Chapter 8: Color and Spectral Doppler -...
64
Chapter 8: Color and Spectral Doppler
Transcript of Chapter 8: Color and Spectral Doppler -...
Chapter 8: Color and Spectral Doppler


Doppler Effect

Doppler Effect
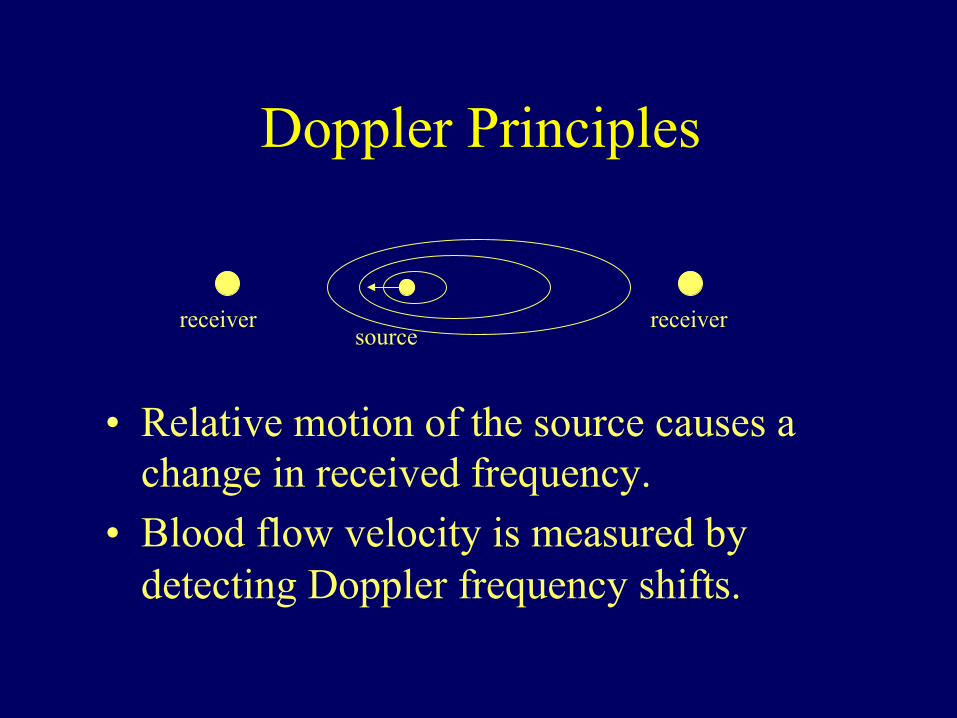
Doppler Principles
• Relative motion of the source causes a change in received frequency.
• Blood flow velocity is measured by detecting Doppler frequency shifts.
receiver receiver source

Doppler Principles
• When both source and receiver are stationary:
• When source is stationary and receiver is moving:

Doppler Principles
• When receiver is stationary and source is moving:

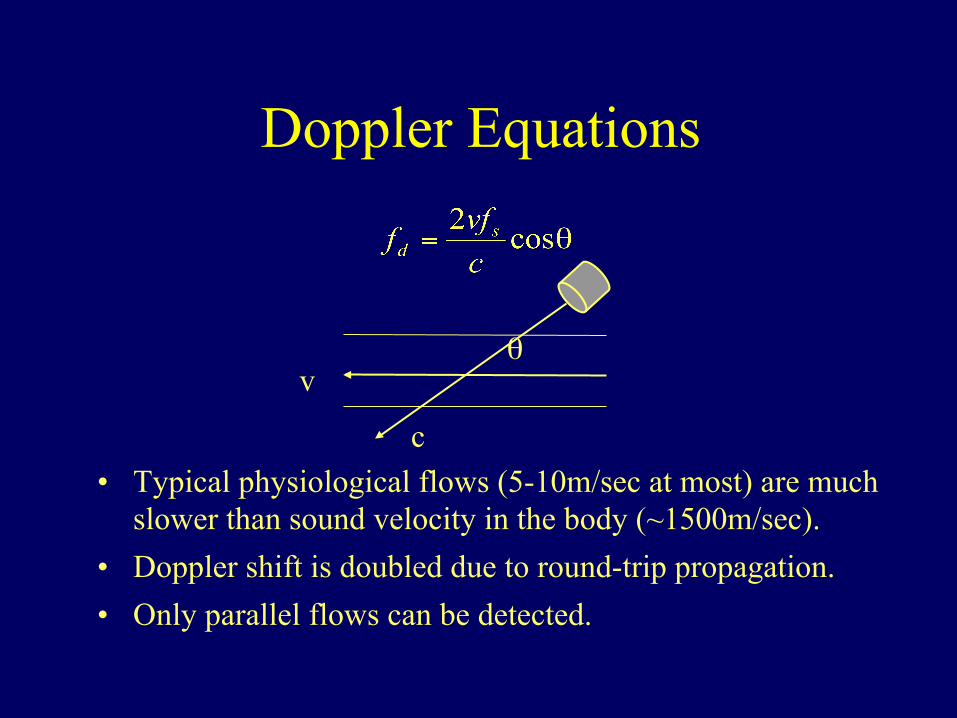
Doppler Equations

Doppler Ultrasound
• Primary scattering site: red blood cell. The platelet is too small and the number of leukocytes is not significant.
• The red blood cell size is around several microns. Thus, scattering and speckle are also present.
• The red blood cells in a sample volume are assumed to move in unison.
Doppler Equations
• Typical physiological flows (5-10m/sec at most) are much slower than sound velocity in the body (~1500m/sec).
• Doppler shift is doubled due to round-trip propagation. • Only parallel flows can be detected.
v
c
θ

Flow Pattern v. Velocity Profile
velocity or Doppler shift
0
ultrasound beam

Flow Pattern v. Velocity Profile
velocity or Doppler shift
0
ultrasound beam

Flow Pattern v. Velocity Profile
velocity or Doppler shift
0
ultrasound beam

Doppler Spectrum Estimation
• Short-time Fourier transform (Spectral Doppler).
• Correlation based estimation (Color Doppler).
fs fd fs+fd
original Doppler shifted demodulated
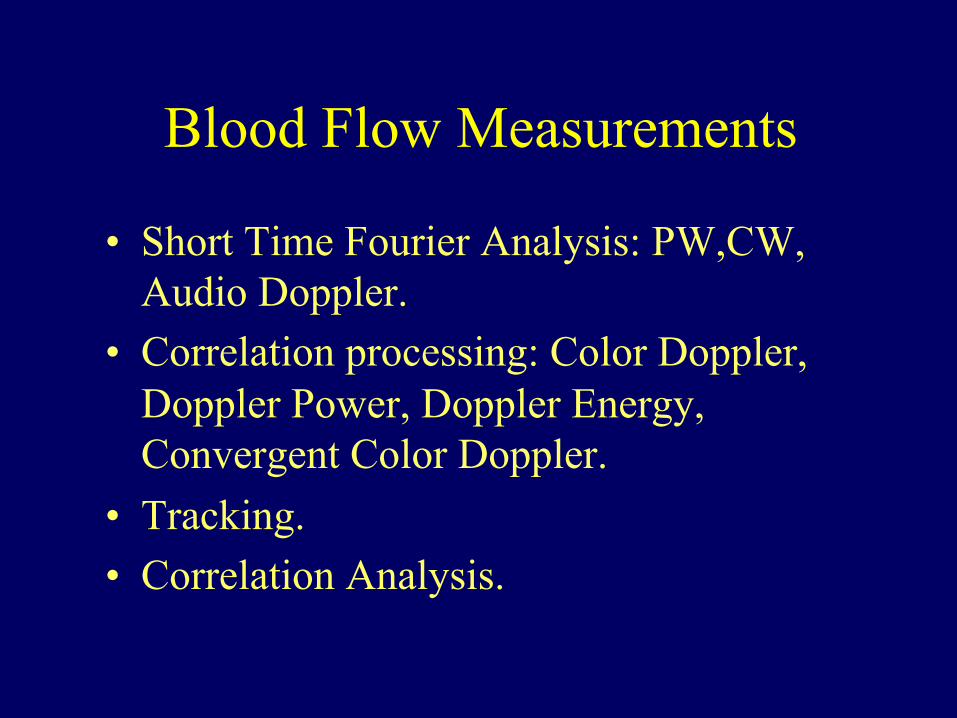
Blood Flow Measurements
• Short Time Fourier Analysis: PW,CW, Audio Doppler.
• Correlation processing: Color Doppler, Doppler Power, Doppler Energy, Convergent Color Doppler.
• Tracking. • Correlation Analysis.
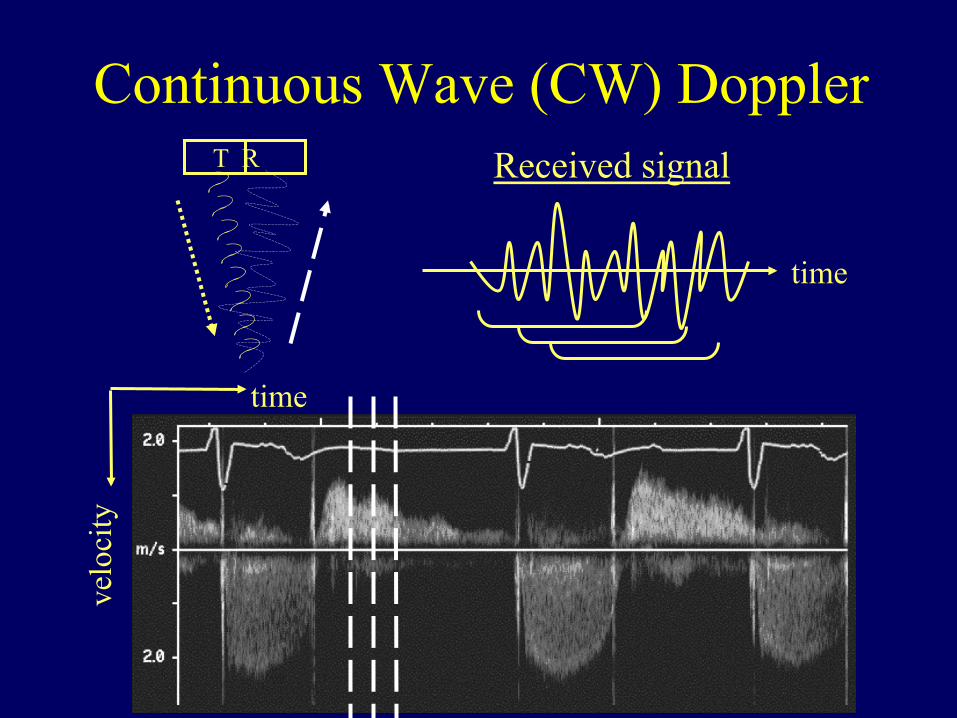
Continuous Wave (CW) Doppler T R
time
velo
city
time
Received signal
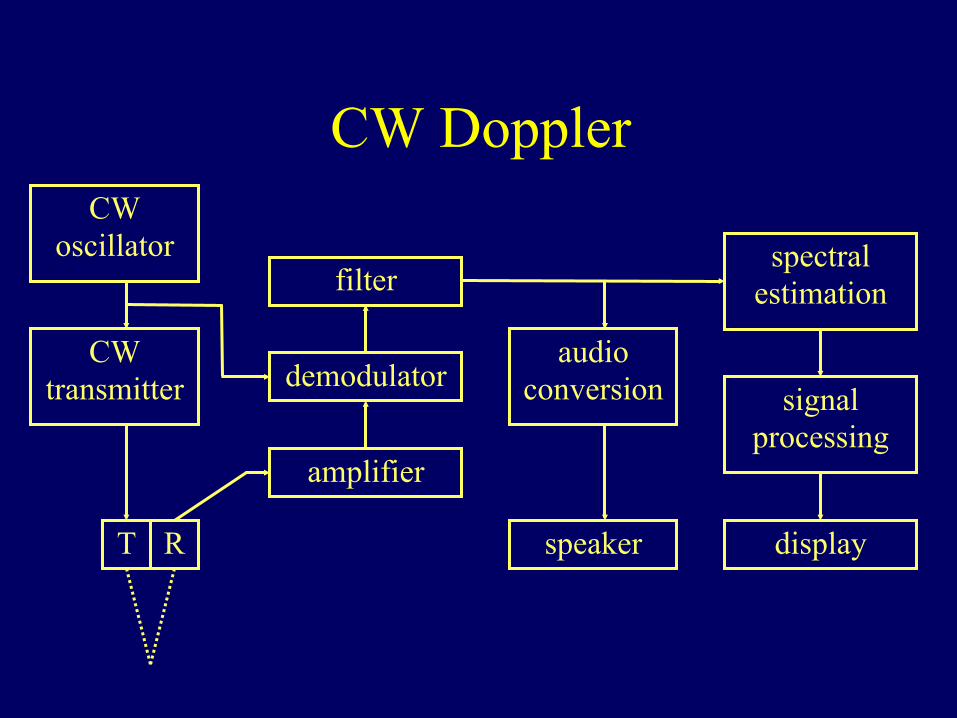
CW Doppler CW
oscillator
CW transmitter
T R
amplifier
demodulator
filter spectral
estimation
audio conversion
display speaker
signal processing

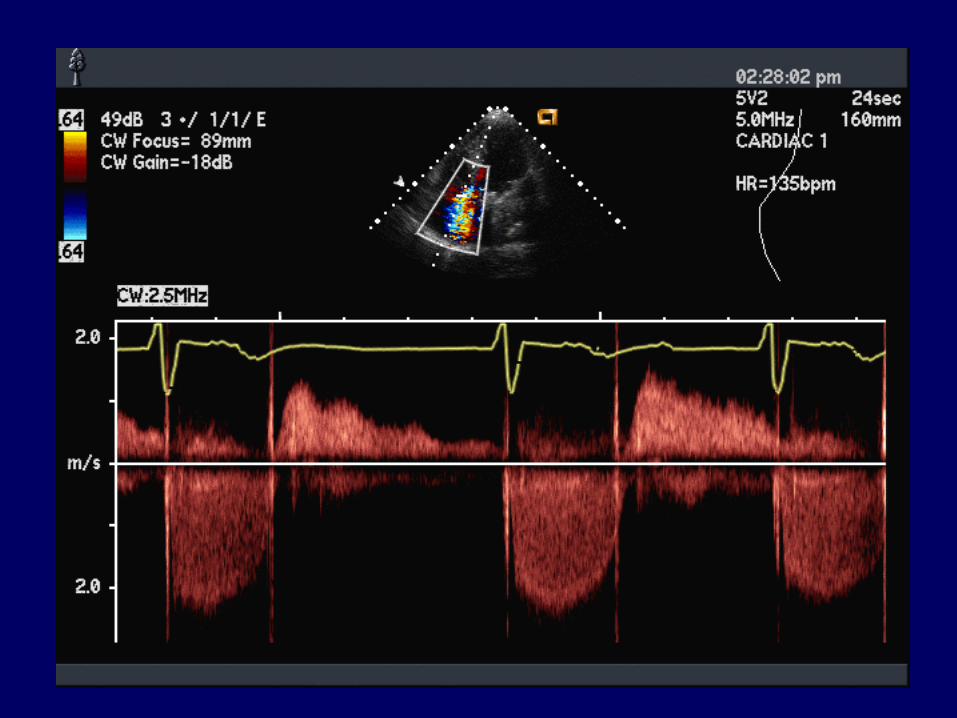
CW Doppler
• Array CW and AUX CW (half transmit, half receive).
• Mainly for Cardiology. • Good velocity (frequency) resolution. • No range resolution. Flows along the same
direction are all detected. • Frequency downshift due to attenuation can be
ignored.

CW Doppler Processing
f0 -f0 f0+fd -f0-fd
fd -2f0-fd
fd
original spectrum
demodulated
demodulated and filtered
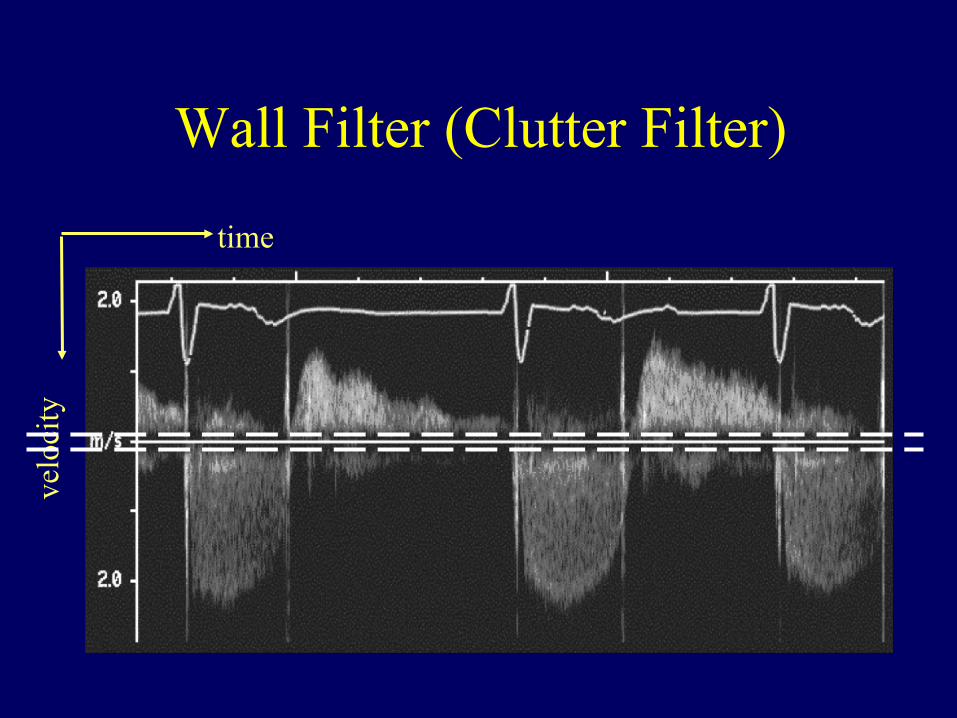
Wall Filter (Clutter Filter)
time
velo
city

CW Doppler Processing
• Time-interval histogram. • 32-128 pt FFT. • Model-based spectrum estimation (AR),
time-frequency analysis. • Magnitudes are converted in dB and
displayed. • Post-processing similar to B-mode.

Audio Doppler
• For typical blood velocities and carrier frequencies, the Doppler shifts from blood happen to be in the human audible range (near DC to 20KHz).
• Positive shifts in one channel and negative ones in the other.
• Hilbert transform. • Clinically useful.
Right
Left
• CW: No range resolution. • Sampling in time = sampling in range. à CW Doppler to PW Doppler.
CW à PW

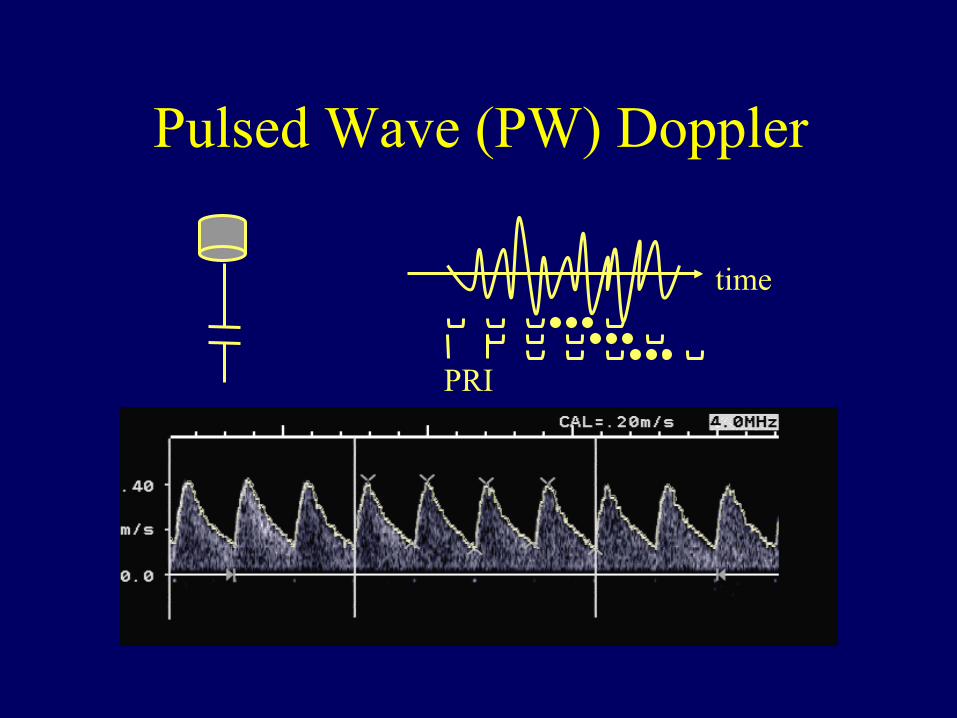
Pulsed Wave (PW) Doppler
time
PRI

Another View for PW Doppler,…

Autocorrelation Processing
取自www.acuson.com
S(t)
PRI (Pulse Repetition Interval)
Autocorrelation function:

PW System Diagram
CW oscillator
PW transmitter (gated CW)
transducer amplifier
demod./LPF
filter spectral estimation
audio conversion
display speaker
signal processing
gating
sample&hold
Pulsed Wave (PW) Doppler
time
PRI

Velocity Ambiguity
vmax
no aliasing
vmax -vmax
aliasing

Velocity Ambiguity (no aliasing)
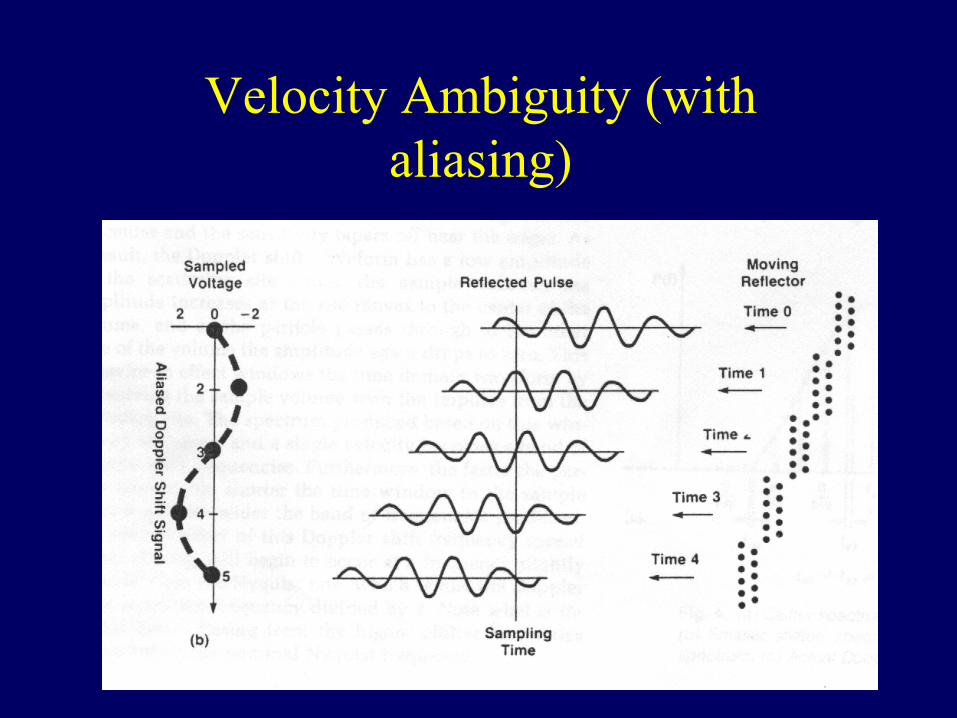
Velocity Ambiguity (with aliasing)
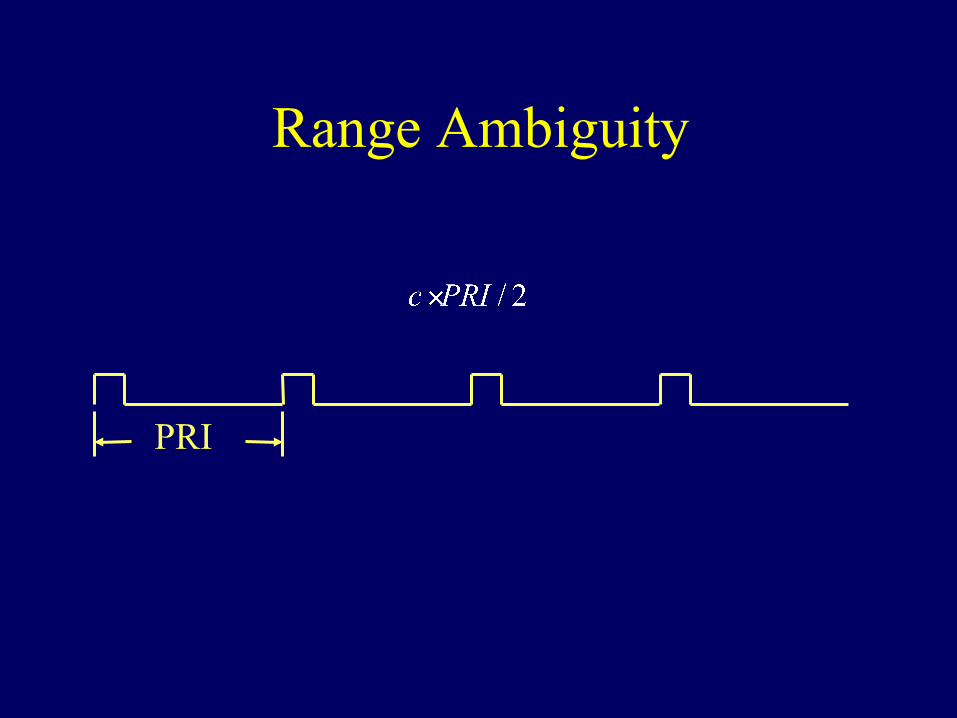
Range Ambiguity
PRI

Range Ambiguity
PRI T0
OR ?

Pulse Wave (PW) Doppler
• Pulse-echo method, similar to B-mode. • Post-processing similar to CW. • Adjustable range resolution (gate). • Maximum detectable velocity is λ/(4*PRI). • Maximum depth is (c*PRI)/2. • 32-128 point FFT.
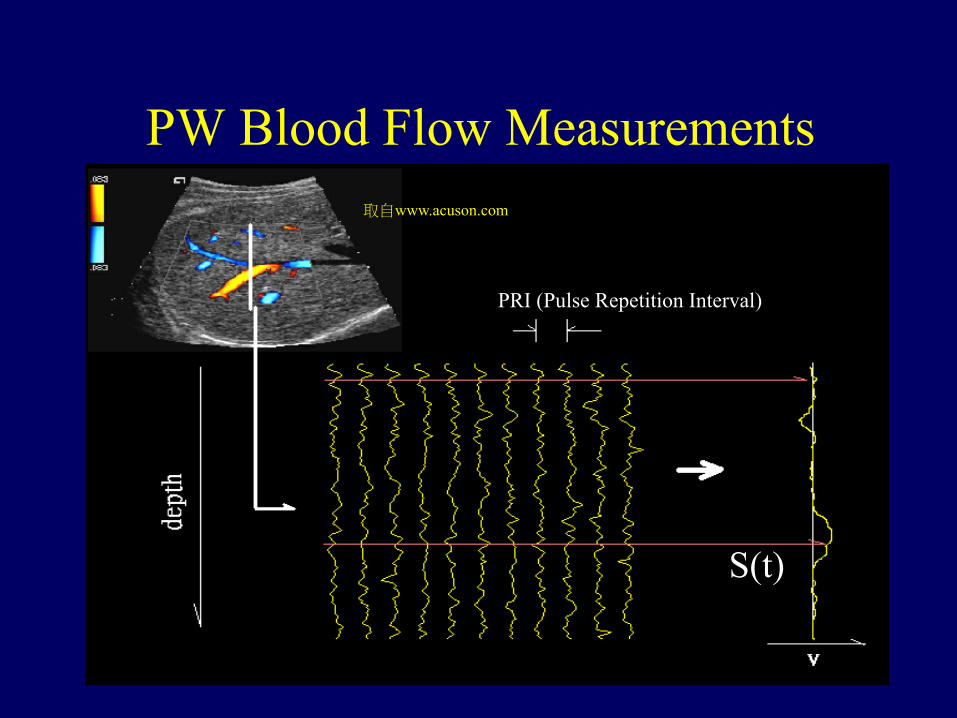
PW Blood Flow Measurements 取自www.acuson.com
S(t)
PRI (Pulse Repetition Interval)

• Single gate à multiple gates. • Local flow information à 2D flow
information. • Less time for velocity estimation:
quantitative à qualitative.
PW à Color Doppler

Color Doppler Parameters
• Use efficient time domain correlation techniques to calculate flow characteristics.
• Auto-correlation of the Doppler signal. • Commonly derived parameters are mean velocity
(including directionality), variance and energy (power).
f

Color Doppler
multiple firings
multiple gates

Color Doppler
multiple firings
multiple gates

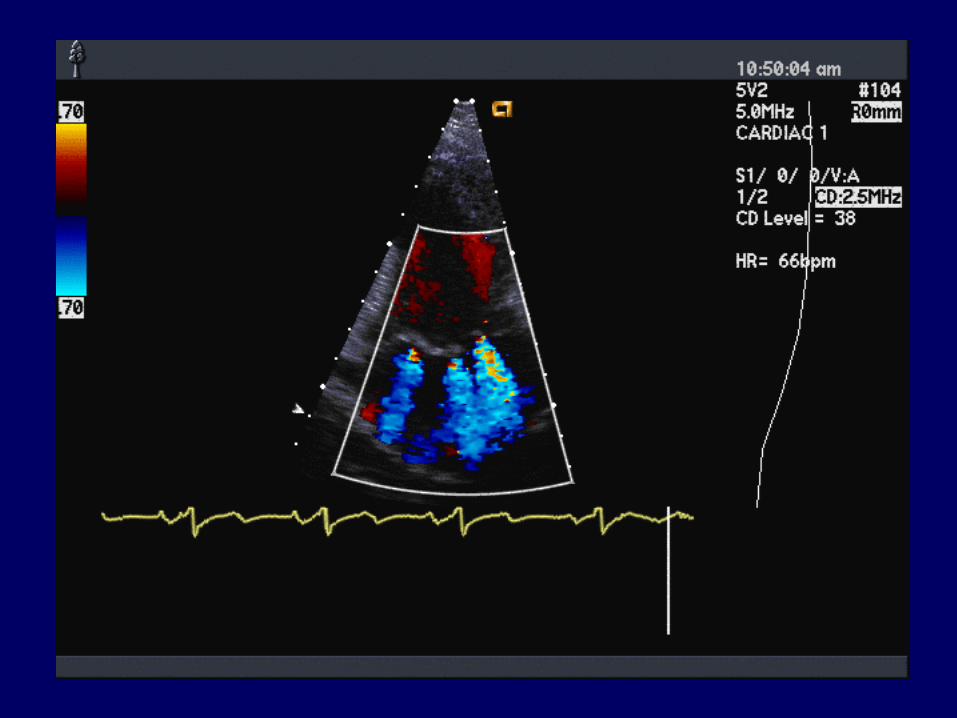
Color Doppler
• Similar to B-mode, except that each line is fired multiple times (5-15).
• Correlation processing. • Multiple range gates along each line. • Real-time two-dimensional flow imaging. • Poor velocity (frequency) resolution.
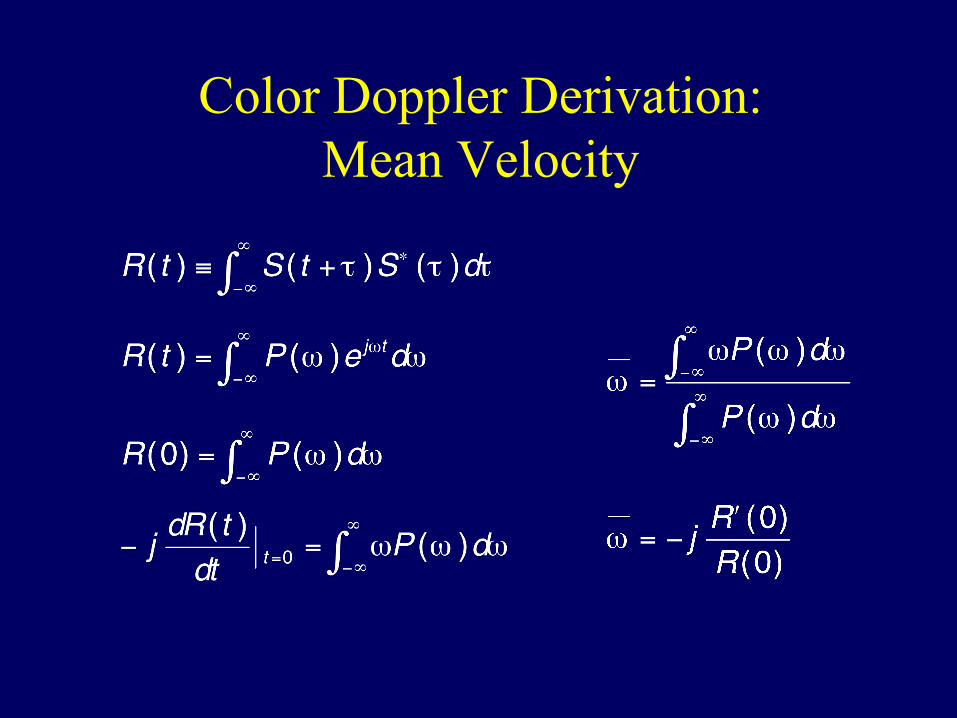
Color Doppler Derivation: Mean Velocity

Color Doppler Derivation: Mean Velocity
: even : odd

In practice, R(t) is by definition a discrete signal,…

Color Doppler Derivation: Mean Velocity
• For a single scatterer:
• The flow direction is determined by the sign of the mean frequency.
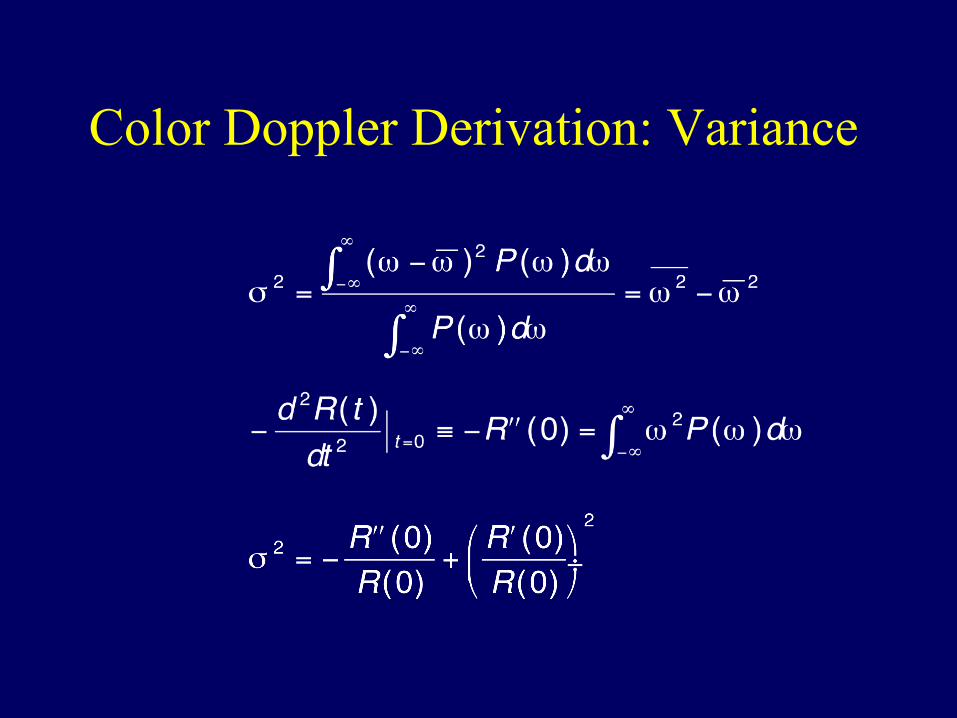
Color Doppler Derivation: Variance
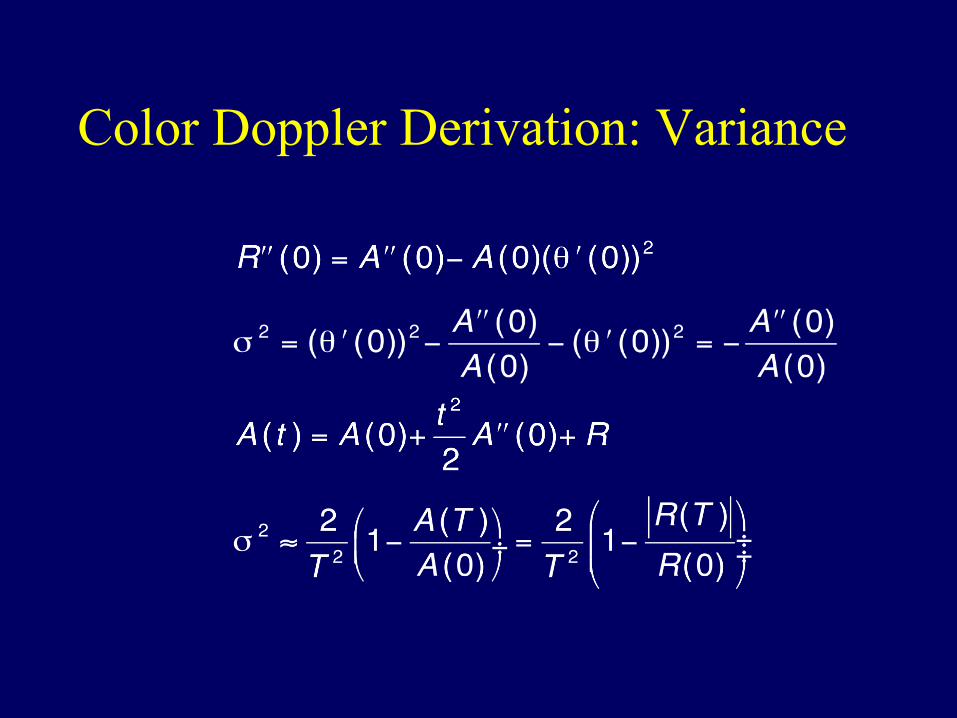
Color Doppler Derivation: Variance

Color Doppler Derivation: Energy
f
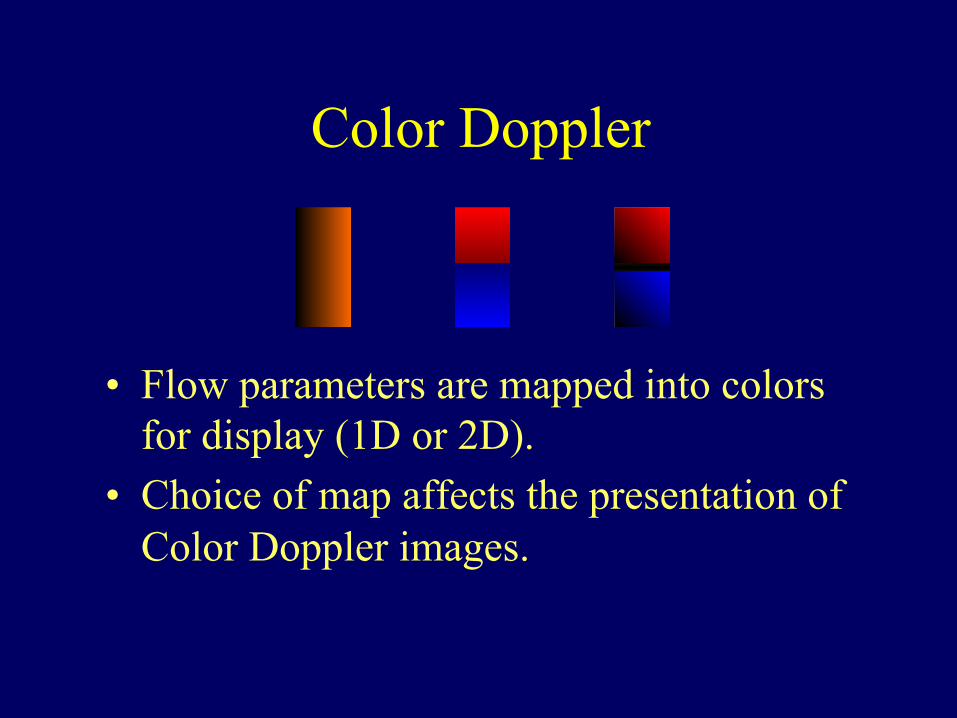
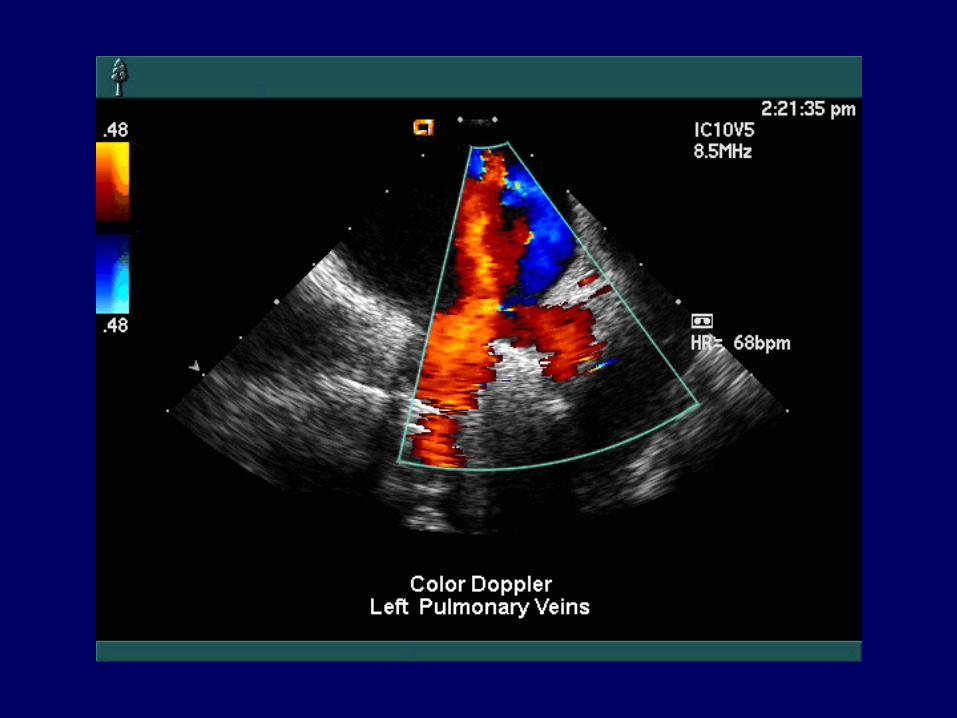
Color Doppler
• Flow parameters are mapped into colors for display (1D or 2D).
• Choice of map affects the presentation of Color Doppler images.
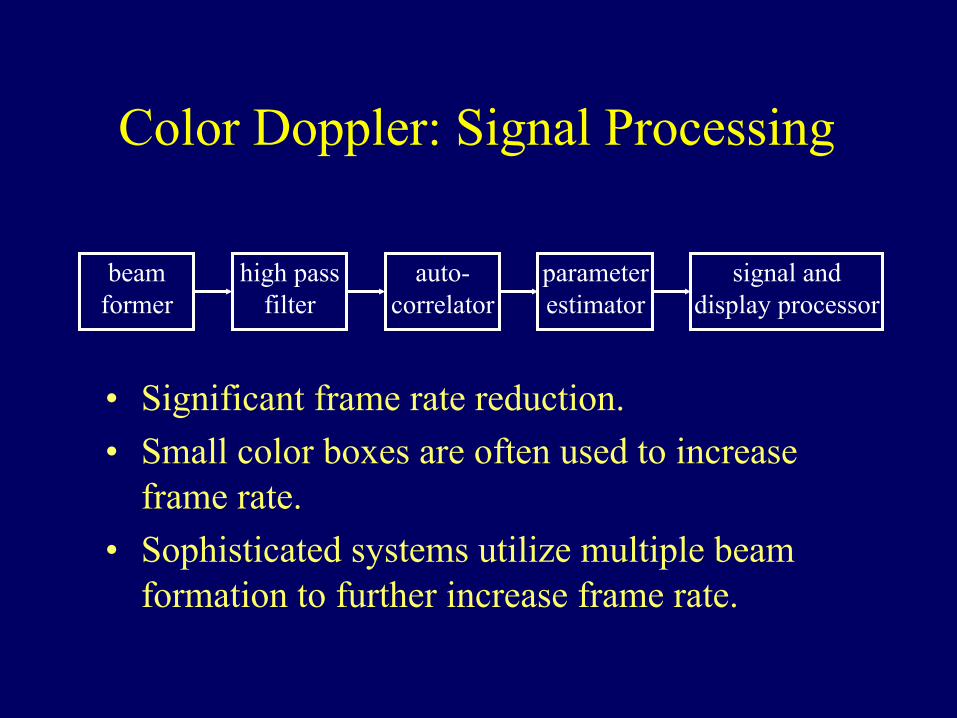
Color Doppler: Signal Processing
beam former
high pass filter
auto-correlator
parameter estimator
signal and display processor
• Significant frame rate reduction. • Small color boxes are often used to increase
frame rate. • Sophisticated systems utilize multiple beam
formation to further increase frame rate.
Doppler: Complications
• Non-trivial wall filters are required to remove interference from slow-moving objects.
• Adequate signal processing capabilities and sufficient dynamic range are necessary to detect weak flows.
• Conflicts with frame rate requirements. • Only parallel flow is detectable.

• Load hw3_dat.mat. In this data file, DopplerData represents a PW Doppler data set. The size of the data is 128 X 400, representing gated received data with 128 firings and 400 data samples for each firing. In the same data file, the following parameters are also included:
– PRI: pulse repetition interval in usec. – fs: sampling frequency in MHz. – f0: center frequency of the transmitted pulse in
MHz.
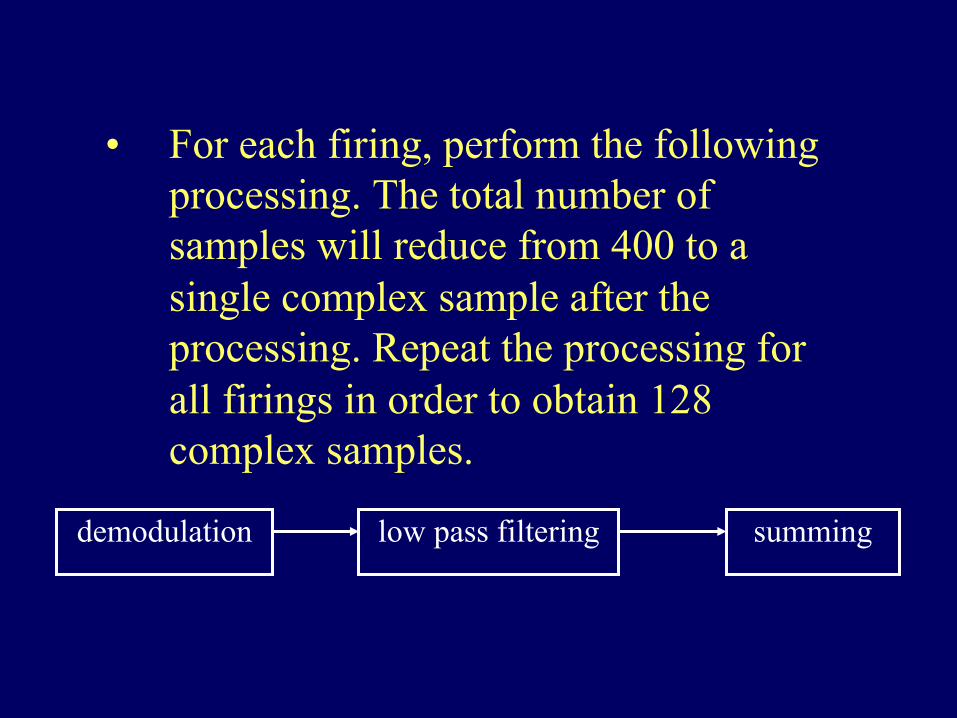
• For each firing, perform the following processing. The total number of samples will reduce from 400 to a single complex sample after the processing. Repeat the processing for all firings in order to obtain 128 complex samples.
demodulation low pass filtering summing

1. Based on the 128 complex samples, calculate the velocity profile using FFT. The profile should be plotted on a logarithmic scale with a 40dB range. The horizontal axis should also be labeled with proper velocity scale. (30%)

2. Re-do Problem 1 by using only the even samples. Also re-do Problem 1, by using only the first 200 RF data points during the summation. Explain your results. (30%)

3. Based on the original complex samples, calculate and plot the mean velocity, variance and energy as the number of samples increases from 2 to 128. Also compare with the results when only using the center 100 (151:250) points for the summing. Note that the discrete correlation function is defined as the following (40%).
4. (bonus) Explore any related Doppler issues based on the dataset.