目錄 - Taipei ExchangeAmount Outstanding of Convertible Bond Asset Swap in 2011 3....
155
Transcript of 目錄 - Taipei ExchangeAmount Outstanding of Convertible Bond Asset Swap in 2011 3....


● 目錄
2
1. 歷年上櫃股票交易市場概況表 4 Statistics of Stock Trades(by Year)
2. 歷年櫃檯買賣債券發行餘額概況表 6 Bonds Outstanding on GTSM(by Year)
1. 100年度櫃檯買賣市場指數走勢圖 8 Chart for Trends of GTSM Indexes in 2011
2. 100年度櫃檯買賣市場每日收市股價指數一覽表 10 Daily Closing of GTSM Indexes in 2011
3. 100年度櫃檯買賣市場總覽 11 Overview of GTSM in 2011
上櫃股票市場 Stock Market1. 100年度一般類股新上櫃公司彙總表 26 New Listing on GTSM Main Board in 2011
2. 100年度上櫃公司產業類別分布表 29 GTSM-Listed Companies - by Industry in 2011
3. 歷年上櫃公司家數變動情形一覽表 30 Overview of Changes to GTSM Listing
4. 100年度上櫃公司現金增資及無償配股總額表 43Cash Capital Increase and Gratuitous Stock Distribution of GTSM-Listed Companies in 2011
5. 100年度上櫃公司資本變動統計表 44Capital Change of GTSM Board Listed Companies in 2011
6. 100年度上櫃股票交易情形統計表 46Trading of GTSM-Listed Stocks in 2011 - by Month
7. 100年度上櫃公司產業別財務資訊統計表 48Financial Information of GTSM-Listed Companies in 2011 - by Sector
8. 100年度上櫃股票產業別交易量值表 50 Turnover of Stock Trades in 2011 - by Sector
9. 100年度上櫃股票成交量排行—電腦交易部分 52Ranking of GTSM-Listed Stocks in 2011 by Trading Volume-Electronic Trading
10. 100年度上櫃股票成交值排行—電腦交易部分 54Ranking of GTSM-Listed Stocks in 2011 by Trading Value-Electronic Trading
11. 100年度上櫃股票漲幅排行 56Ranking of GTSM-Listed Stocks in 2011 by Percentage of Price Increase
12. 100年度上櫃股票跌幅排行 58Ranking of GTSM-Listed Stocks in 2011 by Percentage of Price Decrease
13. 100年度上櫃股票波幅排行 60Ranking of GTSM-Listed Stocks in 2011 by Fluctuation of Share Price
14. 100年底上櫃公司外資持股比例排行 62Ranking of GTSM-Listed Stocks by Percentage of Shares Held by Foreign Investors at End of 2011
15. 100年底上櫃公司外資持股股數排行 64Ranking of GTSM-Listed Companies by Number of Shares Held by Foreign Investors at End of 2011
16. 100年度上櫃股票主要機構投資人交易概況表 66Trading Records of Major Institutional Investors on GTSM in 2011
17. 歷年外資開戶及持股總數統計表 68Statistics of Accounts Opened and Shares Owned by Foreign Investors
18. 100年度上櫃股票產業別加權股價指數分析表 70Analysis of Sector Weighted Price Index of GTSM-Listed Stocks in 2011
19. 歷年上櫃股票自營與經紀交易金額統計表 74Statistics of Trading Amount by Brokers and Dealers(by Year)
20. 100年度櫃檯買賣市場開戶數及證券商家數統計 75 表
Number of Accounts and Securities Firms on GTSM in 2011
21. 100年度櫃檯買賣中心與臺灣證券交易所發行面 76 比較表
Comparison of Issuance on GTSM and TWSE in 2011
22. 100年度櫃檯買賣中心與臺灣證券交易所股票交 78 易面比較表
Comparison of Trading on GTSM and TWSE in 2011
23. 100年度上櫃股票除息交易情形一覽表 80 Trading of Ex-Dividend Stocks in 2011
24. 100年度上櫃公司除權交易情形一覽表 104 List of Ex-Right Trading Stocks in 2011
25. 100年度櫃檯買賣市場信用交易成交值占市場總 118成交值比率表Margin Trading to Total Market Turnover on GTSM in 2011
26. 100年度櫃檯買賣市場融資及融券餘額成長表 119Changes of Margin Trading and Securities Loan Balance on GTSM in 2011
興櫃股票市場 Emerging Stock Market
1. 100年度本國興櫃股票新登錄公司彙總表 120New Registered of Domestic Stocks on Emerging Market Board in 2011
一、總表 Historical Statistics
二、年度總覽 2011 Year in Review
三、統計資料 2011 Statistics

3
2. 100年度外國興櫃股票新登錄公司彙總表 128New Registered of Foreign Stocks on Emerging Market Board in 2011
3. 100年度興櫃公司現金增資及無償配股總額表 129Capital Increase and Gratuitous Stock Distribution of Emerging Stock Companies in 2011
4. 100年度興櫃公司資本變動統計表 130Capital Change of Emerging Stock Companies in 2011
5. 100年度興櫃股票交易情形統計表 132 Trading of Emerging Stocks in 2011 - by Month
債券市場 Bond Marke
1. 100年度政府公債上櫃狀況統計表 134 Government Bonds on GTSM in 2011
2. 100年度金融債券上櫃狀況統計表 134 Financial Debentures on GTSM in 2011
3. 100年度公司債上櫃狀況統計表 135 Corporate Bonds on GTSM in 2011
4. 100年度金融資產證券化/不動產資產信託上 135 櫃狀況統計表 ABS / REIT on GTSM in 2011
5. 100年度外國債券上櫃狀況統計表 136 Foreign Bonds on GTSM in 2011
6. 100年度國際債券上櫃狀況統計表 136 International Bonds on GTSM in 2011
7. 100年度櫃檯買賣債券交易統計表 137 Bond Trading on GTSM in 2011
8. 100年度櫃檯買賣債券成交金額統計表 138 Turnover of Bond Trading on GTSM in 2011
9. 100年度各年期指標債券加權平均殖利率 139Statistics of Weighted Average Yield of Benchmark Bonds in 2011
10. 100年度櫃檯買賣債券買賣斷交易成交金額統 140 計表
Turnover of Bond Outright Trade on GTSM in 2011
衍生性金融商品市場 Financial Derivatives Market
1. 歷年上櫃認購(售)權證發行及交易概況表 142 Highlights of Warrants Issuance on GTSM Market
2. 100年度轉換公司債資產交換交易流通在外餘 143 額統計表
Amount Outstanding of Convertible Bond Asset Swap in 2011
3. 100年度結構型商品交易流通在外餘額統計表 144 Amount Outstanding of Structured Notes in 2011
4. 100年度店頭衍生性商品電腦交易系統交易量 145 統計表
Over-the-counter Trading of Derivatives through TADS in 2011
5. 100年度債券選擇權交易量統計表 146 Trading of Bond Options in 2011
6. 100年度股權衍生性商品成交統計表 147 Trading of Equity Derivatives in 2011
1. 上櫃、興櫃及輔導中公司家數統計圖 148Chart for Numbers of GTSM-Listed Companies, Emerging Stock Companies and Companies under Guidance
2. 100年度上櫃公司家數及資本總額統計圖 149Chart for Number of GTSM-Listed Companies and Total Capital in 2011
3. 歷年櫃檯買賣市場融資及融券餘額成長圖 149Chart for Changes of Margin Trading and Securities Loan Balance on GTSM Over the Years
4. 歷年普通公司債上櫃家數及上櫃期數走勢圖 150Chart for Trends of Number of Corporate Bonds and Issues on GTSM
5. 100年度櫃檯買賣債券成交金額統計圖 150Chart for Statistics of Bond Trading Value on GTSM in 2011
6. 100年度指標債券加權平均殖利率走勢圖 151Chart for Movement of Weighted Average Yield of Benchmark Bonds in 2011
7. 100年度公債發行前交易成交面額日均值統計圖 151Chart for Daily Average of Nominal Transaction Value of When Issued in 2011
8. 100年度中央公債主要交易商營業金額統計圖 152Chart for Trading of Government Bond by Primary Dealers in 2011
9. 100年度轉換公司債資產交換交易流通在外餘額 152 統計圖
Chart for Amount Outstanding of Convertible Bond Asset Swap in 2011
10. 100年度結構型商品交易流通在外餘額統計圖 153Chart for Amount Outstanding of Structured Products in 2011
11. 100年度店頭衍生性商品電腦交易系統交易量統 153 計圖
Chart for Over-the-counter Trading of Derivatives through TADS in 2011
12. 100年度債券選擇權交易量統計圖 154 Chart for Trading of Bond Options in 2011
13. 100年度股權衍生性商品成交統計圖 155 Chart for Trading of Equity Derivatives in 2011
四、統計圖 Statistical Chart

● 總表
4
歷年上櫃股票交易市場概況表 Statistics of Stock Trades(by Year)1
年/月
Yr / Mo
上櫃公司家數
No. ofStocks Listed
上櫃股票
總資本額 (億元)
Total Capital(NT$100MM)
上櫃股票總市值 Market(億元)
Capitalization(NT$100MM)
上櫃股票成交量 (千股)
Trading Volume(1,000 shares)
上櫃股票成交值 (億元)
Trading Amount(NT$100MM)
上櫃股票
成交筆數 (筆)
No. ofTransactions(No.)
平均週轉率
AverageTurnover
( % )
櫃檯買賣市場股價指數 GTSM Stock Index
櫃檯買賣投資人
累計開戶數 No. of
Accounts
年/月
Yr / Mo年平均
Annual Average
最高
High日期
Date最低
Low日期
Date
1989 1 1.72 13.52 14 0.01 14 0.08 - - - - - - 1989
1990 4 14.46 83.86 7,445 11.80 2,683 5.15 - - - - - - 1990
1991 9 37.78 105.20 13,897 4.64 4,318 3.68 - - - - - - 1991
1992 11 44.69 97.87 19,945 6.71 5,271 4.46 - - - - - - 1992
1993 11 39.58 96.08 19,947 6.49 3,971 5.04 - - - - - 15,285 1993
1994 14 97.92 269.16 19,413 5.68 3,621 1.98 - - - - - 15,998 1994
1995 41 1,730.05 2,457.32 170,988 27.96 24,166 0.98 96.55 101.96 12/30 94.02 11/20 45,668 1995
1996 79 2,641.34 8,334.57 16,958,730 4,535.09 3,266,231 69.55 170.27 234.83 12/30 99.92 1/5 817,535 1996
1997 114 3,148.86 10,268.64 43,115,617 23,106.59 12,650,795 130.86 274.29 343.99 8/6 210.22 10/20 2,769,178 1997
1998 176 3,813.91 8,876.35 30,680,939 11,981.58 9,216,459 84.46 213.23 281.41 2/23 163.89 12/28 4,699,563 1998
1999 264 5,137.59 14,684.43 49,052,206 18,999.25 15,160,027 115.26 171.62 207.18 12/28 138.99 2/4 6,094,641 1999
2000 300 6,771.93 10,505.96 88,421,951 44,796.63 28,687,473 153.43 219.37 326.42 4/10 101.56 12/27 7,581,289 2000
2001 333 6,814.36 14,121.96 81,487,392 23,269.67 22,486,536 118.00 118.04 152.46 3/29 78.22 10/8 8,160,457 2001
2002 384 6,272.93 8,622.48 101,842,418 27,947.24 26,331,438 151.41 125.88 163.00 4/24 89.71 10/14 8,834,580 2002
2003 423 6,394.72 12,007.81 101,056,328 20,593.85 21,055,225 161.52 102.65 117.49 11/14 79.56 5/2 9,326,263 2003
2004 466 6,260.97 11,225.32 155,732,694 34,754.49 31,220,771 237.29 124.82 160.13 4/14 105.24 8/17 9,976,366 2004
2005 503 6,431.80 13,124.63 112,192,565 31,664.53 28,193,794 176.90 118.59 133.34 12/30 103.57 10/28 10,307,718 2005
2006 531 7,261.99 18,994.47 154,206,252 51,291.12 41,913,045 230.19 138.90 163.91 12/29 118.97 6/21 10,687,698 2006
2007 547 7,148.10 18,687.70 191,276,747 85,373.95 60,808,759 273.29 180.16 233.25 7/25 137.92 12/21 11,263,182 2007
2008 539 7,030.74 7,721.07 101,994,113 32,854.63 32,827,314 153.00 114.40 163.15 5/19 54.85 11/20 11,638,421 2008
2009 546 7,727.28 19,142.18 168,791,922 52,389.59 52,635,040 240.37 103.93 150.05 12/31 60.49 1/21 12,013,446 2009
2010 564 7,059.95 19,846.36 155,017,866 56,335.88 56,638,594 218.17 139.00 150.75 4/15 122.79 2/6 12,609,084 2010
2011 607 7,319.15 14,170.85 98,413,656 39,930.36 40,503,597 148.39 123.49 146.21 1/20 86.21 12/19 13,176,510 2011
1 571 7,091.23 20,327.57 10,735,861 4,044.89 3,819,332 16.30 144.47 146.21 1/20 142.06 1/7 12,644,642 1
2 573 7,083.93 19,698.33 7,293,878 3,027.88 2,812,595 11.05 142.55 145.45 2/8 139.41 2/23 12,693,538 2
3 578 7,134.73 19,541.68 11,928,244 5,237.01 4,914,571 18.00 139.74 145.15 3/3 132.31 3/17 12,753,264 3
4 581 7,173.28 19,685.46 8,764,672 3,753.01 3,686,830 13.20 140.26 142.33 4/7 137.55 4/19 12,798,110 4
5 583 7,075.98 19,989.88 9,585,591 4,251.29 4,019,226 14.59 137.69 139.81 5/31 135.12 5/24 12,839,254 5
6 585 7,086.73 19,237.14 8,178,032 3,703.41 3,553,086 12.61 135.75 140.58 6/1 130.42 6/21 12,879,887 6
7 585 7,138.30 18,888.14 8,295,407 3,536.00 3,448,634 12.59 132.29 136.67 7/6 127.07 7/14 12,926,767 7
8 587 7,237.09 16,097.55 9,265,894 3,448.67 3,701,055 13.94 115.84 132.16 8/1 106.59 8/22 13,003,216 8
9 590 7,275.59 14,910.54 6,399,491 2,479.12 2,769,136 9.57 106.73 112.92 9/2 98.67 9/26 13,055,900 9
10 594 7,279.27 15,338.42 5,475,577 2,233.29 2,516,490 8.12 103.80 106.39 10/17 99.58 10/5 13,091,706 10
11 599 7,242.87 13,678.84 7,075,106 2,474.40 2,951,773 10.48 100.70 107.87 11/7 90.79 11/25 13,134,735 11
12 607 7,319.15 14,170.85 5,415,903 1,741.40 2,310,869 7.94 91.89 96.09 12/1 86.21 12/19 13,176,510 12

5
年/月
Yr / Mo
上櫃公司家數
No. ofStocks Listed
上櫃股票
總資本額 (億元)
Total Capital(NT$100MM)
上櫃股票總市值 Market(億元)
Capitalization(NT$100MM)
上櫃股票成交量 (千股)
Trading Volume(1,000 shares)
上櫃股票成交值 (億元)
Trading Amount(NT$100MM)
上櫃股票
成交筆數 (筆)
No. ofTransactions(No.)
平均週轉率
AverageTurnover
( % )
櫃檯買賣市場股價指數 GTSM Stock Index
櫃檯買賣投資人
累計開戶數 No. of
Accounts
年/月
Yr / Mo年平均
Annual Average
最高
High日期
Date最低
Low日期
Date
1989 1 1.72 13.52 14 0.01 14 0.08 - - - - - - 1989
1990 4 14.46 83.86 7,445 11.80 2,683 5.15 - - - - - - 1990
1991 9 37.78 105.20 13,897 4.64 4,318 3.68 - - - - - - 1991
1992 11 44.69 97.87 19,945 6.71 5,271 4.46 - - - - - - 1992
1993 11 39.58 96.08 19,947 6.49 3,971 5.04 - - - - - 15,285 1993
1994 14 97.92 269.16 19,413 5.68 3,621 1.98 - - - - - 15,998 1994
1995 41 1,730.05 2,457.32 170,988 27.96 24,166 0.98 96.55 101.96 12/30 94.02 11/20 45,668 1995
1996 79 2,641.34 8,334.57 16,958,730 4,535.09 3,266,231 69.55 170.27 234.83 12/30 99.92 1/5 817,535 1996
1997 114 3,148.86 10,268.64 43,115,617 23,106.59 12,650,795 130.86 274.29 343.99 8/6 210.22 10/20 2,769,178 1997
1998 176 3,813.91 8,876.35 30,680,939 11,981.58 9,216,459 84.46 213.23 281.41 2/23 163.89 12/28 4,699,563 1998
1999 264 5,137.59 14,684.43 49,052,206 18,999.25 15,160,027 115.26 171.62 207.18 12/28 138.99 2/4 6,094,641 1999
2000 300 6,771.93 10,505.96 88,421,951 44,796.63 28,687,473 153.43 219.37 326.42 4/10 101.56 12/27 7,581,289 2000
2001 333 6,814.36 14,121.96 81,487,392 23,269.67 22,486,536 118.00 118.04 152.46 3/29 78.22 10/8 8,160,457 2001
2002 384 6,272.93 8,622.48 101,842,418 27,947.24 26,331,438 151.41 125.88 163.00 4/24 89.71 10/14 8,834,580 2002
2003 423 6,394.72 12,007.81 101,056,328 20,593.85 21,055,225 161.52 102.65 117.49 11/14 79.56 5/2 9,326,263 2003
2004 466 6,260.97 11,225.32 155,732,694 34,754.49 31,220,771 237.29 124.82 160.13 4/14 105.24 8/17 9,976,366 2004
2005 503 6,431.80 13,124.63 112,192,565 31,664.53 28,193,794 176.90 118.59 133.34 12/30 103.57 10/28 10,307,718 2005
2006 531 7,261.99 18,994.47 154,206,252 51,291.12 41,913,045 230.19 138.90 163.91 12/29 118.97 6/21 10,687,698 2006
2007 547 7,148.10 18,687.70 191,276,747 85,373.95 60,808,759 273.29 180.16 233.25 7/25 137.92 12/21 11,263,182 2007
2008 539 7,030.74 7,721.07 101,994,113 32,854.63 32,827,314 153.00 114.40 163.15 5/19 54.85 11/20 11,638,421 2008
2009 546 7,727.28 19,142.18 168,791,922 52,389.59 52,635,040 240.37 103.93 150.05 12/31 60.49 1/21 12,013,446 2009
2010 564 7,059.95 19,846.36 155,017,866 56,335.88 56,638,594 218.17 139.00 150.75 4/15 122.79 2/6 12,609,084 2010
2011 607 7,319.15 14,170.85 98,413,656 39,930.36 40,503,597 148.39 123.49 146.21 1/20 86.21 12/19 13,176,510 2011
1 571 7,091.23 20,327.57 10,735,861 4,044.89 3,819,332 16.30 144.47 146.21 1/20 142.06 1/7 12,644,642 1
2 573 7,083.93 19,698.33 7,293,878 3,027.88 2,812,595 11.05 142.55 145.45 2/8 139.41 2/23 12,693,538 2
3 578 7,134.73 19,541.68 11,928,244 5,237.01 4,914,571 18.00 139.74 145.15 3/3 132.31 3/17 12,753,264 3
4 581 7,173.28 19,685.46 8,764,672 3,753.01 3,686,830 13.20 140.26 142.33 4/7 137.55 4/19 12,798,110 4
5 583 7,075.98 19,989.88 9,585,591 4,251.29 4,019,226 14.59 137.69 139.81 5/31 135.12 5/24 12,839,254 5
6 585 7,086.73 19,237.14 8,178,032 3,703.41 3,553,086 12.61 135.75 140.58 6/1 130.42 6/21 12,879,887 6
7 585 7,138.30 18,888.14 8,295,407 3,536.00 3,448,634 12.59 132.29 136.67 7/6 127.07 7/14 12,926,767 7
8 587 7,237.09 16,097.55 9,265,894 3,448.67 3,701,055 13.94 115.84 132.16 8/1 106.59 8/22 13,003,216 8
9 590 7,275.59 14,910.54 6,399,491 2,479.12 2,769,136 9.57 106.73 112.92 9/2 98.67 9/26 13,055,900 9
10 594 7,279.27 15,338.42 5,475,577 2,233.29 2,516,490 8.12 103.80 106.39 10/17 99.58 10/5 13,091,706 10
11 599 7,242.87 13,678.84 7,075,106 2,474.40 2,951,773 10.48 100.70 107.87 11/7 90.79 11/25 13,134,735 11
12 607 7,319.15 14,170.85 5,415,903 1,741.40 2,310,869 7.94 91.89 96.09 12/1 86.21 12/19 13,176,510 12

● 總表
6
年/月
Yr / Mo
政府債券
Government Bond金融債券
Financial Debenture受益證券
Beneficiary Securities
公司債 Corporate Bond
外國債券
Foreign Bond國際債券
International Bond普通公司債 Corporate Bond
轉(交)換公司債 Convertible(Exchangeable)
Corporate Bond
附認股權債 Corporate Bond
With Warrant
期數 No. ofIssues
餘額
(億元) Amount
Outstanding (NT$100M)
期數 No. ofIssues
餘額
(億元) Amount
Outstanding (NT$100M)
期數 No. ofIssues
餘額
(億元) Amount
Outstanding (NT$100M)
期數 No. ofIssues
餘額
(億元) Amount
Outstanding (NT$100M)
期數 No. of Issues
餘額
(億元) Amount
Outstanding (NT$100M)
期數 No. of Issues
餘額
(億元) Amount
Outstanding (NT$100M)
期數 No. of Issues
餘額
(億美元) Amount
Outstanding(US$100M)
餘額
(億日元) Amount
Outstanding(¥$100M)
餘額
(億元) Amount
Outstanding(NT$100M)
期數 No. of Issues
餘額
(億美元) Amount
Outstanding(US$100M)
1996 42 9,950.5 - - - - 95 1,083.4 - - - - 5 6 300 961997 44 10,344.0 - - - - 188 1,772.1 2 9.0 - - 7 3 300 2941998 45 10,420.0 - - - - 487 2,986.1 7 39.4 - - 11 - - 6311999 50 12,438.2 - - - - 907 3,861.7 11 61.1 - - 18 - - 9112000 57 14,783.2 - - - - 1,206 4,433.4 25 305.1 - - 25 - - 1,1312001 65 18,569.2 21 50.0 - - 1,487 5,169.0 54 593.9 - - 46 - - 1,4302002 74 22,127.2 327 1,299.2 - - 2,036 6,508.6 128 892.0 2 7.0 78 - - 1,4262003 80 25,870.7 727 2,638.9 6 94.8 2,666 7,998.4 219 1,132.4 2 2.1 174 - - 1,5302004 86 28,506.7 1,160 4,550.5 23 297.2 2,882 8,993.8 340 1,460.3 2 5.6 174 - - 1,1652005 88 31,417.2 1,296 5,836.2 58 900.5 2,784 9,355.2 315 1,504.7 1 1.6 156 - - 8912006 90 33,825.2 1,390 7,418.3 75 1,321.1 2,397 9,710.2 289 1,770.4 1 0.9 140 - - 710 1 2.52007 88 35,184.7 1,209 7,541.3 98 1,910.0 1,744 8,773.4 275 2,098.5 - - 127 - - 602 2 4.92008 91 37,351.7 929 8,062.0 82 1,442.8 1,142 9,476.1 269 1,801.0 - - 97 - - 450 2 4.92009 93 39,708.5 605 7,370.7 71 1,059.6 783 9,413.9 208 1,405.2 - - 61 - - 387 3 7.72010 94 43,341.5 452 7,659.4 52 796.1 512 10,002.1 246 1,373.7 - - 8 - - 147 4 11.2
1 93 39,658.5 593 7,258.0 67 1,034.5 785 9,546.9 216 1,449.8 - - 50 - - 347 3 7.72 95 40,458.5 582 7,215.0 66 1,029.3 793 9,644.9 216 1,414.7 - - 50 - - 347 3 7.73 96 40,858.5 564 7,131.7 66 1,015.2 795 9,679.9 216 1,433.1 - - 35 - - 227 3 7.74 96 41,558.5 557 7,153.2 61 1,000.0 765 9,704.4 217 1,429.4 - - 15 - - 177 2 5.25 96 41,958.5 528 7,106.7 61 997.8 733 9,695.4 225 1,449.0 - - 15 - - 177 2 5.26 95 41,964.5 511 7,172.6 61 951.8 665 9,724.8 232 1,471.2 - - 15 - - 177 3 7.97 94 41,664.5 497 7,142.9 60 940.3 627 9,841.4 236 1,494.1 - - 15 - - 177 4 11.28 94 41,964.5 489 7,218.8 61 976.7 588 9,889.8 240 1,525.4 - - 15 - - 177 4 11.29 94 42,264.5 462 7,276.2 59 925.5 569 9,928.3 244 1,560.9 - - 15 - - 177 4 11.2
10 94 42,664.5 458 7,282.2 58 898.0 548 9,843.0 240 1,492.7 - - 9 - - 160 4 11.211 95 43,131.5 451 7,315.2 58 893.1 551 9,911.3 246 1,421.1 - - 9 - - 160 4 11.212 94 43,341.5 452 7,659.4 52 796.1 512 10,002.1 246 1,373.7 - - 8 - - 147 4 11.2
2011 97 46,441.5 417 8,479.5 33 573.5 425 11,242.6 299 1,660.3 - - 2 - - 30 4 11.21 93 42,481.5 448 7,595.2 47 700.3 518 10,050.1 269 1,549.8 - - 7 - - 110 4 11.22 95 43,181.5 439 7,547.5 42 635.0 516 10,033.1 271 1,536.3 - - 7 - - 110 4 11.23 95 43,431.5 430 7,829.0 40 617.2 516 10,068.1 276 1,608.5 - - 5 - - 80 4 11.24 95 44,131.5 431 7,898.0 39 614.1 504 10,210.6 277 1,658.8 - - 5 - - 80 4 11.25 95 44,631.5 414 8,056.5 39 611.6 494 10,114.6 289 1,727.5 - - 5 - - 80 4 11.26 95 45,031.5 423 8,184.5 38 605.3 468 10,378.3 297 1,675.3 - - 5 - - 80 4 11.27 97 44,591.5 420 8,200.6 37 600.6 443 10,565.7 303 1,794.8 - - 5 - - 80 4 11.28 95 44,891.5 424 8,276.1 36 600.4 453 10,674.3 308 1,833.9 - - 5 - - 80 4 11.29 96 45,241.5 427 8,387.1 35 569.4 456 10,968.8 310 1,884.3 - - 5 - - 80 4 11.2
10 96 45,366.0 429 8,432.6 35 569.2 436 11,126.3 309 1,822.4 - - 2 - - 30 4 11.211 96 46,016.0 424 8,488.6 37 610.6 422 11,103.6 303 1,669.8 - - 2 - - 30 4 11.212 97 46,441.5 417 8,479.5 33 573.5 425 11,242.6 299 1,660.3 - - 2 - - 30 4 11.2
註:1. 截至100年12月底分割公司債券已上櫃計分割本金公司債1期18億元、分割利息公司債1期0.47億元;分割金融債券已上櫃計分割本金金融債券12期63億元、分割利息金融債券54期2.05億元。以上皆含在本表中。
2. 截至100年12月底國際債券計有3期美元8.60億元及1期澳洲幣2.90億元。
歷年櫃檯買賣債券發行餘額概況表 Bonds Outstanding on GTSM(by Year)2

7
年/月
Yr / Mo
政府債券
Government Bond金融債券
Financial Debenture受益證券
Beneficiary Securities
公司債 Corporate Bond
外國債券
Foreign Bond國際債券
International Bond普通公司債 Corporate Bond
轉(交)換公司債 Convertible(Exchangeable)
Corporate Bond
附認股權債 Corporate Bond
With Warrant
期數 No. ofIssues
餘額
(億元) Amount
Outstanding (NT$100M)
期數 No. ofIssues
餘額
(億元) Amount
Outstanding (NT$100M)
期數 No. ofIssues
餘額
(億元) Amount
Outstanding (NT$100M)
期數 No. ofIssues
餘額
(億元) Amount
Outstanding (NT$100M)
期數 No. of Issues
餘額
(億元) Amount
Outstanding (NT$100M)
期數 No. of Issues
餘額
(億元) Amount
Outstanding (NT$100M)
期數 No. of Issues
餘額
(億美元) Amount
Outstanding(US$100M)
餘額
(億日元) Amount
Outstanding(¥$100M)
餘額
(億元) Amount
Outstanding(NT$100M)
期數 No. of Issues
餘額
(億美元) Amount
Outstanding(US$100M)
1996 42 9,950.5 - - - - 95 1,083.4 - - - - 5 6 300 961997 44 10,344.0 - - - - 188 1,772.1 2 9.0 - - 7 3 300 2941998 45 10,420.0 - - - - 487 2,986.1 7 39.4 - - 11 - - 6311999 50 12,438.2 - - - - 907 3,861.7 11 61.1 - - 18 - - 9112000 57 14,783.2 - - - - 1,206 4,433.4 25 305.1 - - 25 - - 1,1312001 65 18,569.2 21 50.0 - - 1,487 5,169.0 54 593.9 - - 46 - - 1,4302002 74 22,127.2 327 1,299.2 - - 2,036 6,508.6 128 892.0 2 7.0 78 - - 1,4262003 80 25,870.7 727 2,638.9 6 94.8 2,666 7,998.4 219 1,132.4 2 2.1 174 - - 1,5302004 86 28,506.7 1,160 4,550.5 23 297.2 2,882 8,993.8 340 1,460.3 2 5.6 174 - - 1,1652005 88 31,417.2 1,296 5,836.2 58 900.5 2,784 9,355.2 315 1,504.7 1 1.6 156 - - 8912006 90 33,825.2 1,390 7,418.3 75 1,321.1 2,397 9,710.2 289 1,770.4 1 0.9 140 - - 710 1 2.52007 88 35,184.7 1,209 7,541.3 98 1,910.0 1,744 8,773.4 275 2,098.5 - - 127 - - 602 2 4.92008 91 37,351.7 929 8,062.0 82 1,442.8 1,142 9,476.1 269 1,801.0 - - 97 - - 450 2 4.92009 93 39,708.5 605 7,370.7 71 1,059.6 783 9,413.9 208 1,405.2 - - 61 - - 387 3 7.72010 94 43,341.5 452 7,659.4 52 796.1 512 10,002.1 246 1,373.7 - - 8 - - 147 4 11.2
1 93 39,658.5 593 7,258.0 67 1,034.5 785 9,546.9 216 1,449.8 - - 50 - - 347 3 7.72 95 40,458.5 582 7,215.0 66 1,029.3 793 9,644.9 216 1,414.7 - - 50 - - 347 3 7.73 96 40,858.5 564 7,131.7 66 1,015.2 795 9,679.9 216 1,433.1 - - 35 - - 227 3 7.74 96 41,558.5 557 7,153.2 61 1,000.0 765 9,704.4 217 1,429.4 - - 15 - - 177 2 5.25 96 41,958.5 528 7,106.7 61 997.8 733 9,695.4 225 1,449.0 - - 15 - - 177 2 5.26 95 41,964.5 511 7,172.6 61 951.8 665 9,724.8 232 1,471.2 - - 15 - - 177 3 7.97 94 41,664.5 497 7,142.9 60 940.3 627 9,841.4 236 1,494.1 - - 15 - - 177 4 11.28 94 41,964.5 489 7,218.8 61 976.7 588 9,889.8 240 1,525.4 - - 15 - - 177 4 11.29 94 42,264.5 462 7,276.2 59 925.5 569 9,928.3 244 1,560.9 - - 15 - - 177 4 11.2
10 94 42,664.5 458 7,282.2 58 898.0 548 9,843.0 240 1,492.7 - - 9 - - 160 4 11.211 95 43,131.5 451 7,315.2 58 893.1 551 9,911.3 246 1,421.1 - - 9 - - 160 4 11.212 94 43,341.5 452 7,659.4 52 796.1 512 10,002.1 246 1,373.7 - - 8 - - 147 4 11.2
2011 97 46,441.5 417 8,479.5 33 573.5 425 11,242.6 299 1,660.3 - - 2 - - 30 4 11.21 93 42,481.5 448 7,595.2 47 700.3 518 10,050.1 269 1,549.8 - - 7 - - 110 4 11.22 95 43,181.5 439 7,547.5 42 635.0 516 10,033.1 271 1,536.3 - - 7 - - 110 4 11.23 95 43,431.5 430 7,829.0 40 617.2 516 10,068.1 276 1,608.5 - - 5 - - 80 4 11.24 95 44,131.5 431 7,898.0 39 614.1 504 10,210.6 277 1,658.8 - - 5 - - 80 4 11.25 95 44,631.5 414 8,056.5 39 611.6 494 10,114.6 289 1,727.5 - - 5 - - 80 4 11.26 95 45,031.5 423 8,184.5 38 605.3 468 10,378.3 297 1,675.3 - - 5 - - 80 4 11.27 97 44,591.5 420 8,200.6 37 600.6 443 10,565.7 303 1,794.8 - - 5 - - 80 4 11.28 95 44,891.5 424 8,276.1 36 600.4 453 10,674.3 308 1,833.9 - - 5 - - 80 4 11.29 96 45,241.5 427 8,387.1 35 569.4 456 10,968.8 310 1,884.3 - - 5 - - 80 4 11.2
10 96 45,366.0 429 8,432.6 35 569.2 436 11,126.3 309 1,822.4 - - 2 - - 30 4 11.211 96 46,016.0 424 8,488.6 37 610.6 422 11,103.6 303 1,669.8 - - 2 - - 30 4 11.212 97 46,441.5 417 8,479.5 33 573.5 425 11,242.6 299 1,660.3 - - 2 - - 30 4 11.2
Notes : 1. As of year-end 2011, listed stripped bonds included: 1 issue of principal-only corporate bond in the sum of NT$1,800 million,1 issue of interest-only corporate bond in the sum of NT$470 million, 12 issues of principal-only bank debenture in the sum of NT$630 million, and 54 issues of interest-only bank debenture in the sum of NT$205 million, which are all included in this table.
2. As of year-end 2011, international bonds issued included: 3 issue of USD-denominated bond in the sum of US$860 million and 1 issues of AUD-denominated bond in the sum of 290 million AUD.

● 年度總覽
8
100年度櫃檯買賣市場指數走勢圖 Chart for Trends of GTSM Indexes in 20111
2011/01/01~2011/12/31
11/0
111
/02
11/0
311
/04
11/0
511
/06
11/0
711
/08
800
600
400
200
0
股票成交值︵單位:億元︶T
urnover
(NT
$100M
)

9
發行量加權股價指數 V
olume-w
eighted index
2011/01/01~2011/12/31
11/0
711
/08
11/0
911
/10
11/11
11/1
2
160
140
120
100
80
60
40
20
0

● 年度總覽
10
100年度櫃檯買賣市場每日收市股價指數一覽表Daily Closing of GTSM Indexes in 2011
2
月 Month日 Day
1月Jan.
2月Feb.
3月Mar.
4月Apr.
5月May
6月Jun.
7月Jul.
8月Aug.
9月Sep.
10月Oct.
11月Nov.
12月Dec.
1 - - 143.41 139.87 - 140.58 135.79 132.16 112.56 - 105.63 96.09
2 - - 143.30 - - 139.53 - 131.41 112.92 - 105.52 95.40
3 143.64 - 145.15 - 136.14 140.12 - 129.39 - 100.28 104.52 -
4 144.15 - 144.34 - 138.10 - 135.89 127.44 - 99.99 106.72 -
5 142.33 - - - 138.90 - 135.68 119.52 110.91 99.58 - 94.67
6 142.91 - - 141.15 138.95 - 136.67 - 108.15 99.95 - 92.52
7 142.06 - 144.18 142.33 - 140.56 136.55 - 109.67 100.61 107.87 92.56
8 - 145.45 144.82 142.07 - 140.35 135.82 114.13 109.78 - 107.69 91.10
9 - 144.26 144.87 - 139.20 140.17 - 111.85 110.14 - 106.93 90.34
10 142.24 143.01 143.30 - 138.99 138.31 - 116.45 - - 103.39 -
11 143.87 139.58 142.49 141.55 138.17 - 133.69 115.54 - 102.97 103.31 -
12 144.89 - - 139.38 138.30 - 129.71 116.14 - 103.53 - 90.47
13 144.55 - - 139.62 138.93 136.60 128.66 - 107.55 104.96 - 89.77
14 144.51 141.17 138.99 141.05 - 138.12 127.07 - 105.00 104.85 105.13 90.98
15 - 142.75 132.37 139.67 - 137.75 129.43 117.89 106.45 - 104.26 89.36
16 - 143.30 133.99 - 137.75 135.27 - 118.87 109.00 - 103.18 89.39
17 144.22 142.89 132.31 - 137.02 134.08 - 117.74 - 106.39 103.43 -
18 144.59 144.35 135.07 138.30 138.31 - 128.89 115.28 - 105.32 101.65 -
19 145.85 - - 137.55 138.28 - 129.24 109.41 107.73 105.15 - 86.21
20 146.21 - - 138.96 136.73 130.46 131.31 - 108.46 103.92 - 86.75
21 146.10 145.41 136.41 140.00 - 130.42 131.27 - 109.24 103.89 97.67 90.90
22 - 142.96 138.19 141.04 - 132.23 132.19 106.59 107.12 - 94.79 91.11
23 - 139.41 138.99 - 135.55 132.05 - 109.98 102.87 - 91.60 93.96
24 145.05 139.94 139.83 - 135.12 131.89 - 109.81 - 105.83 91.53 -
25 144.68 141.28 139.03 140.83 135.17 - 130.42 107.54 - 105.67 90.79 -
26 145.52 - - 140.94 136.81 - 131.82 106.60 98.67 105.85 - 94.46
27 145.87 - - 141.44 137.50 132.14 133.48 - 100.07 106.34 - 94.15
28 146.18 - 137.72 140.52 - 132.64 132.99 - 100.95 105.83 92.53 93.62
29 - - 137.83 138.65 - 133.39 131.51 108.47 101.80 - 94.44 93.95
30 - - 138.49 - 137.75 134.08 - 110.54 102.36 - 92.85 93.89
31 - - 138.92 - 139.81 - - 111.51 - 105.04 - -
當月平均 Average of the month
144.47 142.55 139.74 140.26 137.69 135.75 132.29 115.84 106.73 103.80 100.70 91.89
最高 High 146.21 145.45 145.15 142.33 139.81 140.58 136.67 132.16 112.92 106.39 107.87 96.09
最低 Low 142.06 139.41 132.31 137.55 135.12 130.42 127.07 106.59 98.67 99.58 90.79 86.21

11
100年度櫃檯買賣市場總覽 Overview of GTSM in 20113
股票市場 Stock Market
壹、發行面 Issuance
一、發行市場概況 Market Status
1. 本年度送件申請上櫃公司計有56家(含TDR及管理股票申請上櫃案各1家),新增上
櫃掛牌公司計有52家(含TDR掛牌上櫃案1家),截至100年12月31日止,櫃檯市場共
計有607家上櫃公司。
2. 本年度初次申請登錄興櫃公司計有87家,新增興櫃掛牌公司計有85家,截至100年12
月31日止,櫃檯市場共計有277家興櫃公司。
1. In 2011, 56 companies applied for IPO on GTSM (including one company applied for the
listing of TDR and one company applied for trading as a supervised stock) and 52 stocks
were newly listed (including one TDR listing). As of year-end 2011, the GTSM had 607
stocks listed on the Main Board.
2. In 2011, 87 companies applied for first-time registration as emerging stock and 85 stocks
were newly registered in the year. As of year-end 2011, the GTSM had 277 stocks registered
on the Emerging Market Board.
二、本年度重大制度之推行 Major systems implemented in 2011
(一)推動外國企業每股面額案
1. 97年開放外國企業來台掛牌,因有面額新台幣10元之要求,致外國公司需至開
曼等地設立控股公司。考量控股公司造成監理及資訊透明度之障礙,且紙上公
司掛牌,易使外界觀感不佳,復形成申請公司稅務等困擾,故本中心研提外國
企業每股面額建議方案。
2. 經本中心積極爭取,終獲主管機關同意,本中心爰於11月1日檢陳「外國有價
證券櫃檯買賣審查準則」等14項規章修正條文暨配套措施報局鑒核,主管機關
於12月6日准予備查後,本中心即於12月13日據以辦理公告。全案自101年1月1
日起施行,外國企業每股面額得非新台幣10元,無面額者亦可。

● 年度總覽
12
(二)為強化初次申請上櫃案件上櫃掛牌前之承銷作業之查核,故建置交叉比對系統並
訂定相關查核規範。
(三)為強化公司治理之要求,故將設置薪資報酬委員會增訂為申請上(興)櫃之要
件,並要求申請股票第一上櫃之外國企業應擇一設置監察人或審計委員會。
(四)為強化新掛牌上櫃公司之資訊揭露,故要求申請上櫃公司於掛牌前應於法人說明
會及公開說明書充分揭露相關營運等風險。
1. Promoting the change of stock par value rule for foreign listing applicants
(1) Taiwan’s bourses have been accepting the listing of foreign companies since 2008.
But to meet the NT$10 par value requirement, foreign companies interested in listing
on Taiwan’s bourse must first set up a holding company, such as in Cayman Islands.
In consideration of the problems of supervision and information transparency posed
by holding companies and the facts that the listing of paper companies does not invite
public trust and tends to complicate the tax reporting of applicants, the GTSM made a
proposal to the competent authority to change the stock par value rule for foreign listing
applicants.
(2) After considerable efforts, the GTSM finally obtained the consent of the competent
authority to amend the GTSM Criteria for Review of Foreign Securities and 13 other
regulations as well as related support measures. The amendments were submitted to the
competent authority for approval on November 1, which were approved on December
6, and subsequently promulgated on December 13. Starting January 1, 2012, foreign
companies that apply for registration on emerging market board or IPO on GTSM may
issue stocks with par value other than NT$10 or no-par stocks.
2. To step up the audit of IPO underwriting cases, GTSM has established a cross reference
system and drafted relevant audit rules.
3. To strengthen the requirements for corporate governance, the GTSM has included the setup
of compensation committee as a requirement for listing (registration) on the main board
(emerging market board) of GTSM, and requires foreign companies applying for IPO on
GTSM to set up either the position of supervisor or audit committee.
4. To ensure full information disclosure by newly listed companies, the GTSM requires listing
applicants to fully disclose operational and other risks in their pre-listing investor conference
and prospectus.

13
貳、交易面 Trading
一、證券商暨證券市場管理 Administration of Securities �rms and Over-the-counter Market
1. 本中心自87年12月1日起,實施證券櫃檯買賣交易市場共同責任制給付結算基金制
度,截至100年底基金規模計26.45億餘元。
2. 截至100年年底止,與本中心簽訂「證券商經營櫃檯買賣有價證券契約」之經營股票
證券商計總公司91家,分公司997家,合計1,088家。
3. 100年度股票交易天數計247天,市場之給付結算作業均如期完成,未發生證券商違約
交割案件。
1. GTSM has implemented a joint responsibility system payment and settlement fund on
December 1, 1998. As of December 31, 2011, the fund had a market size of NT$2,645
million.
2. As of year-end 2011, a total of 1,088 securities firms, including 91 head offices and 997
branches have signed Securities OTC trading agreements of security firms with GTSM.
3. There were a total of 247 trading days in 2011. All payment and settlement operations were
processed on time without any incidence of default by securities firms.
二、信用交易 Margin Trading
1. 本中心自88年1月1日起實施上櫃股票信用交易業務。至100年底得為融資融券交易的
上櫃股票家數,計有427家,占全體上櫃股票的70.35%。較99年底得為融資融券交易
的上櫃股票家數402家,增加25家。
2. 100年信用交易成交值(不含資券相抵)之比例為25.79%,較99年之比例27.90%,減
幅為7.56%。
3. 100年底融資餘額為348億元,較99年底融資餘額685億元,減少337億元,減幅為
49.20%。
4. 100年底融券餘額為91,558仟股,較99年底融券餘額89,079仟股,增加2,479仟股,增幅
為2.78%。
5. 100年底資券相抵交易成交值比例為9.14%,較99年底資券相抵交易成交值比例
8.96%,增幅為2.01%。
1. Margin trading of GTSM-listed stocks was put into effect on January 1, 1999. As of year-
end 2011, there were 427 GTSM-listed stocks allowed for margin financing and short selling,
accounting for 70.35% of all GTSM-listed stocks. The fact represented an increase of 25
stocks as compared to 402 GTSM-listed stocks allowed at the end of 2010.

● 年度總覽
14
2. The margin trading value (excluding offset of margin financing and short selling) as a
percentage of total market turnover in 2011 is 25.79%, decreasing 7.56% from 27.90% in
2010.
3. The amount of margin financing outstanding at the end of 2011 amounted to NT$34.8 billion,
representing a significant decrease of 49.20% or NT$33.7 billion as compared to NT$68.5
billion at the end of 2010.
4. The amount of securities loan at the end of 2011 amounted to 91,558,000 shares, an increase
of 2,479,000 shares or 2.78% as compared to the balance of 89,079,0000 shares at the end of
2010.
5. The trading value of margin purchase and short selling offset accounted for 9.14% of total
market turnover in 2011, up 2.01% as compared to 8.96% in 2010.
三、監視業務 Surveillance Operation
1. 本中心設有市場監視專責單位,負責規劃、執行監視制度。本中心監視業務主要包
含:線上監視作業、離線監視作業、不法交易查核作業、內部人股權管理作業。
2. 100年度本中心主要監視作業執行情形:公布上櫃有價證券交易資訊提醒投資人注意
計705次,達處置標準者計47次;另通知興櫃股票推薦證券商注意報價者計122次,公
布興櫃有價證券交易資訊者計5次,以提醒投資人注意。
1. The GTSM is staffed with a market surveillance unit in charge of planning and execution of
the surveillance system. The surveillance operation mainly covers: on-line surveillance, off-
line surveillance, examining illegal trading activities, and insider equity management.
2. Surveillance operation in 2011: We made 705 announcements of trade watch on securities
listed on GTSM, of which 47 events triggered disposition. We sent 122 notices of price quote
watch to recommending securities firms for emerging stocks, of which 5 events trigger public
announcement of trading information on specific emerging stock to call to the attention of
investors.
四、指數編製與類別 Index Constitution and Types
本中心自84年11月1日起正式對外發布「證券櫃檯買賣中心發行量加權股價指數」。該指
數是一種以股票市價總值編算之指數,基期指數為100點。隨著上櫃股票掛牌家數之遞
增,本中心並陸續發布了各種不同的分類股價指數。96年7月2日為配合上櫃公司產業分
類重新調整,並檢討當時上櫃公司各產業分類家數,因金融保險業以及證券業合併為金
融業,電器電纜類指數之採樣股票多數已轉上市交易,故配合調整部分產業分類指數,

15
調整後計有紡織纖維類、電機機械類、化學工業類、生技醫療類、鋼鐵工業類、建材營
造類、航運類、觀光事業類、半導體業、電腦及週邊設備業、光電業、通信網路業、電
子零組件業、電子通路業及資訊服務業等15種產業分類股價指數。
另為提供投資人更多衡量市場表現的指標,並為發展多元化金融商品奠定基礎,本中心
於99年4月30日發布以上櫃股票流通市值編製之櫃買「富櫃五十指數」及以國內指標公
債(5年、10年及20年)為標的,採簡單平均法計算的櫃買「台灣指標公債指數」。
The “Gre Tai Securities Market Capitalization Weighted Stock Index” that was published
by the GTSM on November 1, 1995 is an index constitute by the total market value of stocks,
with 100 points as the base. As more and more stocks were listed on GTSM, the GTSM
subsequently published a series of sector stock indexes. On July 2, 2007, the GTSM adjusted
some sector stock indexes in line with the reclassification of industries for GTSM-listed
companies and taking into consideration the number of listed companies under respective
industry. Given that banking and insurance industry and securities industry have been combined
into financial industry and the majority of constituent stocks in the electrical and cable
index have been transferred to TWSE, currently the GTSM publishes 15 sector stock price
indexes, namely textile, electric machinery, chemical, biotech, steel, building materials and
construction, shipping, tourism, semiconductor, computer and peripherals, optotronics, network/
communication, electronic components, electronic channel, and IT service.
To provide investors with more benchmarks for evaluating the market performance and to
prepare for the development of more financial products, the GTSM rolled out Gretai 50 Index
constituted based on the capitalization of GTSM-listed stocks and Taiwan Treasury Benchmark
Index with domestic benchmark government bonds (5-year, 10-year and 20-year) as constituents
and calculated using simple average method on April 30, 2010.
五、證券商證券交易相關費用 Service Fees
櫃檯買賣證券商向本中心繳納業務服務費,依下列方式每月計繳一次:
1. 經營櫃檯買賣上櫃股票經紀及自營業務者,按其每月成交金額10萬分之5.85。
2. 經營櫃檯買賣興櫃股票經紀及自營業務者,按其每月成交金額10萬分之3.25。
3. 證券商營業處所受託買賣股票,向委託人收取手續費之費率,自97年2月12日起,證
券商向委託人收取手續費之費率改為證券商得按客戶成交金額自行訂定費率標準,另
得訂定折讓及每筆委託最低費用。興櫃股票則以不超過客戶成交金額千分之5之上限
自行訂定。
Service fees paid by the securities firms are computed once a month by the following manners:
1. For brokers and dealers buying or selling GTSM-listed stocks, 0.00585% of the monthly
trading value.

● 年度總覽
16
2. For brokers and dealers buying or selling GTSM-registered emerging stocks, 0.00325% of
the monthly trading value.
3. Service fees a securities firm may charge its customers, securities firms may set their own rate
schedule for trades ordered by customers, and may set rate discount as well as the minimum
fees per transaction on February 12, 2008, and up to 0.5% of the trading amount for each
transaction of emerging stock.
債券市場 Bond Market本中心負責管理我國的債券市場,包括債券上櫃掛牌、交易及相關衍生性金融商品等制度之
規章訂定,以及執行市場秩序之維護及證券商管理作業。我國債券市場主要循證券商議價交
易為之,本中心受主管機關委託與監督,肩負我國債券市場發展與管理之重大使命。
The GTSM takes charge of the administration of Taiwan’s bond market. Our responsibilities include
the formulation of systems and rules governing the listing and trading of bonds and financial
derivatives, maintaining market order and administering over securities firms. As bonds are traded
primarily through over-the-counter negotiation in Taiwan, the GTSM shoulders the missions of
developing and administering the bond market under the mandate and supervision of the competent
authority.
壹、發行面 Issuance
我國證券櫃檯買賣市場截至100年底為止,上櫃債券共1,277期,發行餘額計68,427.4億元
及11.2億美元,發行餘額持續成長。在商品種類方面,包括政府債券計97期,發行餘額計
46,441.5億元;金融債券計417期,發行餘額計8,479.5億元;證券化受益證券計33期,發行餘
額計573.5億元;普通公司債共425期,發行餘額計11,242.6億元(內含分割普通公司債);轉
(交)換公司債計299期,發行餘額計1,660.3億元;外國債券計2期,發行餘額計30億元;國
際債券計4期,發行餘額計11.2億美元。
Up to the end of 2011, a total of 1,277 bonds with the amount outstanding of NT$6,842.74 billion
and US$1,120 million were listed on the GTSM. The bond products circulating on the market
include 97 issues of government bonds in the sum of NT$4,644.15 billion; 417 issues of financial
debentures in the sum of NT$847.95 billion; 33 issues of beneficiary securities in the sum of
NT$57.35 billion; 425 issues of straight corporate bonds in the sum of NT$1,124.26 billion (including
stripped corporate bonds); 299 issues of convertible (exchangeable) bonds in the sum of NT$166.03
billion; 2 issues of foreign bonds in the sum of NT$3 billion; and 4 issues of Formosa bonds in the
sum of US$1.12 billion.

17
貳、交易面Trading
100年債券市場整體證券商營業金額達到97兆7,883億元,其中買賣斷營業金額為26兆8,563億
元,佔全部成交量的27.46%,相較於99年的買賣斷交易市場規模(計42兆6,492億元,約佔
同年債市總成交量的40.12%),其成交量約減少37.03%。買賣斷交易仍以政府債券交易為
大宗,所佔比例達93.41%,其次為公司債約佔3.93%,其餘為轉換公司債1.36%、金融債券
1.20%、受益證券0.02%及外國債券0.08%。附條件交易之全年營業金額為70兆9,319億元,
佔全部成交量的72.54%,相較於99年的附條件交易市場規模(計63兆6,603億元,約佔同年
全部成交量的59.88%),增加約11.42%。
The turnover in the bond market in 2011 reached NT$97,788.3 billion, of which, NT$26,856.3
billion involved outright trades, accounting for 27.46% of total turnover and representing a decrease
of 37.03% from 2010 in volume (the outright trade market totaled NT$42,649.2 billion in 2010,
accounting for 40.12% of total turnover for the year). Government bonds still represented the
majority of outright trade, accounting for 93.41% of total turnover, followed by corporate bonds
(3.963%), convertible corporate bonds (1.36%), financial debentures (1.20%), beneficiary securities
(0.02%) and foreign bonds (0.08%). The turnover of RP/RS trades totaled NT$70,931.9 billion in
2011, accounting for 72.54% of total turnover and representing an increase of 11.42% from 2010 in
volume (the RP/RS trade market totaled NT$63,660.3 billion in 2010, accounting for 59.88% of the
yearly turnover).
我國公債買賣斷交易自91年本中心推出新一代的債券等殖成交系統以來,電子交易已成為買
賣斷交易的主要交易管道。100年本中心之債券等殖成交系統買賣斷營業金額達21兆8,682億
元,佔整體市場買賣斷交易的81.43%;等殖成交系統附條件交易營業金額為12兆3,711億元,
佔整體市場附條件交易的17.44%。
Since the GTSM introduced the new generation electronic bond trading system (EBTS) in 2002,
practically all outright trades of government bonds go through the EBTS. In 2011, the EBTS
recorded NT$21,868.2 billion in outright trading, amounting to 81.43% of total outright trades, and
NT$12,371.1 billion in RP/RS trading, accounting for 17.44% of all RP/RS trades.

● 年度總覽
18
參、債券投資方式及介紹 Bond Trading System
項 目
Item說 明
Description
交易方式
與
業務型態
Trading method and business
pattern
交易方式-營業處所議價:買賣斷、附條件。 z-等殖成交系統(含國際債券交易系統):買賣斷、附條件。
-固定收益證券交易系統:買賣斷。
-等價成交系統:買賣斷。
業務型態-營業處所議價:自營。 z-等殖成交系統(含國際債券交易系統):自營。
-固定收益證券交易系統、等價成交系統:自營、經紀。
Trading method-Over-the-counter negotiation: Outright trade and RP/RS trade. z-EBTS (Formosa bond trading system included): outright trade and RP/RS trade.-Fixed-income trading system: outright trade.-Automated trade matching system: outright trade.
Business pattern-Over-the-counter negotiation: proprietary trade. z-EBTS (Formosa bond trading system included): proprietary trade.-Fixed-income trading system, automated trade matching system: proprietary and
brokerage trade.
交易時間
Trading hours
營業處所議價-週一至週五:9:00am-3:00pm(買賣斷及附條件)。 z等殖成交系統-週一至週五: z
買賣斷9:00am-1:30pm。附條件(指定債券)9:00am-1:30pm、2:00-3:00pm。附條件(一般擔保品)9:00am-9:30am。
固定收益證券交易系統-週一至週五:9:00am-1:30pm(買賣斷)。 z等價成交系統-週一至週五:9:00am-1:30pm(買賣斷)。 zOver-the-counter negotiation zMonday ∼ Friday 9:00am-3:00pm (outright trade and RP/RS trade).EBTS zMonday ∼ Friday: Outright trade: 9:00am-1:30pm.
RP/RS trade (designated bonds): 9:00am-1:30pm, 2:00-3:00pm.RP/RS trade (general collateral financing (GCF)): 9:00am-9:30am.
Fixed-income trading system zMonday ∼ Friday: 9:00am-1:30pm (outright trade).Automated trade matching system zMonday ∼ Friday: 9:00am-1:30pm (outright trade).

19
項 目
Item說 明
Description
報價方式
與
成交單位
Quotation and trading units
營業處所議價-買賣申報:以殖利率或百元價格為之。 z升降單位:萬分之一個百分點(殖利率 0.0001 %)或萬分之一元。最低成交單位:面額新台幣1萬元。國際債券:
-以日圓為計價單位者,為面額日圓一百萬元。
-以歐元或美元為計價單位者,為面額一萬貨幣單位。
等殖成交系統-買賣申報:以殖利率為之。 z升降單位:萬分之一個百分點(殖利率 0.0001 %)。最低成交單位:
-電腦議價系統為新台幣面額5,000萬元。-比對系統為新台幣面額10萬元。-國際債券交易系統。
以日圓為計價單位者,為面額日圓一千萬元。
以歐元或美元為計價單位者,為面額十萬貨幣單位。
固定收益證券交易系統-買賣申報:以百元價格為之。 z升降單位:百分之一元。
最低成交單位:新台幣面額10萬元。等價成交系統-買賣申報:以百元價格為之。 z
升降單位:未滿150元者為5分,150元至未滿1,000元者為1元,1,000元以上者為5元。
最低成交單位:新台幣面額10萬元。Over-the-counter negotiation-Quoted by yield or by price in NT$100. z
Tick size: 0.01 b.p. (0.0001% yield) or $0.0001.Minimum trading unit: NT$10,000.Formosa bonds:-Japanese yen denominated bonds - ¥1 million. -Euro or USD denominated bonds - $10,000.
EBTS-Quoted by yield. zTick size: 0.01 b.p. (0.0001% yield).Minimum trading unit: -Electronic negotiation system: NT$50 million.-Matching system: NT$100,000.-Formosa bond trading system
Japanese yen denominated bonds - ¥10 million. Euro or USD denominated bonds - $100,000.
Fixed-income trading system-Quoted by price in NT$100. zTick size: $0.01.Minimum trading unit: NT$100,000.
Automated trade matching system-quoted by price in NT$100. zTick size: < $150, $0.05; $150 - $1,000, $1; >1,000, $5.Minimum trading unit: NT$100,000.

● 年度總覽
20
項 目
Item說 明
Description
成交價格
與
利息計算
Transaction price and interest calculation
買賣斷交易成交價格採除息交易,應計息由買方併同成交價金支付賣方。 z附條件交易應計息採計首不計尾方式,以每年365日,依實際持有天數計算。 z給付結算因天然災害或其他不可抗力事由而順延時,順延期間應予計息。 zThe transaction price is calculated based on the ex-interest price. The accrued interest is zincluded in the transaction price to be paid to the seller. The accrued interest in RP/RS trade is calculated based on the number of days held (the first zday of holding is counted, but not the last day of holding) over 365 days a year.If the payment day is postponed due to natural disaster or other force majeure event, the zdays postponed thereof shall accrue interest.
價格漲跌幅
Daily price movement limits
等價成交系統:7%。 z其他系統:無。 zAutomated trade matching system: 7%. zOther systems: None. z
成交資訊揭示
Disclosure of transaction information
證券商每日於其營業處所揭示債券交易相關價格資訊。 z本中心每日於其網站揭示債券行情資訊。 zSecurities firms disclose relevant trading price information at their business premises every zday.GTSM publishes daily transaction information on its website. z

21
項 目
Item說 明
Description
投資債券
稅負
Taxation
證券交易所得稅:免徵。 z證券交易稅:停徵。 z利息所得稅: z-債券發行人為本國發行人,投資人身分為:國內自然人: 依所得稅法第14條之1第1項,自96年1月1日起,中華民國境內居住之個人
持有公債、公司債及金融債券之利息所得改採分離課稅,按10%稅率扣繳稅款後,不再併計綜合所得總額,亦不適用儲蓄投資特別扣除之規定。
國內法人: 交易時先按10%稅率扣繳稅款,再依所得稅法第24條之1營利事業按債券持有期間,依債券面值及利率計算利息收入,該利息收入已依規定之10%扣繳率計算之扣繳稅額,得自結算申報應納稅額中減除。如於二付息間持有債券者,應以售價減除購進價格及依同項規定計算之利息收入後之餘額為證券交易所得或損失。
外國人: 交易時先按10%稅率扣繳稅款,再依其身分別所適用之扣繳率與10%相比,向稽徵機關補繳或退還其實際持有期間利息之稅款差額。
-債券發行人為外國發行人,投資人身分為:國內自然人:原則免稅,但高所得者須依最低稅負制課徵。國內法人:同「債券發行人為本國發行人」之規定。外國人:免稅。
Capital gain tax from securities trading: exempted. zSecurities transaction tax: suspended. zInterest income tax: z-If the bond is issued by a domestic issuer and the investor is a:
Domestic individual: According to Paragraph 1, Article 14-1 of Income Tax Act, starting January 1, 2007, interest income from government bonds, corporate bonds and financial debentures held by an individual residing in the Republic of China will no longer be included in the consolidated income but be subjected to a 10% separate taxation. In addition, such income will no longer be eligible for special deduction for savings and investments.
Domestic institution: Interest income from bonds will be subjected to a 10% tax withholding at the time of transaction. Then according to Article 24-1 of Income Tax Act, interest income of a profit-seeking enterprise from bond holdings will be calculated by the duration of holding, and the nominal value and the yield of bond. The 10% tax already withheld for the interest income may be deducted from the tax due. For bonds purchased between two interest payment dates, gain or loss from the securities transaction will be the net amount of sale price minus the purchase price and interest income calculated according to the provisions in the this paragraph.
Foreigner: Interest income from bonds will be subjected to a 10% tax withholding at the time of transaction. The foreigner will then file a tax return with the tax authority and pay additional tax or receive a refund depending on his/her applicable tax bracket and actual income earned during the holding period.
-If the bond is issued by a foreign issuer and the investor is a:Domestic individual: exempted in principle, but high income earners are subject to
alternative minimum tax.Domestic institution: The same as if the bond issuer is a domestic issuer.Foreigner: exempted.
手續費率
Fees
自營:免手續費。 z轉(交)換公司債透過等價成交系統者比照上櫃股票之規定,經紀手續費按買賣成交金額 z千分之1.425上限計收。Proprietary trade: No fees. zComparable to the trading of stocks, brokers may charge up to 0.1425% of the trading zamount for each bond transaction.

● 年度總覽
22
肆、債券交易市場100年度新制度介紹 New Systems Introduced in Bond Market in 2011
月 份
Month制度名稱
System說 明
Description
3 月March
轉交換公司債一日
未成交時之價格調
整機制
Price adjustment mechanism for convertible (exchangeable) bonds without transactions in one day
為使透過等價成交系統交易之轉換公司債得以更即時且合理調整當日之漲跌停
價格區間,並提升其價格反應速度,修正其「參考價格」於一般交易日之決
定方式,將「連續二日」無成交紀錄且僅有單邊報價始調整其參考價格,修正
為「單日」無成交紀錄且交易時間結束時有符合條件之買賣申報紀錄者即調整
其參考價格(即兩日未成交改為一日未成交),本系統業已建置完成,並已於
100年3月28日上線實施。To render the adjustment of day’s price movement limits for convertible (exchangeable) corporate bonds traded through the automated trade matching system more timely and reasonable and to speed up the reflection of their trading prices, we revised the method for determining the “reference price” of convertible (exchangeable) bonds on regular trading days. Originally, the reference price of a convertible (exchangeable) bond will be adjusted if there are no transaction records and there are only one-way quotes for the bond in “two consecutive days.” The new system under which reference price will be adjusted when there are no transaction records but there are records of price quote in “one single day” (i.e. “two days” without any transaction to “one day” without any transaction) was rolled out on March 28, 2011.
4 月April
美國公債附條件交
易之利息調整以每
年360天,按實際天數計算
The accrued interest on repo trade of U.S. treasury is calculated based on actual number of days held over 360 days a year
為使美國公債附條件買賣利息計算方式符合國際慣例,以每年360天,按實際天數計算之,業於100年4月11日公告修正本中心「證券商營業處所買賣有價證券業務規則」第52條,明訂外國公債由本中心另行公告。本中心並於100年4月14日公告美國公債附條件利息之計算方式。To align the method of calculating accrued interest on repo trade of U.S. treasury with international practice where accrual period is the actual number of days held over 360 days a year, we amended Article 52 of the GreTai Securities Market Rules Governing Securities Trading on the GTSM, which stipulates that the calculation of accrued interest on repo trade of foreign government bonds will be separately announced by the GTSM on April 11, 2011. We subsequently promulgated the method for interest calculation on April 14, 2011.
5 月May
債券網路掛牌制度
Internet-based bond listing system
為提升公司債等固定收益商品之上櫃掛牌效率並降低發行公司之成本,本中心
已於99年底規劃完成網路掛牌相關制度及系統建置方向,並於100年5月16日正式完成系統建置並上線實施。發行公司申請(報)債券上櫃掛牌可透過「債
券網路掛牌系統」辦理。債券網路掛牌能有效提升上櫃申請流程進行之效率
性、減少發行公司印製書件之成本,債券網路掛牌制度已成為發行公司申請債
券上櫃掛牌之主要模式。
In the efforts to enhance the listing efficiency of corporate bonds and other fixed-income products and help bond issuers reduce costs, we have completed the planning for Internet-based listing systems and system construction directions at the end of 2010 and launched the new listing system on May 16, 2011. Now bond issuer can apply (report) the listing of their bonds through the “Internet-Based Bond Listing System”, which effectively improves the efficiency of listing application process and reduces the issuers’ costs of document printing. Since its launch, the majority of bond issuers have been applying for bond listing through the new system.

23
月 份
Month制度名稱
System說 明
Description
5 月May
定期辦理資產交換
交易行情報表揭示
Regular disclosure of asset swap transactions
為強化資產交換交易之資訊揭露,本中心爰依資產交換交易之特性,分別依固
定收益端及選擇權端交易自100年5月起揭露相關交易行情之日報表及月報表。To strengthen the disclosure of asset swap transaction information, we started to produce daily reports and monthly reports for asset swap transactions in the categories of fixed income and options in May 2011.
6 月June
國際債券還本付息
基準日得以公開說
明書約定日期為之
The principal repayment date and interest payment date of Formosa bonds may be the agreed dates provided in the bond prospectus
為擴大國際債券市場規模,增加法規彈性俾利與國際慣例接軌,本中心於100年6月3日公告修訂外幣計價國際債券管理規則,明訂國際債券次級市場遇還本付息日時得彈性調整以符合國際慣例之作業規範,國際債券還本付息基準日得
以公開說明書約定日期為之。
To expand the scale of Formosa bond market and to add flexibility to related regulations so as to align with the international practice, we promulgated the amended GreTai Securities Market Rules Governing Management of Foreign-denominated Formosa Bonds on June 3, 2011, allowing flexible adjustment of principal repayment date and interest payment date in the Formosa bond secondary market to align with the international practice and allowing those dates to be the agreed dates provided in the bond prospectus.
6 月June
本中心「證券商對
一般客戶辦理衍生
性金融商品交易業
務應注意事項」之
實施
Implementation of “Directions for Securities Firms Conducting Financial Derivatives Businesses Involving General Customers”
為建立衍生性金融商品市場管理一致性規範及強化對一般客戶之權益保障事
宜,爰參考銀行相關規定,修正證券商辦理衍生性金融商品之規範,全案業已
於100年3月25日公告本中心「證券商營業處所經營衍生性金融商品交易業務規則」第30條、31條修正條文,以及增訂本中心「證券商對一般客戶辦理衍生性金融商品交易業務應注意事項」,並自100年6月25日起實施。To provide consistent guidelines for the administration of financial derivatives market and to enhance the protection of retail investors, we revised rules governing financial derivative products in reference to relevant rules for banks. Accordingly, we promulgated the amendment to Articles 30 and 31 of GreTai Securities Market Regulations Governing the Trading of Financial Derivatives on over-the-counter and the newly drafted Directions for Securities Firms Conducting Financial Derivatives Businesses Involving General Customers on March 25, 2011, which were implemented on June 25, 2011.
6 月June
強化債券附條件交
易憑證管理制度
Strengthening bond passbook management system for RP/RS transactions
為強化債券附條件交易採憑證交割之風險控管機制,降低債券自營商違約交割
之潛在風險,有效保障買賣雙方交易安全,爰修訂本中心「證券商營業處所買
賣有價證券業務規則」第78條之1,及本中心「證券商營業處所債券附條件買賣交易細則」第6條及第7條之1規定,並於100年6月1日公告自101年1月1日起實施。
To strengthen the risk control mechanism for bond RP/RS transactions settled via bond passbook so as to reduce the latent risk of default by bond dealers and effectively protect the trading security, we amended Article 78-1 of the GreTai Securities Market Rules Governing Securities Trading on the GTSM and Articles 6 and 7-1 of the GreTai Securities Market Rules Governing Bond Repurchase and Reverse Purchase Transactions on Over-the-Counter Markets, which were promulgated on June 1, 2011 and implemented starting January 1, 2012.

● 年度總覽
24
月 份
Month制度名稱
System說 明
Description
7 月July
外國公債交易系統
新增交易員部位管
理功能
The foreign government bond trading system is added a new function of dealer position management
為提升外國公債交易系統服務效能及配合證券商之交易需求,本中心於外國公
債交易系統新增交易員部位管理功能,相關系統功能業已於100年7月4日上線啟用。
For the sake of improving the service efficiency of our foreign government bond trading system and better serving the trading needs of securities firms, we added a new function of dealer position management to the foreign government bond trading system, which was rolled out on July 4, 2011.
9 月September
新台幣計價外國債
券上櫃掛牌制度
NTD-denominated foreign bond listing system
為因應第一與第二上市櫃外國公司申請新台幣計價外國轉換公司債上櫃掛牌,
本中心於100年9月完成修訂相關規章包括申請上櫃掛牌、交易方式與資訊申報等規定,於同年9月1日公告實施第一與第二上市櫃外國公司得依規定向本中心申請新台幣計價外國債券櫃檯買賣。
To accommodate the applications for listing of NTD-denominated foreign convertible bonds issued by foreign companies that have made IPO or issued TDR on GTSM, we completed the amendments of relevant regulations, including regulations governing GTSM listing application, trading methods and information disclosure in September 2011. The amendments were promulgated on September 1 the same year, according to which foreign companies that have made IPO or issued TDR on GTSM may apply to GTSM for trading of NTD-denominated foreign bonds they issue.
12 月December
客製化結構型商品
應建立新種商品內
部事前審查及事後
追蹤機制
Internal ex-ante review and ex-post follow-up mechanism for custom-made structured products
為強化證券商銷售客製化結構型商品之管理,以及避免證券商商品銷售之道德
風險與客戶涉及不法之行為,爰增訂證券商銷售客製化之結構型商品應建立新
種商品內部事前審查及事後追蹤機制,修訂本中心「證券商營業處所經營衍生
性金融商品交易業務規則」第30條之3及第30條之4,並於100年12月16日公告實施。
To step up the administration of sales of custom-made structured products by securities firms, reduce the moral risk on the part of securities firms in product selling and curtail possible illegal acts on the part of customers, we amended Articles 30-3 and 30-4 of GreTai Securities Market Regulations Governing the Trading of Financial Derivatives on over-the-counter, requiring securities firms that sell custom-made structured products to establish internal ex-ante review and ex-post follow-up mechanisms for new products. The new rule was promulgated and implemented on December 16, 2011.

25
月 份
Month制度名稱
System說 明
Description
12 月December
禁止證券自營商
對相同客戶為債
券買賣斷與附條
件交易或買斷與
賣斷交易相抵之
給付結算
Net settlement of outright trades and RP/RS trades of bond or outright purchase and outright sell trades of securities dealers with the same customer is prohibited
為強化債券自營商風險管理及維護市場交易秩序,禁止債券自營商與一般客
戶進行俗稱之「債券保證金交易」,同時避免影響金融機構間正常交易,爰
修訂本中心「證券商營業處所買賣有價證券業務規則」第70條之2及94條、「證券商營業處所債券附條件買賣交易細則」第12條之1及第12條之2、「公司債暨金融債券買賣辦法」第13條、「轉換公司債、交換公司債暨債券換股權利證書買賣辦法」第14條、「附認股權有價證券買賣辦法」第22條、「債券等殖成交系統買賣辦法」第6條之2規定,並自100年12月29日公告實施。To step up the risk management of bond dealers and uphold the market trading order, we sought to prohibit the practice of bond margin trading between bond dealers and general customers without affecting the normal dealings between financial institutions. Accordingly, we amended Articles 70-1 and 94 of GreTai Securities Market Rules Governing Securities Trading on the GTSM, Articles 12-1 and 12-2 of GreTai Securities Market Rules Governing Bond Repurchase and Reverse Purchase Transactions on Over-the-Counter Markets, Article 13 of Regulations Governing Trading of Corporate Bonds and Bank Debentures, Article 14 of Regulations Governing Convertible Corporate Bonds, Exchangeable Corporate Bonds and Certificate of Bond-to-Stock Conversion, Article 22 of Regulations Governing Trading of Securities with Warrants, and Article 6-2 of Regulations Governing the Electronic Bond Trading System. The amendments were promulgated and implemented on December 29, 2011.

● 統計資料
26
100年度一般類股新上櫃公司彙總表New Listing on GTSM Main Board in 2011
1
上櫃股票市場 Stock Market
公司名稱
Name of Company掛牌日期
Date of Listing股票代號
Code承銷價
IPO Price(NT$)股本(元)
Capital Stock(NT$)
牧德科技
MACHVISION,INC20110105 3563 26 225,496,350
研勤科技
Maction Technologies, Inc.20110111 3632 35 142,886,670
茂為歐買尬數位科技
MacroWell OMG Digital Entertainment Co., Ltd.
20110111 3687 120 156,000,000
東林科技
HEP TECH CO., LTD.20110111 3609 28 267,323,870
毅金工業
YIN KING INDUSTRIAL CO.,LTD.20110112 1566 19 317,728,700
弘塑科技
GRAND PLASTIC TECHNOLOGY CORPORATION
20110117 3131 62 200,000,000
力旺電子
eMemory Technology Inc.20110124 3529 70 624,520,790
森田印刷廠
Sentien Printing Factory Co.,Ltd20110223 8410 52 333,432,000
上詮光纖通信
FOCI Fiber Optic Communications, Inc.20110225 3363 35 532,890,800
盛弘醫藥
SHAREHOPE MEDICINE CO., LTD.20110301 8403 36 381,098,400
光頡科技
VIKING TECH CORPORATION20110316 3624 40 728,468,420
德英生物科技
G&E Herbal Biotechnology Co., Ltd.20110321 4911 68 485,000,000
光環科技
TrueLight Corporation20110324 3234 23.1 732,206,300
桃園大飯店
TAOYUAN HOTEL20110329 2718 31.8 199,200,000
商店街市集國際資訊
PCHOMESTORE INC.20110406 4965 150 129,400,000
F-馬光MA KUANG HEALTHCARE HOLDING LIMITED
20110429 4139 58 135,000,000

27
公司名稱
Name of Company掛牌日期
Date of Listing股票代號
Code承銷價
IPO Price(NT$)股本(元)
Capital Stock(NT$)
F-聯德Lemtech Holdings Co., Limited
20110429 4912 36 250,000,000
雙邦實業
Shuang-Bang Industrial Corp.20110503 6506 15.5 537,159,350
安馳科技ANSWER TECHNOLOGY CO., LTD.
20110518 3528 36.5 375,384,740
兆遠科技
CRYSTALWISE TECHNOLOGY INC.20110531 4944 60 738,282,990
耀億工業
YAO I FABRIC CO.,LTD.20110609 4430 50 399,435,000
紅心辣椒娛樂科技
Cayenne Entertainment Technology Co., Ltd.
20110610 4946 110 165,000,000
友輝光電
UBRIGHT OPTRONICS CORPORATION20110729 4933 78 439,700,000
樂陞科技
XPEC Entertainment Inc.20110803 3662 60 210,000,000
豪展醫療科技
Avita Corporation20110816 4735 16 261,200,110
家登精密工業
Gudeng Precision Industrial Co., LTD20110831 3680 35.5 322,000,000
F-譜瑞Parade Technologies, Ltd.
20110913 4966 130 399,410,750
亞洲電材
Asia Electronic Material Co., Ltd.20110919 4939 17.1 580,790,000
合一生技
ONENESS BIOTECH CO., LTD.20110923 4743 20 1,000,000,000
駿熠電子
Unitel High Technology Corporation20110929 3642 29 310,390,500
川寶科技
Chime Ball Technology Co.,Ltd20111004 1595 52 336,951,890
F-泰鼎Apex International Company Limited
20111018 4927 28 842,492,410

● 統計資料
28
公司名稱
Name of Company掛牌日期
Date of Listing股票代號
Code承銷價
IPO Price(NT$)股本(元)
Capital Stock(NT$)
F-欣厚HTM International Holding Ltd.
20111018 4924 28 301,748,510
F-昂寶On-Bright Electronics Incorporated
20111018 4947 98 360,655,750
彬台科技
TAIWAN BENEFIT COMPANY20111020 3379 25.5 251,045,840
擎泰科技
Skymedi Corporation20111108 3555 65 457,779,000
宇隆科技
Turvo International Co.,Ltd20111114 2233 63 303,817,840
基亞生物科技
Medigen Biotechnology Corporation20111123 3176 23 965,407,550
尚茂電子材料
ShineMore Technology Materials Co., Ltd20111129 8291 10 670,800,000
亞泰影像科技
ASIA TECH IMAGE INC.20111129 4974 22.5 466,840,000
康普材料科技
Coremax Corporation20111201 4739 23 414,999,300
F-東凌Cayman Tung Ling co., Limited
20111202 2924 62 250,000,000
F-必勝JP Nelson Holdings
20111206 8418 46 500,000,000
F-其祥Kee Song Bio-Technology Holdings Limited
20111212 1258 35 300,000,000
華星光通科技
LuxNet Corporation20111212 4979 20 342,197,680
穩懋半導體
WIN SEMICONDUCTORS CORP.20111213 3105 26 6,225,720,350
F-紅木Redwood Group Ltd
20111213 8426 50 360,000,000
傳奇網路
X-LEGEND ENTERTAINMENT CO., LTD20111213 4994 155 153,800,000
安心食品
AN-SHIN FOOD SERVICES CO.,LTD.20111215 1259 166 220,000,000
天宇工業
Formosa Electronic Industries Inc.20111219 8171 23.8 365,661,720
F-康樂KinoBiotech Co.,Ltd.
20111228 4154 38 188,000,000

29
100年度上櫃公司產業類別分布表GTSM-Listed Companies - by Industry in 2011
2
項 目
Item產業別
Sector
上櫃公司家數
No. of Listed Companies
上櫃公司總資本額 (百萬元)
Aggregate Capital of GTSM Listed
Companies﹙NT$Million﹚
上櫃公司總市值 (百萬元)
Market Capitalization of GTSM Listed
Companies﹙NT$Million﹚
占總市值比例
Percentage of Total Market Capitalization
食品工業 Food 3 2,302 4,065 0.29%
塑膠工業 Plastic 6 3,550 4,994 0.35%
紡織纖維 Textile 9 6,540 7,340 0.52%
電機機械 Electrical Machinery 27 18,533 43,282 3.05%
電器電纜 Electrical & Cable 2 867 1,811 0.13%
化學工業 Chemical 16 13,062 20,194 1.43%
生技醫療 Biotechnology & Medical Care
37 24,082 98,839 6.97%
鋼鐵工業 Iron & Steel 11 13,927 29,986 2.12%
橡膠工業 Rubber 1 610 1,044 0.07%
半導體業 Semiconductor 67 178,286 220,893 15.59%
電腦及週邊設備業 Computer & Peripheral Equipment
51 49,905 184,778 13.04%
光電業 Optoelectronic 49 63,017 140,803 9.94%
通信網路業 Communications & Internet
38 28,198 44,828 3.16%
電子零組件業 Electronic Parts & Components
106 99,228 149,740 10.57%
電子通路業 Electronic Products Distribution
20 13,135 18,363 1.30%
資訊服務業 Information Service 33 17,274 81,037 5.72%
其他電子業 Electronics 41 27,906 71,996 5.08%
建材營造 Building Material & Construction
21 33,398 83,362 5.88%
航運業 Shipping & Transportation
5 4,416 8,182 0.58%
觀光事業 Tourist 5 5,768 10,215 0.72%
金融業 Financial 9 81,255 77,613 5.48%
貿易百貨 Trading & Consumer’s Goods
9 9,051 40,144 2.83%
油電燃氣業 Gas & Electricity 4 4,219 9,605 0.68%
其他 Others 32 25,855 61,636 4.35%
管理股票 Supervised 5 7,530 2,336 0.16%
總 計 Total 607 731,915 1,417,085 100.00%

● 統計資料
30
歷年上櫃公司家數變動情形一覽表Overview of Changes to GTSM Listing
3
年 度Year
新上櫃
家數
No. of New
Listing
下櫃公司
Delisted Company轉台灣證券交易所上市
Transfer to TWSE Listing管理股票
Supervised Stock
至年底上櫃
公司合計
No. of Listing by Year-end
家數
No.公司名稱
Company家數
No.公司名稱
Company
1989 1 0 1
1990 3 0 4
1991 5 0 9
1992 3 1南帝化工
NANTEX INDUSTRY.CO.,LTD.11
1993 3 3
亞瑟科技、福懋油脂、國巨
CIS TECHNOLOGY INC., FORMOSA OILSEED PROCESSING CO., LTD., YAGEO CORPORATION
11
1994 3 0 14
1995 29 2
精業、利奇機械
SYSTEX CORPORATION, LEE CHI ENTERPRISES CO., LTD.
41
1996 38 0 79
1997 41 1
正義
CHENG I FOOD CO., LTD
5
藍天電腦、三洋電機、大安銀
行、萬通銀行、中華銀行
CLEVO CO., SANYO ELECTRIC CO., LTD., DAH AN COMMERCIAL BANK, GENERAL BANK, THE CHINESE BANK
正豐化學、羽田機
械
CHENG HONG CHEMICAL CO., LTD.,YTM,
114
1998 74 12
耿鼎企業、台光電子、鴻運電
子、瑞昱、萬泰銀行、台新銀
行、玉山銀行、聯邦銀行、亞太
銀行、遠東銀行、華信銀行、富
邦銀行
GORDON AUTO BODY PARTS CO., LTD., ELITE MATERIAL CO., LTD., POTRANS ELECTRICAL CORPORATION, REALTEK SEMICONDUCTOR CORP., COSMOS BANK, TAIWAN, TAISHIN INTERNATIONAL
176

31
年 度Year
新上櫃
家數
No. of New
Listing
下櫃公司
Delisted Company轉台灣證券交易所上市
Transfer to TWSE Listing管理股票
Supervised Stock
至年底上櫃
公司合計
No. of Listing by Year-end
家數
No.公司名稱
Company家數
No.公司名稱
Company
1998
BANK, E.SUN COMMERCIAL BANK, LTD., UNION BANK OF TAIWAN, ASIA PACIFIC BANK, FAR EASTERN INTERNATIONAL BANK, BANK SINOPAC, TAIPEI FUBON BANK.
1999 102 14
中興銀行、天仁茶葉、大眾銀
行、世昕企業、泰銘實業、云辰
電子、秋雨印刷、合勤科技、安
泰銀行、普立爾、億光電子、精
碟科技、昌益建設、映泰
CHUNG SHING BANK, TENREN GROUP, TC BANK, LUXON ELECTRONICS CORPORATION, THYE MING INDUSTRIAL CO., LTD., EVERSPRING INDUSTRY CO., LTD., CHOICE LITHOGRAPH INC., ZYXEL COMMUNICATIONS CORPORATION, ENTIE COMMERCIAL BANK, LTD., PREMIER IMAGE TECHNOLOGY CORPORATION, EVERLIGHT ELECTRONICS CO., LTD., PRODISC TECHNOLOGY INC., CHANG-YIH CONSTRUCTION CO., LTD., BIOSTAR MICROTECH INTERNATIONAL CORP.
新泰伸、大業、
東隆五金、金緯
纖維、中精機、大
鋼、峰安、易欣工
程
S&T TECHNOLOGY CO., LTD. ,TA YEH CO., LTD.TONG LUNG METAL INDUSTRY CO., LTD. ,KING-WEI TEXTILE CO., LTD.VICTOR-TAICHUNG MACHINERY,TAH CHUNG STEEL CORP. ,FENG AN METAL IND. CO.,,yishin engineering co., Ltd.
264
2000 105 6
三粹、住聯、京華、矽
豐、中強電子、大業
SCIENTRADE CO., LTD., JUH LIEN INDUSTRIAL CO., LTD., CORE PACIFIC SECURITIES, SILICONWARE CORPORATION, CHUNTEX ELECTRONIC CO., LTD., GREAT ELECTRONICS
63
凌陽科技、首利實業、漢唐訊
聯、浩鑫、欣高石油氣、大山電
線電纜、華豐橡膠、鑽全實業、
興泰實業、永裕塑膠、地球綜合
工業、恆大、三洋紡織、台南企
業、弘裕企業、本盟紡織、恩德
實業、樂士電機、亞崴機電、高
林、勤美、億泰電線電纜、榮星
電線電纜、合機電線電纜、元禎
企業、永記造漆、台灣中華化
學、新光鋼鐵、新鋼工業、佳大
世界、環隆科技、精技電腦、錩
新科技、世平興業、圓剛科技、
雅新實業、仲琦科技、新巨企
業、建準電機、國聯光電、固緯
電子、隴華電子、承啟科技、鼎
元光電、三商電腦、興勤電子、
大穎企業、國產汽
車、延穎實業、紐
新企業、中強電
子、尖美建設、瑞
圓纖維
AHIN CO. LTD.CHINESE AUTOMOBILE CO. LTD.YANIN LEATHER CO. LTD.NEW SUN METAL INDUSTRY CO. LTD.CHUNTEX ELECTRONIC CO., LTD.,
300

● 統計資料
32
年 度Year
新上櫃
家數
No. of New
Listing
下櫃公司
Delisted Company轉台灣證券交易所上市
Transfer to TWSE Listing管理股票
Supervised Stock
至年底上櫃
公司合計
No. of Listing by Year-end
家數
No.公司名稱
Company家數
No.公司名稱
Company
2000
永兆精密、燦坤實業、聯昌電
子、倚天資訊、互盛、統懋半導
體、台灣電路、偉詮電子、旺
詮、英誌企業、美律實業、皇翔
建設、根基營造、成霖企業、慶
豐富、欣錩國際、全國加油站
SUNPLUS TECHNOLOGY CO., LTD., SOLYTECH ENTERPRISE CORPORATION, UNITED INFORMATION SYSTEMS CO., LTD., SHUTTLE INC., HSIN KAO GAS CO., LTD., DAN SAN ELELCTRIC WIRE & CABLE CORP., HWA FONG RUBBER IND. CO., LTD., BASSO INDUSTRY CORP., SHIN TAI INDUSTRY CO., LTD., YONYU PLASTICS CO., LTD., GLOBE INDUSTRIES CORPORATION, UNIVERSAL INCORPORATION, TRI OCEAN TEXTILE CO. LTD., TAINAN ENTERPRISES CO., LTD., HONMYUE ENTERPRISE CO., LTD., UMAGH TEXTILE CO., LTD., ANDERSON INSUSTRIAL CORP., LUXE ELECTRIC CO., LTD., AWEA MECHANTRONIC CO., LTD., KAULIN MANUFACTURING CO. LTD., CHINA METAL PRODUCTS CO., LTD., EVERTOP WIRE CABLE CORPORATION, JUNG SHING WIRE CO., LTD., HOLD-KEY ELECTRIC WIRE & CABLE CO., LTD., YUAN JEN ENTERPRISES CO., LTD., YUNG CHI PAINT & VARNISH MFG.CO., LTD., CHUNG HWA CHEMICAL INDUSTRIAL WORKS,LTD., HSIN KUANG STEEL CO. LTD., SINKANG INDUSTRIES CO., LTD., CHIA TA WORLD CO., LTD., UNIVERSAL MICROELECTRONICS CO., LTD., UNITECH ELECTRONICS CO., LTD., CX TECHNOLOGY
TOP COSTRUCTION & DEVELOPMENT CO.. LTD.Royal Information Electronics Co., Ltd.,

33
年 度Year
新上櫃
家數
No. of New
Listing
下櫃公司
Delisted Company轉台灣證券交易所上市
Transfer to TWSE Listing管理股票
Supervised Stock
至年底上櫃
公司合計
No. of Listing by Year-end
家數
No.公司名稱
Company家數
No.公司名稱
Company
2000
CORPORATION, WORLD PEACE INDUSTRIAL CO., LTD., AVERMEDIA TECHNOLOGIES INC., YA HSIN INDUSTRIAL CO., LTD., HITRON TECHNOLOGIES INC., ZIPPY TECHNOLOGY CORP, SUNONWEALTH ELECTRIC MACINE INDUSTRY, UNITED EPITAXY COMPANY, GOOD WILL INSTRUMENT CO., LTD., LUNG HWA ELECTRONICS CO., LTD., CHAINTECH COMPUTER CO., LTD., TYNTEK CORPORATION, MERCURIES DATA SYSTEMS LTD., THINKING ELECTRONIC INDUSTRIAL CO., QUALITEK ELECTRONICS CO., TSANN KUEN ENTERPRISE CO., LTD., LINE CHANG ELECTRONIC ENTERPRISE CO., LTD., E-TEN INFORMATION SYSTEMS CO. LTD., AURORA SYSTEMS CORP., MOSPEC SEMICONDUCTOR CORP., PRINTED WIRE CORP., WELTREND SEMICONDUCTOR INC., RALEC ELECTRONIC CORPORATION, ENLIGHT CORPORATION, MERRY ELECTRONICS CO., LTD., HUANG HSIANG CONSTRUCTION CORPORATION, KEDGE CONSTRUCTION CO., LTD., GLOBE UNION INDUSTRIAL CORP., CHING FENG HOME FASHIONS CO.,LTD., COMPEX INTERNATIONAL CO., LTD., NATIONAL PETROLEUM CO., LTD.
2001 97 16
尖美建設、金緯纖維、
瑞圓纖維、大穎企業、
皇旗資訊、五洲製革、
崑泰營造、長銘實業、
佳茂、聯友光電、東榮
纖維、榮美開發、德利
開發、信南建設、永昌
48
五鼎生技、宏亞食品、新企工
程、中宇環保、和大工業、美吾
華、毛寶、花仙子、允強實業、
華新科技、友立資訊、資通電
腦、麗臺科技、百容電子、大毅
科技、志聖工業、敦吉科技、研
揚科技、瑞軒科技、思源科技、
台灣工礦、宏福建
設、元富鋁業、尚
鋒實業
TAIWAN INDUSTRIAL DEVELOPMENT CORPORATION
333

● 統計資料
34
年 度Year
新上櫃
家數
No. of New
Listing
下櫃公司
Delisted Company轉台灣證券交易所上市
Transfer to TWSE Listing管理股票
Supervised Stock
至年底上櫃
公司合計
No. of Listing by Year-end
家數
No.公司名稱
Company家數
No.公司名稱
Company
2001
證券、富邦證券
TOP COSTRUCTION & DEVELOPMENT CO., LTD., KINGWEI TEXTILE CO., LTD., KING TEXTILE CO., LTD., AHIN CO., LTD., Royal Information Electronics Co., Ltd., UNIVERSAL TANNERY CO., LTD., KUEN-TAI CONSTRUCTION,CHANG MIEN INDUSTRIES CO., GETMORE PRECISION CO., LTD., Unipac Optoelectronics Corp., TUNG ZONG TEXTILE CO., LTD., ACELAND-DYNASTY CORPORATION, d-Life Development Co., Ltd., HSIN NAN CONSTRUCTION CO., LTD.,Entrust Securities Co., Ltd., Fubon Securities Co., Ltd.
品佳、華經資訊、皇統光碟、飛
宏企業、建通精密、光群雷射、
敦陽科技、連宇、冠西電子、強
茂、美隆電器、訊碟科技、和立
聯合、中華映管、一詮精密工
業、義隆電子、立隆電子、力信
興業、漢平電子、鉅祥企業、盟
立自動化、台灣良得、可成科
技、兆赫電子、希華晶體、長榮
航空、信義房屋、裕融企業
Apex Biotechnology Corp., HUNYA FOODS CO., LTD., PHOENIXTEC ENGINEERING CO., LTD., China Ecotek Corp., HOTA INDUSTRIAL MFG. CO., LTD., Maywufa Co., Ltd., Mao Bao INC., FARCENT ENTERPRISE CO.,LTD., YEUN CHYANG INDUSTRIAL CO., LTD., WALSIN TECHNOLOGY CORPORATION, ULEAD SYSTEMS INC., ARES INTERNATIONAL CORP., LEADTEK RESEARCH INC., EXCEL CELL ELECTRONIC CO., LTD., TA-I TECHNOLOGY CO., LTD., C SUN MFG LTD., AUDIX CORPORATION, AAEON Technology Inc., AMTRAN TECHNOLOGY CO., LTD., SPRINGSOFT INC., SILICON APPLICATION CORP., Fortune Information Systems Corp., SUMMIT COMPUTER TECHNOLOGY CO.,LTD., PHIHONG ENTERPRISE CO., LTD., GEM TERMINAL IND.CO., LTD., K LASER TECHNOLOGY INC., STARK TECHNOLOGY INC., UNIFORM INDUSTRIAL CORP., Cosmo Electronics Corporation, PAN JIT INTERNATIONAL INC., MEILOON INDUSTRIAL CO., LTD., Infodisc Technology Co., LTD., Helix Technology Inc.,
HUNG FU CONSTRUCATION CO LTDENSURE CO LTD.SHANGFENG INDUSTRIAL CO., LTD.

35
年 度Year
新上櫃
家數
No. of New
Listing
下櫃公司
Delisted Company轉台灣證券交易所上市
Transfer to TWSE Listing管理股票
Supervised Stock
至年底上櫃
公司合計
No. of Listing by Year-end
家數
No.公司名稱
Company家數
No.公司名稱
Company
2001
CHUNGHWA PICTURE TUBES LTD., I-CHIUN PRECISION INDUSTRY CO., LTD., ELAN MICROELECTRONICS CORP., LELON ELECTRONICS CO., LTD., LI SHIN INTERNATIONAL ENTERPRISE CORPORATION, HANPIN ELECTRON CO., LTD., G-SHANK ENTERPRISE CO., LTD., Mirl Automation Corporation, TAIWAN LINE TEK ELECTRONIC CO., LTD., CATCHER TECHNOLOGY CO., LTD., ZINWELL CORPORATION, SIWARD CRYSTAL TECHNOLOGY CO., LTD., EVA AIRWAYS CORPORATION, Sinyi Realty Inc., TAIWAN ACCEPTANCE CORPORATION
2002 113 19
大日開發、龍田建設、
旭龍、長榮貨櫃、維
迪、玉山票券、日盛銀
行、日盛證券、新寶證
券、建弘證券、大華證
券、台証證券、關貿、
晶磊、擎邦、柏承、歐
格、商合行、博登
GREATSUN DEVELOPMENT TECHNOLOGY Co.,LTD , NATIONAL INVESTMENT TRUST CO., LTD.Grand Cathay Securities Corp. , Taiwan Securities Co. Ltd.TRADE-VAN INFORMATION SERVICES CO. ,SmartASIC Technology,INC. KING POLYTECHNIC ENGINEERING CO. KING POLYTECHNIC ENGINEERING CO. LTD.
43
元富證券、寶來證券、統一證
券、巨庭機械、德律科技、同開
科技工程、亞洲光學、衛道科
技、威達電、好樂迪、華固建
設、憶聲電子、星通資訊、杏輝
藥品、禾伸堂、盛達電業、增你
強、日勝化工、正峰工業、零壹
科技、佰鴻工業、偉訓科技、威
健實業、聯詠科技、智原科技、
新麗企業、全台晶像、宏傳電
子、遠見科技、揚智科技、喬福
機械、台灣晶技、科風、健鼎科
技、台灣大哥大、建碁、訊舟、
信邦電子、文瞱科技、欣興電
子、奇普仕、今皓實業、華立
MasterLink Securities Corporation, Polaris Securities Co., Ltd., President Securities Corp., CHIU TING MACHINERY CO., LTD., Test Research, Inc., TUNG KAI TECHNOLOGY ENGINEERING CO., LTD., ASIA OPTICAL CO., INC., Cradle Technology Corp., ICP Electronics Inc., HOLIDAY GROUP CO., Ltd., HUAKU CONSTRUCTION CO., LTD.,
尚德、順大裕、立
大、三采
TATEH INDUSTRY CO., LTDTaiyu Products CorporationLEE TAH FARM INDUSTRIES CO.,LTDSUN SPLENDOR CO., LTD.
384

● 統計資料
36
年 度Year
新上櫃
家數
No. of New
Listing
下櫃公司
Delisted Company轉台灣證券交易所上市
Transfer to TWSE Listing管理股票
Supervised Stock
至年底上櫃
公司合計
No. of Listing by Year-end
家數
No.公司名稱
Company家數
No.公司名稱
Company
2002
PLOTECH CO. LTD.Ahoku Electronic CompanySaho Co. Ltd.Pro Healthcare International Co. Ltd.
ACTION ELECTRONICS CO., LTD., Loop Telecommunication International Inc., SINPHAR PHARMACEUTICAL CO., LTD., HOLY STONE ENTERPRISE CO., LTD., BILLION ELECTRIC CO., LTD., ZENITRON CORPORATION, EVERMORE CHEMICAL INDUSTRY CO., LTD., JENN FENG INDUSTRIAL CO., LTD., Zero One Technology Co., Ltd., BRIGHT LED ELECTRONICS CORP., COMPUCASE ENTERPRISE CO., LTD., Weikeng Industrial Co., Ltd., NOVATEK MICROELECTRONICS CORP., FARADAY TECHNOLOGY CORP., SHINIH ENTERPRISE CO., LTD., EMERGING DISPLAY TECHNOLOGIES CORP., WELL COMMUNICATION CORP., GLOBAL VIEW CO., LTD., ALi Corporation, ROUNDTOP MACHINERY INDUSTRIES CO., LTD., TXC CORPORATION, POWERCOM CO ., LTD., Tripod Technology Corporation, TAIWAN CELLULAR CORPORATION, AOpen Inc., EDIMAX TECHNOLOGY CO., LTD., SINBON ELECTRONICS CO.,LTD., Wintech microelectronics Co., Ltd., UNIMICRON TECHNOLOGY CORP., ULTRA SOURCE TECHNOLOGY CORP., Ji-Haw Industrial Co., Ltd., WAH LEE INDUSTRIAL CORP.
2003 83 20
華登、台灣慧智、蔚
華、台育證券、正豐化
學、羽田機械、峰安金
屬、延穎實業、紐新企
業、資訊傳真、建弘投
信、統合開發、中精
機、國產汽車、工礦、
宏福建設、易欣技術工
24
上福全球科技、大傳企業、友勁
科技、台灣汽電共生、四維航
業、正文科技、宏齊科技、亞翔
工程、東台精機、松翰科技、迎
廣科技、金鼎證券、金橋科技、
勁永國際、建國工程、崇越科
技、捷泰精密工業、富爾特科
技、瑞智精密、聚碩科技、慧友
東隆、大鋼、尚
鋒、尚德、順大
裕、立大、三采
建、華隆
TONG LUNG METAL INDUSTRY CO., LTD. , TAH CHUNG STEEL
423

37
年 度Year
新上櫃
家數
No. of New
Listing
下櫃公司
Delisted Company轉台灣證券交易所上市
Transfer to TWSE Listing管理股票
Supervised Stock
至年底上櫃
公司合計
No. of Listing by Year-end
家數
No.公司名稱
Company家數
No.公司名稱
Company
2003
程、元富鋁業、天泰、
尚鋒興業
WALTON PHARMACEUTICAL CO., LTD., WYSE TECHNOLOGY INC., SPIROX SYSTEMS CORPORATION , TAI YU SECURITIES CO., LTD., CHENG HONG CHEMICAL CO., LTD., YTM, FENG AN METAL IND. CO.,, YANIN LEATHER CO., LTD., NEW SUN METAL INDUSTRY CO., LTD., THE INFOPRO GROUP INC., NATIONAL INVESTMENT TRUST CO., LTD., TUNG HO DEVELOPMENT CO., LTD., VICTOR-TAICHUNG MACHINERY, CHINESE AUTOMOBILE COMPANY, TAIWAN INDUSTRIAL DEVELOPMENT COPORATION, HUNG FU CONSTRUCTION, YISHIN ENGINEERING CO., LTD., ENSURE CO., LTD., TIEN TAI ELECTRODE CO., LTD., SUN HOME LEATHER CORP.
電子、銳普電子、瀚宇博德、柏
承科技
GENERAL PLASTIC INDUSTRIAL CO., LTD., TECO ENTERPRISE CO., LTD., CAMEO COMMUNICATIONS, INC., TAIWAN COGENERATION CORPORATION, SHIH WEI NAVIGATION CO., LTD., GEMTEK TECHNOLOGY Co., LTD, HARVATEK CORPORATION, L & K ENGINEERING CO., LTD., TONG-TAI MACHINE TOOL CO., LTD, SONIX TECHNOLOGY CO., LTD., IN WIN DEVELOPMENT INC., TAIWAN INTERNATIONAL SECURITIES CORPORATION, GOLDEN BRIDGE ELECTECH INC., POWER QUOTIENT INTERNATONAL CO., LTD., CHIEN KUO CONSTRUCTION CO., LTD., TOPCO SCIENTIFIC CO., LTD., JYE TAI PRECISION INDUSTRIAL CO., LTD., FULLERTON TECHNOLOGY CO., LTD., RECHI PRECISION CO.,LTD., SYSAGE THCHNOLOGY CO., LTD., EVERFOCUS ELECTRONICS CORP., HANNSTAR BOARD CORP., XEPEX ELECTRONICS CO., LTD., PLOTECH CO., LTD.
CORP. , SUN HOME LEATHER CORP , TATEH INDUSTRY CO., LTD., TAIYU PRODUCTS CORPORATION, LEE TAH FARM INDUSTRIES CO.,LTD, SUN SPLENDOR CO., LTD., HUALON CORPORATION
2004 87 18
博登、亞洲證券、順大
裕、尚鋒興業、大中鋼
鐵、十美企業、大寶精
密工具、百成行、一等
高科技、助群營造、國
隆纖維、昱昕電子、尚
德興業、立大、瑩寶、
宏廣、益和、台通光電
Pro Healthcare International Co.,Ltd.,
26
互億科技、帆宣系統科技、長虹
建設、豐藝電子、鎰勝工業、敦
南科技、元大京華證券、飛捷科
技、華孚科技、如興製衣、瀚宇
彩晶、訊連科技、巨路國際、
盛群半導體、天瀚科技、悠克電
子、亞弘電科技、居易科技、建
興電子科技、雃博、佳必琪國
際、力成科技、凌華科技、今國
光學科技、順天建設、遠翔空運
東隆、耀文、百成
行、嘉畜、 惠勝TONG LUNG METAL INDUSTRY CO., UNICAP ELECTRONICS INDUSTRIAL CORP., MOKOH & ASSOCIATES, INC., Chia Hsin Livestock
466

● 統計資料
38
年 度Year
新上櫃
家數
No. of New
Listing
下櫃公司
Delisted Company轉台灣證券交易所上市
Transfer to TWSE Listing管理股票
Supervised Stock
至年底上櫃
公司合計
No. of Listing by Year-end
家數
No.公司名稱
Company家數
No.公司名稱
Company
2004
ASIA SECURITIES INC., TAIYU PRODUCTS CORP., SUN HOME LEATHER CORP , TAH CHUNG STEEL CORP., SHEA MAY LTD.TAIHO TOOL MFG., MOKOH & ASSOCIATES, INC., EDEN TECHNOLOGY, COOPERATI-VE CONSTRUCTION CO., LTD, KOU LONG TEXTILE CO., LTD., Luxon Systems Corporation, SUN HOME LEATHER CORP, LEE TAH FARM INDUSTRIES CO.,LTD, LITE VISION CO., LTD, WANG FILM, MICROTEST, TAI TUNG COMMUNICATION
倉儲
Billionton Systems Inc., MARKETECH INTERNATIONAL CORP., CHONG HONG CONSTRUCTION CO., LTD., Promate Electronic Co.,Ltd., I-SHENG ELECTRIC WIRE & CABLE CO., LTD., LITE-ON SEMICONDUCTOR CORP., YUANTA CORE PACIFIC SECURITIES CO., LTD, FLYTECH TECHNOLOGY CO., LTD., Waffer Technology Corp., ROO HSING GARMENT CO., LTD, Hannstar Display Corp., Cyberlink Co., , LUMAX INTERNATIONAL CORP. LTD., HOLTEK SEMICONDUCTOR INC., AIPTEK International Inc., YOKO TECHNOLOGY CORP., YA HORNG ELECTRONIC CO., LTD, DrayTek Corporation, LITE-ON IT CORPORATION, APEX MEDICAL CORP., JESS-LINK PRODUCTS CO., LTD., Powertech Technology Inc., ADLINK TECHNOLOGE INC, KINKO OPTICAL CO.,LTD., SWEETEN CONSTRUCTION CO.,LTD., FAR GLORY AIR CARGO TERMINAL CO., LTD
Corp., HUI SHUNG AGRICULTURE & FOOD CORP.
2005 56 15
洪氏英、高鋁金屬、捷
力科技、佰鈺科技、世
峰、廣大興業、立生
半導體、矽成、華特、
三采建設實業、華隆、
東正元、宇詮、大騰電
子、陽慶電子
Horng Technical Enterprise CO.,LTD, TAKAO ALUMINIUM ALLOY CO.LTD., Jet Power Technology Co., Ltd, ACORP ELECTRONICS CORPORATION, Puretek Industrial
4
鄉林建設事業、陞泰科技、遠傳
電信、群益證券
Shining Building Business Co.,Ltd.,AV TECH CORPORATION, Far EasTone Telecommunications Co., Ltd., CAPITAL SECURITIES CORP.
東隆、耀文、百成
行、嘉畜、 惠勝、東雲、東正元
TONG LUNG METAL INDUSTRY CO., UNICAP ELECTRONICS INDUSTRIAL CORP., MOKOH & ASSOCIATES, INC., Chia Hsin Livestock Corp., HUI SHUNG AGRICULTURE & FOOD CORP., TUNTEX DISTINCT CORPORATION,
503

39
年 度Year
新上櫃
家數
No. of New
Listing
下櫃公司
Delisted Company轉台灣證券交易所上市
Transfer to TWSE Listing管理股票
Supervised Stock
至年底上櫃
公司合計
No. of Listing by Year-end
家數
No.公司名稱
Company家數
No.公司名稱
Company
2005
Co.,Ltd,Tritronic Co. Ltd.,Antekic Co.,Ltd, Integrated Circuit Solution Inc., Chantek Co.,Ltd, SUN SPLENDOR CO., LTD., HUALON CORPORATION, ORIENT FIRST INDUSTRY CO., LTD., EPCO TECHNOLOGY CO LTD, ULTIMA ELECTRONICS CORP., GLOBALSUNTECH CO LTD,
ORIENT FIRST INDUSTRY CO., LTD.
2006 41 10
鴻源科技、德鑫科技、
嘉新畜產、金腦科、百
成行、惠勝實業、耀文
電子、振遠科技、新寶
科、中友百貨
UNI-CIRCUIT INC , Destiny Technology Corporation, Chia Hsin Livestock Corp. PACCO TECH. CO., LTD. , MOKOH & ASSOCIATES, INC. , HUI SHUNG AGRICULTURE & FOOD CORP., UNICAP ELECTRONICS INDUSTRIAL CORP., Frontek Technology Corporation , SAMPO TECHNOLOGY CORP. , Chung Yo Department Store Co.,LTD
3
鈞寶電子、輔祥實業、凌巨科技 KING CORE ELECTRONICS INC., FORHOUSE CORPORATION, GIANTPLUS TECHNOLOGY CO., LTD.
東雲、羅馬磁磚、
亞瑟科、東正元、
金腦科、欣煜科
技(原名稱:陞
技)、中興紡織、
東企
TUNTEX DISTINCT CORPORATION , United Ceramics Co.,Ltd. , CIS TECHNOLOGY INC., ORIENT FIRST INDUSTRY CO., LTD. , PACCO TECH. CO., LTD., Sainfoin Technology Corp., CHUNG SHING TEXTILE CO.,LTD, Taitung Business Bank.
531

● 統計資料
40
年 度Year
新上櫃
家數
No. of New
Listing
下櫃公司
Delisted Company轉台灣證券交易所上市
Transfer to TWSE Listing管理股票
Supervised Stock
至年底上櫃
公司合計
No. of Listing by Year-end
家數
No.公司名稱
Company家數
No.公司名稱
Company
2007 42 13
鼎太國際、竟誠建築、
台東企銀、欣煜科技、
飛雅高科技、東正元電
路工業、東雲、展茂光
電、正利航業、寶華銀
行、碼斯特科技、華僑
銀行、中興紡織
PROTOP TECHNOLOGY CO., LTD.JAN CHENG CONSTRUCTION CO.,LTDTAITUNG BUSINESS BANKXinYu Technology Corp.FEYA TECHNOLOGIES CO.,LTDORIENT FIRST INDUSTRY CO., LTD.TUNTEX DISTINCT CORPORATIONALLIED MATERIAL TECHNOLOGY CORP.CNCLINE CO LTD.,BOWA BANKMASTER ADVANCED CO.,LTD.BANK OF OVERSEAS CHINESE (BOOC) CHUNG SHING TEXTILE CO.,LTD
13
瑞儀光電、雷虎科技、遠雄建
設、精成科技、華東科技、中磊
電子、日電貿、勝德國際、新日
興、東貿國際、和椿科技、長華
電材、至上電子
RADIANT OPTO-ELECTRONICS CORP.THUNDER TIGER CORP.Farglory Land Development Co., LtdGLOBAL BRANDS MANUFACTURE LIMITEDSERCOMM CORP.WALTON ADVANCED ENGINEERING, INC.NICHIDENBO CORPORATIONPOWERTECH INDUSTRIAL CO., LTD.ENFIELD MEDICAL CO.,LTDShin Zu Shing Co ., LTD.AUROTEK CORPORATIONCHANG WAH ELECTRONMATERIALS INC.Supreme Electronics Co., Ltd
鼎大科技、飛雅高
科技、遠茂光電、
鼎營科技、建台水
泥、碼斯特科技、
和立聯合、羅馬磁
磚、亞瑟科、金腦
科
PROTOP TECHNOLOGY CO., LTD.FEYA TECHNOLOGIES CO.,LTDOptodisc Technology CorporationDING ING TECHNOLOGY CO., LTD.CHIEN TAI CEMENT CO.,LTDMASTER ADVANCED CO.,LTD.Helix Technology Inc.UnitedCeramics Co.,Ltd. , CISTECHNOLOGY INC.,PACCO TECH.CO., LTD.,
547
2008 26 15
新泰伸、得捷、宏億國
際、亞瑟、金腦科、仕
欽、羅馬、遠茂光電、
圓創、遠航、艾群科
技、鐵研、鼎營、磐英
(於97年1月由上櫃公司轉管理股票公司,且
同年4月下管理股票)EPOX COMPUTER CO., LTD.HTS TECHNOLOGY
19
佳龍、譁裕、聯茂、嘉聯益、詮
欣、淳安電子、尖點、炎洲、皇
鼎建設、威力盟、川湖、昇貿
科技、懷特、華興電子、光鼎電
子、全科科技、羅昇企業、競國
實業、致新
SUPER DRAGON TECHNOLOGY CO., LTD. WHA YU INDUSTRIAL CO., LTD.ITEQ CORPORATION.CAREER TECHNOLOGY (MFG.)
鼎大科技、飛雅高
科技、建台水泥、
碼斯特科技、和立
聯合、得捷
PROTOP TECHNOLOGY CO., LTD.FEYA TECHNOLOGIES CO., LTD.CHIEN TAI CEMENT
539

41
年 度Year
新上櫃
家數
No. of New
Listing
下櫃公司
Delisted Company轉台灣證券交易所上市
Transfer to TWSE Listing管理股票
Supervised Stock
至年底上櫃
公司合計
No. of Listing by Year-end
家數
No.公司名稱
Company家數
No.公司名稱
Company
2008
CO., LTD.SMARTEAM CORPORATION.LIH DUO INTERNATIONAL CO., LTD. CIS TECHNOLOGY INC.PACCO TECH. CO., LTD.EVERSKILL TECHNOLOGY CO., LTD.UNITED CERAMICS Co., LTD. OPTODISC TECHNOLOGY CORPORATION.AIMTRON TECHNOLOGY CORPORATION.FAR EASTERN AIR TRANSPORT CORPORATION.EVERELITE TECHNOLOGY CO., LTD. TAK TECHNOLOGY CO., LTD.DING ING TECHNOLOGY CO., LTD.
CO., LTD.CHANT SINCERE CO., LTD.SHUN ON ELECTRONIC CO., LTD.TOPOINT TECHNOLOGY CO., LTD.YEMCHIO.COM.LTD.FOUNDING CONSTRUCTION DEVELOPMENT CO., LTD.WELLYPOWER OPTRONICS CORPORATION.KING SLIDE WORKS CO., LTD.SHENMAO TECHNOLOGY INC.PHYTO HEALTH CORPORATION.LEDTECH ELECTRONICS CORP. PARA LIGHT ELECTRONICS CO., LTD.ALLTEK TECHNOLOGY CORP.ACE PILLAR CO., LTD.APCB INC. GLOBAL MIXED-MODE TECHNOLOGY INC.
CO., LTD.MASTER ADVANCED CO., LTD.HELIX TECHNOLOGY INC.SMARTEAM CORPORATION.
2009 25 9
詮鼎、和立聯合、鼎
大、禾鴻、基泰營造、
飛雅、佳鼎、亞智、和
樂
Asian Information Technology Inc.Helix Technology Inc.Protop Technology Co., LTD.Advanced Research, Engineering and Consulting, Inc.Development Inc.FEYA Technologies Co.,
9
新天地、聚鼎、瀚荃、百一、富
鼎、信錦、迅杰、台虹、晟鈦
New Palace International Co., Ltd.POLYTRONICS TECHNOLOGY CORP.CviLux Corporation.Prime Electronics & Satellitics Inc.Advanced Power Electronics Corp.SYNCMOLD ENTERPRISE CORP.ENE Technology Inc.TAIFLEX Scientific Co.,Ltd.
建台、華宇、精
碟、碼斯特、得
捷、佳鼎
CHIEN TAI CEMENT CO.,LTD.Arima Photovoltaic & Optical Corp.PRODISC TECHNOLOGY INC.MASTER ADVANCED CO.,LTD.SMARTEAM CORPORATION.
546

● 統計資料
42
年 度Year
新上櫃
家數
No. of New
Listing
下櫃公司
Delisted Company轉台灣證券交易所上市
Transfer to TWSE Listing管理股票
Supervised Stock
至年底上櫃
公司合計
No. of Listing by Year-end
家數
No.公司名稱
Company家數
No.公司名稱
Company
2009
LTD.VERTEX PRECISION ELECTRONICS, INC.INTECH MACHINES CO., LTD.HOLA HOME FURNISHINGS Co., Ltd.
CHEER TIME ENTERPRISE CO., LTD.
VERTEX PRECISION LECTRONICS,INC.
2010 27 1
頂倫
J-THREE INTERNATIONAL HOLDING CO.,LTD
8
景岳、台表科、超眾、為升、鑫
永銓、弘憶、精誠、上緯
GenMont Biotech Incorporation、Taiwan Surface Mounting Technology Corp.、CHAUN-CHOUNG TECHNOLOGY CORP.、 CUB ELECPARTS INC.、 HSIN YUNG CHIEN CO.,LTD.、G.M.I Technology Inc.、SYSTEX CORPORATION、 SWANCOR.IND.CO.,LTD.
建台、英群、華
宇、精碟、高盛
電、得捷、佳鼎。
CHIEN TAI CEMENT CO.,LTD.、Behavior Tech Computer Corp.、Arima Photovoltaic & Optical Corp.、PRODISC TECHNOLOGY INC.、 Gold Sun Technology Co., Ltd.、SMARTEAM CORPORATION、VERTEX PRECISION LECTRONICS,INC.
564
2011 51 2
精碟、得捷
PRODISC TECHNOLOGY INC.、SMARTEAM CORPORATION
6
晶睿、三星、鳳凰、關貿、勤
誠、利勤
VIVOTEK INC.、SAN SHING FASTECH CORP.、Phoenix Tours International, Inc.、TRADE-VAN INFORMATION SERVICES CO.、CHENBRO MICOM CO., LTD.、 LI CHENG ENTERPRISE CO.,LTD.
建台、英群、華
宇、高盛電、佳鼎
CHIEN TAI CEMENT CO.,LTD.、Behavior Tech Computer Corp.、Arima Photovoltaic & Optical Corp.、 Gold Sun Technology Co., Ltd.、VERTEX PRECISION LECTRONICS,INC.
607
註:「新上櫃家數」包含管理股票家數。
Note:“No. of New Listing”include supervised stocks.

43
100年度上櫃公司現金增資及無償配股總額表Cash Capital Increase and Gratuitous Stock Distribution of GTSM-Listed Companies in 2011
4
項 目
Item金額(新台幣億元)
Amount(in NT$ 100 Million)百分比
(%)
現金增資
Capital Increase by Cash45.8 23.60%
無償配股
Gratuitous Stock Distribution148.3 76.40%
合 計
Total194.1 100%

● 統計資料
44
100年度上櫃公司資本變動統計表Capital Change of GTSM Board Listed Companies in 2011
5
年/月Yr / Mo
初次上櫃公司 Initial Public Offering
增資 Capital Increase
減資 Capital Decrease
終止上櫃 Delisting 資本變動合計數
Total Change in Capital家數
No.面額
Par Value
現金增資
Cash Offering
盈餘轉增資
Capitalization of Earnings
資本公積轉增資
Capitalization of Capital Reserve
合併增資 Capital Increased
by Acquisition
其他 Others
家數 No.
面額 Par Value
家數 No.
面額 Par Value
家數 No.
面額 Par Value
家數 No.
面額 Par Value
家數 No.
面額 Par Value
家數 No.
面額 Par Value
家數 No.
面額 Par Value
2011 / 01 7 2.35 4 0.67 - - - - - - 70 0.34 5 0.22 - - 3.13
2011 / 02 2 0.97 - - - - - - - - 94 0.39 8 2.09 - - -0.73
2011 / 03 5 2.90 - - - - - - - - 97 2.69 8 0.51 - - 5.08
2011 / 04 3 0.57 2 0.15 - - - - 2 0.21 83 2.99 6 0.07 - - 3.85
2011 / 05 3 1.88 1 0.60 - - - - - - 83 0.76 18 0.21 1 12.76 -9.73
2011 / 06 2 0.62 4 0.60 6 0.48 2 0.11 - - 65 0.84 8 1.58 - - 1.07
2011 / 07 1 0.48 6 0.81 37 2.79 7 0.42 - - 33 2.09 6 0.81 1 0.63 5.16
2011 / 08 3 0.94 5 0.52 65 7.47 17 1.02 - - 53 0.44 6 0.13 1 0.38 9.88
2011 / 09 4 2.68 4 0.37 22 1.59 7 0.36 - - 61 1.38 3 0.34 1 2.20 3.85
2011 / 10 5 2.38 4 0.45 3 0.13 3 0.21 - - 51 0.22 19 2.40 1 0.61 0.37
2011 / 11 5 3.39 4 0.30 2 0.15 1 0.10 - - 51 0.19 16 7.77 - - -3.64
2011 / 12 11 10.14 1 0.10 - - - - - - 52 2.30 19 1.64 3 3.27 7.63
2011 51 29.30 35 4.57 135 12.61 37 2.22 2.00 0.21 793 14.63 122 17.77 8 19.85 25.92
註:1. 上表現金增資面額係以除權基準日股票面額核算之面額。其他項包括債券換股權利證書、可轉換公司債、員工認股權憑證及私募股份等。2. 上櫃公司歷年現金增資實際募集面額如下(含IPO之現金增資及發行GDR),以募資完成日為統計基準日。
87年:878.24億元、88年:424.78億元、89年:450.58億元、90年:205.98億元、91年:472.05億元、92年:284.75億元、93年:358.93億元、94年:478.80億元、95年:597.93億元、96年:323.2億元、97年:75.65億元、98年:418.59億元、 99年:323.92億元、100年12月:39.03億元、累計至12月:258.85億元。
3. 減資包括上櫃公司買回庫藏股辦理減資。

45
年/月Yr / Mo
初次上櫃公司 Initial Public Offering
增資 Capital Increase
減資 Capital Decrease
終止上櫃 Delisting 資本變動合計數
Total Change in Capital家數
No.面額
Par Value
現金增資
Cash Offering
盈餘轉增資
Capitalization of Earnings
資本公積轉增資
Capitalization of Capital Reserve
合併增資 Capital Increased
by Acquisition
其他 Others
家數 No.
面額 Par Value
家數 No.
面額 Par Value
家數 No.
面額 Par Value
家數 No.
面額 Par Value
家數 No.
面額 Par Value
家數 No.
面額 Par Value
家數 No.
面額 Par Value
2011 / 01 7 2.35 4 0.67 - - - - - - 70 0.34 5 0.22 - - 3.13
2011 / 02 2 0.97 - - - - - - - - 94 0.39 8 2.09 - - -0.73
2011 / 03 5 2.90 - - - - - - - - 97 2.69 8 0.51 - - 5.08
2011 / 04 3 0.57 2 0.15 - - - - 2 0.21 83 2.99 6 0.07 - - 3.85
2011 / 05 3 1.88 1 0.60 - - - - - - 83 0.76 18 0.21 1 12.76 -9.73
2011 / 06 2 0.62 4 0.60 6 0.48 2 0.11 - - 65 0.84 8 1.58 - - 1.07
2011 / 07 1 0.48 6 0.81 37 2.79 7 0.42 - - 33 2.09 6 0.81 1 0.63 5.16
2011 / 08 3 0.94 5 0.52 65 7.47 17 1.02 - - 53 0.44 6 0.13 1 0.38 9.88
2011 / 09 4 2.68 4 0.37 22 1.59 7 0.36 - - 61 1.38 3 0.34 1 2.20 3.85
2011 / 10 5 2.38 4 0.45 3 0.13 3 0.21 - - 51 0.22 19 2.40 1 0.61 0.37
2011 / 11 5 3.39 4 0.30 2 0.15 1 0.10 - - 51 0.19 16 7.77 - - -3.64
2011 / 12 11 10.14 1 0.10 - - - - - - 52 2.30 19 1.64 3 3.27 7.63
2011 51 29.30 35 4.57 135 12.61 37 2.22 2.00 0.21 793 14.63 122 17.77 8 19.85 25.92
Note:1. The Par Value of Capial-Increased is calculated by ex-duvudend date (par) value. Item in column "others" includes : Certificate of Entitlement, Convertible Bond, employee stock option, private placement.
2. Fund raised through the GTSM seasoned issued market for the past years (included issuing new stock in IPO and GDR) : (as of the last day of offerings)1998 : NT$87.82 billion、1999 : NT$42.48 billion、2000 : NT$45.06 billion、2001 : NT$20.60 billion、2002 : NT$47.21 billion、2003 : NT$28.48 billion、2004 : NT$35.90 billion、2005 : NT$47.88 billion、2006 : NT$59.79 billion、2007 : NT$32.32 billion、2008 : NT$7.57 billion、 2009 : NT$41.86 billion、2010 : NT$32.39 billion、Dec. 2011 : NT$3.9 billion, accumulated to Dec. 2011 : NT$25.89 billion.
3. Capital decrease includes the reduction by the treasury stocks.
單位:十億元
Unit:NT$Billion

● 統計資料
46
100年度上櫃股票交易情形統計表Trading of GTSM-Listed Stocks in 2011 - by Month
6
項 目 Item
1 月Jan.
2 月Feb.
3 月Mar.
4 月Apr.
5 月May
6 月Jun.
7 月Jul.
8 月Aug.
9 月Sep.
10 月Oct.
11 月Nov.
12 月Dec.
合計
Total
股票總成交值(億元)
Total Trading Value(NT$100 Million)
4,044.89 3,027.88 5,237.01 3,753.01 4,251.29 3,703.41 3,536.00 3,448.67 2,479.12 2,233.29 2,474.40 1,741.40 39,930.36
股票總成交股數(千股) Total Volume(1,000 shares)
10,735,861 7,293,878 11,928,244 8,764,672 9,585,591 8,178,032 8,295,407 9,265,894 6,399,491 5,475,577 7,075,106 5,415,903 98,413,656
股票總成交筆數
Total Number of Transactions 3,819,332 2,812,595 4,914,571 3,686,830 4,019,226 3,553,086 3,448,634 3,701,055 2,769,136 2,516,490 2,951,773 2,310,869 40,503,597
股票交易日數
Trading Days 20 14 23 19 21 21 21 23 21 20 22 22 247
股票平均日成交值(億元)
Average Daily Trading Value(NT$100 Million)
202.24 216.28 227.70 197.53 202.44 176.35 168.38 149.94 118.05 111.66 112.47 79.15 161.66
股票平均日成交量(千股)
Daily Average Volume(1,000 shares)
536,793 520,991 518,619 461,299 456,457 389,430 395,019 402,865 304,738 273,779 321,596 246,177 398,436
股票平均日成交筆數(筆)
Daily Average Number of Transactions
190,967 200,900 213,677 194,044 191,392 169,195 164,221 160,915 131,864 125,825 134,172 105,040 163,982
股票每筆交易平均金額(千元)
Average Value Per Transaction(NT$1,000)
105.91 107.65 106.56 101.79 105.77 104.23 102.53 93.18 89.53 88.75 83.83 75.36 98.58
股票每筆交易平均股數(千股)
Average Volume Per Transaction(1,000 shares)
2.81 2.59 2.43 2.38 2.38 2.30 2.41 2.50 2.31 2.18 2.40 2.34 2.43
股票月底指數
End-of-month Index146.18 141.28 138.92 138.65 139.81 134.08 131.51 111.51 102.36 105.04 92.85 93.89 93.89

47
項 目 Item
1 月Jan.
2 月Feb.
3 月Mar.
4 月Apr.
5 月May
6 月Jun.
7 月Jul.
8 月Aug.
9 月Sep.
10 月Oct.
11 月Nov.
12 月Dec.
合計
Total
股票總成交值(億元)
Total Trading Value(NT$100 Million)
4,044.89 3,027.88 5,237.01 3,753.01 4,251.29 3,703.41 3,536.00 3,448.67 2,479.12 2,233.29 2,474.40 1,741.40 39,930.36
股票總成交股數(千股) Total Volume(1,000 shares)
10,735,861 7,293,878 11,928,244 8,764,672 9,585,591 8,178,032 8,295,407 9,265,894 6,399,491 5,475,577 7,075,106 5,415,903 98,413,656
股票總成交筆數
Total Number of Transactions 3,819,332 2,812,595 4,914,571 3,686,830 4,019,226 3,553,086 3,448,634 3,701,055 2,769,136 2,516,490 2,951,773 2,310,869 40,503,597
股票交易日數
Trading Days 20 14 23 19 21 21 21 23 21 20 22 22 247
股票平均日成交值(億元)
Average Daily Trading Value(NT$100 Million)
202.24 216.28 227.70 197.53 202.44 176.35 168.38 149.94 118.05 111.66 112.47 79.15 161.66
股票平均日成交量(千股)
Daily Average Volume(1,000 shares)
536,793 520,991 518,619 461,299 456,457 389,430 395,019 402,865 304,738 273,779 321,596 246,177 398,436
股票平均日成交筆數(筆)
Daily Average Number of Transactions
190,967 200,900 213,677 194,044 191,392 169,195 164,221 160,915 131,864 125,825 134,172 105,040 163,982
股票每筆交易平均金額(千元)
Average Value Per Transaction(NT$1,000)
105.91 107.65 106.56 101.79 105.77 104.23 102.53 93.18 89.53 88.75 83.83 75.36 98.58
股票每筆交易平均股數(千股)
Average Volume Per Transaction(1,000 shares)
2.81 2.59 2.43 2.38 2.38 2.30 2.41 2.50 2.31 2.18 2.40 2.34 2.43
股票月底指數
End-of-month Index146.18 141.28 138.92 138.65 139.81 134.08 131.51 111.51 102.36 105.04 92.85 93.89 93.89

● 統計資料
48
100年度上櫃公司產業別財務資訊統計表Financial Information of GTSM-Listed Companies in 2011 - by Sector
7
產業別 Sector
公司家數
No. of Company營業收入(百萬元)
Revenues(NT$Million)營業收入平均值
Average Revenue 營收均值成長率(%)
Growth(%)99 100 99 100 99 100
生技醫療業
Biotechnology & Medical Care
30 37 31,823 34,547 1,061 934 -11.98
食品工業
Food2 3 2,566 3,554 1,283 1,185 -7.66
塑膠工業
Plastic6 6 8,042 7,764 1,340 1,294 -3.46
紡織纖維
Textile10 9 10,090 10,264 1,009 1,140 13.03
電機機械
Electrical Machinery24 27 33,824 39,587 1,409 1,466 4.03
電器電纜
Electrical & Cable2 2 3,715 3,587 1,858 1,794 -3.45
化學工業
Chemical14 16 22,349 26,182 1,596 1,636 2.51
通訊網路業
Communications & Internet
34 38 39,617 43,531 1,165 1,146 -1.69
鋼鐵工業
Iron & Steel12 11 53,177 53,488 4,431 4,863 9.73
橡膠工業
Rubber1 1 1,275 1,811 1,275 1,811 42.04
資訊服務業
Information Service28 33 44,997 50,348 1,607 1,526 -5.06
其他電子業
Electronics39 41 97,315 113,820 2,495 2,776 11.26
半導體業
Semiconductor62 67 295,185 220,974 4,761 3,298 -30.73
電腦及週邊設備業
Computer & Peripheral Equipment
51 51 230,341 212,121 4,516 4,159 -7.91
光電業
Optoelectronics47 49 140,460 125,585 2,989 2,563 -14.24

49
產業別 Sector
公司家數
No. of Company營業收入(百萬元)
Revenues(NT$Million)營業收入平均值
Average Revenue 營收均值成長率(%)
Growth(%)99 100 99 100 99 100
電子零組件業
Electronic Parts & Components
98 107 165,144 179,263 1,685 1,675 -0.58
電子通路業
Electronic Products Distribution
21 20 97,530 95,261 4,644 4,763 2.56
建材營造
Building Material & Construction
18 21 40,786 42,276 2,266 2,013 -11.15
航運業
Shipping & Transportation
5 5 4,973 5,295 995 1,059 6.47
觀光事業
Tourism4 5 5,860 7,730 1,465 1,546 5.53
金融業
Financial8 9 31,725 33,309 3,966 3,701 -6.67
貿易百貨
Trading & Consumer’s Goods
7 9 54,548 61,637 7,793 6,849 -12.11
油電燃料業
Gas & Electricity4 4 9,644 10,224 2,411 2,556 6.01
其他業
Others30 31 52,470 57,884 1,749 1,867 6.76
管理股票
Supervised7 5 3,550 3,318 507 664 30.85
註1:100年度數據係自結數。註2:金融保險業之金控公司營收採其各子公司營收合計數。Note 1:2011 figures are based on unaudited data.Note 2:Revenues of financial holding companies in finance/insurance sector include those of subsidiaries.

● 統計資料
50
100年度上櫃股票產業別交易量值表 Turnover of Stock Trades in 2011 - by Sector
8
產業別 Sector
總成交金額(億元)
Total Trading Value(NT$100M)百分比
(%)
總成交股數(千股)
Total Volume(1,000 shares)百分比
(%)
食品工業 Food 14.71 0.04 102,212 0.10
塑膠工業 Plastic 51.19 0.13 248,123 0.25
紡織纖維 Textile 126.93 0.32 496,206 0.50
電機機械 Electrical Machinery 810.58 2.03 2,380,969 2.42
電器電纜 Electrical & Cable 19.89 0.05 75,915 0.08
鋼鐵工業 Iron & Steel 673.13 1.69 2,310,105 2.35
橡膠工業 Rubber 34.84 0.09 149,884 0.15
建材營造 Building Material & Construction 1,185.25 2.97 3,084,123 3.13
航運業 Shipping & Transportation 48.43 0.12 202,427 0.21
觀光事業 Tourism 207.69 0.52 605,156 0.61
金融業 Financial 733.11 1.84 5,424,413 5.51
貿易百貨 Trading & Consumer’s Goods 375.34 0.94 941,663 0.96
其他 Others 1,411.11 3.53 3,975,094 4.04
化學工業 Chemical 460.80 1.15 1,822,949 1.85
生技醫療 Biotechnology & Medical Care 1,965.59 4.92 3,114,687 3.16
油電燃氣業 Gas & Electricity 10.66 0.03 66,432 0.07
半導體業 Semiconductor 8,519.56 21.34 24,214,247 24.60
電腦及週邊設備業 Computer & Peripheral Equipment 5,258.24 13.17 8,097,490 8.23
光電業 Optoelectronics 6,953.55 17.41 12,756,701 12.96
通信網路業 Communications & Internet 1,492.37 3.74 4,895,266 4.97
電子零組件業 Electronic Parts & Components 4,642.13 11.63 14,055,038 14.28
電子通路業 Electronic Products Distribution 637.88 1.60 1,700,137 1.73
資訊服務業 Information Service 1,933.03 4.84 2,726,123 2.77
其他電子業 Other Electric Products 2,360.91 5.91 4,750,656 4.83
管理股票 Supervised 3.45 0.01 217,638 0.22
合 計 Total 39,930.36 100.00 98,413,656 100.00
註:本表僅列計櫃檯買賣股票交易系統部分。
Note : Data include trades through GTSM stock trading system only.

51
產業別 Sector
總成交金額(億元)
Total Trading Value(NT$100M)百分比
(%)
總成交股數(千股)
Total Volume(1,000 shares)百分比
(%)
食品工業 Food 14.71 0.04 102,212 0.10
塑膠工業 Plastic 51.19 0.13 248,123 0.25
紡織纖維 Textile 126.93 0.32 496,206 0.50
電機機械 Electrical Machinery 810.58 2.03 2,380,969 2.42
電器電纜 Electrical & Cable 19.89 0.05 75,915 0.08
鋼鐵工業 Iron & Steel 673.13 1.69 2,310,105 2.35
橡膠工業 Rubber 34.84 0.09 149,884 0.15
建材營造 Building Material & Construction 1,185.25 2.97 3,084,123 3.13
航運業 Shipping & Transportation 48.43 0.12 202,427 0.21
觀光事業 Tourism 207.69 0.52 605,156 0.61
金融業 Financial 733.11 1.84 5,424,413 5.51
貿易百貨 Trading & Consumer’s Goods 375.34 0.94 941,663 0.96
其他 Others 1,411.11 3.53 3,975,094 4.04
化學工業 Chemical 460.80 1.15 1,822,949 1.85
生技醫療 Biotechnology & Medical Care 1,965.59 4.92 3,114,687 3.16
油電燃氣業 Gas & Electricity 10.66 0.03 66,432 0.07
半導體業 Semiconductor 8,519.56 21.34 24,214,247 24.60
電腦及週邊設備業 Computer & Peripheral Equipment 5,258.24 13.17 8,097,490 8.23
光電業 Optoelectronics 6,953.55 17.41 12,756,701 12.96
通信網路業 Communications & Internet 1,492.37 3.74 4,895,266 4.97
電子零組件業 Electronic Parts & Components 4,642.13 11.63 14,055,038 14.28
電子通路業 Electronic Products Distribution 637.88 1.60 1,700,137 1.73
資訊服務業 Information Service 1,933.03 4.84 2,726,123 2.77
其他電子業 Other Electric Products 2,360.91 5.91 4,750,656 4.83
管理股票 Supervised 3.45 0.01 217,638 0.22
合 計 Total 39,930.36 100.00 98,413,656 100.00

● 統計資料
52
100年度上櫃股票成交量排行—電腦交易部分Ranking of GTSM-Listed Stocks in 2011 by Trading Volume-Electronic Trading
9
排行
Ranking代號
Code公司名稱
Name of Company
成交量(千股)
Trading Volume(1,000 shares)
占總成交量比(%)
Percentage of Total Volume(%)
1 5346力晶
Powerchip Technology Corporation 5,022,044 5.10%
2 8069元太科技
E INK HOLDINGS INC. 4,338,941 4.41%
3 6008凱基證券
KGI Securities Co. LTD. 3,173,617 3.22%
4 5483中美矽晶
Sino-American Silicon Products Inc. 2,329,882 2.37%
5 6147頎邦科技
CHIPBOND TECHNOLOGY CORPORATION 2,271,251 2.31%
6 5009榮剛材料
GLORIA MATERIAL TECHNOLOGY CORP 1,727,046 1.75%
7 5371中強光電
Coretronic Corporation 1,507,734 1.53%
8 5820日盛金控
JIH SUN FINANCIAL HOLDING CO., LTD 1,467,638 1.49%
9 5347世界先進
Vanguard International Semiconductor Co. 1,312,058 1.33%
10 3264欣銓科技
Ardentec Corporation 1,177,810 1.20%
11 6244茂迪
MOTECH INDUSTRIES INC 1,109,252 1.13%
12 5326漢磊科技
Episil Technologies Inc. 1,047,590 1.06%
13 6182合晶科技
WAFER WORKS CORP. 1,043,001 1.06%
14 1815富喬工業
FULLTECH FIBER GLASS CORP. 983,661 1.00%
15 8121越峰電子
Acme Electronics Corporation 928,277 0.94%

53
排行
Ranking代號
Code公司名稱
Name of Company
成交量(千股)
Trading Volume(1,000 shares)
占總成交量比(%)
Percentage of Total Volume(%)
16 5349先豐通訊
BOARDTEK ELECTRONICS COR. 924,191 0.94%
17 8096擎亞科技
CoAsia Microelectronics Corp. 848,574 0.86%
18 8925偉盟工業
WEI MON INDUSTRY CO.,LTD. 813,060 0.83%
19 3452益通光能
E-TON SOLAR TECH. CO., LTD. 797,276 0.81%
20 6246臺龍電子
Taiwan Thick-Film Ind. Corp 774,326 0.79%
21 5512力麒建設
RICH DEVELOPMENT CO.,LTD. 773,300 0.79%
22 8299群聯電子
Phison Electronics Corp. 757,177 0.77%
23 3265台星科
STATS ChipPAC Taiwan Semiconductor Corp. 728,252 0.74%
24 3211順達科技
Dynapack International Technology Corporation 715,792 0.73%
25 8086宏捷科技
ADVANCED WIRELESS SEMICONDUCTOR COMPANY
700,092 0.71%
26 8942森鉅科技
Xxentria Technology Materials Co.,Ltd. 613,424 0.62%
27 1785光洋科技
Solar Applied Materials Technology Corp. 605,127 0.61%
28 3508位速科技
Ways Technical Corp., LTD 578,776 0.59%
29 5521工信工程
KUNG SING ENGINEERING CORPORATION 572,359 0.58%
30 6121新普科技
SIMPLO TCHNOLOGY CO.,LTD. 564,281 0.57%

● 統計資料
54
100年度上櫃股票成交值排行—電腦交易部分Ranking of GTSM-Listed Stocks in 2011 by Trading Value-Electronic Trading
10
排行
Ranking代號
Code公司名稱
Name of Company
成交金額(億元)
Trading Amount(NT$100M)
占總成交金額比(%)
Percentage of Total Turnover(%)
1 8069元太科技
E INK HOLDINGS INC.2,508.26 6.28%
2 5483中美矽晶
Sino-American Silicon Products Inc.2,160.76 5.41%
3 8299群聯電子
Phison Electronics Corp.1,229.42 3.08%
4 6121新普科技
SIMPLO TCHNOLOGY CO.,LTD.1,144.38 2.87%
5 6244茂迪
MOTECH INDUSTRIES INC1,026.37 2.57%
6 8121越峰電子
Acme Electronics Corporation 875.47 2.19%
7 3211順達科技
Dynapack International Technology Corporation831.21 2.08%
8 6147頎邦科技
CHIPBOND TECHNOLOGY CORPORATION824.44 2.06%
9 5530龍巖
LUNGYEN LIFE SERVICE CORPORATION562.91 1.41%
10 3691碩禾電子
GIGASOLAR MATERIALS CORPORATION553.47 1.39%
11 3508位速科技
Ways Technical Corp., LTD552.50 1.38%
12 4105東洋藥品
TTY BIOPHARM COMPANY LIMITED548.34 1.37%
13 5371中強光電
Coretronic Corporation526.58 1.32%
14 5009榮剛材料
GLORIA MATERIAL TECHNOLOGY CORP517.52 1.30%
15 3615安可光電
AimCore Technology Co., Ltd490.65 1.23%

55
排行
Ranking代號
Code公司名稱
Name of Company
成交金額(億元)
Trading Amount(NT$100M)
占總成交金額比(%)
Percentage of Total Turnover(%)
16 6223旺矽科技
MPI CORPORATION464.46 1.16%
17 8096擎亞國際科技
CoAsia Microelectronics Corp.460.66 1.15%
18 6182合晶科技
WAFER WORKS CORP.458.22 1.15%
19 6008凱基證券
KGI Securities Co. LTD.455.61 1.14%
20 3556禾瑞亞
eGalax_eMPIA Technology Inc.425.59 1.07%
21 8287英格爾科
ENG ELECTRIC CO., LTD.421.03 1.05%
22 6261久元電子
YOUNGTEK ELECTRONICS CORPORATION412.78 1.03%
23 3630新鉅科
Newmax Technology Co., Ltd.386.95 0.97%
24 1785光洋科技
Solar Applied Materials Technology Corp.386.59 0.97%
25 3227原相科技
PixArt Imaging Inc.339.98 0.85%
26 8942森鉅科技
Xxentria Technology Materials Co.,Ltd320.27 0.80%
27 3264欣銓科技
Ardentec Corporation298.40 0.75%
28 1815富喬工業
FULLTECH FIBER GLASS CORP.280.71 0.70%
29 8044網路家庭
PChome online Inc.280.56 0.70%
30 8086宏捷科技
ADVANCED WIRELESS SEMICONDUCTOR COMPANY
265.50 0.66%

● 統計資料
56
100年度上櫃股票漲幅排行Ranking of GTSM-Listed Stocks in 2011 by Percentage of Price Increase
11
排行
Rank代號 Code
公司名稱 Name of Company
100年底收市價或最後均價(元) 2011 Closing or Final Average
(NT$)
99年底收市價或最後均價(元) 2010 Closing or Final Average
(NT$)
漲幅(%) Change(%)
備註 Remark
1 5206 坤悅開發 Kunyue Development Co., Ltd. 15.80 1.48 967.57% 減資 Capital Decreased
2 6107 華美電子 SINO-AMERICAN ELECTRONIC CO., LTD 66.40 8.05 724.84%
3 4801 高盛電子 Gold Sun Technology Co., Ltd. 33.65 5.30 534.91% 減資 Capital Decreased
4 6242 亨豐科技 BAFO TECHNOLOGIES CORP. 14.00 3.49 301.15% 減資 Capital Decreased
5 3126 信億科技 ACARD TECHNOLOGY CORP. 44.20 13.00 240.00%
6 6240 松崗資產 Sung Gang Asset Management Corp.Limited 7.21 2.19 229.22% 減資 Capital Decreased
7 6276 名鐘科技 MINGJONG TECHNOLOGIES CO, LTD. 19.20 6.34 202.84%
8 5398 力瑋實業 INALWAYS CORPORATION 24.00 10.85 121.20%
9 4966 譜瑞科技 Parade Technologies, Ltd. 391.00 179.00 118.44% 新上櫃 New Listing
10 5432 達威光電 DATA INTERNATIONAL CO., LTD 11.60 5.91 96.28% 減資 Capital Decreased
11 6236 凌越科技 Topro Technology Inc. 18.80 9.63 95.22% 減資 Capital Decreased
12 2381 華宇光能 Arima Photovoltaic & Optical Corp. 3.16 1.71 84.80% 減資 Capital Decreased
13 3176 基亞生物科技 Medigen Biotechnology Corporation 39.60 23.30 69.96% 新上櫃 New Listing
14 4924 欣厚科技 HTM INTERNATIONAL HOLDING LTD. 46.65 28.50 63.68% 新上櫃 New Listing
15 2061 風青實業 FENG CHING METAL CORPORATION 28.05 18.00 55.83%
16 4702 中美聯合實業 ALLIED INDUSTRIAL CORP.,LTD. 20.85 13.60 53.31%
17 3379 彬台科技 TAIWAN BENEFIT COMPANY 59.30 39.50 50.13% 新上櫃 New Listing
18 6195 詩肯 SCAN-D CORPORATION 45.60 30.60 49.02%
19 3252 海灣國際科技 Baytek International Technology Co.,Ltd 21.25 14.40 47.57% 減資 Capital Decreased
20 4703 金美克能 ME KE LONG CHEMICAL INDUSTRIES CO.,LTD. 11.80 8.02 47.13%
21 6171 台灣亞銳士 Taiwan Aries Co.,Ltd. 14.95 10.20 46.57%
22 5011 久陽精密 OFCO Industrial Corporation 28.80 19.75 45.82%
23 3615 安可光電 AimCore Technology Co., Ltd 72.50 49.80 45.58%
24 3632 研勤科技 PAPAGO INC. 61.20 43.70 40.05% 新上櫃 New Listing
25 1569 濱川企業 Bin Chuan Enterprise Co., Ltd. 54.00 39.15 37.93%

57
排行
Rank代號 Code
公司名稱 Name of Company
100年底收市價或最後均價(元) 2011 Closing or Final Average
(NT$)
99年底收市價或最後均價(元) 2010 Closing or Final Average
(NT$)
漲幅(%) Change(%)
備註 Remark
1 5206 坤悅開發 Kunyue Development Co., Ltd. 15.80 1.48 967.57% 減資 Capital Decreased
2 6107 華美電子 SINO-AMERICAN ELECTRONIC CO., LTD 66.40 8.05 724.84%
3 4801 高盛電子 Gold Sun Technology Co., Ltd. 33.65 5.30 534.91% 減資 Capital Decreased
4 6242 亨豐科技 BAFO TECHNOLOGIES CORP. 14.00 3.49 301.15% 減資 Capital Decreased
5 3126 信億科技 ACARD TECHNOLOGY CORP. 44.20 13.00 240.00%
6 6240 松崗資產 Sung Gang Asset Management Corp.Limited 7.21 2.19 229.22% 減資 Capital Decreased
7 6276 名鐘科技 MINGJONG TECHNOLOGIES CO, LTD. 19.20 6.34 202.84%
8 5398 力瑋實業 INALWAYS CORPORATION 24.00 10.85 121.20%
9 4966 譜瑞科技 Parade Technologies, Ltd. 391.00 179.00 118.44% 新上櫃 New Listing
10 5432 達威光電 DATA INTERNATIONAL CO., LTD 11.60 5.91 96.28% 減資 Capital Decreased
11 6236 凌越科技 Topro Technology Inc. 18.80 9.63 95.22% 減資 Capital Decreased
12 2381 華宇光能 Arima Photovoltaic & Optical Corp. 3.16 1.71 84.80% 減資 Capital Decreased
13 3176 基亞生物科技 Medigen Biotechnology Corporation 39.60 23.30 69.96% 新上櫃 New Listing
14 4924 欣厚科技 HTM INTERNATIONAL HOLDING LTD. 46.65 28.50 63.68% 新上櫃 New Listing
15 2061 風青實業 FENG CHING METAL CORPORATION 28.05 18.00 55.83%
16 4702 中美聯合實業 ALLIED INDUSTRIAL CORP.,LTD. 20.85 13.60 53.31%
17 3379 彬台科技 TAIWAN BENEFIT COMPANY 59.30 39.50 50.13% 新上櫃 New Listing
18 6195 詩肯 SCAN-D CORPORATION 45.60 30.60 49.02%
19 3252 海灣國際科技 Baytek International Technology Co.,Ltd 21.25 14.40 47.57% 減資 Capital Decreased
20 4703 金美克能 ME KE LONG CHEMICAL INDUSTRIES CO.,LTD. 11.80 8.02 47.13%
21 6171 台灣亞銳士 Taiwan Aries Co.,Ltd. 14.95 10.20 46.57%
22 5011 久陽精密 OFCO Industrial Corporation 28.80 19.75 45.82%
23 3615 安可光電 AimCore Technology Co., Ltd 72.50 49.80 45.58%
24 3632 研勤科技 PAPAGO INC. 61.20 43.70 40.05% 新上櫃 New Listing
25 1569 濱川企業 Bin Chuan Enterprise Co., Ltd. 54.00 39.15 37.93%

● 統計資料
58
100年度上櫃股票跌幅排行Ranking of GTSM-Listed Stocks in 2011 by Percentage of Price Decrease
12
排行
Rank代號 Code
公司名稱 Name of Stock
100年底收市價或最後均價(元) 2011 Closing or Final Average(NT$)
99年底收市價或最後均價(元) 2010 Closing or Final Average(NT$)
漲幅(%)
Change(%)備註
Remark
1 4609 唐鋒實業 AIRLUX ELEXTRICAL CO., LTD. 15.10 135.00 -88.81%
2 5346 力晶科技 Powerchip Technology Corporation 0.86 5.80 -85.17%
3 8077 冠華科技 Applied Vacuum Coating Technologies Co., Ltd. 2.52 10.45 -75.89%
4 3628 盈正豫順電子 ABLEREX ELECTRONICS CO., LTD. 60.80 251.00 -75.78%
5 3630 新鉅科技 Newmax Technology Co., Ltd. 40.50 162.50 -75.08%
6 8266 中日新科技 STAR WORLD TECHNOLOGY CORPORATION 3.99 15.90 -74.91%
7 3546 宇峻奧汀 Userjoy Technology Co.,Ltd. 64.50 252.50 -74.46%
8 3553 力積 Zentel Electronic Corporation 16.60 64.80 -74.38%
9 3310 佳穎精密 CHIALIN Precision Industrial Co., Ltd. 7.37 28.20 -73.87%
10 5455 訊利電業 Signality System Engineering Co.,Ltd 4.15 15.75 -73.65%
11 3512 能緹精密工業 NENG TYI PRECISION INDUSTRIES CO., LTD. 8.03 30.40 -73.59%
12 6151 晉倫科技 GINAR TECHNOLOGY CO.,LTD. 21.90 82.10 -73.33%
13 3452 益通光能 E-TON SOLAR TECH. CO., LTD 12.80 47.80 -73.22%
14 4944 兆遠科技 CRYSTALWISE TECHNOLOGY INC. 19.95 72.50 -72.48%新上櫃
New Listing
15 6287 元隆電子 Advanced Microelectronic Products Inc. 2.87 10.10 -71.58%
16 3083 中華網龍 CHINESE GAMER INTERNATIONAL CORPORATION 72.40 253.00 -71.38%
17 3268 海德威電子 Higher Way Electronic Co., Ltd. 8.17 27.80 -70.61%
18 8082 眾星 ASTRAL EPOCH INTERNATIONAL CORPORATION 5.98 19.95 -70.03%
19 3511 矽瑪科技 SIMULA TECHNOLOGY, INC. 21.15 68.60 -69.17%
20 5364 浩騰科技 WonTen technology Co.,Ltd. 0.88 2.82 -68.79%
21 3232 昱捷 Sentronic International Corp. 7.45 22.85 -67.40%
22 5345 天揚精密陶瓷 TEAM YOUNG ADVANCED CERAMICS.CO.LTD. 3.53 10.65 -66.85%
23 6134 萬旭電業 WanShih Electronic Co., Ltd. 12.10 36.40 -66.76%
24 6173 信昌電子陶瓷 PROSPERITY DIELECTRICS CO., LTD. 10.40 31.20 -66.67%
25 3078 僑威科技 CHANNEL WELL TECHNOLOGY CO.,LTD 10.30 30.85 -66.61%

59
排行
Rank代號 Code
公司名稱 Name of Stock
100年底收市價或最後均價(元) 2011 Closing or Final Average(NT$)
99年底收市價或最後均價(元) 2010 Closing or Final Average(NT$)
漲幅(%)
Change(%)備註
Remark
1 4609 唐鋒實業 AIRLUX ELEXTRICAL CO., LTD. 15.10 135.00 -88.81%
2 5346 力晶科技 Powerchip Technology Corporation 0.86 5.80 -85.17%
3 8077 冠華科技 Applied Vacuum Coating Technologies Co., Ltd. 2.52 10.45 -75.89%
4 3628 盈正豫順電子 ABLEREX ELECTRONICS CO., LTD. 60.80 251.00 -75.78%
5 3630 新鉅科技 Newmax Technology Co., Ltd. 40.50 162.50 -75.08%
6 8266 中日新科技 STAR WORLD TECHNOLOGY CORPORATION 3.99 15.90 -74.91%
7 3546 宇峻奧汀 Userjoy Technology Co.,Ltd. 64.50 252.50 -74.46%
8 3553 力積 Zentel Electronic Corporation 16.60 64.80 -74.38%
9 3310 佳穎精密 CHIALIN Precision Industrial Co., Ltd. 7.37 28.20 -73.87%
10 5455 訊利電業 Signality System Engineering Co.,Ltd 4.15 15.75 -73.65%
11 3512 能緹精密工業 NENG TYI PRECISION INDUSTRIES CO., LTD. 8.03 30.40 -73.59%
12 6151 晉倫科技 GINAR TECHNOLOGY CO.,LTD. 21.90 82.10 -73.33%
13 3452 益通光能 E-TON SOLAR TECH. CO., LTD 12.80 47.80 -73.22%
14 4944 兆遠科技 CRYSTALWISE TECHNOLOGY INC. 19.95 72.50 -72.48%新上櫃
New Listing
15 6287 元隆電子 Advanced Microelectronic Products Inc. 2.87 10.10 -71.58%
16 3083 中華網龍 CHINESE GAMER INTERNATIONAL CORPORATION 72.40 253.00 -71.38%
17 3268 海德威電子 Higher Way Electronic Co., Ltd. 8.17 27.80 -70.61%
18 8082 眾星 ASTRAL EPOCH INTERNATIONAL CORPORATION 5.98 19.95 -70.03%
19 3511 矽瑪科技 SIMULA TECHNOLOGY, INC. 21.15 68.60 -69.17%
20 5364 浩騰科技 WonTen technology Co.,Ltd. 0.88 2.82 -68.79%
21 3232 昱捷 Sentronic International Corp. 7.45 22.85 -67.40%
22 5345 天揚精密陶瓷 TEAM YOUNG ADVANCED CERAMICS.CO.LTD. 3.53 10.65 -66.85%
23 6134 萬旭電業 WanShih Electronic Co., Ltd. 12.10 36.40 -66.76%
24 6173 信昌電子陶瓷 PROSPERITY DIELECTRICS CO., LTD. 10.40 31.20 -66.67%
25 3078 僑威科技 CHANNEL WELL TECHNOLOGY CO.,LTD 10.30 30.85 -66.61%

● 統計資料
60
100年度上櫃股票波幅排行Ranking of GTSM-Listed Stocks in 2011 by Fluctuation of Share Price
13
排行
Rank代號
Code公司名稱
Name of Company
收市價(元)
Closing(NT$)
最高價
High最低價
Low
波幅
Change (%)
1 6240松崗資產
Sung Gang Asset Management Corp.Limited
60.10 2.16 2,682.41
2 4801高盛電子
Gold Sun Technology Co., Ltd.59.70 2.78 2,047.48
3 5206坤悅開發
Kunyue Development Co., Ltd.19.65 1.34 1,366.42
4 6107華美電子
SINO-AMERICAN ELECTRONIC CO., LTD84.50 8.00 956.25
5 6242亨豐科技
BAFO TECHNOLOGIES CORP.16.70 1.69 888.17
6 4609唐鋒實業
AIRLUX ELEXTRICAL CO., LTD.117.50 12.90 810.85
7 5346力晶科技
Powerchip Technology Corporation6.99 0.78 796.15
8 4415美嘉生電
Mega Biotech & Electronics Co., Ltd.63.30 9.00 603.33
9 5387茂德科技
ProMOS Technologies Inc.2.13 0.34 526.47
10 3069台灣金屬礦業(寶晟)
Taiwan Metal Mining Corp51.50 8.30 520.48
11 5364浩騰科技
WonTen technology Co.,Ltd.4.24 0.69 514.49
12 8266中日新科技
STAR WORLD TECHNOLOGY CORPORATION
20.15 3.42 489.18
13 3628盈正豫順電子
ABLEREX ELECTRONICS CO., LTD.282.00 50.60 457.31
14 3452益通光能
E-TON SOLAR TECH. CO., LTD52.00 9.35 456.15
15 3546宇峻奧汀
Userjoy Technology Co.,Ltd.262.50 48.80 437.91
16 5205漢康科技
FAST TECHNOLOGIES INC.81.00 15.70 415.92

61
排行
Rank代號
Code公司名稱
Name of Company
收市價(元)
Closing(NT$)
最高價
High最低價
Low
波幅
Change (%)
17 3553力積電子
Zentel Electronic Corporation73.50 14.30 413.99
18 5432達威光電
DATA INTERNATIONAL CO., LTD20.00 3.98 402.51
19 6236凌越科技
Topro Technology Inc.21.00 4.20 400.00
20 3325旭品科技
Casing Macron Technology Co., Ltd.61.70 12.65 387.75
21 8082眾星國際
ASTRAL EPOCH INTERNATIONAL CORPORATION
29.00 5.98 384.95
22 3310佳穎精密
CHIALIN Precision Industrial Co., Ltd.29.85 6.19 382.23
23 4944兆遠科技
CRYSTALWISE TECHNOLOGY INC.72.50 15.30 373.86
24 5301祥裕電子
CADAC ELECTRONIC CO., LTD.7.09 1.52 366.45
25 3512能緹精密工業
NENG TYI PRECISION INDUSTRIES CO., LTD.
32.80 7.04 365.91
26 5455訊利電業
Signality System Engineering Co.,Ltd16.10 3.47 363.98
27 8121越峰電子
Acme Electronics Corporation165.00 35.95 358.97
28 8077冠華科技
Applied Vacuum Coating Technologies Co., Ltd.
10.50 2.29 358.52
29 3630新鉅科技
Newmax Technology Co., Ltd.164.50 36.85 346.40
30 3562頂晶科技
TYNSOLAR CORPORATION41.50 9.30 346.24

● 統計資料
62
100年底上櫃公司外資持股比例排行Ranking of GTSM-Listed Stocks by Percentage of Shares Held by Foreign Investors at End of 2011
14
排行
Rank代號 Code
公司名稱 Name of Company
外資持有股數(千股)
Shares Held by Foreign Investors(1,000 shares)
外資持有比率(%) of Foreign Shareholding
1 8426紅木集團
Redwood Group Ltd34,339 85.84
2 1258其祥生物科技
Kee Song Bio-Technology Holdings Limited28,981 85.23
3 8418捷必勝控股
JP Nelson Holdings46,442 83.75
4 6211福登精密
Full Rise Electronic Co.,Ltd.34,204 82.14
5 4154康樂生技
Kino Biotech Co., Ltd17,868 81.96
6 4966譜瑞科技
Parade Technologies, Ltd.40,136 78.45
7 3664安瑞科技
Array Inc.49,533 71.48
8 5820日盛金控
JIH SUN FINANCIAL HOLDING CO., LTD1,794,107 70.27
9 3093台灣港建
TAIWAN KONG KING CO.,LTD24,552 67.65
10 3087翔準先進光罩
Photronics Semiconductor Mask Corp.164,839 62.58
11 4912聯德控股
Lemtech Holdings Co., Limited15,109 54.34
12 3265台灣星科金朋半導體
STATS ChipPAC Taiwan Semiconductor Corp.
73,404 53.87
13 2924開曼東凌
Cayman Tung Ling co., Limited16,022 52.99

63
排行
Rank代號 Code
公司名稱 Name of Company
外資持有股數(千股)
Shares Held by Foreign Investors(1,000 shares)
外資持有比率(%) of Foreign Shareholding
14 4946紅心辣椒娛樂科技
Cayenne Entertainment Technology Co.,Ltd.10,786 52.82
15 6609台灣瀧澤科技
TAIWAN TAKISAWA TECHNOLOGY CO., LTD.
35,753 51.84
16 4702中美聯合實業
ALLIED INDUSTRIAL CORP.,LTD.39,469 51.65
17 5903全家便利商店
Taiwan FamilyMart.Co.,Ltd.112,784 50.52
18 8182加高電子
HARMONY ELECTRONICS CORP54,053 50.49
19 6121新普科技
SIMPLO TCHNOLOGY CO.,LTD.138,157 49.29
20 4927泰鼎國際
Apex International Co., Ltd.45,723 49.19
註:以上外資含外國機構及境內外僑外人,未納入投審會核可之外資。 Note:Data also include shares held by foreign institutional investors and individuals without approval of Investment Commission.

● 統計資料
64
100年底上櫃公司外資持股股數排行Ranking of GTSM-Listed Companies by Number of Shares Held by Foreign Investors at End of 2011
15
排行
Rank代號 Code
公司名稱 Name of Company
外資持有股數(千股)
Shares Held by Foreign Investors(1,000 shares)
外資持有比率(%) of Foreign Shareholding
1 5820日盛金融控股
JIH SUN FINANCIAL HOLDING CO., LTD1,794,107 70.27
2 6008凱基證券
KGI Securities Co. LTD.1,140,105 34.86
3 5346力晶科技
Powerchip Technology Corporation554,589 10.00
4 8069元太科技工業
E INK HOLDINGS INC.425,213 39.41
5 5387茂德科技
ProMOS Technologies Inc.244,674 9.61
6 5347世界先進積體電路
Vanguard International Semiconductor Co.194,452 11.79
7 5371中強光電
Coretronic Corporation183,754 25.37
8 3087翔準先進光罩
Photronics Semiconductor Mask Corp.164,839 62.58
9 6121新普科技
SIMPLO TCHNOLOGY CO.,LTD.138,157 49.29
10 5903全家便利商店
Taiwan FamilyMart.Co.,Ltd.112,784 50.52
11 6147頎邦科技
CHIPBOND TECHNOLOGY CORPORATION101,405 17.07
12 8299群聯電子
Phison Electronics Corp.87,098 48.77
13 3265台灣星科金朋半導體
STATS ChipPAC Taiwan Semiconductor Corp.
73,404 53.87

65
排行
Rank代號 Code
公司名稱 Name of Company
外資持有股數(千股)
Shares Held by Foreign Investors(1,000 shares)
外資持有比率(%) of Foreign Shareholding
14 5483中美矽晶
Sino-American Silicon Products Inc.66,394 14.98
15 6124業強科技
YEH-CHIANG TECHNOLOGY CORP.60,943 33.39
16 5304鼎創達
DBTEL Incorporated58,847 31.64
17 5530龍巖
LUNGYEN LIFE SERVICE CORPORATION55,153 13.82
18 8182加高電子
HARMONY ELECTRONICS CORP54,053 50.49
19 6244茂迪
MOTECH INDUSTRIES INC53,230 12.16
20 3339泰谷光電
TEKCORE CO., LTD50,456 18.32
註:以上外資含外國機構及境內外僑外人,未納入投審會核可之外資。
Note:Data also include shares held by foreign institutional investors and individuals without approval of Investment Commission.

● 統計資料
66
100年度上櫃股票主要機構投資人交易概況表Trading Records of Major Institutional Investors on GTSM in 2011
16
年/月
Yr / Mo
月成交
總金額 Monthly Trading Amount
外資 Foreign Investors
投信 Securities Investment Trust Funds
自營商 Dealer
合計 Total
買進
Buy賣出
Sell合計
Total比率 (%)
買進
Buy賣出
Sell合計
Total比率 (%)
買進
Buy賣出
Sell合計
Total比率 (%)
買進
Buy賣出
Sell合計
Total比率 (%)
2011 39,930.36 2,341.14 2,215.69 4,556.83 5.71 1,065.05 1,085.05 2,150.10 2.69 934.27 1,000.63 1,934.90 2.42 4,340.46 4,301.37 8,641.83 10.82
1 4,044.89 174.53 164.97 339.50 4.20 156.83 92.59 249.42 3.08 121.05 111.83 232.88 2.88 452.41 369.39 821.80 10.16
2 3,027.88 163.87 149.77 313.64 5.18 80.87 71.50 152.37 2.52 79.91 88.49 168.40 2.78 324.65 309.76 634.41 10.48
3 5,237.01 205.47 237.51 442.98 4.23 126.50 165.33 291.83 2.79 125.83 131.87 257.70 2.46 457.80 534.71 992.51 9.48
4 3,753.01 202.94 163.10 366.04 4.88 75.05 103.03 178.08 2.35 98.11 101.27 199.38 2.63 376.10 367.40 743.50 9.91
5 4,251.29 243.45 194.17 437.62 5.15 107.93 125.74 233.66 2.75 109.84 113.07 222.91 2.62 461.21 432.98 894.19 10.52
6 3,703.41 197.17 226.79 423.97 5.72 92.84 98.66 191.50 2.59 94.39 103.99 198.37 2.68 384.40 429.44 813.84 10.99
7 3,536.00 183.04 196.96 380.00 5.37 93.77 88.76 182.53 2.58 88.52 92.30 180.82 2.56 365.33 378.03 743.36 10.51
8 3,448.67 234.44 245.61 480.05 6.96 80.24 102.07 182.32 2.64 65.38 89.19 154.57 2.24 380.06 436.87 816.93 11.84
9 2,479.12 185.06 171.03 356.09 7.18 52.96 60.01 112.98 2.28 41.13 51.79 92.92 1.87 279.16 282.83 561.99 11.33
10 2,233.29 192.78 162.15 354.92 7.95 57.66 55.46 113.12 2.53 37.70 38.76 76.46 1.71 288.13 256.36 544.50 12.19
11 2,474.40 208.91 187.91 396.82 8.02 83.70 64.23 147.93 2.99 48.55 54.27 102.82 2.08 341.15 306.42 647.57 13.09
12 1,741.40 149.48 115.72 265.20 7.61 56.70 57.67 114.38 3.28 23.86 23.80 47.65 1.37 230.04 197.18 427.23 12.27
註:本表不含議價及標購。
Note:Negotiated and auction trades not included.

67
年/月
Yr / Mo
月成交
總金額 Monthly Trading Amount
外資 Foreign Investors
投信 Securities Investment Trust Funds
自營商 Dealer
合計 Total
買進
Buy賣出
Sell合計
Total比率 (%)
買進
Buy賣出
Sell合計
Total比率 (%)
買進
Buy賣出
Sell合計
Total比率 (%)
買進
Buy賣出
Sell合計
Total比率 (%)
2011 39,930.36 2,341.14 2,215.69 4,556.83 5.71 1,065.05 1,085.05 2,150.10 2.69 934.27 1,000.63 1,934.90 2.42 4,340.46 4,301.37 8,641.83 10.82
1 4,044.89 174.53 164.97 339.50 4.20 156.83 92.59 249.42 3.08 121.05 111.83 232.88 2.88 452.41 369.39 821.80 10.16
2 3,027.88 163.87 149.77 313.64 5.18 80.87 71.50 152.37 2.52 79.91 88.49 168.40 2.78 324.65 309.76 634.41 10.48
3 5,237.01 205.47 237.51 442.98 4.23 126.50 165.33 291.83 2.79 125.83 131.87 257.70 2.46 457.80 534.71 992.51 9.48
4 3,753.01 202.94 163.10 366.04 4.88 75.05 103.03 178.08 2.35 98.11 101.27 199.38 2.63 376.10 367.40 743.50 9.91
5 4,251.29 243.45 194.17 437.62 5.15 107.93 125.74 233.66 2.75 109.84 113.07 222.91 2.62 461.21 432.98 894.19 10.52
6 3,703.41 197.17 226.79 423.97 5.72 92.84 98.66 191.50 2.59 94.39 103.99 198.37 2.68 384.40 429.44 813.84 10.99
7 3,536.00 183.04 196.96 380.00 5.37 93.77 88.76 182.53 2.58 88.52 92.30 180.82 2.56 365.33 378.03 743.36 10.51
8 3,448.67 234.44 245.61 480.05 6.96 80.24 102.07 182.32 2.64 65.38 89.19 154.57 2.24 380.06 436.87 816.93 11.84
9 2,479.12 185.06 171.03 356.09 7.18 52.96 60.01 112.98 2.28 41.13 51.79 92.92 1.87 279.16 282.83 561.99 11.33
10 2,233.29 192.78 162.15 354.92 7.95 57.66 55.46 113.12 2.53 37.70 38.76 76.46 1.71 288.13 256.36 544.50 12.19
11 2,474.40 208.91 187.91 396.82 8.02 83.70 64.23 147.93 2.99 48.55 54.27 102.82 2.08 341.15 306.42 647.57 13.09
12 1,741.40 149.48 115.72 265.20 7.61 56.70 57.67 114.38 3.28 23.86 23.80 47.65 1.37 230.04 197.18 427.23 12.27
註:本表不含議價及標購。
Note:Negotiated and auction trades not included.
單位:億元
Unit:NT$100Millions

● 統計資料
68
歷年外資開戶及持股總數統計表Statistics of Accounts Opened and Shares Owned by Foreign Investors
17
年/月
Yr / Mo
外資持股總數(千股)
Total Shares Held by Foreign Investors
外資持股比率(%)
Percentage of Foreign Shareholding
外資開戶數(戶)
Accounts Opened by Foreign Investors
End of 1995 2,907 0.02 11
End of 1996 102,555 0.39 3,031
End of 1997 133,991 0.43 6,331
End of 1998 237,783 0.62 9,115
End of 1999 804,556 1.57 11,079
End of 2000 967,685 1.43 15,670
End of 2001 1,165,777 1.71 19,845
End of 2002 922,211 1.50 21,945
End of 2003 5,337,101 8.82 25,568
End of 2004 4,066,859 6.89 33,672
End of 2005 5,576,561 8.68 45,607
End of 2006 6,877,291 9.36 60,462
End of 2007 7,032,071 9.55 75,762
End of 2008 5,933,125 8.38 86,962

69
年/月
Yr / Mo
外資持股總數(千股)
Total Shares Held by Foreign Investors
外資持股比率(%)
Percentage of Foreign Shareholding
外資開戶數(戶)
Accounts Opened by Foreign Investors
End of 2009 9,107,646 11.94 95,463
End of 2010 7,302,662 10.31 105,671
2011 / 01 7,125,808 10.36 134,400
2011 / 02 7,147,215 10.35 135,257
2011 / 03 7,187,355 10.37 136,115
2011 / 04 7,406,566 10.64 137,653
2011 / 05 7,526,908 10.62 138,485
2011 / 06 7,624,005 10.75 139,640
2011 / 07 7,624,469 10.72 140,316
2011 / 08 7,615,315 10.59 141,512
2011 / 09 7,720,656 10.65 142,504
2011 / 10 8,039,191 11.05 143,809
2011 / 11 7,897,626 10.86 144,889
2011 / 12 7,836,928 10.63 147,849

● 統計資料
70
100年度上櫃股票產業別加權股價指數分析表 Analysis of Sector Weighted Price Index of GTSM-Listed Stocks in 2011
18
指數種類
Index
基期
Base(=100)
1 月Jan.
2 月Feb.
3 月Mar.
4 月Apr.
5 月May
6 月Jun.
平均
Ave最高
High最低
Low平均
Ave最高
High最低
Low平均
Ave最高
High最低
Low平均
Ave最高
High最低
Low平均
Ave最高
High最低
Low平均
Ave最高
High最低
Low
發行量加權 Volume-Weighted
841101 145.26 146.74 141.56 142.97 147.58 139.05 139.87 146.23 130.61 140.45 142.96 136.65 137.82 140.09 133.52 136.02 141.24 128.75
電子類
Electronics850601 201.41 204.18 195.07 198.79 205.58 192.73 194.50 205.37 180.91 192.15 197.43 186.17 186.15 190.61 180.03 183.62 192.41 172.52
紡織類
Textile870601 117.69 121.02 107.95 112.20 118.71 107.55 109.18 112.65 101.63 119.31 127.40 110.68 122.16 127.18 118.46 114.25 122.89 108.45
機械類
Machinery870601 106.78 111.04 105.02 104.03 106.36 100.88 105.18 107.59 99.58 108.89 112.93 105.64 109.15 112.68 104.42 106.36 109.73 102.36
鋼鐵類
Iron & Steel861103 90.60 93.99 88.64 94.39 97.03 91.55 96.30 99.22 91.41 98.50 101.10 96.12 105.02 108.70 100.07 105.09 108.68 102.77
營建類
Construction870601 134.07 139.20 127.25 127.49 135.23 120.05 113.77 122.60 105.81 117.74 121.47 113.88 118.45 124.67 113.16 132.74 139.62 124.36
航運類
Shipping870601 61.78 64.73 60.88 59.79 61.66 57.95 58.70 60.72 54.91 61.22 62.56 59.48 59.80 60.84 58.51 59.08 60.57 57.42
觀光類
Tourism900601 160.65 165.93 156.11 149.49 162.08 144.23 141.96 149.94 126.30 150.85 156.12 141.19 159.77 169.51 150.22 178.96 188.49 169.34
化工類
Chemicals870601 92.83 96.88 87.21 93.18 95.78 90.14 90.76 94.32 83.20 93.13 95.56 89.18 86.43 89.78 81.48 82.57 84.99 78.48
生技醫療
Biotechnology & Medical Care960702 156.21 160.49 152.98 154.71 160.63 149.78 154.14 164.13 141.85 161.67 171.05 152.89 164.64 171.68 156.48 152.45 159.70 143.39
半導體業
Semiconductor960702 41.42 43.19 38.57 41.96 43.79 40.25 39.72 42.49 36.98 38.23 40.02 36.40 36.34 37.49 34.69 34.81 37.26 32.33
電腦及週邊設備
Computer & Peripheral Equipment
960702 75.84 77.03 73.91 73.41 77.25 71.23 72.24 77.28 67.55 71.39 72.91 69.73 72.89 76.71 69.80 75.47 78.60 70.94
光電業
Optoelectronics960702 60.33 61.49 58.98 61.14 63.81 58.05 60.15 63.73 55.32 59.66 61.70 57.04 55.82 58.57 53.19 54.39 57.02 51.34
通信網路業
Communications & Internet960702 61.30 62.64 60.28 59.79 61.03 58.20 60.81 63.98 55.10 62.19 63.63 60.61 59.58 61.23 57.49 59.28 62.57 55.18
電子零組件業
Elec. Parts & Components960702 90.67 91.99 87.94 90.26 92.05 87.58 89.47 94.42 82.36 87.63 90.99 84.20 83.62 85.03 80.68 81.24 85.79 75.68
電子通路業
Elec. Products Distribution960702 93.14 95.88 92.26 92.84 95.73 89.72 92.25 98.42 83.78 93.16 95.40 90.50 91.86 94.60 89.25 90.53 95.72 85.23
資訊服務業
Information Service960702 130.85 137.77 128.16 116.45 129.63 106.96 113.73 121.71 105.76 116.08 118.66 113.38 119.18 127.19 109.76 122.85 131.14 115.54

71
指數種類
Index
基期
Base(=100)
1 月Jan.
2 月Feb.
3 月Mar.
4 月Apr.
5 月May
6 月Jun.
平均
Ave最高
High最低
Low平均
Ave最高
High最低
Low平均
Ave最高
High最低
Low平均
Ave最高
High最低
Low平均
Ave最高
High最低
Low平均
Ave最高
High最低
Low
發行量加權 Volume-Weighted
841101 145.26 146.74 141.56 142.97 147.58 139.05 139.87 146.23 130.61 140.45 142.96 136.65 137.82 140.09 133.52 136.02 141.24 128.75
電子類
Electronics850601 201.41 204.18 195.07 198.79 205.58 192.73 194.50 205.37 180.91 192.15 197.43 186.17 186.15 190.61 180.03 183.62 192.41 172.52
紡織類
Textile870601 117.69 121.02 107.95 112.20 118.71 107.55 109.18 112.65 101.63 119.31 127.40 110.68 122.16 127.18 118.46 114.25 122.89 108.45
機械類
Machinery870601 106.78 111.04 105.02 104.03 106.36 100.88 105.18 107.59 99.58 108.89 112.93 105.64 109.15 112.68 104.42 106.36 109.73 102.36
鋼鐵類
Iron & Steel861103 90.60 93.99 88.64 94.39 97.03 91.55 96.30 99.22 91.41 98.50 101.10 96.12 105.02 108.70 100.07 105.09 108.68 102.77
營建類
Construction870601 134.07 139.20 127.25 127.49 135.23 120.05 113.77 122.60 105.81 117.74 121.47 113.88 118.45 124.67 113.16 132.74 139.62 124.36
航運類
Shipping870601 61.78 64.73 60.88 59.79 61.66 57.95 58.70 60.72 54.91 61.22 62.56 59.48 59.80 60.84 58.51 59.08 60.57 57.42
觀光類
Tourism900601 160.65 165.93 156.11 149.49 162.08 144.23 141.96 149.94 126.30 150.85 156.12 141.19 159.77 169.51 150.22 178.96 188.49 169.34
化工類
Chemicals870601 92.83 96.88 87.21 93.18 95.78 90.14 90.76 94.32 83.20 93.13 95.56 89.18 86.43 89.78 81.48 82.57 84.99 78.48
生技醫療
Biotechnology & Medical Care960702 156.21 160.49 152.98 154.71 160.63 149.78 154.14 164.13 141.85 161.67 171.05 152.89 164.64 171.68 156.48 152.45 159.70 143.39
半導體業
Semiconductor960702 41.42 43.19 38.57 41.96 43.79 40.25 39.72 42.49 36.98 38.23 40.02 36.40 36.34 37.49 34.69 34.81 37.26 32.33
電腦及週邊設備
Computer & Peripheral Equipment
960702 75.84 77.03 73.91 73.41 77.25 71.23 72.24 77.28 67.55 71.39 72.91 69.73 72.89 76.71 69.80 75.47 78.60 70.94
光電業
Optoelectronics960702 60.33 61.49 58.98 61.14 63.81 58.05 60.15 63.73 55.32 59.66 61.70 57.04 55.82 58.57 53.19 54.39 57.02 51.34
通信網路業
Communications & Internet960702 61.30 62.64 60.28 59.79 61.03 58.20 60.81 63.98 55.10 62.19 63.63 60.61 59.58 61.23 57.49 59.28 62.57 55.18
電子零組件業
Elec. Parts & Components960702 90.67 91.99 87.94 90.26 92.05 87.58 89.47 94.42 82.36 87.63 90.99 84.20 83.62 85.03 80.68 81.24 85.79 75.68
電子通路業
Elec. Products Distribution960702 93.14 95.88 92.26 92.84 95.73 89.72 92.25 98.42 83.78 93.16 95.40 90.50 91.86 94.60 89.25 90.53 95.72 85.23
資訊服務業
Information Service960702 130.85 137.77 128.16 116.45 129.63 106.96 113.73 121.71 105.76 116.08 118.66 113.38 119.18 127.19 109.76 122.85 131.14 115.54

● 統計資料
72
指數種類
Index
基期
Base(=100)
7 月Jul.
8 月Aug.
9 月Sep.
10 月Oct.
11 月Nov.
12 月Dec.
2011(1月∼12月)2011(Jan. ~ Dec.)
平均
Ave最高
High最低
Low平均
Ave最高
High最低
Low平均
Ave最高
High最低
Low平均
Ave最高
High最低
Low平均
Ave最高
High最低
Low平均
Ave最高
High最低
Low最高
High日期
Date最低
Low日期
Date
發行量加權 Volume-Weighted
841101 132.50 137.51 125.62 115.84 132.93 105.56 106.92 113.76 98.54 103.88 108.16 98.58 100.93 108.53 89.06 92.03 96.37 86.13 147.58 2 / 8 86.13 12 / 19
電子類
Electronics850601 174.35 183.24 163.60 148.77 174.00 134.24 138.96 146.55 129.08 135.19 139.56 129.06 129.43 139.99 112.36 117.07 122.90 109.32 205.58 2 / 8 109.32 12 / 19
紡織類
Textile870601 116.90 123.97 111.47 110.34 124.13 99.77 103.19 109.30 95.13 96.70 101.80 90.58 91.55 98.60 86.15 82.82 90.54 75.78 127.40 4 / 25 75.78 12 / 20
機械類
Machinery870601 106.94 110.02 102.92 95.83 108.90 87.79 87.65 92.65 80.61 87.76 93.96 81.70 89.92 96.34 82.92 82.92 86.84 79.08 112.93 4 / 28 79.08 12 / 20
鋼鐵類
Iron & Steel861103 105.65 108.57 102.23 102.34 110.34 95.73 94.61 101.33 86.96 90.72 94.54 87.66 90.73 94.57 83.40 87.30 90.65 83.39 110.34 8 / 4 83.39 12 / 20
營建類
Construction870601 143.82 149.16 134.65 131.81 147.20 116.66 111.49 126.52 95.51 109.54 117.62 97.74 112.23 121.37 100.54 103.14 107.47 95.60 149.16 7 / 21 95.51 9 / 27
航運類
Shipping870601 56.28 59.02 54.63 52.53 56.66 48.78 50.70 52.28 48.06 48.91 51.29 47.07 48.72 51.20 44.84 46.14 47.16 44.52 64.73 1 / 4 44.52 12 / 20
觀光類
Tourism900601 161.95 178.71 148.32 140.48 154.41 129.16 136.35 144.97 127.08 136.08 142.85 129.95 132.72 141.29 120.12 120.39 126.61 112.02 188.49 6 / 7 112.02 12 / 20
化工類
Chemicals870601 80.17 83.59 75.40 72.18 80.40 66.26 64.48 70.23 59.63 63.40 66.32 59.90 61.03 64.98 55.63 57.30 60.48 53.77 96.88 1 / 19 53.77 12 / 19
生技醫療
Biotechnology & Medical Care
960702 155.01 160.51 147.95 139.41 158.74 127.80 125.60 136.72 115.32 120.64 128.13 114.38 118.55 128.85 105.00 105.91 113.53 96.68 171.68 5 / 11 96.68 12 / 19
半導體業
Semiconductor960702 31.32 33.89 28.66 24.85 30.77 21.73 23.38 24.96 22.02 22.70 23.49 21.86 21.70 23.49 18.74 20.12 21.32 18.78 43.79 2 / 8 18.74 11 / 24
電腦及週邊設備
Computer & Peripheral Equipment
960702 74.61 77.73 70.08 65.90 76.02 58.07 60.98 64.11 55.62 59.44 62.47 56.45 59.63 63.38 52.85 55.83 58.73 51.83 78.60 6 / 1 51.83 12 / 19
光電業
Optoelectronics960702 53.40 55.55 50.96 46.70 54.66 41.57 43.23 45.74 40.09 41.51 43.94 38.82 37.46 42.12 31.08 31.27 35.31 27.79 63.81 2 / 21 27.79 12 / 20
通信網路業
Communications & Internet
960702 56.06 58.82 52.84 47.02 55.12 42.88 45.45 47.29 43.06 44.83 46.41 43.42 42.82 46.38 37.03 38.99 40.25 36.50 63.98 3 / 4 36.50 12 / 20
電子零組件業
Elec. Parts & Components960702 76.01 80.73 71.61 65.32 75.07 59.55 61.22 64.78 57.29 59.30 61.10 57.41 56.38 61.32 48.82 50.43 52.59 47.50 94.42 3 / 9 47.50 12 / 19
電子通路業
Elec. Products Distribution960702 83.73 88.06 79.86 76.56 84.67 69.60 74.04 77.70 69.68 71.95 74.26 69.29 68.41 73.66 59.54 61.01 63.24 58.54 98.42 3 / 4 58.54 12 / 9
資訊服務業
Information Service960702 117.97 126.69 108.66 100.34 114.89 91.66 93.64 100.68 84.60 92.35 96.83 86.24 90.25 96.57 81.07 86.16 91.46 80.76 137.77 1 / 10 80.76 12 / 19

73
指數種類
Index
基期
Base(=100)
7 月Jul.
8 月Aug.
9 月Sep.
10 月Oct.
11 月Nov.
12 月Dec.
2011(1月∼12月)2011(Jan. ~ Dec.)
平均
Ave最高
High最低
Low平均
Ave最高
High最低
Low平均
Ave最高
High最低
Low平均
Ave最高
High最低
Low平均
Ave最高
High最低
Low平均
Ave最高
High最低
Low最高
High日期
Date最低
Low日期
Date
發行量加權 Volume-Weighted
841101 132.50 137.51 125.62 115.84 132.93 105.56 106.92 113.76 98.54 103.88 108.16 98.58 100.93 108.53 89.06 92.03 96.37 86.13 147.58 2 / 8 86.13 12 / 19
電子類
Electronics850601 174.35 183.24 163.60 148.77 174.00 134.24 138.96 146.55 129.08 135.19 139.56 129.06 129.43 139.99 112.36 117.07 122.90 109.32 205.58 2 / 8 109.32 12 / 19
紡織類
Textile870601 116.90 123.97 111.47 110.34 124.13 99.77 103.19 109.30 95.13 96.70 101.80 90.58 91.55 98.60 86.15 82.82 90.54 75.78 127.40 4 / 25 75.78 12 / 20
機械類
Machinery870601 106.94 110.02 102.92 95.83 108.90 87.79 87.65 92.65 80.61 87.76 93.96 81.70 89.92 96.34 82.92 82.92 86.84 79.08 112.93 4 / 28 79.08 12 / 20
鋼鐵類
Iron & Steel861103 105.65 108.57 102.23 102.34 110.34 95.73 94.61 101.33 86.96 90.72 94.54 87.66 90.73 94.57 83.40 87.30 90.65 83.39 110.34 8 / 4 83.39 12 / 20
營建類
Construction870601 143.82 149.16 134.65 131.81 147.20 116.66 111.49 126.52 95.51 109.54 117.62 97.74 112.23 121.37 100.54 103.14 107.47 95.60 149.16 7 / 21 95.51 9 / 27
航運類
Shipping870601 56.28 59.02 54.63 52.53 56.66 48.78 50.70 52.28 48.06 48.91 51.29 47.07 48.72 51.20 44.84 46.14 47.16 44.52 64.73 1 / 4 44.52 12 / 20
觀光類
Tourism900601 161.95 178.71 148.32 140.48 154.41 129.16 136.35 144.97 127.08 136.08 142.85 129.95 132.72 141.29 120.12 120.39 126.61 112.02 188.49 6 / 7 112.02 12 / 20
化工類
Chemicals870601 80.17 83.59 75.40 72.18 80.40 66.26 64.48 70.23 59.63 63.40 66.32 59.90 61.03 64.98 55.63 57.30 60.48 53.77 96.88 1 / 19 53.77 12 / 19
生技醫療
Biotechnology & Medical Care
960702 155.01 160.51 147.95 139.41 158.74 127.80 125.60 136.72 115.32 120.64 128.13 114.38 118.55 128.85 105.00 105.91 113.53 96.68 171.68 5 / 11 96.68 12 / 19
半導體業
Semiconductor960702 31.32 33.89 28.66 24.85 30.77 21.73 23.38 24.96 22.02 22.70 23.49 21.86 21.70 23.49 18.74 20.12 21.32 18.78 43.79 2 / 8 18.74 11 / 24
電腦及週邊設備
Computer & Peripheral Equipment
960702 74.61 77.73 70.08 65.90 76.02 58.07 60.98 64.11 55.62 59.44 62.47 56.45 59.63 63.38 52.85 55.83 58.73 51.83 78.60 6 / 1 51.83 12 / 19
光電業
Optoelectronics960702 53.40 55.55 50.96 46.70 54.66 41.57 43.23 45.74 40.09 41.51 43.94 38.82 37.46 42.12 31.08 31.27 35.31 27.79 63.81 2 / 21 27.79 12 / 20
通信網路業
Communications & Internet
960702 56.06 58.82 52.84 47.02 55.12 42.88 45.45 47.29 43.06 44.83 46.41 43.42 42.82 46.38 37.03 38.99 40.25 36.50 63.98 3 / 4 36.50 12 / 20
電子零組件業
Elec. Parts & Components960702 76.01 80.73 71.61 65.32 75.07 59.55 61.22 64.78 57.29 59.30 61.10 57.41 56.38 61.32 48.82 50.43 52.59 47.50 94.42 3 / 9 47.50 12 / 19
電子通路業
Elec. Products Distribution960702 83.73 88.06 79.86 76.56 84.67 69.60 74.04 77.70 69.68 71.95 74.26 69.29 68.41 73.66 59.54 61.01 63.24 58.54 98.42 3 / 4 58.54 12 / 9
資訊服務業
Information Service960702 117.97 126.69 108.66 100.34 114.89 91.66 93.64 100.68 84.60 92.35 96.83 86.24 90.25 96.57 81.07 86.16 91.46 80.76 137.77 1 / 10 80.76 12 / 19

● 統計資料
74
歷年上櫃股票自營與經紀交易金額統計表Statistics of Trading Amount by Brokers and Dealers(by Year)
19
單位:億元 Unit:NT$100Millions
年/月 Yr / Mo
自營買進Dealer Purchase
自營賣出Dealer Sale
經紀買進Brokerage Purchase
經紀賣出
Brokerage Sale合 計
Total
1989 - 0.01 - - 0.01
1990 5.18 6.20 2.61 2.82 16.82
1991 0.52 2.13 3.29 2.20 8.13
1992 0.92 2.77 4.03 3.34 11.06
1993 0.46 0.55 5.64 5.60 12.26
1994 0.53 0.46 5.03 4.90 10.93
1995 2.97 6.54 21.75 20.52 51.78
1996 128.77 129.78 4,404.68 4,403.94 9,067.16
1997 254.18 294.57 22,850.57 22,811.99 46,211.31
1998 267.19 337.58 11,706.39 11,643.03 23,954.19
1999 319.10 352.85 18,675.33 18,645.37 37,992.65
2000 751.03 877.83 44,044.67 43,916.69 89,590.24
2001 423.24 466.01 22,846.43 22,803.66 46,539.33
2002 485.83 578.21 27,461.42 27,369.03 55,894.49
2003 415.02 443.48 20,210.00 20,181.54 41,250.05
2004 772.62 860.71 33,985.24 33,897.16 69,515.72
2005 1,050.97 1,091.85 30,615.12 30,574.25 63,328.59
2006 1,361.72 1,354.57 49,929.40 49,936.55 102,582.24
2007 1,925.81 2,058.20 83,448.15 83,315.75 170,747.91
2008 492.32 517.59 32,360.54 32,335.27 65,705.72
2009 854.24 793.32 51,535.36 51,596.28 104,779.19
2010 1,286.87 1,303.21 55,049.01 55,032.68 112,671.77
2011 934.26 1,000.63 38,996.10 38,929.73 79,860.72
1 121.05 111.83 3,923.84 3,933.06 8,089.78
2 79.91 88.49 2,947.96 2,939.39 6,055.75
3 125.83 131.87 5,111.18 5,105.13 10,474.01
4 98.11 101.27 3,654.90 3,651.73 7,506.01
5 109.84 113.07 4,141.45 4,138.22 8,502.58
6 94.39 103.99 3,609.02 3,599.42 7,406.82
7 88.52 92.30 3,447.48 3,443.70 7,072.00
8 65.38 89.19 3,383.30 3,359.48 6,897.35
9 41.13 51.79 2,437.99 2,427.33 4,958.24
10 37.70 38.76 2,195.59 2,194.53 4,466.58
11 48.55 54.27 2,425.85 2,420.12 4,948.79
12 23.86 23.80 1,717.54 1,717.60 3,482.80

75
100年度櫃檯買賣市場開戶數及證券商家數統計表Number of Accounts and Securities Firms on GTSM in 2011
20
年/月 Yr / Mo
櫃檯買賣投資人
累計開戶數 Accumulated GTSM Accounts Opened
櫃檯買賣證券商家數
No. of Securities Firms on GTSM
證券商(含兼營債券)
Securities Firms(Stocks and Bonds)
專營債券商 Securities Firms(Bonds Only)
2011 13,176,510 1,088 71
1 12,644,642 1,074 79
2 12,693,538 1,074 78
3 12,753,264 1,074 78
4 12,798,110 1,077 78
5 12,839,254 1,077 77
6 12,879,887 1,079 77
7 12,926,767 1,082 77
8 13,003,216 1,083 77
9 13,055,900 1,084 77
10 13,091,706 1,084 77
11 13,134,735 1,086 77
12 13,176,510 1,088 71

● 統計資料
76
100年度櫃檯買賣中心與臺灣證券交易所發行面比較表Comparison of Issuance on GTSM and TWSE in 2011
21
發行
Issuance1 月Jan.
2 月Feb.
3 月Mar.
4 月Apr.
5 月May
6 月Jun.
7 月Jul.
8 月Aug.
9 月Sep.
10 月Oct.
11 月Nov.
12 月Dec.
掛牌公司數(家)
No. of Listing
櫃檯買賣中心
GTSM571 573 578 581 583 585 585 587 590 594 599 607
證券交易所
TWSE759 759 761 762 763 763 765 769 774 779 783 790
總資本額 (10億元)Total Capital(NT$Billion)
櫃檯買賣中心
GTSM709.12 708.39 713.47 717.33 707.60 708.67 713.83 723.71 727.56 727.93 724.29 731.92
百分比 (%)
10.71 10.69 10.76 10.86 10.74 10.75 10.69 10.67 10.65 10.65 10.56 10.63
證券交易所
TWSE5,913.80 5,915.51 5,917.50 5,888.76 5,883.17 5,886.60 5,963.80 6,057.72 6,106.11 6,107.56 6,132.29 6,152.38
百分比 (%)
89.29 89.31 89.24 89.14 89.26 89.25 89.31 89.33 89.35 89.35 89.44 89.37
總市值 (10億元)
Total Market Capitalization(NT$Billion)
櫃檯買賣中心
GTSM2,032.76 1,969.83 1,954.17 1,968.55 1,998.99 1,923.71 1,888.81 1,609.75 1,491.05 1,533.84 1,367.88 1,417.09
百分比 (%)
7.74 7.94 7.81 7.60 7.72 7.71 7.56 7.20 7.14 7.00 6.82 6.87
證券交易所
TWSE24,235.33 22,826.28 23,066.61 23,938.93 23,891.46 23,012.09 23,079.67 20,734.80 19,397.42 20,392.98 18,686.99 19,216.18
百分比 (%)
92.26 92.06 92.19 92.40 92.28 92.29 92.44 92.80 92.86 93.00 93.18 93.13

77
發行
Issuance1 月Jan.
2 月Feb.
3 月Mar.
4 月Apr.
5 月May
6 月Jun.
7 月Jul.
8 月Aug.
9 月Sep.
10 月Oct.
11 月Nov.
12 月Dec.
掛牌公司數(家)
No. of Listing
櫃檯買賣中心
GTSM571 573 578 581 583 585 585 587 590 594 599 607
證券交易所
TWSE759 759 761 762 763 763 765 769 774 779 783 790
總資本額 (10億元)Total Capital(NT$Billion)
櫃檯買賣中心
GTSM709.12 708.39 713.47 717.33 707.60 708.67 713.83 723.71 727.56 727.93 724.29 731.92
百分比 (%)
10.71 10.69 10.76 10.86 10.74 10.75 10.69 10.67 10.65 10.65 10.56 10.63
證券交易所
TWSE5,913.80 5,915.51 5,917.50 5,888.76 5,883.17 5,886.60 5,963.80 6,057.72 6,106.11 6,107.56 6,132.29 6,152.38
百分比 (%)
89.29 89.31 89.24 89.14 89.26 89.25 89.31 89.33 89.35 89.35 89.44 89.37
總市值 (10億元)
Total Market Capitalization(NT$Billion)
櫃檯買賣中心
GTSM2,032.76 1,969.83 1,954.17 1,968.55 1,998.99 1,923.71 1,888.81 1,609.75 1,491.05 1,533.84 1,367.88 1,417.09
百分比 (%)
7.74 7.94 7.81 7.60 7.72 7.71 7.56 7.20 7.14 7.00 6.82 6.87
證券交易所
TWSE24,235.33 22,826.28 23,066.61 23,938.93 23,891.46 23,012.09 23,079.67 20,734.80 19,397.42 20,392.98 18,686.99 19,216.18
百分比 (%)
92.26 92.06 92.19 92.40 92.28 92.29 92.44 92.80 92.86 93.00 93.18 93.13

● 統計資料
78
100年度櫃檯買賣中心與臺灣證券交易所股票交易面比較表Comparison of Trading on GTSM and TWSE in 2011
22
交易
Trading1 月Jan.
2 月Feb.
3 月Mar.
4 月Apr.
5 月May
6 月Jun.
7 月Jul.
8 月Aug.
9 月Sep.
10 月Oct.
11 月Nov.
12 月Dec.
成交值(億元)
Trading Value(NT$100 Million)
櫃檯買賣中心
GTSM4,045 3,028 5,237 3,753 4,251 3,703 3,536 3,449 2,479 2,233 2,474 1,741
百分比 (%)
13.37 13.69 16.59 14.98 16.36 15.19 12.68 10.55 10.40 10.94 11.52 10.72
證券交易所
TWSE26,213 19,086 26,326 21,300 21,728 20,675 24,348 29,248 21,359 18,185 18,997 14,508
百分比 (%)
86.63 86.31 83.41 85.02 83.64 84.81 87.32 89.45 89.60 89.06 88.48 89.28
成交量(百萬股)
Trading Volume(1 Million Shares)
櫃檯買賣中心
GTSM10,736 7,294 11,928 8,765 9,586 8,178 8,295 9,266 6,399 5,476 7,075 5,416
百分比 (%)
12.39 13.16 15.63 14.68 16.17 15.49 13.20 11.34 10.66 11.05 12.24 11.48
證券交易所
TWSE75,903 48,137 64,401 50,958 49,708 44,620 54,545 72,453 53,620 44,086 50,735 41,776
百分比 (%)
87.61 86.84 84.37 85.32 83.83 84.51 86.80 88.66 89.34 88.95 87.76 88.52
周轉率(%)
Turnover Rate(%)
櫃檯買賣中心
GTSM15.14 10.30 16.72 12.22 13.55 11.54 11.62 12.80 8.80 7.52 9.77 7.40
證券交易所
TWSE12.83 8.14 10.88 8.65 8.45 7.58 9.15 11.96 8.78 7.22 8.27 6.79

79
交易
Trading1 月Jan.
2 月Feb.
3 月Mar.
4 月Apr.
5 月May
6 月Jun.
7 月Jul.
8 月Aug.
9 月Sep.
10 月Oct.
11 月Nov.
12 月Dec.
成交值(億元)
Trading Value(NT$100 Million)
櫃檯買賣中心
GTSM4,045 3,028 5,237 3,753 4,251 3,703 3,536 3,449 2,479 2,233 2,474 1,741
百分比 (%)
13.37 13.69 16.59 14.98 16.36 15.19 12.68 10.55 10.40 10.94 11.52 10.72
證券交易所
TWSE26,213 19,086 26,326 21,300 21,728 20,675 24,348 29,248 21,359 18,185 18,997 14,508
百分比 (%)
86.63 86.31 83.41 85.02 83.64 84.81 87.32 89.45 89.60 89.06 88.48 89.28
成交量(百萬股)
Trading Volume(1 Million Shares)
櫃檯買賣中心
GTSM10,736 7,294 11,928 8,765 9,586 8,178 8,295 9,266 6,399 5,476 7,075 5,416
百分比 (%)
12.39 13.16 15.63 14.68 16.17 15.49 13.20 11.34 10.66 11.05 12.24 11.48
證券交易所
TWSE75,903 48,137 64,401 50,958 49,708 44,620 54,545 72,453 53,620 44,086 50,735 41,776
百分比 (%)
87.61 86.84 84.37 85.32 83.83 84.51 86.80 88.66 89.34 88.95 87.76 88.52
周轉率(%)
Turnover Rate(%)
櫃檯買賣中心
GTSM15.14 10.30 16.72 12.22 13.55 11.54 11.62 12.80 8.80 7.52 9.77 7.40
證券交易所
TWSE12.83 8.14 10.88 8.65 8.45 7.58 9.15 11.96 8.78 7.22 8.27 6.79

● 統計資料
80
100年度上櫃股票除息交易情形一覽表Trading of Ex-Dividend Stocks in 2011
23
單位:元
Unit:NT$
代號 Code
公司名稱 Name of Company
日期 Date
除息金額
Dividend
除息前參考價
Reference Price Before Ex-Dividend
除息後參考價
Reference Price After Ex-Dividend
01006T基泰SR Kee Tai Star
2.24 0.12 7.85 7.73
4138曜亞國際 DYNAMIC MEDICAL TECHNOLOGIES INC.
5.18 5.00 175.50 170.50
911613特藝石油能源 Technics Oil & Gas Limited
6.01 0.35 11.30 10.95
5706鳳凰國際旅行社 Phoenix Tours International, Inc.
6.02 0.50 109.00 108.50
6160欣技資訊 Cipherlab Co.,Ltd.
6.02 2.50 43.60 41.10
3615安可光電 AimCore Technology Co., Ltd
6.08 0.20 167.00 166.80
4736泰博科技 Taidoc Technology Corporation
6.09 4.13 69.20 65.07
8114振樺電子 POSIFLEX TECHNOLOGY, INC.
6.09 4.23 67.60 63.37
3630新鉅科技 Newmax Technology Co., Ltd.
6.10 3.05 129.50 126.45
5490同亨科技 XAC AUTOMATION CORP
6.14 3.32 38.20 34.88
8074鉅橡企業 AURONA INDUSTRIES, INC
6.16 0.30 14.80 14.50
2916滿心企業 MUNSIN GARMENT CORPORATION
6.20 2.00 28.75 26.75
3293鈊象電子 INTERNATIONAL GAMES SYSTEM CO.,LTD.
6.20 9.50 161.00 151.50

81
代號 Code
公司名稱 Name of Company
日期 Date
除息金額
Dividend
除息前參考價
Reference Price Before Ex-Dividend
除息後參考價
Reference Price After Ex-Dividend
5211蒙恬科技 Penpower Technology LTD.
6.21 2.95 61.10 58.15
6023寶來曼氏期貨 Polaris Futures Co., Ltd.
6.21 1.58 38.15 36.57
8923時報文化出版企業 China Times Publishing Comp.
6.21 1.25 20.75 19.50
3511矽瑪科技 SIMULA TECHNOLOGY, INC.
6.22 5.00 57.50 52.50
3363上詮光纖通信 FOCI Fiber Optic Communications, Inc.
6.22 1.20 40.50 39.30
4126太平洋醫材 PACIFIC HOSPITAL SUPPLY CO., LTD.
6.23 3.00 130.00 127.00
3169亞信電子 ASIX ELECTRONICS CORPORATION
6.23 2.50 36.00 33.50
4120友華生技醫藥 Orient Europharma Co., Ltd.
6.24 0.65 46.10 45.45
6506雙邦實業 Shuang-Bang Industrial Corp.
6.27 0.60 20.45 19.85
1336台翰精密科技 IHAN PRECISION TECHNOLOGY CO., LTD.
6.28 0.60 18.40 17.80
4533協易機械工業 SHIEH YIH MACHINERY INDUSTRY CO., LTD
6.28 0.60 15.20 14.60
3290東浦精密光電 DONPON PRECISION INC.
6.29 0.50 31.45 30.95
9951皇田工業 MACAUTO INDUSTRIAL CO., LTD
6.29 2.00 29.75 27.75

● 統計資料
82
代號 Code
公司名稱 Name of Company
日期 Date
除息金額
Dividend
除息前參考價
Reference Price Before Ex-Dividend
除息後參考價
Reference Price After Ex-Dividend
8287英格爾科技 ENG ELECTRIC CO., LTD.
6.29 0.58 147.00 146.42
3527聚積科技 Macroblock, Inc.
6.29 8.00 123.50 115.50
6134萬旭電業 WanShih Electronic Co., Ltd.
6.29 0.50 19.05 18.55
5015華祺工業 RODEX FASTENERS CORP.
6.30 0.40 17.10 16.70
5601台聯貨櫃通運 TAIWAN ALLIED CONTAINER TERMINAL CORP.
6.30 0.23 16.80 16.57
5604中連汽車貨運 CHUNG LIEN TRANSPORTATION CO., LTD
7.04 1.96 27.15 25.19
5371中強光電 Coretronic Corporation
7.04 3.50 45.75 42.25
3466致振企業 Skardin Industrial Corporation
7.04 1.00 26.20 25.20
4420光明絲織廠 Kwang Ming Silk Mill Co., Ltd.
7.04 1.70 27.50 25.80
4720德淵企業 TEX YEAR INDUSTRIES INC.
7.05 0.20 17.15 16.95
6194育富電子 YUFO ELECTRONICS CO., LTD.
7.05 2.00 24.70 22.70
3089展成科技 JAAN CHERNG TECHNOLOGICAL COMPANY LTD.
7.05 0.30 11.85 11.55
1788杏昌生技 Hi-Clearance Inc.
7.05 3.50 110.50 107.00
3631晟楠科技 Chernan Metal Industrial Corp.
7.05 3.09 67.70 64.61
2718桃園大飯店 TAOYUAN HOTEL
7.05 0.95 39.15 38.20
5007三星科技 SAN SHING FASTECH CORP.
7.05 1.94 48.50 46.56

83
代號 Code
公司名稱 Name of Company
日期 Date
除息金額
Dividend
除息前參考價
Reference Price Before Ex-Dividend
除息後參考價
Reference Price After Ex-Dividend
1565精華光學 St.Shine Optical Co.,Ltd.
7.06 14.50 454.00 439.50
2061風青實業 FENG CHING METAL CORPORATION
7.06 1.00 18.00 17.00
3609東林科技 HEP TECH CO., LTD.
7.06 1.20 38.45 37.25
3522宏森光電科技 HI-LIGHT TEK CO., LTD.
7.06 1.20 27.45 26.25
3529力旺電子 mory Technology Inc.
7.07 2.50 71.30 68.80
3287廣寰科技 KWORLD COMPUTER CO.,LTD
7.07 1.30 14.90 13.60
3388崇越電通 TOPCO TECHNOLOGIES CORP.
7.07 6.00 85.80 79.80
3537堡達實業 PODAK CO., LTD
7.07 1.00 26.00 25.00
5493三聯科技 SAN LIEN TECHNOLOGY CORP.
7.07 3.00 38.75 35.75
5439高技企業 First Hi-tec Enterprise Co.,Ltd.
7.07 3.00 33.50 30.50
5480統盟電子 T-MAC TECHVEST PCB CO., LTD.
7.07 1.10 13.90 12.80
8091翔名科技 FEEDBACK TECHNOLOGY CORP.
7.07 5.37 67.70 62.33
8024佑華微電子 Alpha Microelectronics Corp.
7.07 1.88 22.80 20.92
4946紅心辣椒娛樂科技 Cayenne Entertainment Technology Co.,Ltd.
7.07 2.00 185.50 183.50
4429聚紡 G-FUN INDUSTRIAL CORPORATION
7.08 3.20 53.00 49.80
6021大慶證券 TA CHING SECURI TIES CO., LTD
7.08 0.40 16.40 16.00

● 統計資料
84
代號 Code
公司名稱 Name of Company
日期 Date
除息金額
Dividend
除息前參考價
Reference Price Before Ex-Dividend
除息後參考價
Reference Price After Ex-Dividend
5520力泰建設企業 Lihtai Construction Enterprise Co., Ltd.
7.08 1.35 25.35 24.00
5347世界先進積體電路 Vanguard International Semiconductor Co.
7.08 0.60 14.95 14.35
5210寶碩財務科技 APEX International Financial Engineering Res.
7.08 0.50 11.25 10.75
3093台灣港建 TAIWAN KONG KING CO.,LTD
7.11 6.00 66.60 60.60
4706大恭化學工業 TAH KONG CHEMICAL INDUSTRIAL CORP.
7.11 1.00 15.80 14.80
3373熱映光電 Radiant Innovation Inc.
7.11 1.47 21.20 19.73
3332幸康電子 Cincon Electronics Co.,Ltd.
7.11 4.00 51.80 47.80
6188廣明光電 Quanta Storage Inc.
7.11 2.00 25.50 23.50
6244茂迪 MOTECH INDUSTRIES INC
7.11 5.50 113.00 107.50
3652精聯電子 UNITECH ELECTRONIC CO., LTD.
7.11 1.15 30.80 29.65
3691碩禾電子材料 GIGASOLAR MATERIALS CORPORATION
7.11 25.00 729.00 704.00
6129普誠科技 Princeton Technology Corporation
7.11 1.00 16.80 15.80
3531先益電子工業 Shian Yih Electronic Industry Co., Ltd
7.11 1.20 26.50 25.30
3548兆利科技工業 JARLLYTEC CO. , LTD.
7.11 1.00 21.85 20.85
6151晉倫科技 GINAR TECHNOLOGY CO.,LTD.
7.12 2.00 40.75 38.75
1777生泰合成工業 SYN-TECH CHEM. & PHARM. CO., LTD.
7.12 2.30 49.90 47.60

85
代號 Code
公司名稱 Name of Company
日期 Date
除息金額
Dividend
除息前參考價
Reference Price Before Ex-Dividend
除息後參考價
Reference Price After Ex-Dividend
9950萬國通路 EMINENT LUGGAGE CORPORATION
7.12 1.27 19.90 18.63
9962有益鋼鐵 YEOU YIH STEEL CO., LTD.
7.12 0.40 20.10 19.70
6183關貿網路 TRADE-VAN INFORMATION SERVICES CO.
7.12 1.01 18.90 17.89
5438東友科技 TECO Image Systems Co.,Ltd
7.12 1.60 20.40 18.80
5398力瑋實業 INALWAYS CORPORATION
7.12 0.20 15.30 15.10
3624光頡科技 VIKING TECH CORPORATION
7.12 1.50 47.00 45.50
8921沈氏藝術印刷 SHEN'S ART PRINTING CO., LTD.
7.12 0.90 14.35 13.45
8913華夏資融 HWA-HSIA LEASING & FINANCIAL CORPORATION
7.12 1.50 22.20 20.70
3629卓韋光電 Join Well Technology Co.,Ltd.
7.12 0.49 27.35 26.86
6298崴強科技 Foxlink Image Technology
7.13 0.20 15.50 15.30
4965商店街市集國際資訊 PCHOMESTORE INC.
7.13 1.76 136.00 134.24
3541西柏科技 Cypress Technology CO.,LTD.
7.13 2.15 32.05 29.90
3131弘塑科技 GRAND PLASTIC TECHNOLOGY CORPORATION
7.13 8.50 93.70 85.20
1566毅金工業 YIN KING INDUSTRIAL CO.,LTD.
7.13 0.50 18.85 18.35
4426利勤實業 LI CHENG ENTERPRISE CO.,LTD.
7.13 0.30 14.60 14.30
6024群益期貨 CAPITAL FUTURES CORP.
7.13 0.10 27.00 26.90

● 統計資料
86
代號 Code
公司名稱 Name of Company
日期 Date
除息金額
Dividend
除息前參考價
Reference Price Before Ex-Dividend
除息後參考價
Reference Price After Ex-Dividend
3479安勤科技 Avalue Technology Inc.
7.14 2.80 42.20 39.40
4711永純化學工業 YONG SHUN CHEMICAL CO.,LTD
7.14 1.40 22.10 20.70
5519隆大營建事業 LongDa Construction & Development Corporation
7.14 1.06 49.45 48.39
6158禾昌興業 P-TWO INDUSTRIES INC.
7.14 2.40 30.30 27.90
3455由田新技 UTECHZONE Co., Ltd.
7.14 2.98 59.20 56.22
4527堃霖冷凍機械 KUEN LING REFRIGERATING MACHINERY CO.,LTD.
7.14 0.20 14.10 13.90
3265台灣星科金朋半導體 STATS ChipPAC Taiwan Semiconductor Corp.
7.14 1.66 25.50 23.84
4417金洲海洋科技 KING CHOU MARINE TECHNOLOGY CO., LTD
7.14 0.60 21.10 20.50
5212凌網科技 HYWEB TECHNOLOGY CO., LTD.
7.14 0.28 18.50 18.22
5536聖暉工程科技 ACTER CO.,LTD.
7.14 10.00 170.00 160.00
6020大展證券 TACHAN SECURITIES CO.,LTD.
7.14 0.64 17.00 16.36
6220岳豐科技 YFC-BonEagle ELECTRIC CO.,LTD
7.14 0.25 17.85 17.60
8083瑞穎 PRO-HAWK CORPORATION
7.14 2.30 36.00 33.70
8938明安國際企業 ADVANCED INTERNATIONAL MULTITECH CO.,LTD
7.14 2.60 42.90 40.30
3202樺晟電子 HIGH-TEK HARNESS ENTERPRISE CO.,LTD
7.14 0.20 10.35 10.15

87
代號 Code
公司名稱 Name of Company
日期 Date
除息金額
Dividend
除息前參考價
Reference Price Before Ex-Dividend
除息後參考價
Reference Price After Ex-Dividend
3444利機企業 NICHING INDUSTRIAL CORP.
7.14 1.00 31.60 30.60
5521工信工程 KUNG SING ENGINEERING CORPORATION
7.14 0.30 10.65 10.35
6231系微 syde Software Corp.
7.14 5.50 144.50 139.00
6138茂達電子 Anpec Electronics Corporation
7.15 1.50 22.80 21.30
6146耕興 SPORTON INTERNATIONAL INC.
7.15 4.94 69.80 64.86
1787福盈科技化學 JINTEX CORPORATION LTD.
7.15 0.69 13.10 12.41
3528安馳科技 ANSWER TECHNOLOGY CO., LTD.
7.18 1.78 36.45 34.67
3299帛漢 BOTHHAND ENTERPRISE INC.
7.18 3.00 38.25 35.25
3234光環科技 TrueLight Corporation
7.18 1.00 24.00 23.00
3211順達科技 Dynapack International Technology Corporation
7.18 5.99 140.00 134.01
6266泰詠電子 TOP UNION ELECTRONICS CORP.
7.18 0.63 12.70 12.07
3582凌耀科技 Capella Microsystems(Taiwan), Inc.
7.18 5.02 151.00 145.98
6154順發電腦 Sunfar Computer Co., Ltd
7.18 2.00 28.10 26.10
5356協益電子 SIRTEC INTERNATIONAL CO.,LTD.
7.18 5.00 52.20 47.20
5353台林通信 TAILYN COMMUNICATION COMPANY, LTD
7.18 0.36 13.45 13.09
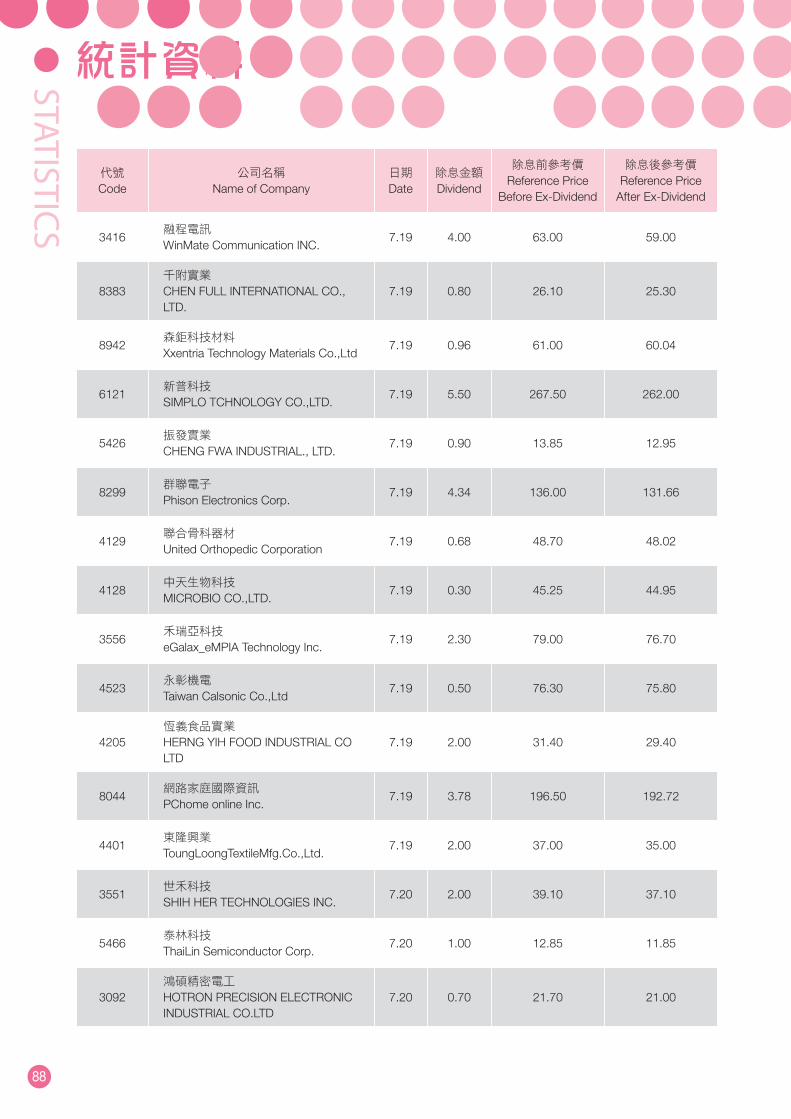
● 統計資料
88
代號 Code
公司名稱 Name of Company
日期 Date
除息金額
Dividend
除息前參考價
Reference Price Before Ex-Dividend
除息後參考價
Reference Price After Ex-Dividend
3416融程電訊 WinMate Communication INC.
7.19 4.00 63.00 59.00
8383千附實業 CHEN FULL INTERNATIONAL CO., LTD.
7.19 0.80 26.10 25.30
8942森鉅科技材料 Xxentria Technology Materials Co.,Ltd
7.19 0.96 61.00 60.04
6121新普科技 SIMPLO TCHNOLOGY CO.,LTD.
7.19 5.50 267.50 262.00
5426振發實業 CHENG FWA INDUSTRIAL., LTD.
7.19 0.90 13.85 12.95
8299群聯電子 Phison Electronics Corp.
7.19 4.34 136.00 131.66
4129聯合骨科器材 United Orthopedic Corporation
7.19 0.68 48.70 48.02
4128中天生物科技 MICROBIO CO.,LTD.
7.19 0.30 45.25 44.95
3556禾瑞亞科技 eGalax_eMPIA Technology Inc.
7.19 2.30 79.00 76.70
4523永彰機電 Taiwan Calsonic Co.,Ltd
7.19 0.50 76.30 75.80
4205恆義食品實業 HERNG YIH FOOD INDUSTRIAL CO LTD
7.19 2.00 31.40 29.40
8044網路家庭國際資訊 PChome online Inc.
7.19 3.78 196.50 192.72
4401東隆興業 ToungLoongTextileMfg.Co.,Ltd.
7.19 2.00 37.00 35.00
3551世禾科技 SHIH HER TECHNOLOGIES INC.
7.20 2.00 39.10 37.10
5466泰林科技 ThaiLin Semiconductor Corp.
7.20 1.00 12.85 11.85
3092鴻碩精密電工 HOTRON PRECISION ELECTRONIC INDUSTRIAL CO.LTD
7.20 0.70 21.70 21.00

89
代號 Code
公司名稱 Name of Company
日期 Date
除息金額
Dividend
除息前參考價
Reference Price Before Ex-Dividend
除息後參考價
Reference Price After Ex-Dividend
6185幃翔精密
Plastron Precision Co.7.20 2.00 24.80 22.80
4944兆遠科技 CRYSTALWISE TECHNOLOGY INC.
7.20 1.32 42.80 41.48
5820日盛金融控股 JIH SUN FINANCIAL HOLDING CO., LTD
7.20 0.09 13.25 13.16
8109博大科技 POWER MATE TECHNOLOGY CO.,LTD
7.20 1.70 60.10 58.40
8240華宏新技 WAH HONG INDUSTRIAL CORP.
7.20 3.20 68.80 65.60
6247淇譽電子科技 JAZZ HIPSTER CORPORATION
7.21 0.45 14.65 14.20
8401白紗科技印刷 BAI SHA TECHNOLOGY CO., LTD.
7.21 1.51 28.70 27.19
6210慶生電子 KINTECH ELECTRONICS CO., LTD.
7.21 4.00 48.50 44.50
6190萬泰科技 WONDERFUL HI-TECH CO., LTD.
7.21 0.30 13.70 13.40
3546宇峻奧汀 Userjoy Technology Co.,Ltd.
7.21 8.00 144.50 136.50
4406新昕纖維 HSIN-SIN TEXTILE CO., LTC
7.21 0.20 9.36 9.16
8931大園汽電共生 TA-YUAN COGENERATION COMPANY LTD.
7.21 0.90 15.00 14.10
3628盈正豫順 ABLEREX ELECTRONICS CO., LTD.
7.21 12.00 124.00 112.00
6803崑鼎投資控股 KD Holding Corporation
7.21 6.19 150.00 143.81
8069元太科技工業 E INK HOLDINGS INC.
7.21 2.66 54.50 51.84
8905裕國冷凍冷藏 EAGLE COLD STORAGE ENTERPRISE CO.,LTD
7.21 0.60 15.50 14.90

● 統計資料
90
代號 Code
公司名稱 Name of Company
日期 Date
除息金額
Dividend
除息前參考價
Reference Price Before Ex-Dividend
除息後參考價
Reference Price After Ex-Dividend
8925偉盟工業 WEI MON INDUSTRY CO.,LTD.
7.21 0.14 18.20 18.06
3491昇達科技 Universal Microwave Technology,Inc.
7.22 2.19 60.70 58.51
3611鼎翰科技 TSC AUTO ID TECHNOLOGY CO., LTD.
7.22 5.00 124.00 119.00
6126信音企業 GATRON ENTERPRISE CO.,LTD
7.25 1.50 31.00 29.50
1580新麥企業 SINMAG EQUIPMENT CORPORATION
7.25 7.00 113.00 106.00
4305世坤塑膠 SHIH-KUEN PLASTICS CO.LTD
7.25 0.80 20.95 20.15
6140訊達電腦 DIMENSION COMPUTER TECHNOLOGY CO., LTD.
7.25 0.10 12.95 12.85
6180遊戲橘子數位科技 GAMANIA DIGITAL ENTERTAINMENT CO.,LTD.
7.25 1.20 45.00 43.80
3354律勝科技 MICROCOSM TECHNOLOGY CO., LTD.
7.25 0.60 20.20 19.60
3217優群科技 ARGOSY RESEARCH INC.
7.26 1.50 19.70 18.20
8054安國國際科技 Alcor Micro,Corp.
7.26 2.50 45.15 42.65
3632研勤科技 PAPAGO INC.
7.26 1.00 92.20 91.20
5016松和工業 SONG HO INDUSTRIAL CO., LTD.
7.26 1.50 45.55 44.05
5443均豪精密工業 GALLANT PRECISION MACHINING CO., LTD.
7.26 0.71 12.05 11.34
5704知本老爺大酒店 Hotel royal chihpen
7.26 0.30 21.70 21.40

91
代號 Code
公司名稱 Name of Company
日期 Date
除息金額
Dividend
除息前參考價
Reference Price Before Ex-Dividend
除息後參考價
Reference Price After Ex-Dividend
5904寶雅國際 Poya Co., Ltd.
7.27 2.80 48.40 45.60
4534慶騰精密科技 Trinity Precision Technology Co., Ltd.
7.27 0.50 14.00 13.50
5425台灣半導體 TAIWAN SEMICONDUCTOR CO., LTD.
7.27 1.20 20.90 19.70
3390旭軟電子科技 SUNFLEX TECH. CO., Ltd.
7.27 1.20 47.10 45.90
8210勤誠興業 CHENBRO MICOM CO., LTD.
7.27 2.50 45.70 43.20
8182加高電子 HARMONY ELECTRONICS CORP
7.27 1.20 20.40 19.20
6123上奇科技 GrandTech C.G. Systems Inc.
7.28 2.80 33.50 30.70
8040九暘電子 IC Plus Corp.
7.28 1.04 20.15 19.11
8916光隆實業 KWONG LUNG ENTERPRISE CO.,LTD.
7.28 1.10 23.00 21.90
6270倍微科技 Professional Computer Technology Limited
7.28 2.00 22.30 20.30
6161捷波資訊 JETWAY INFORMATION CO., LTD.
7.28 0.30 13.30 13.00
2063世鎧精密 SHEH KAI PRECISION CO.,LTD
7.28 2.00 73.10 71.10
5209新鼎系統 Advanced Control & Systems Inc.
7.28 3.97 73.60 69.63
4722國精化學 QUALIPOLY CHEMICAL CORP.
7.28 0.79 24.00 23.21
6218豪勉科技 Hauman Technologies Corp.
7.28 2.50 48.50 46.00
8705東隆五金工業 TONG LUNG METAL INDUSTRY CO., LTD.
7.29 1.68 31.60 29.92

● 統計資料
92
代號 Code
公司名稱 Name of Company
日期 Date
除息金額
Dividend
除息前參考價
Reference Price Before Ex-Dividend
除息後參考價
Reference Price After Ex-Dividend
4105台灣東洋藥品工業 TTY BIOPHARM COMPANY LIMITED
7.29 0.26 158.00 157.74
6022大眾綜合證券 TA CHONG SECURITIES CO., LTD.
7.29 0.34 11.20 10.86
8042臺灣金山電子工業 TAIWAN CHINSAN ELECTRONIC INDUSTRIAL CO., LTD
8.01 4.00 49.80 45.80
5511德昌營造 TE CHANG CONSTRUCTION CO., LTD.
8.01 0.40 25.00 24.60
8917欣泰石油氣 HSIN TAI GAS CO., LTD.
8.01 1.50 46.80 45.30
3213茂訊電腦 Mildef Crete Inc.
8.01 4.00 70.50 66.50
3484崧騰企業 SOLTEAM ELECTRONICS CO.,LTD.
8.01 1.30 26.80 25.50
3306鼎天國際 RoyalTek Company Ltd.
8.01 1.60 29.60 28.00
3088艾訊 AXIOMTEK CO., LTD.
8.01 2.20 28.45 26.25
5403中菲電腦 DIMERCO DATA SYSTEM CORPORATION
8.01 1.79 22.35 20.56
3221台灣嘉碩科技 TAI-SAW TECHNOLOGY CO.,LTD.
8.02 0.80 16.75 15.95
8107大億科技 Kenmos Technology Co.,Ltd.
8.02 0.85 11.95 11.10
1742台灣蠟品 TAIWAN WAX COMPANY,LTD.
8.02 0.20 40.70 40.50
6147頎邦科技 CHIPBOND TECHNOLOGY CORPORATION
8.02 2.00 33.10 31.10
3291遠翔科技 Feeling Technology Corp.
8.02 2.00 31.80 29.80

93
代號 Code
公司名稱 Name of Company
日期 Date
除息金額
Dividend
除息前參考價
Reference Price Before Ex-Dividend
除息後參考價
Reference Price After Ex-Dividend
3266昇陽開發 Sunty Property Development Co., LTD
8.02 0.80 28.30 27.50
3526凡甲科技 ALLTOP TECHNOLOGY CO.,LTD
8.02 4.75 60.00 55.25
8255朋程科技 ACTRON TECHNOLOGY CORPORATION
8.02 3.50 118.50 115.00
8071豐聲科技 FENG SHENG Technology Co., Ltd
8.02 0.42 25.95 25.53
6292迅德興業 AXIS Corporation
8.02 2.90 34.65 31.75
5609中菲行航空貨運承攬 Dimerco Express (Taiwan) Corporation
8.02 1.20 24.30 23.10
5349先豐通訊 BOARDTEK ELECTRONICS COR.
8.02 0.80 27.70 26.90
3553力積電子 Zentel Electronic Corporation
8.02 1.10 28.30 27.20
5312寶島光學科技 FORMOSA OPTICAL TECHNOLOGY CO.,LTD.
8.03 2.20 95.80 93.60
4714永捷高分子工業 U-BEST POLYMER INDUSTRY CO.,LTD
8.03 1.00 20.90 19.90
8996高力熱處理工業 KAORI HEAT TREATMENT CO.,LTD
8.03 0.50 48.70 48.20
6245立端科技 Lanner Electronics Inc.
8.03 0.10 23.45 23.35
5013強新工業 NEW BEST WIRE INDUSTRIAL CO.,LTD
8.03 0.50 19.00 18.50
3114好德科技 Howteh Technology Co., Ltd.
8.03 0.20 15.20 15.00
5903全家便利商店 Taiwan FamilyMart.Co.,Ltd.
8.03 3.40 169.50 166.10

● 統計資料
94
代號 Code
公司名稱 Name of Company
日期 Date
除息金額
Dividend
除息前參考價
Reference Price Before Ex-Dividend
除息後參考價
Reference Price After Ex-Dividend
8086宏捷科技 ADVANCED WIRELESS SEMICONDUCTOR COMPANY
8.03 0.40 30.05 29.65
3152璟德電子 Advanced Ceramic X Corporation
8.04 5.50 97.80 92.30
4102永日化學工業 YUNG ZIP CHEMICAL IND. CO., LTD.
8.04 1.50 78.10 76.60
6195詩肯 SCAN-D CORPORATION
8.04 2.00 65.30 63.30
3563牧德科技 MACHVISION,INC
8.04 0.35 69.00 68.65
8064東捷科技 Contrel Technology Co., Ltd
8.04 0.40 14.25 13.85
6274台燿科技 TAIWAN UNION TECHNOLOGY CORPORATION
8.04 0.80 14.15 13.35
4716大立高分子工業 DAILY POLYMER CORP.
8.04 0.20 27.40 27.20
3325旭品科技 Casing Macron Technology Co., Ltd.
8.04 0.49 56.50 56.01
3236千如電機工業 ABC TAIWAN ELECTRONICS CORP.
8.04 0.60 16.95 16.35
6284佳邦科技 INPAQ TECHNOLOGY CO., LTD.
8.04 1.60 31.50 29.90
4912聯德控股 Lemtech Holdings Co., Limited
8.04 1.00 29.20 28.20
5205漢康科技 FAST TECHNOLOGIES INC.
8.04 0.27 77.70 77.43
6609台灣瀧澤科技 TAIWAN TAKISAWA TECHNOLOGY CO., LTD.
8.04 0.80 23.00 22.20
3508位速科技 Ways Technical Corp., LTD
8.05 0.73 91.90 91.17

95
代號 Code
公司名稱 Name of Company
日期 Date
除息金額
Dividend
除息前參考價
Reference Price Before Ex-Dividend
除息後參考價
Reference Price After Ex-Dividend
3118進階生物科技 VEL BIOTECHNOLOGY INC.
8.05 1.50 38.55 37.05
5483中美矽晶製品 Sino-American Silicon Products Inc.
8.05 5.00 82.00 77.00
6177達麗建設事業 DA-LI CONSTRUCTION CO., LTD.
8.08 0.51 32.20 31.69
1813寶利徠光學科技 Polylite Taiwan Co., Ltd.
8.08 1.50 38.15 36.65
6150撼訊科技 Tul Corporation
8.08 2.00 27.00 25.00
8403盛弘醫藥 SHAREHOPE MEDICINE CO., LTD.
8.08 1.50 42.00 40.50
1785光洋應用材料科技 Solar Applied Materials Technology Corp.
8.08 2.00 67.80 65.80
4528江興鍛壓工業 CHIAN HSING FORGING INDUSTRIAL CO.,LTD.
8.09 0.70 17.40 16.70
4430耀億工業 YAO I FABRIC CO.,LTD.
8.09 2.00 52.30 50.30
8050廣積科技 IBASE TECHNOLOGY INC.
8.09 3.02 40.35 37.33
8032光菱電子 Koryo Electronics Co., Ltd.
8.09 1.20 22.15 20.95
4909新復興微波通訊 NEW ERA ELECTRONICS CO., LTD
8.09 1.70 34.85 33.15
6261久元電子 YOUNGTEK ELECTRONICS CORPORATION
8.09 4.67 70.30 65.63
6182合晶科技 WAFER WORKS CORP.
8.09 1.00 33.15 32.15
6204台灣艾華電子工業 TAIWAN ALPHA ELECTRONIC CO., LTD.
8.09 2.20 27.55 25.35

● 統計資料
96
代號 Code
公司名稱 Name of Company
日期 Date
除息金額
Dividend
除息前參考價
Reference Price Before Ex-Dividend
除息後參考價
Reference Price After Ex-Dividend
6290良維科技 LONGWELL COMPANY
8.10 2.50 29.50 27.00
4121優盛醫學科技 ROSSMAX INTERNATIONAL LTD.
8.10 0.40 16.20 15.80
3264欣銓科技 Ardentec Corporation
8.11 2.00 20.90 18.90
3570大塚資訊科技 Otsuka Information Technology Corp.
8.11 1.98 54.00 52.02
6143振曜科技 NETRONIX,INC.
8.11 0.50 35.40 34.90
5452佶優科技 UNIC TECHNOLOGY CORP.
8.11 0.35 14.10 13.75
5460同協電子 MUSTANG INDUSTRIAL CORP.
8.11 0.60 11.00 10.40
3206志豐電子 KINGSTATE ELECTRONICS CORP.
8.11 1.30 24.00 22.70
3297杭特電子 Hunt Electronic Co., Ltd.
8.12 0.99 24.80 23.81
3490單井工業 Single Well Industrial Corporation
8.15 3.50 32.00 28.50
3587閎康科技 Materials Analysis Technology Inc.
8.15 1.36 29.50 28.14
8390金益鼎企業 JIIN YEEH DING ENTERPRISE CO.,LTD
8.15 1.32 44.35 43.03
8358金居開發銅箔 CO-TECH COPPER FOIL CORPORATION
8.15 1.40 16.80 15.40
6223旺矽科技 MPI CORPORATION
8.15 5.79 81.30 75.51
6170統振 WELLDONE COMPANY
8.15 0.13 20.50 20.37
3389志遠電子 TECHMOSA INTERNATIONAL INC.
8.15 2.50 28.50 26.00

97
代號 Code
公司名稱 Name of Company
日期 Date
除息金額
Dividend
除息前參考價
Reference Price Before Ex-Dividend
除息後參考價
Reference Price After Ex-Dividend
3162精確實業 UNITED ALLOY-TECH COMPANY LTD
8.15 0.22 10.05 9.83
6279胡連精密 HU LANE ASSOCIATE INC.
8.15 3.49 60.00 56.51
3323加百裕工業 Celxpert Energy Corporation
8.15 1.50 22.70 21.20
1558伸興工業 ZENG HSING INDUSTRIAL CO., LTD.
8.15 7.70 116.50 108.80
8079誠遠科技 TEST-SERV INC.
8.15 1.17 21.00 19.83
6125廣運機械工程 KENMEC MECHANICAL ENGINEERING CO.,LTD.
8.15 0.91 21.30 20.39
5392應華精密 AVY Precision Technology INC.
8.16 3.50 81.00 77.50
5489彩富電子 DYNACOLOR,INC.
8.16 2.33 28.55 26.22
5491連展科技 ADVANCED-CONNECTEK INC.
8.16 0.15 11.15 11.00
8289泰藝電子 TAITIEN ELECTRONICS CO., LTD.
8.16 1.30 18.40 17.10
9960邁達康網路事業 DACOME INTERNATIONAL LTD.
8.16 0.40 23.90 23.50
5530龍巖 NGYEN LIFE SERVICE CORPORATION
8.16 1.50 125.00 123.50
5410國眾電腦 LEO SYSTEMS, INC.
8.16 0.58 14.40 13.82
3067全域 Phonic Corporation
8.16 2.10 25.05 22.95
3227原相科技 PixArt Imaging Inc.
8.17 4.70 70.70 66.00
3068美磊科技 MAG.LAYERS Scientific-Technics Co.,Ltd.
8.17 4.36 54.80 50.44

● 統計資料
98
代號 Code
公司名稱 Name of Company
日期 Date
除息金額
Dividend
除息前參考價
Reference Price Before Ex-Dividend
除息後參考價
Reference Price After Ex-Dividend
4535至興精機 FINE BLANKING & TOOL CO., LTD
8.17 2.50 43.10 40.60
6263普萊德科技 Planet Technology Corporation
8.17 1.50 22.05 20.55
8929富堡工業 Fu Burg Industrial Co., Ltd.
8.18 1.60 30.35 28.75
8121越峰電子材料 Acme Electronics Corporation
8.18 0.98 84.00 83.02
8234新漢電腦 NEXCOM International Co., LTD.
8.18 1.00 35.30 34.30
6008凱基證券 KGI Securities Co. LTD.
8.18 0.45 14.45 14.00
9949琉園 TITTOT CO.,LTD.
8.19 0.80 26.00 25.20
6208日揚科技 HIGHLIGHT TECH CORP.
8.19 0.25 18.85 18.60
4103百略醫學科技 MICROLIFE CORPORATION
8.22 3.00 45.15 42.15
6221晉泰科技 Genesis Technology, Inc.
8.22 0.59 15.80 15.21
3402漢科系統科技 Wholetech System Hitech Limited
8.23 1.40 22.00 20.60
5508永信建設開發 YUNGSHIN CONSTRUCTION & DEVELOPMENT CO.,LTD.
8.24 2.53 30.70 28.17
3284太普高精密影像 TOP HIGH IMAGE CORP.
8.24 1.00 12.30 11.30
2596綠意開發 ReaLy Development & Construction Corp.
8.24 1.20 15.70 14.50
5512力麒建設 RICH DEVELOPMENT CO.,LTD.
8.24 0.51 15.55 15.04

99
代號 Code
公司名稱 Name of Company
日期 Date
除息金額
Dividend
除息前參考價
Reference Price Before Ex-Dividend
除息後參考價
Reference Price After Ex-Dividend
8043蜜望實企業 HONEY HOPE HONESTY ENTERPRISE CO.,LTD
8.25 0.85 16.55 15.70
4905台聯電訊 TAINET COMMUNICATION SYSTEM CORP.
8.25 0.50 20.60 20.10
6217中國探針 C.C.P.CONTACT PROBES CO.,LTD
8.25 0.10 24.00 23.90
6127九豪精密陶瓷 LEATEC FINE CERAMICS CO., LTD.
8.25 0.52 12.60 12.08
6122擎邦國際科技工程 KING POLYTECHNIC ENGINEERING CO.,LTD.
8.25 1.00 20.65 19.65
8099大同世界科技 TATUNG SYSTEM TECHNOLOGIES INC.
8.25 1.00 21.90 20.90
6173信昌電子陶瓷 OSPERITY DIELECTRICS CO., LTD.
8.25 0.30 15.60 15.30
4107邦特生物科技 BIOTEQUE CORPORATION
8.26 1.80 27.50 25.70
6275元山科技工業 YEN SUN TECHNOLOGY CORP
8.26 0.50 14.15 13.65
8048德勝科技 RUBY TECH CORPORATION
8.26 0.20 12.30 12.10
3339泰谷光電 TEKCORE CO., LTD
8.29 1.00 19.90 18.90
2636台驊國際 T.H.I. GROUP LTD.
8.30 2.21 30.50 28.29
3441聯一光學工業 IQUE OPTICAL INDUSTRIAL CO.,LTD.
8.30 0.80 47.70 46.90
8111立碁電子工業 LIGITEK ELECTRONICS CO.,LTD
8.30 0.20 11.70 11.50
01006T基泰SR Kee Tai Star
8.30 0.12 11.10 10.98

● 統計資料
100
代號 Code
公司名稱 Name of Company
日期 Date
除息金額
Dividend
除息前參考價
Reference Price Before Ex-Dividend
除息後參考價
Reference Price After Ex-Dividend
4721美琪瑪國際 MECHEMA CHEMICALS INT CORP.
8.30 2.00 26.65 24.65
3438台灣類比科技 Advanced Analog Technology Inc
8.31 3.20 44.50 41.30
8930青鋼金屬建材 CKM BUILDING MATERIAL CORP.
9.01 0.89 14.25 13.36
4111濟生化學製藥廠 CHI SHENG CHEMICAL CORPORATION
9.01 0.30 21.00 20.70
3685政翔精密 Jeng Shiang Precision Ind .Co .,Ltd.
9.01 2.02 20.90 18.88
5102富強輪胎工廠 FU-CHIAN TIRE CO.,LTD
9.02 0.50 27.85 27.35
3687茂為歐買尬數位科技 MacroWell OMG Digital Entertainment Co., Ltd.
9.05 0.50 258.00 257.50
5317凱美電機 KAIMEI ELECTRONIC CORP.
9.06 0.50 8.19 7.69
8410森田印刷廠 Sentien Printing Factory Co.,Ltd
9.07 2.00 50.10 48.10
5344立衛科技 VATE TECHNOLOGY CO., LTD.
9.07 0.93 14.80 13.87
6203海韻電子工業 Sea Sonic Electronics Co., Ltd.
9.08 3.50 38.90 35.40
6105瑞傳科技 Portwell, Inc.
9.09 1.00 24.10 23.10
3577泓格科技 ICP DAS CO., LTD.
9.09 1.99 33.60 31.61
5324士林開發 SHIHLIN DEVELOPMENT COMPANY LIMITED
9.09 0.30 38.30 38.00
3289宜特科技 INTEGRATED SERVICE TECHNOLOGY INC.
9.13 0.25 29.90 29.65

101
代號 Code
公司名稱 Name of Company
日期 Date
除息金額
Dividend
除息前參考價
Reference Price Before Ex-Dividend
除息後參考價
Reference Price After Ex-Dividend
4609唐鋒實業 AIRLUX ELEXTRICAL CO., LTD.
9.13 0.96 21.30 20.34
4908前鼎光電 APAC Opto Electronics Inc.
9.13 1.60 28.00 26.40
5487通泰積體電路 TONTEK DESIGN TECHNOLOGY LTD.
9.13 1.00 14.80 13.80
3317尼克森微電子 NIKO SEMICONDUCTOR CO.,LTD.
9.13 0.40 15.35 14.95
5014建錩實業 Chain Chon Industrial Co., Ltd.
9.14 0.20 9.66 9.46
3483力致科技 Forcecon Technology Co., Ltd.
9.14 0.30 20.55 20.25
6227茂綸 GALAXY FAR EAST CORP
9.14 0.80 12.15 11.35
6207雷科 LASER TEK TAIWAN CO.,LTD.
9.14 1.96 42.10 40.14
3083中華網龍 CHINESE GAMER INTERNATIONAL CORPORATION
9.15 9.35 92.70 83.35
6229研通科技 V-TAC TECHNOLOGY CO.,LTD.
9.15 1.09 12.00 10.91
4416三圓建設 SHANYUAN CO.,LTD
9.15 3.20 66.80 63.60
3207耀勝電子 YAO SHENG ELECTRONIC CO., LTD.
9.15 0.10 11.60 11.50
6508惠光化學 Huikwang Corporation
9.15 1.30 26.80 25.50
3580友威科技 UVAT Technology Co., Ltd.
9.15 0.30 13.10 12.80
1815富喬工業 FULLTECH FIBER GLASS CORP.
9.15 0.79 20.25 19.46
3567逸昌科技 ETREND Hightech Corp.
9.15 1.53 13.90 12.37

● 統計資料
102
代號 Code
公司名稱 Name of Company
日期 Date
除息金額
Dividend
除息前參考價
Reference Price Before Ex-Dividend
除息後參考價
Reference Price After Ex-Dividend
4506崇友實業 LDEN FRIENDS CORPORATION
9.19 1.00 15.75 14.75
3360尚立 NIC Technology & Merchandise Inc.
9.20 0.49 10.65 10.16
3078僑威科技 CHANNEL WELL TECHNOLOGY CO.,LTD
9.20 0.39 12.30 11.91
3552同致電子 TUNG THIH ELECTRONIC CO., LTD.
9.22 1.76 64.40 62.64
8927北基加油站 North-Star Petroleum Co.,LTD.
9.22 0.05 15.60 15.55
8349友信國際 QST INTERNATIONAL CORP.
9.23 1.29 26.80 25.51
5464霖宏科技 LIN HORN TECHNOLOGY CO., LTD.
9.26 1.00 20.80 19.80
1569濱川企業 Bin Chuan Enterprise Co., Ltd.
9.26 0.76 54.00 53.24
911613特藝石油能源 Technics Oil & Gas Limited
9.26 0.36 10.50 10.14
6175立敦科技 LITON TECHNOLOGY CORP.
9.26 0.52 26.20 25.68
5213亞昕國際開發 YeaShin International Development Co., Ltd.
9.26 0.62 34.10 33.48
8936國統國際 KUO TOONG INTERNATIONAL CO.,LTD.
9.26 0.25 34.15 33.90
1795美時化學製藥 Lotus Pharmaceutical Co.,Ltd.
9.27 0.30 26.10 25.80
6509聚和國際 TAIWAN HOPAX CHEMS.MFG.CO.,LTD.
9.27 0.10 12.15 12.05
5351鈺創科技 Etron Technology, Inc.
9.27 0.12 9.77 9.65

103
代號 Code
公司名稱 Name of Company
日期 Date
除息金額
Dividend
除息前參考價
Reference Price Before Ex-Dividend
除息後參考價
Reference Price After Ex-Dividend
6174安碁科技 AKER TECHNOLOGY CO., LTD
9.29 0.25 9.65 9.40
8354冠郝企業 KOAN HAO ENTERPRISE CO.,LTD
9.29 0.10 10.40 10.30
5383金利精密工業 Kenly Precision Industrial Co., LTD.
9.30 0.70 12.30 11.60
6118建達國際 Xander International Corp.
9.30 0.25 13.50 13.25
4114健喬信元醫藥生技 SYNMOSA BIOPHARMA CORPORATION
9.30 0.11 26.10 25.99
5478智冠科技 SOFT-WORLD INTERNATIONAL CORPORATION
10.06 6.50 72.50 65.67
5328華容 HUA JUNG COMPONENTS CO.,LTD.
10.13 0.09 7.63 7.38
5505和旺建設 HOWARM CONSTRUCTION CO,. LTD.
10.17 3.35 38.00 32.04
6603富強鑫精密工業 FU CHUN SHIN MACHINERY MANUFACTURE CO., LTD.
10.18 0.80 16.00 14.21
5516雙喜營造 SUN-SEA CONSTRUCTION CORPORATION
10.20 0.50 16.35 15.85
8933愛地雅工業 IDEAL BIKE CORPORATION
10.21 0.20 11.80 10.94
8096擎亞國際 CoAsia Microelectronics Corp.
11.02 1.03 50.30 43.44
5703亞都麗緻大飯店 The Landis Taipei Hotel Co., Ltd
11.03 0.25 24.75 24.50
3662樂陞科技 XPEC Entertainment Inc.
11.15 0.18 56.50 51.72
006201寶富櫃 Polaris / P-shares Taiwan Gre Tai 50 ETF
11.23 0.25 9.84 9.59

● 統計資料
104
100年度上櫃公司除權交易情形一覽表List of Ex-Right Trading Stocks in 2011
24
代號 Code
公司名稱 Name of Company
日期 Date
除權前參考價
(元)
Reference Price Before
Ex-Right(NT$)
除權後參考價
(元)
Reference Price AfterEx-Right(NT$)
每仟股配發或認購 Entitlement Per 1,000 Shares
無償股數 Gratuitous
Shares
有償 Non-Gratuitous
股數
Shares
每股認購金額
Subscription Price Per Share
8111立碁 LIGITEK ELECTRONICS CO.,LTD
1.04 24.90 24.42 132.60 21.50
3625西勝 C-TECH UNITED CORP.
1.05 24.50 21.92 326.40 16.00
1815富喬工業 FULLTECH FIBER GLASS CORP.
1.06 28.35 28.13 81.32 26.00
1784訊聯生物科技 BIONET CORP.
1.21 60.10 59.53 65.44 53.00
3455由田新技 CHZONE Co., Ltd.
4.21 64.60 62.66 122.36 50.00
8390金益鼎企業 IN YEEH DING ENTERPRISE CO.,LTD
4.21 43.15 42.11 102.22 34.00
9946金革科技 GO Digital Inc.
5.31 18.40 16.38 480.00 13.00
5706鳳凰國際旅行社 Phoenix Tours International, Inc.
6.02 108.50 70.00 550.00
3615安可光電 AimCore Technology Co., Ltd
6.08 166.80 148.91 80.00 121.54 112.00
8114振樺電子 POSIFLEX TECHNOLOGY, INC.
6.09 63.37 61.56 29.50
8074鉅橡企業 AURONA INDUSTRIES, INC
6.16 14.50 13.55 70.00
4126太平洋醫材 PACIFIC HOSPITAL SUPPLY CO., LTD.
6.23 127.00 114.21 112.00

105
代號 Code
公司名稱 Name of Company
日期 Date
除權前參考價
(元)
Reference Price Before
Ex-Right(NT$)
除權後參考價
(元)
Reference Price AfterEx-Right(NT$)
每仟股配發或認購 Entitlement Per 1,000 Shares
無償股數 Gratuitous
Shares
有償 Non-Gratuitous
股數
Shares
每股認購金額
Subscription Price Per Share
6175立敦科技 LITON TECHNOLOGY CORP.
6.27 30.15 29.73 122.97 27.00
5505和旺建設 HOWARM CONSTRUCTION CO,. LTD.
6.28 48.35 45.41 168.18 32.30
8287英格爾科技 ENG ELECTRIC CO., LTD.
6.29 146.42 110.01 330.98
4729熒茂光學 MILDEX OPTICAL INC.
7.04 50.30 48.36 165.92 39.00
3232昱捷 Sentronic International Corp.
7.05 16.10 15.59 253.42 14.00
8096擎亞國際科技 CoAsia Microelectronics Corp.
7.05 58.90 57.75 94.03 48.00
4139馬光保健探股 MA KUANG HEALTHCARE HOLDING LIMITED
7.07 89.90 83.36 78.00
3691碩禾電子材料 GIGASOLAR MATERIALS CORPORATION
7.11 704.00 541.54 300.00
6244茂迪 TECH INDUSTRIES INC
7.11 107.50 93.48 150.00
6603富強鑫精密工業 FU CHUN SHIN MACHINERY MANUFACTURE CO., LTD.
7.11 19.40 18.92 158.72 16.50
3324雙鴻科技 AURAS Technology Co.,Ltd.
7.11 27.30 26.32 98.40 18.87
9962有益鋼鐵 YEOU YIH STEEL CO., LTD.
7.12 19.70 17.13 150.00
8913華夏資融 HWA-HSIA LEASING & FINANCIAL CORPORATION
7.12 20.70 18.82 100.00

● 統計資料
106
代號 Code
公司名稱 Name of Company
日期 Date
除權前參考價
(元)
Reference Price Before
Ex-Right(NT$)
除權後參考價
(元)
Reference Price AfterEx-Right(NT$)
每仟股配發或認購 Entitlement Per 1,000 Shares
無償股數 Gratuitous
Shares
有償 Non-Gratuitous
股數
Shares
每股認購金額
Subscription Price Per Share
4426利勤實業 LI CHENG ENTERPRISE CO.,LTD.
7.13 14.30 13.36 70.00
4527堃霖冷凍機械 KUEN LING REFRIGERATING MACHINERY CO.,LTD.
7.14 13.90 13.63 20.00
4417金洲海洋科技 KING CHOU MARINE TECHNOLOGY CO., LTD
7.14 20.50 19.52 50.00
3444利機企業 NICHING INDUSTRIAL CORP.
7.14 30.60 27.82 100.00
6146耕興 SPORTON INTERNATIONAL INC.
7.15 64.86 64.53 5.00
6266泰詠電子 TOP UNION ELECTRONICS CORP.
7.18 12.07 11.35 63.00
3528安馳科技 ANSWER TECHNOLOGY CO., LTD.
7.18 34.67 31.85 89.00
3582凌耀科技 Capella Microsystems (Taiwan), Inc.
7.18 145.98 139.00 50.00
8383千附實業 CHEN FULL INTERNATIONAL CO., LTD.
7.19 25.30 24.33 40.00
6121新普科技 SIMPLO TCHNOLOGY CO.,LTD.
7.19 262.00 238.18 100.00
4128中天生物科技 MICROBIO CO.,LTD.
7.19 44.95 36.85 220.00
3556禾瑞亞科技 eGalax_eMPIA Technology Inc.
7.19 76.70 73.05 50.00
3416融程電訊 WinMate Communication INC.
7.19 59.00 56.19 50.00
8044網路家庭國際資訊 PChome online Inc.
7.19 192.72 165.84 162.00
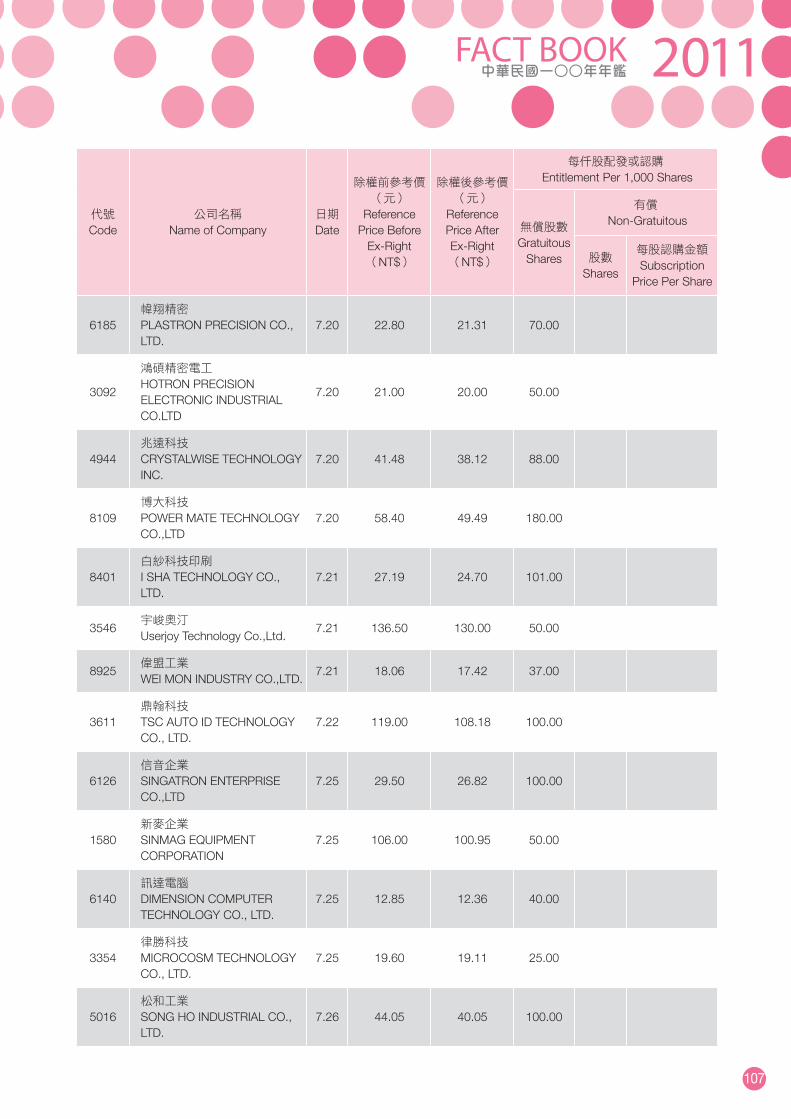
107
代號 Code
公司名稱 Name of Company
日期 Date
除權前參考價
(元)
Reference Price Before
Ex-Right(NT$)
除權後參考價
(元)
Reference Price AfterEx-Right(NT$)
每仟股配發或認購 Entitlement Per 1,000 Shares
無償股數 Gratuitous
Shares
有償 Non-Gratuitous
股數
Shares
每股認購金額
Subscription Price Per Share
6185幃翔精密 PLASTRON PRECISION CO., LTD.
7.20 22.80 21.31 70.00
3092
鴻碩精密電工 HOTRON PRECISION ELECTRONIC INDUSTRIAL CO.LTD
7.20 21.00 20.00 50.00
4944兆遠科技 CRYSTALWISE TECHNOLOGY INC.
7.20 41.48 38.12 88.00
8109博大科技 POWER MATE TECHNOLOGY CO.,LTD
7.20 58.40 49.49 180.00
8401白紗科技印刷 I SHA TECHNOLOGY CO., LTD.
7.21 27.19 24.70 101.00
3546宇峻奧汀 Userjoy Technology Co.,Ltd.
7.21 136.50 130.00 50.00
8925偉盟工業 WEI MON INDUSTRY CO.,LTD.
7.21 18.06 17.42 37.00
3611鼎翰科技 TSC AUTO ID TECHNOLOGY CO., LTD.
7.22 119.00 108.18 100.00
6126信音企業 SINGATRON ENTERPRISE CO.,LTD
7.25 29.50 26.82 100.00
1580新麥企業 SINMAG EQUIPMENT CORPORATION
7.25 106.00 100.95 50.00
6140訊達電腦 DIMENSION COMPUTER TECHNOLOGY CO., LTD.
7.25 12.85 12.36 40.00
3354律勝科技 MICROCOSM TECHNOLOGY CO., LTD.
7.25 19.60 19.11 25.00
5016松和工業 SONG HO INDUSTRIAL CO., LTD.
7.26 44.05 40.05 100.00

● 統計資料
108
代號 Code
公司名稱 Name of Company
日期 Date
除權前參考價
(元)
Reference Price Before
Ex-Right(NT$)
除權後參考價
(元)
Reference Price AfterEx-Right(NT$)
每仟股配發或認購 Entitlement Per 1,000 Shares
無償股數 Gratuitous
Shares
有償 Non-Gratuitous
股數
Shares
每股認購金額
Subscription Price Per Share
3632研勤科技 PAPAGO INC.
7.26 91.20 84.44 80.00
8210勤誠興業 CHENBRO MICOM CO., LTD.
7.27 43.20 41.70 36.00
5904寶雅國際 Poya Co., Ltd.
7.27 45.60 45.15 10.00
3390旭軟電子科技 SUNFLEX TECH. CO., Ltd.
7.27 45.90 41.73 100.00
5213亞昕國際開發 YeaShin International Development Co., Ltd.
7.27 44.20 42.74 93.02 31.00
2063世鎧精密 SHEH KAI PRECISION CO.,LTD
7.28 71.10 59.25 200.00
6218豪勉科技 Hauman Technologies Corp.
7.28 46.00 40.00 150.00
4105台灣東洋藥品工業 TTY BIOPHARM COMPANY LIMITED
7.29 157.74 127.83 234.00
3213茂訊電腦 Mildef Crete Inc.
8.01 66.50 57.83 150.00
8917欣泰石油氣 HSIN TAI GAS CO., LTD.
8.01 45.30 42.34 70.00
3484崧騰企業 SOLTEAM ELECTRONICS CO.,LTD.
8.01 25.50 24.06 59.86
5511德昌營造 TE CHANG CONSTRUCTION CO., LTD.
8.01 24.60 21.21 160.00
5403中菲電腦 DIMERCO DATA SYSTEM CORPORATION
8.01 20.56 20.14 21.00
1742台灣蠟品 TAIWAN WAX COMPANY,LTD.
8.02 40.50 31.64 280.00

109
代號 Code
公司名稱 Name of Company
日期 Date
除權前參考價
(元)
Reference Price Before
Ex-Right(NT$)
除權後參考價
(元)
Reference Price AfterEx-Right(NT$)
每仟股配發或認購 Entitlement Per 1,000 Shares
無償股數 Gratuitous
Shares
有償 Non-Gratuitous
股數
Shares
每股認購金額
Subscription Price Per Share
3291遠翔科技 Feeling Technology Corp.
8.02 29.80 28.52 45.00
3221台灣嘉碩科技 TAI-SAW TECHNOLOGY CO.,LTD.
8.02 15.95 15.34 40.00
8255朋程科技 ACTRON TECHNOLOGY CORPORATION
8.02 115.00 102.50 100.00 80.11 80.00
5609中菲行航空貨運承攬 Dimerco Express(Taiwan)Corporation
8.02 23.10 22.39 31.52
3526凡甲科技 ALLTOP TECHNOLOGY CO.,LTD
8.02 55.25 50.23 100.00
3553力積電子 Zentel Electronic Corporation
8.02 27.20 24.50 109.97
5349先豐通訊 BOARDTEK ELECTRONICS COR.
8.02 26.90 26.21 26.38
5013強新工業 NEW BEST WIRE INDUSTRIAL CO.,LTD
8.03 18.50 16.52 120.00
6245立端科技 Lanner Electronics Inc.
8.03 23.35 22.99 15.43
8086宏捷科技 ADVANCED WIRELESS SEMICONDUCTOR COMPANY
8.03 29.65 28.78 30.08
3563牧德科技 MACHVISION,INC
8.04 68.65 57.21 200.00
4716大立高分子工業 DAILY POLYMER CORP.
8.04 27.20 25.19 80.00
3236千如電機 ABC TAIWAN ELECTRONICS CORP.
8.04 16.35 15.42 60.00
5310天剛資訊 CGS INTERNATIONAL INC.
8.04 40.00 34.78 150.00

● 統計資料
110
代號 Code
公司名稱 Name of Company
日期 Date
除權前參考價
(元)
Reference Price Before
Ex-Right(NT$)
除權後參考價
(元)
Reference Price AfterEx-Right(NT$)
每仟股配發或認購 Entitlement Per 1,000 Shares
無償股數 Gratuitous
Shares
有償 Non-Gratuitous
股數
Shares
每股認購金額
Subscription Price Per Share
6609台灣瀧澤科技 TAIWAN TAKISAWA TECHNOLOGY CO., LTD.
8.04 22.20 21.88 135.67 20.00
4102永日化學工業 YUNG ZIP CHEMICAL IND. CO., LTD.
8.04 76.60 72.95 50.00
3118進階生物科技 LEVEL BIOTECHNOLOGY INC.
8.05 37.05 35.29 50.00
5483中美矽晶製品 Sino-American Silicon Products Inc.
8.05 77.00 73.33 50.00
3631晟楠科技 Chernan Metal Industrial Corp.
8.05 54.80 50.64 82.25
6177達麗建設事業 DA-LI CONSTRUCTION CO., LTD.
8.08 31.69 25.20 257.67
8403盛弘醫藥 SHAREHOPE MEDICINE CO., LTD.
8.08 40.50 39.32 30.00
6024群益期貨 CAPITAL FUTURES CORP.
8.08 26.45 24.27 90.00
5514三豐建設 SUNFON CONSTRUCTION CO., LTD.
8.08 27.50 25.23 90.00
6150撼訊科技 Tul Corporation
8.08 25.00 23.36 70.00
1785光洋應用材料科技 Solar Applied Materials Technology Corp.
8.08 65.80 52.64 250.00
5529志嘉建設 Well Glory Development CO.,LTD.
8.08 12.55 11.41 100.00
4946紅心辣椒娛樂科技 Cayenne Entertainment Technology Co.,Ltd.
8.08 96.90 88.09 100.00
6182合晶科技 WAFER WORKS CORP.
8.09 32.15 31.21 30.00

111
代號 Code
公司名稱 Name of Company
日期 Date
除權前參考價
(元)
Reference Price Before
Ex-Right(NT$)
除權後參考價
(元)
Reference Price AfterEx-Right(NT$)
每仟股配發或認購 Entitlement Per 1,000 Shares
無償股數 Gratuitous
Shares
有償 Non-Gratuitous
股數
Shares
每股認購金額
Subscription Price Per Share
4909新復興微波通訊 NEW ERA ELECTRONICS CO., LTD
8.09 33.15 30.14 100.00
5009榮剛材料科技 GLORIA MATERIAL TECHNOLOGY CORP
8.09 31.15 29.78 45.88
4528江興鍛壓工業 CHIAN HSING FORGING INDUSTRIAL CO.,LTD.
8.09 16.70 16.21 30.00
6261久元電子 YOUNGTEK ELECTRONICS CORPORATION
8.09 65.63 65.02 9.34
4121優盛醫學科技 ROSSMAX INTERNATIONAL LTD.
8.10 15.80 15.19 40.00
3541西柏科技 Cypress Technology CO.,LTD.
8.11 23.65 21.50 100.00
3264欣銓科技 Ardentec Corporation
8.11 18.90 18.71 10.00
6143振曜科技 NETRONIX,INC.
8.11 34.90 30.35 150.00
5452佶優科技 UNIC TECHNOLOGY CORP.
8.11 13.75 12.91 65.20
3206志豐電子 KINGSTATE ELECTRONICS CORP.
8.11 22.70 22.25 20.00
1558伸興工業 ZENG HSING INDUSTRIAL CO., LTD.
8.15 108.80 105.63 30.00
8079誠遠科技 TEST-SERV INC.
8.15 19.83 18.03 100.00
3587閎康科技 Materials Analysis Technology Inc.
8.15 28.14 26.59 58.37
8390金益鼎企業 JIIN YEEH DING ENTERPRISE CO.,LTD
8.15 43.03 41.92 26.46

● 統計資料
112
代號 Code
公司名稱 Name of Company
日期 Date
除權前參考價
(元)
Reference Price Before
Ex-Right(NT$)
除權後參考價
(元)
Reference Price AfterEx-Right(NT$)
每仟股配發或認購 Entitlement Per 1,000 Shares
無償股數 Gratuitous
Shares
有償 Non-Gratuitous
股數
Shares
每股認購金額
Subscription Price Per Share
3389志遠
TECHMOSA INTERNATIONAL INC.
8.15 26.00 25.49 20.00
3162精確實業 UNITED ALLOY-TECH COMPANY LTD
8.15 9.83 9.56 27.89
6279胡連精密 HU LANE ASSOCIATE INC.
8.15 56.51 53.83 49.81
6125廣運機械工程 KENMEC MECHANICAL ENGINEERING CO.,LTD.
8.15 20.39 19.50 45.48
9960邁達康網路事項 DACOME INTERNATIONAL LTD.
8.16 23.50 22.60 40.00
5410國眾電腦 LEO SYSTEMS, INC.
8.16 13.82 13.05 59.00
5392應華精密 AVY Precision Technology INC.
8.16 77.50 73.81 50.00
8289泰藝電子 TAITIEN ELECTRONICS CO., LTD.
8.16 17.10 16.76 20.00
5491連展科技 ANCED-CONNECTEK INC.
8.16 11.00 10.89 10.00
3227原相科技 PixArt Imaging Inc.
8.17 66.00 65.34 10.00
8240華宏新技 WAH HONG INDUSTRIAL CORP.
8.17 57.70 57.01 129.30 53.00
5519隆大營建事業 LongDa Construction & Development Corporation
8.18 51.50 40.60 268.57
8121越峰電子材料 Acme Electronics Corporation
8.18 83.02 59.58 393.46
8929富堡工業 Fu Burg Industrial Co., Ltd.
8.18 28.75 28.19 20.00

113
代號 Code
公司名稱 Name of Company
日期 Date
除權前參考價
(元)
Reference Price Before
Ex-Right(NT$)
除權後參考價
(元)
Reference Price AfterEx-Right(NT$)
每仟股配發或認購 Entitlement Per 1,000 Shares
無償股數 Gratuitous
Shares
有償 Non-Gratuitous
股數
Shares
每股認購金額
Subscription Price Per Share
4123晟德大藥廠 Center Laboratories, Inc.
8.18 45.60 40.53 125.00
8234新漢電腦 NEXCOM International Co., LTD.
8.18 34.30 31.18 99.95
6008凱基證券 KGI Securities Co. LTD.
8.18 14.00 13.73 19.81
6208日揚科技 HIGHLIGHT TECH CORP.
8.19 18.60 18.15 25.00
9949琉園 TITTOT CO.,LTD.
8.19 25.20 24.23 40.00
6221晉泰科技 Genesis Technology, Inc.
8.22 15.21 14.91 19.77
3402漢科系統科技 Wholetech System Hitech Limited
8.23 20.60 18.18 133.44
5483中美矽晶製品 Sino-American Silicon Products Inc.
8.23 58.00 57.91 35.45 56.00
4138曜亞國際 DYNAMIC MEDICAL TECHNOLOGIES INC.
8.23 130.00 130.00 99.06 130.00
3284太普高精密影像 TOP HIGH IMAGE CORP.
8.24 11.30 11.19 10.00
5512力麒建設 RICH DEVELOPMENT CO.,LTD.
8.24 15.04 13.79 91.23
6217中國探針 C.C.P.CONTACT PROBES CO.,LTD
8.25 23.90 23.20 29.97
6173信昌電子陶瓷 PROSPERITY DIELECTRICS CO., LTD.
8.25 15.30 13.78 110.00
6122擎邦國際科技工程 KING POLYTECHNIC ENGINEERING CO.,LTD.
8.25 19.65 18.54 60.00

● 統計資料
114
代號 Code
公司名稱 Name of Company
日期 Date
除權前參考價
(元)
Reference Price Before
Ex-Right(NT$)
除權後參考價
(元)
Reference Price AfterEx-Right(NT$)
每仟股配發或認購 Entitlement Per 1,000 Shares
無償股數 Gratuitous
Shares
有償 Non-Gratuitous
股數
Shares
每股認購金額
Subscription Price Per Share
5820日盛金融控股 JIH SUN FINANCIAL HOLDING CO., LTD
8.26 10.25 9.47 82.17
8048德勝科技 RUBY TECH CORPORATION
8.26 12.10 11.86 20.00
1584精剛精密科技 S-Tech Corp
8.29 32.10 31.47 19.93
2636台驊國際 .H.I. GROUP LTD.
8.30 28.29 26.92 50.91
6021大慶證券 TA CHING SECURI TIES CO., LTD
8.30 14.30 13.00 100.00
4721美琪瑪國際 MECHEMA CHEMICALS INT CORP.
8.30 24.65 23.77 37.00
8111立碁電子工業 LIGITEK ELECTRONICS CO.,LTD
8.30 11.50 10.95 50.29
3268海德威電子工業 Higher Way Electronic Co., Ltd.
9.01 13.10 12.65 313.05 11.50
4111濟生化學製藥廠 CHI SHENG CHEMICAL CORPORATION
9.01 20.70 20.29 20.00
5102富強輪胎工廠 FU-CHIAN TIRE CO.,LTD
9.02 27.35 26.05 50.00
3687茂為歐買尬數位科技 MacroWell OMG Digital Entertainment Co., Ltd.
9.05 257.50 214.58 200.00
8908欣雄天然氣 SHINHSIUNG NATURAL GAS INC.
9.05 23.80 20.88 140.00
3388崇越電通 TOPCO TECHNOLOGIES CORP.
9.06 68.50 67.63 90.80 60.00
6016康和綜合證券 Concord Securities Co.,Ltd.
9.07 7.28 7.17 15.08

115
代號 Code
公司名稱 Name of Company
日期 Date
除權前參考價
(元)
Reference Price Before
Ex-Right(NT$)
除權後參考價
(元)
Reference Price AfterEx-Right(NT$)
每仟股配發或認購 Entitlement Per 1,000 Shares
無償股數 Gratuitous
Shares
有償 Non-Gratuitous
股數
Shares
每股認購金額
Subscription Price Per Share
4429聚紡 G-FUN INDUSTRIAL CORPORATION
9.08 45.05 43.95 223.46 40.00
3289宜特科技 INTEGRATED SERVICE TECHNOLOGY INC.
9.13 29.65 29.07 20.00
4908前鼎光電 APAC Opto Electronics Inc.
9.13 26.40 25.14 50.00
5014建錩實業 Chain Chon Industrial Co., Ltd.
9.14 9.46 9.10 40.00
6207雷科 LASER TEK TAIWAN CO.,LTD.
9.14 40.14 36.45 101.20
6506雙邦實業 Shuang-Bang Industrial Corp.
9.15 14.90 14.33 40.00
3207耀勝電子 YAO SHENG ELECTRONIC CO., LTD.
9.15 11.50 11.17 30.00
4207環泰企業 TAIWAN FRUCTOSE CO., LTD.
9.15 10.40 9.95 45.00
1815富喬工業 FULLTECH FIBER GLASS CORP.
9.15 19.46 19.08 19.87
6508惠光化學 Huikwang Corporation
9.15 25.50 25.00 20.00
3078僑威科技 CHANNEL WELL TECHNOLOGY CO.,LTD
9.20 11.91 11.09 73.90
3552同致電子企業 TUNG THIH ELECTRONIC CO., LTD.
9.22 62.64 52.83 185.85
8927北基加油站 North-Star Petroleum Co.,LTD.
9.22 15.55 15.15 26.17
4109加捷科技事業 CHIA JEI TECHNOLOGY BUSINESS CO., LTD.
9.23 18.25 17.23 59.31

● 統計資料
116
代號 Code
公司名稱 Name of Company
日期 Date
除權前參考價
(元)
Reference Price Before
Ex-Right(NT$)
除權後參考價
(元)
Reference Price AfterEx-Right(NT$)
每仟股配發或認購 Entitlement Per 1,000 Shares
無償股數 Gratuitous
Shares
有償 Non-Gratuitous
股數
Shares
每股認購金額
Subscription Price Per Share
8936國統國際 KUO TOONG INTERNATIONAL CO.,LTD.
9.26 33.90 30.97 94.50
1569濱川企業 Bin Chuan Enterprise Co., Ltd.
9.26 53.24 52.75 9.44
5213亞昕國際開發 YeaShin International Development Co., Ltd.
9.26 33.48 24.77 351.72
6509聚和國際 TAIWAN HOPAX CHEMS.MFG.CO.,LTD.
9.27 12.05 11.81 20.00
5351鈺創科技 Etron Technology, Inc.
9.27 9.65 9.46 20.16
5355佳總興業 GIA TZOONG ENTERPRISE CO.,LTD
9.27 9.60 9.63 64.23 10.00
8050廣積科技 IBASE TECHNOLOGY INC.
9.29 35.05 34.01 30.48
8354冠郝企業 KOAN HAO ENTERPRISE CO.,LTD
9.29 10.30 9.90 40.00
5383金利精密工業 Kenly Precision Industrial Co., LTD.
9.30 11.60 11.26 30.00
4114健喬信元醫藥生技 SYNMOSA BIOPHARMA CORPORATION
9.30 25.99 24.69 52.70
5478
智冠科技 SOFT-WORLD INTERNATIONAL CORPORATION
10.06 66.00 65.67 5.00
5328華容 HUA JUNG COMPONENTS CO.,LTD.
10.13 7.54 7.38 21.65
4743合一生技 ONENESS BIOTECH CO., LTD.
10.13 19.35 18.52 44.90

117
代號 Code
公司名稱 Name of Company
日期 Date
除權前參考價
(元)
Reference Price Before
Ex-Right(NT$)
除權後參考價
(元)
Reference Price AfterEx-Right(NT$)
每仟股配發或認購 Entitlement Per 1,000 Shares
無償股數 Gratuitous
Shares
有償 Non-Gratuitous
股數
Shares
每股認購金額
Subscription Price Per Share
5505和旺建設 HOWARM CONSTRUCTION CO,. LTD.
10.17 34.65 32.04 81.61
6603富強鑫精密工業 FU CHUN SHIN MACHINERY MANUFACTURE CO., LTD.
10.18 15.20 14.21 70.00
4402福大棉業 FU-TA TEXTILE CO., LTD.
10.19 10.15 10.12 223.27 10.00
8933愛地雅 IDEAL BIKE CORPORATION
10.21 11.60 10.94 59.99
1788杏昌生技 Hi-Clearance Inc.
10.24 85.90 83.29 147.45 70.00
3218大學光學科技 UNIVERSAL VISION BIOTECHNOLOGY CO., LTD.
10.24 27.35 26.67 343.69 25.10
5536聖暉工程科技 ACTER CO.,LTD.
10.27 121.00 117.56 83.06 86.50
8096擎亞國際科技 CoAsia Microelectronics Corp.
11.02 49.27 43.44 134.22
1566毅金工業 YIN KING INDUSTRIAL CO.,LTD.
11.03 15.45 14.96 133.30 12.00
5475德宏工業 GLOTECH INDUSTRIAL CORP
11.10 10.70 10.18 50.68
3662樂陞科技 XPEC Entertainment Inc.
11.15 56.32 51.72 88.89
3290東浦精密光電 DONPON PRECISION INC.
11.16 21.75 21.54 107.64 20.00
6140訊達電腦 DIMENSION COMPUTER TECHNOLOGY CO., LTD.
11.18 13.00 12.47 161.85 10.00
1584精剛精密 S-Tech Corp
11.24 22.40 22.30 96.16 21.50
4523永彰機電 Taiwan Calsonic Co.,Ltd
12.02 50.00 47.81 138.89 36.00

● 統計資料
118
100年度櫃檯買賣市場信用交易成交值占市場總成交值比率表Margin Trading to Total Market Turnover on GTSM in 2011
25
單位:億元
Unit : NT$100Million
年/月
Yr / Mo總成交值(A)
Total Trading Value
較前一期增減變化
(%)
Change From Previous Month
信用交易(B)Margin Trading
較前一期增減變化
(%)
Change From Previous Month
(B)/ 2(A)(%)
2011 39,930.3 - 20,598.5 - 25.79
2011 / 01 4,044.9 -22.67 2,132.0 -27.71 26.35
2011 / 02 3,027.9 -25.14 1,557.7 -26.94 25.72
2011 / 03 5,237.0 72.96 2,801.2 79.83 26.74
2011 / 04 3,753.0 -28.34 1,805.8 -35.53 24.06
2011 / 05 4,251.2 13.27 2,199.4 21.80 25.87
2011 / 06 3,703.4 -12.89 1,922.2 -12.60 25.95
2011 / 07 3,535.9 -4.52 1,804.7 -6.11 25.52
2011 / 08 3,448.7 -2.47 1,768.3 -2.02 25.64
2011 / 09 2,479.1 -28.11 1,287.6 -27.18 25.97
2011 / 10 2,233.3 -9.91 1,190.2 -7.56 26.65
2011 / 11 2,474.4 10.80 1,282.9 7.79 25.92
2011 / 12 1,741.4 -29.62 846.3 -34.03 24.30
註:(B)欄信用交易成交值,不含94年11月14日起實施之資券相抵成交值。Note:Margin trading values in column(B)do not include the value of margin purchase and short selling offset implemented since November 14, 2005.

119
100年度櫃檯買賣市場融資及融券餘額成長表Changes of Margin Trading and Securities Loan Balance on GTSM in 2011
26
年/月
Yr / Mo
融資餘額(億元)
Margin Balance(NT$100 Million)
較前一期增減變化
(%)
Change From Previous Month
融券餘額(仟股)
Securities Loan Balance
(1,000 shares)
較前一期增減變化(%)
Change From Previous Month
2011 / 01 654.4 - 84,296 -
2011 / 02 654.3 -0.02 82,097 -2.61
2011 / 03 644.0 -1.57 50,164 -38.90
2011 / 04 627.8 -2.52 43,710 -12.87
2011 / 05 632.0 0.67 79,125 81.02
2011 / 06 610.0 -3.48 70,681 -10.67
2011 / 07 579.7 -4.97 63,378 -10.33
2011 / 08 472.7 -18.46 80,874 27.61
2011 / 09 441.9 -6.52 83,803 3.62
2011 / 10 431.5 -2.35 98,620 17.68
2011 / 11 376.4 -12.77 84,856 -13.96
2011 / 12 348.1 -7.52 91,558 7.90

● 統計資料
120
100年度本國興櫃股票新登錄公司彙總表New Registered of Domestic Stocks on Emerging Market Board in 2011
1
興櫃股票市場 Emerging Stock Market
代號
Code公司名稱
Name of Company推薦證券商
Recommending Securities Firms
資本額(億元)
Capital Issued(NT$100 Million)
掛牌日期
Date of Listing
4996智盛全球
Innovation & Infinity Global Corp.
凱基、群益金鼎、玉山綜合
KGI Securities Co., Ltd.、Capital Securities Corp.、E.SUN SECURITIES CORP.
6.8 20110111
4973廣穎電通
Silicon Power Computer & Communications Inc.
群益金鼎、台新、元富、大眾
Capital Securities Corp.、Taishin Securities Co., Ltd.、MasterLink Securities Corp.、Ta Chong Securities Corp.
4.5 20110111
3428光燿科技
GLORY SCIENCE CO., LTD
福邦、台新
Gfortune Securities Co., Ltd.、Taishin Securities Co., Ltd.
0.6 20110117
4976佳凌科技
CALIN TECHNOLOGY CO., LTD.
元大、兆豐、元富
Yuanta Core Pacific Securities Co., Ltd.、Mega Securities Co., Ltd.、MasterLink Securities Corp.
9.0 20110124
5217旭泓全球光電
Sunrise Global Solar EnergyCo.,Ltd
大華、凱基、群益金鼎
Grand Cathay Securities Corp.、KGI Securities Co., Ltd.、Capital Securities Corp.
15.9 20110124
4989李長榮科技
Lee Chang Yung Technology Corporation
富邦、大華、群益金鼎、寶來
Fubon Securities Co., Ltd.、Grand Cathay Securities Corp.、Capital Securities Corp.、Polaris Securities Co., Ltd.
6.0 20110125
1259安心食品服務
AN-SHIN FOOD SERVICES CO.,LTD.
群益金鼎、元大、寶來
Capital Securities Corp.、Yuanta Core Pacific Securities Co., Ltd.、Polaris Securities Co., Ltd.
2.2 20110126
1816
富元精密鍍膜
BUWON ADVANCED COATING TECHNOLOGY CO., LTD
第一金、寶來
First Securities Inc.、Polaris Securities Co., Ltd.
4.6 20110127

121
代號
Code公司名稱
Name of Company推薦證券商
Recommending Securities Firms
資本額(億元)
Capital Issued(NT$100 Million)
掛牌日期
Date of Listing
4997齊瀚光電
LUSTROUS TECHNOLOGY LTD
凱基、寶來、兆豐
KGI Securities Co., Ltd.、Polaris Securities Co., Ltd.、Mega Securities Co., Ltd.
2.6 20110221
3663
鑫科材料科技股份有限
公司
THINTECH MATERIALS TECHNOLOGY CO., LTD.
大華、台新
Grand Cathay Securities Corp.、Taishin Securities Co., Ltd.
4.9 20110225
4972湯石照明科技
TONS LIGHTOLOGY INC.
宏遠、元大、兆豐、群益金鼎
Horizon Securities Co., Ltd.、Yuanta Core Pacific Securities Co., Ltd.、Mega Securities Co., Ltd.、Capital Securities Corp.
2.6 20110225
5221合晶光電
Wafer Works Optronics Corp.
凱基、富邦、台新
KGI Securities Co., Ltd.、Fubon Securities Co., Ltd.、Taishin Securities Co., Ltd.
5.5 20110301
8431匯鑽科技
Superior Plating Technology Co., Ltd.
大華、台新、中國信託綜合、寶來
Grand Cathay Securities Corp.、Taishin Securities Co., Ltd.、Chinatrust Securities Co., Ltd.、Polaris Securities Co., Ltd.
3.6 20110304
1597直得科技
CHIEFTEK PRECISION Co., LTD.
第一金、兆豐、華南永昌
First Securities Inc.、Mega Securities Co., Ltd.、Hua Nan Entrust Securities Ltd. Co.
3.8 20110310
5216晶讚光電
Glory Praise Photronics Corp.
福邦、富邦
Gfortune Securities Co., Ltd.、Fubon Securities Co., Ltd.
3.6 20110315
8416實威國際
Soild Wizard Technology Co., Ltd.
元富、統一、群益金鼎
MasterLink Securities Corp.、President Securities Corp.、Capital Securities Corp.
2.1 20110325

● 統計資料
122
代號
Code公司名稱
Name of Company推薦證券商
Recommending Securities Firms
資本額(億元)
Capital Issued(NT$100 Million)
掛牌日期
Date of Listing
3357西北臺慶科技
TAI-TECH Advanced Electronics Co.,Ltd.
第一金、大華、凱基、統一
First Securities Inc.、Grand Cathay Securities Corp.、KGI Securities Co., Ltd.、President Securities Corp.
7.8 20110406
1339昭輝實業
Y.C.C. PARTS MFG. CO., LTD.
統一、臺銀綜合、台灣工銀、元大
President Securities Corp.、 BankTaiwan Securities Co.,Ltd.、IBT Securities Co., Ltd.、Yuanta Core Pacific Securities Co., Ltd.
5.7 20110412
5226太一節能系統
Top Energy Saving System Corp.
國泰、大眾
Cathay Securities Corporation、Ta Chong Securities Corp.
2.3 20110420
5231鑫晶鑽科技
Alpha Crystal Technology Co., Ltd.
第一金、凱基、富邦、元大
First Securities Inc.、KGI Securities Co., Ltd.、Fubon Securities Co., Ltd.、Yuanta Core Pacific Securities Co., Ltd.
6.4 20110425
5229立宇高新科技
Liyu Technology Co., Ltd.
富邦、台新、宏遠
Fubon Securities Co., Ltd.、Taishin Securities Co., Ltd.、Horizon Securities Co., Ltd.
6.1 20110427
2727王品餐飲
WOWPRIME CORP.
永豐金、群益金鼎、台新、中國信託
SinoPac Securities Corp.、Capital Securities Corp.、Taishin Securities Co., Ltd.、Chinatrust Securities Co., Ltd.
6.2 20110429
3658漢民微測
Hermes Microvision, Inc.
永豐金、台灣工銀
SinoPac Securities Corp.、IBT Securities Co., Ltd.
6.0 20110429
5230雷笛克光學
LEDLINK OPTICS, INC.
元大、群益金鼎、永豐金
Yuanta Core Pacific Securities Co., Ltd.、Capital Securities Corp.、SinoPac Securities Corp.
2.1 20110503
2235謚源實業
I YUAN PRECISION IND CO.,LTD.
統一、日盛
President Securities Corp.、Jih Sun Securities Co., Ltd.
2.6 20110512
3475富晶電子
Fortune Semiconductor Corporation
統一、國票、群益金鼎、致和
President Securities Corp.、Waterland Securities Co., 、Capital Securities Corp.、Concord International Securities Co., Ltd.
6.2 20110512

123
代號
Code公司名稱
Name of Company推薦證券商
Recommending Securities Firms
資本額(億元)
Capital Issued(NT$100 Million)
掛牌日期
Date of Listing
5234達興材料
Daxin Materials Corporation
大華、永豐金、兆豐、富邦
Grand Cathay Securities Corp.、SinoPac Securities Corp.、Mega Securities Co., Ltd.、Fubon Securities Co., Ltd.
7.9 20110512
1783和康生物科技
MAXIGEN BIOTECH INC.
第一金、日盛、凱基
First Securities Inc.、Jih Sun Securities Co., Ltd.、KGI Securities Co., Ltd.
5.0 20110518
8155博智電子
ALLIED CIRCUIT CO.,LTD
大華、第一金、華南永昌
Grand Cathay Securities Corp.、First Securities Inc.、Hua Nan Entrust Securities Ltd. Co.
3.4 20110520
4999鑫禾科技
Sinher Technology Inc.
兆豐、富邦、福邦
Mega Securities Co., Ltd.、Fubon Securities Co., Ltd.、Gfortune Securities Co., Ltd.
3.1 20110524
8432東生華製藥
Tsh biopharm corporation limited
元富、統一、凱基、元大
MasterLink Securities Corp.、President Securities Corp.、KGI Securities Co., Ltd.、Yuanta Core Pacific Securities Co., Ltd.
2.5 20110616
5240建騰創達科技
ACTi Corporation
凱基、元大
KGI Securities Co., Ltd.、Yuanta Core Pacific Securities Co., Ltd.
3.5 20110622
5233有量科技
Amita Technologies,Inc.
永豐金、國泰、富邦
SinoPac Securities Corp.、Cathay Securities Corporation、Fubon Securities Co., Ltd.
4.3 20110628
5238威力能源
Power Source Energy Co., Ltd.
第一金、台新、凱基、兆豐
First Securities Inc.、Taishin Securities Co., Ltd.、KGI Securities Co., Ltd.、Mega Securities Co., Ltd.
4.4 20110708
4160創源
Genesis Genetics Asia
寶來、華南永昌
Polaris Securities Co., Ltd.、Hua Nan Entrust Securities Ltd. Co.
2.0 20110715
2640台灣大車隊
TaiwanTaxi
群益金鼎、福邦、統一
Capital Securities Corp.、Gfortune Securities Co., Ltd.、President Securities Corp.
2.4 20110725
5239宏鈺半導體
Fitilink lntegrated technology Inc.
華南永昌、統一、富邦、群益金鼎
Hua Nan Entrust Securities Ltd. Co.、President Securities Corp.、Fubon Securities Co., Ltd.、Capital Securities Corp.
2.8 20110728

● 統計資料
124
代號
Code公司名稱
Name of Company推薦證券商
Recommending Securities Firms
資本額(億元)
Capital Issued(NT$100 Million)
掛牌日期
Date of Listing
4161聿新科
BIOPTIK TECHNOLOGY, INC
福邦、第一金
Gfortune Securities Co., Ltd.、First Securities Inc.
3.3 20110729
4975福聚太陽能
TAIWAN POLYSILICON CORPORATION
富邦、群益金鼎、大華、宏遠、台新
Fubon Securities Co., Ltd.、Capital Securities Corp.、Grand Cathay Securities Corp.、Horizon Securities Co., Ltd.、Taishin Securities Co., Ltd.
60.7 20110819
1817凱撒衛浴
SANITAR CO., LTD.
中國信託、德信
Chinatrust Securities Co., Ltd.、Reliance Securities Co., Ltd.
6.5 20110822
5245智晶光電
WISECHIP SEMICONDUCTOR INC.
國票、台新
Waterland Securities Co.,、Taishin Securities Co., Ltd.
3.6 20110829
4431敏成
Mytrex Industries, Inc.
群益金鼎、大華、日盛
Capital Securities Corp.、Grand Cathay Securities Corp.、Jih Sun Securities Co., Ltd.
1.2 20110830
4162智擎
PharmaEngine, Inc.
元富、大華、日盛、台灣工銀
MasterLink Securities Corp.、Grand Cathay Securities Corp.、Jih Sun Securities Co., Ltd.、IBT Securities Co., Ltd.
7.4 20110901
5247映相科技
Ying Shiang Technology Co., Ltd.
統一、台新
President Securities Corp.、Taishin Securities Co., Ltd.
5.0 20110902
3377健格科技
CONTROLNET INTERNATIONAL INC
元富、日盛
MasterLink Securities Corp.、Jih Sun Securities Co., Ltd.
1.0 20110906
4432銘旺實業
Hakers Enterprise Co., LTD.
永豐金、第一金、元大、群益金鼎
SinoPac Securities Corp.、First Securities Inc.、Yuanta Core Pacific Securities Co., Ltd.、Capital Securities Corp.
3.5 20110906
4922旭能光電
Sunner Solar CORP.
群益金鼎、華南永昌、國票
Capital Securities Corp.、Hua Nan Entrust Securities Ltd. Co.、Waterland Securities Co.,
27.8 20110906
5248景傳光電
Pixon Technologies Corporation
台新、大華
Taishin Securities Co., Ltd.、Grand Cathay Securities Corp.
1.7 20110906

125
代號
Code公司名稱
Name of Company推薦證券商
Recommending Securities Firms
資本額(億元)
Capital Issued(NT$100 Million)
掛牌日期
Date of Listing
8433弘帆
BON FAME CO., LTD.
富邦、國泰、群益金鼎、元富、第一金
Fubon Securities Co., Ltd.、Cathay Securities Corporation、Capital Securities Corp.、MasterLink Securities Corp.、First Securities Inc.
6.0 20110909
4156賽德醫藥
CytoPharm,Inc.
華南永昌、宏遠、群益金鼎、元大
Hua Nan Entrust Securities Ltd. Co.、Horizon Securities Co., Ltd.、Capital Securities Corp.、Yuanta Core Pacific Securities Co., Ltd.
4.1 20110913
5242佳晶科技
Procrystal Technology Co., Ltd.
元大、第一金、福邦
Yuanta Core Pacific Securities Co., Ltd.、First Securities Inc.、Gfortune Securities Co., Ltd.
7.2 20110913
2729瓦城泰統
TTFB COMPANY LIMITED
群益金鼎、台新
Capital Securities Corp.、Taishin Securities Co., Ltd.
1.8 20110916
5250奇岩電子
MOAI ELECTRONICS CORPORATION
統一、日盛、德信、大眾
President Securities Corp.、Jih Sun Securities Co., Ltd.、Reliance Securities Co., Ltd.、Ta Chong Securities Corp.
2.5 20110929
5251天鉞電子
JSW PACIFIC CORPORATION
第一金、大眾
First Securities Inc.、Ta Chong Securities Corp.
2.0 20111004
1599宏佳騰動力科技
AEON MOTOR CO.,LTD.
統一、致和
President Securities Corp.、Concord International Securities Co., Ltd.
2.3 20111005
4164承業
Cheng Yeh Holdings Co., Ltd.
元大、國泰、國票、富邦
Yuanta Core Pacific Securities Co., Ltd.、Cathay Securities Corporation、Waterland Securities Co., 、Fubon Securities Co., Ltd.
10.8 20111018
4536拓凱實業
TOPKEY CORPORATION
永豐金、兆豐、富邦
SinoPac Securities Corp.、Mega Securities Co., Ltd.、Fubon Securities Co., Ltd.
8.2 20111020
2064晉椿工業
CAMELLIA METAL CO.,LTD.
群益金鼎、國票、第一金
Capital Securities Corp.、Waterland Securities Co., 、First Securities Inc.
6.2 20111021

● 統計資料
126
代號
Code公司名稱
Name of Company推薦證券商
Recommending Securities Firms
資本額(億元)
Capital Issued(NT$100 Million)
掛牌日期
Date of Listing
1598岱宇國際
Dyaco International Inc.
國泰、永豐金、亞東、德信
Cathay Securities Corporation、SinoPac Securities Corp.、Oriental Securities Corporation、Reliance Securities Co., Ltd.
6.5 20111024
4152台微體
Taiwan Liposome Company, Ltd
永豐金、凱基、台灣工銀、國票
SinoPac Securities Corp.、KGI Securities Co., Ltd.、IBT Securities Co., Ltd.、Waterland Securities Co.,
3.0 20111024
4163鐿鈦科技
INTAI TECHNOLOGY CORP.
台新、兆豐、凱基
Taishin Securities Co., Ltd.、Mega Securities Co., Ltd.、KGI Securities Co., Ltd.
3.7 20111024
2730美麗信酒店
MIRAMAR HOSPITALITY CO.,LTD
群益金鼎、元大、臺銀綜合
Capital Securities Corp.、Yuanta Core Pacific Securities Co., Ltd.、 BankTaiwan Securities Co.,Ltd.
3.8 20111028
2066世德工業
Sumeeko Industries Co., Ltd.
台新、大華、中國信託
Taishin Securities Co., Ltd.、Grand Cathay Securities Corp.、Chinatrust Securities Co., Ltd.
3.0 20111101
3163波若威科技
Browave Corporation
大華、臺銀綜合
Grand Cathay Securities .Corp.、 BankTaiwan Securities Co.,Ltd.
5.5 20111103
5258虹堡科技
Castles Technology Co., Ltd.
台新、華南永昌、福邦
Taishin Securities Co., Ltd.、Hua Nan Entrust Securities Ltd. Co.、Gfortune Securities Co., Ltd.
4.6 20111114
5259清惠實業
CANDMARK ENTERPRISE CO., LTD.
華南永昌、宏遠、富邦、第一金
Hua Nan Entrust Securities Ltd. Co.、Horizon Securities Co., Ltd.、Fubon Securities Co., Ltd.、First Securities Inc
5.4 20111123
4730通用矽酮
General Silicones Co., Ltd.
福邦、統一、德信
Gfortune Securities Co., Ltd.、President Securities Corp.、Reliance Securities Co., Ltd.
2.9 20111130
3682亞太電信
Asia Pacific Telecom Co.,Ltd.
元富、中國信託、群益金鼎、元大
MasterLink Securities Corp.、Chinatrust Securities Co., Ltd.、Capital Securities Corp.、Yuanta Core Pacific Securities Co., Ltd.
328.4 20111201

127
代號
Code公司名稱
Name of Company推薦證券商
Recommending Securities Firms
資本額(億元)
Capital Issued(NT$100 Million)
掛牌日期
Date of Listing
5263智崴資訊科技
BROGENT TECHNOLOGIES INC.
台新、新光
Taishin Securities Co., Ltd.、Skis Securities Co., Ltd.
2.3 20111205
3151
智泰科技
3DFAMILY TECHNOLOGY CO., LTD.
國泰、德信
Cathay Securities Corporation、Reliance Securities Co., Ltd.
2.0 20111215
8435台灣鉅邁
Zimmite Taiwan Ltd.
永豐金、亞東
SinoPac Securities Corp.、Oriental Securities Corporation
2.5 20111215
4168台灣醣聯生技醫藥
GlycoNex Incorporation
台新、凱基、群益金鼎
Taishin Securities Co., Ltd.、KGI Securities Co., Ltd.、Capital Securities Corp.
4.3 20111216
2641正德海運
Franbo Lines Corp.
大眾、日盛、群益金鼎、第一金、致和
Ta Chong Securities Corp.、Jih Sun Securities Co., Ltd.、Capital Securities Corp.、First Securities Inc.、Concord International Securities Co., Ltd.
9.5 20111219
5257北儒精密
Bay Zu Precision Co., Ltd.
元富、新光
MasterLink Securities Corp.、Skis Securities Co., Ltd.
11.5 20111229

● 統計資料
128
100年度外國興櫃股票新登錄公司彙總表New Registered of Foreign Stocks on Emerging Market Board in 2011
2
代號
Code公司名稱
Name of Company推薦證券商
Recommending Securities Firms
資本額(億元)
Capital Issued(NT$100 Million)
掛牌日期
Date of Listing
8423F-保綠Polygreen Resources Co., Ltd
元富、大眾
MasterLink Securities Corp.、Ta Chong Securities Corp.
1.5 20110120
8418F-必勝JP Nelson Holdings
大華、凱基
Grand Cathay Securities Corp.、KGI Securities Co., Ltd.
5.0 20110527
8426F-紅木Redwood Group Ltd
大華、凱基
Grand Cathay Securities Corp.、KGI Securities Co., Ltd.
3.6 20110530
1337F-亞塑Asia Plastic Recycling Holding Limited
元大、台新、大華、群益金鼎
Yuanta Core Pacific Securities Co., Ltd.、Taishin Securities Co., Ltd.、Grand Cathay Securities Corp.、Capital Securities Corp.
12.4 20110701
5871F-中租Chailease Holding Company Limited
群益金鼎、永豐金
Capital Securities Corp.、SinoPac Securities Corp.
75.5 20110711
4943F-康控Concraft Holding. Co., Ltd.
群益金鼎、中國信託
Capital Securities Corp.、Chinatrust Securities Co., Ltd.
4.4 20110712
4154F-康樂Kino Biotech Co., Ltd
中國信託、台新
Chinatrust Securities Co., Ltd.、Taishin Securities Co., Ltd.
1.9 20110727
5232F-怡德EVENDATA HOLDING COMPANY LIMITED
日盛、華南永昌、凱基
Jih Sun Securities Co., Ltd.、Hua Nan Entrust Securities Ltd. Co.、KGI Securities Co., Ltd.
2.1 20110728
1258
F-其祥Kee Song Bio-Technology Holdings Limited
群益金鼎、華南永昌
Capital Securities Corp.、Hua Nan Entrust Securities Ltd. Co.
3.0 20110829
2924F-東凌Cayman Tung Ling Co., Limited
大華、凱基
Grand Cathay Securities Corp.、KGI Securities Co., Ltd.
2.5 20110909
8414F-富怡Ferrell International Limited
群益金鼎、福邦
Capital Securities Corp.、Gfortune Securities Co., Ltd.
2.2 20110922

129
100年度興櫃公司現金增資及無償配股總額表Capital Increase and Gratuitous Stock Distribution of Emerging Stock Companies in 2011
3
項 目
Item金額(新台幣億元)
Amount(NT$100 Million)百分比
(%)
現金增資
Capital Increase by Cash79.4 59.70
無償配股
Gratuitous Stock Distribution53.6 40.30
合 計
Total133.0 100

● 統計資料
130
100年度興櫃公司資本變動統計表Capital Change of Emerging Stock Companies in 2011
4
年/月Yr / Mo
興櫃股票
Emerging Stock 初次登錄
Newly Registered 增資
Capital Increased
減資 Capital Decreased
終止櫃檯買賣
Terminated Registration
資本變動
合計數
Total Amount of Changes in Capital家數
No.
櫃檯買賣
面值
Par Value
成長率
Growth Rate(%)
櫃檯買賣
市值
Market 家數 No.
金額
Amount
現金增資
Capital Increased by Cash
盈餘轉增資
Capital Increased by Earnings
Recapitalization
資本公積轉增資
Capital Increase Out of Capital Reserve
合併增資
Capital Increase by Acquisition
其他
Others
家數
No.金額
Amount家數
No.金額
Amount家數
No.金額
Amount家數
No.金額
Amount家數
No.金額
Amount家數
No.金額
Amount家數
No.金額
Amount
2011 / 01 286 351.04 1.67 879.38 9 5.46 11 1.11 1 0.01 0 0 0 0 28 1.72 0 0 8 2.54 5.76
2011 / 02 286 349.69 -0.38 873.16 3 1 4 0.364 0 0 0 0 0 0.00 31 0.142 1 1.623 3 1.23 -1.35
2011 / 03 283 350.18 0.14 850.46 5 1.86 6 2.36 0 0 0 0 0 0.00 24 0.07 0 0 8 3.8 0.49
2011 / 04 285 354.22 1.15 872.31 7 4.05 6 0.97 0 0 0 0 0 0.00 17 0.09 0 0 5 1.07 4.04
2011 / 05 289 355.54 0.372649766 852.58 9 3.88 3 0.25 0 0 0 0 0 0 19 0.06 1 0 5 2.87 1.32
2011 / 06 288 354.76 -0.22 801.81 3 1.03 1 0.30 2 0.12 0 0 0 0 11 0.02 1 0 4 2.25 -0.78
2011 / 07 294 365.58 3.05 815.4 10 11.11 3 0.21 7 0.79 0 0 0 0 19 0.42 2 0.37 4 1.34 10.82
2011 / 08 292 368.71 0.856173751 744.22 5 7.49 2 0.21 13 0.57 0 0 0 0 22 0.15 0 0 7 5.29 3.13
2011 / 09 296 359.21 -2.576550677 662.69 13 7.25 0 0.00 24 1.32 2 0.08 0 0 24 0.03 0 0 9 18.18 -9.50
2011 / 10 293 355.43 -1.052309234 619.24 9 4.64 3 0.17 25 2.09 0 0 0 0 20 0.09 0 0 12 10.77 -3.78
2011 / 11 287 347.08 -2.349267085 543.21 5 2.14 6 1.60 11 0.3 0 0 0 0 10 0.09 1 0.23 11 12.25 -8.35
2011 / 12 277 362.1 4.327532557 521.6 7 36.04 3 0.40 4 0.16 2 0.04 1 0.11 11 0.02 1 0.02 17 21.73 15.02
2011 277 362.10 4.87 521.60 85 85.95 48 7.94 87 5.36 4 0.12 1 0.11 236 2.90 7 2.24 93 83.32 16.82
註:興櫃股票市場自91年1月2日起開始交易。Note:The Emerging Stock Market commenced trading on Jan. 2, 2002.
Capitalization

131
單位:十億元
Unit : NT$Billion
年/月Yr / Mo
興櫃股票
Emerging Stock 初次登錄
Newly Registered 增資
Capital Increased
減資 Capital Decreased
終止櫃檯買賣
Terminated Registration
資本變動
合計數
Total Amount of Changes in Capital家數
No.
櫃檯買賣
面值
Par Value
成長率
Growth Rate(%)
櫃檯買賣
市值
Market 家數 No.
金額
Amount
現金增資
Capital Increased by Cash
盈餘轉增資
Capital Increased by Earnings
Recapitalization
資本公積轉增資
Capital Increase Out of Capital Reserve
合併增資
Capital Increase by Acquisition
其他
Others
家數
No.金額
Amount家數
No.金額
Amount家數
No.金額
Amount家數
No.金額
Amount家數
No.金額
Amount家數
No.金額
Amount家數
No.金額
Amount
2011 / 01 286 351.04 1.67 879.38 9 5.46 11 1.11 1 0.01 0 0 0 0 28 1.72 0 0 8 2.54 5.76
2011 / 02 286 349.69 -0.38 873.16 3 1 4 0.364 0 0 0 0 0 0.00 31 0.142 1 1.623 3 1.23 -1.35
2011 / 03 283 350.18 0.14 850.46 5 1.86 6 2.36 0 0 0 0 0 0.00 24 0.07 0 0 8 3.8 0.49
2011 / 04 285 354.22 1.15 872.31 7 4.05 6 0.97 0 0 0 0 0 0.00 17 0.09 0 0 5 1.07 4.04
2011 / 05 289 355.54 0.372649766 852.58 9 3.88 3 0.25 0 0 0 0 0 0 19 0.06 1 0 5 2.87 1.32
2011 / 06 288 354.76 -0.22 801.81 3 1.03 1 0.30 2 0.12 0 0 0 0 11 0.02 1 0 4 2.25 -0.78
2011 / 07 294 365.58 3.05 815.4 10 11.11 3 0.21 7 0.79 0 0 0 0 19 0.42 2 0.37 4 1.34 10.82
2011 / 08 292 368.71 0.856173751 744.22 5 7.49 2 0.21 13 0.57 0 0 0 0 22 0.15 0 0 7 5.29 3.13
2011 / 09 296 359.21 -2.576550677 662.69 13 7.25 0 0.00 24 1.32 2 0.08 0 0 24 0.03 0 0 9 18.18 -9.50
2011 / 10 293 355.43 -1.052309234 619.24 9 4.64 3 0.17 25 2.09 0 0 0 0 20 0.09 0 0 12 10.77 -3.78
2011 / 11 287 347.08 -2.349267085 543.21 5 2.14 6 1.60 11 0.3 0 0 0 0 10 0.09 1 0.23 11 12.25 -8.35
2011 / 12 277 362.1 4.327532557 521.6 7 36.04 3 0.40 4 0.16 2 0.04 1 0.11 11 0.02 1 0.02 17 21.73 15.02
2011 277 362.10 4.87 521.60 85 85.95 48 7.94 87 5.36 4 0.12 1 0.11 236 2.90 7 2.24 93 83.32 16.82
註:興櫃股票市場自91年1月2日起開始交易。Note:The Emerging Stock Market commenced trading on Jan. 2, 2002.

● 統計資料
132
100年度興櫃股票交易情形統計表Trading of Emerging Stocks in 2011 - by Month
5
項目
Item1月Jan.
2月Feb.
3月Mar.
4月Apr.
5月May
6月Jun.
7月Jul.
8月Aug.
9月Sep.
10月Oct.
11月Nov.
12月Dec.
合計
Total
股票總成交值(億元)
Total Turnover(NT$100 Million) 286.37 192.07 284.66 222.62 208.57 153.18 141.45 172.84 120.99 85.88 101.58 64.60 2,034.82
股票總成交股數(千股)
Total Volume(1,000 shares) 619,907 463,525 710,440 520,535 512,082 433,957 400,607 505,641 444,162 358,110 377,459 357,542 5,703,968
股票總成交筆數
Total Number of Transactions 142,336 103,624 157,647 117,287 115,038 103,244 97,873 124,844 96,964 70,384 76,914 66,442 1,272,597
股票交易日數
Trading Days 20 14 23 19 21 21 21 23 21 20 22 22 247
股票平均日成交值(億元)
Daily Average Turnover(NT$100 Million) 14.32 13.72 12.38 11.72 9.93 7.29 6.74 7.51 5.76 4.29 4.62 2.94 8.24
股票平均日成交量(千股)
Daily Average Volume(1,000 shares) 30,995 33,109 30,889 27,397 24,385 20,665 19,077 21,984 21,151 17,906 17,157 16,252 23,093
股票平均日成交筆數(筆) Daily Average Number of Transactions
7,117 7,402 6,854 6,173 5,478 4,916 4,661 5,428 4,617 3,519 3,496 3,020 5,152
股票每筆交易平均金額(千元)
Average Value Per Transaction(NT$1,000) 201.20 185.35 180.57 189.81 181.31 148.37 144.53 138.45 124.78 122.02 132.07 97.23 159.90
股票每筆交易平均股數(千股)
Average Volume Per Transaction(1,000 shares)
4.36 4.47 4.51 4.44 4.45 4.20 4.09 4.05 4.58 5.09 4.91 5.38 4.48

133
項目
Item1月Jan.
2月Feb.
3月Mar.
4月Apr.
5月May
6月Jun.
7月Jul.
8月Aug.
9月Sep.
10月Oct.
11月Nov.
12月Dec.
合計
Total
股票總成交值(億元)
Total Turnover(NT$100 Million) 286.37 192.07 284.66 222.62 208.57 153.18 141.45 172.84 120.99 85.88 101.58 64.60 2,034.82
股票總成交股數(千股)
Total Volume(1,000 shares) 619,907 463,525 710,440 520,535 512,082 433,957 400,607 505,641 444,162 358,110 377,459 357,542 5,703,968
股票總成交筆數
Total Number of Transactions 142,336 103,624 157,647 117,287 115,038 103,244 97,873 124,844 96,964 70,384 76,914 66,442 1,272,597
股票交易日數
Trading Days 20 14 23 19 21 21 21 23 21 20 22 22 247
股票平均日成交值(億元)
Daily Average Turnover(NT$100 Million) 14.32 13.72 12.38 11.72 9.93 7.29 6.74 7.51 5.76 4.29 4.62 2.94 8.24
股票平均日成交量(千股)
Daily Average Volume(1,000 shares) 30,995 33,109 30,889 27,397 24,385 20,665 19,077 21,984 21,151 17,906 17,157 16,252 23,093
股票平均日成交筆數(筆) Daily Average Number of Transactions
7,117 7,402 6,854 6,173 5,478 4,916 4,661 5,428 4,617 3,519 3,496 3,020 5,152
股票每筆交易平均金額(千元)
Average Value Per Transaction(NT$1,000) 201.20 185.35 180.57 189.81 181.31 148.37 144.53 138.45 124.78 122.02 132.07 97.23 159.90
股票每筆交易平均股數(千股)
Average Volume Per Transaction(1,000 shares)
4.36 4.47 4.51 4.44 4.45 4.20 4.09 4.05 4.58 5.09 4.91 5.38 4.48

● 統計資料
134
100年度政府公債上櫃狀況統計表Government Bonds on GTSM in 2011
100年度金融債券上櫃狀況統計表Financial Debentures on GTSM in 2011
1
2
債券市場 Bond Market
項 目 Item
期 數
No. of Issues金額(新台幣億元)
Amount Issued(NT$100M)
99 年底餘額 Amount outstanding at year-end 2010
94 43,341.51
100 年新上櫃總額 New listing in 2011
12 6,400.00
到期(提前)還本總額 Total principal paid back on maturity(early)
9 3,300.00
100 年底餘額 Amount outstanding at year-end 2011
97 46,441.51
項 目 Item
期 數
No. of Issues金額(新台幣億元)
Amount Issued(NT$100M)
99 年底餘額 Amount outstanding at year-end 2010
452 7,659.38
100 年新上櫃總額 New listing in 2011
72 1,912.60
到期(提前)還本總額 Total principal paid back on maturity(early)
107 1,092.50
100 年底餘額 Amount outstanding at year-end 2011
417 8,479.48

135
100年度公司債上櫃狀況統計表Corporate Bonds on GTSM in 2011
100年度金融資產證券化/不動產資產信託上櫃狀況統計表ABS / REIT on GTSM in 2011
3
4
項 目 Item
期 數
No. of Issues金額(新台幣億元)
Amount Issued(NT$100M)
99 年底餘額 Amount outstanding at year-end 2010
758 11,375.80
100 年新上櫃總額 New listing in 2011
202 3,875.87
到期(提前)還本總額 Total principal paid back on maturity(early)
232 2,348.77
100 年底餘額 Amount outstanding at year-end 2011
724 12,902.90
註:公司債包含普通公司債、轉(交)換公司債及附認股權公司債。
Note:Corporate bonds include straight bonds, convertible(exchangeable)bonds and bonds with warrant.
項 目 Item
期 數
No. of Issues金額(新台幣億元)
Amount Issued(NT$100M)
99 年底餘額 Amount outstanding at year-end 2010
52 796.10
100 年新上櫃總額 New listing in 2011
2 41.54
到期(提前)還本總額 Total principal paid back on maturity(early)
21 264.14
100 年底餘額 Amount outstanding at year-end 2011
33 573.50

● 統計資料
136
100年度外國債券上櫃狀況統計表Foreign Bonds on GTSM in 2011
100年度國際債券上櫃狀況統計表International Bonds on GTSM in 2011
5
6
項 目 Item
期 數
No. of Issues金額(新台幣億元)
Amount Issued(NT$100M)
99 年底餘額 Amount outstanding at year-end 2010
8 147
100 年新上櫃總額 New listing in 2011
0 -
到期(提前)還本總額 Total principal paid back on maturity(early)
6 117
100 年底餘額 Amount outstanding at year-end 2011
2 30
項 目 Item
期 數
No. of Issues金額(新台幣億元)
Amount Issued(NT$100M)
99 年底餘額 Amount outstanding at year-end 2010
4 362
100 年新上櫃總額 New listing in 2011
0 -
到期(提前)還本總額 Total principal paid back on maturity(early)
0 -
100 年底餘額 Amount outstanding at year-end 2011
4 362
註:資料截至2011年12月31日,匯率 US$=NT$32.2351。Note:the information is up to the end of 2011, and the reference exchange rate US$1=NT$32.2351.

137
100年度櫃檯買賣債券交易統計表Bond Trading on GTSM in 2011
7
年/月 Yr/Mo
上櫃債券總成交金額(億元)
Total Trading Value(NT$100 Million)債券營業日數
No. of Trading Days債券平均日成交值(億元)
Ave. Daily Turnover(NT$100M)
2011 / 1 64,586.12 21 3,075.53
2011 / 2 45,843.33 15 3,056.22
2011 / 3 67,760.24 23 2,946.10
2011 / 4 53,382.21 19 2,809.59
2011 / 5 59,720.29 21 2,843.82
2011 / 6 60,384.51 21 2,875.45
2011 / 7 61,071.56 21 2,908.17
2011 / 8 66,037.41 23 2,871.19
2011 / 9 63,669.73 21 3,031.89
2011 / 10 56,488.18 20 2,824.41
2011 / 11 57,842.36 22 2,629.20
2011 / 12 58,829.89 22 2,674.09
合 計 Total
715,615.82 249 2,873.96
註:本表數字包含轉換公司債及附認股權公司債。 Note:The figures include convertible bonds and corporate bonds with warrant.

● 統計資料
138
100年度櫃檯買賣債券成交金額統計表Turnover of Bond Trading on GTSM in 2011
8
年/月 Yr / Mo
買賣斷(億元) Outrights
(NT$100Million)
百分比 (%)
附條件(億元)
RP / RS (NT$100Million)
百分比 (%)
合計(億元) Total
(NT$100Million)
2011 / 1 15,238.31 23.59% 49,347.81 76.41% 64,586.12
2011 / 2 11,562.64 25.22% 34,280.69 74.78% 45,843.33
2011 / 3 16,262.62 24.00% 51,497.62 76.00% 67,760.24
2011 / 4 10,044.28 18.82% 43,337.93 81.18% 53,382.21
2011 / 5 12,898.65 21.60% 46,821.64 78.40% 59,720.29
2011 / 6 14,292.51 23.67% 46,092.00 76.33% 60,384.51
2011 / 7 13,072.94 21.41% 47,998.62 78.59% 61,071.56
2011 / 8 14,694.09 22.25% 51,343.33 77.75% 66,037.41
2011 / 9 17,017.42 26.73% 46,652.31 73.27% 63,669.73
2011 / 10 10,885.42 19.27% 45,602.76 80.73% 56,488.18
2011 / 11 8,970.05 15.51% 48,872.31 84.49% 57,842.36
2011 / 12 8,080.18 13.73% 50,749.71 86.27% 58,829.89
合 計 Total
153,019.10 21.38% 562,596.72 78.62% 715,615.82
註:本表數字包含轉換公司債及附認股權公司債。
Note:The figures include convertible bonds and corporate bonds with warrant.

139
100年度各年期指標債券加權平均殖利率Statistics of Weighted Average Yield of Benchmark Bonds in 2011
9
年/月 Yr / Mo
5年期5-Year
10年期10-Year
20年期20-Year
加權平均殖利率
(%)
Weighted Ave. Yield
買賣斷金額
(億元)
Outright Trade Value
(NT$100Million)
加權平均殖利率
(%) Weighted Ave.
Yield
買賣斷金額 (億元)
Outright Trade Value
(NT$100Million)
加權平均殖利率
(%)
Weighted Ave. Yield
買賣斷金額 (億元)
Outright Trade Value
(NT$100Million)
2011 / 1 1.0702 10,044.87 1.4482 311.69 2.0970 356.12
2011 / 2 1.1154 6,757.39 1.3968 123.92 1.9375 51.54
2011 / 3 1.0896 1,048.09 1.3810 9,916.05 1.7400 4.26
2011 / 4 1.0757 4,977.73 1.3619 947.66 1.7627 363.56
2011 / 5 1.1004 3,998.78 1.4050 794.58 1.7636 137.22
2011 / 6 1.1188 573.47 1.4899 9,215.40 1.8222 15.22
2011 / 7 1.1785 8,049.51 1.5131 711.66 1.8819 99.78
2011 / 8 1.0632 7,870.90 1.3978 1,674.40 1.8656 104.17
2011 / 9 0.9753 3,061.26 1.2733 7,483.94 1.7374 117.13
2011 / 10 1.0464 3,978.65 1.2935 2,588.67 1.7991 38.48
2011 / 11 1.0329 2,143.12 1.3226 1,916.40 1.8004 256.60
2011 / 12 0.9962 684.93 1.2710 3,102.42 1.7148 157.05
註:本表之殖利率為債券等殖成交之加權平均殖利率。
Note:The yields are weighted average yield of bonds.

● 統計資料
140
100年度櫃檯買賣債券買賣斷交易成交金額統計表Turnover of Bond Outright Trade on GTSM in 2011
10
年/月
Yr / Mo
政府公債
Government Bond金融債券
Financial Debenture受益證券
Beneficiary Securities普通公司債
Corporate Bond
轉(交)換公司債
Convertible and Exchangible Corporate
Bond
附認股權公司債
Corporate Bond With Warrant
外國債券
Foreign Bond合 計 Total
成交金額
Value百分比
(%)
成交金額 Value
百分比
(%)
成交金額 Value
百分比
(%)
成交金額 Value
百分比
(%)
成交金額 Value
百分比
(%)
成交金額 Value
百分比
(%)
成交金額 Value
百分比
(%)
2011 / 1 14,465.54 94.93 50.53 0.33 0.00 - 490.85 3.22 231.38 1.52 0.00 - 0.00 - 15,238.31
2011 / 2 11,116.37 96.14 42.60 0.37 0.00 - 287.57 2.49 116.10 1.00 0.00 - 0.00 - 11,562.64
2011 / 3 14,877.96 91.49 520.80 3.20 2.93 0.02 648.82 3.99 212.11 1.30 0.00 - 0.00 - 16,262.62
2011 / 4 8,883.21 88.44 263.31 2.62 0.00 - 740.16 7.37 157.60 1.57 0.00 - 0.00 - 10,044.28
2011 / 5 11,716.86 90.84 390.74 3.03 0.00 - 567.01 4.40 163.62 1.27 0.00 - 60.42 0.47 12,898.65
2011 / 6 13,176.18 92.19 240.10 1.68 0.00 - 727.13 5.09 149.11 1.04 0.00 - 0.00 - 14,292.51
2011 / 7 12,039.76 92.10 81.65 0.62 0.00 - 679.93 5.20 230.16 1.76 0.00 - 41.44 0.32 13,072.94
2011 / 8 13,668.17 93.02 198.94 1.35 0.00 - 578.88 3.94 217.67 1.48 0.00 - 30.44 0.21 14,694.09
2011 / 9 16,089.32 94.55 190.63 1.12 0.00 - 579.54 3.41 148.93 0.88 0.00 - 9.00 0.05 17,017.42
2011 / 10 9,822.79 90.24 195.76 1.80 0.00 - 758.79 6.97 108.08 0.99 0.00 - 0.00 - 10,885.42
2011 / 11 7,870.37 87.74 217.75 2.43 42.74 0.48 751.29 8.38 87.89 0.98 0.00 - 0.00 - 8,970.05
2011 / 12 7,170.19 88.74 275.06 3.40 0.61 0.01 539.12 6.67 95.21 1.18 0.00 - 0.00 - 8,080.18
合 計 Total
140,896.73 92.08 2,667.86 1.74 46.27 0.03 7,349.08 4.80 1,917.86 1.25 0.0000 - 141.30 0.09 153,019.10
註:本表含各分割債券之交易金額。
Note:The figures include the trading of stripped bonds.

141
單位:億元
Unit : NT$100Million
年/月
Yr / Mo
政府公債
Government Bond金融債券
Financial Debenture受益證券
Beneficiary Securities普通公司債
Corporate Bond
轉(交)換公司債
Convertible and Exchangible Corporate
Bond
附認股權公司債
Corporate Bond With Warrant
外國債券
Foreign Bond合 計 Total
成交金額
Value百分比
(%)
成交金額 Value
百分比
(%)
成交金額 Value
百分比
(%)
成交金額 Value
百分比
(%)
成交金額 Value
百分比
(%)
成交金額 Value
百分比
(%)
成交金額 Value
百分比
(%)
2011 / 1 14,465.54 94.93 50.53 0.33 0.00 - 490.85 3.22 231.38 1.52 0.00 - 0.00 - 15,238.31
2011 / 2 11,116.37 96.14 42.60 0.37 0.00 - 287.57 2.49 116.10 1.00 0.00 - 0.00 - 11,562.64
2011 / 3 14,877.96 91.49 520.80 3.20 2.93 0.02 648.82 3.99 212.11 1.30 0.00 - 0.00 - 16,262.62
2011 / 4 8,883.21 88.44 263.31 2.62 0.00 - 740.16 7.37 157.60 1.57 0.00 - 0.00 - 10,044.28
2011 / 5 11,716.86 90.84 390.74 3.03 0.00 - 567.01 4.40 163.62 1.27 0.00 - 60.42 0.47 12,898.65
2011 / 6 13,176.18 92.19 240.10 1.68 0.00 - 727.13 5.09 149.11 1.04 0.00 - 0.00 - 14,292.51
2011 / 7 12,039.76 92.10 81.65 0.62 0.00 - 679.93 5.20 230.16 1.76 0.00 - 41.44 0.32 13,072.94
2011 / 8 13,668.17 93.02 198.94 1.35 0.00 - 578.88 3.94 217.67 1.48 0.00 - 30.44 0.21 14,694.09
2011 / 9 16,089.32 94.55 190.63 1.12 0.00 - 579.54 3.41 148.93 0.88 0.00 - 9.00 0.05 17,017.42
2011 / 10 9,822.79 90.24 195.76 1.80 0.00 - 758.79 6.97 108.08 0.99 0.00 - 0.00 - 10,885.42
2011 / 11 7,870.37 87.74 217.75 2.43 42.74 0.48 751.29 8.38 87.89 0.98 0.00 - 0.00 - 8,970.05
2011 / 12 7,170.19 88.74 275.06 3.40 0.61 0.01 539.12 6.67 95.21 1.18 0.00 - 0.00 - 8,080.18
合 計 Total
140,896.73 92.08 2,667.86 1.74 46.27 0.03 7,349.08 4.80 1,917.86 1.25 0.0000 - 141.30 0.09 153,019.10
註:本表含各分割債券之交易金額。
Note:The figures include the trading of stripped bonds.

● 統計資料
142
歷年上櫃認購(售)權證發行及交易概況表Highlights of Warrants Issuance on GTSM Market
1
衍生性金融商品市場 Financial Derivatives Market
年/月 Yr / Mo
已取得發行人
資格家數
No. of Authorized Issuers
發行權證數
No. of Warrants
發行單位數
(千單位)
Issued Size(1,000 units)
市值 (億元)Market Value
(NT$100Million)
成交量
(千單位)
Trading Volume(1,000 units)
成交值
(億元)
Trading Value(NT$100Million)
2003 22 10 117,000 3.5 772,483 31.06
2004 25 6 150,000 4.0 1,554,431 56.03
2005 28 46 592,000 14.5 9,192,212 182.28
2006 29 148 2,921,500 37.9 18,988,148 323.45
2007 30 591 8,515,800 37.1 73,039,076 1,032.36
2008 29 241 2,185,000 11.5 41,780,245 510.54
2009 27 790 8,692,000 121.8 13,917,634 206.13
2010 27 1,293 12,988,140 105.0 43,531,748 395.91
2011 27 1,318 15,967,023 74.8 53,150,543 431.29
1 27 1,424 14,739,290 123.7 5,214,653 49.09
2 27 1,374 14,607,090 111.9 3,745,264 36.52
3 27 1,470 16,423,430 109.3 6,541,733 59.94
4 27 1,469 17,118,750 97.3 5,235,210 41.34
5 26 1,555 18,439,520 111.6 6,181,622 46.95
6 26 1,597 18,948,720 91.8 5,329,329 38.85
7 27 1,597 19,024,420 114.2 4,536,391 33.50
8 27 1,647 19,449,660 74.2 4,092,361 27.40
9 27 1,550 18,331,816 71.7 3,100,268 25.67
10 27 1,504 17,738,949 84.8 2,980,011 24.48
11 27 1,421 16,868,823 63.7 3,529,326 28.96
12 27 1,318 15,967,023 74.8 2,664,375 18.59
註:「發行權證數」欄內數字,係指已發行尚未到期權證數。
Note:"No. of Warrants" indicates those who were issued and not expired.

143
100年度轉換公司債資產交換交易流通在外餘額統計表Amount Outstanding of Convertible Bond Asset Swap in 2011
2
年/月 Yr / Mo
99 年度流通在外契約餘額(億元)
2010 Principal of Outstanding Contracts(NT$100Million)
100 年度流通在外契約餘額(億元)
2011 Principal of Outstanding Contracts(NT$100Million)
成長率 Growth Ratio(%)
2011 / 1 302.48 502.96 66.28%
2011 / 2 311.12 545.28 75.26%
2011 / 3 305.71 586.95 91.99%
2011 / 4 314.83 601.35 91.01%
2011 / 5 328.70 663.66 101.91%
2011 / 6 371.45 683.44 83.99%
2011 / 7 384.96 726.67 88.76%
2011 / 8 394.13 802.25 103.55%
2011 / 9 433.37 872.89 101.42%
2011 / 10 429.07 859.35 100.28%
2011 / 11 445.56 871.71 95.64%
2011 / 12 449.93 854.84 90.00%

● 統計資料
144
100年度結構型商品交易流通在外餘額統計表Amount Outstanding of Structured Notes in 2011
3
年/月 Yr / Mo
99 年度流通在外契約餘額(億元)
2010 Principal of Outstanding Contracts(NT$100Million)
100 年度流通在外契約餘額(億元)
2011 Principal of Outstanding Contracts(NT$100Million)
成長率 Growth Ratio(%)
2011 / 1 93.03 117.52 26.33%
2011 / 2 76.77 132.14 72.13%
2011 / 3 89.69 130.48 45.48%
2011 / 4 102.65 141.91 38.25%
2011 / 5 98.51 143.94 46.11%
2011 / 6 93.50 110.76 18.47%
2011 / 7 98.63 124.70 26.44%
2011 / 8 96.94 144.09 48.65%
2011 / 9 97.72 117.96 20.71%
2011 / 10 121.06 138.22 14.17%
2011 / 11 129.89 121.67 -6.33%
2011 / 12 114.47 122.81 7.28%

145
100年度店頭衍生性商品電腦交易系統交易量統計表Over-the-counter Trading of Derivatives through TADS in 2011
4
年/月 Yr / Mo
99年度成交金額(億元)Turnover in 2010(NT$100Million)
100年度成交金額(億元)Turnover in 2011(NT$100Million)
成長率 Growth Ratio(%)
2011 / 1 158 182 15.19%
2011 / 2 18 228 1166.67%
2011 / 3 100 308 208.00%
2011 / 4 70 166 137.14%
2011 / 5 228 224 -1.75%
2011 / 6 232 130 -43.97%
2011 / 7 244 166 -31.97%
2011 / 8 464 82 -82.33%
2011 / 9 264 50 -81.06%
2011 / 10 200 44 -78.00%
2011 / 11 142 56 -60.56%
2011 / 12 62 120 93.55%

● 統計資料
146
100年度債券選擇權交易量統計表Trading of Bond Options in 2011
5
年/月 Yr / Mo
99年度成交金額(億元)Turnover in 2010(NT$100Million)
100年度成交金額(億元)Turnover in 2011(NT$100Million)
成長率 Growth Ratio(%)
2011 / 1 382 226 -40.84%
2011 / 2 171 252 47.37%
2011 / 3 315 367 16.51%
2011 / 4 246 218 -11.38%
2011 / 5 284 263 -7.39%
2011 / 6 313 146 -53.35%
2011 / 7 382 173 -54.71%
2011 / 8 510 86 -83.14%
2011 / 9 303 52 -82.84%
2011 / 10 263 47 -82.13%
2011 / 11 86 56 -34.88%
2011 / 12 81 128 58.02%
註:本表數字包含營業處所及店頭衍生性商品電腦交易系統。
Note:Figures in this table include transactions taken place over-the-counter at the business places of securities firms and through the over-the-counter electronic derivatives trading system.

147
100年度股權衍生性商品成交統計表Trading of Equity Derivatives in 2011
6
年/月 Yr / Mo
99年度成交金額(億元)Turnover in 2010(NT$100Million)
100年度成交金額(億元)Turnover in 2011(NT$100Million)
成長率 Growth Ratio(%)
2011 / 1 4.59 1.26 -72.55%
2011 / 2 2.62 5.08 93.89%
2011 / 3 2.30 19.62 753.02%
2011 / 4 6.39 9.45 47.94%
2011 / 5 1.97 20.21 926.12%
2011 / 6 4.25 7.89 85.36%
2011 / 7 2.22 21.10 850.65%
2011 / 8 2.87 0.82 -71.34%
2011 / 9 3.68 6.35 72.61%
2011 / 10 1.72 16.41 854.25%
2011 / 11 4.05 1.88 -53.52%
2011 / 12 5.07 4.62 -8.85%

148
● 統計圖
上櫃、興櫃及輔導中公司家數統計圖Chart for Statistics of Numbers of GTSM-Listed Companies, Emerging Stock Companies and Companies under Guidance
1
900
800
700
600
500
400
300
200
100
0
家數 No.
1994 1995 1996 1997 1998 1999 2000 2001 2002 2003 2004 2005 2006 2007 2008 2009 2010 2011 年度
興櫃家數 No. of Emerging Stock Companies
上櫃家數 No. of GTSM-Listed Companies
輔導家數 No. of Companies under Guidance
1441
172
226
79114
334
524
264
627
300333
384
172
245
423
464
349
466
382
505
307
230
298
246
332
249223
261285
363
277
344
233
531547 539 546
564
607
257
819
711
517
176158

149
100年度上櫃公司家數及資本總額統計圖 Number of GTSM-Listed Companies and Total Capital in 2011
歷年櫃檯買賣股票融資融券餘額成長圖Chart for Changes of Margin Trading and Securities Loan Balance on GTSM Over the Years
2
3
00/12 01/12 02/12 03/12 04/12 05/12 06/12 07/12 08/12 09/12 10/12 11/01 11/02 11/03 11/04 11/05 11/06 11/07 11/08 11/09 11/10 11/11 11/12
900
800
700
600
500
400
300
200
100
0
2000
2001
2002
2003
2004
2005
2006
2007
2008
2009
2010
/01
2010
/02
2010
/03
2010
/04
2010
/05
2010
/06
2010
/07
2010
/08
2010
/09
2010
/10
2010
/11
2010
/12
2011
/12
上櫃公司家數 N
o. of listing
資本額 C
apital
資本總額(十億)Total Capital(NT$Billion)
上櫃公司家數 No. of Listing
融資餘額(億元)Margin Balance($100M)
融券餘額(仟股)Securities Loan Balance(1,000 shares)
2,400
2,100
1,800
1,500
1,200
900
600
300
0
300,000
100,000
-100,000
融資餘額(億元)M
argin Balance
($100M
)
融券餘額(仟股)S
ecurities Loan Balance
(1,000 shares
)
677 682627 639 626 643
726 715 703 719
775 776 781 787 790 796 803 784 755
712 708 706 732
300
333384
423466
503531
547
539
546
548
548
549
550
553
556
557
556
559
561
563
564607
77 128 135
219 297
417
718
862
195
591
685 654 654 644 628 632 610 580
473 442 432 376 348
10, 509
36, 407
28, 919
78, 135
142, 697
238, 624
288, 953
86, 366
108, 633
190, 292
89, 079
84, 296 82, 097
50, 164
43, 710
79, 125 70, 681
63, 378
80, 874
83, 803
98, 620
84, 856
91, 558

歷年普通公司債上櫃家數及上櫃期數走勢圖Chart for Trends of Number of Corporate Bonds and Issues on GTSM
100年度櫃檯買賣債券成交金額統計圖 Chart for Statistics of Bond Trading Value on GTSM in 2011
4
5
150
● 統計圖
3200
2800
2400
2000
1600
1200
800
400
094/12 95/12 96/12 97/12 98/12 99/12 00/12 01/12 02/12 0312 04/12 05/12 06/12 07/12 0812 09/12 10/12 11/12
11/01 11/02 11/03 11/04 11/05 11/06 11/07 11/08 11/09 11/10 11/11 11/12
家數 N
o. of Com
panys
165
115
65
15
-35
期數 N
o. of Issues
公司債上櫃期數 No. of Bond Issues公司債上櫃家數 No. of Company
買賣斷 Outright 附條件 Repo
7
6
5
4
3
2
1
0
成交金額(兆元)T
rading Value
(NT
$Trllion
)
17 2695
188
487
907
1206
1487
2036
2666
2882
2784
2397
1744
1142
783
512425
18
35
86
128133
129
107
128
140
157
146
121
107
78
5752 53

100年度指標債券加權平均殖利率走勢圖Chart for Movement of Weighted Average Yield of Benchmark Bonds in 2011
100年度公債發行前交易成交面額日均值統計圖Chart for Daily Average of Nominal Transaction Value of When Issued in 2011
6
7
151
11/1 11/2 11/3 11/4 11/5 11/6 11/7 11/8 11/9 11/10 11/11 11/12
成交面額(億元) Nominal transaction value(NT$100M)
5年期 10年期 20年期
2.5
2
1.5
1
0.5
0
加權平均殖利率(%)W
eighted Ave. Y
ield
600
500
400
300
200
100
0
日均值(億元)D
aily Average
(NT
$100M
)
A00
101(
5)A
0010
2(20
)A
0010
3(2)
A00
104(
30)
A00
105
A00
102R
(20
)A
0010
1R(
5)A
0010
4R(
30)
A00
201(
20)
A00
106(
5)A
0010
7(20
)A
0010
8(30
)A
0010
9(10
)
A00
105R
(10
)
A00
106R
(5)
A00
107R
(20
)A
0010
8R(
30)
A00
109R
(10
)

100年度中央公債主要交易商營業金額統計圖 Chart for Trading of Government Bond by Primary Dealers in 2011
100年度轉換公司債資產交換交易流通在外餘額統計圖Chart for Amount Outstanding of Convertible Bond Asset Swap in 2011
8
9
152
● 統計圖
11/01 11/02 11/03 11/04 11/05 11/06 11/07 11/08 11/09 11/10 11/11 11/12
11/01 11/02 11/03 11/04 11/05 11/06 11/07 11/08 11/09 11/10 11/11 11/12
2,000,000
1,800,000
1,600,000
1,400,000
1,200,000
1,000,000
800,000
600,000
400,000
200,000
0
單位:百萬元(NT$1M)
主要交易商 Primary Dealers 其他證券自營商 Other Bond Dealers
註:93/11前之主要交易商家數為9家,93/11起為11家,94/12起為13家,97/4起為15家,99/12起為16家。
Note:9 primary dealers before 2004/11; 11 starting 2004/11、13 starting 2005/12 、15 Starting 2008/4 and 16 starting 2010/12.
1,000.00
900.00
800.00
700.00
600.00
500.00
400.00
300.00
200.00
100.00
-
流通在外契約本金金額(億元)
Principal of O
utstanding Contracts
(NT
$100M
)
2010 2011

100年度結構型商品交易流通在外餘額統計圖 Chart for Amount Outstanding of Structured Products in 2011
100年度店頭衍生性商品電腦交易系統交易量統計圖 Chart for Over-the-counter Trading of Derivatives through TADS in 2011
10
11
153
1 2 3 4 5 6 7 8 9 10 11 12 月份
Month
1 2 3 4 5 6 7 8 9 10 11 12 月份
Month
2010 2011
2010 2011
160
140
120
100
80
60
40
20
0
流通在外契約金額(億元)
Principal of O
utstanding Contracts
(NT
$100M
)
500
450
400
350
300
250
200
150
100
50
0
交易量(億元)T
rading Value
(NT
$100M
)

100年度債券選擇權交易量統計圖Chart for Trading of Bond Options in 2011
12
154
● 統計圖
600
500
400
300
200
100
-1 2 3 4 5 6 7 8 9 10 11 12 月份
Month
成交量(億元)T
rading Value
(NT
$100M
)
2010 2011
註:債券衍生性商品包括債券選擇權、遠期交易及交換,惟僅債券選擇權交易較為活絡。但不含店頭衍生性商品電腦交易系
統之債券選擇權交易。
Note:Bond derivatives include bond options, forward and swap; only bond options have been traded more actively.

100年度股權衍生性商品成交統計圖Chart for Trading of Equity Derivatives in 2011
13
155
1 2 3 4 5 6 7 8 9 10 11 12 月份
Month1 2 3 4 5 6 7 8 9 10 11 12 月份
Month
2010 2011
25
20
15
10
5
0
新作金額(億元)N
ew C
ontract Am
ount
(NT
$100M
)
註:1. 股權選擇交易自95年9月5日開放證券商承作。
2. 股權交換交易自96年3月1日開放證券商承作。
3. 股權遠期交易自96年12月31日開放證券商承作。
Note:1. The equity option business was opened to securities firms on Sep. 5, 2006.
2. The equity swap business was opened to securities firms on March 1, 2007.
3. The Equity forward Buniness was opened to seurities firms on Dec. 2007.