Central Bank of Egypt - الصفحة الرئيسية Bank of Egypt – External Position Preface...
70
Central Bank of Egypt External Position of the Egyptian Economy July/September 2013/14 Quarterly Report Volume No. (43)
Transcript of Central Bank of Egypt - الصفحة الرئيسية Bank of Egypt – External Position Preface...
Central Bank of Egypt
External Position of the Egyptian Economy
July/September 2013/14
Quarterly Report
Volume No. (43)

Central Bank of Egypt – External Position
Preface
The External Position of the Egyptian Economy Report is a series produced by the Economic Research Sector in the Central Bank of Egypt (CBE). The report tracks, on quarterly basis, the international transactions that the Egyptian economy conducts with the rest of the world. It relies, for this purpose, on the national statistics that are regularly compiled in line with the SDDS prescriptions.
Enthused by the CBE keenness to enhance its disclosure, transparency and communication policy, the report is meant to serve several functions. Generally, it spreads, to a broad array of readers, knowledge of Egypt’s external accounts including the balance of payments, external debt, international investment position and external liquidity. Particularly, it monitors key external sector performance indicators of the economy in order to identify areas of policy needs. The information revealed in this series has also significant implications for decision-making, investment climate, doing-business environment and sovereign credit ratings.
The report contains 5 sections. The first two give a performance
portrait of the key components of Egypt's Balance of Payments (BOP), and external liquidity. The third and fourth review developments related to Egypt’s external debt in its different classifications, in addition to the Egyptian pound exchange rate performance. The fifth section is a statistical part that provides more details on the above mentioned four sections. This is in addition to a part that contains definitions of the key terms used in the report, as well as other miscellaneous information.
The report is downloadable from CBE website www.cbe.org.eg. Hard copies can be obtained from the Economic Research Sector, 8th floor, 54 El Gomhouria Street, Cairo.

Central Bank of Egypt – External Position
Table of Contents Page
Overview Section I: Balance of Payments BOP Performance. 1 1-Current Account 1 2-Capital and Financial Account 4 Section II: External Liquidity A -Net International Reserves (NIR) 7 B -Net Foreign Assets of Banks (NFA) 7 Section III: External Debt A - Breakdown by Maturity 9 B - Breakdown by Type 10 C - Breakdown by Currency 10 D - Breakdown by Creditor 11 E - Breakdown by Debtor 11 F- External Debt Indicators 12 Section IV: Exchange Rate Developments 13 Statistical Section: Appendix I 1- Balance of Payments 17 2- International Investment Position (IIP) 19 3- Coordinated Portfolio Investment Survey
(CPIS)
20 4- NIR & NFA at Banks 21 5-External Debt by Type 22 6-External Debt Indicators 23 7-External Debt by Debtor 24 8-Exchange Rates 25 Appendix II A- Medium- and Long-Term External Debt 29-43 B- Projected Medium- and Long-Term Public
and Publicly Guaranteed External Debt Service
44-58
C- Exchange Rates of the Currencies of External Debt versus US Dollar
59
Appendix III Box. (1): Egypt's Subscription to SDDS and
Data Quality Dimensions
61 Box. (2): Egypt's Data Quality Dimensions 62 Box. (3): Doing Business in Egypt 63 Box. (4): Tourism Sector Performance 64 Definitions and Terminology 65

Central Bank of Egypt – External Position
Overview Egypt's transactions with the external world ran an overall BOP surplus of US$ 3.7 billion in July/Sept. of FY 2013/2014 (against a deficit of US$ 518.7 million in the respective period a year earlier). The current account achieved a surplus of US$ 757.0 million and the capital and financial account resulted in a net inflow of US$ 4.0 billion. The surplus in the current account was attributed to the rise in unrequited transfers to US$ 8.3 billion (from US$ 4.9 billion)), and the improvement of the trade deficit to US$ 7.7 billion (from US$ 7.8 billion). However, the rise in the current account surplus was mitigated by the dramatic fall (91.8 percent) in services surplus, which registered a comparatively low figure of US$ 135.8 million during the reporting period (against US$ 1.6 billion). The capital and financial account revealed that portfolio investment in Egypt reversed to a net inflow of about US$ 1.3 billion (from a net outflow of US$ 327.1 million). In addition, FDI in Egypt recorded a net inflow of US$ 1246.4 million (against US$ 1164.1 million). Egypt's International Investment Position (IIP)* continued to register net liabilities, realizing US$ 65.2 billion at end-Dec. 2012, up from US$ 52.6 billion at end-Dec. 2011 and US$ 43.5 billion at end-Dec. 2010. Net international reserves (NIR) increased by US$ 3.8 billion during
July/September 2013/14, to reach US$ 18.7 billion at end of September 2013, covering 4.1 months of merchandise imports. The increase was mainly ascribed to the rise in foreign currencies by about US$ 3.7 billion worth. On December 30, 2012, the CBE decided to introduce a new mechanism, to run alongside with the foreign exchange interbank system. The new mechanism is a regular auction for buying/selling US dollar (FX Auction) through which banks offer their bids to CBE. During the report’s preparation, NIR reached US$ 17.0 billion at end of December 2013. Banks' net foreign assets amounted to US$ 11.9 billion at end of September 2013, down by US$ 0.3 billion from end of June’s level. Total external debt increased by US$ 3.8 billion to US$ 47.0 billion at end - September 2013, from US$ 43.2 billion at end of June. The external debt has remained within manageable limits and its position continued to have a favorable structure, with 91.5 percent of the total representing the share of the medium- and long- term debt. Although the size of external debt has increased over the transitional period, the external debt traditional and sustainability indicators have remained within manageable limits. The weighted average of the inter-bank foreign exchange market rate reached EGP 6.882 per US dollar at end of Sept. 2013, against EGP 7.009 at end of June. Accordingly, the Egyptian pound inter-bank rate appreciated by 1.8 percent during July/Sept. of FY 2013/2014.
__________________________ * IIP statement was first introduced in Volume 20 of the External Position Report, to be updated annually at end
of December each year within the SDDS requirements.
Section I
Balance of Payments (BOP)

Central Bank of Egypt – External Position 1 BOP Performance
gypt's BOP ran an overall
surplus of US$ 3.7 billion in July/Sept. of FY 2013/2014 (against a deficit of US$ 518.7 million in the respective period a year earlier).The improvement in BOP performance came on the back of the surplus of US$ 757.0 million in the current account (against a deficit of US$ 1.3 billion). In addition, the capital and financial account unfolded a rise in net inflows to US$ 4.0 billion (from US$ 1.5 billion). Chart (1) shows developments in Egypt’s BOP main components, on quarterly basis.
1 - Current Account The current account achieved a surplus of US$ 757.0 million during July/Sept. of FY 2013/2014 (0.3 percent of GDP) against a deficit of US$ 1.3 billion (0.4 percent of GDP), thanks to the surge in net unrequited transfers to US$ 8.3 billion (from US$ 4.9 billion), and the fall in the trade deficit to US$ 7.7 billion (from US$ 7.8 billion). However, services and income surplus decreased by 91.8 percent to
register US$ 135.8 million (against US$ 1.6 billion). 1.1: Trade on Goods The trade volume decreased by 1.4 percent, to reach US$ 19.6 billion (6.6 percent of GDP). The trade deficit narrowed by US$ 0.1 billion, to US$ 7.7 billion during July/September 2013/14 (2.6 percent of GDP) from US$ 7.8 billion (2.7 percent of GDP) during the corresponding quarter, due to the following developments: Merchandise exports (FOB) decreased to US$ 5.9 billion, due to a decrease in non-oil exports by 11.8 percent (53.1 percent of total exports) and an increase in oil exports by 14.2 percent. As a result, the export/import ratio increased to 43.6 percent during July/September 2013/14, from 43.5 percent. Merchandise imports (CIF) decreased by 1.5 percent to US$ 13.6 billion, due to the decrease in non-oil imports by 2.2 percent (78.3 percent of total imports) and the pickup in oil imports by 1.4 percent.
E
Chart(2):Oil & Non oil Exports and Imports July / September
-20.0
-15.0
-10.0
-5.0
0.0
5.0
10.0
2011/2012 2012/2013 2013/2014
US $ bn
oil exports non oil exports oil imports non oil importsTrade balance
Chart (1): BOP Recent Performance
-4.0
-3.0
-2.0
-1.0
0.0
1.0
2.0
3.0
4.0
5.0
6.0
Q1 Q2 Q3 Q4 Q1
2012/2013 2013/2014
US$ bn
Current Account BalanceCapital & Financial AccountOv erall Balance
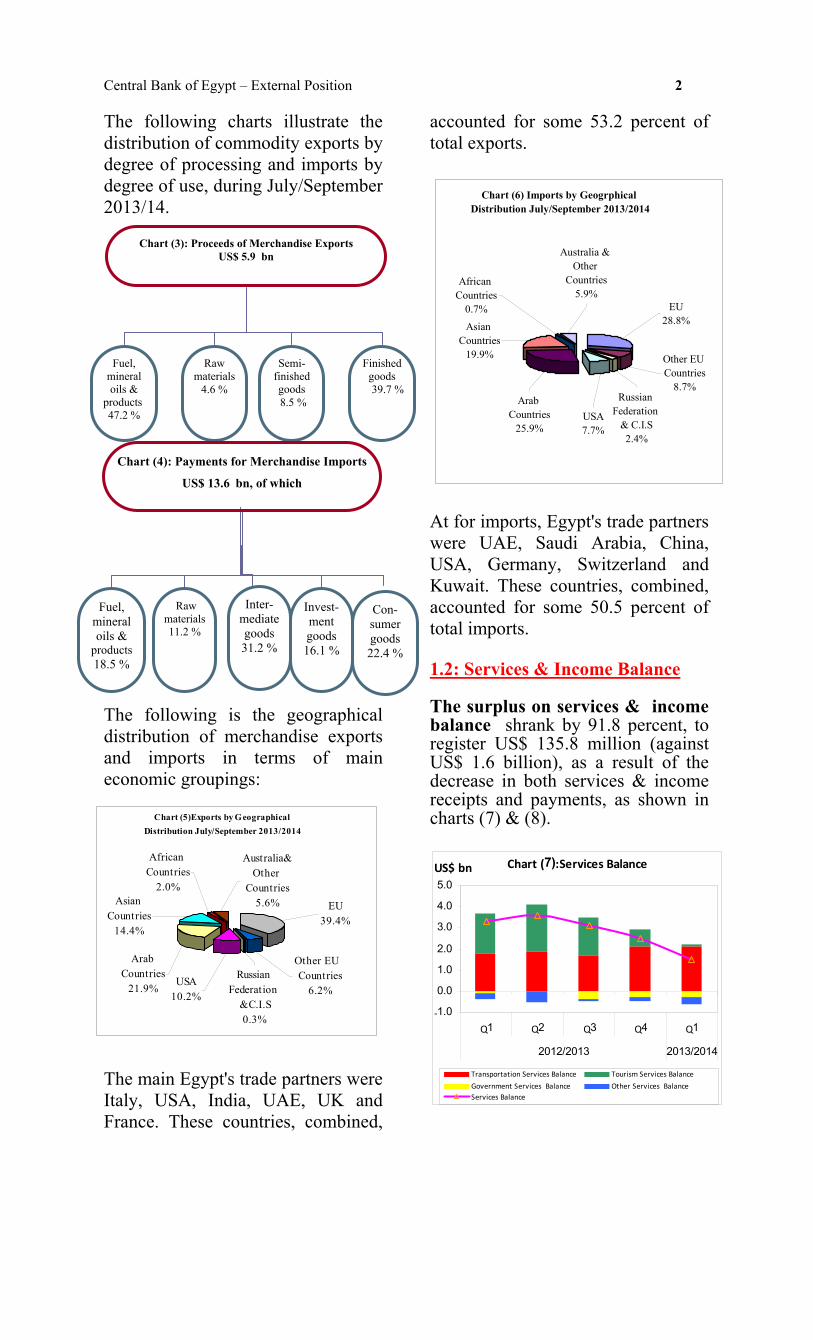
Central Bank of Egypt – External Position 2 The following charts illustrate the distribution of commodity exports by degree of processing and imports by degree of use, during July/September 2013/14.
The following is the geographical distribution of merchandise exports and imports in terms of main economic groupings: The main Egypt's trade partners were Italy, USA, India, UAE, UK and France. These countries, combined,
accounted for some 53.2 percent of total exports.
Chart (6) Imports by Geogrphical Distribution July/September 2013/2014
EU28.8%
Russian Federation
& C.I.S2.4%
Other EU Countries
8.7%
USA7.7%
Arab Countries
25.9%
Asian Countries
19.9%
Australia & Other
Countries5.9%
African Countries
0.7%
At for imports, Egypt's trade partners were UAE, Saudi Arabia, China, USA, Germany, Switzerland and Kuwait. These countries, combined, accounted for some 50.5 percent of total imports. 1.2: Services & Income Balance The surplus on services & income balance shrank by 91.8 percent, to register US$ 135.8 million (against US$ 1.6 billion), as a result of the decrease in both services & income receipts and payments, as shown in charts (7) & (8).
Chart (3): Proceeds of Merchandise Exports US$ 5.9 bn
Fuel, mineral oils &
products47.2 %
Raw materials
4.6 %
Semi-finished goods 8.5 %
Finished goods 39.7 %
Chart (4): Payments for Merchandise Imports
US$ 13.6 bn, of which
Fuel, mineral oils &
products 18.5 %
Raw materials11.2 %
Inter-mediate goods 31.2 %
Invest-ment goods 16.1 %
Con-sumer goods 22.4 %
Chart (5)Exports by Geographical Distribution July/September 2013/2014
EU39.4%
Russian Federation
&C.I.S0.3%
Other EU Countries
6.2%USA
10.2%
Arab Countries
21.9%
Asian Countries
14.4%
Australia&Other
Countries5.6%
African Countries
2.0%
Chart (7):Services Balance
‐1.0
0.0
1.0
2.0
3.0
4.0
5.0
Q1 Q2 Q3 Q4 Q1
2012/2013 2013/2014
US$ bn
Transportation Services Balance Tourism Services Balance
Government Services Balance Other Services BalanceServices Balance

Central Bank of Egypt – External Position 3 1.2.1: Services & income receipts decreased by 29.8 percent, to US$ 4.0 billion (against US$ 5.6 billion), driven by the decrease in the main items as follows: • Tourism revenues by 64.7 percent
to US$ 931.1 million (from US$ 2.6 billion), reflecting the decline of 57.0 percent in the number of tourist nights to register 15.3 million nights (against 35.5 million nights), and also the decline in the average spending of tourist to US$ 61.0 per night (against US$ 74.4). See Appendix III, Box 4.
• Other services receipts by 31.0
percent to about US$ 436.1 million (against US$ 632.4 million), mainly due to the decline in communication services , legal & consultation fees, computer services & subscription for magazines, and construction services.
• Government services receipts by
8.4 percent to US$ 74.5 million (against US$ 81.3 million), reflecting lower expenses of foreign embassies in Egypt, and other government receipts.
• Investment income receipts by 3.5
percent to US$ 54.9 million (from US$ 56.9 million), mainly due to the decrease in other investment income receipts.
Conversely, transportation receipts increased by 10.4 percent to US$ 2.5 billion (against US$ 2.2 billion), spurred by the larger receipts of Egyptian shipping companies, and the 6.5 percent increase in Suez Canal receipts to reach US$ 1.4 billion (against US$ 1.3 billion).
1.2.2: Services & income payments decreased by 4.2 percent, to about US$ 3.8 billion (against US$ 4.0
billion). This was attributed to the decrease in the following items: • Investment income payments by
14.0 percent to US$ 1.4 billion (against US$ 1.7 billion), as a result of lower transfers of foreign companies’ profit and interest and dividends on bonds and securities.
• Other services payments by 17.4
percent, to about US$ 784.8 million (against US$ 950.5 million), driven by lower amounts transferred by foreign petroleum companies, insurance and communications services.
• Transportation payments by 9.9
percent to US$ 391.8 million (against US$ 435.0 million), due to lower payments of foreign shipping and airline companies.
• Conversely, travel payments
increased by 17.3 percent, to US$ 849.4 million (against US$ 724.0 million), mainly due to the rise in visa card payments, and expenses of pilgrimage services, and conferences participation.
• Government services payments
increased to US$ 363.9 million (from US$ 215.8 million), reflecting the increase in other government payments, expenses of government medication, and Egyptian embassies abroad.
Chart(8): Income Balance
‐2.0‐1.5‐1.0‐0.50.00.51.01.52.02.5
Q1 Q2 Q3 Q4 Q1
2012/2013 2013/2014
US $ bn
Income Receipts Income Payments Income Balance

Central Bank of Egypt – External Position 4 1.3: Unrequited transfers (Net) As shown in chart (9), unrequited transfers (net) increased by 69.9 percent, to US$ 8.3 billion, (from US$ 4.9 billion). It reflected the pickup in net official transfers (cash and commodity) to US$ 4.3 billion (from US$ 40.4 million), and the decline in net private transfers by 16.9 percent, to US$ 4.0 billion (mainly due to the decrease in workers' remittances by 16.3 percent to US$ 4.1 billion). Against this background, some of the external balance indicators improved as shown in chart (10). 2- Capital and Financial Account The capital and financial account unfolded a rise in net inflows to US$ 4.0 billion (from US$ 1.5 billion) as
an outcome of the following developments: A-Portfolio investment in Egypt reversed to a net inflow of US$ 1.3 billion (from a net outflow of US$ 327.1 million), mainly due to the issuance of Egyptian government bonds at a value of US$ 1.0 billion. B - Foreign direct investment (FDI) in Egypt stepped up to US$ 1246.4 million (from US$ 1164.1 million). This was primarily an outcome of the increase in the net inflows of the oil sector by 44.2 percent to US$ 878.6 million (from US$ 609.2 million), and the retreat in net inflows of greenfield investments to US$ 339.5 million (from US$ 540.1 million) . The sectoral breakdown of total FDI inflows as depicted in chart (11) shows that the petroleum sector has the lion's share of 80.4 percent. Apart from the oil sector, the majority of FDI went to the manufacturing sector. with 2.1 percent. The services sectors followed, with 2.0 percent distributed as follows: the real estate sector (1.2 percent), the financial sector (0.5 percent) and other services sectors (0.3 percent). The share of the construction sector was 0.5 percent, the agriculture sector 0.1 percent, and the remaining portion was acquired by undistributed figures. C- Medium & long term loans and suppliers' credit realized net repayments of US$ 598.6 million, (against US$ 509.2 million). This was an outcome of the increase in total repayments to US$ 814.9 million (from US$ 790.4 million), and the fall in total disbursements to US$ 216.3 million (from US$ 281.2 million).
Chart (10): External Balance Indicators July/Sept.
92.7
92.9
141.2
43.5
79.9
104.3
103.5
43.6
-10.0 10.0 30.0 50.0 70.0 90.0 110.0130.0 150.0
Current Receipts (excluding officialtransfers) / Current Pay ments
Current Receipts / Current Pay ments
Services Receipts / Services Pay ments
Merchandise Exports / MerchandiseImports
(%)
2012/2013 2013/2014
Chart (9): Unrequited Transfers (Net)
-1.02.03.04.05.0
Q1 Q2 Q3 Q4 Q1
2012/2013 2013/2014
US$ bn
Private Transfers (Net) Official Transfers (Net)
Workers' Remittances

Central Bank of Egypt – External Position D- Short term suppliers' credit
recorded a net outflow of US$ 347.9 million (against a net inflow of US$ 73.8 million).
5 E- Net foreign assets and liabilities
of the banking sector and other sectors posted an inflow of US$ 2.5 billion, (against US$ 1.2 billion), mainly because of the pickup in the deposits transferred from some Arab countries.
Chart (11): Total FDI in Egypt by Economic SectorJuly/Sept. 2013/2014
Petroleum sector80.4%
Manufacturing sector2.1%
Agriculture sector0.1%
Construction sector0.5%
Undistributed sectors14.9%
Services sector2.0%
Real Estate sector1.2%
Financial sector0.5%
Other services0.3%
Communication sector0.02%
Tourism sector0.02%

Section II
External Liquidity

Central Bank of Egypt – External Position 7
External Liquidity A-Net International Reserves (NIR) In order to enhance the efficiency of the forex market, CBE decided to introduce a new mechanism, to run alongside with the foreign exchange interbank system. The aim is to organize trading on the forex market and avoid depletion of international reserves that have reached critical levels, covering merely three months of merchandise imports. The new mechanism is a regular auction for buying/selling US dollar (FX Auction) through which banks offer their bids to CBE. The mechanism became effective 30 December 2012. During July/September 2013/14, NIR increased by US$ 3.8 billion (against a decline of US$ 0.5 billion during the corresponding period a year earlier) to reach US$ 18.7 billion at end of September 2013, covering 4.1 months of merchandise imports. The increase was mainly ascribed to the rise in foreign currencies by about US$ 3.7 billion worth.
While this report was under preparation, NIR reached US$ 17.0 billion at end of December 2013.
(US$ mn) End of June
2013 Sept. 2013
Net International Reserves (1-2)
14936 18709
1- Gross Official Reserves 14960 18734 Gold 2463 2463 SDRs 1233 1257 Foreign Currencies 11181 14929 Loans to IMF 83 85 2- Reserve Liabilities 24 25 Reserves/Months of Imports 3.1 4.1
B- Net Foreign Assets of Banks
(NFA) Banks’ net foreign assets declined by US$ 0.3 billion during July/ September 2013/14 (against US$ 0.4 billion in the corresponding period a year earlier) to reach US$ 11.9 billion at end of September 2013.
Foreign Assets & Liabilities of Banks
18.9 18.216.9 16.7
5.5 5.1 4.8 4.8
0.0
5.0
10.0
15.0
20.0
25.0
June 12 Sept. 12 June 13 Sept. 13
US$ bn Assets Liabilities
( End of Month)Chart (2)
ChartNIR & Months of Imports Covered
0.0
3.0
6.0
9.0
12.0
15.0
18.0
June 12 Sept. 12 June 13 Sept. 13
US$ bn
3.0
4.0
5.0(Month)
Foreign CurrenciesLoans to IMFGoldReserves/Months Imports
( Balance at end of Month )Chart (1)

Central Bank of Egypt – External Position 8
Foreign currency deposits with banks decreased by 2.5% during July/September 2013/2014, reaching US$ 31.2 billion at end of September 2013, while local currency deposits increased by 3.9%. As such, the ratio of foreign currency deposits to total deposits at end of September 2013, made up 19.9%, against 21.3% at end of June.
Chart (3)
Developments in Deposits by Local and Foreign Currencies
0100200300400500600700800900
10001100
June 12 Sept. 12 June 13 Sept. 13
LE bn
-5.0
0.0
5.0
10.0
15.0
20.0
Foreign Currency Deposits
Local Currency Deposits
Growth Rate of Local Currency DepositsGrowth Rate of Foreign Currency Deposits
( End of Month)%
Chart (3)
Section III
External Debt

Central Bank of Egypt – External Position 9
External Debt gypt's external debt increased to US$ 47.0 billion at end-
September 2013, from US$ 43.2 billion at end-June. This brings the increase in the stock of debt to US$ 3.8 billion, driven by the net disbursements of foreign loans, facilities and deposits in the amount of US$ 3.3 billion and the valuation effects1 of US$ 460.8 million.
A- Breakdown by Maturity By original maturity, external debt reaffirmed, at end-September 2013, its usual pattern of long-term debt predominance. Long-term debt accounted for US$ 32.8 billion or 69.8% of the total, whereas medium-term debt reached US$ 10.2 billion or 21.7% and short-term debt accounted for the smallest portion of US$ 4.0 billion or 8.5%.
1 The valuation effects arise because external debt is denominated in different currencies and the US dollar value, which is the international numeraire for indicating debt numbers, fluctuates over time vis-à-vis these currencies.
By residual maturity2, medium- and long-term debt represented 84.4 percent of the total debt. In comparison, they accounted for 91.5 percent of the total by original maturity. Similarly, short-term debt showed an increase, as it represented 15.6 percent, compared to 8.5 percent classified by original maturity.
2 While the analytical presentation of external debt by original maturity is the norm recommended in the External Debt Statistics Guide, residual maturity presentation still draws significant attention. In other words, compilation of external debt statistics based on original maturity helps in understanding the nature of capital flows; while the remaining maturity provides a profile of debt service payments, especially those falling due in the near term, and of potential liquidity risks facing the economy. Short-term debt by residual maturity comprises all components of short-term debt with original maturity of up to one year, and the amounts falling due -under medium and long-term debt by original maturity- within one year or less.
E
Short-term Debt by Residual Maturity End-September 2013
(US$ million)
1. Short-term debt by original maturity 4007.8
2. Medium & long-term debt maturing within one year 3313.2
3. External debt by residual maturity up to 1 year (1+2) 7321.0
Percentage to Total External Debt 15.6
Percentage to NIR 39.1
4. Medium & long-term debt by residual maturity 39696.1
Percentage to Total External Debt 84.4
Chart (1)External Debt by O riginal Maturity
End of September 2013
Long- Term69.8%
Medium- Term21.7%
Short- Term8.5%

Central Bank of Egypt – External Position B- Breakdown by Type Medium- and long-term debt accounted for 91.5 percent of total debt, of which: • Bilateral loans (rescheduled and
non-rescheduled) owed to Paris Club members and suppliers’ & buyers’ credit, reached US$ 13.4 billion or 28.6 percent of total debt.
• Non-Paris Club members' debt amounted to US$ 2.4 billion or 5.2 percent of total debt.
• International and regional
organizations' debt reached US$ 12.0 billion or 25.6 percent of total debt, up by US$ 65.0 million, compared to end-June 2013 level.
• Government bonds and notes
increased by US$ 959.0 million, to around US$ 6.1 billion or 13.0 percent of total debt at end-September 2013. These include: (i) US$ 1.3 billion of guaranteed 10–year notes, issued in Sept. 2005; (ii) US$ 867.6 million of 10- and 20-year sovereign notes issued in April 2010; (iii) US$ 500.0 million of the 5–year Treasury bond issued in June 2012 to Saudi Fund for Development; and (iv) US$ 3.5 billion of the Euro-Medium Term Notes issued in May 2013.
• A long-term deposit of US$ 9.0
billion from Arab countries was placed at the Central Bank of Egypt.
• Non-guaranteed medium- and
long-term debt of the private sector remained unchanged at US$ 17.3 million at end - September 2013.
10 Short-term debt decreased by US$ 3.1 billion to US$ 4.0 billion or 8.5 percent of total debt. This was mainly due to a decrease in non-residents' deposits (including Arab countries' deposits at the CBE) by 55.2 percent to reach US$ 2.4 billion, and short-term credit by US$ 6.7 percent to US$ 1.6 billion. C- Breakdown by Currency Measuring the currency composition of Egypt's external debt is an important indicator that sheds light on the external debt exposure, arising from currency markets' volatility. A breakdown of the currency composition of external debt indicates that the US dollar is the main borrowing currency, with a relative importance of 61.5 percent of the total. This upward biased share of US dollar largely reflects the fact that there are other outstanding obligations in US dollar to creditors other than the USA (such as the African Development Bank and the International Bank for Reconstruction and Development).
Chart (2) External Debt StructureEnd of September 2013
Rescheduled bilateral debt
19.3%
Other bilateral debt
13.2%
International & regional
organizations25.6%
Egyptian bonds and notes
13.0%
Suppliers' & buyers' credits
1.3%
Long- term deposits19.1%
Short- term debt8.5%

Central Bank of Egypt – External Position Other important currencies were: the euro which is the runner-up (18.0 percent), the Japanese yen (6.8 percent), the Special Drawing Rights* (5.8 percent) and the Kuwaiti dinar (5.2 percent). These currencies combined accounted for 35.8 percent of the total debt. D- Breakdown by Creditor Distribution by creditor country indicates that 25.3 percent of Egypt's external debt came from four countries; namely Germany (7.6 percent), Japan (6.5 percent), France and USA (5.6 percent for each). Meanwhile, 25.6 percent was owed to international organizations**; (mainly IBRD 7.1%, EIB 4.2% and ADF & AfDB 3.7%) and 26.0 percent to Arab countries (mainly Saudi Arabia***, Kuwait and United Arab Emirates).
_____________________________________
∗ Including Egypt’s allocation of SDRs by the IMF. ∗∗ International Bank for Reconstruction and Development
(IBRD), European Investment Bank (EIB), African Development Fund (ADF), African Development Bank (AfDB).
11 E- Breakdown by Debtor The structure of Egypt’s external debt by debtor reveals that the central and local government is the main debtor, with about US$ 29.4 billion or 62.5 percent of the total external debt at end-September 2013, compared with about US$ 28.5 billion or 65.9 percent at end-June. External debt by institutional sectors showed an increase of US$ 3.8 billion during the period under review. The bulk was in monetary authority's outstanding balances at end- September 2013, with a rise of US$ 3.0 billion (mainly due to Arab countries' deposits at CBE). Central and local government debt position increased as well, by US$ 0.9 billion. In contrast, banks' debt decreased by US$ 18.8 million and other sectors' debt by US$ 124.8 million. ____________________________________________ ∗∗∗ Including the US$ 3.0 billion as a long term deposit from
the Saudi Fund for Development at CBE. However, it does not include the US$ 500 million which is classified as a 5-year Treasury bond issued in June 2012 to Saudi Fund for Development.
Chart (3) External Debt by Major CurrenciesEnd of September 2013
Euro18.0%
SDRs5.8%
Other currencies
1.1%
Egy ptian Pound0.7%
Kuwaiti dinar5.2%
Japanese y en
6.8%Swiss f ranc0.9%
US dollar 61.5%
Chart (4) External Debt by Creditor
Other countries8.2%
Arab countries26.0%
United Kingdom1.9%
Germany7.6%
France5.6%
Japan6.5%
USA5.6%
Egyptian bonds and notes
13.0%
International organizations
25.6%
September2013
Chart (5) External Debt by DebtorEnd of September
05
101520253035404550
201320122011
(US$ bn)
Central & Local Gov ernment Monetary Authority BanksOther Sectors
Chart (6) External Debt by DebtorShare inTotal Increase/Decrease
July/September
(1027.6)(165.4)
897.3
(3.9)
517.8
3030.0
(65.3) (31.7) (18.8)
189.0 14.7
(124.8)-2000-1000
01000200030004000500060007000
2011/12 2012/13 2013/14
(US$ mn)
Central & Local Gov ernmentMonetary Authority BanksOther Sectors

Central Bank of Egypt – External Position 12 F- External Debt Indicators*
As the country scrambled to raise funds to meet higher financing needs through accepting official deposits and issuing new bonds, traditional external debt indicators showed an increase during July/September 2013/2014. However, Egypt’s external debt has remained within manageable limits as indicated by external debt to GDP ratio of 15.8 percent at end of September 2013 (compared with 12.0 percent at end - September 2012) and debt service ratio** of 11.0 percent during July/September 2013/2014 (compared with 10.3 percent).
The ratio of short-term debt to net international reserves increased from 19.6 percent at end - September 2012 to 21.4 percent at end - September 2013. In addition, its ratio to total debt remained steady at 8.5 percent. The external debt per capita increased to US$ 532.8 at end - September 2013, from US$ 393.5 at end - September 2012. Medium- and long-term debt service payments decreased by US$ 200.7 million to US$ 1.1 billion, as a result of the US$ 167.5 million decrease in principal repayments, to reach US$ 914.9 million, and the US$ 33.2 million decrease in interest pay-ments, to US$ 178.7 million.
______________________ * For more indicators, refer to appendix I, table No 6. **Debt-Service Ratio, The ratio of debt service (interest and principal payments due) during a year, expressed
as a percentage of exports (typically of goods and services) for that year. This ratio is considered to be a key indicator of a country’s debt burden.
Chart (7) External Debt Indicators July / September
6.0
8.5
7.4
19.621.4
8.5
10.3 11.0
0
5
10
15
20
25
2010/11 2011/12 2012/13 2013/14
%
Debt Serv ice / Current Receipts (including transf ers)Short-term Debt / Net International Reserv esShort-term Debt / Total External DebtDebt Serv ice / Exports of Goods and Serv ices
73.2
62.5
12.0 15.8
393.5
532.8
0
15
30
45
60
75
90
2010/11 2011/12 2012/13 2013/14
%
0
100
200
300
400
500
600
(US$)
Government External Debt / External Debt External Debt /GDP External Debt per capita (US$) (right axis)

Section IV
Exchange Rate Developments
Central Bank of Egypt – External Position 13
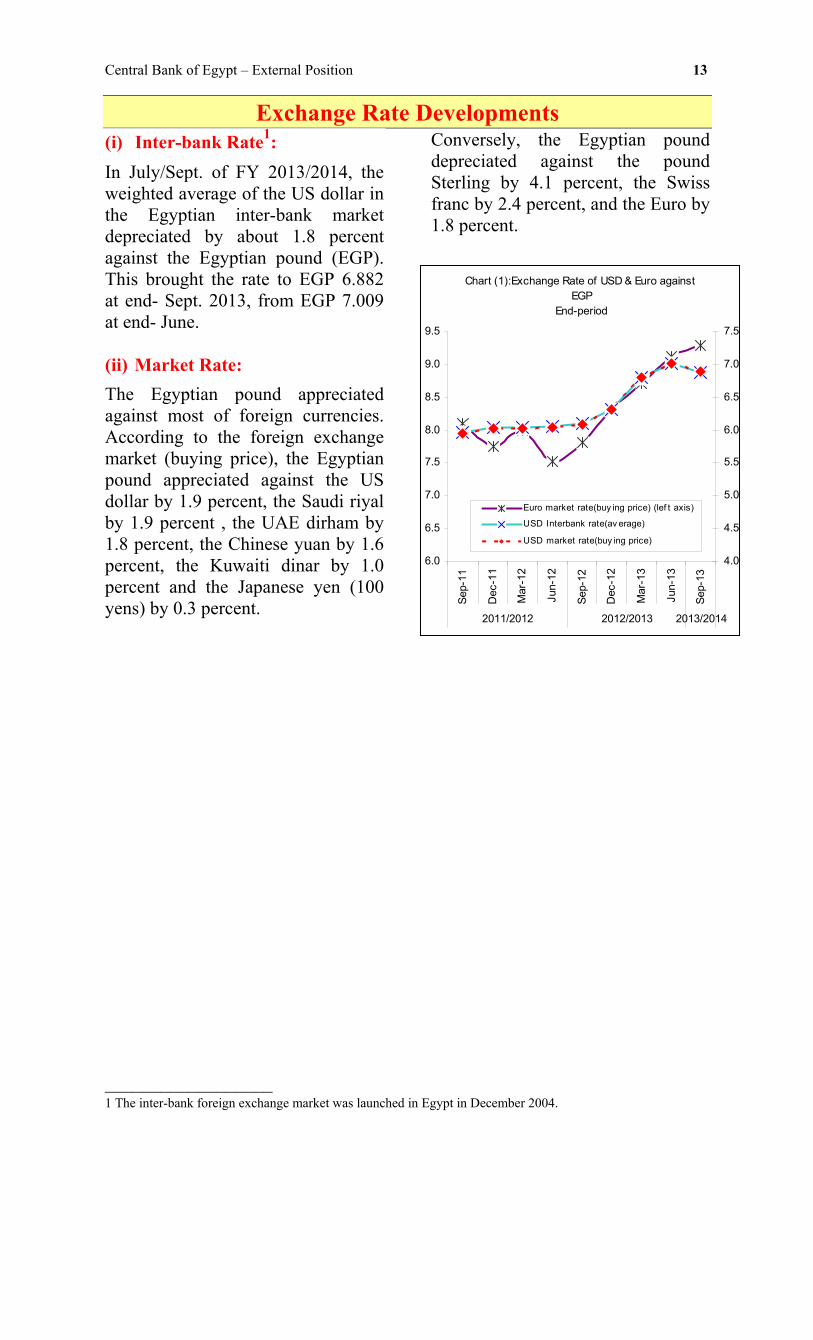
Exchange Rate Developments(i) Inter-bank Rate1: In July/Sept. of FY 2013/2014, the weighted average of the US dollar in the Egyptian inter-bank market depreciated by about 1.8 percent against the Egyptian pound (EGP). This brought the rate to EGP 6.882 at end- Sept. 2013, from EGP 7.009 at end- June. (ii) Market Rate: The Egyptian pound appreciated against most of foreign currencies. According to the foreign exchange market (buying price), the Egyptian pound appreciated against the US dollar by 1.9 percent, the Saudi riyal by 1.9 percent , the UAE dirham by 1.8 percent, the Chinese yuan by 1.6 percent, the Kuwaiti dinar by 1.0 percent and the Japanese yen (100 yens) by 0.3 percent.
Conversely, the Egyptian pound depreciated against the pound Sterling by 4.1 percent, the Swiss franc by 2.4 percent, and the Euro by 1.8 percent.
__________________ 1 The inter-bank foreign exchange market was launched in Egypt in December 2004.
Chart (1):Exchange Rate of USD & Euro against EGP
End-period
6.0
6.5
7.0
7.5
8.0
8.5
9.0
9.5
Sep-
11
Dec
-11
Mar
-12
Jun-
12
Sep-
12
Dec
-12
Mar
-13
Jun-
13
Sep-
13
2011/2012 2012/2013 2013/2014
4.0
4.5
5.0
5.5
6.0
6.5
7.0
7.5
Euro market rate(buy ing price) (lef t axis)
USD Interbank rate(av erage)
USD market rate(buy ing price)

Statistical Section

Central Bank of Egypt – External Position
Appendix I
Table Page
I- Balance of Payments
BOP Current Account ………………………………………. 1 17
BOP Capital and Financial Account (contd.) ………………. 18
II- International Investment Position (IIP) 2 19
III- Coordinated Portfolio Investment Survey (CPIS) 3 20
IV- External Liquidity
NIR & NFA at Banks ………………………………………. 4 21
V- External Debt
External Debt by Type …………………………………........ 5 22
External Debt Indicators …………………………………….
External Debt by Debtor …………………………………….
6
7
23
24
VI- Exchange Rate Developments
Exchange Rates (In Egyptian Pound per foreign currency unit) 8 25

Central Bank of Egypt - External Position 17
(US$ mn)
2012/2013* 2013/2014*
Trade Balance -7812.6 -7687.1
Exports** 6014.9 5939.2 Petroleum 2439.7 2786.3 Other Exports 3575.2 3152.9
Imports** -13827.5 -13626.3 Petroleum -2914.8 -2955.3 Other Imports -10912.7 -10671.0Services (Net) 1648.4 135.8Receipts 5647.4 3965.3
Transportation, of which : 2236.6 2468.7 Suez Canal 1288.4 1372.6 Travel 2640.2 931.1 Investment Income 56.9 54.9 Government receipts 81.3 74.5 Other 632.4 436.1Payments 3999.0 3829.5
Transportation 435.0 391.8 Travel 724.0 849.4 Investment Income, of which 1673.7 1439.6 Interest Paid 175.7 190.7 Government Expenditures 215.8 363.9 Other 950.5 784.8Balance of Goods & Services -6164.2 -7551.3
Transfers 4903.3 8308.3
Private Transfers (Net) 4862.9 4041.5Official Transfers (Net) 40.4 4266.8Current Account Balance -1260.9 757.0
* Preliminary.** Include free zones exports and imports.
July/Sep.
Table (1) Balance of Payments
+
+

Central Bank of Egypt - External Position 18
(US$ mn)
2012/2013* 2013/2014*
Capital & Financial Account 1499.9 3978.7 Capital Account -38.6 -33.7 Financial Account 1538.5 4012.4
Direct Investment Abroad -25.3 -57.7 Direct Investment in Egypt (Net) 1164.1 1246.4 Portfolio Investment Abroad (Net) -1.1 32.0 Portfolio Investment in Egypt (Net), of which: -327.1 1267.7 Bonds -275.5 959.0
Other Investment (Net) 727.9 1524.0 Net Borrowing -435.4 -946.5
M&L-Term Loans (Net) -508.1 -591.0
Drawings 272.0 215.4
Repayments -780.1 -806.4
MT-Suppliers' Credit (Net) -1.1 -7.6
Drawings 9.2 0.9
Repayments -10.3 -8.5
ST-Suppliers' Credit (Net) 73.8 -347.9 Other Assets 1007.9 -587.2
Central Bank -10.1 -11.4
Banks 723.1 215.4
Other 294.9 -791.2 Other Liabilities 155.4 3057.7
Central Bank 503.1 3001.4
Banks -347.7 56.3
Net Errors & Omissions -757.7 -989.0
Overall Balance -518.7 3746.7
Change in CBE Reserve Assets ,Increase(-) 518.7 -3746.7
* Preliminary.
Table (1) Balance of Payments (contd.)
+ The data was revised, following the oil sector data revision.
July/Sep.
+

End of
Assets Liabilities Assets Liabilities Assets Liabilities Assets Liabilities
Total 72701.8 102438.6 79806.1 123261.2 57785.0 110385.7 50914.8 116143.11-Direct investment 4272.9 66709.0 5448.4 73094.6 6073.9 72611.9 6285.0 75409.62-Portfolio investments 4120.2 4108.2 9691.4 18241.1 3368.6 6526.0 3334.2 4574.0
Equity security 965.7 1756.9 961.0 3481.3 796.1 2770.1 717.8 1786.7Debt security 3154.5 2351.3 8730.4 14759.8 2572.5 3755.9 2616.4 2787.3
3-Other investments 30839.3 31621.4 28472.7 31925.5 30030.0 31247.8 26444.6 36159.5 Trade credits 1291.2 1869.5 2123.3 1753.5 General government 0.0 Other sectors 1291.2 1869.5 2123.3 1753.5 Short-term 1291.2 1869.5 2123.3 1753.5 Loans 3177.5 27659.4 3552.8 27392.8 2756.1 26847.2 2026.7 27121.5 Monetary authorities 142.2 0.0 80.1 0.0 263.7 0.0 266.3 Other long-term 142.2 80.1 263.7 266.3 General government 23999.5 23767.6 23273.3 23525.4 Long-term 23999.5 23767.6 23273.3 23525.4 Banks 3177.5 661.9 3552.8 705.2 2756.1 668.5 2026.7 854.8 Long-term 1132.5 654.4 1832.2 705.2 1590.0 668.5 1100.5 854.8 Short-term 2045.0 7.5 1720.6 0.0 1166.1 0.0 926.2 0.0 Other sectors 2855.8 0.0 2839.9 0.0 2641.7 0.0 2475.0 Long-term 2855.8 2839.9 2641.7 2475.0 Currency and deposits 25989.4 1262.3 24919.9 1279.5 27273.9 902.3 24417.9 5903.7 Monetary authorities 0.0 0.0 5000.0 Long-term 1000.0 Short-term 4000.0 Banks 12629.4 1262.3 12254.9 1279.5 14383.9 902.3 12938.9 903.7 Other sectors 13360.0 12665.0 12890.0 11479.0 Other assets 1672.4 1408.5 0.0 1383.7 0.0 1375.0 0.0 1380.8 Monetary authorities 1672.4 1408.5 0.0 1383.7 0.0 1375.0 0.0 1380.8 Long-term 1408.5 1383.7 1375.0 1380.8 Short-term 1672.4 0.0 0.0 0.0 General government 0.0 0.0 0.0 0.0 0.0 0.0 Banks 0.0 0.0 0.0 0.0 0.0 0.0 0.0 0.0 Other sectors 0.0 0.0 0.0 0.0 0.0 0.04-Reserve assets 33469.4 36193.6 18312.5 14851.0* Preliminary.
Table (2) International Investment Position (IIP)
19 C
entral Bank of E
gypt - External Position
December 2009 December 2010 December 2011
(US$ millions)
December 2012 *

Central Bank of Egypt - External Position 20
(US$ millions)
Country of non-resident issuers Equities Long-term debt securities Short-term debt securities Total
United States 38.0 892.0 606.6 1536.6Saudi Arabia 280.9 19.7 38.6 339.2Cayman Islands 0.0 153.6 0.0 153.6United Kingdom 40.5 78.7 14.4 133.6United Arab Emirates 9.0 104.4 10.2 123.6Qatar 0.0 80.1 30.7 110.8Turkey 3.2 5.9 96.3 105.4Germany 12.7 74.7 0.4 87.8Switzerland 35.5 37.9 14.3 87.7International Organizations 85.7 0.0 0.0 85.7India 0.2 0.0 81.1 81.3France 40.6 39.5 0.1 80.2Ethiopia 0.0 0.0 58.5 58.5Italy 49.0 0.0 8.9 57.9Bahrain 23.2 11.9 0.0 35.1Malaysia 0.0 34.1 0.0 34.1Belgium 12.0 19.1 0.0 31.1Lebanon 0.0 0.0 25.3 25.3Sudan 4.3 0.0 18.5 22.8Japan 22.0 0.0 0.0 22.0Malta 13.3 0.0 1.0 14.3Netherlands 10.6 1.8 0.0 12.4China, P.R. 3.5 0.0 7.3 10.8Kuwait 2.4 0.0 7.9 10.3Belize 0.0 0.0 10.0 10.0Mozambique 0.0 0.0 9.8 9.8Singapore 7.9 0.0 1.1 9.0Ireland 8.4 0.0 0.0 8.4Pakistan 0.0 4.0 2.0 6.0Poland 5.9 0.0 0.0 5.9Hong Kong SAR of China 5.4 0.0 0.0 5.4Jordan 1.1 0.0 3.8 4.9Luxembourg 1.0 3.0 0.0 4.0Tunisia 0.0 2.7 0.0 2.7Sri Lanka 0.0 0.0 1.7 1.7Ghana 0.0 0.0 1.6 1.6Oman 0.0 0.0 1.6 1.6Spain 0.0 0.0 1.2 1.2Syrian Arab Republic 1.0 0.0 0.0 1.0Nigeria 0.5 0.0 0.0 0.5Kenya 0.0 0.0 0.2 0.2Romania 0.0 0.0 0.1 0.1South Africa 0.0 0.0 0.1 0.1
Total 717.8 1563.1 1053.3 3334.2
Table (3) Egypt's Coordinated Portfolio investment survey (CPIS) at end of December 2012 Breakdown of Portfolio Investment Assets by country of residenc of the (Issuer)

End of June 2011
Sept. 2011
June 2012
Sept. 2012
June 2013
Sept. 2013
Net International Reserves(1-2) 26564 24009 15534 15043 14936 18709 1- Gross Official Reserves 26593 24033 15556 15068 14960 18734
Gold 2743 2743 3303 3303 2463 2463
SDRs 1311 1281 1243 1263 1233 1257
Foreign Currencies 22450 19922 10926 10416 11181 14929
Loans to IMF 89 87 84 86 83 85
2- Reserve Liabilities 29 24 22 25 24 25
Banks' Net Foreign Assets 17809 15628 13462 13086 12121 11850
Assets 23312 20891 18947 18223 16885 16670
Liabilities 5503 5263 5485 5137 4764 4820
Table (4) :Net International Reserves & Net Foreign Assets at Banking System
(US$ mn)
Central B
ank of Egypt - E
xternal Position21

(US$ mn)
Total External Debt 29674.4 28950.9 31923.9 32481.4 32399.2 34699.9 33997.9 34719.9 47017.1
1- Medium & Long term debt : 27937.9 27314.2 30147.0 29830.7 29970.3 31829.0 31012.0 31775.3 43009.3
Rescheduled bilateral debt 15373.3 14965.3 15068.8 14385.8 14067.8 12897.9 12086.7 10626.3 9085.2
ODA 7707.0 7524.4 7524.4 7410.1 7538.0 7235.6 7092.8 6576.4 5843.6
Non-ODA 7666.3 7440.9 7544.4 6975.7 6529.8 5662.3 4993.9 4049.9 3241.6
Other bilateral debt 4272.7 4298.8 4492.1 4719.8 5021.5 4976.5 5208.1 5239.9 6169.6
Paris Club countries 3528.6 3601.4 3754.2 3890.6 4152.9 4072.5 4155.3 4068.0 3738.1
Other countries 744.1 697.4 737.9 829.2 868.6 904.0 1052.8 1171.9 2431.5
International & regional Organizations 5088.1 5218.9 7084.2 7270.7 8513.2 10405.0 10794.6 11356.3 12028.3
Suppliers' & buyers' credits 747.4 868.6 794.8 750.9 367.6 404.3 409.5 416.7 591.3
Egyptian bonds and notes 1846.1 1578.8 2633.2 2620.6 1916.6 3087.9 2495.6 2625.2 6117.6
Long- term deposits 500.0 300.0 0.0 0.0 0.0 0.0 0.0 1500.0 9000.0
Private sector debt (non-guaranteed) 110.3 83.8 73.9 82.9 83.6 57.4 17.5 10.9 17.3
2- Short-term debt 1736.5 1636.7 1776.9 2650.7 2428.9 2870.9 2985.9 2944.6 4007.8
Deposits 732.9 611.3 636.6 983.5 1326.6 1121.4 947.4 943.0 2371.8 Other short-term facilities 1003.6 1025.4 1140.3 1667.2 1102.3 1749.5 2038.5 2001.6 1636.0
Source: Central Bank of Egypt.+ Provisional
2013+2007 2008 2009 2010
Table (5) External Debt by Type
22C
entral Bank of E
gypt - External Position
End of September 2005 2006 2011 2012

(%)
July / September 2005/06 2006/07 2007/08 2008/09 2009/10 2010/11 2011/12 2012/13 2013/14+
External Debt / Exports (G & S) % 342.9 271.1 265.3 208.6 277.8 271.1 279.2 275.7 474.7
Debt Service * (Principal & Interest) (US$ mn.) 869.0 1153.6 833.1 1007.0 932.8 995.1 1214.7 1294.3 1093.6
Debt Service / Exports (G & S) % 10.0 10.8 6.9 6.5 8.0 7.8 10.0 10.3 11.0
Debt Service / Current Receipts % 8.7 9.5 5.9 5.7 6.6 6.2 7.5 7.4 6.0
Interest / Exports (G & S) % 2.3 2.2 2.1 1.9 2.2 1.8 1.9 1.7 1.8
External Debt / GDP (at current market prices) 27.6 22.3 20.2 17.0 14.7 14.4 12.9 12.0 15.8
Short-term Debt / External Debt 5.9 5.7 5.6 8.1 7.5 8.3 8.8 8.5 8.5
Short-term Debt / Net International Reserves 8.2 6.8 5.9 7.6 7.2 8.1 12.4 19.6 21.4
External Debt per capita (US$) 402.8 385.9 425.5 431.2 430.1 411.1 390.3 393.5 532.8
+ Provisional* includes interest payments on US dollar-denominated bonds and notes holding by nonresedents
23Table (6) External Debt Indicators
Central B
ank of Egypt - E
xternal Position

24
(US$ mn)End of June 2013 % September 2013* % Change (-) %
External Debt 43233.4 100.0 47017.1 100.0 3783.7 8.8Total Medium- & Long-Term 36187.3 83.7 43009.3 91.5 6822.0 18.9Total Short-Term 7046.1 16.3 4007.8 8.5 (3038.3) (43.1)Central & Local Government 28489.6 65.9 29386.9 62.5 897.3 3.1 Medium- & Long-Term 28489.6 65.9 29386.9 62.5 897.3 3.1 Bonds & Notes 5158.6 11.9 6117.6 13.0 959.0 18.6 Loans 23331.0 54.0 23269.3 49.5 (61.7) (0.3) Currency and Deposits Other Liabilities Short-Term 0.0 0.0 0.0 0.0 0.0 0.0 Money Market Instruments Loans Currency and Deposits Other LiabilitiesMonetary Authority 9064.2 20.9 12094.2 25.7 3030.0 33.4 Medium- & Long-Term 4564.2 10.5 10594.2 22.5 6030.0 132.1 Bonds & Notes Loans 213.0 0.5 215.9 0.5 2.9 1.4 Currency and Deposits 3000.0 6.9 9000.0 19.1 6000.0 200.0 Other Liabilities ** 1351.2 3.1 1378.3 2.9 27.1 2.0 Short-Term 4500.0 10.4 1500.0 3.2 (3000.0) (66.7) Money Market Instruments Loans Currency and Deposits 4500.0 10.4 1500.0 3.2 (3000.0) (66.7) Other LiabilitiesBanks 1599.9 3.7 1581.1 3.3 (18.8) (1.2) Medium- & Long-Term Loans 806.5 1.9 709.3 1.5 (97.2) (12.1) Bonds & Notes Loans 806.5 1.9 709.3 1.5 (97.2) (12.1) Currency and Deposits Other Liabilities Short-Term Loans 793.4 1.8 871.8 1.8 78.4 9.9 Money Market Instruments Loans 0.0 0.0 0.0 0.0 0.0 0.0 Currency and Deposits 793.4 1.8 871.8 1.8 78.4 9.9 Other Liabilities 0.0 0.0 0.0 0.0 0.0 0.0Other Sectors 4079.7 9.5 3954.9 8.5 (124.8) (3.1) Medium- & Long-Term 2327.0 5.4 2318.9 5.0 (8.1) (0.3) Loans from Direct Investors Bonds & Notes Trade Credits Loans 2327.0 5.4 2318.9 5.0 (8.1) (0.3) Currency and Deposits Other Liabilities Short-Term 1752.7 4.1 1636.0 3.5 (116.7) (6.7) Loans from Direct Investors Money Market Instruments Trade Credits 1752.7 4.1 1636.0 3.5 (116.7) (6.7) Loans Currency and Deposits Other Liabilities* Provisional.** Representing US$ 1,378.30 million representing SDR allocation by IMF to its member countries, Egypt’s share is SDR 898.45 MM.
Central Bank of Egypt - External Position
Table (7) External Debt by Debtor

First: Interbank Rates *MinimumMaximumWeighted average
Second : Market Rates Buy Sell Buy Sell
US Dollar 7.0119 7.0478 6.8838 6.9210
Euro 9.1225 9.1713 9.2910 9.3420
Pound Sterling 10.6644 10.7225 11.1180 11.1795
Swiss Franc 7.4184 7.4635 7.6022 7.6450
100 Japanese Yens 7.0699 7.1104 7.0516 7.0934
Saudi Riyal 1.8699 1.8790 1.8356 1.8456
Kuwaiti Dinar 24.4786 24.7813 24.2250 24.5287
UAE Dirham 1.9087 1.9190 1.8742 1.8843
Chinese Yuan 1.1424 1.1483 1.1242 1.1309
Source: CBE daily exchange rates.
* The interbank rates were launched on December 23, 2004.
End of June 201325
September 2013
7.00947.0094
Central B
ank of Egypt - E
xternal Position
7.0094
6.88166.88166.8816
Table (8) Exchange Rates (In Egyptian pound per foreign currency unit)

Central Bank of Egypt – External Position
Appendix II
Table Page
I- Medium - and Long -Term External Debt
A- Outstanding Stock …………………………………………………… 1 29
1. Public and Publicly Guaranteed External Debt ……………………… 2 31
a. Paris Club Bilateral Debt ………………………………………….. 3 33
(1) Rescheduled Debt……………………………………………… 4 34
(2) Non- Rescheduled Debt…………………………………........... 5 35
b. Supplier's Credit………………………………………………........ 6 37
c. Other Bilateral Debt…………………………………………........ 7 38
d. Multilateral Institutions…………………………………………… 8 39
2. Private Sector, Non-Guaranteed ……………………………….......... 9 41
B. Outstanding External Short-Term Debt ……………………………........ 10 42
C. Disbursed and Undisbursed Amounts for Signed Loans & Deposits …. 11 43
II- Projected Medium - and Long -Term External Debt Service
Public and Publicly Guaranteed……………………………………………. 12 44
1. Paris Club Debt…………...…………………………………….......... 13 46
a. Rescheduled Debt ………………………………………….…....... 14 48
b. Non-Rescheduled Debt………… ………………………………... 15 49
2. Supplier's Credit………………………………………………........ 16 50
3. Other Bilateral Debt……………………………………………......... 17 51
4. Multilateral Institutions………………………………………............. 18 52
5. Projected Guaranteed Notes …………………………………………. 19 54
6. Projected Sovereign Notes ………………………………………....... 20 55
7. Projected Saudi Bond ………………………………………………... 21 56 8. Projected Euro-Medium Term Notes (E.M.T.N)……………………. 22 57 9. Projected Deposits …………………………………………………… 23 58
III- Exchange Rates of the Currencies of External Debt Versus
US Dollar
24
59
Central Bank of Egypt - External Position 29
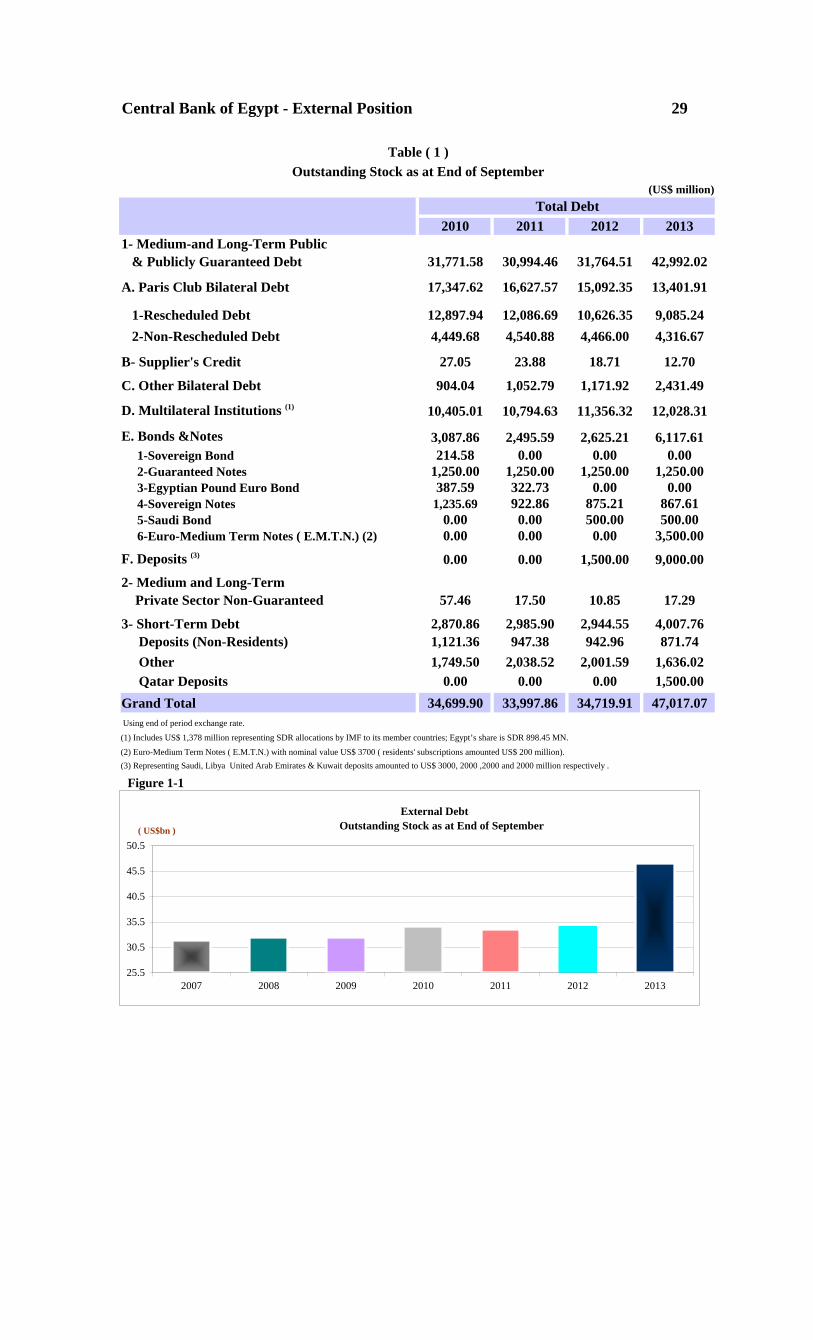
2010 2011 2012 20131- Medium-and Long-Term Public & Publicly Guaranteed Debt 31,771.58 30,994.46 31,764.51 42,992.02
A. Paris Club Bilateral Debt 17,347.62 16,627.57 15,092.35 13,401.91
1-Rescheduled Debt 12,897.94 12,086.69 10,626.35 9,085.24 2-Non-Rescheduled Debt 4,449.68 4,540.88 4,466.00 4,316.67
B- Supplier's Credit 27.05 23.88 18.71 12.70
C. Other Bilateral Debt 904.04 1,052.79 1,171.92 2,431.49
D. Multilateral Institutions (1) 10,405.01 10,794.63 11,356.32 12,028.31
E. Bonds &Notes 3,087.86 2,495.59 2,625.21 6,117.61 1-Sovereign Bond 214.58 0.00 0.00 0.00 2-Guaranteed Notes 1,250.00 1,250.00 1,250.00 1,250.00 3-Egyptian Pound Euro Bond 387.59 322.73 0.00 0.00 4-Sovereign Notes 1,235.69 922.86 875.21 867.61 5-Saudi Bond 0.00 0.00 500.00 500.00 6-Euro-Medium Term Notes ( E.M.T.N.) (2) 0.00 0.00 0.00 3,500.00
F. Deposits (3) 0.00 0.00 1,500.00 9,000.00
2- Medium and Long-Term Private Sector Non-Guaranteed 57.46 17.50 10.85 17.29
3- Short-Term Debt 2,870.86 2,985.90 2,944.55 4,007.76 Deposits (Non-Residents) 1,121.36 947.38 942.96 871.74 Other 1,749.50 2,038.52 2,001.59 1,636.02 Qatar Deposits 0.00 0.00 0.00 1,500.00Grand Total 34,699.90 33,997.86 34,719.91 47,017.07 Using end of period exchange rate.
(1) Includes US$ 1,378 million representing SDR allocations by IMF to its member countries; Egypt’s share is SDR 898.45 MN.
(2) Euro-Medium Term Notes ( E.M.T.N.) with nominal value US$ 3700 ( residents' subscriptions amounted US$ 200 million).(3) Representing Saudi, Libya United Arab Emirates & Kuwait deposits amounted to US$ 3000, 2000 ,2000 and 2000 million respectively .
Figure 1-1
(US$ million)
Table ( 1 )Outstanding Stock as at End of September
Total Debt
External Debt Outstanding Stock as at End of September
25.5
30.5
35.5
40.5
45.5
50.5
2007 2008 2009 2010 2011 2012 2013
( US$bn )
C
entral Bank of E
gypt - External Position
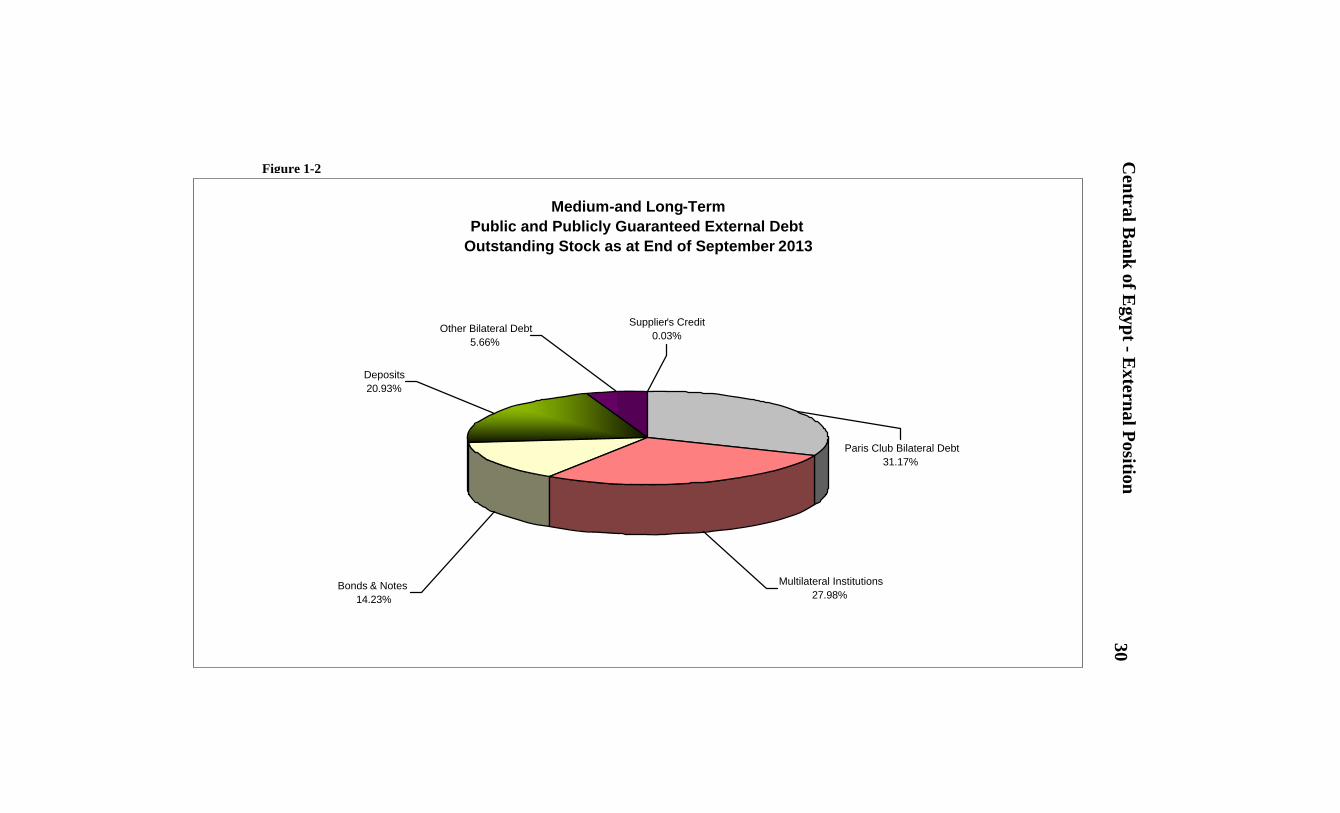
30Figure 1-2 Medium-and Long-Term
Public and Publicly Guaranteed External Debt Outstanding Stock as at End of September 2013
Deposits20.93%
Bonds & Notes 14.23%
Other Bilateral Debt5.66%
Supplier's Credit0.03%
Multilateral Institutions27.98%
Paris Club Bilateral Debt31.17%
Figure 1-2

Central Bank of Egypt - External Position 31
2010 2011 2012 2013
Creditor CountriesGermany 3,622.61 3,550.19 3,330.97 3,476.02
Japan 4,141.67 4,276.68 4,026.09 3,021.26
France 3,590.45 3,323.71 2,849.78 2,579.76
United States 3,171.16 2,920.96 2,666.45 2,419.70
Turkey 0.00 0.00 0.00 1,000.00
Kuwait 705.65 825.19 933.76 971.46
Spain 650.40 588.44 535.79 473.76
China 132.34 143.13 136.80 341.73
Italy 462.35 405.10 341.93 281.82
Switzerland 375.75 358.96 287.45 237.30
Austria 397.31 345.52 274.85 232.29
Denmark 268.08 257.85 244.47 230.24
Canada 180.94 164.82 152.53 126.59
United Kingdom 167.08 146.92 131.10 108.03
Saudi Arabia 36.64 59.05 78.76 95.73
The Netherlands 91.68 89.54 82.50 84.21
Australia 152.42 132.76 114.56 82.00
Belgium 66.93 58.67 45.44 39.57
United Arab emirates 29.41 25.42 22.60 22.57
Sweden 29.58 25.76 22.33 18.08
Norway 6.26 5.57 4.82 3.98
Multilateral Institutions 10,405.01 10,794.63 11,356.32 12,028.31 {2}
Notes, Bonds and Deposits
Deposits 0.00 0.00 1,500.00 9,000.00 {3}
Euro-Medium Term Notes ( E.M.T.N.) 0.00 0.00 0.00 3500.00
Guaranteed Notes 1,250.00 1,250.00 1,250.00 1,250.00
Sovereign Notes 1,235.69 922.86 875.21 867.61
Saudi Bond 0.00 0.00 500.00 500.00
Egyptian Pound Euro Bond 387.59 322.73 0.00 0.00
Sovereign Bond 214.58 0.00 0.00 0.00
Grand Total 31,771.58 30,994.46 31,764.51 42,992.02(1) Using end of period exchange rate.(2) Includes US$ 1,378 million representing SDR allocations by IMF to its member countries, Egypt’s share is SDR 898.45 MN.(3) Representing Saudi, Libya, United Arab Emirates & Kuwait deposits amounted to US$ 3000, 2000 ,2000 and 2000 million respectively .
(US$ million){1}
Total Debt
Table ( 2 ) Medium and Long-Term
Public & Publicly Guaranteed External DebtOutstanding Stock as at End of September

Central B
ank of Egypt - E
xternal Position32
Figure 2
Medium and Long-TermPublic and Publicly Guaranteed External Debt
Outstanding Stock as at End of September 2013
Euro-Medium Term Notes ( E.M.T.N.)
8%Deposits
21%
Guaranteed Notes 3%
Multilateral Institutions 28%
Other Countries 11%
France6 %
United States 6 %
Germany8 %
Japan7%
Turkey2%

Central Bank of Egypt - External Position 33
2010 2011 2012 2013
Germany 3,622.61 3,550.19 3,330.98 3,476.03Japan 4,124.27 4,261.98 4,015.76 3,016.32France 3,590.45 3,323.71 2,849.78 2,579.75United States 3,171.16 2,920.96 2,666.45 2,419.70Spain 650.40 588.44 535.79 473.76Italy 461.40 404.19 341.79 281.71Switzerland 375.75 358.96 287.45 237.30Austria 397.31 345.52 274.85 232.29Denmark 267.97 257.85 244.47 230.24Canada 172.35 156.55 144.29 118.94United Kingdom 167.08 146.92 131.09 108.04The Netherlands 91.68 89.54 82.50 84.21Australia 152.42 132.76 114.56 82.00Belgium 66.93 58.67 45.44 39.56Sweden 29.58 25.76 22.33 18.08Norway 6.26 5.57 4.82 3.98
Grand Total 17,347.62 16,627.57 15,092.35 13,401.91
{1} This table sums up tables 4 and 5.{2} Using end of period exchange rate.
Country
Table ( 3 ) {1}
Medium and Long-TermPublic & Publicly Guaranteed External Debt By Creditor Country
Paris Club Bilateral DebtOutstanding Stock as at End of September
Total Debt(US$ million){2}
0.0
5.0
10.0
15.0
20.0
( US$
bn )
2007 2008 2009 2010 2011 2012 2013
Medium and Long-Term Public & Publicly Guaranteed External Debt
Paris Club Bilateral DebtOutstanding Stock as at End of September
Figure 3

Central Bank of Egypt - External Position 34
2010 2011 2012 2013
Japan 3,052.92 3,090.58 2,810.93 2,052.03United States 2,641.19 2,436.16 2,219.08 2,002.00Germany 2,005.18 1,958.92 1,805.64 1,843.76France 2,837.03 2,482.03 1,998.57 1,689.19Spain 496.84 437.19 372.06 303.84Austria 385.29 337.10 270.27 229.53Switzerland 359.74 339.26 270.46 221.62Italy 307.07 270.78 230.66 189.67Canada 172.35 156.55 144.29 118.94United Kingdom 167.03 146.88 131.06 108.01Denmark 132.15 124.12 108.08 102.91The Netherlands 91.68 89.54 82.50 84.21Australia 152.42 132.76 114.56 82.00Belgium 61.35 53.61 41.14 35.55Sweden 29.44 25.64 22.23 18.00Norway 6.26 5.57 4.82 3.98
Grand Total 12,897.94 12,086.69 10,626.35 9,085.24{1} Using end of period exchange rate.
(US$ million){1}
CountryTotal Debt
Table ( 4 )Medium and Long-Term
Public & Publicly Guaranteed External Debt By Creditor CountryParis Club Bilateral Debt
Rescheduled DebtOutstanding Stock as at End of September
0.0
5.0
10.0
15.0
20.0
( US$
bn )
2007 2008 2009 2010 2011 2012 2013
Medium and Long-Term Public & Publicly Guaranteed External Debt
Paris Club Bilateral Debt Rescheduled Debt
Outstanding Stock as at End of September
Figure 4
Central Bank of Egypt - External Position 35
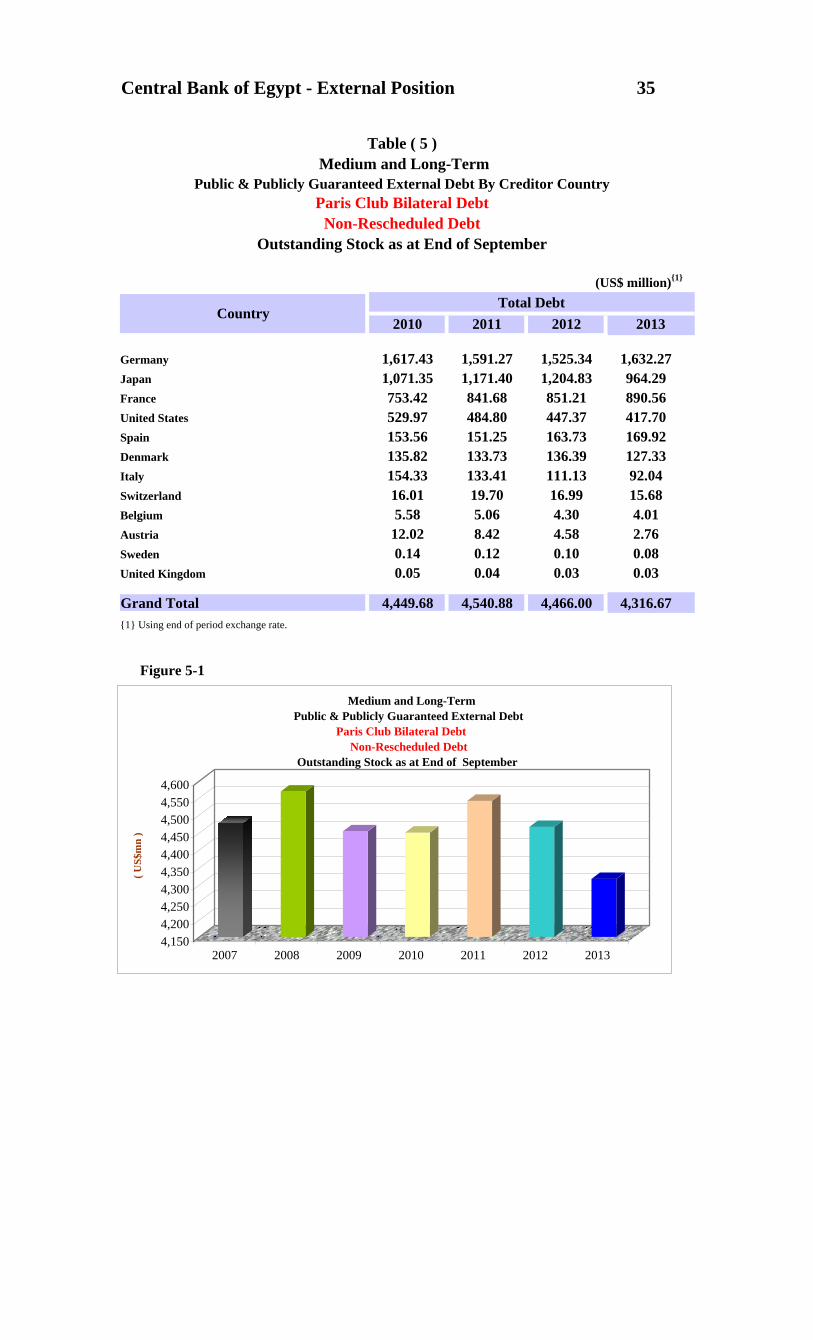
2010 2011 2012
Germany 1,617.43 1,591.27 1,525.34 1,632.27Japan 1,071.35 1,171.40 1,204.83 964.29France 753.42 841.68 851.21 890.56United States 529.97 484.80 447.37 417.70Spain 153.56 151.25 163.73 169.92Denmark 135.82 133.73 136.39 127.33Italy 154.33 133.41 111.13 92.04Switzerland 16.01 19.70 16.99 15.68Belgium 5.58 5.06 4.30 4.01Austria 12.02 8.42 4.58 2.76Sweden 0.14 0.12 0.10 0.08United Kingdom 0.05 0.04 0.03 0.03
Grand Total 4,449.68 4,540.88 4,466.00 4,316.67{1} Using end of period exchange rate.
2013Country
Table ( 5 ) Medium and Long-Term
Public & Publicly Guaranteed External Debt By Creditor Country
Total Debt
Paris Club Bilateral DebtNon-Rescheduled Debt
Outstanding Stock as at End of September
(US$ million){1}
4,1504,2004,2504,3004,3504,4004,4504,5004,5504,600
( US$
mn
)
2007 2008 2009 2010 2011 2012 2013
Medium and Long-Term Public & Publicly Guaranteed External Debt
Paris Club Bilateral Debt Non-Rescheduled Debt
Outstanding Stock as at End of September
Figure 5-1

Central B
ank of Egypt - E
xternal Position36
Medium and Long-Term Public and Publicly Guaranteed External Debt
Paris Club Bilateral DebtOutstanding Stock as at End of September 2013
Non-Rescheduled Debt32%
Rescheduled Debt68%
Figure 5-2

Central Bank of Egypt - External Position 37
2010 2011 2012 2013
Canada 8.59 8.27 8.24 7.64
Japan 17.40 14.69 10.33 4.95
Italy 0.95 0.92 0.14 0.11
Denmark 0.11 0.00 0.00 0.00
Grand Total 27.05 23.88 18.71 12.70
{1} Using end of period exchange rate.
(US$ million){1}
CountryTotal Debt
Table ( 6 )
Supplier's CreditOutstanding Stock as at End of September
Medium and Long-Term
Public & Publicly Guaranteed External Debt By Creditor Country
0
10
20
30
40
50
60
70
80
( US$
mn
)
2007 2008 2009 2010 2011 2012 2013
Medium and Long-TermPublic &Publicly Guaranteed External Debt
Supplier's CreditOutstanding Stock as at End of September
Figure 6

Central Bank of Egypt - External Position 38
2010 2011 2012 2013
Turkey 0.00 0.00 0.00 1,000.00
Kuwait 705.65 825.19 933.76 971.46
China 132.34 143.13 136.80 341.73
Saudi Arabia 36.64 59.05 78.76 95.73
United Arab Emirates 29.41 25.42 22.60 22.57
Grand Total 904.04 1,052.79 1,171.92 2,431.49{1} Using end of period exchange rate.
Country
Table ( 7 ) Medium and Long-Term
Public & Publicly Guaranteed External Debt By Creditor CountryOther Bilateral Debt
Outstanding Stock as at End of September
Total Debt(US$ million){1}
0
500
1,000
1,500
2,000
2,500
( US$
mn
)
2007 2008 2009 2010 2011 2012 2013
Medium and Long-TermPublic & Publicly Guaranteed External Debt
Other Bilateral DebtOutstanding Stock as at End of September
Figure 7

Central Bank of Egypt - External Position 39
2010 2011 2012 2013
IBRD 2,542.85 2,777.75 3,006.42 3,325.79
European Investment Bank 2,110.80 1,913.61 1,829.05 1,975.80
African Development Bank 1,244.05 1,256.12 1,409.85 1,547.60
Arab Fund for Economic and Social Development 1,276.21 1,332.86 1,347.58 1,489.18
IMF 1,186.64 1,408.09 1,385.58 1,378.30 {2}
IDA 1,381.31 1,332.53 1,264.87 1,199.43
Arab Monetary Fund 77.20 29.16 343.54 352.16
Islamic Development Bank 61.14 131.53 183.94 223.75
African Development Fund 239.94 239.38 227.25 211.98
OPEC 85.74 102.88 115.53 153.07
International Fund for Agricultural Development 114.13 112.16 107.11 106.25
Arab Trade Financing Program 65.00 58.56 35.60 65.00
Arab International Bank 20.00 100.00 100.00 0.00
Grand Total 10,405.01 10,794.63 11,356.32 12,028.31{1} Using end of period exchange rate.(2) Representing SDR allocations by IMF to its member countries; Egypt’s share is SDR 898.45 MN.
CreditorTotal Debt
Table ( 8 ) Medium and Long-Term
Public & Publicly Guaranteed External DebtMultilateral Institutions
Outstanding Stock as at End of September
(US$ million){1}
0
2,000
4,000
6,000
8,000
10,000
12,000
14,000
( U
S$m
n )
2007 2008 2009 2010 2011 2012 2013
Medium and Long-TermPublic & Publicly Guaranteed External Debt
Multilateral InstitutionsOutstanding Stock as at End of September
Figure 8-1
Central B
ank of Egypt - E
xternal Position40
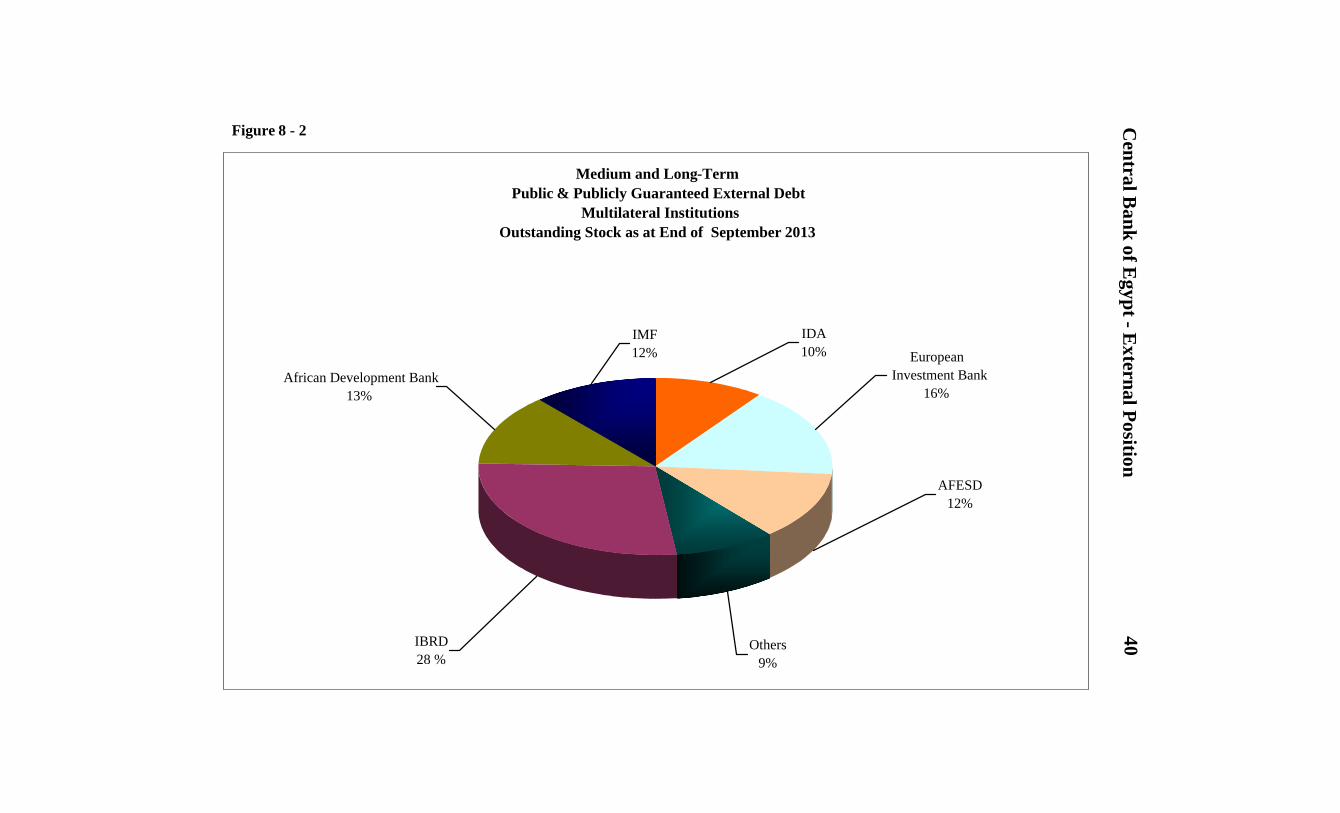
Medium and Long-TermPublic & Publicly Guaranteed External Debt
Multilateral InstitutionsOutstanding Stock as at End of September 2013
IMF12%
African Development Bank13%
AFESD12%
IDA10%
Others9%
IBRD28 %
European Investment Bank
16%
Figure 8 - 2

Central Bank of Egypt - External Position 41
2010 2011 2012 2013
Multilateral Institutions 5.00 17.50 10.85 17.29
United States 50.00 0.00 0.00 0.00
Austria 2.46 0.00 0.00 0.00
Grand Total 57.46 17.50 10.85 17.29{1} Using end of period exchange rate.
CountryTotal Debt
Table ( 9 ) Medium and Long-Term
Private Sector Non-Guaranteed External Debt By Creditor CountryOutstanding Stock as at End of September
(US$ million){1}
0.00
10.00
20.00
30.00
40.00
50.00
60.00
70.00
80.00
90.00
( US$
mn
)
2007 2008 2009 2010 2011 2012 2013
Medium and Long-Term Private Sector Non-Guaranteed External Debt
Outstanding Stock as at End of September
Figure 9

Central Bank of Egypt - External Position 42
2010 2011 2012 2013
Short-Term Debt
Trade Credits 1,745.58 2,021.02 2,001.59 1,636.02
Qatar Deposits 0.00 0.00 0.00 1,500.00(1)
Deposits (Non-Residents) 1,121.36 947.38 942.96 871.74
Loans 3.92 17.50 0.00 0.00
Grand Total 2,870.86 2,985.90 2,944.55 4,007.76
(1) Representing Qatar deposits amounted US$ 1500 million .
Short-Term DebtTable ( 10 )
Outstanding Stock as at End of September
Total Debt(US$ million)
0
500
1,000
1,500
2,000
2,500
3,000
3,500
4,000
4,500
( US$
mn
)
2007 2008 2009 2010 2011 2012 2013
Short-Term DebtOutstanding Stock as at End of September
Figure 10

Central Bank of Egypt - External Position 43
Medium and Long-Term
Signed Amount Disbursed Undisbursed
1- Medium and Long-Term Public & Publicly Guaranteed Debt 17,598.45 12,375.68 5,267.53
A. Paris Club Bilateral Debt 1,242.78 207.00 1,035.78 Non-Rescheduled Debt 1,242.78 207.00 1,035.78
B. Other Bilateral Debt 1,571.12 1,269.81 301.31
C. Multilateral Institutions 5,284.55 1,398.87 3,930.44
D. Deposits 9,500.00 9,500.00 0.00
2- Medium and Long-Term Private 85.08 83.43 1.65 Sector Non-Guaranteed Debt
Grand Total 17,683.53 12,459.11 5,269.18 {1} Using end of period exchange rate.
Disbursed and Undisbursed Amounts for Signed Loans and Deposit
(US$ million){1}
Table ( 11 )
from 1/10/2010 to 30/9/2013
Figure 11
0.00
1,000.00
2,000.00
3,000.00
4,000.00
5,000.00
6,000.00
7,000.00
8,000.00
9,000.00
10,000.00
2007 2008 2009 2010 2011 2012 2013
Signed Loans and Deposit Disbursed Undisbursed
Medium and Long-Term Disbursed and Undisbursed Amounts for Signed Loans and Deposits
from 1/10/2006 to 30/9/2013
( US
$mn
)

Central Bank of Egypt - External Position 44
Period Principal Interest Total Period Principal Interest Total 2013/H2 371.62 185.12 556.74 2032/H2 99.49 20.60 120.092014/H1 1209.44 377.82 1,587.26 2033/H1 89.28 19.98 109.262014/H2(2) 3743.26 390.18 4,133.44 2033/H2 81.71 19.45 101.162015/H1 1240.18 302.01 1,542.19 2034/H1 78.30 18.96 97.262015/H2(3) 2853.90 314.36 3,168.26 2034/H2 65.74 18.50 84.242016/H1 1616.29 259.97 1,876.27 2035/H1 62.07 18.09 80.162016/H2 (4) 3164.48 262.89 3,427.37 2035/H2 60.98 17.71 78.692017/H1(5) 2263.62 210.35 2,473.97 2036/H1 57.30 17.34 74.642017/H2 1763.18 208.56 1,971.74 2036/H2 55.64 16.98 72.622018/H1 1561.33 176.40 1,737.73 2037/H1 53.73 16.62 70.352018/H2 7062.87 187.03 7,249.90 2037/H2 52.65 16.29 68.932019/H1 1033.82 155.68 1,189.50 2038/H1 40.32 15.94 56.262019/H2 1060.31 152.78 1,213.08 2038/H2 25.84 15.80 41.642020/H1(6) 1445.34 135.57 1,580.91 2039/H1 21.61 15.70 37.312020/H2 931.52 119.20 1,050.72 2039/H2 21.04 15.63 36.672021/H1 839.87 102.69 942.55 2040/H1(7) 437.78 15.56 453.342021/H2 792.02 99.26 891.28 2040/H2 19.21 1.12 20.332022/H1 600.02 85.33 685.35 2041/H1 17.45 1.04 18.492022/H2 608.67 84.26 692.93 2041/H2 16.71 0.99 17.702023/H1 562.63 73.91 636.54 2042/H1 14.66 0.92 15.582023/H2 553.36 72.38 625.75 2042/H2 12.49 0.87 13.372024/H1 524.54 62.98 587.52 2043/H1 12.41 0.82 13.232024/H2 541.88 60.98 602.86 2043/H2 11.51 0.78 12.302025/H1 517.81 52.13 569.94 2044/H1 10.46 0.74 11.202025/H2 526.80 49.57 576.38 2044/H2 10.23 0.70 10.932026/H1 470.27 41.62 511.89 2045/H1 9.90 0.66 10.562026/H2 457.12 38.76 495.87 2045/H2 9.90 0.63 10.532027/H1 213.30 32.58 245.88 2046/H1 9.05 0.59 9.642027/H2 225.79 32.54 258.33 2046/H2 7.00 0.56 7.572028/H1 192.79 29.46 222.25 2047/H1 6.19 0.53 6.732028/H2 196.99 28.98 225.97 2047/H2 3.88 0.52 4.392029/H1 171.68 26.71 198.39 2048/H1 2.41 0.50 2.912029/H2 172.55 25.96 198.51 2048/H2 1.86 0.50 2.362030/H1 146.45 24.33 170.77 2049/H1 0.44 0.48 0.922030/H2 174.74 23.60 198.34 2049/H2 0.44 0.49 0.922031/H1 115.40 22.62 138.02 2050/H1 0.30 0.48 0.782031/H2 106.08 21.88 127.96 2050/H2 0.06 0.49 0.552032/H1 101.80 21.23 123.03
Grand Total 41,613.72 (8) 4,845.27 (9) 46,458.99(1) The exchange rate of September 30, 2013 .(2) Includes US$ 2500.00 million Euro-Medium Term Notes ( E.M.T.N.) maturing 2014.(3) Includes US$ 1250.00 million guaranteed notes maturing 2015.(4) Includes US$ 1000.00 million Euro-Medium Term Notes ( E.M.T.N.) maturing 2016.(5) Includes US$ 500.00 million Saudi bond maturing 2017.(6) Includes US$ 449.59 million sovereign notes maturing 2020.(7) Includes US$ 418.02 million sovereign notes maturing 2040.(8) Excludes US$ 1,378.30 million representing SDR allocation by IMF to its member countries, Egypt’s share is SDR 898.45 MN.(9) Includes US$ 35.94 million representing forecast interest of SDR allocation.
(US$ million)(1)as of October 1, 2013
Table ( 12 )Projected Medium and Long-Term Public & Publicly Guaranteed
External Debt Service

45C
entral Bank of E
gypt - External Position
Figure 12
0
1,000
2,000
3,000
4,000
5,000
6,000
7,000
8,000
9,000
10,000
2013 2015 2017 2019 2021 2023 2025 2027 2029 2031 2033 2035 2037 2039 2041 2043 2045 2047 2049
Principal Interest Total
Medium and Long-Term Public and Publicly Guaranteed External Debt Service as of October 1 , 2013US$ mn

Central Bank of Egypt - External Position 46
Period Principal Interest Total Period Principal Interest Total2013/H2 128.52 29.36 157.88 2032/H2 43.73 2.21 45.952014/H1 757.30 115.71 873.01 2033/H1 40.34 2.07 42.412014/H2 802.28 119.66 921.94 2033/H2 38.75 1.94 40.682015/H1 794.28 102.45 896.73 2034/H1 37.35 1.80 39.152015/H2 843.80 106.48 950.28 2034/H2 35.71 1.67 37.392016/H1 856.33 89.65 945.97 2035/H1 33.80 1.55 35.352016/H2 905.63 92.46 998.09 2035/H2 32.71 1.43 34.152017/H1 434.16 76.13 510.29 2036/H1 30.79 1.32 32.122017/H2 460.39 79.66 540.04 2036/H2 29.53 1.21 30.742018/H1 441.72 66.38 508.10 2037/H1 28.05 1.11 29.152018/H2 474.50 69.54 544.04 2037/H2 27.08 1.01 28.092019/H1 437.83 56.65 494.49 2038/H1 25.71 0.91 26.622019/H2 474.10 59.11 533.21 2038/H2 22.72 0.82 23.542020/H1 442.24 47.24 489.47 2039/H1 18.95 0.74 19.692020/H2 475.94 48.81 524.75 2039/H2 18.42 0.68 19.102021/H1 424.81 37.66 462.47 2040/H1 17.79 0.61 18.402021/H2 411.23 38.38 449.60 2040/H2 17.24 0.55 17.782022/H1 242.02 28.46 270.48 2041/H1 15.48 0.49 15.972022/H2 265.95 30.73 296.68 2041/H2 14.74 0.43 15.172023/H1 244.09 23.73 267.82 2042/H1 12.69 0.38 13.072023/H2 267.76 25.32 293.08 2042/H2 10.52 0.34 10.862024/H1 246.77 18.93 265.70 2043/H1 10.43 0.30 10.732024/H2 265.26 19.93 285.19 2043/H2 10.07 0.26 10.332025/H1 246.80 14.09 260.90 2044/H1 9.55 0.22 9.772025/H2 270.95 14.42 285.37 2044/H2 9.32 0.19 9.512026/H1 252.35 9.25 261.60 2045/H1 8.99 0.16 9.142026/H2 272.09 8.67 280.77 2045/H2 8.99 0.12 9.112027/H1 59.18 4.13 63.31 2046/H1 8.14 0.09 8.232027/H2 80.33 5.51 85.84 2046/H2 6.09 0.06 6.152028/H1 57.08 3.75 60.83 2047/H1 5.28 0.04 5.322028/H2 71.19 4.49 75.68 2047/H2 2.96 0.02 2.992029/H1 54.27 3.37 57.64 2048/H1 1.79 0.01 1.802029/H2 60.69 3.64 64.33 2048/H2 1.61 0.01 1.622030/H1 49.70 3.01 52.71 2049/H1 0.19 0.00 0.192030/H2 55.20 3.02 58.22 2049/H2 0.19 0.00 0.192031/H1 46.89 2.67 49.56 2050/H1 0.05 0.00 0.052031/H2 46.71 2.51 49.22 2050/H2 0.05 0.00 0.052032/H1 45.79 2.36 48.15
Grand Total 13,401.91 1,492.09 14,894.00{1} The exchange rate of September 30, 2013 .
Projected Medium and Long-Term Public & Publicly GuaranteedTable ( 13 )
(US$ million){1}
as of October 1, 2013Paris Club Bilateral Debt
External Debt Service
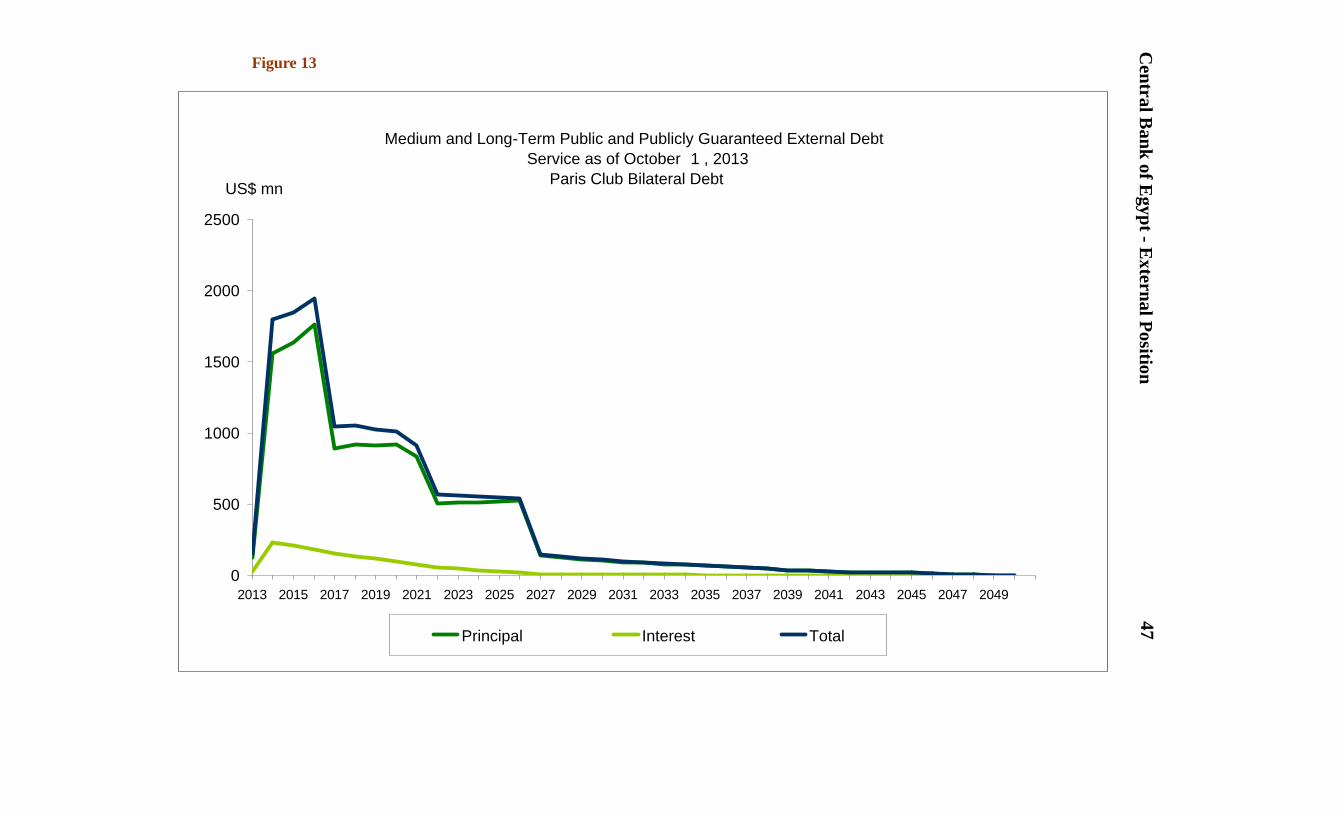
Figure 13
Central B
ank of Egypt - E
xternal Position47
0
500
1000
1500
2000
2500
2013 2015 2017 2019 2021 2023 2025 2027 2029 2031 2033 2035 2037 2039 2041 2043 2045 2047 2049
Principal Interest Total
Medium and Long-Term Public and Publicly Guaranteed External Debt Service as of October 1 , 2013
Paris Club Bilateral DebtUS$ mn
Central Bank of Egypt - External Position 48
Period Principal Interest Total Period Principal Interest Total
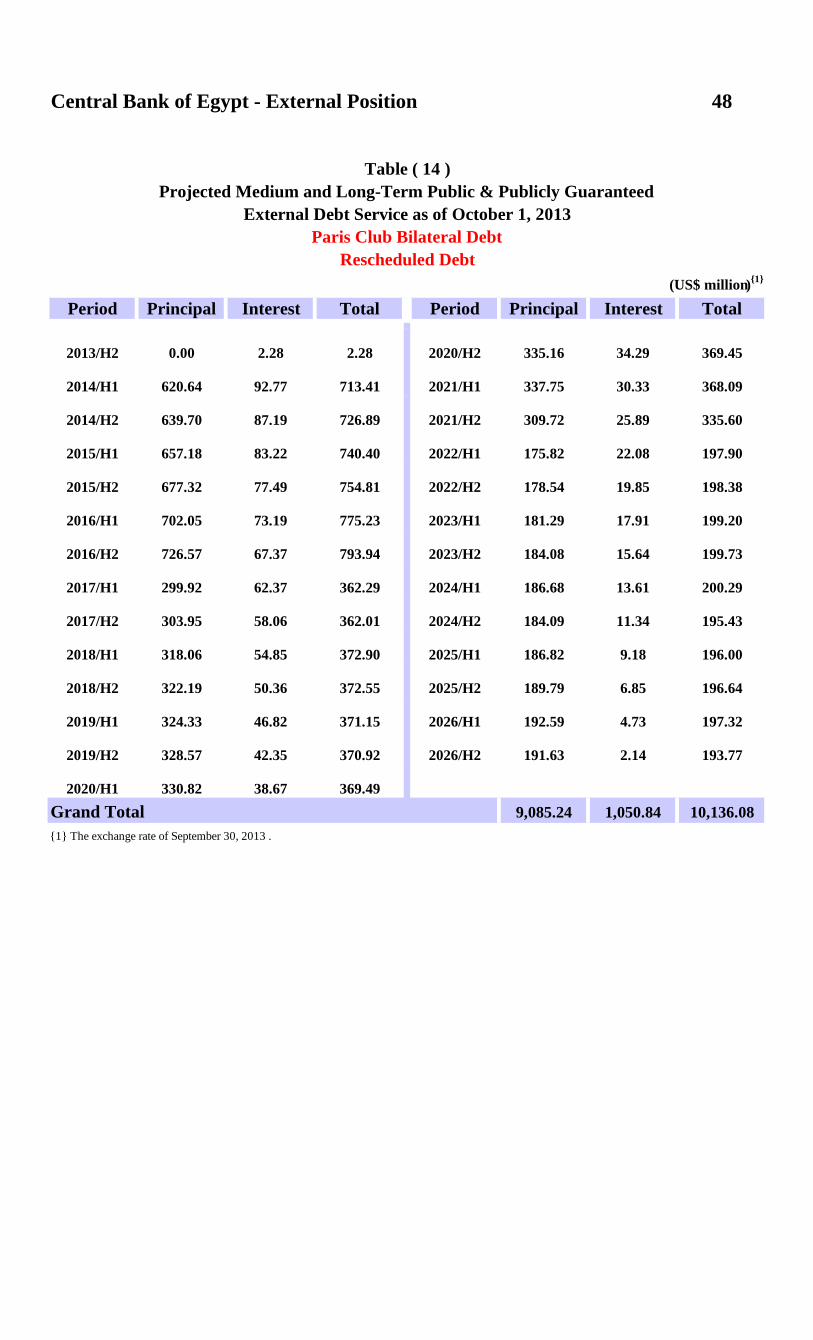
2013/H2 0.00 2.28 2.28 2020/H2 335.16 34.29 369.45
2014/H1 620.64 92.77 713.41 2021/H1 337.75 30.33 368.09
2014/H2 639.70 87.19 726.89 2021/H2 309.72 25.89 335.60
2015/H1 657.18 83.22 740.40 2022/H1 175.82 22.08 197.90
2015/H2 677.32 77.49 754.81 2022/H2 178.54 19.85 198.38
2016/H1 702.05 73.19 775.23 2023/H1 181.29 17.91 199.20
2016/H2 726.57 67.37 793.94 2023/H2 184.08 15.64 199.73
2017/H1 299.92 62.37 362.29 2024/H1 186.68 13.61 200.29
2017/H2 303.95 58.06 362.01 2024/H2 184.09 11.34 195.43
2018/H1 318.06 54.85 372.90 2025/H1 186.82 9.18 196.00
2018/H2 322.19 50.36 372.55 2025/H2 189.79 6.85 196.64
2019/H1 324.33 46.82 371.15 2026/H1 192.59 4.73 197.32
2019/H2 328.57 42.35 370.92 2026/H2 191.63 2.14 193.77
2020/H1 330.82 38.67 369.49Grand Total 9,085.24 1,050.84 10,136.08{1} The exchange rate of September 30, 2013 .
(US$ million){1}
Table ( 14 )Projected Medium and Long-Term Public & Publicly Guaranteed
External Debt Service as of October 1, 2013Paris Club Bilateral Debt
Rescheduled Debt

Central Bank of Egypt - External Position 49
Period Principal Interest Total Period Principal Interest Total2013/H2 128.52 27.08 155.60 2032/H2 43.73 2.21 45.952014/H1 136.66 22.94 159.60 2033/H1 40.34 2.07 42.412014/H2 162.59 32.46 195.05 2033/H2 38.75 1.94 40.682015/H1 137.10 19.23 156.33 2034/H1 37.35 1.80 39.152015/H2 166.48 28.98 195.47 2034/H2 35.71 1.67 37.392016/H1 154.28 16.46 170.74 2035/H1 33.80 1.55 35.352016/H2 179.06 25.09 204.16 2035/H2 32.71 1.43 34.152017/H1 134.24 13.76 148.00 2036/H1 30.79 1.32 32.122017/H2 156.44 21.60 178.04 2036/H2 29.53 1.21 30.742018/H1 123.66 11.53 135.19 2037/H1 28.05 1.11 29.152018/H2 152.31 19.18 171.49 2037/H2 27.08 1.01 28.092019/H1 113.50 9.83 123.33 2038/H1 25.71 0.91 26.622019/H2 145.53 16.76 162.29 2038/H2 22.72 0.82 23.542020/H1 111.42 8.57 119.99 2039/H1 18.95 0.74 19.692020/H2 140.78 14.52 155.30 2039/H2 18.42 0.68 19.102021/H1 87.05 7.32 94.38 2040/H1 17.79 0.61 18.402021/H2 101.51 12.49 114.00 2040/H2 17.24 0.55 17.782022/H1 66.20 6.37 72.57 2041/H1 15.48 0.49 15.972022/H2 87.41 10.88 98.29 2041/H2 14.74 0.43 15.172023/H1 62.80 5.81 68.62 2042/H1 12.69 0.38 13.072023/H2 83.68 9.67 93.35 2042/H2 10.52 0.34 10.862024/H1 60.09 5.31 65.41 2043/H1 10.43 0.30 10.732024/H2 81.16 8.59 89.76 2043/H2 10.07 0.26 10.332025/H1 59.99 4.91 64.90 2044/H1 9.55 0.22 9.772025/H2 81.16 7.56 88.72 2044/H2 9.32 0.19 9.512026/H1 59.76 4.52 64.28 2045/H1 8.99 0.16 9.142026/H2 80.46 6.53 87.00 2045/H2 8.99 0.12 9.112027/H1 59.18 4.13 63.31 2046/H1 8.14 0.09 8.232027/H2 80.33 5.51 85.84 2046/H2 6.09 0.06 6.152028/H1 57.08 3.75 60.83 2047/H1 5.28 0.04 5.322028/H2 71.19 4.49 75.68 2047/H2 2.96 0.02 2.992029/H1 54.27 3.37 57.64 2048/H1 1.79 0.01 1.802029/H2 60.69 3.64 64.33 2048/H2 1.61 0.01 1.622030/H1 49.70 3.01 52.71 2049/H1 0.19 0.00 0.192030/H2 55.20 3.02 58.22 2049/H2 0.19 0.00 0.192031/H1 46.89 2.67 49.56 2050/H1 0.05 0.00 0.052031/H2 46.71 2.51 49.22 2050/H2 0.05 0.00 0.052032/H1 45.79 2.36 48.15
Grand Total 4,316.67 441.25 4,757.92{1} The exchange rate of September 30, 2013 .
Table ( 15 )
(US$ million){1}
Projected Medium and Long-Term Public & Publicly GuaranteedExternal Debt Service as of October 1, 2013
Paris Club Bilateral DebtNon-Rescheduled Debt

Central Bank of Egypt - External Position 50
Period Principal Interest Total Period Principal Interest Total2013/H2 0.04 0.00 0.04 2026/H2 0.16 0.00 0.162014/H1 1.82 0.05 1.88 2027/H1 0.16 0.00 0.162014/H2 1.82 0.04 1.86 2027/H2 0.16 0.00 0.162015/H1 1.83 0.02 1.84 2028/H1 0.16 0.00 0.162015/H2 0.18 0.00 0.18 2028/H2 0.16 0.00 0.162016/H1 0.18 0.00 0.18 2029/H1 0.16 0.00 0.162016/H2 0.18 0.00 0.18 2029/H2 0.16 0.00 0.162017/H1 0.16 0.00 0.16 2030/H1 0.16 0.00 0.162017/H2 0.16 0.00 0.16 2030/H2 0.16 0.00 0.162018/H1 0.16 0.00 0.16 2031/H1 0.16 0.00 0.162018/H2 0.16 0.00 0.16 2031/H2 0.16 0.00 0.162019/H1 0.16 0.00 0.16 2032/H1 0.16 0.00 0.162019/H2 0.16 0.00 0.16 2032/H2 0.16 0.00 0.162020/H1 0.16 0.00 0.16 2033/H1 0.16 0.00 0.162020/H2 0.16 0.00 0.16 2033/H2 0.16 0.00 0.162021/H1 0.16 0.00 0.16 2034/H1 0.16 0.00 0.162021/H2 0.16 0.00 0.16 2034/H2 0.16 0.00 0.162022/H1 0.16 0.00 0.16 2035/H1 0.16 0.00 0.162022/H2 0.16 0.00 0.16 2035/H2 0.16 0.00 0.162023/H1 0.16 0.00 0.16 2036/H1 0.16 0.00 0.162023/H2 0.16 0.00 0.16 2036/H2 0.16 0.00 0.162024/H1 0.16 0.00 0.16 2037/H1 0.16 0.00 0.162024/H2 0.16 0.00 0.16 2037/H2 0.04 0.00 0.042025/H1 0.16 0.00 0.16 2038/H1 0.04 0.00 0.042025/H2 0.16 0.00 0.16 2038/H2 0.04 0.00 0.042026/H1 0.16 0.00 0.16 2039/H1 0.04 0.00 0.04
Grand Total 12.70 0.11 12.81{1} The exchange rate of September 30, 2013 .
Supplier's Creditas of October 1, 2013
(US$ million){1}
Table ( 16 )Projected Medium and Long-Term Public & Publicly Guaranteed
External Debt Service

Central Bank of Egypt - External Position 51
Period Principal Interest Total Period Principal Interest Total2013/H2 18.75 14.04 32.79 2025/H1 32.08 2.87 34.95
2014/H1 48.65 21.30 69.95 2025/H2 32.08 2.41 34.49
2014/H2 32.19 20.85 53.04 2026/H1 28.05 1.94 29.99
2015/H1 50.16 20.35 70.51 2026/H2 21.54 1.55 23.09
2015/H2 242.04 19.88 261.91 2027/H1 14.47 1.25 15.72
2016/H1 261.99 18.82 280.81 2027/H2 14.39 1.07 15.46
2016/H2 249.61 17.75 267.36 2028/H1 12.62 0.88 13.50
2017/H1 272.84 16.57 289.41 2028/H2 9.12 0.71 9.83
2017/H2 258.62 15.32 273.94 2029/H1 5.46 0.60 6.06
2018/H1 70.10 13.97 84.07 2029/H2 5.46 0.55 6.01
2018/H2 64.91 13.00 77.91 2030/H1 5.46 0.50 5.95
2019/H1 76.39 11.92 88.31 2030/H2 5.25 0.44 5.69
2019/H2 68.91 10.84 79.75 2031/H1 4.72 0.39 5.10
2020/H1 77.18 9.68 86.86 2031/H2 4.82 0.34 5.16
2020/H2 81.69 8.58 90.27 2032/H1 4.82 0.29 5.11
2021/H1 53.18 7.14 60.32 2032/H2 4.82 0.24 5.07
2021/H2 41.36 6.55 47.91 2033/H1 4.48 0.20 4.68
2022/H1 51.29 5.97 57.25 2033/H2 4.05 0.15 4.20
2022/H2 38.97 5.40 44.37 2034/H1 4.05 0.11 4.16
2023/H1 46.30 4.84 51.15 2034/H2 3.52 0.07 3.59
2023/H2 34.81 4.34 39.16 2035/H1 1.76 0.04 1.79
2024/H1 33.64 3.84 37.49 2035/H2 1.76 0.02 1.78
2024/H2 33.15 3.36 36.50
Grand Total 2,431.49 290.93 2,722.42{1} The exchange rate of September 30, 2013 .
Table ( 17 )
(US$ million){1}
Other Bilateral DebtExternal Debt Service as of October 1, 2013
Projected Medium and Long-Term Public & Publicly Guaranteed

Central Bank of Egypt - External Position 52
Period Principal Interest Total Period Principal Interest Total2013/H2 224.30 48.12 272.42 2032/H2 50.77 3.78 54.552014/H1 401.67 101.18 502.85 2033/H1 44.30 3.34 47.642014/H2 406.96 97.10 504.06 2033/H2 38.76 3.00 41.762015/H1 393.91 92.76 486.67 2034/H1 36.75 2.67 39.422015/H2 417.88 88.59 506.48 2034/H2 26.35 2.39 28.732016/H1 397.80 93.00 490.79 2035/H1 26.35 2.13 28.482016/H2 409.06 81.31 490.37 2035/H2 26.35 1.89 28.242017/H1 456.46 76.91 533.37 2036/H1 26.35 1.64 27.992017/H2 444.01 72.53 516.54 2036/H2 25.95 1.40 27.352018/H1 449.35 68.08 517.44 2037/H1 25.52 1.14 26.672018/H2 423.31 63.69 487.00 2037/H2 25.52 0.91 26.432019/H1 419.45 59.40 478.85 2038/H1 14.57 0.66 15.232019/H2 417.14 55.25 472.40 2038/H2 3.08 0.61 3.682020/H1 376.17 51.22 427.39 2039/H1 2.62 0.59 3.212020/H2 373.73 47.44 421.17 2039/H2 2.62 0.59 3.212021/H1 361.72 43.52 405.24 2040/H1 1.97 0.57 2.552021/H2 339.28 39.96 379.24 2040/H2 1.97 0.57 2.542022/H1 306.56 36.53 343.09 2041/H1 1.97 0.55 2.532022/H2 303.59 33.76 337.35 2041/H2 1.97 0.55 2.532023/H1 272.07 30.97 303.04 2042/H1 1.97 0.54 2.512023/H2 250.63 28.35 278.98 2042/H2 1.97 0.54 2.512024/H1 243.97 25.84 269.81 2043/H1 1.97 0.53 2.502024/H2 243.32 23.33 266.65 2043/H2 1.45 0.52 1.972025/H1 238.76 20.80 259.57 2044/H1 0.91 0.52 1.432025/H2 223.62 18.38 242.00 2044/H2 0.91 0.52 1.432026/H1 189.71 16.05 205.77 2045/H1 0.91 0.50 1.412026/H2 163.32 14.17 177.49 2045/H2 0.91 0.51 1.422027/H1 139.50 12.82 152.32 2046/H1 0.91 0.50 1.412027/H2 130.91 11.60 142.50 2046/H2 0.91 0.50 1.412028/H1 122.94 10.46 133.39 2047/H1 0.91 0.49 1.402028/H2 116.52 9.40 125.92 2047/H2 0.91 0.49 1.412029/H1 111.79 8.37 120.17 2048/H1 0.62 0.49 1.112029/H2 106.25 7.40 113.65 2048/H2 0.25 0.49 0.742030/H1 91.13 6.46 97.59 2049/H1 0.25 0.48 0.732030/H2 114.12 5.77 119.90 2049/H2 0.25 0.49 0.742031/H1 63.64 5.20 68.84 2050/H1 0.25 0.48 0.742031/H2 54.39 4.66 59.05 2050/H2 0.00 0.49 0.492032/H1 51.03 4.20 55.23
Grand Total 10,650.01 (2) 1,552.65 (3) 12,202.66{1} The exchange rate of September 30, 2013 . (2) Excludes US$ 1,378.30 million representing SDR allocations by IMF to its member countries; Egypt’s share is SDR 898.45 MN.(3) Includes US$ 35.94 million representing forecast interest of SDR allocation.
Table ( 18 )
(US$ million){1}
Multilateral InstitutionsExternal Debt Service as of October 1, 2013
Projected Medium and Long-Term Public & Publicly Guaranteed

Central B
ank of Egypt - E
xternal Position53
Figure 18
0
200
400
600
800
1000
1200
2013 2015 2017 2019 2021 2023 2025 2027 2029 2031 2033 2035 2037 2039 2041 2043 2045 2047 2049
Principal Interest Total
Total Medium and Long-Term Public and Publicly Guaranteed External Debt Service Multilateral Institutions
as of October 1, 2013
US$ mn

Central Bank of Egypt - External Position 54
(US$ million)
Period Principal Interest Total
2014/H1 0.00 27.81 27.81
2014/H2 0.00 27.81 27.81
2015/H1 0.00 27.81 27.81
2015/H2 1,250.00 27.81 1,277.81
Grand Total 1,250.00 111.24 1,361.24
Debt Service as of October 1, 2013
Table ( 19 )Projected Guaranteed Notes

Central Bank of Egypt - External Position 55
Period Principal Interest Total Period Principal Interest Total2013/H2 0.00 27.30 27.30 2027/H1 0.00 14.37 14.37
2014/H1 0.00 27.30 27.30 2027/H2 0.00 14.37 14.37
2014/H2 0.00 27.30 27.30 2028/H1 0.00 14.37 14.37
2015/H1 0.00 27.30 27.30 2028/H2 0.00 14.37 14.37
2015/H2 0.00 27.30 27.30 2029/H1 0.00 14.37 14.37
2016/H1 0.00 27.30 27.30 2029/H2 0.00 14.37 14.37
2016/H2 0.00 27.30 27.30 2030/H1 0.00 14.37 14.37
2017/H1 0.00 27.30 27.30 2030/H2 0.00 14.37 14.37
2017/H2 0.00 27.30 27.30 2031/H1 0.00 14.37 14.37
2018/H1 0.00 27.30 27.30 2031/H2 0.00 14.37 14.37
2018/H2 0.00 27.30 27.30 2032/H1 0.00 14.37 14.37
2019/H1 0.00 27.30 27.30 2032/H2 0.00 14.37 14.37
2019/H2 0.00 27.30 27.30 2033/H1 0.00 14.37 14.37
2020/H1 449.59 27.30 476.89 2033/H2 0.00 14.37 14.37
2020/H2 0.00 14.37 14.37 2034/H1 0.00 14.37 14.37
2021/H1 0.00 14.37 14.37 2034/H2 0.00 14.37 14.37
2021/H2 0.00 14.37 14.37 2035/H1 0.00 14.37 14.37
2022/H1 0.00 14.37 14.37 2035/H2 0.00 14.37 14.37
2022/H2 0.00 14.37 14.37 2036/H1 0.00 14.37 14.37
2023/H1 0.00 14.37 14.37 2036/H2 0.00 14.37 14.37
2023/H2 0.00 14.37 14.37 2037/H1 0.00 14.37 14.37
2024/H1 0.00 14.37 14.37 2037/H2 0.00 14.37 14.37
2024/H2 0.00 14.37 14.37 2038/H1 0.00 14.37 14.37
2025/H1 0.00 14.37 14.37 2038/H2 0.00 14.37 14.37
2025/H2 0.00 14.37 14.37 2039/H1 0.00 14.37 14.37
2026/H1 0.00 14.37 14.37 2039/H2 0.00 14.37 14.37
2026/H2 0.00 14.37 14.37 2040/H1 418.02 14.37 432.39Grand Total 867.61 957.00 1,824.61
(US$ million)
Table ( 20 )Projected Sovereign Notes
Debt Service as of October 1, 2013
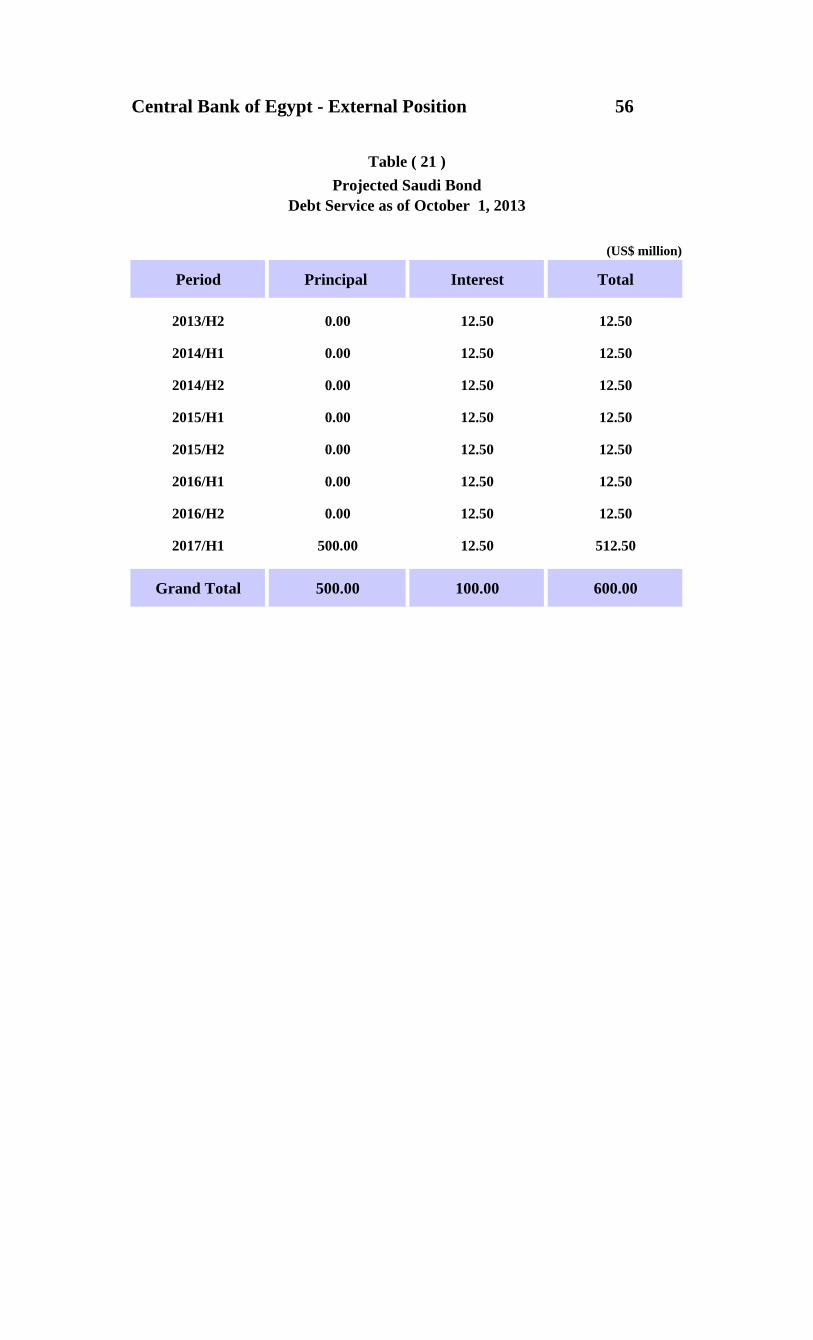
Central Bank of Egypt - External Position 56
(US$ million)
Period Principal Interest Total
2013/H2 0.00 12.50 12.50
2014/H1 0.00 12.50 12.50
2014/H2 0.00 12.50 12.50
2015/H1 0.00 12.50 12.50
2015/H2 0.00 12.50 12.50
2016/H1 0.00 12.50 12.50
2016/H2 0.00 12.50 12.50
2017/H1 500.00 12.50 512.50
Grand Total 500.00 100.00 600.00
Debt Service as of October 1, 2013
Table ( 21 )Projected Saudi Bond
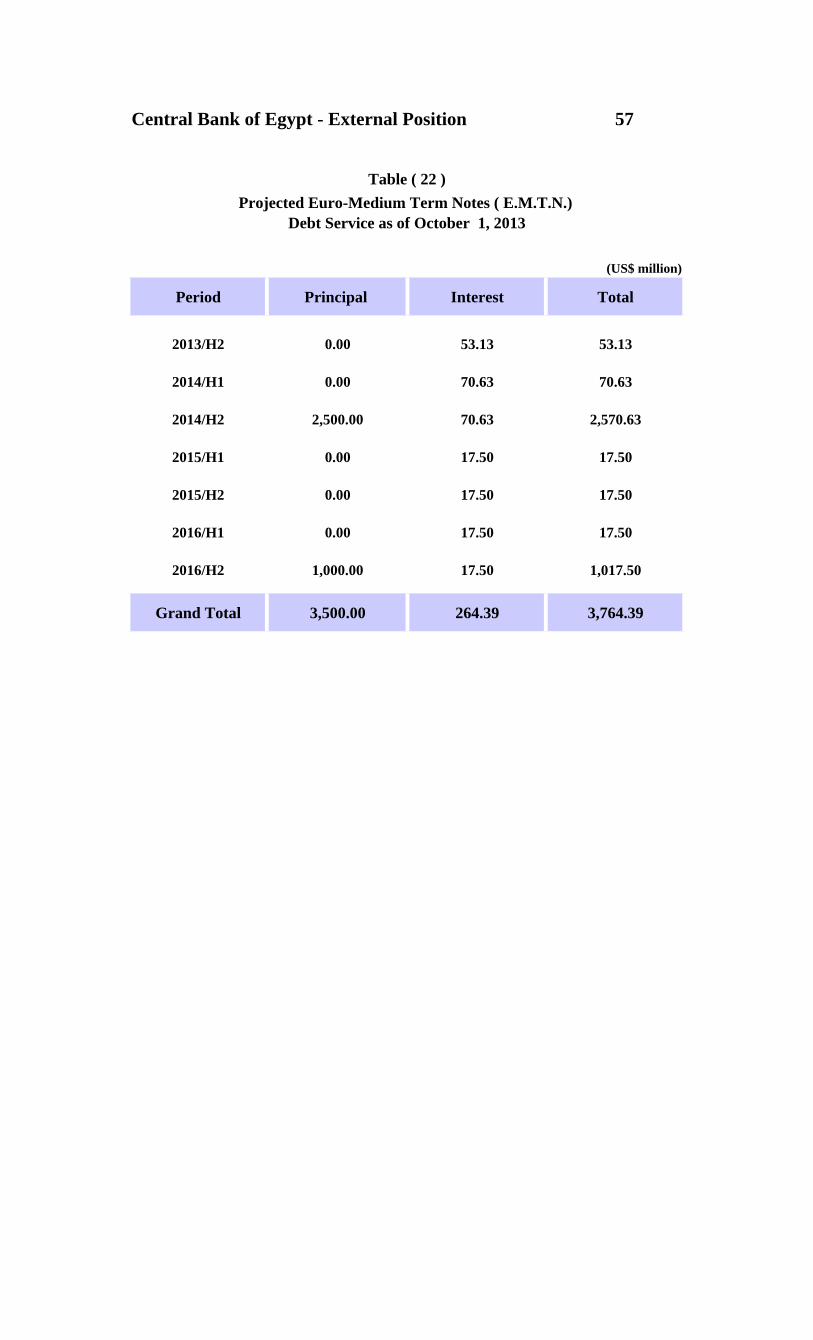
Central Bank of Egypt - External Position 57
(US$ million)
Period Principal Interest Total
2013/H2 0.00 53.13 53.13
2014/H1 0.00 70.63 70.63
2014/H2 2,500.00 70.63 2,570.63
2015/H1 0.00 17.50 17.50
2015/H2 0.00 17.50 17.50
2016/H1 0.00 17.50 17.50
2016/H2 1,000.00 17.50 1,017.50
Grand Total 3,500.00 264.39 3,764.39
Debt Service as of October 1, 2013
Table ( 22 )Projected Euro-Medium Term Notes ( E.M.T.N.)
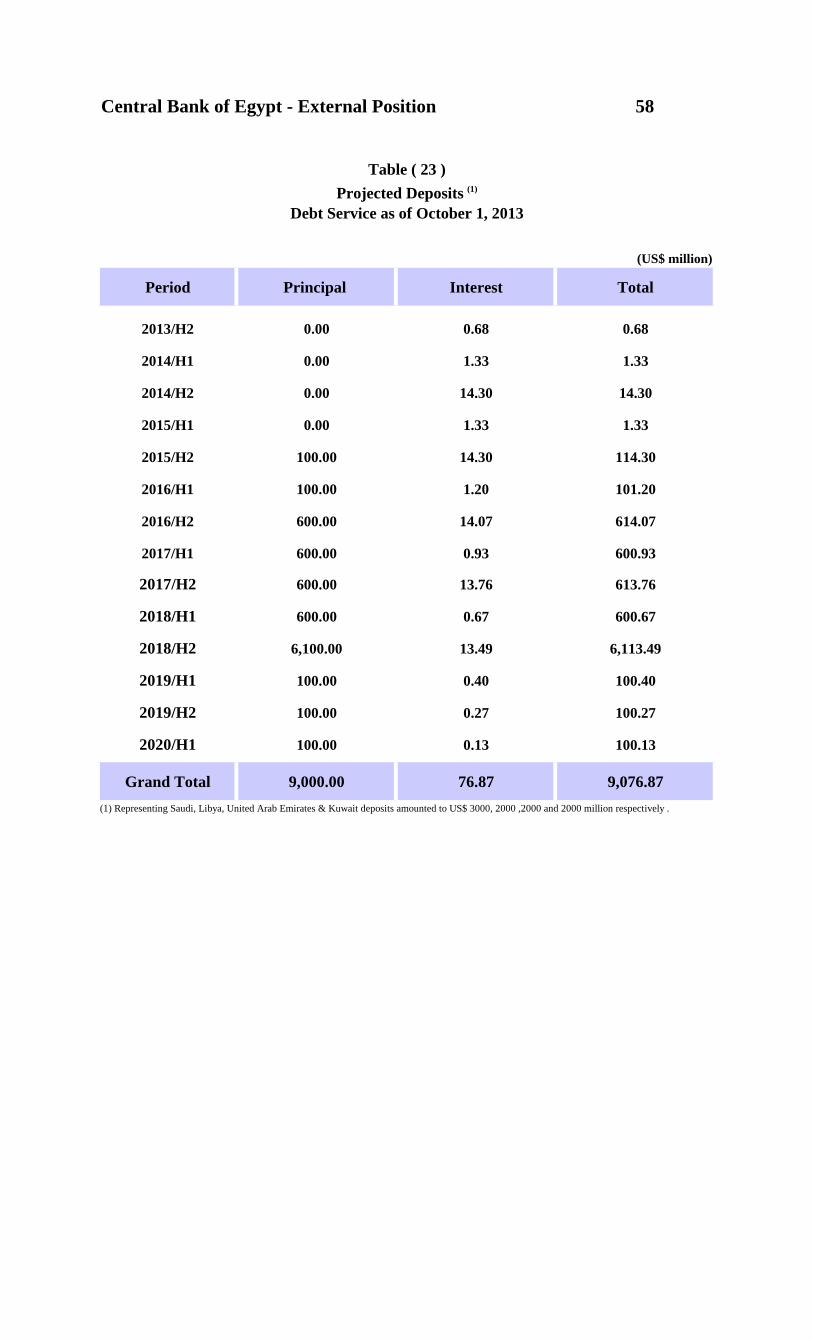
Central Bank of Egypt - External Position 58
(US$ million)
Period Principal Interest Total
2013/H2 0.00 0.68 0.68
2014/H1 0.00 1.33 1.33
2014/H2 0.00 14.30 14.30
2015/H1 0.00 1.33 1.33
2015/H2 100.00 14.30 114.30
2016/H1 100.00 1.20 101.20
2016/H2 600.00 14.07 614.07
2017/H1 600.00 0.93 600.93
2017/H2 600.00 13.76 613.76
2018/H1 600.00 0.67 600.67
2018/H2 6,100.00 13.49 6,113.49
2019/H1 100.00 0.40 100.40
2019/H2 100.00 0.27 100.27
2020/H1 100.00 0.13 100.13
Grand Total 9,000.00 76.87 9,076.87(1) Representing Saudi, Libya, United Arab Emirates & Kuwait deposits amounted to US$ 3000, 2000 ,2000 and 2000 million respectively .
Debt Service as of October 1, 2013
Table ( 23 )Projected Deposits (1)

Central Bank of Egypt - External Position 59
Table ( 24 )Exchange Rates of the Currencies of External Debt Versus US Dollar
as at End of September
Country Currency 2010 2011 2012 2013
United States USD 1.00 1.00 1.00 1.00
Switzerland CHF 0.97 0.90 0.94 0.91
Denmark DKK 5.46 5.47 5.80 5.53
Egypt EGP 5.68 5.96 6.08 6.87
Sweden SEK 6.71 6.77 6.57 6.42
Japan JPY 83.35 76.72 77.94 97.64
India INR 44.56 48.99 52.70 62.78
United Kingdom GBP 0.63 0.64 0.62 0.62
Canada CAD 1.03 1.03 0.98 1.03
Australia AUD 1.03 1.02 0.96 1.07
Norway NOK 5.85 5.76 5.73 6.02
Euro EURO 0.73 0.73 0.78 0.74
Special Drawing Rights SDR 0.64 0.64 0.65 0.65
Kuwait KWD 0.28 0.28 0.28 0.28
United Arab Emirates AED 3.67 3.67 3.67 3.67
Saudi Arabia SAR 3.75 3.75 3.75 3.75

Central Bank of Egypt – External Position
Appendix III
Box Page
I- Egypt's Subscription to SDDS and Data Quality Dimensions……………… 1 61
II- Egypt's Data Quality Dimensions…………………………………………... 2 62
III- Doing Business in Egypt…………………………………………………… 3 63
IIII- Tourism Sector Performance ………………………………………………. 4 64
- Definitions and Terminology………………………………………………. 65

Central Bank of Egypt – External Position 61
Box. (1): Egypt's Subscription to SDDS and Data Quality Dimensions: In 1996, the International Monetary Fund (IMF) introduced the Special Data Dissemination Standards (SDDS). The SDDS is intended to guide countries that have, or seek to have, access to international capital markets in their provision of economic and financial statistics. Subscription to SDDS is voluntary and it requires subscribers to observe the standard and provide information on data and dissemination practices (the metadata) to the IMF for re-dissemination. The standard identifies 4 dimensions of data dissemination: coverage, periodicity, and timeliness; access by the public; the integrity of the disseminated data; and the quality of the data themselves. In particular, the data dimension lists 18 data category, providing coverage for 4 sectors (real, financial, fiscal and external sectors) of the economy and prescribes minimum timeliness and frequency standard, summarized in table below.
On January 31, 2005, Egypt became the 59th subscriber to the International
Monetary Fund's Special Data Dissemination Standard (SDDS). The report of external position contains external sector data that consist of external debt, balance of payments, international reserves, merchandise trade, international investment position (IIP) and exchange rates data. Such data are published in compliance with the requirement under Special Data Dissemination Standards (SDDS) of the IMF. Central Bank of Egypt compiles these statistics and disseminates them through press releases, its website, and at the same time, on the IMF's Dissemination Standard Bulletin Board (DSBB). Also, these data are included in the CBE main publications; quarterly Economic Review, Annual Report and monthly Bulletins. As the title indicates, the most comprehensive and complete databases are those available from national sources, supplying high quality, timely and accurate data to international financial community to support investment activity.
SDDS Data Categories and Related Periodicity & Timeliness Standards
SDDS Data Category Periodicity Minimum Timeliness Real Sector National accounts Quarterly 1 Quarter Production indices Monthly 6 weeks Employment, unemployment, wage/earnings Quarterly 1 Quarter Consumer price index Monthly 1 Month Fiscal Sector General Government operations Annual 2 quarters Central Government operations Monthly 1 Month Central Government debt Quarterly 1 Quarter Financial Sector Analytical accounts of the banking sector Monthly 1 Month Analytical accounts of the Central Bank Monthly 2 weeks Interest rates and stock market Daily * No timeliness standard set External Sector Balance of payments Quarterly 1 Quarter International reserves Monthly 1 week Merchandise trade Monthly 8 weeks International investment position (IIP) Annual 3 quarters External debt Quarterly 1 Quarter Exchange rates Daily *No timeliness standard set Source: IMF Statistics Department. 1 http://dsbb.imf.org/Pages/SDDS/CtyCtgList.aspx?ctycode=EGY

Central Bank of Egypt – External Position 62
Box. (2):Egypt's Data Quality Dimensions*: According to international rating agencies, having an efficient, effective and reliable economic data, especially in developing countries, is becoming increasingly crucial to assign an appropriate sovereign credit rating. Thus, a lack of data in this area will automatically translate into a perception of high risk. Therefore, highlighting the dimensions of Egypt data quality by showing the results of World Bank index (BBSC 2013) will be an appropriate way to show how reliable are the Egyptian official data.
Egypt ranked 10th on World Bank's Bulletin Board on Statistical Capacity index on 149 developing countries and 1st on the MENA and African regions, with an overall statistical capacity index of 90 points, compared to 87 points in 2012. This score puts Egypt among the top 10 country group score list, ranging between 90-100 points. These countries can be distinguished and noticed easily on the map by countries colored dark green, as shown above.
Statistical Capacity Indicator 2013 (on a scale of 0-100)
Indicator Egypt All Countries Overall 90 68 Methodology 80 58
Source Data 100 65 Periodicity & timeliness 90 82
A country's statistical capacity means its ability to extract and publish reliable and timely statistical data, easily accessible by the public. The statistical capacity index, issued annually by the World Bank, consists of three sub-indicators which include; methodology, data sources, and its periodicity and timeliness. The latter measures the degree of information and data dissemination concerning changes in government policy, and how easily that information can be accessed by the public. It is worth mentioning that, aiming to improve the statistical capacity of 149 developing countries, the World Bank provides information on various aspects of national statistical systems through the BBSC indicator at its website.
0 20 40 60 80 100
Overall
Methodology
Source Data
Periodicity & Timeliness
All countries Egypt
As can be seen from the table and its chart, Egypt’s score outpaced the average score of all countries, either on the level of the overall index, or on the level of its three sub-indicators, getting the highest score of 100 points on the scale in the source data sub-indicator. ___________________________________________ * Source; bbsc.Worldbank.org, accessed in October, 2013.

Central Bank of Egypt – External Position 63
Box. (3): Doing Business in Egypt: One of the most important indices and reports that is closely related to investment climate and investor’s decisions is the Doing Business. The Report has been designed and issued by the World Bank Group on an annual basis since 2003. It provides objective measures of business regulations for firms in 189 economies worldwide. The 2014 ranking on the ease of doing business is built upon indicator sets that measure and benchmark regulations affecting 10 areas in a business’s life cycle (shown in table below). Doing Business encompasses 2 types of data. The first is “Legal scoring indicators” that provides a measure of legal provisions in the laws and regulations on the books. The other type is “Time and motion indicators”, which measures the efficiency and complexity in achieving a regulatory goal by recording the procedures, time and cost to complete a transaction according to all relevant regulations. By comparing business regulation environments across economies and over time, Doing Business encourages countries to compete towards more efficient regulation; offers measurable benchmarks for reform; and serves as a resource for policymakers and others interested in the business climate of each country.
Topic Rankings 2014 Rank 2013 Rank* Change in Rank
Overall index 128 127 -1 Starting a Business 50 44 -6 Dealing with Construction Permits 149 144 -5 Getting Electricity 105 104 -1 Registering Property 105 106 +1 Getting Credit 86 82 -4 Protecting Investors 147 147 - Paying Taxes 148 149 +1 Trading Across Borders 83 81 -2 Enforcing Contracts 156 155 -1 Resolving Insolvency 146 141 -5 * Last year's rankings are adjusted based on 10 topics and reflect data corrections.
Doing Business recognizes, every year, the 10 economies that improved the most in the ease of Doing Business in the previous year and introduced policy changes in 3 or more areas. A sweeping set of reforms of the business environment that was implemented, placed Egypt among the top reformers in the World Bank’s Doing Business Index over three consecutive years (2008-2010). During the transitional period, Egypt dropped back one place to 128th rank in 2014 from 127th in 2013.
Area of Reform Year Reform Actions 2008 The minimum capital required to start a business was cut from EGP 50,000 to EGP
1,000, and halved start-up time and cost.
2009 It was made easier by reducing the paid-in minimum capital requirement by more than 80%, abolishing bar association fees, and automating tax registration.
2010 The minimum capital required to start a business was removed Starting a Business
2011 Egypt reduced the cost to start a business. 2008 The cost of dealing with licenses was reduced.
2009 A new building code introduced in 2008 is aimed at reducing the procedures and time required to deal with construction permits by establishing a single window for processing construction-related approvals.
Dealing with Construction Permits
2010 Construction permits were made easier by issuing executive articles for the 2008 construction law and eliminating most pre-approvals for construction permits.
Protecting Investors 2009 New listing rules for the Cairo Stock Exchange strengthened protections for minority shareholders: now an independent body must assess transactions between interested parties before they are approved.
Enforcing Contracts 2010 Contract enforcement was expedited with the creation of commercial courts.
2009 Thanks to new regulations issued by the Central Bank, borrowers have the right to inspect their data in the private credit bureau. Getting Credit
2010 Access to credit information has expanded with the addition of retailers to the database of the private credit bureau.
2008 Registering property was reduced from 3% of the property value to a low fixed fee. Registering Property
2009 Simplified administrative procedures for registering property and new time limits have reduced the time to transfer property in Cairo from 193 days to 72.
2008 New one-stop shops were launched for traders at the ports, cutting the time to import by 7 days and the time to export by 5.
2009 Alexandria port continued to upgrade its facilities and speed customs clearance, reducing the time to export by 1 day and the time to import by 3.
Trading Across Borders
2011 Egypt made trading easier by introducing an electronic system for submitting export and import documents.
Source: www.doingbusiness.org, accessed in October, 2013.

Central Bank of Egypt – External Position 64
Box. (4): Tourism Sector Performance: On Q-over-Q comparison, the tourism sector experienced an unfavorable shock during Q1 of 2013/2014, as it witnessed massive drop in all tourism indicators; the number of tourist arrivals, the average expenditure per night and the number of tourist nights. (Lines 1, 2, and 5 in table below) Ministry of Tourism figures show that a total of 1630 thousand tourists coming from all over the world spent 15263 thousand nights in Q1 of 2013/2014, constituting remarkable declines of 46.5 percent and 57.0 percent respectively, from the same period of the previous year figures. About 46.5 percent contraction in tourist arrivals resulted from less visitors coming from all regions, as follows; Middle East region (59.9 percent of total decrease), Asia & Pacific region (53.2 percent), European countries (44.1 percent), Americas and African countries (32.4 percent and 24.1 percent respectively).
Egypt's Inward Tourism Performance2010/2011: Q1-2013/2014: Q1
3,65
3
3,29
0
1,79
2
1,85
4 2,70
2
2,36
0
2,02
3
2,33
5
2,64
0
2,94
2
2,49
4
1,67
2
931
0
500
1000
1500
2000
2500
3000
3500
4000
4500
Q1 Q2 Q3 Q4 Q1 Q2 Q3 Q4 Q1 Q2 Q3 Q4 Q1
2010/11 2011/12 2012/13 2013/14
05000100001500020000250003000035000400004500050000
Travel Receipts, $ mn Tourist Arrivals, X 1000Tourist Nights, X 1000
55
60
65
70
75
80
85
90
Q1 Q2 Q3 Q4 Q1 Q2 Q3 Q4 Q1 Q2 Q3 Q4 Q1
2010/11 2011/12 2012/13 2013/14
8
9
10
11
12
13
14
Receipts per Visitor Nights (USD/night)Average Nights Spent (per Visitor)
The average expenditure per night dropped to US$ 61.0/night in Q1 of 2013/2014 from US$ 74.4/night a year earlier (line 7 in the following table). This drop was mainly attributable to the fact that the biggest drops in numbers of tourists were in those coming from Middle East and Asian and Pacific regions, who have the highest expenditure per visitor night compared with other countries. In addition, the rate per room, on average is still at low levels, as hoteliers tried to maintain demand volume by lowering rates. As a consequence, travel receipts data of the balance of payments recorded a sharp drop of US$ 1.7 billion or 64.7 percent to US$ 931.1 million (Q-over-Q) in the first quarter of 2013/14. In terms of consecutive quarters, this quarter recorded the lowest level over the previous ten years as it hit approximately the same level of the third quarter of 2002/2003. Overall, such deterioration was caused mainly by an alert issued by USA and European countries for their citizens from traveling to Egypt, especially the Red Sea Coast resorts. During Q1 of 2013/2014, data show that visitors stayed shorter on average (9.4 nights per person compared to 11.6 nights per person a year earlier - line 6). Tourists coming from Middle East region headed the list in terms of the length of stay per visitor with an average of 15.5 nights per visitor. American region was the runner up with 12.3 nights/visitor, followed by European countries (8.2 nights/visitor), Asia & Pacific region (7.4 nights/visitor) and African nationals (7.3 nights/visitor).
Indicators of Tourism Activity 2011/2012 2012/13 2013/14
2011/12 2012/13 Q1 Q1 Q4 Q1
1. Tourism Receipts (US$ mn) 9419 9748 2702 2640 1672 931 2. Stay-over Visitors (x 1.000) 10952 12213 2760 3046 3058 1630 3. Market Shares (% of Tourist Arrivals) 100 100 100 100 100 100 a. European Countries 74.0 73.1 74.6 71.1 71.7 74.4 b. Middle East Countries 15.9 17.1 16.6 19.6 17.6 14.7 c. African Countries 4.0 3.6 3.6 3.5 4.2 5.0 d. The Americas 2.6 2.4 2.4 2.4 2.6 3.1 e. Asia & Pacific 3.4 3.6 2.6 3.1 3.7 2.7 f. Other Countries 0.2 0.2 0.2 0.2 0.2 0.2 4. Market Shares (% of Tourist Nights) 100 100 100 100 100 100 a. European Countries 65.9 68.7 61.8 66.5 72.4 65.5 b. Middle East Countries 22.9 22.2 26.6 23.2 19.7 24.3 c. African Countries 4.8 3.7 5.3 4.1 3.7 3.9 d. The Americas 3.3 2.6 3.7 3.5 2.1 4.0 e. Asia & Pacific 3.0 2.7 2.5 2.6 2.1 2.1 f. Other Countries 0.2 0.1 0.1 0.1 0.1 0.2 5. Visitor Nights (x 1.000) 131,768 142,431 37,420 35,485 27,815 15,263 6. Average Nights Spent (per Visitor) 10.4 12.0 11.7 13.6 11.6 9.1 7. Receipts per Visitor Nights (USD) 71.5 68.0 72.2 74.4 60.1 61.0 8. Contribution to Current Receipts % 14.6 14.5 16.7 15.9 10.5 5.1
Sources: CBE, MOT, and CAPMAS.

Central Bank of Egypt – External Position 65
Definitions and Terminology Balance of Payments: a statistical statement that summarizes, for a specific period of time, the economic transactions of an economy with the rest of the world. Bilateral Rescheduling Agree-ments: agreements that are reached bilaterally between the debtor and creditor countries. Egypt's Paris Club Rescheduling Agreement was signed in May 25, 1991. Buyer’s Credit: a financial arrange-ment, in which a bank or financial institution in the exporting country extends a loan directly to a foreign buyer or to a bank in the importing country to pay for the purchase of goods and services from the exporting country. Capital Account: a bop account that covers capital transfers and the acquisition or disposal of non-produced non-financial items, such as; patents. Creditor Country: the country in which the creditor resides. In Paris Club terminology, it is an official bilateral creditor. Current Account: a bop account that covers all transactions in goods, services, income, and current transfers between residents and nonresidents. Cutoff Date: the date (established at the time of a country’s first Paris Club debt reorganization/ restruc-turing) before which loans must have been contracted in order for their debt service to be eligible for restructuring. New loans extended after the cutoff date are protected from future restructuring. Ac-cordingly, Egypt's external debt are divided into rescheduled and non-rescheduled debt.
Debt Instruments: they include debt securities, loans, trade credit, (buyers' and suppliers' credits) and currency and deposits. Debt Service: payments in respect of both principal and interest. Scheduled debt service is the set of payments, including principal and interest that is required to be made through the life of the debt. Actual debt service is the set of payments actually made. Financial Account: a bop account that covers transactions between residents and nonresidents in direct, portfolio, and other investment, financial derivatives, and reserve assets. Gross Domestic Product (GDP): the value of an economy's total output of goods and services, less intermediate consumption, plus net taxes on products and imports. It can be broken down by output, ex-penditure, or income components. The main expenditure aggregates are final consumption of household and government, gross fixed capital formation, changes in inventories and imports and exports of goods and services. Gross External Debt: the out-standing amount of those actual current, and not contingent, liabi-lities that require payments of principal and/or interest by the debtor at some point(s) in the future and that are owed to nonresidents by residents of an economy. International Investment Position (IIP): Egypt's (IIP) is a financial statement setting out the value and composition of Egypt's external financial assets and liabilities. Egypt's IIP is based on the BPM5. According to SDDS requirements, it has been reported to the IMF on an annual basis since 2004.

Central Bank of Egypt – External Position 66 Long and Short-term: one way of classifying external debt is into long and short-term. Long term debt is defined as debt with an original maturity of more than one year, while short term debt is defined as debt repayments on demand or with an original maturity of one year or less.
Multilateral and Bilateral Debt: Multilateral creditors are primarily multilateral institutions, such as the IMF, World Bank and African Development Bank (AfDB), etc. Bilateral creditors are sovereign countries with whom sovereign and non-sovereign entities enter into one-to-one loan arrangements. Official Development Assistance (ODA) Loan: has a maturity of over one year and with a grant element of at least 25 percent (using a fixed 10 percent rate of discount), provided by governments or official agencies, and for which repayment is required in convertible currencies or in kind. Original Maturity: the period of time from when the financial asset/liability was created to its final maturity date.
Remaining (Residual) Maturity: the period of time until debt payments fall due. It is re-commended that short-term by remaining maturity of outstanding external debt be measured by adding the value of outstanding short-term external debt (original maturity) to the value of outstanding long-term external debt (original maturity) due to be paid in one year or less. Paris Club: an informal group of creditor governments that has met regularly in Paris since 1956 to reschedule bilateral debts. Creditors meet with a debtor country to reschedule its debts as part of the international support provided to a country that is experiencing debt servicing difficulties and is pursuing an adjustment program supported by the IMF. Supplier's Credit: refers to credit extended directly from the exporter to the importer who pays a down payment ranging between 15% - 20% of the total value of the imported goods and services. Debt Sustainability: is the ability of government to service its borrowings, both internal and external, without resorting to rescheduling or accumulation of arrears