業績推移データ Historical Financial Data 1 Overview 1Law of Japan and the Company Law of...
21
2015/04/28 業績推移データ Historical Financial Data 主要連結業績データ推移 1 Overview_1 主要連結業績データ推移 2 Overview_2 海外売上高 International sales 旧海外売上高 Old International sales セグメント情報 Segment Information 旧セグメント情報 1 Old Segment Information_1 旧セグメント情報 2 Old Segment Information_2 携帯電話機出荷台数 Mobile Terminal Sales 当社は、2006年度(2007年3月期)中間決算から、証券取引法および会社法において要求される連結財務諸表を作成する際の会計基準を米国会計基準から日 本会計基準に変更いたしました。これに伴い、本資料に掲載されている情報は、日本会計基準に基づいております。日本会計基準と米国会計基準との間には重 大な差異があります。 NEC has changed the accounting principles under which it prepares its consolidated financial statements required under the Securities and Exchange Law of Japan and the Company Law of Japan from U.S. GAAP to Japan GAAP, effective for the first half of the fiscal year ending March 31, 2007. In light of the change, the information provided on this supplementai material has been prepared in accordance with Japan GAAP.Please note that there are significant differences between Japan GAAP and U.S. GAAP. <将来予想に関する注意> CAUTIONARY STATEMENTS: 本資料には日本電気株式会社および連結子会社(以下NECと総称します。)の戦略、財務目標、技術、製品、サービス、業績等に関する将来予想に関する記述 が含まれています。将来予想は、NECが金融商品取引所や関東財務局長等の規制当局に提出する他の資料および株主向けの報告書その他の通知に記載され ている場合があります。NECは、そのような開示を行う場合、将来予想に関するセーフハーバー(safe-harbor)ルールに準拠しています。これらの記述は、現在入 手可能な仮定やデータ、方法に基づいていますが、そうした仮定やデータ、方法は必ずしも正しいとは限らず、NECは予想された結果を実現できない場合があり ます。また、これら将来予想に関する記述は、あくまでNECの分析や予想を記述したものであって、将来の業績を保証するものではありません。このため、これらの 記述を過度に信頼することは控えるようお願いします。また、これらの記述はリスクや不確定な要因を含んでおり、様々な要因により実際の結果とは大きく異なり うることをあらかじめご了承願います。実際の結果に影響を与える要因には、(1)NECの事業領域を取り巻く国際経済・経済全般の情勢、(2)市場におけるNECの 製品、サービスに対する需要変動や競争激化による価格下落圧力、(3)激しい競争にさらされた市場においてNECが引き続き顧客に受け入れられる製品、サービ スを提供し続けていくことができる能力、(4)NECが中国等の海外市場において事業を拡大していく能力、(5)NECの事業活動に関する規制の変更や不透明さ、 潜在的な法的責任、(6)市場環境の変化に応じてNECが経営構造を改革し、事業経営を適応させていく能力、(7)為替レート(特に米ドルと円との為替レート)の 変動、(8)NECが保有する上場株式の減損をもたらす株価下落など、株式市場における好ましくない状況や動向、(9)NECに対する規制当局による措置や法的手 続きによる影響等があります。将来予想に関する記述は、あくまでも公表日現在における予想です。新たなリスクや不確定要因は随時生じるものであり、その発 生や影響を予測することは不可能であります。また、新たな情報、将来の事象その他にかかわらず、NECがこれら将来予想に関する記述を見直すとは限りませ ん。 This material contains forward-looking statements pertaining to strategies, financial targets, technology, products and services, and business performance of NEC Corporation and its consolidated subsidiaries (collectively "NEC"). Written forward-looking statements may appear in other documents that NEC files with stock exchanges or regulatory authorities, such as the Director of the Kanto Finance Bureau, and in reports to shareholders and other communications. NEC is relying on certain safe-harbors for forward-looking statements in making these disclosures. Some of the forward-looking statements can be identified by the use of forward-looking words such as "believes," "expects," "may," "will," "should," "seeks," "intends," "plans," "estimates," "targets," "aims," or "anticipates," or the negative of those words, or other comparable words or phrases. You can also identify forward-looking statements by discussions of strategy, beliefs, plans, targets, or intentions. Forward-looking statements necessarily depend on currently available assumptions, data, or methods that may be incorrect or imprecise and NEC may not be able to realize the results expected by them. You should not place undue reliance on forward-looking statements, which reflect NEC’s analysis and expectations only. Forward-looking statements are not guarantees of future performance and involve inherent risks and uncertainties. A number of important factors could cause actual results to differ materially from those in the forward-looking statements. Among the factors that could cause actual results to differ materially from such statements include (i) global economic conditions and general economic conditions in NEC’s markets, (ii) fluctuating demand for, and competitive pricing pressure on, NEC’s products and services, (iii) NEC’s ability to continue to win acceptance of NEC’s products and services in highly competitive markets, (iv) NEC’s ability to expand into foreign markets, such as China, (v) regulatory change and uncertainty and potential legal liability relating to NEC’s business and operations, (vi) NEC’s ability to restructure, or otherwise adjust, its operations to reflect changing market conditions, (vii) movement of currency exchange rates, particularly the rate between the yen and the U.S. dollar, (viii) the impact of unfavorable conditions or developments, including share price declines, in the equity markets which may result in losses from devaluation of listed securities held by NEC, and (iv) impact of any regulatory action or legal proceeding against NEC. Any forward-looking statements speak only as of the date on which they are made. New risks and uncertainties come up from time to time, and it is impossible for NEC to predict these events or how they may affect NEC. NEC does not undertake any obligation to update or revise any of the forward-looking statements, whether as a result of new information, future events, or otherwise. 本資料に含まれる経営目標は、予測や将来の業績に関する経営陣の現在の推定を表すものではなく、NECが事業戦略を遂行することにより経営陣が達成しよ うと努める目標を表すものです。 The management targets included in this material are not projections, and do not represent management’s current estimates of future performance. Rather, they represent targets that management will strive to achieve through the successful implementation of NEC’s business strategies. 本資料に含まれる記述は、有価証券の募集を構成するものではありません。いかなる国・地域においても、法律上証券の登録が必要となる場合は、有価証券の 登録を行う場合または登録の免除を受ける場合を除き、有価証券の募集または売出しを行うことはできません。 Finally, NEC cautions you that the statements made in this material are not an offer of securities for sale. Securities may not be offered or sold in any jurisdiction in which required registration is absent or an exemption from registration under the applicable securities laws is not granted.
Transcript of 業績推移データ Historical Financial Data 1 Overview 1Law of Japan and the Company Law of...
2015/04/28
業績推移データ Historical Financial Data
主要連結業績データ推移1 Overview_1主要連結業績データ推移2 Overview_2海外売上高 International sales旧海外売上高 Old International salesセグメント情報 Segment Information旧セグメント情報1 Old Segment Information_1旧セグメント情報2 Old Segment Information_2携帯電話機出荷台数 Mobile Terminal Sales
当社は、2006年度(2007年3月期)中間決算から、証券取引法および会社法において要求される連結財務諸表を作成する際の会計基準を米国会計基準から日
本会計基準に変更いたしました。これに伴い、本資料に掲載されている情報は、日本会計基準に基づいております。日本会計基準と米国会計基準との間には重
大な差異があります。
NEC has changed the accounting principles under which it prepares its consolidated financial statements required under the Securities and ExchangeLaw of Japan and the Company Law of Japan from U.S. GAAP to Japan GAAP, effective for the first half of the fiscal year ending March 31, 2007. Inlight of the change, the information provided on this supplementai material has been prepared in accordance with Japan GAAP.Please note thatthere are significant differences between Japan GAAP and U.S. GAAP.
<将来予想に関する注意> CAUTIONARY STATEMENTS:
本資料には日本電気株式会社および連結子会社(以下NECと総称します。)の戦略、財務目標、技術、製品、サービス、業績等に関する将来予想に関する記述
が含まれています。将来予想は、NECが金融商品取引所や関東財務局長等の規制当局に提出する他の資料および株主向けの報告書その他の通知に記載され
ている場合があります。NECは、そのような開示を行う場合、将来予想に関するセーフハーバー(safe-harbor)ルールに準拠しています。これらの記述は、現在入
手可能な仮定やデータ、方法に基づいていますが、そうした仮定やデータ、方法は必ずしも正しいとは限らず、NECは予想された結果を実現できない場合があり
ます。また、これら将来予想に関する記述は、あくまでNECの分析や予想を記述したものであって、将来の業績を保証するものではありません。このため、これらの
記述を過度に信頼することは控えるようお願いします。また、これらの記述はリスクや不確定な要因を含んでおり、様々な要因により実際の結果とは大きく異なり
うることをあらかじめご了承願います。実際の結果に影響を与える要因には、(1)NECの事業領域を取り巻く国際経済・経済全般の情勢、(2)市場におけるNECの
製品、サービスに対する需要変動や競争激化による価格下落圧力、(3)激しい競争にさらされた市場においてNECが引き続き顧客に受け入れられる製品、サービ
スを提供し続けていくことができる能力、(4)NECが中国等の海外市場において事業を拡大していく能力、(5)NECの事業活動に関する規制の変更や不透明さ、
潜在的な法的責任、(6)市場環境の変化に応じてNECが経営構造を改革し、事業経営を適応させていく能力、(7)為替レート(特に米ドルと円との為替レート)の
変動、(8)NECが保有する上場株式の減損をもたらす株価下落など、株式市場における好ましくない状況や動向、(9)NECに対する規制当局による措置や法的手
続きによる影響等があります。将来予想に関する記述は、あくまでも公表日現在における予想です。新たなリスクや不確定要因は随時生じるものであり、その発
生や影響を予測することは不可能であります。また、新たな情報、将来の事象その他にかかわらず、NECがこれら将来予想に関する記述を見直すとは限りませ
ん。
This material contains forward-looking statements pertaining to strategies, financial targets, technology, products and services, and businessperformance of NEC Corporation and its consolidated subsidiaries (collectively "NEC"). Written forward-looking statements may appear in otherdocuments that NEC files with stock exchanges or regulatory authorities, such as the Director of the Kanto Finance Bureau, and in reports toshareholders and other communications. NEC is relying on certain safe-harbors for forward-looking statements in making these disclosures. Some ofthe forward-looking statements can be identified by the use of forward-looking words such as "believes," "expects," "may," "will," "should," "seeks,""intends," "plans," "estimates," "targets," "aims," or "anticipates," or the negative of those words, or other comparable words or phrases. You can alsoidentify forward-looking statements by discussions of strategy, beliefs, plans, targets, or intentions. Forward-looking statements necessarily dependon currently available assumptions, data, or methods that may be incorrect or imprecise and NEC may not be able to realize the results expected bythem. You should not place undue reliance on forward-looking statements, which reflect NEC’s analysis and expectations only. Forward-lookingstatements are not guarantees of future performance and involve inherent risks and uncertainties. A number of important factors could cause actualresults to differ materially from those in the forward-looking statements. Among the factors that could cause actual results to differ materially fromsuch statements include (i) global economic conditions and general economic conditions in NEC’s markets, (ii) fluctuating demand for, andcompetitive pricing pressure on, NEC’s products and services, (iii) NEC’s ability to continue to win acceptance of NEC’s products and services inhighly competitive markets, (iv) NEC’s ability to expand into foreign markets, such as China, (v) regulatory change and uncertainty and potential legalliability relating to NEC’s business and operations, (vi) NEC’s ability to restructure, or otherwise adjust, its operations to reflect changing marketconditions, (vii) movement of currency exchange rates, particularly the rate between the yen and the U.S. dollar, (viii) the impact of unfavorableconditions or developments, including share price declines, in the equity markets which may result in losses from devaluation of listed securities heldby NEC, and (iv) impact of any regulatory action or legal proceeding against NEC. Any forward-looking statements speak only as of the date onwhich they are made. New risks and uncertainties come up from time to time, and it is impossible for NEC to predict these events or how they mayaffect NEC. NEC does not undertake any obligation to update or revise any of the forward-looking statements, whether as a result of new information,future events, or otherwise.
本資料に含まれる経営目標は、予測や将来の業績に関する経営陣の現在の推定を表すものではなく、NECが事業戦略を遂行することにより経営陣が達成しよ
うと努める目標を表すものです。
The management targets included in this material are not projections, and do not represent management’s current estimates of future performance.Rather, they represent targets that management will strive to achieve through the successful implementation of NEC’s business strategies.
本資料に含まれる記述は、有価証券の募集を構成するものではありません。いかなる国・地域においても、法律上証券の登録が必要となる場合は、有価証券の
登録を行う場合または登録の免除を受ける場合を除き、有価証券の募集または売出しを行うことはできません。Finally, NEC cautions you that the statements made in this material are not an offer of securities for sale. Securities may not be offered or sold in anyjurisdiction in which required registration is absent or an exemption from registration under the applicable securities laws is not granted.
2015/04/28
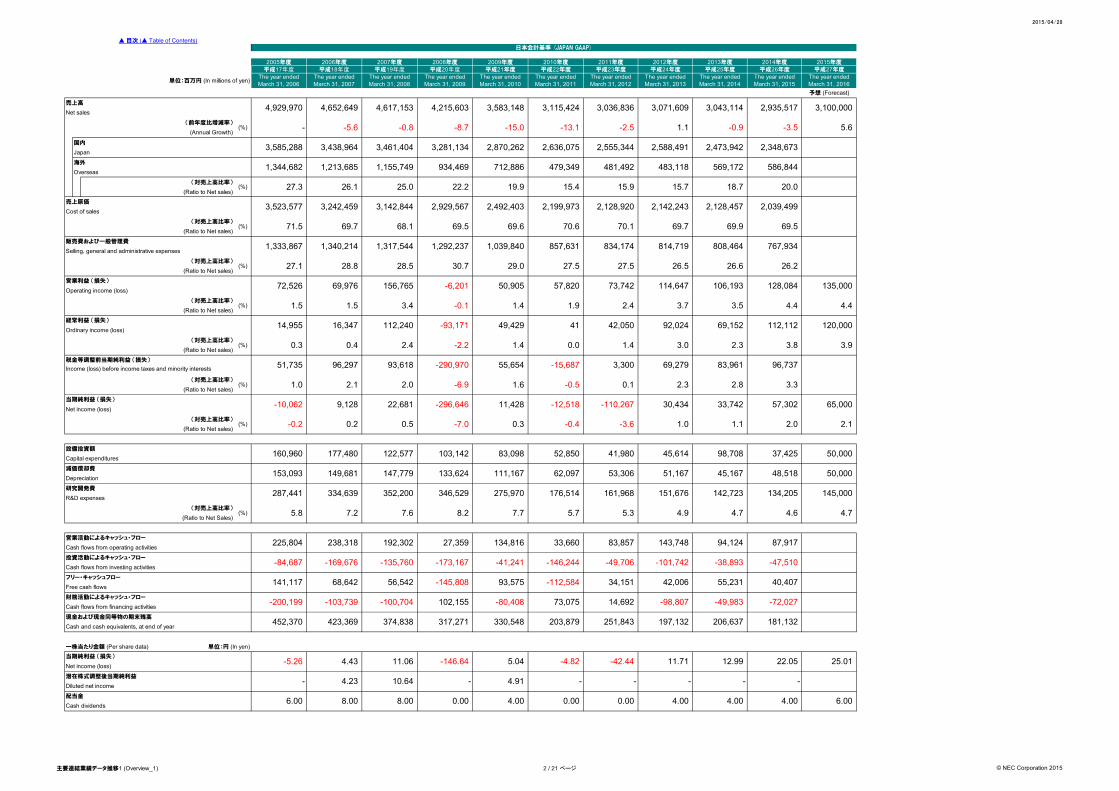
単位:百万円 (In millions of yen)
国内
Japan
海外
Overseas
(対売上高比率)
(Ratio to Net sales)
Income (loss) before income taxes and minority interests
一株当たり金額 (Per share data) 単位:円 (In yen)
25.01
6.00
日本会計基準 (JAPAN GAAP)
4.7
65,000
2.1
50,000
50,000
145,000
135,000
4.4
120,000
3.9
2015年度
平成27年度
The year endedMarch 31, 2016予想 (Forecast)
3,100,000
5.6
1.4
7.2
1.4
49,429
0.2
2.4
9,128
16,347
133,624
-6.9
▲ 目次 (▲ Table of Contents)
25.026.1
423,369 374,838 317,271
102,155
156,765
営業活動によるキャッシュ・フロー192,302
4.91
56,542 -145,808
-0.1
27,359 134,816
-2.2
103,142
330,548
-100,704
減価償却費
287,441
-80,408
93,575フリー・キャッシュフロー
-41,241 -169,676
Depreciation
Free cash flows
-200,199
-173,167
11.06
Cash flows from operating activities225,804
現金および現金同等物の期末残高
-103,739 財務活動によるキャッシュ・フロー
Cash flows from financing activities
投資活動によるキャッシュ・フロー
68,642141,117
0.4
0.006.00 8.00 8.00
334,639
-84,687 -135,760
452,370
Diluted net income- 4.23
配当金
Cash dividends
-146.64
10.64 -
4.43
Cash and cash equivalents, at end of year
潜在株式調整後当期純利益
2006年度 2007年度
平成19年度
2005年度
当期純利益 (損失)
Net income (loss)-5.26
Cash flows from investing activities
238,318
The year endedMarch 31, 2007
-8.7
4,617,153
The year endedMarch 31, 2008
Ordinary income (loss)
1,344,682
27.3
1,333,867
Operating income (loss)
平成17年度 平成18年度
4,215,603
The year endedMarch 31, 2006
4,929,970
2009年度
The year endedMarch 31, 2010
平成21年度平成20年度
2008年度
The year endedMarch 31, 2009
(対売上高比率)(%)
27.1
(Ratio to Net sales)
販売費および一般管理費
(Ratio to Net sales)
Selling, general and administrative expenses
(対売上高比率)(%)
営業利益 (損失)
売上高
Net sales
3,461,404
-0.8
(%)
4,652,649
(前年度比増減率)
3,585,288
(Annual Growth)
売上原価3,523,577
3,281,1343,438,964
3,142,844
-5.6
Cost of sales
19.9
712,886
2,929,567
(%) -
1,213,685 1,155,749 934,469
22.2
1,039,8401,340,214
2,492,403
1,317,544
69.7 68.1 69.5
3,583,148
11,428Net income (loss)
(%) 1.0 2.1 2.0
-15.0
2,870,262
(対売上高比率)
-10,062
-93,171 112,240
0.3
14,955
51,735
1.5
28.5
69,976
(対売上高比率)(%)
(対売上高比率)
(Ratio to Net sales)
税金等調整前当期純利益 (損失)
Capital expenditures
(Ratio to Net sales)
(%)
(対売上高比率)
当期純利益 (損失)
設備投資額160,960
27.5
-15,687
0.0
1.9
28.8
(Ratio to Net sales)
72,526
経常利益 (損失)
30.7
69.6
(%)
29.0
-6,201
71.5
1.5 3.4
50,905
1,292,237
-0.2
3,115,424
-13.1
2,636,075
479,349
57,820
96,297
41
70.6
93,618
(Ratio to Net sales)
15.4
研究開発費
(Ratio to Net Sales)
(対売上高比率)(%) 5.8 8.2
R&D expenses
7.6
153,093 147,779
2010年度
平成22年度
The year endedMarch 31, 2011
2,199,973
-296,646
857,631
3,242,459
-0.5
-12,518
55,654
1.6
22,681
-290,970
5.7
33,660
-146,244
-112,584
-
346,529
7.7
275,970
5.04
73,075
149,681
-0.4
52,850
111,167
0.3-7.0
62,097
83,098177,480
0.5
352,200
834,174
0.1
-110,267
3,300
4.00
122,577
203,879
-4.82
0.00
176,514
2011年度
平成23年度
The year endedMarch 31, 2012
-3.6
41,980
73,742
2.4
42,050
1.4
34,151
3,036,836
-2.5
2,555,344
481,492
-49,706
15.9
5.3
83,857
0.00
14,692
251,843
-42.44
-
1.1
2,128,920
53,306
161,968
27.5
70.1
15.7
2,142,243
69.7
3.7
92,024
2012年度
平成24年度
The year endedMarch 31, 2013
3,071,609
4.00
42,006
-98,807
197,132
11.71
2.3
1.0
45,614
483,118
814,719
26.5
114,647
3.0
69,279
2,473,942
569,172
-
4.9
143,748
-101,742
30,434
51,167
151,676
2,588,491
2013年度
平成25年度
The year endedMarch 31, 2014
3,043,114
-0.9
18.7
2,128,457
69.9
808,464
2.3
83,961
3.5
69,152
26.6
106,193
1.1
98,708
2.8
33,742
45,167
142,723
12.99
-
4.00
4.7
94,124
-38,893
55,231
-49,983
206,637
2014年度
平成26年度
The year endedMarch 31, 2015
2,935,517
-3.5
3.3
2,348,673
586,844
20.0
69.5
767,934
26.2
2.0
37,425
48,518
134,205
4.6
128,084
4.4
112,112
3.8
96,737
-
4.00
2,039,499
87,917
-47,510
40,407
-72,027
181,132
22.05
57,302
主要連結業績データ推移1 (Overview_1) 2 / 21 ページ © NEC Corporation 2015
2015/04/28
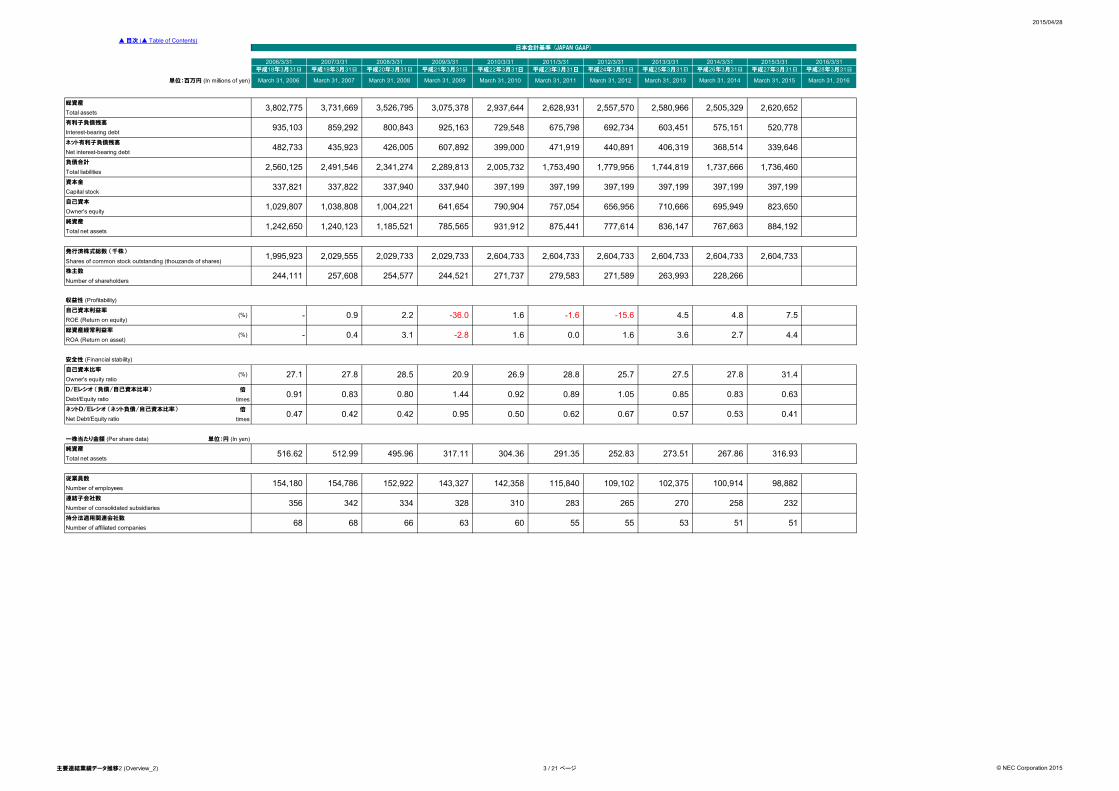
単位:百万円 (In millions of yen)
Shares of common stock outstanding (thouzands of shares)
Number of shareholders
倍
times
倍
times
一株当たり金額 (Per share data) 単位:円 (In yen)
日本会計基準 (JAPAN GAAP)
2016/3/31平成28年3月31日
March 31, 2016
267.86
100,914
258
51
228,266
4.8
2.7
27.8
0.83
0.53
368,514
1,737,666
397,199
695,949
767,663
2,604,733
2014/3/31平成26年3月31日
March 31, 2014
2,505,329
575,151
2,289,8132,341,274
254,577
785,565
Number of employees154,786
収益性 (Profitability)
自己資本比率
(%)
安全性 (Financial stability)
154,180
(%)
Net Debt/Equity ratio
ROE (Return on equity)
0.4
790,904
20.9
-2.8
244,521
641,654
2.2 -36.0
ネットD/Eレシオ (ネット負債/自己資本比率)
D/Eレシオ (負債/自己資本比率)
27.1
Debt/Equity ratio
Owner's equity ratio
(%)
1,240,123
244,111
1,038,808
337,940
935,103
426,005
800,843
337,822
負債合計
482,733
純資産
1,004,221
1,185,521
0.80
27.8
1,029,807
1,242,650
2,029,733
3,526,795
平成18年3月31日 平成19年3月31日
自己資本利益率0.9
March 31, 2006 March 31, 2007
自己資本
Total net assets
Owner's equity
総資産
2008/3/31 2009/3/31
3,731,669
2006/3/31 2007/3/31平成20年3月31日 平成21年3月31日
March 31, 2008
有利子負債残高
Interest-bearing debt
March 31, 2009
▲ 目次 (▲ Table of Contents)
2,029,5551,995,923発行済株式総数 (千株)
2,560,125
資本金
Total liabilities
3,075,378Total assets
337,821Capital stock
859,292
2,491,546
ネット有利子負債残高
Net interest-bearing debt
6068 68 6366
925,163
435,923
3,802,775
607,892
143,327 142,358
356
1.440.91 0.83
334
0.47
328
0.95
Number of affiliated companies
持分法適用関連会社数
257,608
総資産経常利益率
株主数
342
従業員数
-ROA (Return on asset)
-
757,054
397,199
2,029,733
875,441
337,940
0.42
3.1
28.5
0.50
0.92
2010/3/31
471,919
1,753,490
397,199
平成22年3月31日
399,000
2,005,732
2,937,644
729,548
2011/3/31平成23年3月31日
March 31, 2011
2,628,931
675,798
March 31, 2010
279,583
-1.6
0.89
310Number of consolidated subsidiaries
495.96 317.11Total net assets
純資産516.62
連結子会社数
0.62
28.8
1.6
931,912
271,737
0.0
26.9
1.6
2,604,7332,604,733
397,199
55
0.42
283
152,922
304.36512.99
115,840
291.35
1,779,956
2012/3/31平成24年3月31日
March 31, 2012
2,557,570
692,734
440,891
656,956
777,614
2,604,733
25.7
55
1.05
0.67
252.83
109,102
265
2,604,733
27.5
0.85
271,589
-15.6
1.6
263,993
4.5
3.6
273.51
102,375
270
53
0.57
406,319
1,744,819
397,199
710,666
836,147
2,580,966
603,451
2013/3/31平成25年3月31日
March 31, 2013
2015/3/31平成27年3月31日
March 31, 2015
2,620,652
520,778
339,646
1,736,460
397,199
823,650
884,192
2,604,733
316.93
98,882
232
51
7.5
4.4
31.4
0.63
0.41
主要連結業績データ推移2 (Overview_2) 3 / 21 ページ © NEC Corporation 2015
2015/04/28
単位:百万円 (In millions of yen)
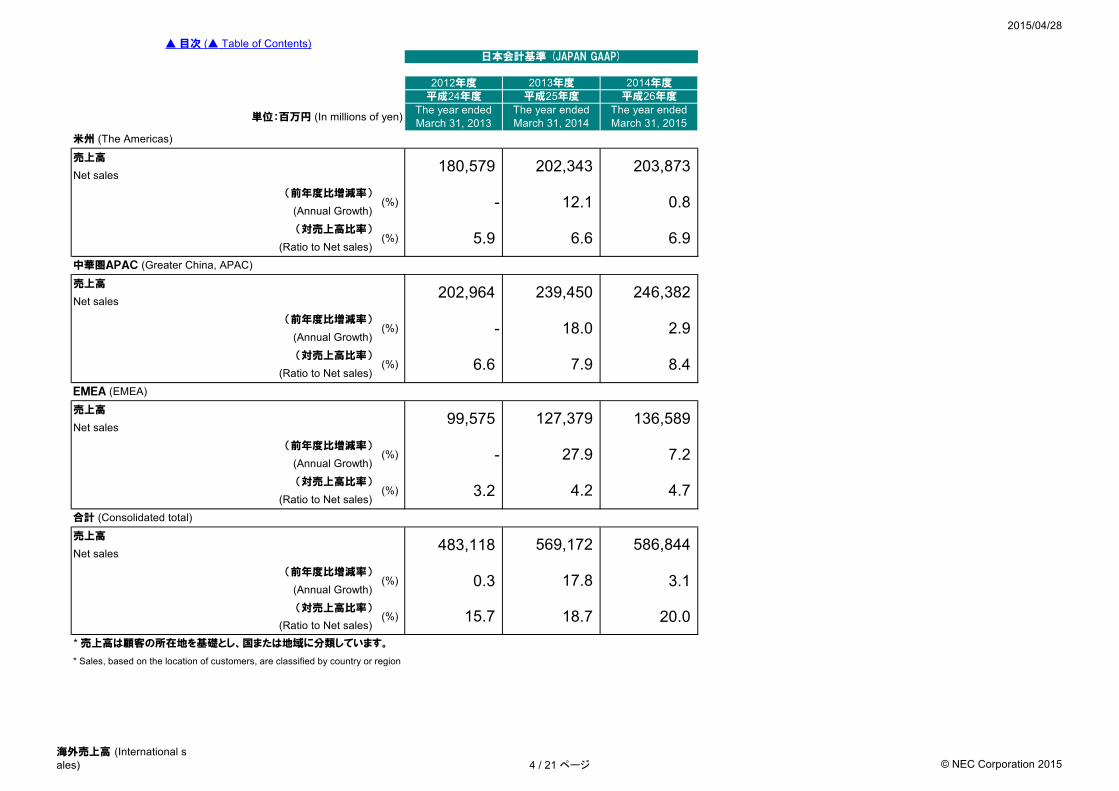
売上高
Net sales
売上高
Net sales
売上高
Net sales
売上高
Net sales
3.1
20.0
日本会計基準 (JAPAN GAAP)
8.4
136,589
7.2
18.7
2014年度平成26年度
The year endedMarch 31, 2015
203,873
0.8
6.9
246,382
2.9
127,379
27.9
4.2
569,172
4.7
586,844
17.8
6.6
239,450
18.0
7.9
2013年度平成25年度
The year endedMarch 31, 2014
202,343
12.1
15.7(Ratio to Net sales)
* 売上高は顧客の所在地を基礎とし、国または地域に分類しています。
* Sales, based on the location of customers, are classified by country or region
0.3(Annual Growth)
(対売上高比率)(%)
483,118(前年度比増減率)
(%)
3.2(Ratio to Net sales)
合計 (Consolidated total)
-(Annual Growth)
(対売上高比率)(%)
99,575(前年度比増減率)
(%)
EMEA (EMEA)
6.6(Ratio to Net sales)
-(Annual Growth)
(対売上高比率)(%)
202,964(前年度比増減率)
(%)
5.9(Ratio to Net sales)
中華圏APAC (Greater China, APAC)
-(Annual Growth)
(対売上高比率)(%)
180,579(前年度比増減率)
(%)
The year endedMarch 31, 2013
米州 (The Americas)
2012年度平成24年度
▲ 目次 (▲ Table of Contents)
海外売上高 (International sales) 4 / 21 ページ © NEC Corporation 2015
2013/04/26
単位:百万円 (In millions of yen)
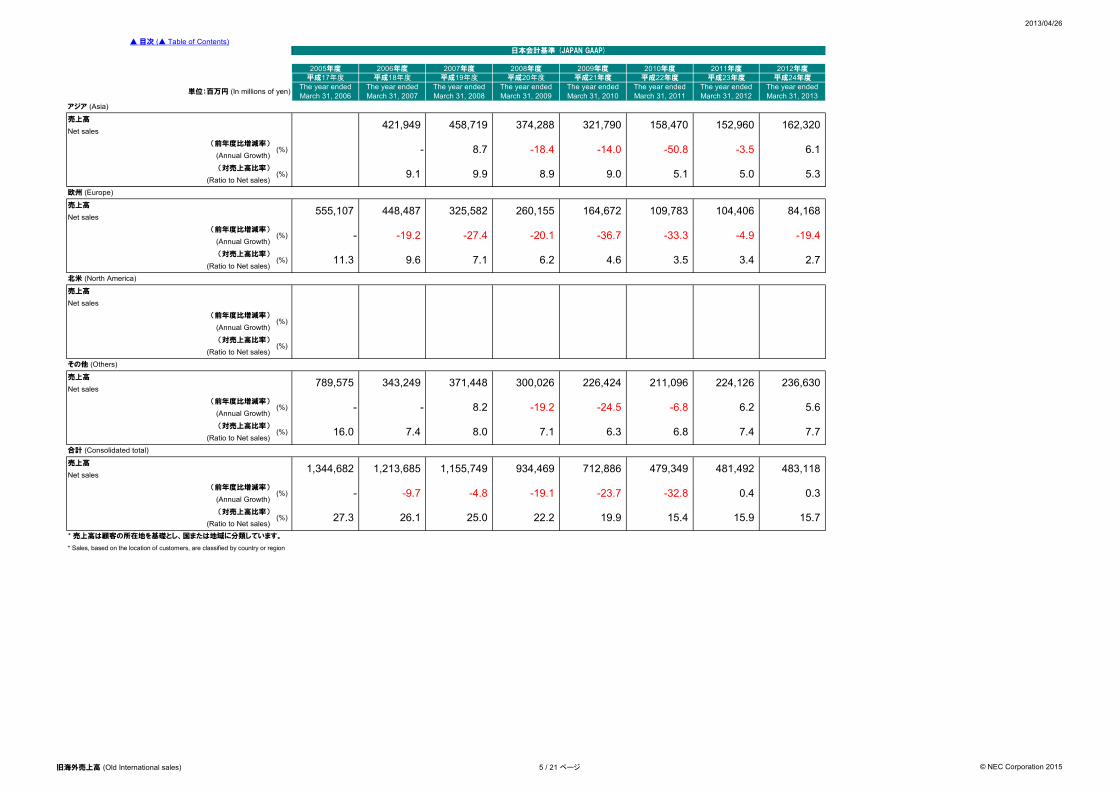
売上高
Net sales
売上高
Net sales
売上高
Net sales
売上高
Net sales
売上高
Net sales
平成19年度 平成20年度 平成21年度平成17年度 平成18年度2009年度2006年度
-18.4
(対売上高比率)
(前年度比増減率)
-
(Annual Growth)
▲ 目次 (▲ Table of Contents)
(前年度比増減率)(%)
2008年度2007年度
(前年度比増減率)
(%)
* 売上高は顧客の所在地を基礎とし、国または地域に分類しています。
* Sales, based on the location of customers, are classified by country or region
(Annual Growth)
(対売上高比率)
(Annual Growth)
(対売上高比率)(%)
(%)
-14.0
9.1
-27.4
The year endedMarch 31, 2010
The year endedMarch 31, 2006
The year endedMarch 31, 2007
The year endedMarch 31, 2009
The year endedMarch 31, 2008
321,790
-36.7
- 8.7
4.66.2
9.08.9
164,672
-19.2
日本会計基準 (JAPAN GAAP)
2010年度 2011年度 2012年度2005年度平成22年度 平成23年度 平成24年度
The year endedMarch 31, 2011
The year endedMarch 31, 2012
The year endedMarch 31, 2013
アジア (Asia)
158,470 152,960 162,320421,949 458,719 374,288
-50.8 -3.5 6.1(対売上高比率)
(%) 5.1 5.0 5.3(Ratio to Net sales)
9.9欧州 (Europe)
555,107 448,487 325,582 260,155 109,783 104,406 84,168(前年度比増減率)
(%) -33.3 -4.9 -19.4 (Annual Growth)
-20.1
3.5 3.4 2.7北米 (North America)
(Ratio to Net sales)11.3(%) 7.19.6
(%)(Annual Growth)
(対売上高比率)(%)
(Ratio to Net sales)
その他 (Others)
789,575 343,249 371,448 300,026 226,424 211,096 224,126 236,630(前年度比増減率)
(%) - - 8.2 -19.2 -24.5 -6.8 6.2 5.6
16.0 7.4 8.0 7.1 6.3 6.8(Ratio to Net sales)
合計 (Consolidated total)
1,344,682 1,213,685 1,155,749 934,469
15.7
-32.8 0.4 0.3
25.0
7.4 7.7
712,886 479,349
26.1
- -9.7 -4.8 -19.1 -23.7
(Ratio to Net sales)
481,492 483,118
22.2 19.9 15.4 15.927.3
旧海外売上高 (Old International sales) 5 / 21 ページ © NEC Corporation 2015
2015/04/28
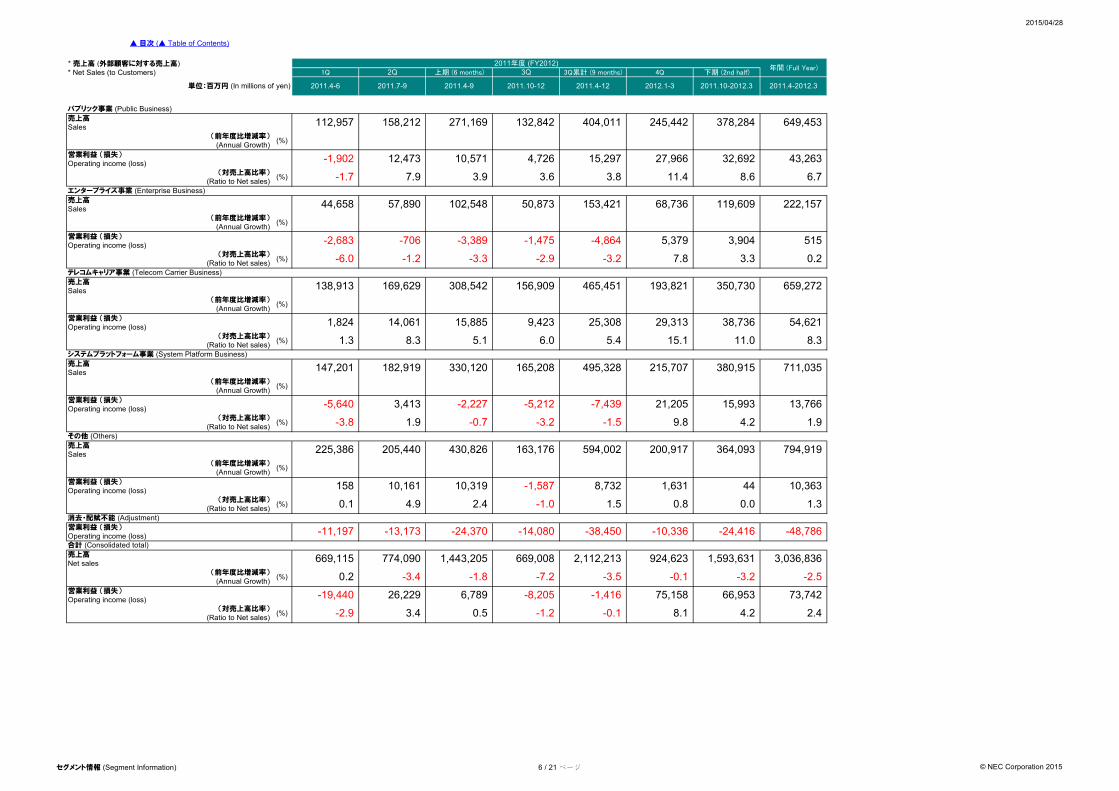
* 売上高 (外部顧客に対する売上高)* Net Sales (to Customers)
売上高Sales
営業利益 (損失)Operating income (loss)
売上高Sales
営業利益 (損失)Operating income (loss)
売上高Sales
営業利益 (損失)Operating income (loss)
売上高Sales
営業利益 (損失)Operating income (loss)
売上高Sales
営業利益 (損失)Operating income (loss)
営業利益 (損失)Operating income (loss)
売上高Net sales
営業利益 (損失)Operating income (loss)
▲ 目次 (▲ Table of Contents)
2011年度 (FY2012)1Q
年間 (Full Year)2Q 上期 (6 months) 3Q 3Q累計 (9 months) 4Q 下期 (2nd half)
2011.10-12 2011.4-12 2012.1-3 2011.10-2012.3 2011.4-2012.3単位:百万円 (In millions of yen) 2011.4-6 2011.7-9 2011.4-9
271,169 132,842 404,011112,957 158,212 378,284245,442 649,453パブリック事業 (Public Business)
(前年度比増減率) (%)(Annual Growth)
12,473 10,571 4,726 15,297 27,966 32,692-1,902
7.9 3.9
43,263
6.7(対売上高比率) (%) -1.7 3.6 3.8 11.4 8.6エンタープライズ事業 (Enterprise Business)
(Ratio to Net sales)
44,658 57,890 102,548 50,873 153,421 68,736(前年度比増減率) (%)(Annual Growth)
119,609 222,157
-2,683 -706 -3,389 -1,475 -4,864 5,379
-3.3 -2.9
3,904 515
-6.0 -1.2
350,730
(Ratio to Net sales)テレコムキャリア事業 (Telecom Carrier Business)
-3.2 7.8(対売上高比率) (%) 3.3 0.2
138,913 169,629 308,542(前年度比増減率) (%)(Annual Growth)
156,909 465,451 193,821 659,272
1,824 14,061 15,885 9,423 25,308 29,313
5.1 6.0
38,736 54,621
1.3 8.3
380,915
(Ratio to Net sales)システムプラットフォーム事業 (System Platform Business)
5.4 15.1(対売上高比率) (%) 11.0 8.3
147,201 182,919 330,120(前年度比増減率) (%)(Annual Growth)
165,208 495,328 215,707 711,035
-5,640 3,413 -2,227 -5,212 -7,439 21,205
-0.7 -3.2
15,993 13,766
-3.8 1.9
364,093
(Ratio to Net sales)その他 (Others)
-1.5 9.8(対売上高比率) (%) 4.2 1.9
225,386 205,440 430,826(前年度比増減率) (%)(Annual Growth)
163,176 594,002 200,917 794,919
158 10,161 10,319 -1,587 8,732 1,631 44 10,363
0.0 1.32.4 -1.0 (Ratio to Net sales)消去・配賦不能 (Adjustment)
1.5 0.8(対売上高比率) (%) 0.1 4.9
合計 (Consolidated total)
924,6231,443,205 669,008 1,593,631 3,036,836
-10,336 -24,416
2,112,213
-48,786 -11,197 -13,173 -24,370 -14,080 -38,450
(前年度比増減率) (%)
774,090669,115
-3.5 -0.1 -3.2 -2.5
-19,440 26,229 6,789 -8,205
0.2 -3.4 -1.8 -7.2 (Annual Growth)
-1,416 75,158 66,953 73,742
0.5 -1.2 -0.1 8.1 4.2 2.4(対売上高比率) (%) -2.9 3.4(Ratio to Net sales)
セグメント情報 (Segment Information) 6 / 21 ページ © NEC Corporation 2015
2015/04/28
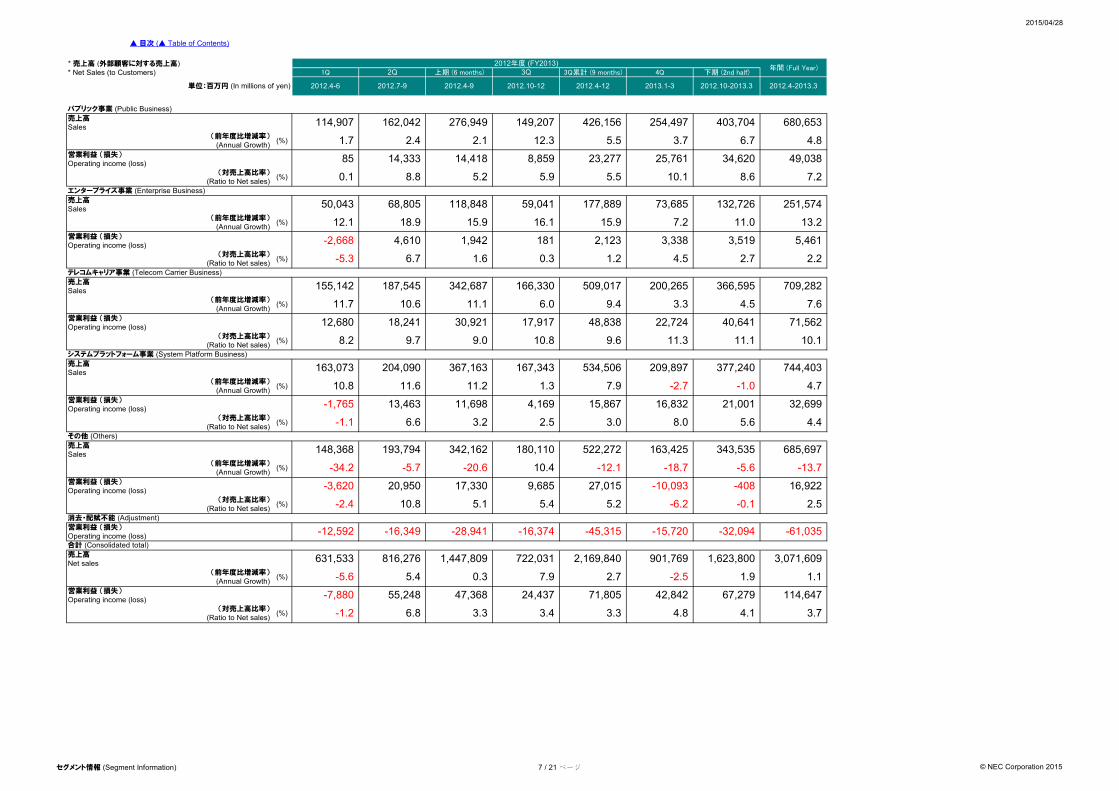
* 売上高 (外部顧客に対する売上高)* Net Sales (to Customers)
売上高Sales
営業利益 (損失)Operating income (loss)
売上高Sales
営業利益 (損失)Operating income (loss)
売上高Sales
営業利益 (損失)Operating income (loss)
売上高Sales
営業利益 (損失)Operating income (loss)
売上高Sales
営業利益 (損失)Operating income (loss)
営業利益 (損失)Operating income (loss)
売上高Net sales
営業利益 (損失)Operating income (loss)
▲ 目次 (▲ Table of Contents)
単位:百万円 (In millions of yen)
パブリック事業 (Public Business)
(前年度比増減率) (%)(Annual Growth)
(対売上高比率) (%)
エンタープライズ事業 (Enterprise Business)(Ratio to Net sales)
(前年度比増減率) (%)(Annual Growth)
(Ratio to Net sales)テレコムキャリア事業 (Telecom Carrier Business)
(対売上高比率) (%)
(前年度比増減率) (%)(Annual Growth)
(Ratio to Net sales)システムプラットフォーム事業 (System Platform Business)
(対売上高比率) (%)
(前年度比増減率) (%)(Annual Growth)
(Ratio to Net sales)その他 (Others)
(対売上高比率) (%)
(前年度比増減率) (%)(Annual Growth)
(Ratio to Net sales)消去・配賦不能 (Adjustment)
(対売上高比率) (%)
合計 (Consolidated total)
(前年度比増減率) (%)(Annual Growth)
(対売上高比率) (%)(Ratio to Net sales)
1Q 2Q 上期 (6 months) 3Q 下期 (2nd half)2012年度 (FY2013)
年間 (Full Year)
2012.7-9
4Q
2013.1-3 2012.10-2013.3
3Q累計 (9 months)
2012.4-6 2012.10-12 2012.4-122012.4-9 2012.4-2013.3
162,042 149,207 426,156 254,497114,907 276,949 403,704 680,653
2.1 12.31.7 2.4 5.5 3.7 6.7 4.8
85 14,333 14,418 8,859 23,277
0.1
25,761 34,620 49,038
5.2 8.6 7.210.18.8 5.55.9
177,889 73,685 132,726 251,574
15.9 16.1
50,043 68,805 118,848 59,041
15.9 7.2 11.0 13.2
3,519 5,461
12.1 18.9
1,942 181 2,123 3,338-2,668 4,610
1.2 4.5 2.7 2.2-5.3 6.7 1.6 0.3
509,017 200,265 366,595 709,282
11.1 6.0
187,545 342,687 166,330
11.7 10.6
155,142
9.4 3.3 4.5 7.6
48,838 22,724 40,641 71,56230,921 17,91712,680 18,241
9.6 11.3 11.1 10.18.2 9.7 9.0 10.8
534,506 209,897 377,240 744,403
11.2 1.3
204,090 367,163 167,343
10.8 11.6
163,073
7.9 -2.7 -1.0 4.7
15,867 16,832 21,001 32,69911,698 4,169-1,765 13,463
3.0 8.0 5.6 4.4-1.1 6.6 3.2 2.5
522,272 163,425 343,535 685,697
-20.6 10.4
193,794 342,162 180,110
-34.2 -5.7
148,368
-12.1 -18.7 -5.6 -13.7
27,015 -10,093 -408 16,92217,330 9,685-3,620 20,950
5.1 5.4-2.4 10.8 5.2 -6.2 -0.1 2.5
-45,315 -15,720 -32,094 -61,035 -16,374 -12,592 -16,349 -28,941
816,276 1,623,800
-5.6 5.4 0.3
722,031 2,169,840631,533 3,071,609901,7691,447,809
1.1-2.5 1.97.9 2.7
71,805 42,842 67,279 114,647-7,880 55,248 47,368 24,437
-1.2 6.8 3.3 4.83.3 4.1 3.73.4
セグメント情報 (Segment Information) 7 / 21 ページ © NEC Corporation 2015
2015/04/28
* 売上高 (外部顧客に対する売上高)* Net Sales (to Customers)
売上高Sales
営業利益 (損失)Operating income (loss)
売上高Sales
営業利益 (損失)Operating income (loss)
売上高Sales
営業利益 (損失)Operating income (loss)
売上高Sales
営業利益 (損失)Operating income (loss)
売上高Sales
営業利益 (損失)Operating income (loss)
営業利益 (損失)Operating income (loss)
売上高Net sales
営業利益 (損失)Operating income (loss)
▲ 目次 (▲ Table of Contents)
単位:百万円 (In millions of yen)
パブリック事業 (Public Business)
(前年度比増減率) (%)(Annual Growth)
(対売上高比率) (%)
エンタープライズ事業 (Enterprise Business)(Ratio to Net sales)
(前年度比増減率) (%)(Annual Growth)
(Ratio to Net sales)テレコムキャリア事業 (Telecom Carrier Business)
(対売上高比率) (%)
(前年度比増減率) (%)(Annual Growth)
(Ratio to Net sales)システムプラットフォーム事業 (System Platform Business)
(対売上高比率) (%)
(前年度比増減率) (%)(Annual Growth)
(Ratio to Net sales)その他 (Others)
(対売上高比率) (%)
(前年度比増減率) (%)(Annual Growth)
(Ratio to Net sales)消去・配賦不能 (Adjustment)
(対売上高比率) (%)
合計 (Consolidated total)
(前年度比増減率) (%)(Annual Growth)
(対売上高比率) (%)(Ratio to Net sales)
年間 (Full Year)3Q 3Q累計 (9 months)1Q 2Q2013年度 (FY2014)
4Q 下期 (2nd half)上期 (6 months)
2013.4-2014.32013.4-6 2013.7-9 2013.4-9 2013.10-12 2013.4-12 2013.10-2014.32014.1-3
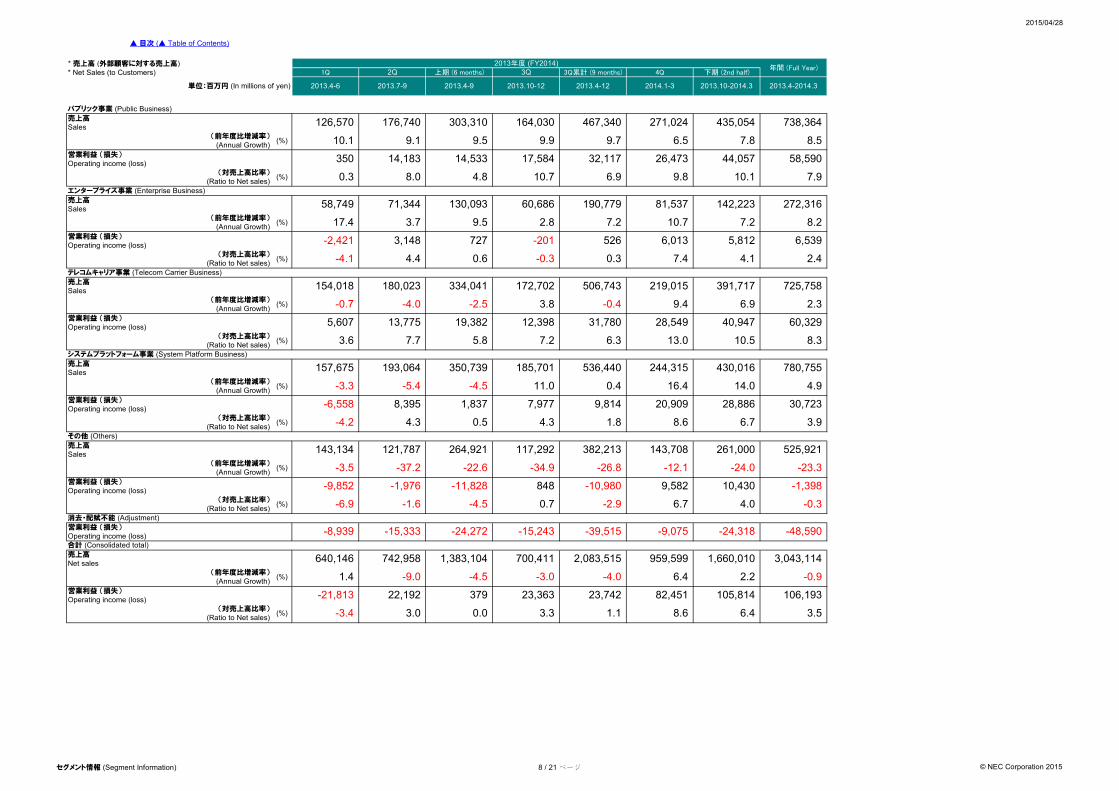
176,740 467,340 271,024126,570 435,054303,310 164,030 738,364
7.8 8.510.1 9.1 9.7 6.59.5 9.9
17,584 32,117 26,473 44,057350 14,183 14,533 58,590
0.3 7.98.0 4.8 10.7 6.9 9.8 10.1
81,537 142,223 272,31658,749 71,344 60,686130,093 190,779
7.2 8.217.4 3.7 9.5 2.8 7.2 10.7
5,812 6,539727 -201 -2,421 3,148 526 6,013
4.1 2.4-4.1 4.4
219,015
0.6 -0.3 0.3 7.4
391,717 725,758154,018 180,023 172,702 506,743334,041
6.9 2.3-0.7 -4.0 -0.4 9.4
31,780 28,549
-2.5 3.8
40,947 60,32919,382 12,3985,607 13,775
10.5 8.33.6 7.7
244,315
5.8 7.2 6.3 13.0
430,016 780,755157,675 193,064 185,701 536,440350,739
14.0 4.9-3.3 -5.4 0.4 16.4
9,814 20,909
-4.5 11.0
28,886 30,7231,837 7,977-6,558 8,395
6.7 3.9-4.2 4.3
143,708
0.5 4.3 1.8 8.6
261,000 525,921143,134 121,787 117,292 382,213264,921
-24.0 -23.3 -3.5 -37.2 -26.8 -12.1
-10,980 9,582
-22.6 -34.9
10,430 -1,398 -11,828 848-9,852 -1,976
4.0 -0.3 -6.9 -1.6 -2.9 6.7-4.5 0.7
-48,590 -8,939 -15,333 -39,515 -9,075 -15,243 -24,318 -24,272
2,083,515 959,599 1,660,010 3,043,114700,411742,958 1,383,104640,146
1.4 -0.9 -9.0 -4.5 -3.0 -4.0 6.4 2.2
105,814 106,193379 23,363 23,742 82,451-21,813 22,192
1.13.3 8.6 6.4 3.5-3.4 3.0 0.0
セグメント情報 (Segment Information) 8 / 21 ページ © NEC Corporation 2015
2015/04/28
* 売上高 (外部顧客に対する売上高)* Net Sales (to Customers)
売上高Sales
営業利益 (損失)Operating income (loss)
売上高Sales
営業利益 (損失)Operating income (loss)
売上高Sales
営業利益 (損失)Operating income (loss)
売上高Sales
営業利益 (損失)Operating income (loss)
売上高Sales
営業利益 (損失)Operating income (loss)
営業利益 (損失)Operating income (loss)
売上高Net sales
営業利益 (損失)Operating income (loss)
▲ 目次 (▲ Table of Contents)
単位:百万円 (In millions of yen)
パブリック事業 (Public Business)
(前年度比増減率) (%)(Annual Growth)
(対売上高比率) (%)
エンタープライズ事業 (Enterprise Business)(Ratio to Net sales)
(前年度比増減率) (%)(Annual Growth)
(Ratio to Net sales)テレコムキャリア事業 (Telecom Carrier Business)
(対売上高比率) (%)
(前年度比増減率) (%)(Annual Growth)
(Ratio to Net sales)システムプラットフォーム事業 (System Platform Business)
(対売上高比率) (%)
(前年度比増減率) (%)(Annual Growth)
(Ratio to Net sales)その他 (Others)
(対売上高比率) (%)
(前年度比増減率) (%)(Annual Growth)
(Ratio to Net sales)消去・配賦不能 (Adjustment)
(対売上高比率) (%)
合計 (Consolidated total)
(前年度比増減率) (%)(Annual Growth)
(対売上高比率) (%)(Ratio to Net sales)
2014年度 (FY2015)年間 (Full Year)
1Q 2Q 上期 (6 months) 3Q 3Q累計 (9 months) 4Q 下期 (2nd half)
2014.4-6 2014.7-9 2014.4-9 2014.10-12 2014.4-12 2015.1-3 2014.10-2015.3 2014.4-2015.3
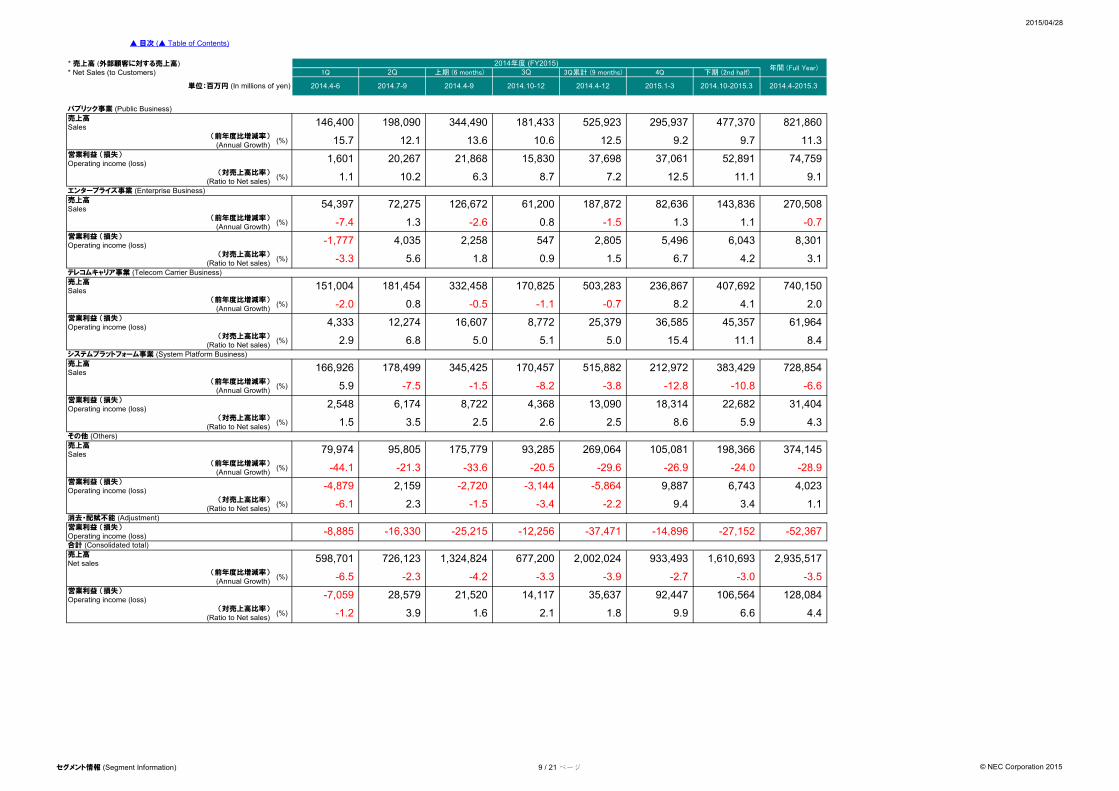
146,400 198,090 344,490 181,433 525,923 295,937 477,370 821,860
15.7 12.1 13.6 10.6 12.5 9.2 9.7 11.3
1,601 20,267 21,868 15,830 37,698 37,061 52,891 74,759
1.1 10.2 6.3 8.7 7.2 12.5 11.1 9.1
54,397 72,275 126,672 61,200 187,872 82,636 143,836 270,508
-7.4 1.3 -2.6 0.8 -1.5 1.3 1.1 -0.7
-1,777 4,035 2,258 547 2,805 5,496 6,043 8,301
-3.3 5.6 1.8 0.9 1.5 6.7 4.2 3.1
151,004 181,454 332,458 170,825 503,283 236,867 407,692 740,150
-2.0 0.8 -0.5 -1.1 -0.7 8.2 4.1 2.0
4,333 12,274 16,607 8,772 25,379 36,585 45,357 61,964
2.9 6.8 5.0 5.1 5.0 15.4 11.1 8.4
166,926 178,499 345,425 170,457 515,882 212,972 383,429 728,854
5.9 -7.5 -1.5 -8.2 -3.8 -12.8 -10.8 -6.6
2,548 6,174 8,722 4,368 13,090 18,314 22,682 31,404
1.5 3.5 2.5 2.6 2.5 8.6 5.9 4.3
79,974 95,805 175,779 93,285 269,064 105,081 198,366 374,145
-44.1 -21.3 -33.6 -20.5 -29.6 -26.9 -24.0 -28.9
-4,879 2,159 -2,720 -3,144 -5,864 9,887 6,743 4,023
-6.1 2.3 -1.5 -3.4 -2.2 9.4 3.4 1.1
-8,885 -16,330 -25,215 -12,256 -37,471 -14,896 -27,152 -52,367
598,701 726,123 1,324,824 677,200 2,002,024 933,493 1,610,693 2,935,517
-6.5 -2.3 -4.2 -3.3 -3.9 -2.7 -3.0 -3.5
-7,059 28,579 21,520 14,117 35,637 92,447 106,564 128,084
6.6 4.4-1.2 3.9 1.6 2.1 1.8 9.9
セグメント情報 (Segment Information) 9 / 21 ページ © NEC Corporation 2015
2015/04/28
* 売上高 (外部顧客に対する売上高)* Net Sales (to Customers)
売上高Sales
営業利益 (損失)Operating income (loss)
売上高Sales
営業利益 (損失)Operating income (loss)
売上高Sales
営業利益 (損失)Operating income (loss)
売上高Sales
営業利益 (損失)Operating income (loss)
売上高Sales
営業利益 (損失)Operating income (loss)
営業利益 (損失)Operating income (loss)
売上高Net sales
営業利益 (損失)Operating income (loss)
▲ 目次 (▲ Table of Contents)
単位:百万円 (In millions of yen)
パブリック事業 (Public Business)
(前年度比増減率) (%)(Annual Growth)
(対売上高比率) (%)
エンタープライズ事業 (Enterprise Business)(Ratio to Net sales)
(前年度比増減率) (%)(Annual Growth)
(Ratio to Net sales)テレコムキャリア事業 (Telecom Carrier Business)
(対売上高比率) (%)
(前年度比増減率) (%)(Annual Growth)
(Ratio to Net sales)システムプラットフォーム事業 (System Platform Business)
(対売上高比率) (%)
(前年度比増減率) (%)(Annual Growth)
(Ratio to Net sales)その他 (Others)
(対売上高比率) (%)
(前年度比増減率) (%)(Annual Growth)
(Ratio to Net sales)消去・配賦不能 (Adjustment)
(対売上高比率) (%)
合計 (Consolidated total)
(前年度比増減率) (%)(Annual Growth)
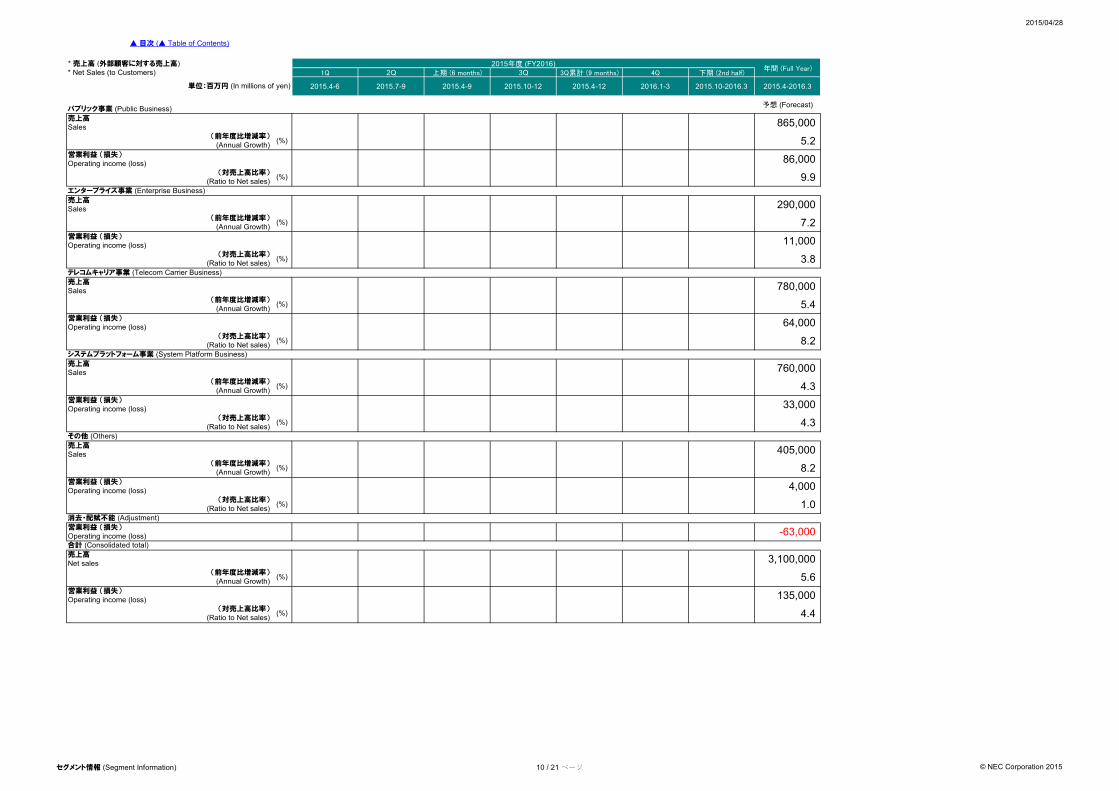
(対売上高比率) (%)(Ratio to Net sales) 4.4
5.6
135,000
-63,000
3,100,000
4,000
1.0
405,000
8.2
33,000
4.3
760,000
4.3
64,000
8.2
780,000
5.4
11,000
3.8
290,000
7.2
86,000
9.9
865,000
5.2
2015.10-2016.3 2015.4-2016.3
予想 (Forecast)
2015.4-6 2015.7-9 2015.4-9 2015.10-12 2015.4-12 2016.1-3
2015年度 (FY2016)年間 (Full Year)
1Q 2Q 上期 (6 months) 3Q 3Q累計 (9 months) 4Q 下期 (2nd half)
セグメント情報 (Segment Information) 10 / 21 ページ © NEC Corporation 2015
2012/04/27
* 売上高 (外部顧客に対する売上高)* Net Sales (to Customers)
売上高Sales
営業利益 (損失)Operating income (loss)
売上高Sales
営業利益 (損失)Operating income (loss)
売上高Sales
営業利益 (損失)Operating income (loss)
売上高Sales
営業利益 (損失)Operating income (loss)
売上高Sales
営業利益 (損失)Operating income (loss)
営業利益 (損失)Operating income (loss)
売上高Net sales
営業利益 (損失)Operating income (loss)
3.4
-1,724 3,893 2,169 2,193
-2.8
-17,511
925,540
-1.9 -0.6
▲ 目次 (▲ Table of Contents)
7.6
-5,852 -32,177 -14,666
3.4
1,646,264 3,115,424
-11,659 -10,580 -28,091 -4,086
5.7 1.7 3.1 2.2 4.9
4,362 4,799
6.7
6,992
374,450
201,667 71,319 142,878 272,986
-1.3 -0.2 0.2 -1.8
-1,630 -4,807 1,266 -3,177
392,062 192,989193,537 198,525 585,051 181,461
8.8
4,466
2.2
10,109444
58,392 79,468 137,860 204,47866,618 114,308
12,195 25,676-5,530 13,032 7,502 4,693
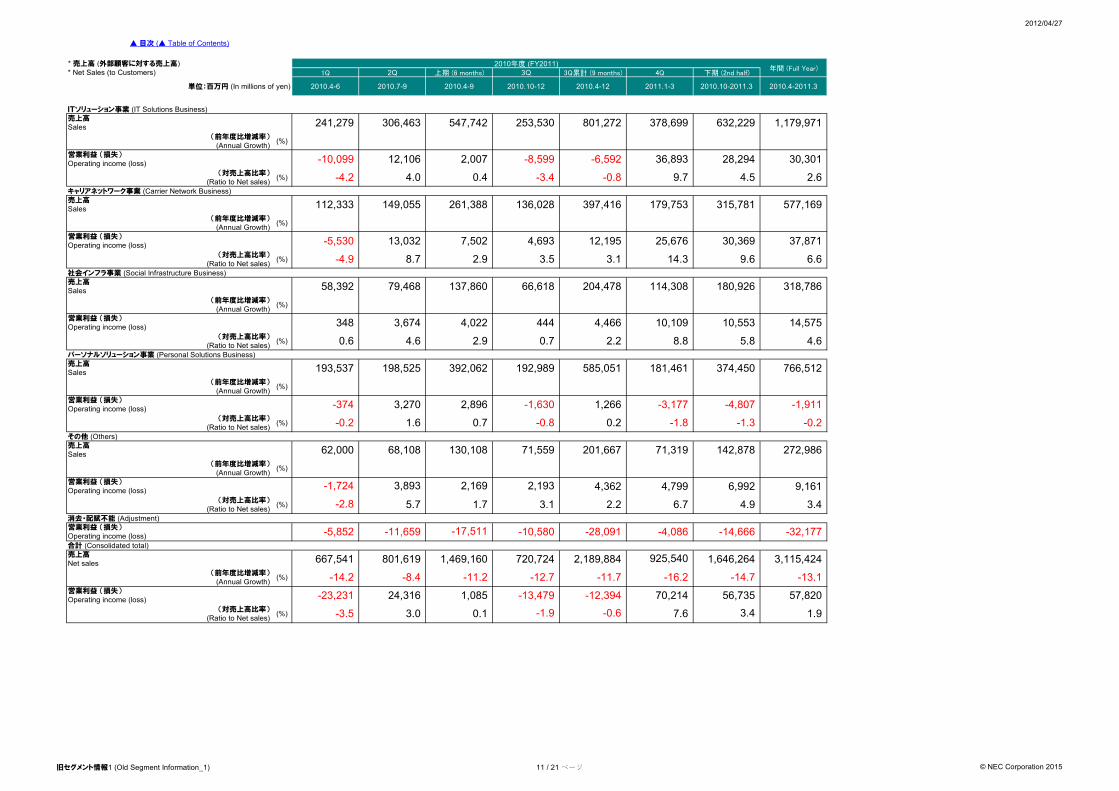
112,333 149,055 261,388
-4.2 -3.4 4.0 0.4
136,028
-8,599 -6,592 36,893
179,753
-0.8
-10,099 12,106 2,007 28,294
306,463 547,742241,279
2010年度 (FY2011)年間 (Full Year)
1Q 2Q 上期 (6 months) 3Q 3Q累計 (9 months) 4Q 下期 (2nd half)
253,530 1,179,971
2010.10-12 2010.4-12 2011.1-3 2010.10-2011.3
378,699801,272 632,229
30,301
30,369 37,871
180,926 318,786
2010.4-2011.3
2.6
766,512
9,161
4.6
14,575
-1,911
-3.5 3.0 0.1
-13.1
1.9
(Annual Growth)
(Ratio to Net sales)消去・配賦不能 (Adjustment)
(対売上高比率) (%)
(前年度比増減率) (%)(Annual Growth)
-0.2 (対売上高比率) 1.6
130,108 71,559
0.7 -0.8
62,000 68,108
(%)(Ratio to Net sales)その他 (Others)
(前年度比増減率) (%)
-374 3,270 2,896(Annual Growth)
パーソナルソリューション事業 (Personal Solutions Business)
(対売上高比率) (%) 5.8(Ratio to Net sales) 0.6 4.6 2.9
4,022
0.7
(Annual Growth)
348 3,674
(前年度比増減率) (%)
(Ratio to Net sales)社会インフラ事業 (Social Infrastructure Business)
3.1 14.3(対売上高比率) (%) 6.69.6-4.9 8.7 2.9 3.5
(前年度比増減率) (%)
(Annual Growth)
(対売上高比率) (%) 9.7
(Annual Growth)
(Ratio to Net sales)キャリアネットワーク事業 (Carrier Network Business)
315,781397,416
(前年度比増減率) (%)
単位:百万円 (In millions of yen)
ITソリューション事業 (IT Solutions Business)
2010.4-6 2010.7-9 2010.4-9
4.5
577,169
10,553
合計 (Consolidated total)
667,541 801,619 1,469,160 720,724 2,189,884
-11.7 (前年度比増減率) (%) -14.2 -8.4 -11.2 -12.7 -16.2 -14.7
-23,231 24,316 1,085 -13,479 -12,394 70,214 56,735 57,820(対売上高比率) (%)(Ratio to Net sales)
旧セグメント情報1 (Old Segment Information_1) 11 / 21 ページ © NEC Corporation 2015
2012/04/27
* 売上高 (外部顧客に対する売上高)* Net Sales (to Customers)
売上高Sales
営業利益 (損失)Operating income (loss)
売上高Sales
営業利益 (損失)Operating income (loss)
売上高Sales
営業利益 (損失)Operating income (loss)
売上高Sales
営業利益 (損失)Operating income (loss)
売上高Sales
営業利益 (損失)Operating income (loss)
営業利益 (損失)Operating income (loss)
売上高Net sales
営業利益 (損失)Operating income (loss)
▲ 目次 (▲ Table of Contents)
(Annual Growth)
(Ratio to Net sales)消去・配賦不能 (Adjustment)
(対売上高比率) (%)
(前年度比増減率) (%)(Annual Growth)
(対売上高比率) (%)(Ratio to Net sales)その他 (Others)
(前年度比増減率) (%)(Annual Growth)
パーソナルソリューション事業 (Personal Solutions Business)
(対売上高比率) (%)(Ratio to Net sales)
(Annual Growth)(前年度比増減率) (%)
(Ratio to Net sales)社会インフラ事業 (Social Infrastructure Business)
(対売上高比率) (%)
(前年度比増減率) (%)
(Annual Growth)
(対売上高比率) (%)
(Annual Growth)
(Ratio to Net sales)キャリアネットワーク事業 (Carrier Network Business)
(前年度比増減率) (%)
単位:百万円 (In millions of yen)
ITソリューション事業 (IT Solutions Business)
合計 (Consolidated total)
(前年度比増減率) (%)
(対売上高比率) (%)(Ratio to Net sales) -0.1 0.5 -1.2
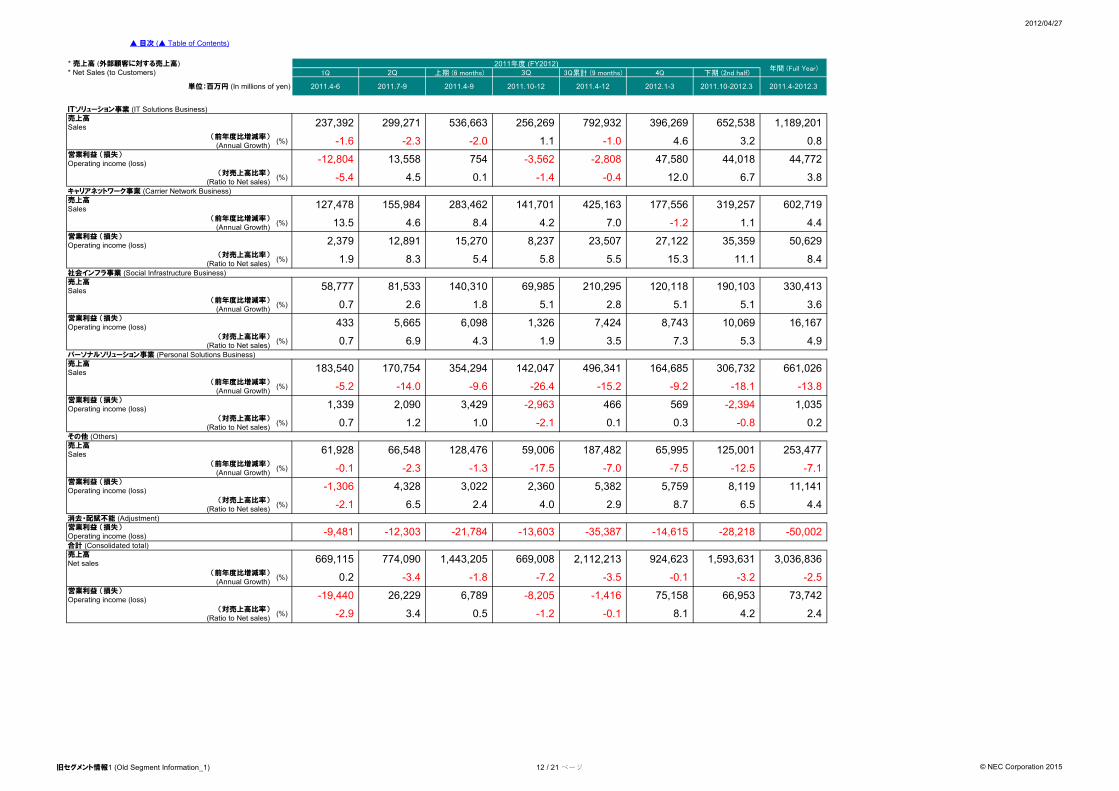
354,294 142,047
8.7
-3.5
187,482 65,995
-21,784 -13,603 -14,615
2.9
5,382
496,341 164,685
-1,306 4,328 2,3603,022
2,090
-0.1
-1.4
3,429
-1.3 -17.5
66,548
183,540 170,754
128,476 59,006
-2,963
5,665
5.8
12,8912,379
433
5.1
58,777 81,533
-2.0 1.1
15,270 8,237
13.5
4.5
127,478
75413,558 -3,562 -2,808
2011.4-9
-12,804
2011.4-12
8.4 4.2
-5.4
155,984
-1.6 -2.3
35,359
-1.2
177,556
5.5 15.3
2012.1-3
23,507 27,122
7.0
306,732
569
5,759
0.3
7.3
-12.5
3Q累計 (9 months) 4Q 下期 (2nd half)
466
5.3
2011年度 (FY2012)1Q 2Q 上期 (6 months) 3Q 年間 (Full Year)
50,629
0.2
2.4
661,026
4.4
8.4
-50,002
4.9
253,477
652,538
3.2
6.7
11.1
0.8
44,018
0.2
-2.9 4.28.13.4
-9,481 -12,303 -35,387 -28,218
1,593,631 3,036,836
-2.1 6.5 2.4 4.0
8,119 11,141
6.5 4.4
-2.3
61,928
-7.1 -7.0 -7.5
0.7 1.2 1.0 0.1 -0.8
125,001
-2.1
-14.0
1,339 1,035
-9.6 -26.4 -15.2 -9.2 -5.2 -18.1 -13.8
-2,394
3.50.7 6.9 4.3 1.9
7,424
5.1 3.6
1,326 10,069 16,1678,743
2.8 5.10.7 2.6
210,295 120,118 190,103140,310 69,985 330,413
1.9 8.3 5.4
1.14.6
3.8
319,257 602,719
-0.4 12.0
425,163283,462 141,701
0.1
44,77247,580
-1.0 4.6
1,189,201237,392 299,271 536,663 256,269 792,932 396,269
2011.4-2012.32011.10-2012.32011.7-92011.4-6 2011.10-12
669,115 774,090
1.8
6,098
1,443,205 669,008 2,112,213 924,623
-3.4 -1.8 -7.2 -0.1 -3.2 -2.5
-1,416 -19,440 26,229 6,789 -8,205 75,158 66,953 73,742
旧セグメント情報1 (Old Segment Information_1) 12 / 21 ページ © NEC Corporation 2015
2012/04/27
* 売上高 (外部顧客に対する売上高)* Net Sales (to Customers)
売上高Sales
営業利益 (損失)Operating income (loss)
売上高Sales
営業利益 (損失)Operating income (loss)
売上高Sales
営業利益 (損失)Operating income (loss)
売上高Sales
営業利益 (損失)Operating income (loss)
売上高Sales
営業利益 (損失)Operating income (loss)
営業利益 (損失)Operating income (loss)
売上高Net sales
営業利益 (損失)Operating income (loss)
▲ 目次 (▲ Table of Contents)
(Annual Growth)
(Ratio to Net sales)消去・配賦不能 (Adjustment)
(対売上高比率) (%)
(前年度比増減率) (%)(Annual Growth)
(対売上高比率) (%)(Ratio to Net sales)その他 (Others)
(前年度比増減率) (%)(Annual Growth)
パーソナルソリューション事業 (Personal Solutions Business)
(対売上高比率) (%)(Ratio to Net sales)
(Annual Growth)(前年度比増減率) (%)
(Ratio to Net sales)社会インフラ事業 (Social Infrastructure Business)
(対売上高比率) (%)
(前年度比増減率) (%)
(Annual Growth)
(対売上高比率) (%)
(Annual Growth)
(Ratio to Net sales)キャリアネットワーク事業 (Carrier Network Business)
(前年度比増減率) (%)
単位:百万円 (In millions of yen)
ITソリューション事業 (IT Solutions Business)
合計 (Consolidated total)
(前年度比増減率) (%)
(対売上高比率) (%)(Ratio to Net sales) -1.2 3.76.8 -43.0 3.3 3.4 3.3
-2.5 1.9
24,437 71,805
4.1
7.9 2.7
-61,034 -39,769 -21,265 -10,336 -15,038
-2.8 22.5
-14,395 -24,731 -36,303
9.0 10.311.5 8.1 10.4 -14.9
-1,400
-26.6 -17.1 -14.5
4,902 9,344 22,316
0.4 3.5 1.4
113,037 55,142
14,372 12,972
-10.3
4,442 17,414
168,179
-12.0 -6.5 -4.2 -20.4
-3,690
-0.6
4,150 5,189
-2.2 2.4
48,441
-1,869.9
103,583
-1.7
49,297 63,740
-4,882
216,620
-6.5 -10.9 5.3-27.8 -0.4 -8.9 -16.8
-10,071 6,381
-14.6
-2,958 1,192
286,664 589,149132,490 169,995 302,485 149,587 452,072 137,077
2.4
1,395
8.2 5.7 7.1 7.56.2 57.1 8.5
1.1
8,1596,764 14,073 13,737
12.719.6 7.3 22.1 21.2
5,914 27,81019,651
0.8 1.4
146,67983,73759,244 82,663
8.6 10.8
26,957
372,323
10.8 9.7
230,416141,907
63,12943,487 19,642
225,644
15,745
-27.6
10.1 7.7
7.9
10.9
9.2
9.4
16,530
9.4
9.3 3.1 5.1 7.5
36,17211,212
-2.3 3.9
335,642 647,690464,693 182,997312,048 152,645141,330
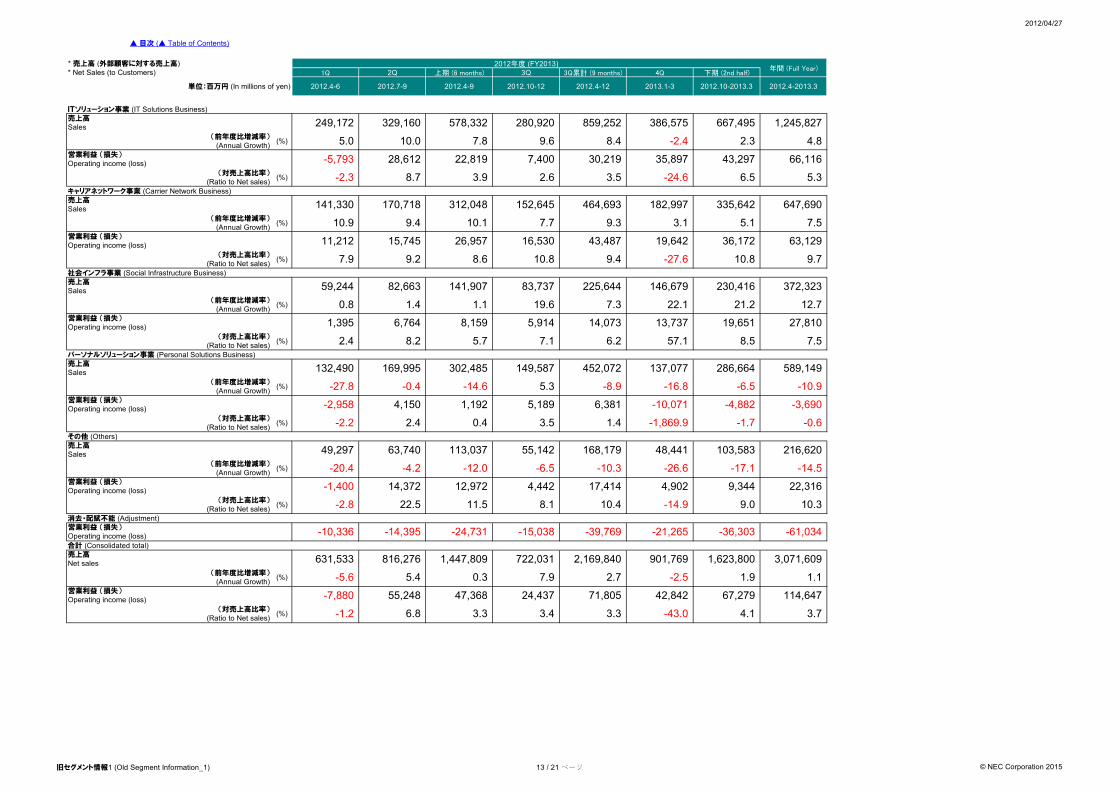
-5,793 28,612 22,819
8.7
170,718
66,116
3.5 -24.6
43,29730,219 35,897
6.5 5.32.6
7.8 9.6
386,575280,920 859,252
4.8
667,495
-2.4 2.38.45.0 10.0
7,400
329,160 578,332249,172
2012.4-2013.3
1,245,827
2012.4-6 2012.7-9 2012.4-9 2012.10-12 2012.10-2013.32012.4-12 2013.1-3
3Q累計 (9 months) 4Q年間 (Full Year)
1Q 2Q 上期 (6 months) 3Q 下期 (2nd half)2012年度 (FY2013)
816,276 1,447,809 722,031 901,769 1,623,800 3,071,6092,169,840631,533
-5.6 5.4 0.3 1.1
114,64755,248 42,842 67,27947,368-7,880
旧セグメント情報1 (Old Segment Information_1) 13 / 21 ページ © NEC Corporation 2015
2010/07/06
* 売上高 (外部顧客に対する売上高)* Net Sales (to Customers)
売上高
Sales
営業利益 (損失)
Operating income (loss)
売上高
Sales
営業利益 (損失)
Operating income (loss)
売上高
Sales
営業利益 (損失)
Operating income (loss)
売上高
Sales
営業利益 (損失)
Operating income (loss)
売上高
Sales
営業利益 (損失)
Operating income (loss)
売上高
Sales
営業利益 (損失)
Operating income (loss)
営業利益 (損失)
Operating income (loss)
売上高
Net sales
営業利益 (損失)
Operating income (loss)
▲ 目次 (▲ Table of Contents)
(対売上高比率) (%) -0.7 0.7(Ratio to Net sales)
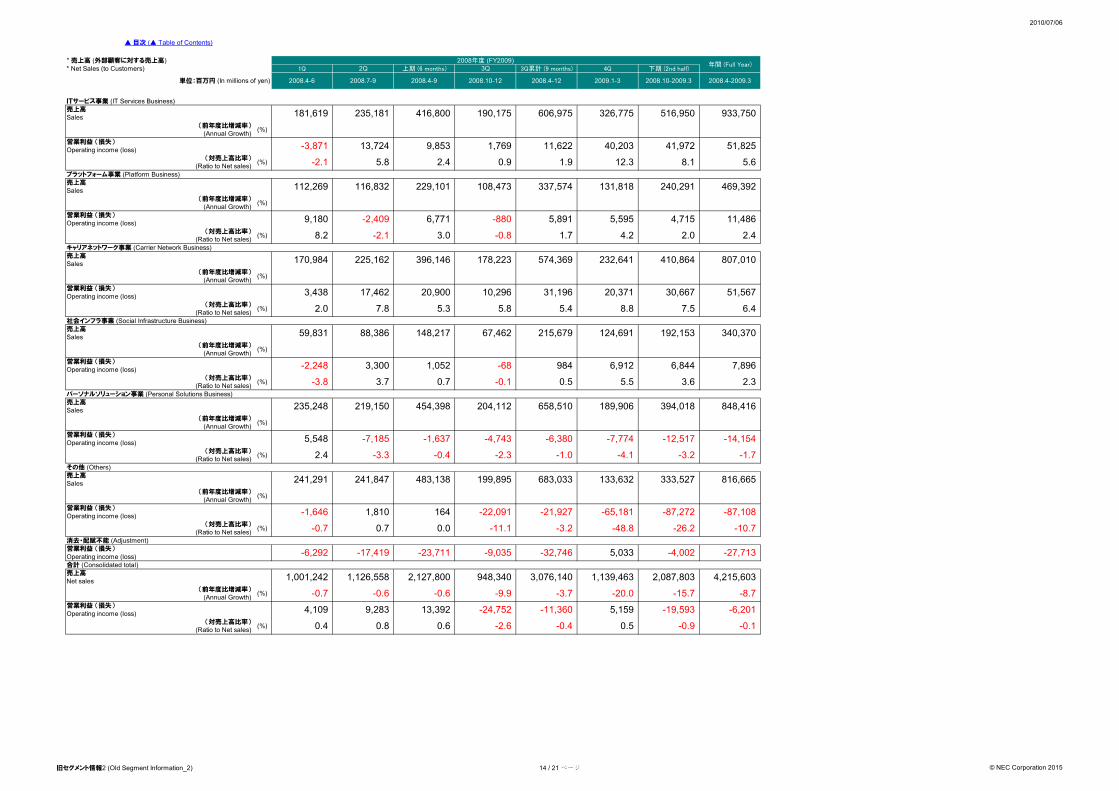
-1,646
その他 (Others)
241,291(前年度比増減率)
-26.2 -10.7 0.0 -11.1 -3.2 -48.8
-21,927 -22,091 -65,181 -87,272 -87,108
816,665
0.5 -0.9 0.4 0.8 0.6 -0.1 -2.6 -0.4
-20.0 -15.7
4,215,603
-3.7 -8.7
消去・配賦不能 (Adjustment)
-6,292 -17,419 -32,746 5,033 -4,002 -27,713
(%)(Annual Growth)
241,847
-23,711 -9,035
199,895
1,810 164
483,138 683,033 133,632 333,527
-1.7 -0.4 -2.3
-6,380 (対売上高比率) (%) 2.4 -3.3 (Ratio to Net sales)
-12,517
-1.0 -4.1 -3.2
-7,774 5,548 -7,185 -1,637 -4,743 -14,154 (Annual Growth)
(前年度比増減率) (%)
658,510 189,906 394,018 848,416
(Ratio to Net sales)パーソナルソリューション事業 (Personal Solutions Business)
235,248 219,150 454,398 204,112
3.60.5 2.35.5(対売上高比率) (%) -3.8 3.7 0.7 -0.1
6,844 7,896-2,248 3,300 1,052 -68 984 6,912
(前年度比増減率) (%)(Annual Growth)
社会インフラ事業 (Social Infrastructure Business)
59,831 88,386 192,153 340,370148,217 67,462 215,679 124,691
7.5 6.45.3 5.8 5.4 8.8(対売上高比率) (%) 2.0 7.8(Ratio to Net sales)
3,438 17,462 20,900 10,296 31,196 20,371 30,667 51,567
(前年度比増減率) (%)(Annual Growth)
キャリアネットワーク事業 (Carrier Network Business)
170,984 225,162 396,146 178,223 574,369 410,864
4.2 2.0
807,010232,641
(対売上高比率) (%) 8.2 -2.1 3.0 -0.8 (Ratio to Net sales) 1.7 2.4
5,595 4,715 11,4869,180 -2,409 6,771 -880 5,891
(前年度比増減率) (%)(Annual Growth)
プラットフォーム事業 (Platform Business)
112,269 116,832 240,291 469,392229,101 108,473 337,574 131,818
5.62.4 0.9 1.9 12.3 8.1(対売上高比率) (%) -2.1 5.8(Ratio to Net sales)
40,203 41,972 51,82511,622-3,871 13,724 9,853 1,769
(前年度比増減率) (%)(Annual Growth)
606,975 326,775ITサービス事業 (IT Services Business)
181,619 235,181 416,800 190,175 516,950 933,750
2008.4-2009.32009.1-3 2008.10-2009.32008.7-9 2008.4-9 2008.10-12 2008.4-12
1Q 2Q 上期 (6 months) 3Q 3Q累計 (9 months) 4Q 下期 (2nd half)
単位:百万円 (In millions of yen)
2008年度 (FY2009)年間 (Full Year)
2008.4-6
合計 (Consolidated total)
1,001,242 1,126,558 2,127,800 948,340 3,076,140 1,139,463 2,087,803(前年度比増減率) (%) -0.7 -0.6 -0.6 -9.9 (Annual Growth)
4,109 9,283 13,392 -24,752 -11,360 5,159 -19,593 -6,201
(Ratio to Net sales)(対売上高比率) (%)
旧セグメント情報2 (Old Segment Information_2) 14 / 21 ページ © NEC Corporation 2015
2010/07/06
* 売上高 (外部顧客に対する売上高)* Net Sales (to Customers)
売上高
Sales
営業利益 (損失)
Operating income (loss)
売上高
Sales
営業利益 (損失)
Operating income (loss)
売上高
Sales
営業利益 (損失)
Operating income (loss)
売上高
Sales
営業利益 (損失)
Operating income (loss)
売上高
Sales
営業利益 (損失)
Operating income (loss)
売上高
Sales
営業利益 (損失)
Operating income (loss)
営業利益 (損失)
Operating income (loss)
売上高
Net sales
営業利益 (損失)
Operating income (loss)
▲ 目次 (▲ Table of Contents)
(対売上高比率) (%)(Ratio to Net sales)
その他 (Others)
(前年度比増減率)
消去・配賦不能 (Adjustment)
(%)(Annual Growth)
(対売上高比率) (%)(Ratio to Net sales)
(Annual Growth)(前年度比増減率) (%)
(Ratio to Net sales)パーソナルソリューション事業 (Personal Solutions Business)
(対売上高比率) (%)
(前年度比増減率) (%)(Annual Growth)
社会インフラ事業 (Social Infrastructure Business)
(対売上高比率) (%)(Ratio to Net sales)
(前年度比増減率) (%)(Annual Growth)
キャリアネットワーク事業 (Carrier Network Business)
(対売上高比率) (%)(Ratio to Net sales)
(前年度比増減率) (%)(Annual Growth)
プラットフォーム事業 (Platform Business)
(対売上高比率) (%)(Ratio to Net sales)
(前年度比増減率) (%)(Annual Growth)
ITサービス事業 (IT Services Business)
単位:百万円 (In millions of yen)
合計 (Consolidated total)
(前年度比増減率) (%)(Annual Growth)
(Ratio to Net sales)(対売上高比率) (%)
-17.2 -9.5 0.2-12.1 -7.8 -4.6 -2.1 -6.8
-7,347 -44,929 -7,707 -24,660 -37,582 -12,922
143,098 309,573 166,549
-30.3 -40.7 -31.2 -35.9
166,475 185,245 351,794 661,367
38.6 5.5 -19.0
360-45,289
-16.7
476,122
1.4-0.9 -5.1 0.3 8.7 4.6
778,465
-7.6 -15.0
1,104,096 1,929,455 3,583,148875,228 1,653,693 825,359 2,479,052
-8,048 -27,546 -10,053 -28,472 926-19,498 -8,974 -9,445
2.62.8
8,926 -724
-0.4 2.2 3.64.6 2.3 2.0
8,202 11,648 7,204 10,650 18,852
-20.3 -13.4 -18.1
3,446
-17.1 -23.6 4.6 -4.7 -13.0
539,039 198,706 375,412 737,745194,939 176,706167,394 362,333
4.7 2.1 6.9-1.2 15.1 10.20.9 1.7
18,449 19,005-684 556 3,262 21,7113,390 2,706
-12.5 -4.1 -9.9 -2.0 -4.3 -18.1 -2.7 -7.0
194,384 122,182 186,889 316,566129,67757,246 72,431
4.0 1.4
64,707
5.05.9
11,823
0.4 7.1 3.2 9.6
18,970 31,34212,372 2,034 14,406 16,936549
-25.9 -22.1 -24.4 -22.4 -22.3 -19.8 -21.4 -17.1
142,887 451,462 175,949 318,836 627,411
0.7 -8.1 -0.5
141,666
-19.1 10.0 5.7-0.3 -5.4
308,575166,909
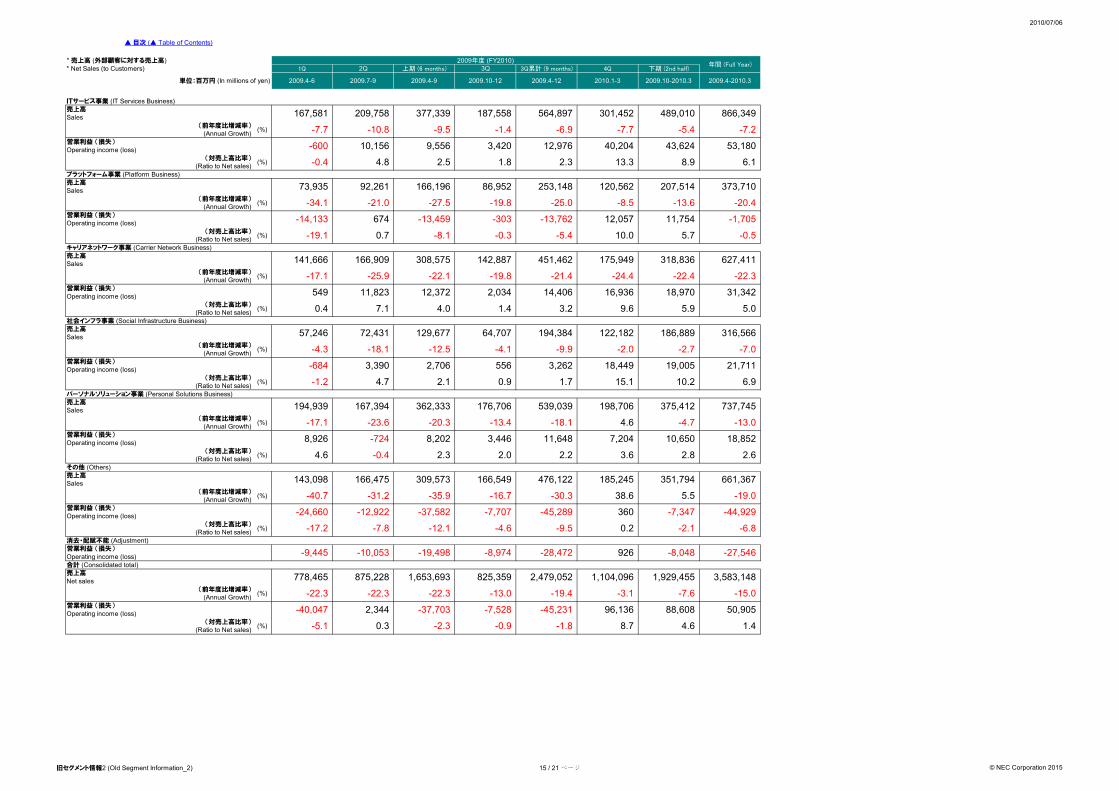
-14,133 -1,705 12,057 11,754-13,459 -303 -13,762
-13.6 -20.4
674
-27.5 -19.8 -25.0 -8.5 -34.1 -21.0
253,148 120,562 207,514 373,710166,19673,935 92,261
1.8 2.3 13.3
86,952
-0.4 4.8 2.5 8.9 6.1
53,180-600 10,156 9,556 40,204
-1.4 -6.9
3,420 12,976 43,624
-7.7 -5.4 -7.2
377,339 564,897 301,452 489,010 866,349
-9.5 -10.8 -7.7
167,581 209,758 187,558
2009.4-6 2009.10-122009.7-9 2009.4-9 2009.10-2010.32009.4-12 2010.1-3 2009.4-2010.3
年間 (Full Year)1Q 2Q
2009年度 (FY2010)上期 (6 months) 3Q 3Q累計 (9 months) 4Q 下期 (2nd half)
-22.3 -22.3 -22.3 -19.4 -3.1 -13.0
-40,047 2,344 -37,703 -7,528 -45,231 96,136 88,608 50,905
-1.8 -2.3
旧セグメント情報2 (Old Segment Information_2) 15 / 21 ページ © NEC Corporation 2015
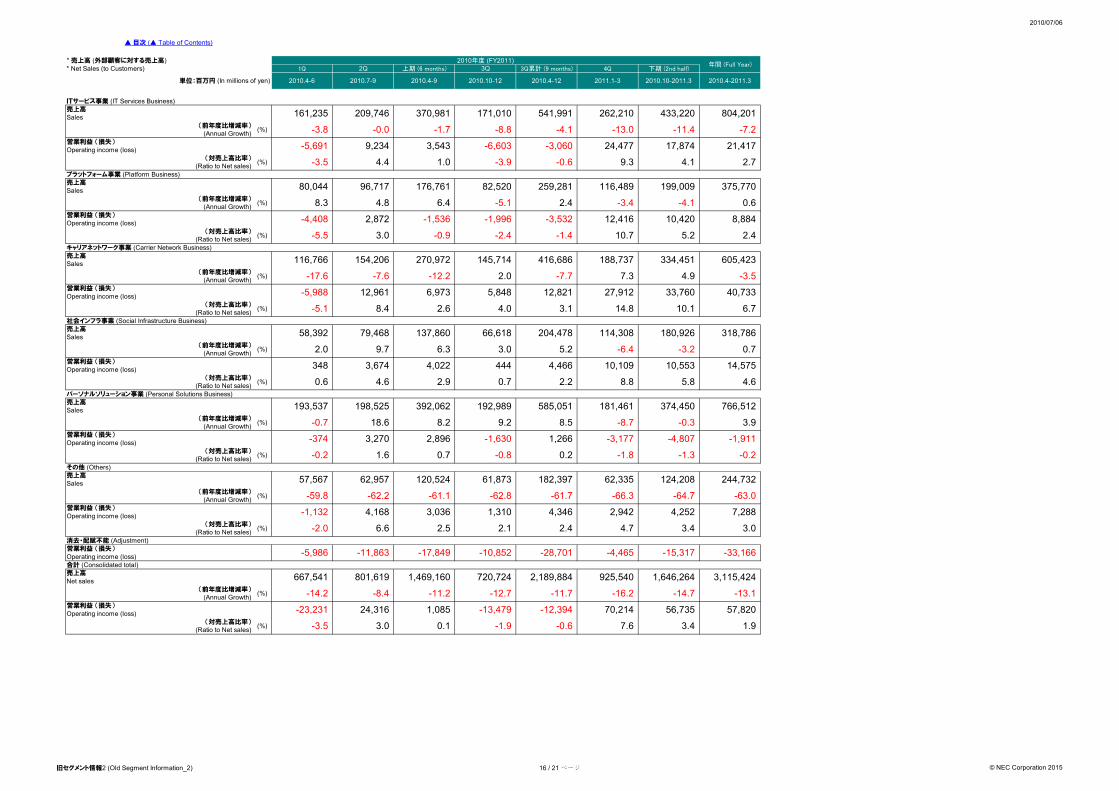
2010/07/06
* 売上高 (外部顧客に対する売上高)* Net Sales (to Customers)
売上高
Sales
営業利益 (損失)
Operating income (loss)
売上高
Sales
営業利益 (損失)
Operating income (loss)
売上高
Sales
営業利益 (損失)
Operating income (loss)
売上高
Sales
営業利益 (損失)
Operating income (loss)
売上高
Sales
営業利益 (損失)
Operating income (loss)
売上高
Sales
営業利益 (損失)
Operating income (loss)
営業利益 (損失)
Operating income (loss)
売上高
Net sales
営業利益 (損失)
Operating income (loss)
▲ 目次 (▲ Table of Contents)
(対売上高比率) (%)(Ratio to Net sales)
その他 (Others)
(前年度比増減率)
消去・配賦不能 (Adjustment)
(%)(Annual Growth)
(対売上高比率) (%)(Ratio to Net sales)
(Annual Growth)(前年度比増減率) (%)
(Ratio to Net sales)パーソナルソリューション事業 (Personal Solutions Business)
(対売上高比率) (%)
(前年度比増減率) (%)(Annual Growth)
社会インフラ事業 (Social Infrastructure Business)
(対売上高比率) (%)(Ratio to Net sales)
(前年度比増減率) (%)(Annual Growth)
キャリアネットワーク事業 (Carrier Network Business)
(対売上高比率) (%)(Ratio to Net sales)
(前年度比増減率) (%)(Annual Growth)
プラットフォーム事業 (Platform Business)
(対売上高比率) (%)(Ratio to Net sales)
(前年度比増減率) (%)(Annual Growth)
ITサービス事業 (IT Services Business)
単位:百万円 (In millions of yen)
合計 (Consolidated total)
(前年度比増減率) (%)(Annual Growth)
(Ratio to Net sales)(対売上高比率) (%)
3.0-2.0 6.6 4.72.5 2.1 2.4
3,036
-61.7 -66.3 -64.7
4,346
3.4
7,288-1,132 4,168 2,942 4,2521,310
62,95757,567
-59.8
1.9-3.5 3.0 0.1 7.6 3.4-1.9 -0.6
720,724801,619 1,469,160
-14.2
667,541
-17,849 -5,986 -11,863 -28,701
182,397
-1.3
-15,317 -4,465
-62.8
-10,852
61,873 124,20862,335
-0.2 0.7 -0.8 0.2 -1.8
-62.2 -61.1
244,732120,524
-63.0
-33,166
-1,911 2,896 -1,630
-0.2 1.6
-3,177 3,270
-8.7 -0.3
1,266-374 -4,807
8.58.2 9.2 3.9-0.7 18.6
585,051198,525 392,062 766,512193,537 192,989
5.8 4.6
181,461 374,450
4.6 2.9 0.7 2.2 8.80.6
348 10,109 10,553 14,575444 4,4663,674 4,022
-3.2 -6.4 0.7
114,308
2.0 9.7 6.3 3.0 5.2
58,392 79,468
8.4 2.6 4.0 3.1 14.8
318,786137,860 66,618 180,926204,478
40,7336,973 5,848
10.1 6.7-5.1
33,76027,912-5,988 12,961 12,821
-12.2 -17.6 -7.6
116,766 154,206
-1.4 10.7 5.2
145,714 416,686
2.4
334,451
3.0 -0.9 -2.4
-3.5 7.3
605,423270,972 188,737
4.92.0 -7.7
8,88412,416 10,420-1,996
-5.5
-4,408 -3,532 2,872 -1,536
0.6-4.1
259,281 116,489
8.3 4.8 6.4 -5.1 2.4 -3.4
199,009 375,77080,044 96,717 176,761 82,520
4.1 2.7-3.5 4.4 1.0 -3.9 -0.6 9.3
21,4173,543 -6,603 -5,691 -3,060 17,874
-8.8 -4.1
24,4779,234
804,201
-7.2 -0.0 -1.7
433,220
-11.4
171,010209,746 262,210
-13.0 -3.8
161,235 541,991370,981
2010.4-2011.32010.10-2011.32010.4-12 2011.1-32010.4-9 2010.10-122010.4-6 2010.7-9
1Q 2Q 上期 (6 months)
2010年度 (FY2011)4Q 下期 (2nd half)3Q 3Q累計 (9 months)
年間 (Full Year)
2,189,884 925,540 1,646,264 3,115,424
-8.4 -11.2 -12.7 -11.7 -16.2 -14.7 -13.1
-23,231 24,316 1,085 -13,479 -12,394 70,214 56,735 57,820
旧セグメント情報2 (Old Segment Information_2) 16 / 21 ページ © NEC Corporation 2015
2010/07/06
* 売上高 (外部顧客に対する売上高)* Net Sales (to Customers)
売上高
Sales
営業利益 (損失)
Operating income (loss)
売上高
Sales
営業利益 (損失)
Operating income (loss)
売上高
Sales
営業利益 (損失)
Operating income (loss)
売上高
Sales
営業利益 (損失)
Operating income (loss)
売上高
Sales
営業利益 (損失)
Operating income (loss)
売上高
Sales
営業利益 (損失)
Operating income (loss)
営業利益 (損失)
Operating income (loss)
売上高
Net sales
営業利益 (損失)
Operating income (loss)
▲ 目次 (▲ Table of Contents)
(対売上高比率) (%)(Ratio to Net sales)
その他 (Others)
(前年度比増減率)
消去・配賦不能 (Adjustment)
(%)(Annual Growth)
(対売上高比率) (%)(Ratio to Net sales)
(Annual Growth)(前年度比増減率) (%)
(Ratio to Net sales)パーソナルソリューション事業 (Personal Solutions Business)
(対売上高比率) (%)
(前年度比増減率) (%)(Annual Growth)
社会インフラ事業 (Social Infrastructure Business)
(対売上高比率) (%)(Ratio to Net sales)
(前年度比増減率) (%)(Annual Growth)
キャリアネットワーク事業 (Carrier Network Business)
(対売上高比率) (%)(Ratio to Net sales)
(前年度比増減率) (%)(Annual Growth)
プラットフォーム事業 (Platform Business)
(対売上高比率) (%)(Ratio to Net sales)
(前年度比増減率) (%)(Annual Growth)
ITサービス事業 (IT Services Business)
単位:百万円 (In millions of yen)
合計 (Consolidated total)
(前年度比増減率) (%)(Annual Growth)
(Ratio to Net sales)(対売上高比率) (%)
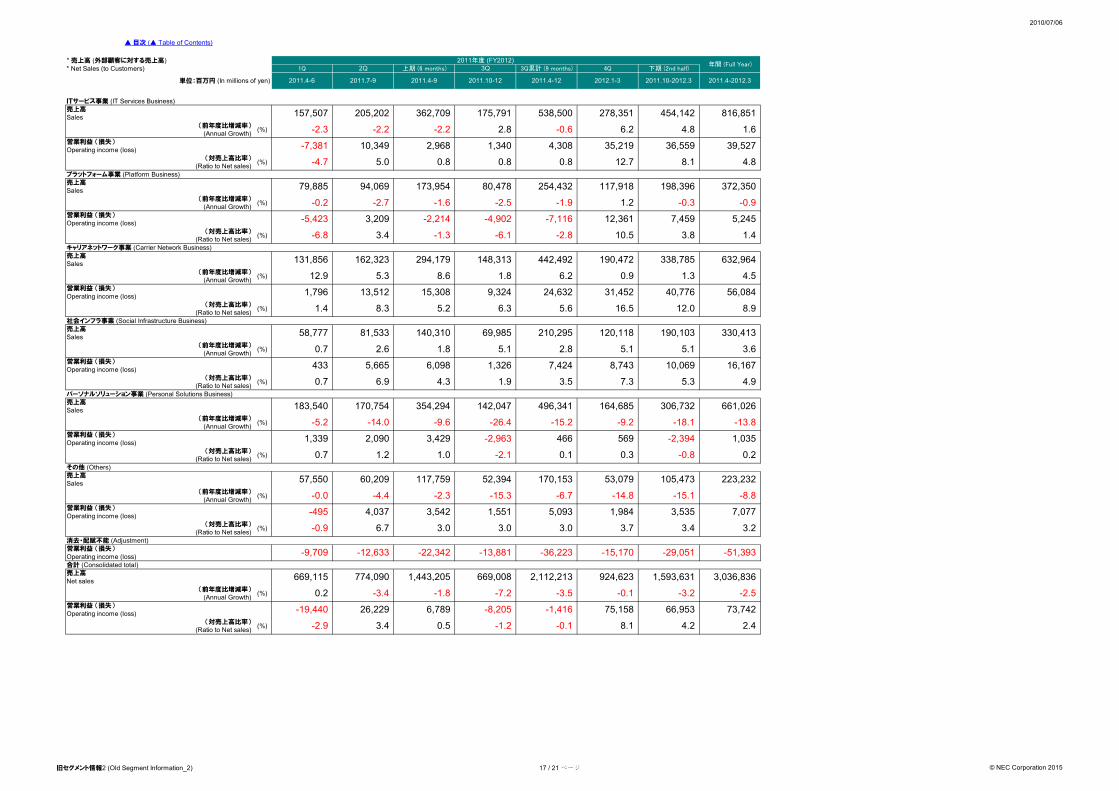
2011年度 (FY2012)年間 (Full Year)
1Q 2Q 上期 (6 months) 3Q 3Q累計 (9 months) 4Q 下期 (2nd half)
2011.4-6 2011.7-9 2011.4-9 2011.10-12 2011.4-12 2012.1-3 2011.10-2012.3 2011.4-2012.3
157,507 205,202 362,709 175,791 538,500 278,351 454,142 816,851
-2.3 -2.2 -2.2 2.8 -0.6 6.2 4.8 1.6
-7,381 10,349 2,968 1,340 4,308 35,219 36,559 39,527
-4.7 5.0 0.8 0.8 0.8 12.7 8.1 4.8
79,885 94,069 173,954 80,478 254,432 117,918 198,396 372,350
-0.2 -2.7 -1.6 -2.5 -1.9 1.2 -0.3 -0.9
-5,423 3,209 -2,214 -4,902 -7,116 12,361 7,459 5,245
-6.8 3.4 -1.3 -6.1 -2.8 10.5 3.8 1.4
131,856 162,323 294,179 148,313 442,492 190,472 338,785 632,964
12.9 5.3 8.6 1.8 6.2 0.9 1.3 4.5
1,796 13,512 15,308 9,324 24,632 31,452 40,776 56,084
1.4 8.3 5.2 6.3 5.6 16.5 12.0 8.9
58,777 81,533 140,310 69,985 210,295 120,118 190,103 330,413
0.7 2.6 1.8 5.1 2.8 5.1 5.1 3.6
433 5,665 6,098 1,326 7,424 8,743 10,069 16,167
0.7 6.9 4.3 1.9 3.5 7.3 5.3 4.9
183,540 170,754 354,294 142,047 496,341 164,685 306,732 661,026
-5.2 -14.0 -9.6 -26.4 -15.2 -9.2 -18.1 -13.8
1,339 2,090 3,429 -2,963 466 569 -2,394 1,035
0.7 1.2 1.0 -2.1 0.1 0.3 -0.8 0.2
57,550 60,209 117,759 52,394 170,153 53,079 105,473 223,232
-0.0 -4.4 -2.3 -15.3 -6.7 -14.8 -15.1 -8.8
-495 4,037 3,542 1,551 5,093 1,984 3,535 7,077
-0.9 6.7 3.0 3.0 3.0 3.7 3.4 3.2
-9,709 -12,633 -22,342 -13,881 -36,223 -15,170 -29,051 -51,393
669,115 774,090 1,443,205 669,008 2,112,213 924,623 1,593,631 3,036,836
0.2 -3.4 -1.8 -7.2 -3.5 -0.1 -3.2 -2.5
73,742-19,440 26,229 6,789 -8,205 -1,416 75,158 66,953
-0.1 8.1 4.2 2.4-2.9 3.4 0.5 -1.2
旧セグメント情報2 (Old Segment Information_2) 17 / 21 ページ © NEC Corporation 2015
2010/7/6
* 売上高 (外部顧客に対する売上高)* Net Sales (to Customers)
売上高Sales
営業利益 (損失)Operating income (loss)
売上高Sales
営業利益 (損失)Operating income (loss)
売上高Sales
営業利益 (損失)Operating income (loss)
売上高Sales
営業利益 (損失)Operating income (loss)
売上高Sales
営業利益 (損失)Operating income (loss)
売上高Sales
営業利益 (損失)Operating income (loss)
売上高Sales
営業利益 (損失)Operating income (loss)
営業利益 (損失)Operating income (loss)
売上高Net sales
営業利益 (損失)Operating income (loss)
2007.4-12 2008.1-3
▲ 目次 (▲ Table of Contents)
単位:百万円 (In millions of yen)
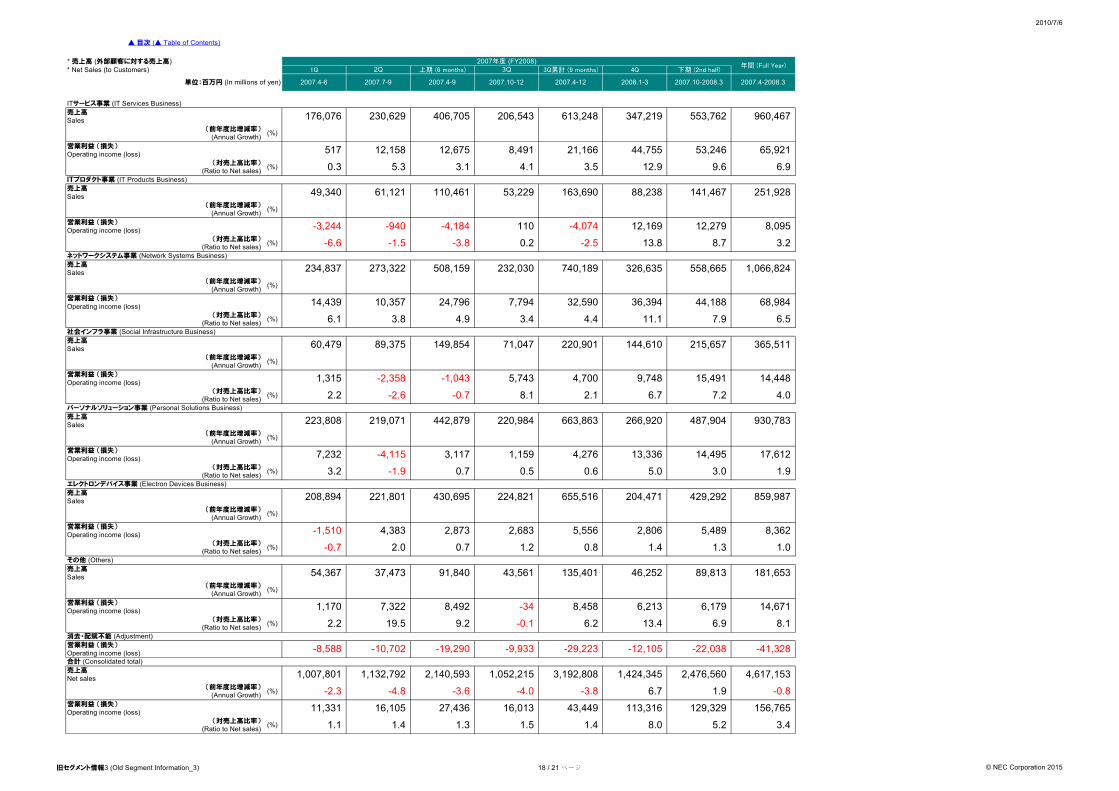
2007年度 (FY2008)年間 (Full Year)
2007.4-6 2007.7-9 2007.4-9
1Q 2Q 上期 (6 months) 3Q 3Q累計 (9 months) 4Q 下期 (2nd half)
2007.10-12 2007.10-2008.3 2007.4-2008.3
ITサービス事業 (IT Services Business)
206,543176,076 230,629 406,705 613,248 347,219 553,762 960,467(前年度比増減率) (%)(Annual Growth)
740,189 326,635
517 12,158 12,675
(対売上高比率)
12,169 12,279 8,095
13.8
266,920 487,904 930,783223,808 219,071 442,879 220,984 663,863
365,511144,61071,04760,479 149,854
(Annual Growth)
14,439
220,901
(対売上高比率)
7,232 -4,115 3,117
5.0
13,336 14,495
429,292
1,159 4,276 17,612
0.6
655,516 204,471224,821430,695 859,987221,801208,894
5,556 2,8064,383 2,873 2,683 5,489
54,367 37,473 91,840 43,561 135,401 46,252
-1,510
1.4 1.31.2 0.8
8,362
89,813
(対売上高比率) (%)
181,653
消去・配賦不能 (Adjustment)
-29,223 -12,105 -22,038 -41,328
9.6 6.9
8,491
3.1 4.1 3.5 12.9
21,166 44,755 53,246 65,921
(前年度比増減率)
0.3 5.3
110,461 53,229 163,690
558,665 1,066,824
88,238 141,467 251,928
215,657
3.2
(対売上高比率) (%)(Ratio to Net sales)ITプロダクト事業 (IT Products Business)
49,340 61,121(前年度比増減率) (%)(Annual Growth)
-3,244 -940 -4,184 110 -4,074 (%) -6.6 -1.5 -3.8 0.2 -2.5 8.7(Ratio to Net sales)
ネットワークシステム事業 (Network Systems Business)
234,837 273,322 508,159 232,030(%)
10,357 24,796 7,794 32,590 36,394 44,188 68,984(対売上高比率) (%) 6.1 3.8 4.9 3.4 4.4 11.1 7.9 6.5(Ratio to Net sales)
社会インフラ事業 (Social Infrastructure Business)
(前年度比増減率) (%)
89,375
(Annual Growth)
1,315 -2,358 -1,043 5,743 4,700 9,748 15,491 14,448(%) 2.2 -2.6 -0.7 8.1 2.1 6.7 7.2 4.0(Ratio to Net sales)
パーソナルソリューション事業 (Personal Solutions Business)
(前年度比増減率) (%)(Annual Growth)
(対売上高比率) (%) 3.2 -1.9 0.7 0.5(Ratio to Net sales) 3.0 1.9エレクトロンデバイス事業 (Electron Devices Business)
(前年度比増減率) (%)(Annual Growth)
(対売上高比率) (%)(Ratio to Net sales) -0.7 2.0 0.7 1.0その他 (Others)
(前年度比増減率) (%)(Annual Growth)
1,170 7,322 8,492 -34 8,458 6,213
-0.1 6.2 13.4
6,179 14,671
(Ratio to Net sales) 6.9 8.12.2 19.5 9.2
合計 (Consolidated total)
1,007,801 1,132,792 2,140,593 1,052,215
-8,588 -10,702 -19,290 -9,933
3,192,808 1,424,345 2,476,560 4,617,153(前年度比増減率) (%) -2.3 -4.8 -3.6 -4.0 -3.8 6.7 1.9 -0.8 (Annual Growth)
11,331 16,105 27,436 16,013 43,449 113,316 129,329 156,765(対売上高比率) (%) 1.1 1.4 1.3 1.5 1.4 8.0 5.2 3.4(Ratio to Net sales)
旧セグメント情報3 (Old Segment Information_3) 18 / 21 ページ © NEC Corporation 2015
2010/7/6
* 売上高 (外部顧客に対する売上高)* Net Sales (to Customers)
売上高Sales
営業利益 (損失)Operating income (loss)
売上高Sales
営業利益 (損失)Operating income (loss)
売上高Sales
営業利益 (損失)Operating income (loss)
売上高Sales
営業利益 (損失)Operating income (loss)
売上高Sales
営業利益 (損失)Operating income (loss)
売上高Sales
営業利益 (損失)Operating income (loss)
売上高Sales
営業利益 (損失)Operating income (loss)
営業利益 (損失)Operating income (loss)
売上高Net sales
営業利益 (損失)Operating income (loss)
▲ 目次 (▲ Table of Contents)
単位:百万円 (In millions of yen)
ITサービス事業 (IT Services Business)
(前年度比増減率) (%)(Annual Growth)
(対売上高比率)
(Annual Growth)
(対売上高比率)
(対売上高比率) (%)
消去・配賦不能 (Adjustment)
(前年度比増減率)
(対売上高比率) (%)(Ratio to Net sales)ITプロダクト事業 (IT Products Business)
(前年度比増減率) (%)(Annual Growth)
(%)(Ratio to Net sales)ネットワークシステム事業 (Network Systems Business)
(%)
(対売上高比率) (%)(Ratio to Net sales)社会インフラ事業 (Social Infrastructure Business)
(前年度比増減率) (%)(Annual Growth)
(%)(Ratio to Net sales)パーソナルソリューション事業 (Personal Solutions Business)
(前年度比増減率) (%)(Annual Growth)
(対売上高比率) (%)(Ratio to Net sales)エレクトロンデバイス事業 (Electron Devices Business)
(前年度比増減率) (%)(Annual Growth)
(対売上高比率) (%)(Ratio to Net sales)その他 (Others)
(前年度比増減率) (%)(Annual Growth)
(Ratio to Net sales)
合計 (Consolidated total)
(前年度比増減率) (%)(Annual Growth)
(対売上高比率) (%)(Ratio to Net sales)
3Q 年間 (Full Year)2Q 上期 (6 months)
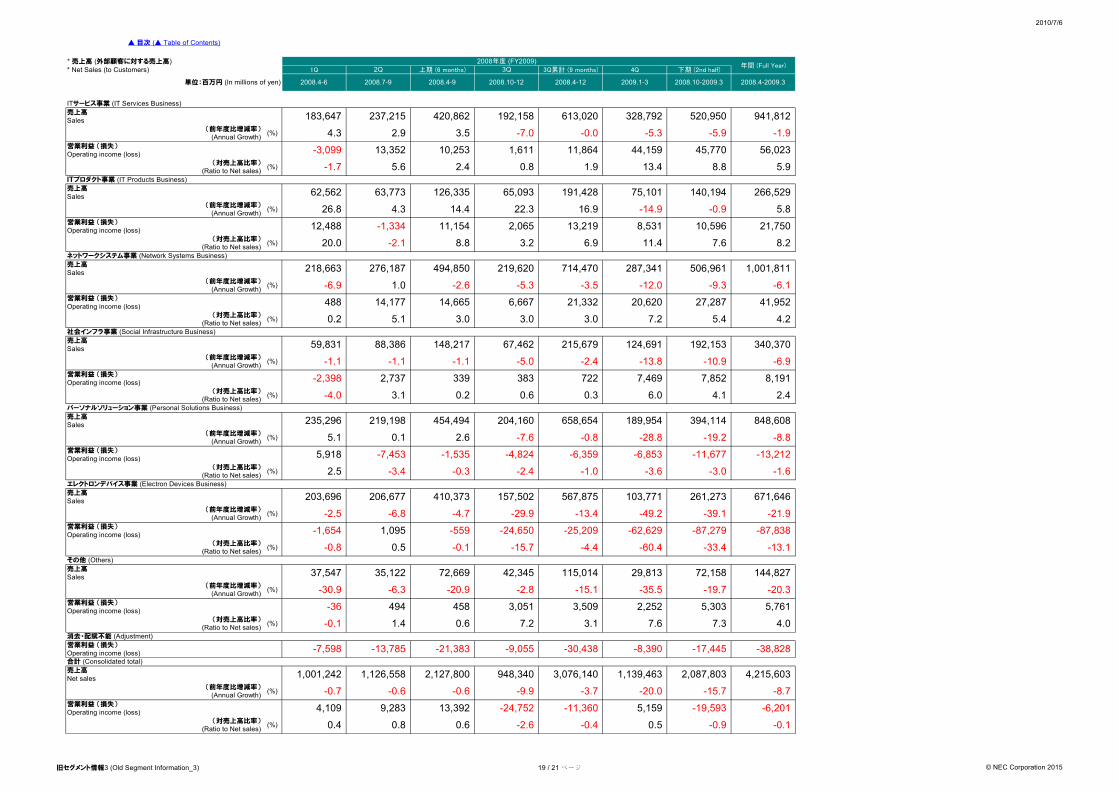
2008年度 (FY2009)4Q
2008.4-12 2009.1-3
下期 (2nd half)1Q 3Q累計 (9 months)
2008.10-2009.32008.4-6 2008.7-9 2008.4-9 2008.10-12 2008.4-2009.3
520,950
-7.0
328,792613,020420,862 192,158237,215183,647
-5.9 -1.9
941,812
-0.0 -5.3 3.54.3 2.9
-9.3 -6.1 -6.9 1.0 -2.6 -5.3 -3.5 -12.0
215,679
0.1
219,198 454,494
124,691 192,153 340,370
189,954
67,462
658,654
-6,853 -6,359 -4,824 -11,677 -13,212
-19.2 -8.8
-3.0
671,646
-0.8 -28.8 5.1
848,608394,114
2.6 -7.6
204,160235,296
-6.9 -13.8 -10.9
-1,535
-0.3 -2.4
5,918 -7,453
-39.1
206,677 261,273103,771567,875157,502410,373
-49.2 -21.9 -2.5
203,696
1,095 -559
-29.9 -6.8 -4.7 -13.4
-87,279
72,669 42,345 115,014
-87,838 -62,629
29,813 72,158 144,827
-1,654 -25,209 -24,650
494
-35.5
37,547
-30.9
35,122
-7,598
4.0
458
3.1 7.6 7.3
-9,055
2,252 5,303 5,761
-13,785 -21,383 -30,438 -8,390 -17,445
10,253 1,611
-38,828
45,770
8.8
56,023
5.9
266,529
2.4 0.8-1.7 5.6 1.9 13.4
-3,099 44,15913,352 11,864
63,77362,562 126,335
26.8
59,831 88,386 148,217
-2.1 8.820.0
14,177
65,093 191,428 75,101 140,194
4.3 14.4 22.3 16.9 -14.9 -0.9 5.8
12,488 -1,334 11,154 2,065 13,219 8,531 10,596 21,750
3.2 6.9 11.4 7.6 8.2
218,663 276,187 494,850 219,620 714,470 287,341 506,961 1,001,811
488 14,665 6,667 21,332 20,620 27,287 41,952
0.2 5.1 3.0 3.0 3.0 7.2 5.4 4.2
-1.1 -1.1 -1.1 -5.0 -2.4
-2,398 2,737 339 383 722 7,469 7,852 8,191
-4.0 3.1 0.2 0.6 0.3 6.0 4.1 2.4
2.5 -3.4 -1.0 -3.6 -1.6
-0.8 0.5 -0.1 -15.7 -4.4 -60.4 -33.4 -13.1
-20.9 -2.8 -15.1 -6.3 -19.7 -20.3
3,509
0.6 7.2
3,051-36
-0.1 1.4
1,001,242 1,126,558 2,127,800 948,340 3,076,140 1,139,463 2,087,803 4,215,603
-0.7 -0.6 -0.6 -9.9 -3.7 -20.0 -15.7 -8.7
4,109 9,283 13,392 -24,752 -11,360 5,159 -19,593 -6,201
0.4 0.8 0.6 -2.6 -0.4 0.5 -0.9 -0.1
旧セグメント情報3 (Old Segment Information_3) 19 / 21 ページ © NEC Corporation 2015
2010/7/6
* 売上高 (外部顧客に対する売上高)* Net Sales (to Customers)
売上高Sales
営業利益 (損失)Operating income (loss)
売上高Sales
営業利益 (損失)Operating income (loss)
売上高Sales
営業利益 (損失)Operating income (loss)
売上高Sales
営業利益 (損失)Operating income (loss)
売上高Sales
営業利益 (損失)Operating income (loss)
売上高Sales
営業利益 (損失)Operating income (loss)
売上高Sales
営業利益 (損失)Operating income (loss)
営業利益 (損失)Operating income (loss)
売上高Net sales
営業利益 (損失)Operating income (loss)
▲ 目次 (▲ Table of Contents)
単位:百万円 (In millions of yen)
ITサービス事業 (IT Services Business)
(前年度比増減率) (%)(Annual Growth)
(対売上高比率)
(Annual Growth)
(対売上高比率)
(対売上高比率) (%)
消去・配賦不能 (Adjustment)
(前年度比増減率)
(対売上高比率) (%)(Ratio to Net sales)ITプロダクト事業 (IT Products Business)
(前年度比増減率) (%)(Annual Growth)
(%)(Ratio to Net sales)ネットワークシステム事業 (Network Systems Business)
(%)
(対売上高比率) (%)(Ratio to Net sales)社会インフラ事業 (Social Infrastructure Business)
(前年度比増減率) (%)(Annual Growth)
(%)(Ratio to Net sales)パーソナルソリューション事業 (Personal Solutions Business)
(前年度比増減率) (%)(Annual Growth)
(対売上高比率) (%)(Ratio to Net sales)エレクトロンデバイス事業 (Electron Devices Business)
(前年度比増減率) (%)(Annual Growth)
(対売上高比率) (%)(Ratio to Net sales)その他 (Others)
(前年度比増減率) (%)(Annual Growth)
(Ratio to Net sales)
合計 (Consolidated total)
(前年度比増減率) (%)(Annual Growth)
(対売上高比率) (%)(Ratio to Net sales)
3Q 3Q累計 (9 months) 4Q年間 (Full Year)
2009年度 (FY2010)1Q 2Q 下期 (2nd half)上期 (6 months)
2009.10-2010.3 2009.4-2010.32009.4-12 2010.1-32009.4-6 2009.7-9 2009.4-9 2009.10-12
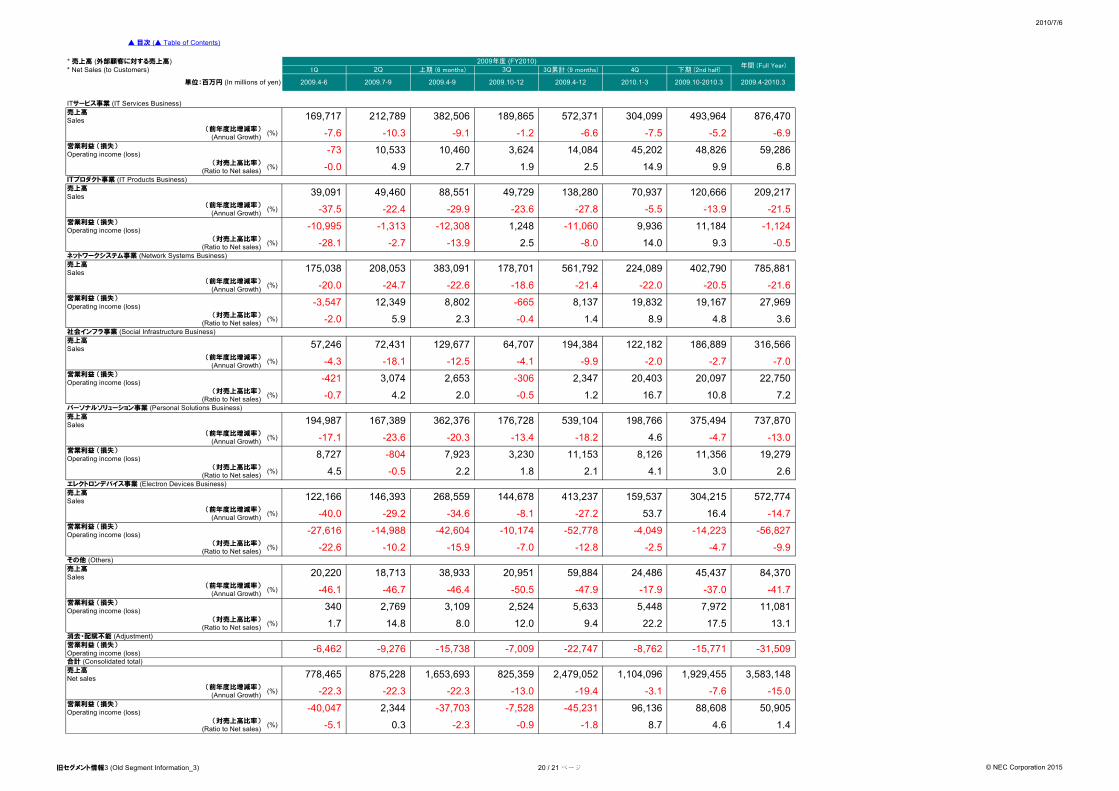
169,717 876,470
-5.2 -6.6 -9.1 -7.5 -7.6
212,789
-6.9 -1.2
382,506 189,865 572,371 304,099 493,964
-10.3
402,790561,792 224,089
316,566
3.6
122,182129,677 64,707 194,384
-0.4 1.4 8.9 4.8
186,889
539,104
72,431
362,376
57,246
194,987 167,389
-4.7
8,727
-17.1 -23.6 -18.2 -20.3
-4,049
8,126-804 7,923
198,766 375,494 737,870176,728
19,279
-13.0 -13.4
3,230 11,356
4.6
2,653 -306
-4.3 -18.1 -12.5
11,153
144,678 159,537122,166 146,393 268,559 413,237
-14.7
572,774
-29.2
304,215
16.4
-10,174 -52,778
-8.1 -27.2 53.7
-42,604
-34.6 -40.0
-14,223 -56,827
18,713
-27,616 -14,988
84,37020,220 59,884 24,486 45,437
-50.5 -47.9
38,933 20,951
-46.7
1.7
-8,762
340 3,109 2,524 5,633
14.8
-15,771 -7,009 -15,738 -22,747 -31,509 -9,276 -6,462
59,286-73 10,460 3,624 14,084 45,202
1.9
10,533
4.9
48,826
9.9 6.82.5 14.9-0.0
39,091 49,460 88,551 70,937
2.7
49,729 138,280 120,666 209,217
-37.5 -22.4 -29.9 -23.6 -27.8 -5.5 -13.9 -21.5
-10,995 -1,313 -12,308 1,248 -11,060 9,936 11,184 -1,124
-28.1 -2.7 -13.9 2.5 -8.0 14.0 9.3 -0.5
175,038 208,053 383,091 178,701 785,881
-20.0 -24.7 -22.6 -18.6 -21.4 -22.0 -20.5 -21.6
-3,547 12,349 8,802 19,832 19,167-665 8,137 27,969
-2.0 5.9 2.3
-4.1 -9.9 -2.0 -2.7 -7.0
-421 3,074 2,347 20,403 20,097 22,750
16.7 10.8-0.7 7.24.2 2.0 -0.5 1.2
2.2 1.8 2.1 4.1 3.0 2.64.5 -0.5
-10.2 -15.9 -7.0 -12.8 -2.5 -4.7 -9.9 -22.6
-46.4 -46.1 -17.9 -37.0 -41.7
11,081
12.0 9.4 22.2 17.5
5,448 7,9722,769
13.18.0
778,465 875,228 1,653,693 825,359 2,479,052 1,104,096 1,929,455 3,583,148
-22.3 -22.3 -22.3 -13.0 -19.4 -3.1 -7.6 -15.0
-40,047 2,344 -37,703 -7,528 -45,231 96,136 88,608 50,905
0.3 -2.3 -0.9 -1.8 8.7 4.6 1.4-5.1
旧セグメント情報3 (Old Segment Information_3) 20 / 21 ページ © NEC Corporation 2015
2014/04/28
出荷台数
Sales
出荷台数
Sales
出荷台数
Sales
出荷台数
Sales
出荷台数
Sales
出荷台数
Sales
出荷台数
Sales
出荷台数
Sales
出荷台数Sales
出荷台数
Sales
出荷台数Sales
▲ 目次 (▲ Table of Contents)
単位:千台 (K units)
2003年度 (FY2004)年間 (Full Year)
1Q 2Q 上期 (6 months) 3Q 3Q累計 (9 months) 4Q 下期 (2nd half)
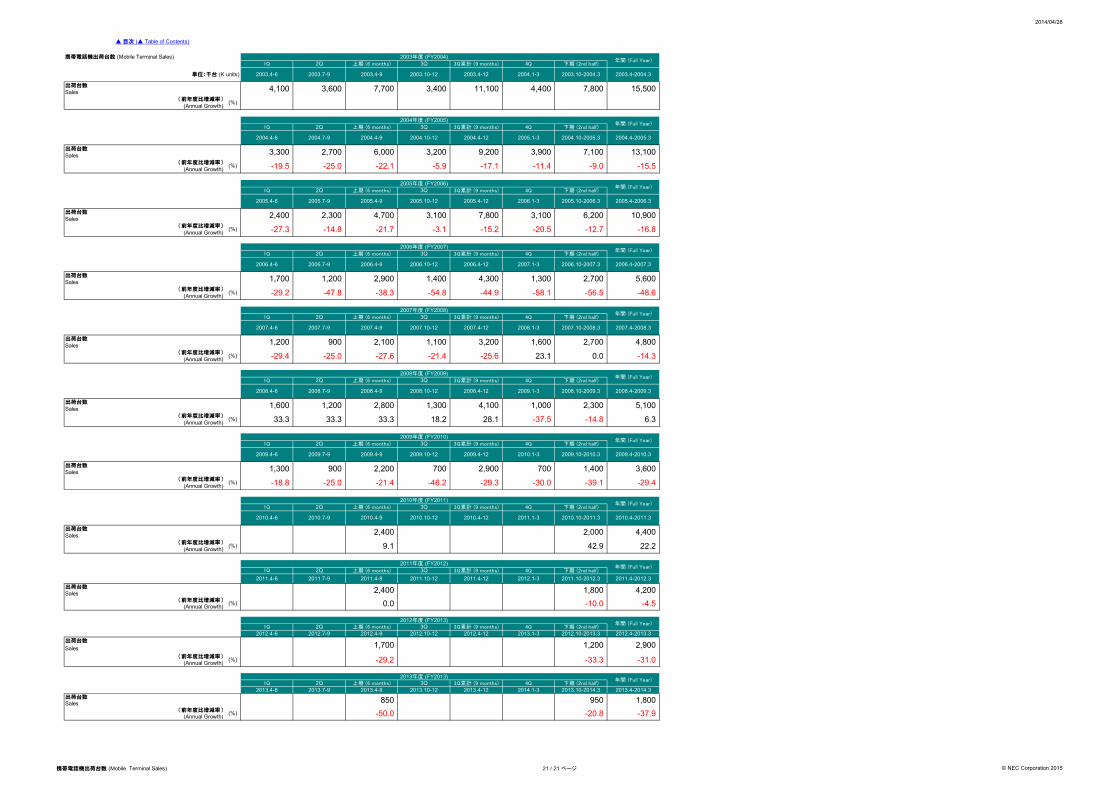
7,800 15,500
2003.4-6 2003.7-9 2003.4-9 2003.10-12 2003.4-12 2004.1-3
4,100
2003.10-2004.3 2003.4-2004.3
4,400
3Q累計 (9 months) 4Q 下期 (2nd half)
(Annual Growth)(前年度比増減率) (%)
3,600 7,700 3,400 11,100
2004年度 (FY2005)年間 (Full Year)
1Q 2Q 上期 (6 months) 3Q
3,300
-9.0
2,700
2004.10-2005.3
-11.4
2004.4-6 2004.7-9 2004.4-9 2004.10-12 2004.4-2005.3
6,000 3,200 9,200 3,900
2004.4-12 2005.1-3
7,100 13,100
(Annual Growth)(前年度比増減率) (%) -19.5 -25.0 -22.1 -5.9 -17.1 -15.5
2005年度 (FY2006)年間 (Full Year)
1Q 2Q 上期 (6 months) 3Q 3Q累計 (9 months) 4Q 下期 (2nd half)
2005.4-2006.3
10,9004,700 3,100 7,800 3,100
2005.10-12
2,400 6,200
-12.7
2005.4-12 2006.1-3
2,300
2005.10-2006.32005.4-6 2005.7-9 2005.4-9
(Annual Growth)(前年度比増減率) (%) -27.3 -14.8 -21.7 -3.1 -16.8
年間 (Full Year)1Q 2Q 上期 (6 months) 3Q 3Q累計 (9 months) 4Q 下期 (2nd half)
1,700 1,200
2006.10-2007.3
-15.2 -20.5
2006年度 (FY2007)
2006.4-2007.32006.4-6 2006.7-9 2006.4-9 2006.10-12 2006.4-12 2007.1-3
-56.5 -48.6
2,900 1,400 4,300 1,300 2,700 5,600
(Annual Growth)(前年度比増減率) (%) -29.2 -47.8 -38.3 -54.8 -44.9 -58.1
2007年度 (FY2008)年間 (Full Year)
1Q 2Q 上期 (6 months) 3Q 3Q累計 (9 months) 4Q 下期 (2nd half)
1,200 900
2007.10-2008.32007.4-6 2007.7-9 2007.4-9 2007.10-12 2007.4-12 2008.1-3
0.0 -14.3
2,100 1,100 3,200 1,600 2,700 4,800
23.1
2007.4-2008.3
(Annual Growth)(前年度比増減率) (%) -29.4 -25.0 -27.6 -21.4 -25.6
2008年度 (FY2009)年間 (Full Year)
1Q 2Q 上期 (6 months) 3Q 3Q累計 (9 months) 4Q 下期 (2nd half)
1,600 1,200
2008.10-2009.3 2008.4-2009.32008.4-6 2008.7-9 2008.4-9 2008.10-12 2008.4-12 2009.1-3
-37.5 -14.8 6.3
2,800 1,300 4,100 1,000 2,300 5,100
下期 (2nd half)
(Annual Growth)(前年度比増減率) (%) 33.3 33.3 33.3 18.2 28.1
2,200 700
2009年度 (FY2010)年間 (Full Year)
1Q 2Q 上期 (6 months) 3Q 3Q累計 (9 months) 4Q
2010.1-3
-29.3
1,300 900
2009.10-2010.32009.4-6 2009.7-9 2009.4-9 2009.10-12 2009.4-12
-39.1 -29.4
1,400 3,6002,900 700
-30.0
2009.4-2010.3
下期 (2nd half)
(Annual Growth)(前年度比増減率) (%) -18.8 -25.0 -21.4 -46.2
2011.1-3
2010年度 (FY2011)
2010.4-6 2010.7-9 2010.4-9 2010.10-12 2010.10-2011.3
年間 (Full Year)1Q 2Q 上期 (6 months) 3Q 3Q累計 (9 months) 4Q
2010.4-2011.32010.4-12
42.9
携帯電話機出荷台数 (Mobile Terminal Sales)
2,400
9.1 22.2(Annual Growth)
2,000 4,400(前年度比増減率) (%)
2011年度 (FY2012)年間 (Full Year)
1Q 2Q 上期 (6 months) 3Q 3Q累計 (9 months) 4Q 下期 (2nd half)
2011.4-6 2011.7-9 2011.4-9 2011.10-12 2011.4-12 2012.1-3
-10.0
2011.10-2012.3 2011.4-2012.3
4,2002,400 1,800-4.5 (Annual Growth) 0.0(前年度比増減率) (%)
2012年度 (FY2013)年間 (Full Year)
1Q 2Q 上期 (6 months) 3Q 3Q累計 (9 months) 4Q 下期 (2nd half)2012.4-2013.32012.4-6 2012.7-9 2012.4-9 2012.10-12 2012.4-12 2013.1-3
1,7002012.10-2013.3
(Annual Growth)
1,200 2,900(前年度比増減率) (%) -29.2 -33.3 -31.0
2013年度 (FY2013)年間 (Full Year)
1Q 2Q 上期 (6 months) 3Q
8502013.4-6 2013.7-9 2013.4-9 2013.10-12
3Q累計 (9 months) 下期 (2nd half)2013.4-2014.32013.4-12 2014.1-3 2013.10-2014.3
4Q
(前年度比増減率) (%) -50.0 (Annual Growth) -20.8 -37.9 950 1,800
携帯電話機出荷台数 (Mobile Terminal Sales) 21 / 21 ページ © NEC Corporation 2015