
1. 2 VALUTRANS Spa Sede Amministrativa sita in Via Melchiorre Gioia 168, Milano, ITALY.
A compact light readout system for longitudinally segmented shashlikcalorimeters
A. Berraa,b,∗, C. Brizzolaria,b, S. Cecchinic, F. Cindoloc, C. Jolletd, A. Longhine, L. Ludovicif, G. Mandriolic,N. Mauric, A. Meregagliad, A. Paolonie, L. Pasqualinic,g, L. Patriziic, M. Pozzatoc, F. Pupillie, M. Presta,b, G. Sirric,
F. Terranovab,h, E. Vallazzai, L. Votanoe
aUniversita degli Studi dell’Insubria, Via Valleggio, 11 - 22100 Como, ItalybINFN sezione di Milano Bicocca, Piazza della Scienza, 3 - 20126 Milano, Italy
cINFN sezione di Bologna, Viale Berti Pichat, 6/2 - 40127 Bologna, ItalydIPHC, Universite de Strasbourg, CNRS/IN2P3, Strasbourg, France
eINFN Laboratori Nazionali di Frascati, Via Enrico Fermi, 40 - 00044 Frascati (RM), ItalyfINFN sezione di Roma, Piazzale Aldo Moro, 2 - 00185 Roma, Italy
gUniversita di Bologna, Dipartimento di Fisica, Via Irnerio, 46 - 40126 Bologna, ItalyhUniversita degli Studi di Milano Bicocca, Dipartimento di Fisica, Piazza della Scienza, 3 - 20126 Milano, Italy
iINFN sezione di Trieste, Via Valerio, 2 - 34127 Trieste, Italy
Abstract
The longitudinal segmentation of shashlik calorimeters is challenged by dead zones and non-uniformities in-troduced by the light collection and readout system. This limitation can be overcome by direct fiber-photosensorcoupling, avoiding routing and bundling of the wavelength shifter fibers and embedding ultra-compact photosensors(SiPMs) in the bulk of the calorimeter. We present the first experimental test of this readout scheme performed at theCERN PS-T9 beamline in 2015 with negative particles in the 1-5 GeV energy range. In this paper, we demonstratethat the scheme does not compromise the energy resolution and linearity compared with standard light collection andreadout systems. In addition, we study the performance of the calorimeter for partially contained charged hadrons toassess the e/π separation capability and the response of the photosensors to direct ionization.
Keywords: Shashlik calorimeter, Longitudinal segmentation, Silicon PhotoMultipliers
1. Introduction
The “shashlik” readout technology [1] for sampling calorimeters has been successfully employed in particlephysics since more than twenty years [2–8]. Shashlik calorimeters are sampling calorimeters in which the scintil-lation light is readout via wavelength shifting (WLS) fibers running perpendicularly to the converter/absorber plates.This technique offers flexibility in the calorimeter design combined with ease of assembly, good hermeticity and fasttime response. In most applications, it represents a cost effective solution compared to crystals or cryogenic liquidcalorimeters. The main drawback of this technique is the limitation imposed to the longitudinal segmentation by theoptical fiber readout. For each segment, fibers must be bundled and routed toward the photosensors, introducing non-uniform response or the presence of dead zones. As a consequence, shashlik calorimeters allow for high flexibility inthe choice of parameters except for the granularity of the longitudinal sampling [9].
The current generation of shashlik calorimeters [10–12] is readout by compact solid-state photosensors. In par-ticular, the INFN FACTOR Collaboration has demonstrated that Silicon PhotoMultipliers (SiPMs) can be used veryeffectively for the light readout of these detectors [13, 14]. The compactness of SiPMs and the possibility to use thesedevices embedded in the bulk of the calorimeters [15] open new possibilities to implement longitudinal segmentationin shashlik devices.
∗Corresponding author, address: Universita degli Studi dell’Insubria, Via Valleggio, 11 - 22100 Como, Italy; e-mail: [email protected]
Preprint submitted to Nuclear Instruments and Methods in Physics Research: Section A November 9, 2018
arX
iv:1
605.
0963
0v1
[ph
ysic
s.in
s-de
t] 3
1 M
ay 2
016
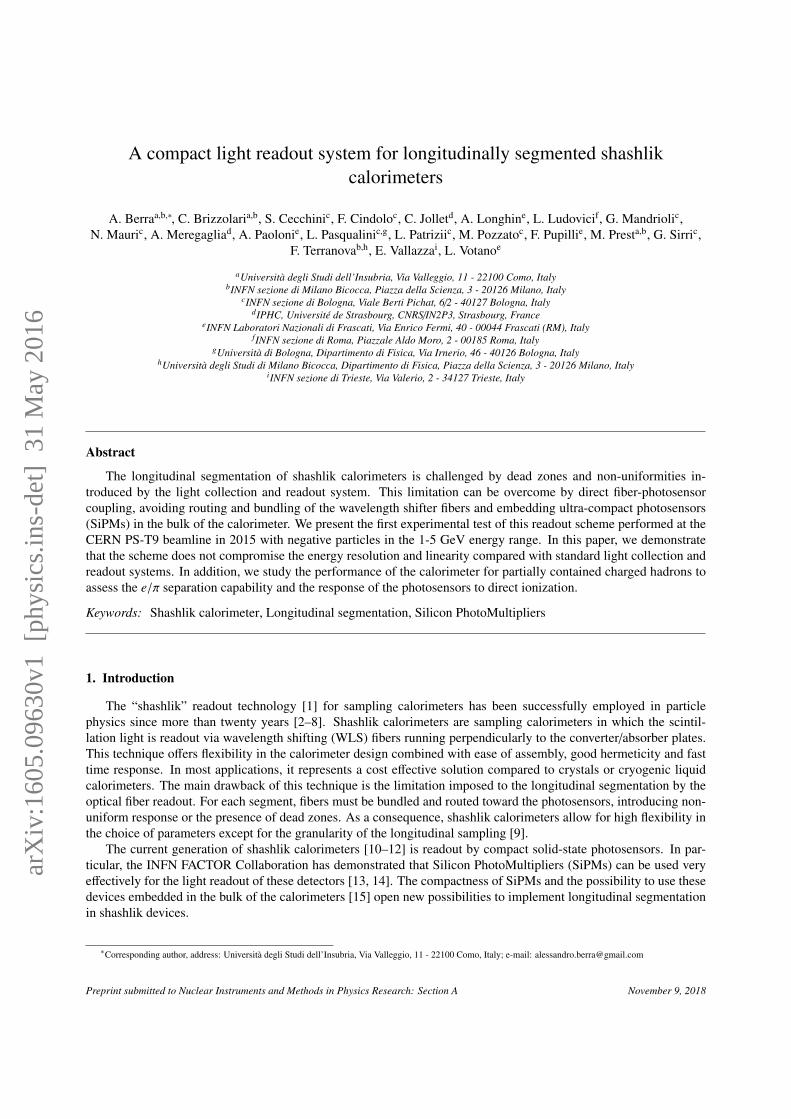
In particular, the INFN SCENTT Collaboration is developing an ultra-compact module (Fig. 1) where every singlefiber segment is directly connected to a SiPM and the SiPMs array is hosted on a PCB (Printed Circuit Board) holderthat integrates both the passive components and the signal routing toward the front-end electronics (fast digitizers).This setup offers maximum flexibility in the choice of the longitudinal sampling (length of the fiber crossing thescintillator/absorber tiles) and transverse granularity (tile size and number of summed SiPM channels). Applicationsrange from high granularity devices for collider physics employing particle flow algorithms for hadrons [15], up tobeam dump [16] and non-conventional neutrino facilities [17–19], where the large sizes of the detectors pose stringentrequirements on the cost.
Figure 1: Schematics of the ultra-compact module that is being developed by SCENTT. The module corresponds to a4 X0 sampling and a transverse granularity of 3×3 cm2 (9 fibers per module).
In view of the SCENTT R&D, one of the FACTOR calorimeters was modified to allow for direct fiber-SiPMcoupling without bundling and tested with negative charged particles at the CERN PS-T9 beamline. The goals ofthe test were to demonstrate that direct fiber coupling to SiPMs and summing up of the SiPMs output signal withoutpre-amplification can replace fiber bundling to a single large area photosensor. In particular, the tests were aimed atchecking that direct coupling does not compromise the energy response and linearity achieved in FACTOR. Duringthe test, e/π separation, nuclear counter effects (NCE) and the performance of the readout electronics were alsoinvestigated.
Sec. 2 and Sec. 3 of this paper are devoted to the description of the shashlik prototype and the experimental setup.Sec. 4 presents the GEANT4 simulation of the calorimeter under test. Linearity and energy resolution for electrons arediscussed in Sec. 5.1, while studies with partially contained hadrons for e/π separation, NCE and readout electronicsare reported in Secs. 5.2, 5.3 and 5.4, respectively.
2. The test calorimeter
The shashlik calorimeter prototype employed in this study is a modified version of the calorimeter tested byFACTOR in 2009 [13]. It is composed of two modules: each module consists of 8×8 cm2 tiles of lead interleavedwith plastic scintillator. The thickness of both the lead and scintillator tiles is 3.3 mm and each module groups 20(lead) + 20 (scint.) tiles. The depth of the module corresponds to ∼ 12 X0 (Fig. 2a). Due to the limited amount ofSiPMs available for the test only one module per run could be readout: the longitudinal containment of a 1(5) GeVelectromagnetic (EM) shower in a module is 88%(83%) (see Sec. 4). Given the beam energy range (1-5 GeV) and the
2

number of available radiation lengths, a single module with different fiber lengths (see below) was used to evaluatethe e/π discrimination capability of the calorimeter in the region of interest for neutrino physics applications (twolongitudinal samplings at ∼5 and ∼ 10 X0 for E < 5 GeV [17]).
The light produced in the scintillator is collected by 64 0.8 mm diameter Kuraray-Y11 WLS fibers. In the firstmodule, the fibers are divided into two groups with different lengths: the former crosses the whole calorimeter (12 X0)and the latter only half of it (6 X0). The pattern of long and short fibers is shown in Fig. 2b: the module is readout byone short fiber every 2 cm in both transverse directions interleaved with a long fiber. In this configuration the showeris sampled uniformly by both long and short fibers. Long fibers integrate the scintillator light over 12 X0 while shortfibers collect the light produced between 6 and 12 X0 since the beginning of the shower. For comparison, the secondmodule was readout only with long fibers. This configuration is different from the one that will be implemented inSCENTT (one standalone module every 4 X0) but allows for a test of e/π separation using just one SiPM holder planelocated at the back of the module.
(a) (b)
Figure 2: Picture of the first module of the calorimeter prototype (a); close-up on the WLS fibers (b) and the long/shortalternated pattern: short fibers (some of them highlighted with red circles) are less bright than long ones due to thedifferent ambient light collection efficiency.
The WLS fibers are collected in a plastic holder, which also acts as a mechanical support for the electronic boardhosting the SiPMs. 64 SiPMs manufactured by Advansid [20] in a plastic SMD package (Fig. 3b) are soldered on acustom PCB (glass-reinforced epoxy laminate sheet FR4, 4 layers, 1.6 mm total thickness). The mechanical matchingbetween the plastic mask and the PCB ensures that each SiPM is in direct contact with the fiber and is centered alongthe fiber axis. The technical specifications of the SiPMs employed in this test can be found in Tab. 1. The electronicboard provides:
• the signal routing through MCX connectors: the 64 SiPMs can be readout independently, or summed togetherin groups of four, reducing the number of readout channels to 16. The summed configuration can be selectedswitching a set of jumpers located on the board (see Fig. 3a); the SiPMs are AC coupled to the output with10 nF capacitors;
• four independent bias voltages corresponding to four different regions of the board: sensors with the samebreakdown voltage were grouped in the same bias zone in order to provide the same overvoltage to all theSiPMs (the SiPMs have been preliminary characterized by the manufacturing company in terms of I-V curves).The precision of the overvoltage equalization is within 0.1 V.
The red (blue) signal routing on the PCB (see Fig. 3a) follows an accordion pattern in order to collect the signalsfrom long (short) fibers only. During the beamtest, the SiPM signals were summed in groups of four, reducing thenumber of total channels to 16.
3

(a) (b)
Figure 3: Back-plane of the custom PCB (a) where the SiPMs and the electronic components are hosted (the SiPMsare soldered on the opposite side); close-up of the Advansid 1.13 mm2 circular SiPMs (b) employed in the calorimeter.The red and blue lines in (a) show the group of SiPMs that are summed.
Model VBD # of Cell area Active Fill PDE(V) cells (µm2) Area (mm2) factor
ASD-RGB1C-P ∼28 673 40×40 1.13 ∼60% 32.5%
Table 1: SiPMs features: VBD refers to the breakdown voltage of the SiPMs, while the Photo Detection Efficiency(PDE) value is obtained at 550 nm.
3. Experimental setup
The shashlik calorimeter prototype was tested at CERN on the PS-T9 beamline using a mixed beam of muons,pions and electrons up to 5 GeV. On the T9 beamline the particles are obtained from the interaction of the primary24 GeV/c protons of the PS accelerator with a fixed target. The momentum of the extracted beam ranges between0.5 and 15 GeV/c. The momentum bite δp/p can be set in steps of 1% changing the aperture of the horizontalcollimators [21]. The experimental setup on the T9 beamline was composed of:
• one CO2 Cherenkov detector for the beam particle ID;
• two silicon strip detectors (SSD) [22] for the track reconstruction with a spatial resolution of ∼30 µm;
• a 10×10 cm2 plastic scintillator for the trigger;
• the calorimeter modules, hosted inside a darkened metal box.
The DAQ system is based on a standard VME system controlled by a SBS Bit3 model 620 bridge1, opticallylinked to a Linux PC-system. The calorimeter readout was performed with both a charge integrating ADC (mod.V792 QDC, CAEN) and two 8 channel 500 MS/s, 14-bit waveform digitizers (mod. DT5730 and V1730, CAEN). Forthe QDC readout, the calorimeter signals were delayed by 120 ns. This readout configuration was used to evaluatethe general performance of the calorimeter in terms of linearity and energy resolution (Sec. 5.1), e/π discriminationcapability (Sec. 5.2) and possible contributions due to the nuclear counter effects (Sec. 5.3).
1SBS Technologies Inc., US, http://www.ge-ip.com
4

(a) (b)
Figure 4: The experimental area along the T9 beamline with a sketch of its layout (a); the calorimeter box with thetwo modules (b).
In addition, special runs were performed with a waveform digitizer DAQ (Sec. 5.4). In these runs, a 1024 ns(corresponding to 512 samples) waveform was acquired for each calorimeter channel without any delay line (thedigitizer sampling started 60 ns before the trigger signal). In both DAQ modes, the trigger conditions and the siliconstrip detector readout were controlled by custom VME boards developed by INFN-Trieste [14].
4. GEANT4 simulation
The calorimeter prototype was simulated using the GEANT4 [23] simulation package in order to characterize thedetector in terms of linearity, energy resolution, energy leakage and e/π discrimination. The simulation is based onthe energy deposited in the scintillator tiles and, hence, it sets the reference for an ideal light readout system. Inparticular, it does not account for light production and transport in the WLS fibers and for the SiPM photon detectionefficiency. The primary particle beam consists of 5 × 10⁴ monochromatic electrons and pions: five different runshave been generated, with an energy of the primary particles in the 1-5 GeV range and momentum parallel to theaxis of the calorimeter. Considering its negligible contribution (1.4%), the momentum dispersion of the T9 beamlineis not included in the primary particle generation. The distribution of the particles in the transverse plane is a twodimensional Gaussian (σ=4 cm) centered on the axis of the calorimeter. Only particles impinging in the 4 × 4 cm2
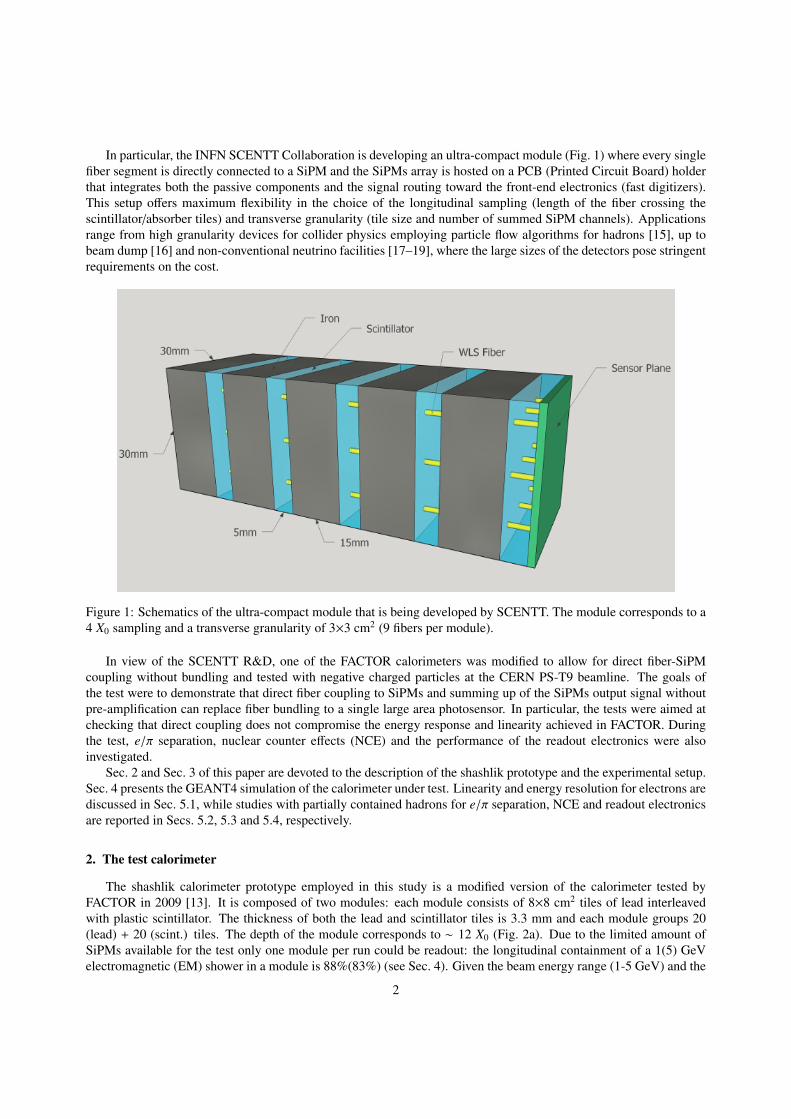
central area are considered for the analysis. These parameters reproduce the beam size of the CERN PS-T9 beamlineas monitored by the SSD during the test and the fiducial area cut employed using the SSD hits. The FTFP BERTreference physics list [24] was used to describe the physical interactions of the electrons and hadrons in the calorimeter.The calorimeter linearity, energy resolution and shower containment were obtained fitting the histograms of the energydeposit inside the scintillator tiles with a Crystal Ball function [25](Fig. 5).
The mean and the σ values of the Crystal Ball function were used to test the linearity of the detector response(Fig. 6a), the shower containment fraction and the energy resolution (Fig. 6b) as a function of the particle momentum.The energy resolution was fitted with a σE
E = S√
E⊕ C function, where S and C represent the stochastic and constant
terms [26], respectively.As expected, small deviations from the linearity (0.6% and 1.2%) are visible above 3 GeV: this is due to the limited
size of the calorimeter (12 X0) and the resulting longitudinal energy leakage. The shower containment decreases from88% at 1 GeV to 83% at 5 GeV. The stochastic term obtained from the fit is 12.5% with a constant term of ∼4%(mostly due to the longitudinal leakage). At low energy, the resolution is dominated by the sampling fraction of thecalorimeter.
In order to estimate the e/π separation capability, the energy deposit in all the scintillator tiles (simulating thelong fibers light collection) and in the last ten tiles (simulating the short fibers light collection) is considered. In
5
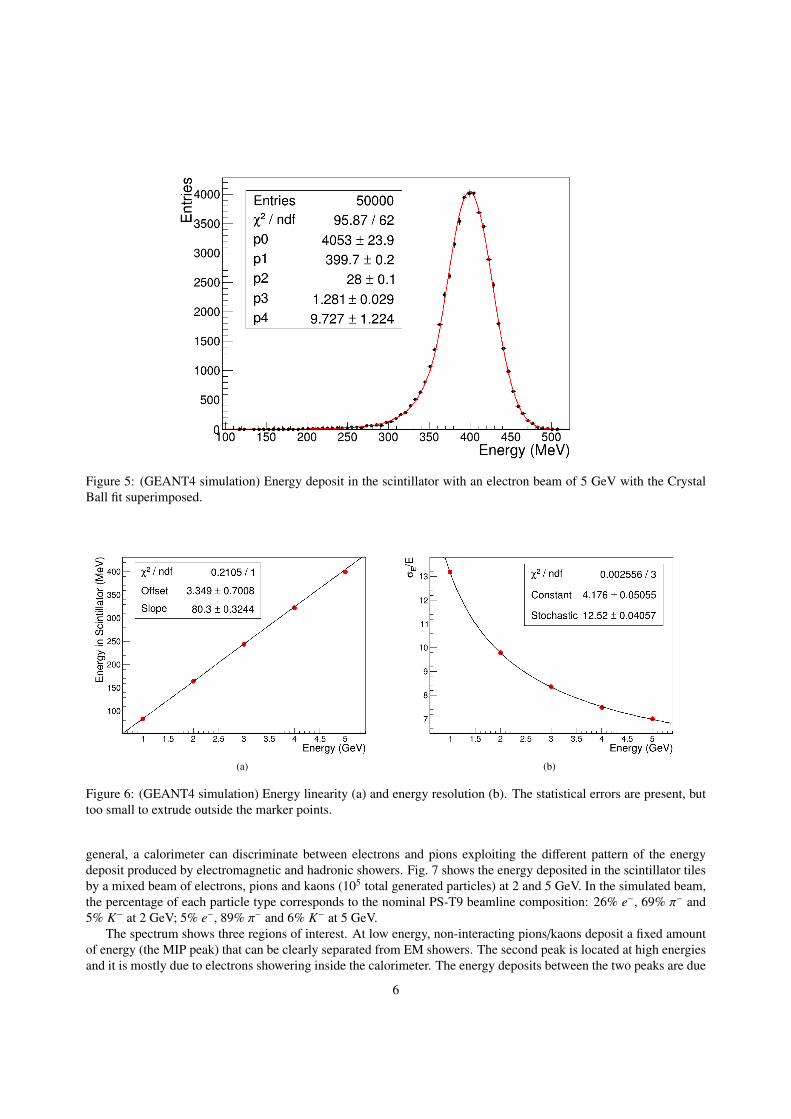
Figure 5: (GEANT4 simulation) Energy deposit in the scintillator with an electron beam of 5 GeV with the CrystalBall fit superimposed.
(a) (b)
Figure 6: (GEANT4 simulation) Energy linearity (a) and energy resolution (b). The statistical errors are present, buttoo small to extrude outside the marker points.
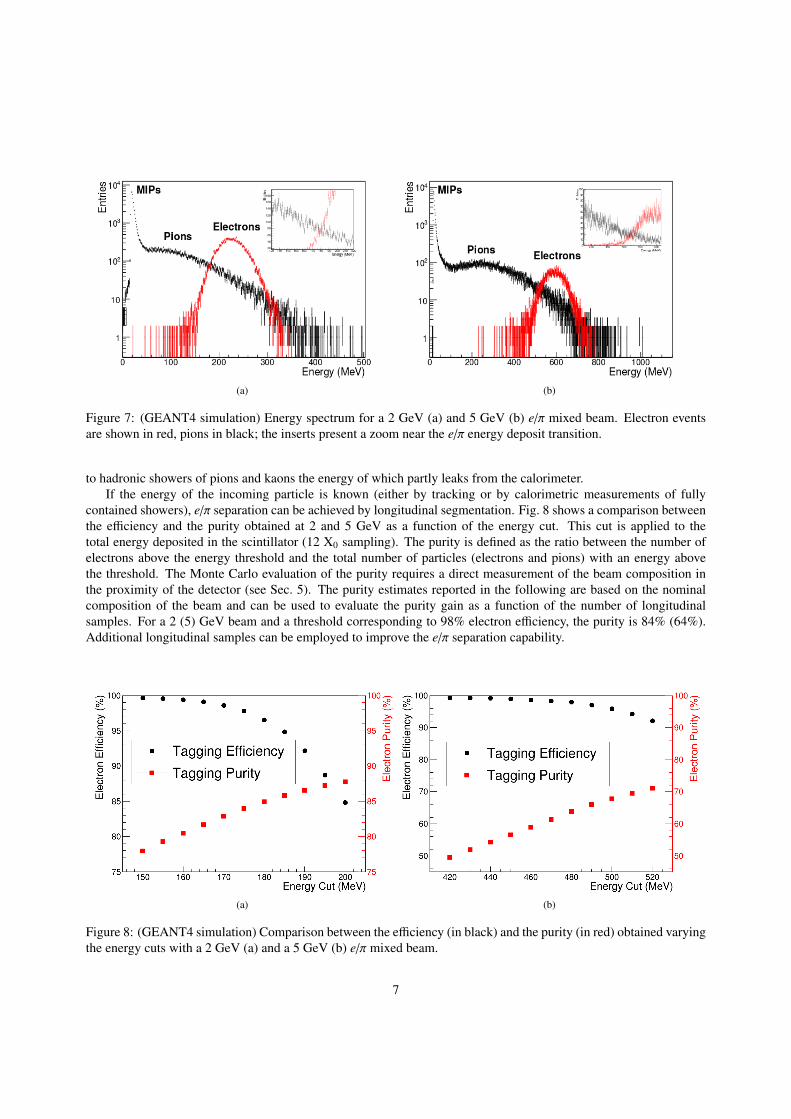
general, a calorimeter can discriminate between electrons and pions exploiting the different pattern of the energydeposit produced by electromagnetic and hadronic showers. Fig. 7 shows the energy deposited in the scintillator tilesby a mixed beam of electrons, pions and kaons (105 total generated particles) at 2 and 5 GeV. In the simulated beam,the percentage of each particle type corresponds to the nominal PS-T9 beamline composition: 26% e−, 69% π− and5% K− at 2 GeV; 5% e−, 89% π− and 6% K− at 5 GeV.
The spectrum shows three regions of interest. At low energy, non-interacting pions/kaons deposit a fixed amountof energy (the MIP peak) that can be clearly separated from EM showers. The second peak is located at high energiesand it is mostly due to electrons showering inside the calorimeter. The energy deposits between the two peaks are due
6
(a) (b)
Figure 7: (GEANT4 simulation) Energy spectrum for a 2 GeV (a) and 5 GeV (b) e/π mixed beam. Electron eventsare shown in red, pions in black; the inserts present a zoom near the e/π energy deposit transition.
to hadronic showers of pions and kaons the energy of which partly leaks from the calorimeter.If the energy of the incoming particle is known (either by tracking or by calorimetric measurements of fully
contained showers), e/π separation can be achieved by longitudinal segmentation. Fig. 8 shows a comparison betweenthe efficiency and the purity obtained at 2 and 5 GeV as a function of the energy cut. This cut is applied to thetotal energy deposited in the scintillator (12 X0 sampling). The purity is defined as the ratio between the number ofelectrons above the energy threshold and the total number of particles (electrons and pions) with an energy abovethe threshold. The Monte Carlo evaluation of the purity requires a direct measurement of the beam composition inthe proximity of the detector (see Sec. 5). The purity estimates reported in the following are based on the nominalcomposition of the beam and can be used to evaluate the purity gain as a function of the number of longitudinalsamples. For a 2 (5) GeV beam and a threshold corresponding to 98% electron efficiency, the purity is 84% (64%).Additional longitudinal samples can be employed to improve the e/π separation capability.
(a) (b)
Figure 8: (GEANT4 simulation) Comparison between the efficiency (in black) and the purity (in red) obtained varyingthe energy cuts with a 2 GeV (a) and a 5 GeV (b) e/π mixed beam.
7
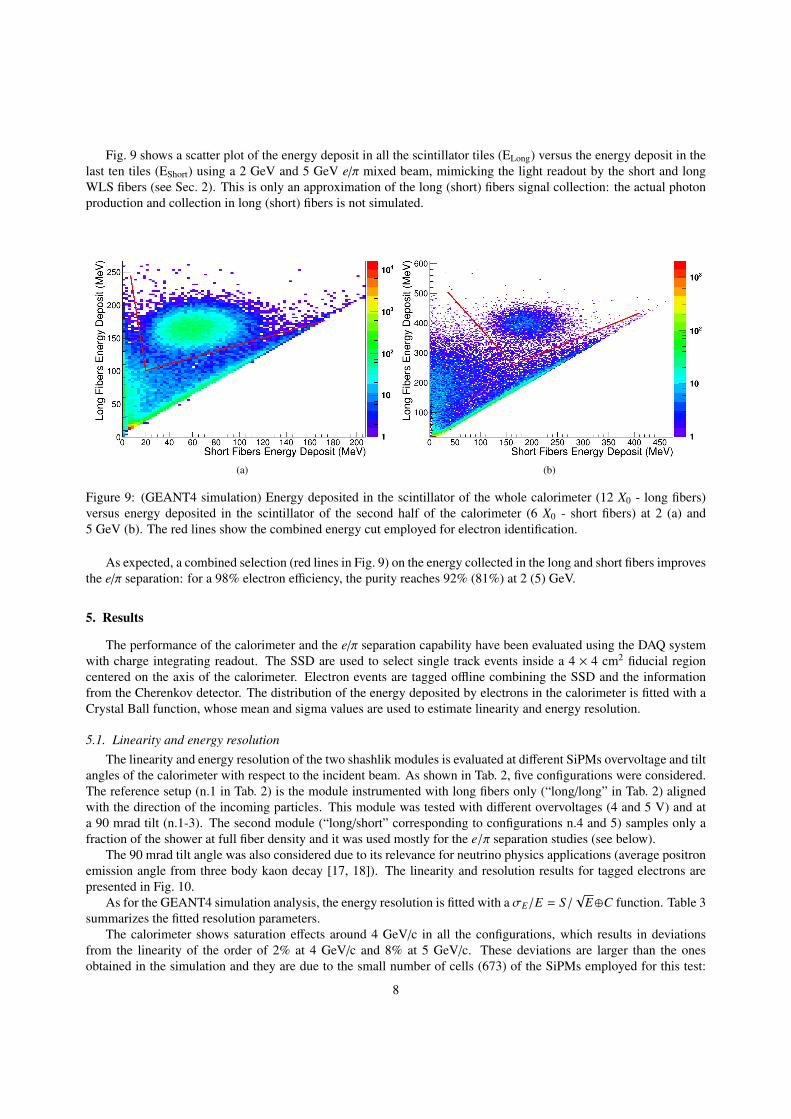
Fig. 9 shows a scatter plot of the energy deposit in all the scintillator tiles (ELong) versus the energy deposit in thelast ten tiles (EShort) using a 2 GeV and 5 GeV e/π mixed beam, mimicking the light readout by the short and longWLS fibers (see Sec. 2). This is only an approximation of the long (short) fibers signal collection: the actual photonproduction and collection in long (short) fibers is not simulated.
(a) (b)
Figure 9: (GEANT4 simulation) Energy deposited in the scintillator of the whole calorimeter (12 X0 - long fibers)versus energy deposited in the scintillator of the second half of the calorimeter (6 X0 - short fibers) at 2 (a) and5 GeV (b). The red lines show the combined energy cut employed for electron identification.
As expected, a combined selection (red lines in Fig. 9) on the energy collected in the long and short fibers improvesthe e/π separation: for a 98% electron efficiency, the purity reaches 92% (81%) at 2 (5) GeV.
5. Results
The performance of the calorimeter and the e/π separation capability have been evaluated using the DAQ systemwith charge integrating readout. The SSD are used to select single track events inside a 4 × 4 cm2 fiducial regioncentered on the axis of the calorimeter. Electron events are tagged offline combining the SSD and the informationfrom the Cherenkov detector. The distribution of the energy deposited by electrons in the calorimeter is fitted with aCrystal Ball function, whose mean and sigma values are used to estimate linearity and energy resolution.
5.1. Linearity and energy resolutionThe linearity and energy resolution of the two shashlik modules is evaluated at different SiPMs overvoltage and tilt
angles of the calorimeter with respect to the incident beam. As shown in Tab. 2, five configurations were considered.The reference setup (n.1 in Tab. 2) is the module instrumented with long fibers only (“long/long” in Tab. 2) alignedwith the direction of the incoming particles. This module was tested with different overvoltages (4 and 5 V) and ata 90 mrad tilt (n.1-3). The second module (“long/short” corresponding to configurations n.4 and 5) samples only afraction of the shower at full fiber density and it was used mostly for the e/π separation studies (see below).
The 90 mrad tilt angle was also considered due to its relevance for neutrino physics applications (average positronemission angle from three body kaon decay [17, 18]). The linearity and resolution results for tagged electrons arepresented in Fig. 10.
As for the GEANT4 simulation analysis, the energy resolution is fitted with a σE/E = S/√
E⊕C function. Table 3summarizes the fitted resolution parameters.
The calorimeter shows saturation effects around 4 GeV/c in all the configurations, which results in deviationsfrom the linearity of the order of 2% at 4 GeV/c and 8% at 5 GeV/c. These deviations are larger than the onesobtained in the simulation and they are due to the small number of cells (673) of the SiPMs employed for this test:
8
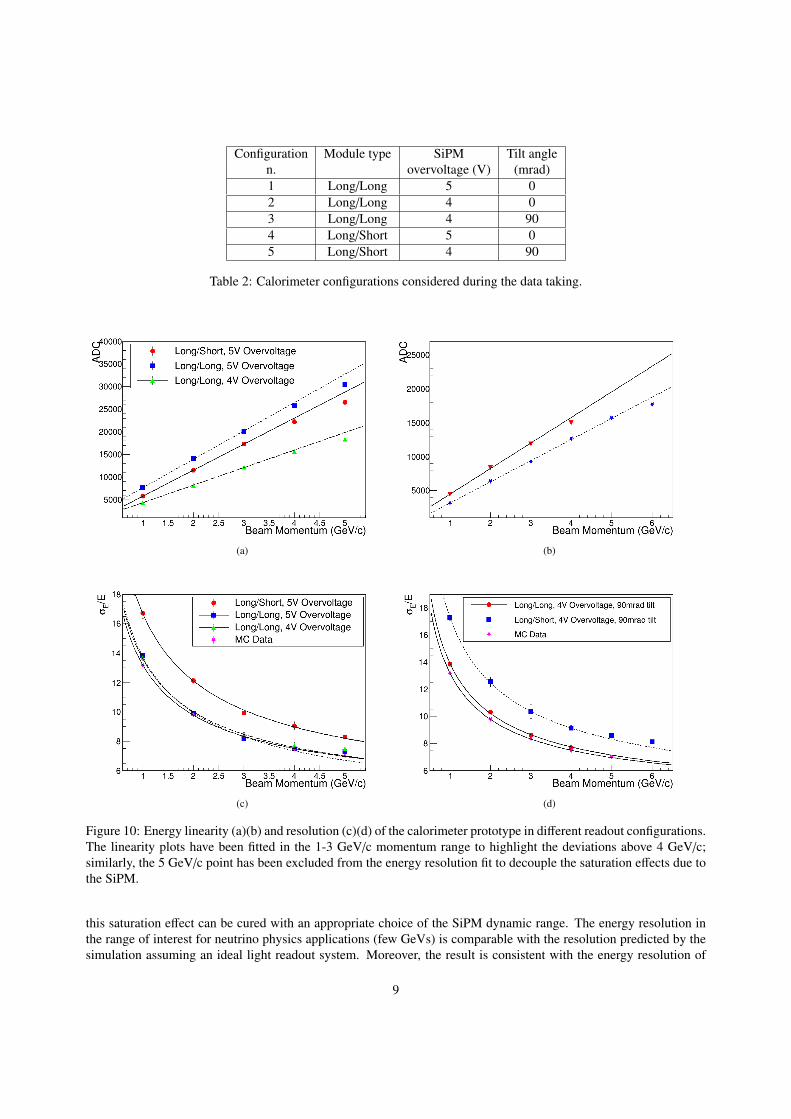
Configuration Module type SiPM Tilt anglen. overvoltage (V) (mrad)1 Long/Long 5 02 Long/Long 4 03 Long/Long 4 904 Long/Short 5 05 Long/Short 4 90
Table 2: Calorimeter configurations considered during the data taking.
(a) (b)
(c) (d)
Figure 10: Energy linearity (a)(b) and resolution (c)(d) of the calorimeter prototype in different readout configurations.The linearity plots have been fitted in the 1-3 GeV/c momentum range to highlight the deviations above 4 GeV/c;similarly, the 5 GeV/c point has been excluded from the energy resolution fit to decouple the saturation effects due tothe SiPM.
this saturation effect can be cured with an appropriate choice of the SiPM dynamic range. The energy resolution inthe range of interest for neutrino physics applications (few GeVs) is comparable with the resolution predicted by thesimulation assuming an ideal light readout system. Moreover, the result is consistent with the energy resolution of
9

Configuration n. Stochastic Constant1 13.4 ± 0.3 3.0 ± 0.52 13.0 ± 0.3 3.9 ± 0.53 13.4 ± 0.3 3.9 ± 0.54 16.3 ± 0.5 3.8 ± 0.95 17.0 ± 0.4 3.4 ± 0.9
Table 3: Stochastic and constant terms as extracted from the energy resolution fits.
shashlik devices with similar lead and scintillator tile thickness operated in the standard fiber bundling scheme [4] anddemonstrates the equivalence of the two light readout systems. The performance is similar for particles impinging atsmall angles (configurations 3 and 5) and is not sensitive to overvoltage variations within 1 V. A deterioration of theenergy resolution is visible only for the “long/short” module because the calorimeter does not sample uniformly theshower in the proximity of the maximum (∼ 5X0 at 2 GeV/c).
5.2. Electron/Pion separationThe e/π discrimination capability has been investigated employing the “long/short” module and selecting high
purity electron samples with the Cherenkov counter. Due to the strong depletion of the electron component in the T9beam at high beam momenta (<5% at 5 GeV/c) e/π separation runs were performed only at 2 GeV/c, i.e. at the peakof the pion background distribution for non conventional neutrino beams [17].
Particle selection is performed using the same criteria as in Sec. 5.1. The electron sample (electron efficiency>98%) was selected with the Cherenkov counter, operated with CO2 at a pressure of 1.25 bar. The correspondingenergy spectrum (in ADC counts) in the calorimeter is shown in Fig. 11; the red histogram represents the Cherenkovtagged electron sample, while the full spectrum (black line) includes the MIP peak and interacting hadrons. An energycut at 7900 ADC counts selects a sample with an electron efficiency of 98%: the corresponding purity is 91%. In thiscase, purity is defined as the ratio between the number of Cherenkov tagged electrons above the energy threshold andthe total number of particles (electrons and hadrons) with an energy above the threshold. The efficiency (purity) as afunction of the energy threshold is shown in Fig. 12.
The signal (ADC counts) collected by the long versus short fibers is shown in Fig. 13. The red lines show thecombined cut employed for e/π separation. For an electron efficiency of 98%, the combined cut selects a sample with95% purity. The additional sampling thus improves the e/π separation in agreement with the expectation of Sec. 4.
A direct comparison of these results with the GEANT4 expectations is limited by the uncertainty on the beamcomposition. In fact, a full characterization of the beam composition at the proximity of the detector was not possiblesince only one Cherenkov counter was available. In addition, pressure scans were performed only in a limited range.We hence estimated the systematic uncertainty on the beam composition (mostly due to halo muons and hadrondecays) from the ratio between the MIP and the total particle rate in the sample of events with no signal in theCherenkov counter. The corresponding uncertainty on the purity computed with the long/short information is 3%.
5.3. Nuclear counter effectsNuclear counter effect (NCE) is the extra amount of charge produced in the photosensor by a particle directly
hitting it, on the top of the charge produced by the scintillation light. This direct ionization effect is of relevance forphotodiodes [27]; it has also been observed for APDs in the CMS ECAL calorimeter [28], where contributions ofdirect ionization from particles produced in the hadronic showers [29, 30] may affect the e/π separation. NCEs areexpected to be negligible in SiPMs because these sensors are pixelated and operated in Geiger mode. When a ionizingparticle crosses the SiPM and deposits part of its energy, it triggers a single cell discharge at most, mimicking thesignal of only one optical photon [31]. No evidence of NCEs were reported by FACTOR where most of the studieswere done with electrons and, due to the standard bundling and routing layout, the SiPMs were located far from thecore of the shower. Similarly, in the calorimeter studied in this paper the pion samples selected in Sec. 5.2 do not showdistortions that can be traced to fully saturated SiPMs. To test in a direct manner NCE in the present light readoutscheme, a dedicated run at 5 GeV/c has been performed. In this special run, the SiPMs were mounted on a calorimetermodule with no WLS fibers. Since the field of view of the SiPM towards the scintillator tiles is negligible and the
10

Figure 11: Full and Cherenkov-tagged spectrum of the calorimeter exposed to the 2 GeV beam.
Figure 12: Comparison between the efficiency (in black) and the purity (in red) obtained varying the energy cut
QE of the sensor is mismatched with respect to the emission spectrum of the plastic scintillator, the only expectedcontribution is from NCE. Fig. 14 presents the energy spectrum in ADC counts obtained in the NCE run. Two eventsubsets have been selected:
• electron events (black line): electrons tagged with the Cherenkov detector, impinging on the calorimeter. Theyproduce EM showers, thus should maximize NCE signals;
11

Figure 13: Signal collected by the long versus short fibers at 2 GeV. The red lines show the combined energy cutemployed for electron identification.
• pedestal events (red dashed line): particles that are outside the calorimeter. They should not produce any signalin the calorimeter, and the corresponding energy spectrum can be considered as the electronic chain pedestal.
Figure 14: Comparison between the spectra recorded in the special run without WLS fibers (black and red lines - seetext for details) and a standard run.
12

As can be seen, the NCE electron peak is consistent with the pedestal peak and no contributions extend to theMIP region (∼ 1300 ADC counts, blue dashed line) recorded in the same conditions (SiPMs overvoltage, calorimeterposition and beam energy) but using a standard module with WLS fibers. This result is consistent with the expectationof negligible NCE in light readout systems based on SiPMs. In the SCENTT setup (Fig. 1) we expect a factor threelarger charged particle rate at 5 GeV since the photosensors are located in the proximity of the maximum of the showerwhile in this setup they are positioned at 12 X0. Still, from these measurements it is clear that NCE will not representa relevant source of noise even in the MIP signal region.
5.4. DAQ based on waveform digitizers
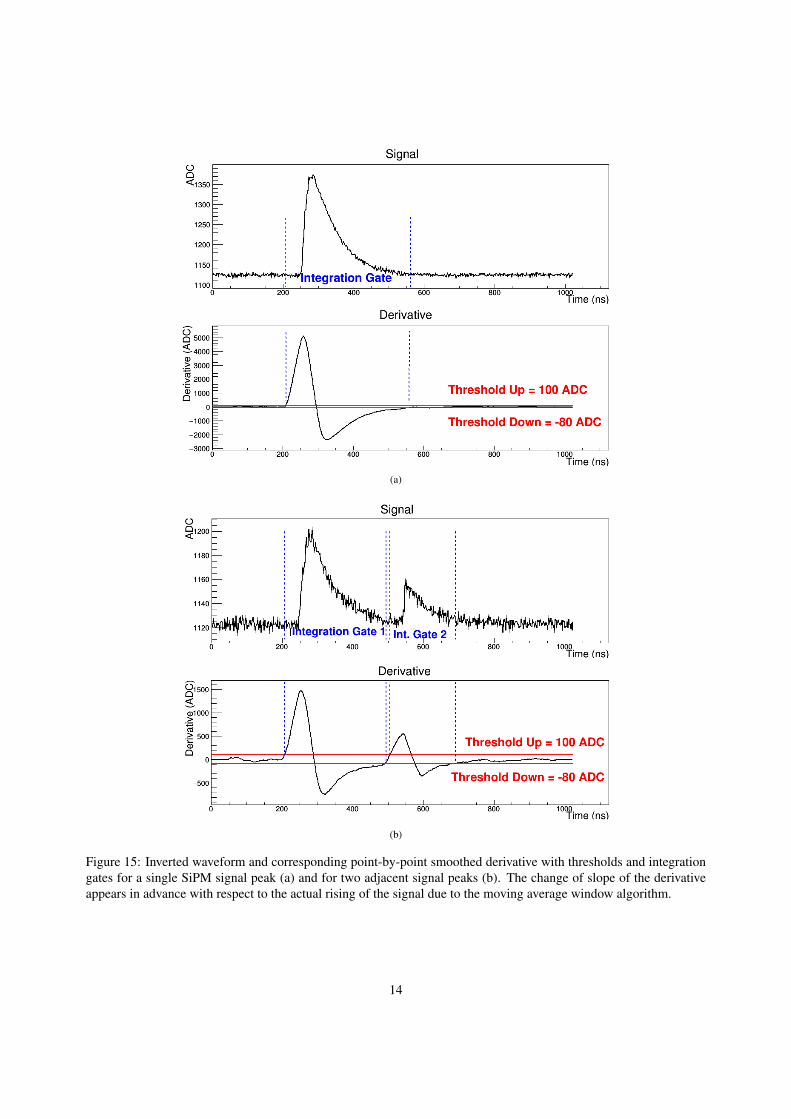
The application of this light readout system for neutrino physics, as the ones that are being investigated in [17–19], requires a triggerless acquisition where the signal of the summed SiPMs is continuously sampled during the beamextraction spill. The DAQ system will hence be based on waveform digitizers and sampling will be extended up to10 ms. In this test, the calorimeter was readout for ∼1 µs (each calorimeter channel is sampled 512 times every 2 ns)with commercial waveform digitizers (CAEN DT5730 and V1730) in order to test data analysis algorithms for theSiPMs waveforms and compare the energy resolution results for fully sampled (500 ms, 14 bit) and downsampled(250 ms, 12 bit) waveforms with the ones obtained with the QDC. The downsampled waveforms are obtained in theoffline analysis halving the number of samplings and omitting the last two bits of data.
For each waveform, the smoothed derivative δi of the i-th waveform point is computed as:
δi(N) =
N∑k=1
si+k −
N∑k=1
si−k (1)
where si is the waveform value in the i-th point and N is the number of points used for the moving average window.A SiPM pulse is tagged when the derivative exceeds for the first time a given positive threshold (100 ADC counts inFig. 15a). The threshold crossing generates the start of the integration gate; the gate is stopped when the derivativecrosses from below a negative threshold (corresponding to -80 ADC in Fig. 15a). This algorithm offers high frequencynoise filtering (smoothing) and is well suited to resolve multiple peaks in standard SiPM output signals (see Fig. 15b).The sensitivity to the peaks of a given height can be tuned adjusting the upper and lower threshold values. Thewaveform baseline is computed peak by peak exploiting the waveform integral used for the calculation of the derivativeand it is subtracted in the peak integral calculation.
For each event, the 16 waveforms of the calorimeter signals are analyzed. The peaks are identified and integratedin order to compute the total energy deposit. The event selection criteria (fiducial area and Cherenkov cuts) are thesame as for the QDC analysis described above.
In Table 4 the energy resolution obtained with the waveform digitizer DAQ (with the original and downsampledwaveforms) and the QDC DAQ are compared. The calorimeter used for the comparison is the long/short longitudinallysegmented module and the SiPMs are biased with a 4 V overvoltage.
Beam 500 MS/s 250 MS/s QDC QDC (4 V OV,Momentum 14-bit 12-bit (5 V OV) 90 mrad Tilt)
1 GeV/c 17.0% 17.2% 16.7% 17.3%2 GeV/c 13.4% 13.3% 12.1% 12.6%3 GeV/c 10.8% 10.8% 9.9% 10.4%
Table 4: Comparison between the energy resolution values at different energies, using the waveform digitizer basedand the QDC based DAQs. The QDC results have been obtained using a slightly larger overvoltage with respect tothe waveform digitizer results.
The energy resolution computed with the waveform digitizer analysis is the same using both the original and thedownsampled (250 MS/s, 12-bit) waveforms. Moreover, the results are compatible with the previous ones obtainedwith the QDC based DAQ.
13
(a)
(b)
Figure 15: Inverted waveform and corresponding point-by-point smoothed derivative with thresholds and integrationgates for a single SiPM signal peak (a) and for two adjacent signal peaks (b). The change of slope of the derivativeappears in advance with respect to the actual rising of the signal due to the moving average window algorithm.
14

6. Conclusions
A calorimeter light readout system based on direct fiber-photosensor coupling without fiber bundling has beentested and characterized on the CERN PS-T9 beamline. This novel system allows for the construction of compactsub-modules that ease significantly the longitudinal segmentation of shashlik calorimeters and will be studied in theframework of the SCENTT R&D program. In this paper we characterized two shashlik modules where each fiberis directly connected to a SiPM and the SiPMs array is hosted on a PCB holder that integrates both the passivecomponents and the signal routing toward the front-end electronics. One of the two modules was equipped with fibersof different lengths to sample different parts of the shower and improve the e/π discrimination capability. The energyresolution obtained with this readout scheme (13%/
√E(GeV) ⊕ 3%) is comparable to the standard fiber bundling
readout and, therefore, the new compact scheme with the photosensors embedded in the bulk of the calorimeter fullyretains the performance of the device. Deviations from linearity were observed at beam momenta > 4 GeV/c and areattributed to the limited dynamic range of the SiPMs used in the test. At 98% electron efficiency, the sample purityincreases from 91% to 95% when employing both long and short fibers for electron identification.
The same results can be obtained replacing the QDC DAQ with a 4 ns 12 bit waveform digitizer, as requestedfor neutrino physics applications. Finally, nuclear counter effects have been tested in a direct manner removing theWLS fibers from one of the modules and keeping the SiPM in the bulk of the module. As expected from the pixelatedstructure of the SiPM, no visible effects were observed.
7. Acknowledgments
This project has received funding from the European Union’s Horizon 2020 Research and Innovation programmeunder Grant Agreement no. 654168. The authors gratefully acknowledge CERN and the PS staff for successfullyoperating the East Experimental Area and for continuous supports to users. We specially thank Henric Wilkens andLau Gatignon for help and suggestions during the data taking on the PS-T9 beamline.
References
References
[1] H. Fessler, P. Freund, J. Gebauer, K. M. Glas, K. Pretzl, P. Seyboth, J. Seyerlein and J. C. Thevenin, Nucl. Instr. and Meth. in Phys. Res. A 228(1985) 303;
[2] G. S. Atoyan et. al., Nucl. Instr. and Meth. in Phys. Res. A 320 (1992) 144;[3] J. Badier et. al., Nucl. Instr. and Meth. in Phys. Res. A 348 (1994) 74;[4] S. J. Alvsvaag et. al., [DELPHI STIC Collaboration], Nucl. Instr. and Meth. in Phys. Res. A 425 (1999) 106;[5] L. Aphecetche et. al., [PHENIX Collaboration], Nucl. Instr. and Meth. in Phys. Res. A 499 (2003) 521;[6] A. Zoccoli [HERA-B Collaboration], Nucl. Instr. and Meth. in Phys. Res. A 446 (2000) 246;[7] F. Goebel [ZEUS Collaboration], Nucl. Instr. and Meth. in Phys. Res. A 453 (2000) 230;[8] R. Dzhelyadin [LHCb Collaboration], Nucl. Instr. and Meth. in Phys. Res. A 581 (2007) 384;[9] A. C. Benvenuti et. al. [CALEIDO Collaboration], Nucl. Instr. and Meth. in Phys. Res. A 432 (1999) 232;[10] G. S. Atoian et. al., Nucl. Instr. and Meth. in Phys. Res. A 584 (2008) 291;[11] A. Fantoni [ALICE Collaboration], Nucl. Instr. and Meth. in Phys. Res. A 293 (2011) 012043;[12] N. Anfimov et. al., Nucl. Instr. and Meth. in Phys. Res. A 718 (2013) 75;[13] A. Berra et. al., IEEE Trans. Nucl. Sci. 58 (2011) 1297;[14] A. Berra et. al., Nucl. Instr. and Meth. in Phys. Res. A 735 (2014) 422;[15] C. Adloff et. al. [CALICE Collaboration], Journal of Instr. 5 (2010) P05004;[16] M. Anelli et. al. [SHiP Collaboration], arXiv:1504.04956 [physics.ins-det];[17] A. Longhin, L. Ludovici and F. Terranova, Eur. Phys. J. C 75 (2015) 155;[18] A. Berra et. al., arXiv:1512.08202 [hep-ex];[19] The neutrino physics opportunities and the technology for the non-conventional kaon-tagged neutrino beams will be developed in the frame-
work of the EU Horizon 2020 Project ENUBET (ERC Consolidator Grant 2015, PI: Andrea Longhin).[20] Advansid, Povo (TN), Italy. http://advansid.com/;[21] L. Durieu et. al., Proceedings of the 19th IEEE PAC 2001 (2001) CERN-PS-2001-037-AE;[22] M. Prest et. al., Nucl. Instr. and Meth. in Phys. Res. A 501 (2003) 280;[23] J. Allison et. al., IEEE Trans. Nucl. Sci. 53 (2006) 270;[24] Documentation available at http://geant4.cern.ch/geant4/support/proc mod catalog/physics lists/referencePL.shtml;[25] T. Skwarnicki, DESY F31-86-02 (1986), Ph.D Thesis, Appendix E;[26] C. W. Fabjan and F. Gianotti, Rev. Mod. Phys. 75 (2003) 1243;
15

[27] K. Ueno, S. K. Sahu, K. C. Peng, W. S. Hou and C. H. Wang, Nucl. Instr. and Meth. in Phys. Res. A 396 (1997) 103;[28] M. Dittmar and D. Zurcher, CERN-CMS-NOTE-1999-040, CMS-NOTE-1999-040.[29] D. Zurcher, Nucl. Instr. and Meth. in Phys. Res. A 442 (2000) 433;[30] R. Mao, L. Zhang and R. Y. Zhu, J. Phys. Conf. Ser. 293 (2011) 012012 [IEEE Trans. Nucl. Sci. 58 (2011) 1249;[31] D. Renker and E. Lorenz, Journal of Instr. 4 (2009) P04004;
16


![Massimo Caccia, P.I. Universita’ dell’Insubria [UINS] Como (Italy) & INFN- Sezione di Milano](https://static.fdocument.pub/doc/165x107/56814fdd550346895dbda5b0/massimo-caccia-pi-universita-dellinsubria-uins-como-italy-infn-.jpg)