
Çáà|àâà|ÉÇá TÇÇâtÄ exÑÉÜà ECCIkfi.ky.gov/publications/Annual Reports/2006 Annual...
34
byy|vx Éy Y|ÇtÇv|tÄ \Çáà|àâà|ÉÇá byy|vx Éy Y|ÇtÇv|tÄ \Çáà|àâà|ÉÇá byy|vx Éy Y|ÇtÇv|tÄ \Çáà|àâà|ÉÇá TÇÇâtÄ e TÇÇâtÄ e TÇÇâtÄ e xÑ xÑ xÑ ÉÜ ÉÜ ÉÜ à à à ECCI ECCI ECCI fâÑxÜä|á|Çz ^xÇàâv~çËá Y|ÇtÇv|tÄ \ÇwâáàÜç yÉÜ LG lxtÜá fâÑxÜä|á|Çz ^xÇàâv~çËá Y|ÇtÇv|tÄ \ÇwâáàÜç yÉÜ LG lxtÜá fâÑxÜä|á|Çz ^xÇàâv~çËá Y|ÇtÇv|tÄ \ÇwâáàÜç yÉÜ LG lxtÜá
Transcript of Çáà|àâà|ÉÇá TÇÇâtÄ exÑÉÜà ECCIkfi.ky.gov/publications/Annual Reports/2006 Annual...
byy|vx Éy Y|ÇtÇv|tÄ \Çáà|àâà|ÉÇábyy|vx Éy Y|ÇtÇv|tÄ \Çáà|àâà|ÉÇábyy|vx Éy Y|ÇtÇv|tÄ \Çáà|àâà|ÉÇá
TÇÇâtÄ eTÇÇâtÄ eTÇÇâtÄ exÑxÑxÑÉÜÉÜÉÜààà ECCIECCIECCI
fâÑxÜä|á|Çz ^xÇàâv~çËá Y|ÇtÇv|tÄ \ÇwâáàÜç yÉÜ LG lxtÜáfâÑxÜä|á|Çz ^xÇàâv~çËá Y|ÇtÇv|tÄ \ÇwâáàÜç yÉÜ LG lxtÜáfâÑxÜä|á|Çz ^xÇàâv~çËá Y|ÇtÇv|tÄ \ÇwâáàÜç yÉÜ LG lxtÜá
gtuÄx Éy VÉÇàxÇàá
ê ECCI OFI A
NN
UA
L REPO
RT | ,
Mission Statement and OFI Philosophy ..............................................................................................3 Letter from the Executive Director ......................................................................................................4 Commissioners/Executive Directors....................................................................................................5 OFI History and Organizational Structure...........................................................................................6 Financial Institutions Board.................................................................................................................7 Administrative Services Branch ..........................................................................................................8 Division of Financial Institutions.........................................................................................................9 94th Annual Bank and Thrift Report ...................................................................................................9 Annual Consolidated Statement of Assets - State Banks and Thrifts ................................................10 Consolidated Condition and Income Data - State Banks and Thrifts ................................................11 Total Assets - State Banks and Thrifts...............................................................................................12 Trust Assets - State-Chartered Independent Trust Companies ..........................................................16 Trust Assets - State Bank Trust Departments ....................................................................................17 New Bank Charters, Bank Conversions, Name Changes and Mergers .............................................19 73rd Annual Credit Union Report......................................................................................................20 Annual Consolidated Statement of Assets - State-Chartered Credit Unions.....................................21 Selected Composite Operating Ratios - State-Chartered Credit Unions ...........................................22 Report of Condition - State-Chartered Credit Unions .......................................................................24 10th Annual Compliance Branch Report ...........................................................................................25 Annual Consolidated Statement of Assets - Consumer Loan Companies.........................................27 Consolidated Report of Condition - Consumer Loan Companies .....................................................28 Annual Consolidated Statement of Assets - Industrial Loan Companies ..........................................29 Consolidated Report of Condition - Industrial Loan Companies ......................................................30 21st Annual Securities Report ...........................................................................................................31 2006 Securities Report - Securities Licensing ...................................................................................32 2006 Securities Report - Securities Corporations Finance, Compliance and Enforcement...............33
2
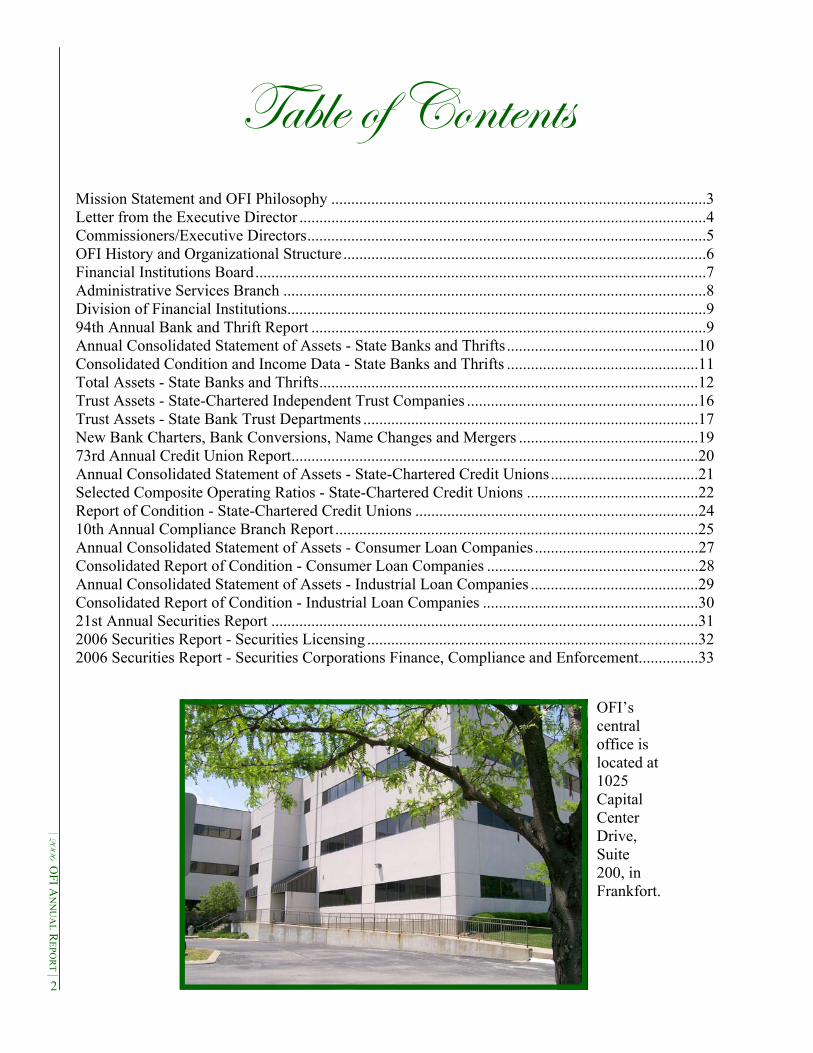
OFI’s central office is located at 1025 Capital Center Drive, Suite 200, in Frankfort.
`|áá|ÉÇ fàtàxÅxÇà
ê
ECCI
OFI
AN
NU
AL
REP
OR
T |
The agency’s philosophy, drawn from its core values, its vision and its mission, represents the funda-mental beliefs that shape the approach to policy and operations, as well as our commitment to those we regulate and to the citizens of Kentucky. • Commitment to High Standards. OFI is committed to raising the standards of financial services
regulation by providing professional, accurate, knowledgeable and courteous service to those we regulate.
• Commitment to Employees. The agency recognizes that its employees are its greatest asset and that they should be encouraged and empowered to use their creativity, working not only individu-ally but as a team to fully satisfy the needs of the financial services industry. Only through team-work, training and education can our staff ensure adequate response and delivery of unequaled ser-vice. We must continue to provide our employees with lifelong educational opportunities and the most up-to-date technology.
• Commitment to Flexibility and Service. Flexibility is essential in today’s rapidly changing world. Those we regulate expect greater efficiency and responsiveness from government. Government ex-pectation of its employees is at a higher level than ever before. We must make every effort to keep abreast of emerging trends and be able to make changes within our agency that result from mapping trends and industry expectations.
• Commitment to Assisting Taxpayers. This agency will improve its efforts to educate and inform citizens.
• Commitment to Responsiveness. OFI will continue its efforts to be of service to the citizens. We will, in individual cases, act as an ombudsman to resolve complaints against entities we regulate. We will continue our educational outreach to our citizens in order to ensure their knowledge of their rights and responsibilities.
• Commitment to Fair and Impartial Administration and Enforcement. This agency is commit-ted to administering the laws of the commonwealth fairly, equitably and impartially, without regard to status, wealth, political affiliation, race, color, creed or disability.
3
bY\ c{|ÄÉáÉÑ{ç
Âg{x `|áá|ÉÇ Éy à{x byy |vx Éy Y|ÇtÇv|tÄ \Çáà|àâà|ÉÇá |á àÉ áxÜäx à{x ÑâuÄ|v à{ÜÉâz{ xyyxvà|äx
tÇw xyy|v|xÇà ÜxzâÄtà|ÉÇ à{tà ÑÜÉÅÉàxá vÉÇáâÅxÜ vÉÇy|wxÇvx tÇw xvÉÇÉÅ|v wxäxÄÉÑÅxÇàAÊ

ê ECCI OFI A
NN
UA
L REPO
RT | , 4
Ernie Fletcher
Governor
Commonwealth of Kentucky Environmental and Public Protection Cabinet
OFFICE OF FINANCIAL INSTITUTIONS 1025 CAPITAL CENTER DRIVE, SUITE 200
FRANKFORT, KENTUCKY 40601 TELEPHONE: 502 -573--3390
www.kentucky.gov
Teresa J. Hill Secretary
June 30, 2007 The Honorable Ernie L. Fletcher, Governor The State Capitol Frankfort, KY 40601 Dear Governor Fletcher: It is my honor and privilege as executive director of the Office of Financial Institutions to submit our annual report for the year ending Dec. 31, 2006. This report includes statistical and historical informa-tion pertaining to the financial services industry regulated by our agency. The dynamic and continually changing environment within the financial services industry will continue to require diligence and a keen focus on supervisory methodologies that are consistent with your vision for improving the quality of life through economic growth and opportunities for the citizens of the commonwealth. We will continue to be ever vigilant in our regulatory capacity to ensure the safety and soundness of the financial services industry, whether that may be in the context of regulatory relief or strengthening regulations where necessary to ensure the entities we supervise adhere to standards of fair and ethical practices. We must continually search for opportunities to implement the use of technology whenever appropriate to realize your vision of cost-effective and efficient government. We also will require accountability of the financial services industry in all respects for the fair and legal provision of financial services in ex-change for the privilege of being licensed or possessing a charter to conduct business in our great com-monwealth. Our entire professional staff is committed to fulfilling the agency’s mission through the thoughtful con-sideration and implementation of our strategic plan, which we have set forth to further enhance the in-dustry and citizens we serve. This commitment is evidenced by our endeavors to continually improve upon the service we provide to the financial services industry and to all of the citizens of the common-wealth.
Sincerely,
Cordell G. Lawrence Executive Director
Office of Financial Institutions

VÉÅÅ|áá|ÉÇxÜá
ê
ECCI
OFI
AN
NU
AL
REP
OR
T |
1912-2006
Year Commissioner Governor (Title changed to Executive Director 2004) 1912 Thomas J. Smith James B. McCreary 1916 George G. Speer Augustus O. Stanley 1920 James Lewis Edwin P. Morrow 1924 Charles E. Marvin William J. Fields 1928 O. S. Denny Flem D. Samson 1930 C. S. Wilson Flem D. Samson 1931 J. R. Dorman Ruby Laffoon 1935 Hiram Wilhoit A. B. Chandler 1939 Hiram Wilhoit Keene Johnson 1943 Hillard H. Smith Simeon S. Willis 1948 Henry H. Carter Earle C. Clements 1951 Henry H. Carter Lawrence W. Wetherby 1955 R. E. Glenn Lawrence W. Wetherby 1956 S. Albert Phillips A. B. Chandler 1958 Earle B. Combs A. B. Chandler 1960 H. A. Rogers Bert T. Combs 1964 H. A. Rogers Edward T. Breathitt 1965 G. D. Beach Edward T. Breathitt 1968 E. G. Adams Louie B. Nunn 1971 Lenvil R. Hall Wendell H. Ford 1971 Perry R. Miller (Acting) Wendell H. Ford 1973 Howard T. Sallee Wendell H. Ford 1975 John Williams Jr. Julian M. Carroll 1980 Randall L. Attkisson John Y. Brown Jr. 1982 Foster Pettit (Acting) John Y. Brown Jr. 1983 Morris R. Smith John Y. Brown Jr. 1983 Tracy Farmer (Acting) John Y. Brown Jr. 1983 Neil Welch (Acting) John Y. Brown Jr. 1983 Leonard B. Marshall John Y. Brown Jr. 1984 Ballard W. Cassady Jr. Martha Layne Collins 1986 Thomas B. Miller Martha Layne Collins 1988 Edward B. Hatchett Jr. Wallace G. Wilkinson 1992 Edward B. Hatchett Jr. Brereton C. Jones 1994 Edward J. Holmes (Acting) Brereton C. Jones 1995 J. Rick Jones (Acting) Brereton C. Jones 1996 Larry D. Lander Paul E. Patton 1997 Ella D. Robinson (Acting) Paul E. Patton 1998 Arthur L. Freeman Paul E. Patton 1999 Ella D. Robinson Paul E. Patton 2004 Tom B. Miller Ernie Fletcher 2005 Cordell G. Lawrence Ernie Fletcher 2006 Cordell G. Lawrence Ernie Fletcher 5
bÜztÇ|étà|ÉÇtÄ fàÜâvàâÜx
bY\ [|áàÉÜç
ê ECCI OFI A
NN
UA
L REPO
RT | ,
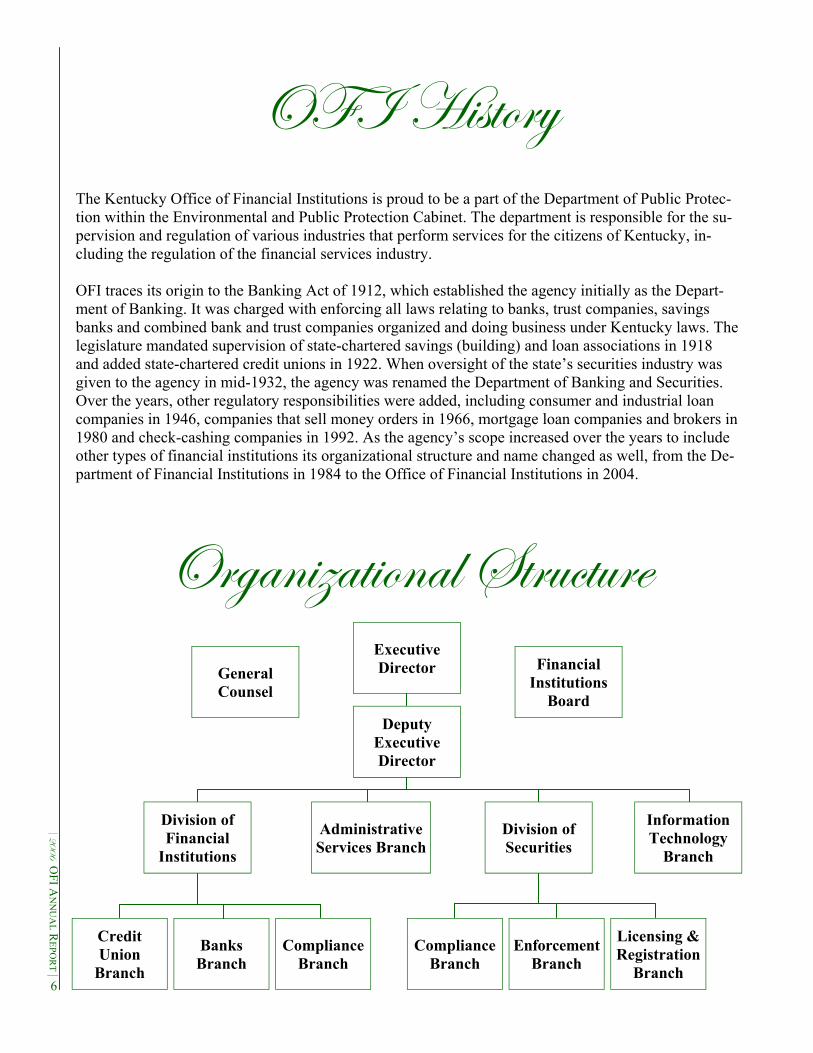
The Kentucky Office of Financial Institutions is proud to be a part of the Department of Public Protec-tion within the Environmental and Public Protection Cabinet. The department is responsible for the su-pervision and regulation of various industries that perform services for the citizens of Kentucky, in-cluding the regulation of the financial services industry. OFI traces its origin to the Banking Act of 1912, which established the agency initially as the Depart-ment of Banking. It was charged with enforcing all laws relating to banks, trust companies, savings banks and combined bank and trust companies organized and doing business under Kentucky laws. The legislature mandated supervision of state-chartered savings (building) and loan associations in 1918 and added state-chartered credit unions in 1922. When oversight of the state’s securities industry was given to the agency in mid-1932, the agency was renamed the Department of Banking and Securities. Over the years, other regulatory responsibilities were added, including consumer and industrial loan companies in 1946, companies that sell money orders in 1966, mortgage loan companies and brokers in 1980 and check-cashing companies in 1992. As the agency’s scope increased over the years to include other types of financial institutions its organizational structure and name changed as well, from the De-partment of Financial Institutions in 1984 to the Office of Financial Institutions in 2004.
6
Deputy Executive Director
Executive Director
Division of Financial
Institutions
Division of Securities
Administrative Services Branch
Information Technology
Branch
Compliance Branch
General Counsel
Banks Branch
Credit Union
Branch
Compliance Branch
Enforcement Branch
Licensing & Registration
Branch
Financial Institutions
Board
Y|ÇtÇv|tÄ \Çáà|àâà|ÉÇá UÉtÜw
ê
ECCI
OFI
AN
NU
AL
REP
OR
T |
The Financial Institutions Board is a statutory body that serves in an advisory capacity to the governor and the executive director of the Office of Financial Institutions. The board consists of representatives of all segments of Kentucky’s financial industry and the public at large and is chaired by the executive director. The definition of the board’s duties can be found in KRS 286.1-013.
7
byy|vx Éy Y|ÇtÇv|tÄ \Çáà|àâà|ÉÇá Cordell G. Lawrence 1025 Capital Center Drive, Suite 200 Frankfort, KY 40601 UtÇ~|Çz \ÇwâáàÜç John H. Booher 2173 Antiqua Drive, Lexington, KY 40509 Appointed Nov. 10, 2003 Term Expires Oct. 10, 2007 Whitney Taylor Greer-Stokes 96 Hart Church Road, London, KY 40744 Appointed Sept. 22, 2005 Term Expires Oct. 10, 2008 William David Michael P.O. Box 1062, Louisa, KY 41230 Appointed Feb. 28, 2005 Term Expires Oct. 10, 2008 Mindi F. Whitworth 6465 Barberry Drive, Paducah, KY 42001 Reappointed Nov. 10, 2003 Term Expires Oct. 10, 2007 Christopher Lee Wooldridge P.O. Box 1862, 1857 State Route 94 West Murray, KY 42071 Appointed March 14, 2006 Term Expires Oct. 10, 2008
VÉÇáâÅxÜ Y|ÇtÇvx Robert I. Stafford Jr. 200 Blossom Hill Drive, Corbin, KY 40741 Appointed Oct. 9, 2006 Term Expires Oct. 10, 2010 VÜxw|à hÇ|ÉÇ exÑÜxáxÇàtà|äx Alla Sue Holland 609 Fincastle Lane, Fort Wright, KY 41017 Appointed Oct. 9, 2006 Term Expires Oct. 10, 2010 câuÄ|v tà _tÜzx Monti Rhea Collins 205 E. 21st, Benton, KY 42025 Appointed Dec. 5, 2005 Term Expires Oct. 10, 2009 Jack Martin Goins 2163 Bahama Drive, Lexington, KY 40509 Appointed Oct. 17, 2006 Term Expires Oct. 10, 2008 William Edward Hesch 117 Beechwood Road, Fort Mitchell, KY 41017 Appointed Dec. 5, 2005 Term Expires Oct. 10, 2009 fxvâÜ|à|xá \ÇwâáàÜç Pete Mahurin 1419 Euclid, Bowling Green, KY 42101 Appointed Nov. 10, 2003 Term Expires Oct. 10, 2007

TwÅ|Ç|áàÜtà|äx fxÜä|vxá UÜtÇv{
ê ECCI OFI A
NN
UA
L REPO
RT | ,
Employees in the Administrative Services Branch provide administrative support to the office in the following areas: • Facilities management: Frankfort office and field offices in Eddyville, Bowling Green, Louisville
and Lexington. • Fiscal management. • Operations and quality control. • Records management. • Agency publications. • Staff development: coordinating employee training, continuing education and examiner certifica-
tion programs. A primary agency goal is to hire, train and maintain a highly informed and capable staff. One of the ways the office seeks to accomplish this goal is through staff development by identifying training needs, developing and delivering agency specific training, coordinating and/or sharing training and education resources with other state and federal agencies, and assuring equal access to continuing education and training opportunities for all em-ployees. Through continued innovation and open communication, the office is hopeful its past accomplishments will carry forward into the future and en-able this agency to become second to none in terms of staff development through training, continuing education and career development opportuni-ties. In addition to staff training, the Administrative Services Branch continues to coordinate and support the agency’s efforts to inform/educate consumers, legislators and industry representatives. The Administra-tive Services Branch also is instrumental in developing and publishing several informational brochures and distributing copies of its annual report to the state’s public libraries and senior citizens’ centers across the commonwealth. Staff members from throughout the agency continue to enhance the agency’s visibility by participating in public education forums, town meetings and industry association meetings. The office’s presence at career days and job fairs was increased during 2006 as administrative services staff visited high schools and colleges in Kentucky and spoke with students about job opportunities. As it has for many years, the office maintains a toll-free telephone number, and consumers and industry representatives wanting to speak with a member of the agency’s staff are encouraged to call 800-223-2579 with their questions and concerns. Information for consumers, regulated industries and the gen-eral public also is available on the office’s Web site at www.kfi.ky.gov. Business hours are from 8 a.m. to 5 p.m. Eastern time at our central office located at 1025 Capital Center Drive, Suite 200, Frank-fort, KY 40601.
8
W|ä|á|ÉÇ Éy Y|ÇtÇv|tÄ \Çáà|àâà|ÉÇá
ê
ECCI
OFI
AN
NU
AL
REP
OR
T |
The Division of Financial Institutions was created by Executive Order reorganizing the agency, effec-tive June 12, 1997. The division is responsible for licensing, chartering and regulating the activities of state-chartered/licensed depository and non-depository financial institutions. The division’s duties are strategically divided among three branches: Bank, Credit Union and Compliance.
94TH ANNUAL BANK AND THRIFT REPORT
The primary duties of the Bank Branch include chartering and regulating 162 state-chartered commer-cial banks, five independent trust companies, and numerous bank trust departments, bank holding com-panies and electronic data processors. As of Dec. 31, 2006, the banks held in aggregate of approxi-mately $37 billion in assets.
Banks in general flourished financially in 2006 as the state and national economy continued to im-prove. No banks failed and the number of problem banks continued to decrease. Problem banks contin-ued to be characterized by weak management, poor underwriting and lack of effective board oversight. Successful banks continue to be the institutions with the most effective risk management systems. The agency’s examination focus continued to be concentrated on fundamental banking principles relating to lending, investing, management quality, earnings and capital.
The condition of Kentucky state banks remained relatively stable in 2006 in terms of financial performance. Through Dec. 31, 2006, they realized a return on assets (ROA) of 1.20 percent compared to 1.24 percent in 2005. Net charge-offs to loans and leases fell to 0.18 per-cent from 0.24 percent in 2005. Earnings gains slowed in 2006 with only 46 percent of the banks reporting increases over the previous year as compared to 2005, when almost 72 percent of the banks re-ported earnings gains. The levels of nonperforming loans declined in 2006, indicating improvement in asset quality. At 9.79 percent, the core capital (leverage) ratio remained strong. There were 58 written consumer complaints against state-chartered banks in 2006 versus 68 in 2005. Three de novo bank applications and one trust company application were processed in 2006. In addition, one national bank converted to a
state-chartered institution. De novo charter activity is continuing to increase as the economy continues to improve.
All Bank Branch personnel are provided with a comprehensive training program that involves at least one week of training each year. Training includes the areas of lending, operations, e-banking, trust, bank secrecy and asset/liability management. Many of the examiners have completed or are attending one of the graduate schools of banking or trust.
9
fàtàx UtÇ~á tÇw g{Ü|yàá
ê ECCI OFI A
NN
UA
L REPO
RT | ,
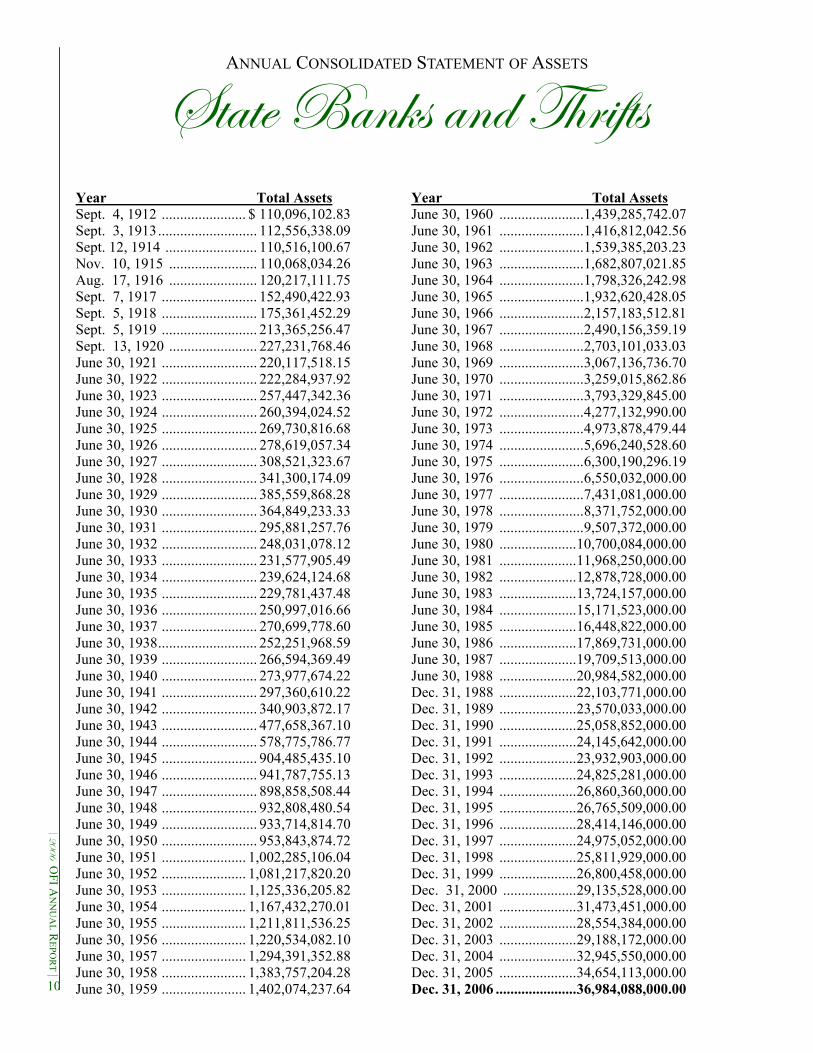
ANNUAL CONSOLIDATED STATEMENT OF ASSETS
Year Total Assets Sept. 4, 1912 ....................... $ 110,096,102.83 Sept. 3, 1913........................... 112,556,338.09 Sept. 12, 1914 ......................... 110,516,100.67 Nov. 10, 1915 ........................ 110,068,034.26 Aug. 17, 1916 ........................ 120,217,111.75 Sept. 7, 1917 .......................... 152,490,422.93 Sept. 5, 1918 .......................... 175,361,452.29 Sept. 5, 1919 .......................... 213,365,256.47 Sept. 13, 1920 ........................ 227,231,768.46 June 30, 1921 .......................... 220,117,518.15 June 30, 1922 .......................... 222,284,937.92 June 30, 1923 .......................... 257,447,342.36 June 30, 1924 .......................... 260,394,024.52 June 30, 1925 .......................... 269,730,816.68 June 30, 1926 .......................... 278,619,057.34 June 30, 1927 .......................... 308,521,323.67 June 30, 1928 .......................... 341,300,174.09 June 30, 1929 .......................... 385,559,868.28 June 30, 1930 .......................... 364,849,233.33 June 30, 1931 .......................... 295,881,257.76 June 30, 1932 .......................... 248,031,078.12 June 30, 1933 .......................... 231,577,905.49 June 30, 1934 .......................... 239,624,124.68 June 30, 1935 .......................... 229,781,437.48 June 30, 1936 .......................... 250,997,016.66 June 30, 1937 .......................... 270,699,778.60 June 30, 1938........................... 252,251,968.59 June 30, 1939 .......................... 266,594,369.49 June 30, 1940 .......................... 273,977,674.22 June 30, 1941 .......................... 297,360,610.22 June 30, 1942 .......................... 340,903,872.17 June 30, 1943 .......................... 477,658,367.10 June 30, 1944 .......................... 578,775,786.77 June 30, 1945 .......................... 904,485,435.10 June 30, 1946 .......................... 941,787,755.13 June 30, 1947 .......................... 898,858,508.44 June 30, 1948 .......................... 932,808,480.54 June 30, 1949 .......................... 933,714,814.70 June 30, 1950 .......................... 953,843,874.72 June 30, 1951 ....................... 1,002,285,106.04 June 30, 1952 ....................... 1,081,217,820.20 June 30, 1953 ....................... 1,125,336,205.82 June 30, 1954 ....................... 1,167,432,270.01 June 30, 1955 ....................... 1,211,811,536.25 June 30, 1956 ....................... 1,220,534,082.10 June 30, 1957 ....................... 1,294,391,352.88 June 30, 1958 ....................... 1,383,757,204.28 June 30, 1959 ....................... 1,402,074,237.64
Year Total Assets June 30, 1960 .......................1,439,285,742.07 June 30, 1961 .......................1,416,812,042.56 June 30, 1962 .......................1,539,385,203.23 June 30, 1963 .......................1,682,807,021.85 June 30, 1964 .......................1,798,326,242.98 June 30, 1965 .......................1,932,620,428.05 June 30, 1966 .......................2,157,183,512.81 June 30, 1967 .......................2,490,156,359.19 June 30, 1968 .......................2,703,101,033.03 June 30, 1969 .......................3,067,136,736.70 June 30, 1970 .......................3,259,015,862.86 June 30, 1971 .......................3,793,329,845.00 June 30, 1972 .......................4,277,132,990.00 June 30, 1973 .......................4,973,878,479.44 June 30, 1974 .......................5,696,240,528.60 June 30, 1975 .......................6,300,190,296.19 June 30, 1976 .......................6,550,032,000.00 June 30, 1977 .......................7,431,081,000.00 June 30, 1978 .......................8,371,752,000.00 June 30, 1979 .......................9,507,372,000.00 June 30, 1980 .....................10,700,084,000.00 June 30, 1981 .....................11,968,250,000.00 June 30, 1982 .....................12,878,728,000.00 June 30, 1983 .....................13,724,157,000.00 June 30, 1984 .....................15,171,523,000.00 June 30, 1985 .....................16,448,822,000.00 June 30, 1986 .....................17,869,731,000.00 June 30, 1987 .....................19,709,513,000.00 June 30, 1988 .....................20,984,582,000.00 Dec. 31, 1988 .....................22,103,771,000.00 Dec. 31, 1989 .....................23,570,033,000.00 Dec. 31, 1990 .....................25,058,852,000.00 Dec. 31, 1991 .....................24,145,642,000.00 Dec. 31, 1992 .....................23,932,903,000.00 Dec. 31, 1993 .....................24,825,281,000.00 Dec. 31, 1994 .....................26,860,360,000.00 Dec. 31, 1995 .....................26,765,509,000.00 Dec. 31, 1996 .....................28,414,146,000.00 Dec. 31, 1997 .....................24,975,052,000.00 Dec. 31, 1998 .....................25,811,929,000.00 Dec. 31, 1999 .....................26,800,458,000.00 Dec. 31, 2000 ....................29,135,528,000.00 Dec. 31, 2001 .....................31,473,451,000.00 Dec. 31, 2002 .....................28,554,384,000.00 Dec. 31, 2003 .....................29,188,172,000.00 Dec. 31, 2004 .....................32,945,550,000.00 Dec. 31, 2005 .....................34,654,113,000.00 Dec. 31, 2006 ......................36,984,088,000.00 10
fàtàx UtÇ~á tÇw g{Ü|yàá
ê
ECCI
OFI
AN
NU
AL
REP
OR
T |
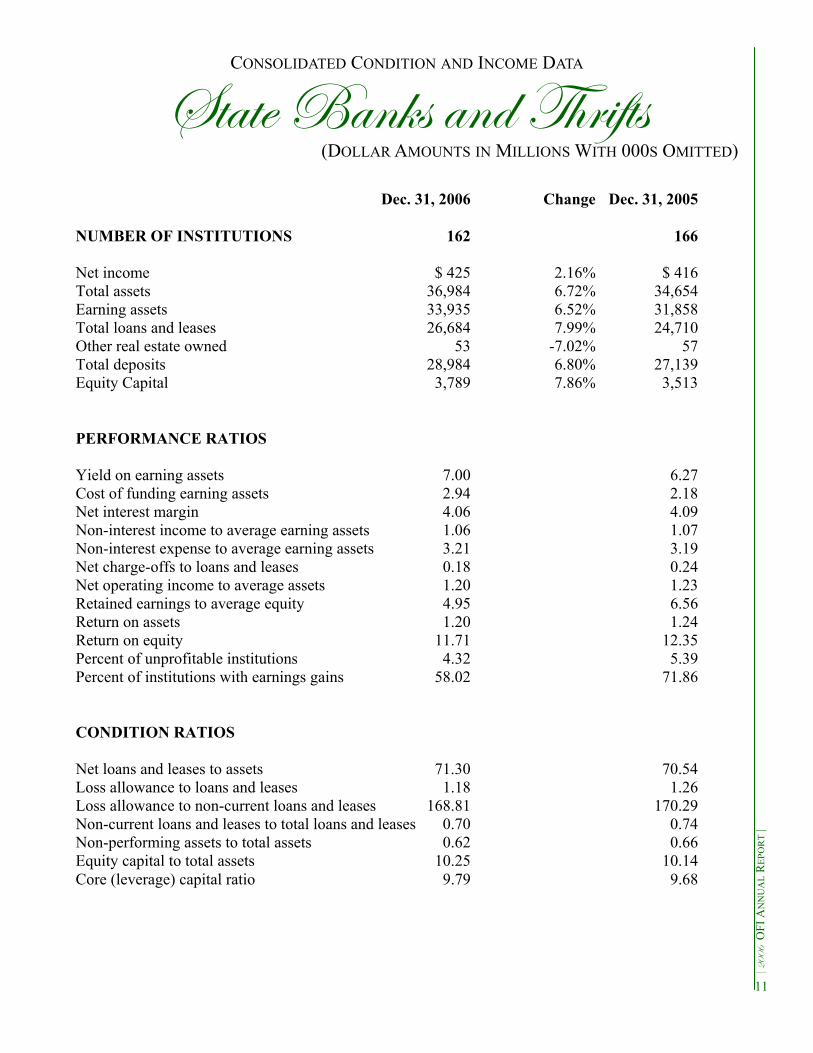
CONSOLIDATED CONDITION AND INCOME DATA
(DOLLAR AMOUNTS IN MILLIONS WITH 000S OMITTED)
Dec. 31, 2006 Change Dec. 31, 2005
NUMBER OF INSTITUTIONS 162 166
Net income $ 425 2.16% $ 416 Total assets 36,984 6.72% 34,654 Earning assets 33,935 6.52% 31,858 Total loans and leases 26,684 7.99% 24,710 Other real estate owned 53 -7.02% 57 Total deposits 28,984 6.80% 27,139 Equity Capital 3,789 7.86% 3,513
PERFORMANCE RATIOS
Yield on earning assets 7.00 6.27 Cost of funding earning assets 2.94 2.18 Net interest margin 4.06 4.09 Non-interest income to average earning assets 1.06 1.07 Non-interest expense to average earning assets 3.21 3.19 Net charge-offs to loans and leases 0.18 0.24 Net operating income to average assets 1.20 1.23 Retained earnings to average equity 4.95 6.56 Return on assets 1.20 1.24 Return on equity 11.71 12.35 Percent of unprofitable institutions 4.32 5.39 Percent of institutions with earnings gains 58.02 71.86
CONDITION RATIOS Net loans and leases to assets 71.30 70.54 Loss allowance to loans and leases 1.18 1.26 Loss allowance to non-current loans and leases 168.81 170.29 Non-current loans and leases to total loans and leases 0.70 0.74 Non-performing assets to total assets 0.62 0.66 Equity capital to total assets 10.25 10.14 Core (leverage) capital ratio 9.79 9.68
11
fàtàx UtÇ~á tÇw g{Ü|yàá
ê ECCI OFI A
NN
UA
L REPO
RT | ,
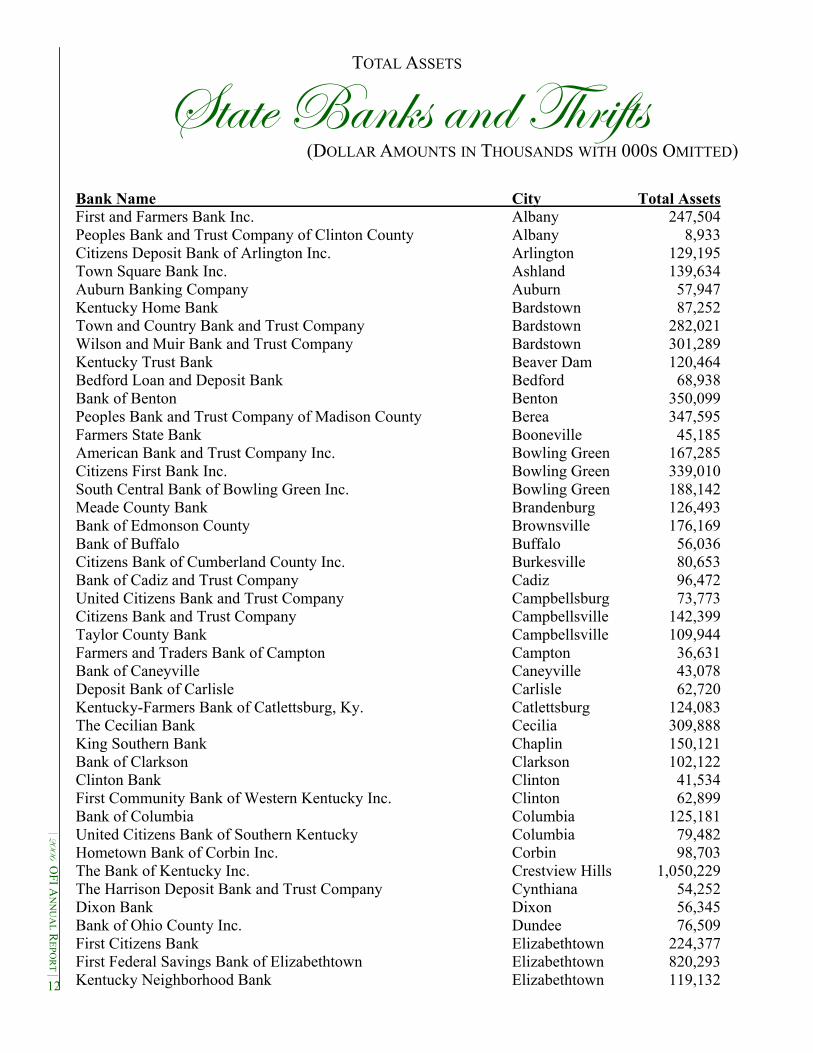
TOTAL ASSETS
(DOLLAR AMOUNTS IN THOUSANDS WITH 000S OMITTED)
Bank Name City Total Assets First and Farmers Bank Inc. Albany 247,504 Peoples Bank and Trust Company of Clinton County Albany 8,933 Citizens Deposit Bank of Arlington Inc. Arlington 129,195 Town Square Bank Inc. Ashland 139,634 Auburn Banking Company Auburn 57,947 Kentucky Home Bank Bardstown 87,252 Town and Country Bank and Trust Company Bardstown 282,021 Wilson and Muir Bank and Trust Company Bardstown 301,289 Kentucky Trust Bank Beaver Dam 120,464 Bedford Loan and Deposit Bank Bedford 68,938 Bank of Benton Benton 350,099 Peoples Bank and Trust Company of Madison County Berea 347,595 Farmers State Bank Booneville 45,185 American Bank and Trust Company Inc. Bowling Green 167,285 Citizens First Bank Inc. Bowling Green 339,010 South Central Bank of Bowling Green Inc. Bowling Green 188,142 Meade County Bank Brandenburg 126,493 Bank of Edmonson County Brownsville 176,169 Bank of Buffalo Buffalo 56,036 Citizens Bank of Cumberland County Inc. Burkesville 80,653 Bank of Cadiz and Trust Company Cadiz 96,472 United Citizens Bank and Trust Company Campbellsburg 73,773 Citizens Bank and Trust Company Campbellsville 142,399 Taylor County Bank Campbellsville 109,944 Farmers and Traders Bank of Campton Campton 36,631 Bank of Caneyville Caneyville 43,078 Deposit Bank of Carlisle Carlisle 62,720 Kentucky-Farmers Bank of Catlettsburg, Ky. Catlettsburg 124,083 The Cecilian Bank Cecilia 309,888 King Southern Bank Chaplin 150,121 Bank of Clarkson Clarkson 102,122 Clinton Bank Clinton 41,534 First Community Bank of Western Kentucky Inc. Clinton 62,899 Bank of Columbia Columbia 125,181 United Citizens Bank of Southern Kentucky Columbia 79,482 Hometown Bank of Corbin Inc. Corbin 98,703 The Bank of Kentucky Inc. Crestview Hills 1,050,229 The Harrison Deposit Bank and Trust Company Cynthiana 54,252 Dixon Bank Dixon 56,345 Bank of Ohio County Inc. Dundee 76,509 First Citizens Bank Elizabethtown 224,377 First Federal Savings Bank of Elizabethtown Elizabethtown 820,293 Kentucky Neighborhood Bank Elizabethtown 119,132 12
fàtàx UtÇ~á tÇw g{Ü|yàá
ê
ECCI
OFI
AN
NU
AL
REP
OR
T |
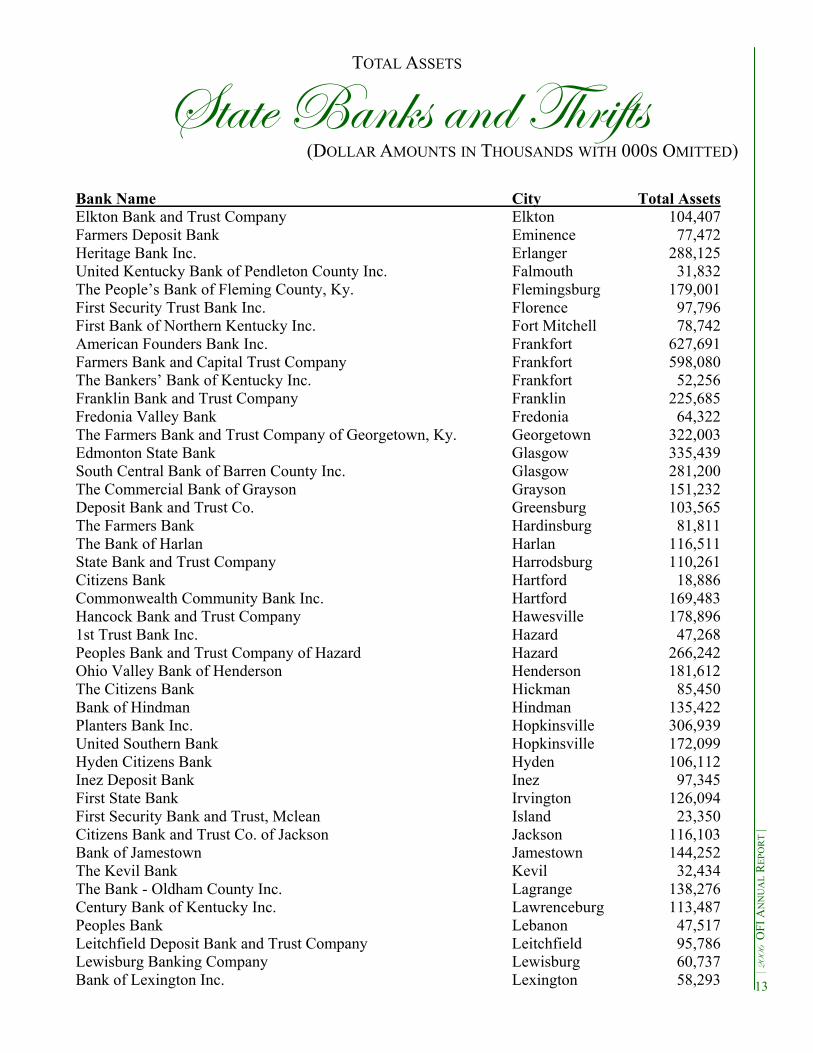
TOTAL ASSETS
(DOLLAR AMOUNTS IN THOUSANDS WITH 000S OMITTED)
Bank Name City Total Assets Elkton Bank and Trust Company Elkton 104,407 Farmers Deposit Bank Eminence 77,472 Heritage Bank Inc. Erlanger 288,125 United Kentucky Bank of Pendleton County Inc. Falmouth 31,832 The People’s Bank of Fleming County, Ky. Flemingsburg 179,001 First Security Trust Bank Inc. Florence 97,796 First Bank of Northern Kentucky Inc. Fort Mitchell 78,742 American Founders Bank Inc. Frankfort 627,691 Farmers Bank and Capital Trust Company Frankfort 598,080 The Bankers’ Bank of Kentucky Inc. Frankfort 52,256 Franklin Bank and Trust Company Franklin 225,685 Fredonia Valley Bank Fredonia 64,322 The Farmers Bank and Trust Company of Georgetown, Ky. Georgetown 322,003 Edmonton State Bank Glasgow 335,439 South Central Bank of Barren County Inc. Glasgow 281,200 The Commercial Bank of Grayson Grayson 151,232 Deposit Bank and Trust Co. Greensburg 103,565 The Farmers Bank Hardinsburg 81,811 The Bank of Harlan Harlan 116,511 State Bank and Trust Company Harrodsburg 110,261 Citizens Bank Hartford 18,886 Commonwealth Community Bank Inc. Hartford 169,483 Hancock Bank and Trust Company Hawesville 178,896 1st Trust Bank Inc. Hazard 47,268 Peoples Bank and Trust Company of Hazard Hazard 266,242 Ohio Valley Bank of Henderson Henderson 181,612 The Citizens Bank Hickman 85,450 Bank of Hindman Hindman 135,422 Planters Bank Inc. Hopkinsville 306,939 United Southern Bank Hopkinsville 172,099 Hyden Citizens Bank Hyden 106,112 Inez Deposit Bank Inez 97,345 First State Bank Irvington 126,094 First Security Bank and Trust, Mclean Island 23,350 Citizens Bank and Trust Co. of Jackson Jackson 116,103 Bank of Jamestown Jamestown 144,252 The Kevil Bank Kevil 32,434 The Bank - Oldham County Inc. Lagrange 138,276 Century Bank of Kentucky Inc. Lawrenceburg 113,487 Peoples Bank Lebanon 47,517 Leitchfield Deposit Bank and Trust Company Leitchfield 95,786 Lewisburg Banking Company Lewisburg 60,737 Bank of Lexington Inc. Lexington 58,293 13
fàtàx UtÇ~á tÇw g{Ü|yàá
ê ECCI OFI A
NN
UA
L REPO
RT | ,
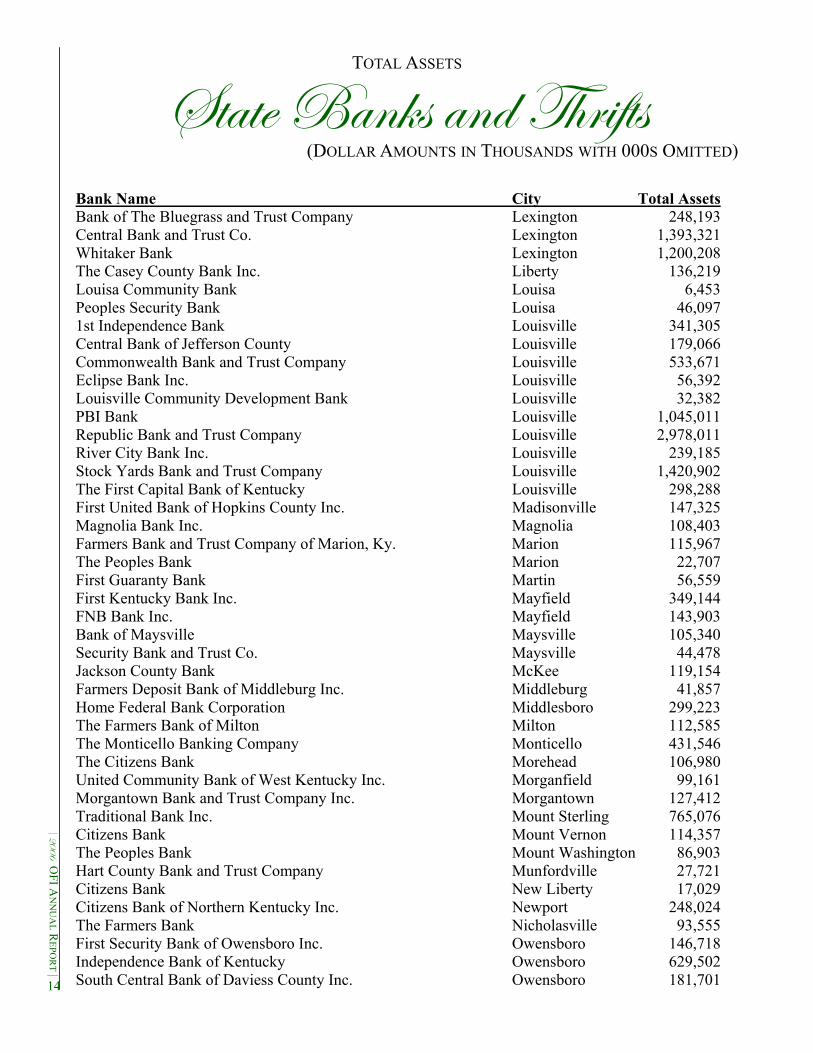
TOTAL ASSETS
(DOLLAR AMOUNTS IN THOUSANDS WITH 000S OMITTED)
Bank Name City Total Assets Bank of The Bluegrass and Trust Company Lexington 248,193 Central Bank and Trust Co. Lexington 1,393,321 Whitaker Bank Lexington 1,200,208 The Casey County Bank Inc. Liberty 136,219 Louisa Community Bank Louisa 6,453 Peoples Security Bank Louisa 46,097 1st Independence Bank Louisville 341,305 Central Bank of Jefferson County Louisville 179,066 Commonwealth Bank and Trust Company Louisville 533,671 Eclipse Bank Inc. Louisville 56,392 Louisville Community Development Bank Louisville 32,382 PBI Bank Louisville 1,045,011 Republic Bank and Trust Company Louisville 2,978,011 River City Bank Inc. Louisville 239,185 Stock Yards Bank and Trust Company Louisville 1,420,902 The First Capital Bank of Kentucky Louisville 298,288 First United Bank of Hopkins County Inc. Madisonville 147,325 Magnolia Bank Inc. Magnolia 108,403 Farmers Bank and Trust Company of Marion, Ky. Marion 115,967 The Peoples Bank Marion 22,707 First Guaranty Bank Martin 56,559 First Kentucky Bank Inc. Mayfield 349,144 FNB Bank Inc. Mayfield 143,903 Bank of Maysville Maysville 105,340 Security Bank and Trust Co. Maysville 44,478 Jackson County Bank McKee 119,154 Farmers Deposit Bank of Middleburg Inc. Middleburg 41,857 Home Federal Bank Corporation Middlesboro 299,223 The Farmers Bank of Milton Milton 112,585 The Monticello Banking Company Monticello 431,546 The Citizens Bank Morehead 106,980 United Community Bank of West Kentucky Inc. Morganfield 99,161 Morgantown Bank and Trust Company Inc. Morgantown 127,412 Traditional Bank Inc. Mount Sterling 765,076 Citizens Bank Mount Vernon 114,357 The Peoples Bank Mount Washington 86,903 Hart County Bank and Trust Company Munfordville 27,721 Citizens Bank New Liberty 17,029 Citizens Bank of Northern Kentucky Inc. Newport 248,024 The Farmers Bank Nicholasville 93,555 First Security Bank of Owensboro Inc. Owensboro 146,718 Independence Bank of Kentucky Owensboro 629,502 South Central Bank of Daviess County Inc. Owensboro 181,701 14
fàtàx UtÇ~á tÇw g{Ü|yàá
ê
ECCI
OFI
AN
NU
AL
REP
OR
T |
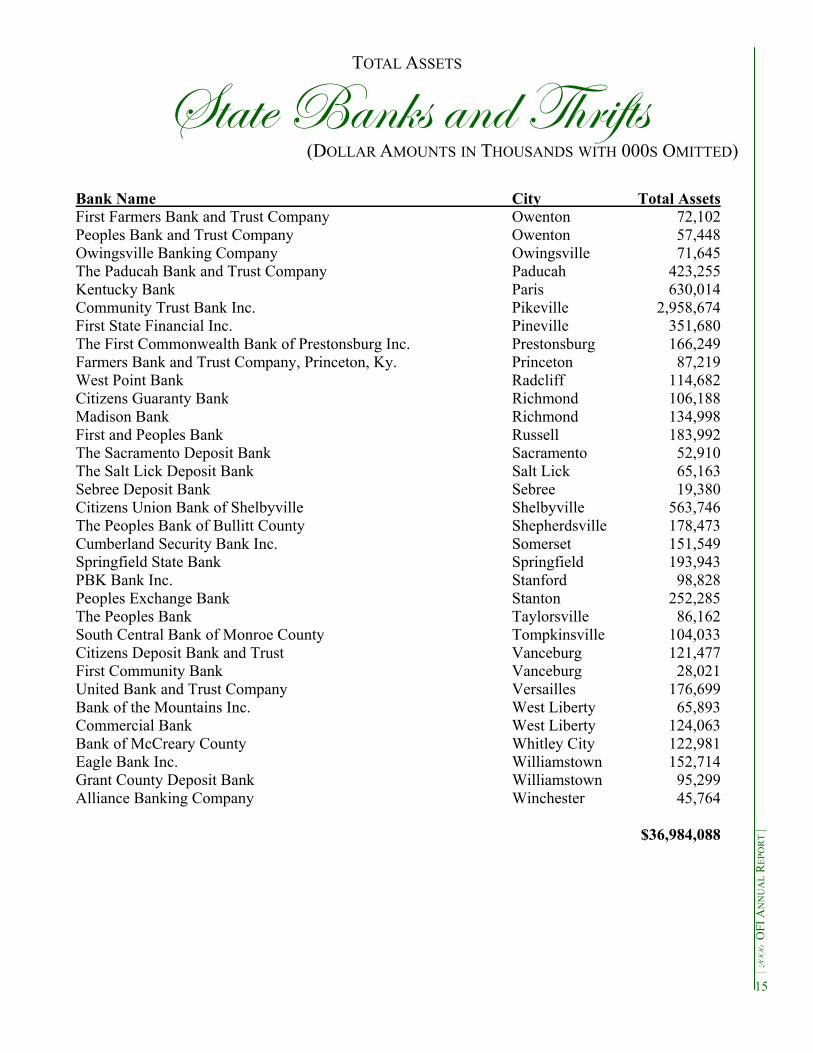
TOTAL ASSETS
(DOLLAR AMOUNTS IN THOUSANDS WITH 000S OMITTED)
Bank Name City Total Assets First Farmers Bank and Trust Company Owenton 72,102 Peoples Bank and Trust Company Owenton 57,448 Owingsville Banking Company Owingsville 71,645 The Paducah Bank and Trust Company Paducah 423,255 Kentucky Bank Paris 630,014 Community Trust Bank Inc. Pikeville 2,958,674 First State Financial Inc. Pineville 351,680 The First Commonwealth Bank of Prestonsburg Inc. Prestonsburg 166,249 Farmers Bank and Trust Company, Princeton, Ky. Princeton 87,219 West Point Bank Radcliff 114,682 Citizens Guaranty Bank Richmond 106,188 Madison Bank Richmond 134,998 First and Peoples Bank Russell 183,992 The Sacramento Deposit Bank Sacramento 52,910 The Salt Lick Deposit Bank Salt Lick 65,163 Sebree Deposit Bank Sebree 19,380 Citizens Union Bank of Shelbyville Shelbyville 563,746 The Peoples Bank of Bullitt County Shepherdsville 178,473 Cumberland Security Bank Inc. Somerset 151,549 Springfield State Bank Springfield 193,943 PBK Bank Inc. Stanford 98,828 Peoples Exchange Bank Stanton 252,285 The Peoples Bank Taylorsville 86,162 South Central Bank of Monroe County Tompkinsville 104,033 Citizens Deposit Bank and Trust Vanceburg 121,477 First Community Bank Vanceburg 28,021 United Bank and Trust Company Versailles 176,699 Bank of the Mountains Inc. West Liberty 65,893 Commercial Bank West Liberty 124,063 Bank of McCreary County Whitley City 122,981 Eagle Bank Inc. Williamstown 152,714 Grant County Deposit Bank Williamstown 95,299 Alliance Banking Company Winchester 45,764 $36,984,088
15
ê ECCI OFI A
NN
UA
L REPO
RT | ,
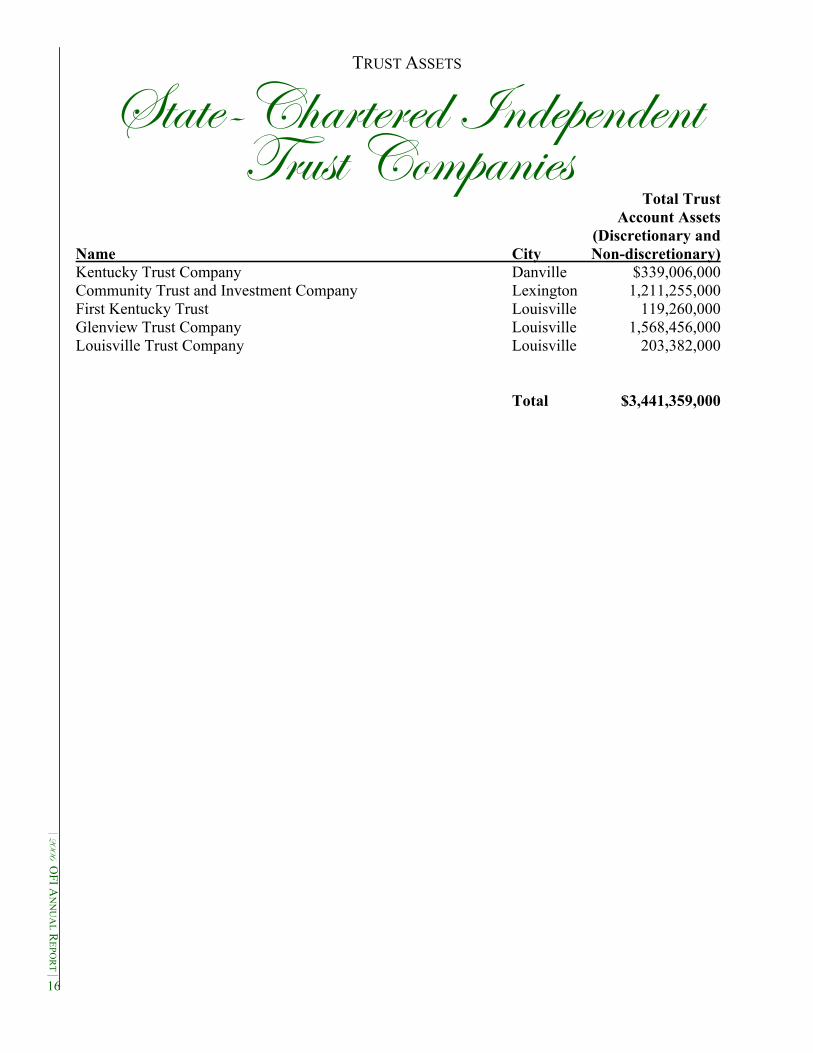
TRUST ASSETS
16
fàtàx@V{tÜàxÜxw \ÇwxÑxÇwxÇà gÜâáà VÉÅÑtÇ|xá
Total Trust Account Assets (Discretionary and Name City Non-discretionary) Kentucky Trust Company Danville $339,006,000 Community Trust and Investment Company Lexington 1,211,255,000 First Kentucky Trust Louisville 119,260,000 Glenview Trust Company Louisville 1,568,456,000 Louisville Trust Company Louisville 203,382,000 Total $3,441,359,000
fàtàx UtÇ~ gÜâáà WxÑtÜàÅxÇàá
ê
ECCI
OFI
AN
NU
AL
REP
OR
T |
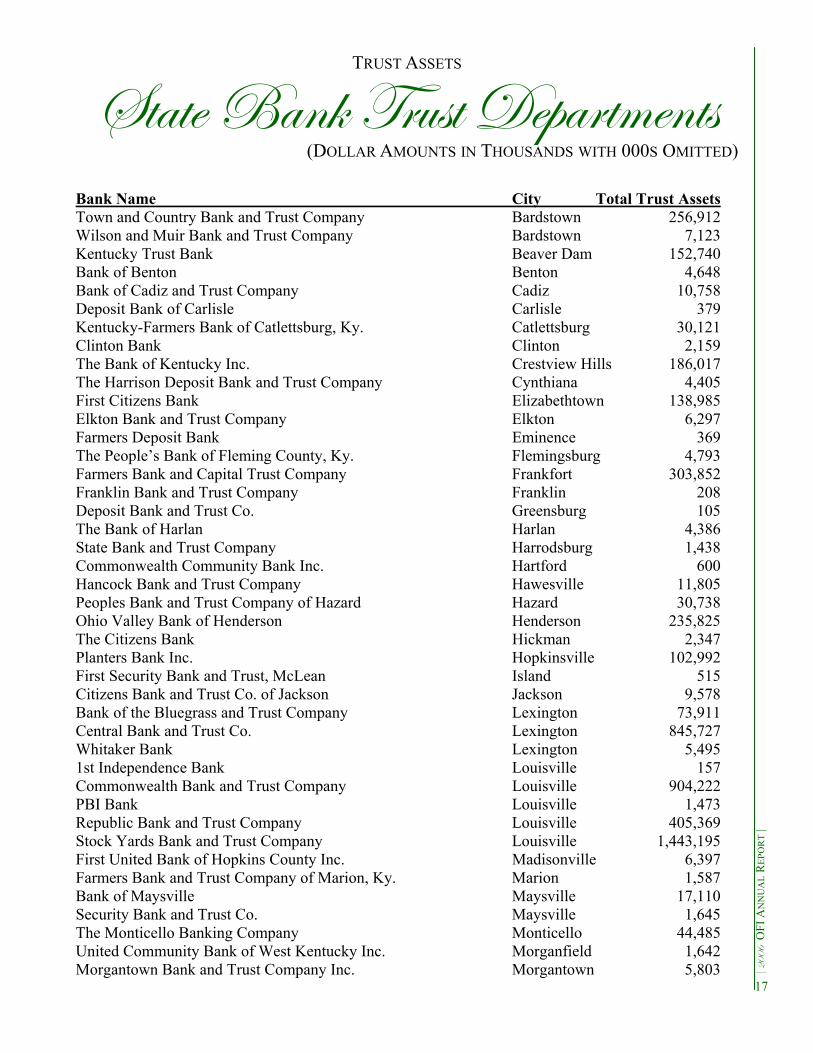
TRUST ASSETS
(DOLLAR AMOUNTS IN THOUSANDS WITH 000S OMITTED)
Bank Name City Total Trust Assets Town and Country Bank and Trust Company Bardstown 256,912 Wilson and Muir Bank and Trust Company Bardstown 7,123 Kentucky Trust Bank Beaver Dam 152,740 Bank of Benton Benton 4,648 Bank of Cadiz and Trust Company Cadiz 10,758 Deposit Bank of Carlisle Carlisle 379 Kentucky-Farmers Bank of Catlettsburg, Ky. Catlettsburg 30,121 Clinton Bank Clinton 2,159 The Bank of Kentucky Inc. Crestview Hills 186,017 The Harrison Deposit Bank and Trust Company Cynthiana 4,405 First Citizens Bank Elizabethtown 138,985 Elkton Bank and Trust Company Elkton 6,297 Farmers Deposit Bank Eminence 369 The People’s Bank of Fleming County, Ky. Flemingsburg 4,793 Farmers Bank and Capital Trust Company Frankfort 303,852 Franklin Bank and Trust Company Franklin 208 Deposit Bank and Trust Co. Greensburg 105 The Bank of Harlan Harlan 4,386 State Bank and Trust Company Harrodsburg 1,438 Commonwealth Community Bank Inc. Hartford 600 Hancock Bank and Trust Company Hawesville 11,805 Peoples Bank and Trust Company of Hazard Hazard 30,738 Ohio Valley Bank of Henderson Henderson 235,825 The Citizens Bank Hickman 2,347 Planters Bank Inc. Hopkinsville 102,992 First Security Bank and Trust, McLean Island 515 Citizens Bank and Trust Co. of Jackson Jackson 9,578 Bank of the Bluegrass and Trust Company Lexington 73,911 Central Bank and Trust Co. Lexington 845,727 Whitaker Bank Lexington 5,495 1st Independence Bank Louisville 157 Commonwealth Bank and Trust Company Louisville 904,222 PBI Bank Louisville 1,473 Republic Bank and Trust Company Louisville 405,369 Stock Yards Bank and Trust Company Louisville 1,443,195 First United Bank of Hopkins County Inc. Madisonville 6,397 Farmers Bank and Trust Company of Marion, Ky. Marion 1,587 Bank of Maysville Maysville 17,110 Security Bank and Trust Co. Maysville 1,645 The Monticello Banking Company Monticello 44,485 United Community Bank of West Kentucky Inc. Morganfield 1,642 Morgantown Bank and Trust Company Inc. Morgantown 5,803
17
ê ECCI OFI A
NN
UA
L REPO
RT | ,
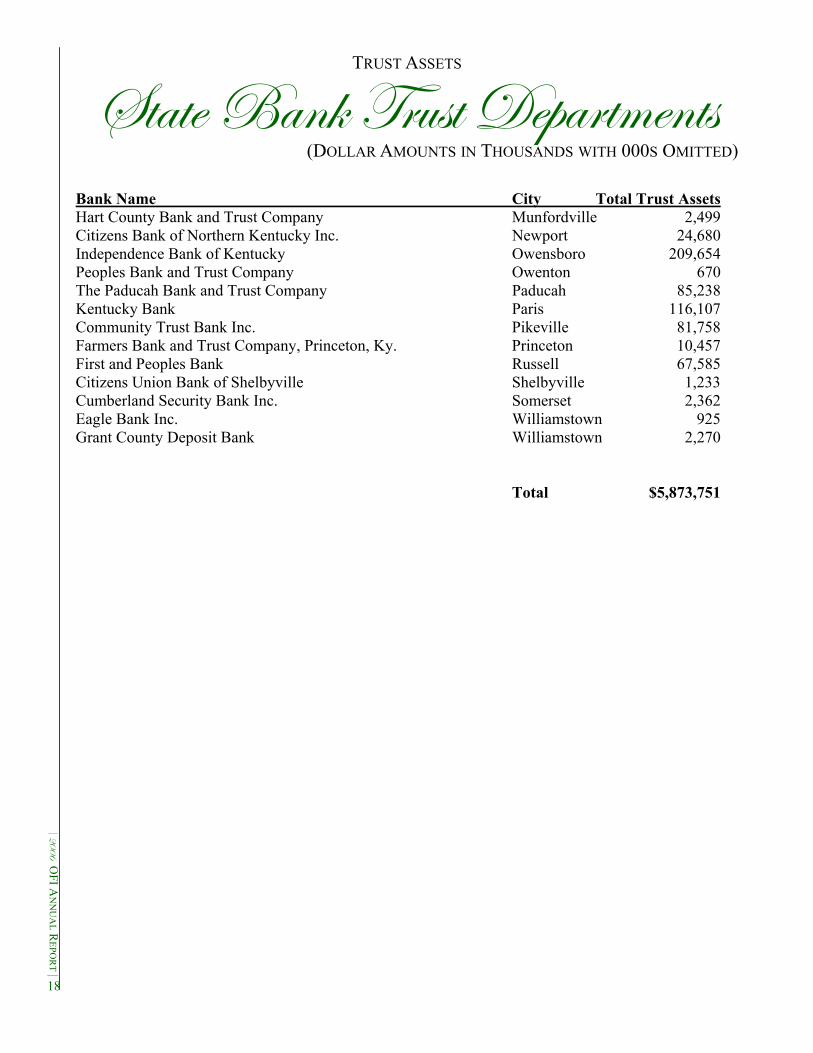
Bank Name City Total Trust Assets Hart County Bank and Trust Company Munfordville 2,499 Citizens Bank of Northern Kentucky Inc. Newport 24,680 Independence Bank of Kentucky Owensboro 209,654 Peoples Bank and Trust Company Owenton 670 The Paducah Bank and Trust Company Paducah 85,238 Kentucky Bank Paris 116,107 Community Trust Bank Inc. Pikeville 81,758 Farmers Bank and Trust Company, Princeton, Ky. Princeton 10,457 First and Peoples Bank Russell 67,585 Citizens Union Bank of Shelbyville Shelbyville 1,233 Cumberland Security Bank Inc. Somerset 2,362 Eagle Bank Inc. Williamstown 925 Grant County Deposit Bank Williamstown 2,270 Total $5,873,751
18
fàtàx UtÇ~ gÜâáà WxÑtÜàÅxÇàá TRUST ASSETS
(DOLLAR AMOUNTS IN THOUSANDS WITH 000S OMITTED)

UtÇ~ V{tÇzxá ECCI
ê
ECCI
OFI
AN
NU
AL
REP
OR
T |
NEW BANK CHARTERS, BANK CONVERSIONS, NAME CHANGES AND MERGERS
Conversions 12/04/2006 Ohio Valley National Bank, Henderson, converted to a state bank charter. Name Change 1/17/2006 Central Bank USA Inc., Greensburg, changed its name to PBI Bank 12/04/2006 Ohio Valley National Bank, Henderson, changed its name to Ohio Valley Bank New Bank Charters 2/06/2006 Bank of Lexington Inc., Lexington 3/20/2006 Peoples Bank and Trust Company of Clinton County, Albany 8/07/2006 Louisa Community Bank, Louisa New Trust Charters 8/21/2006 First Kentucky Trust, Louisville Main Office Relocations 3/28/2006 PBI Bank, 202 North Main St., Greensburg, to 2500 Eastpoint Parkway, Louisville Mergers 1/17/2006 Bullitt County Bank, Shepherdsville, merged into Central Bank USA, Greensburg 1/17/2006 Ascencia Bank, Louisville, merged into Central Bank USA, Greensburg 1/17/2006 Brownsville Deposit Bank, Brownsville, merged into Central Bank USA, Greensburg 4/10/2006 First Security Bank of Lexington Inc., Lexington, merged into American Founders Bank Inc., Frankfort 4/18/2006 Heritage Bank of Ashland, Ashland, merged into Citizens National Corporation, Paintsville 5/11/2006 Peoples Bank, Morehead, merged into Kentucky Bank, Paris 10/20/2006 Bardwell Deposit Bank, Bardwell, merged into First Kentucky Bank Inc., Mayfield 11/30/2006 Kentucky Banking Centers Inc., Glasgow, merged into Citizens First Bank Inc., Bowling Green 19

VÜxw|à hÇ|ÉÇ UÜtÇv{
ê ECCI OFI A
NN
UA
L REPO
RT | ,
73rd ANNUAL CREDIT UNION BRANCH REPORT
The Credit Union Branch supervises the activities of 30 Kentucky state-chartered credit unions, rang-ing in asset size from $334,799 to $650,076,027. The total assets under supervision by the Credit Un-ion Branch are $1,304,569,417. Total asset growth was positive at 2.45 percent as compared to the pre-vious year’s -.03 percent.
The number of Kentucky state-chartered credit unions continues to decline due to mergers. The Office of Financial Institutions received two merger applications in 2006. Kenesco Credit Union merged into Members Choice Credit Union, and Members One Credit Union merged into Park Community Federal Credit Union. Kentucky state-chartered credit unions favored well during the year. Net worth growth exceeded asset growth for the third consecutive year. Several key ratios indicate noticeable improvement as the return on average assets ratio increased, while delinquency and net charge-offs declined.
The fixed rate real estate loan portfolio of credit unions is increasing. Of the loans granted this year, 15.32 percent were fixed-rate real estate loans, while negative loan growth was experienced in the used automo-bile lending area. The leasing program has not been successful and the balance of leases receivable contin-ues to dwindle.
20

fàtàx@V{tÜàxÜxw VÜxw|à hÇ|ÉÇá
ê
ECCI
OFI
AN
NU
AL
REP
OR
T |
ANNUAL CONSOLIDATED STATEMENT OF ASSETS
Year Total Assets June 30, 1934.................................. 391,943 June 30, 1935.................................. 725,535 June 30, 1936............................... 1,249,342 June 30, 1937............................... 1,660,520 June 30, 1938............................... 1,696,127 June 30, 1939............................... 2,057,015 June 30, 1941*............................. 3,146,257 June 30, 1942............................... 3,251,825 June 30, 1943............................... 2,982,267 June 30, 1944............................... 3,088,248 June 30, 1945............................... 3,505,257 June 30, 1946............................... 4,144,653 June 30, 1947............................... 4,995,675 June 30, 1948............................... 6,083,221 June 30, 1949............................... 7,107,044 June 30, 1950............................... 8,334,194 June 30, 1951............................... 8,179,622 June 30, 1952............................. 10,516,625 June 30, 1953............................. 12,623,784 June 30, 1954............................. 14,781,357 June 30, 1955............................. 16,702,656 June 30, 1956............................. 19,107,017 June 30, 1957............................. 21,437,514 June 30, 1958............................. 23,623,385 June 30, 1959............................. 26,447,334 June 30, 1960............................. 27,979,449 June 30, 1961............................. 29,357,256 June 30, 1962............................. 31,739,280 June 30, 1963............................. 34,501,791 June 30, 1964............................. 39,301,082 June 30, 1965............................. 43,391,089 June 30, 1966............................. 46,430,845 June 30, 1967............................. 50,065,518 June 30, 1968............................. 53,669,699 June 30, 1969............................. 58,409,409 June 30, 1970............................. 64,297,546 June 30, 1971............................. 71,728,169 June 30, 1972............................. 81,246,995 June 30, 1973............................. 91,221,819 June 30, 1974........................... 100,937,750 June 30, 1975........................... 113,438,105 June 30, 1976........................... 129,079,696 June 30, 1977........................... 147,094,455 June 30, 1978........................... 169,281,627 June 30, 1979........................... 176,261,333 June 30, 1980........................... 170,888,349
Year Total Assets June 30, 1981 ...........................198,916,832 June 30, 1982 ...........................190,721,775 June 30, 1983 ...........................226,257,290 June 30, 1984 ...........................270,077,766 June 30, 1985 ...........................324,359,567 June 30, 1986 ...........................465,930,836 June 30, 1987 ...........................534,721,314 June 30, 1988 ...........................522,854,417 Dec. 31, 1988 ...........................486,976,000 Dec. 31, 1989 ...........................482,857,000 Dec. 31, 1990 ...........................509,758,691 Dec. 31, 1991 ...........................554,628,084 Dec. 31, 1992 ...........................610,893,902 Dec. 31, 1993 ...........................643,540,808 Dec. 31, 1994 ...........................670,077,079 Dec. 31, 1995 ...........................697,585,006 Dec. 31, 1996 ...........................726,727,477 Dec. 31, 1997 ...........................782,580,308 Dec. 31, 1998 ...........................855,559,615 Dec. 31, 1999 ...........................897,712,452 Dec. 31, 2000 ...........................957,541,750 Dec. 31, 2001 ........................1,081,872,980 Dec. 31, 2002 ........................1,157,171,468 Dec. 31, 2003 ........................1,246,656,550 Dec. 31, 2004 ........................1,273,660,697 Dec. 31, 2005 ........................1,273,328,540 Dec. 31, 2006 ..................... $1,304,569,417
21 * No records are available for 1940.
fàtàx@V{tÜàxÜxw VÜxw|à hÇ|ÉÇá
ê ECCI OFI A
NN
UA
L REPO
RT | ,
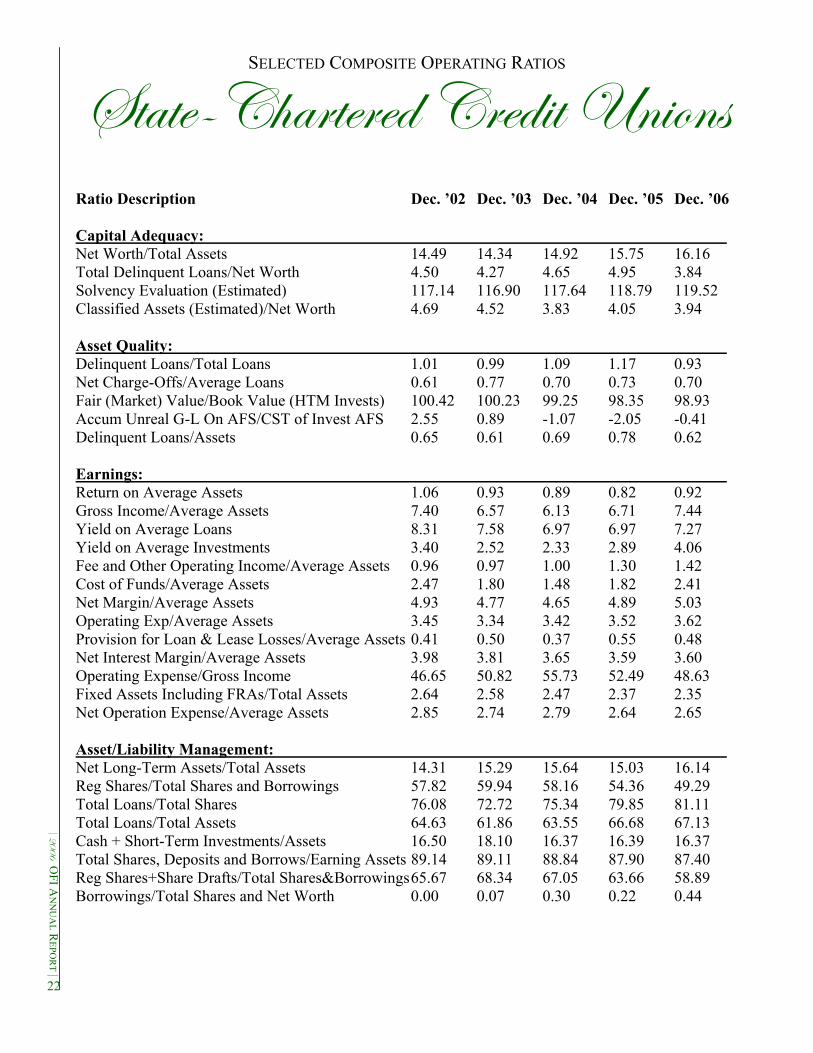
SELECTED COMPOSITE OPERATING RATIOS
Ratio Description Dec. ’02 Dec. ’03 Dec. ’04 Dec. ’05 Dec. ’06 Capital Adequacy: Net Worth/Total Assets 14.49 14.34 14.92 15.75 16.16 Total Delinquent Loans/Net Worth 4.50 4.27 4.65 4.95 3.84 Solvency Evaluation (Estimated) 117.14 116.90 117.64 118.79 119.52 Classified Assets (Estimated)/Net Worth 4.69 4.52 3.83 4.05 3.94 Asset Quality: Delinquent Loans/Total Loans 1.01 0.99 1.09 1.17 0.93 Net Charge-Offs/Average Loans 0.61 0.77 0.70 0.73 0.70 Fair (Market) Value/Book Value (HTM Invests) 100.42 100.23 99.25 98.35 98.93 Accum Unreal G-L On AFS/CST of Invest AFS 2.55 0.89 -1.07 -2.05 -0.41 Delinquent Loans/Assets 0.65 0.61 0.69 0.78 0.62 Earnings: Return on Average Assets 1.06 0.93 0.89 0.82 0.92 Gross Income/Average Assets 7.40 6.57 6.13 6.71 7.44 Yield on Average Loans 8.31 7.58 6.97 6.97 7.27 Yield on Average Investments 3.40 2.52 2.33 2.89 4.06 Fee and Other Operating Income/Average Assets 0.96 0.97 1.00 1.30 1.42 Cost of Funds/Average Assets 2.47 1.80 1.48 1.82 2.41 Net Margin/Average Assets 4.93 4.77 4.65 4.89 5.03 Operating Exp/Average Assets 3.45 3.34 3.42 3.52 3.62 Provision for Loan & Lease Losses/Average Assets 0.41 0.50 0.37 0.55 0.48 Net Interest Margin/Average Assets 3.98 3.81 3.65 3.59 3.60 Operating Expense/Gross Income 46.65 50.82 55.73 52.49 48.63 Fixed Assets Including FRAs/Total Assets 2.64 2.58 2.47 2.37 2.35 Net Operation Expense/Average Assets 2.85 2.74 2.79 2.64 2.65 Asset/Liability Management: Net Long-Term Assets/Total Assets 14.31 15.29 15.64 15.03 16.14 Reg Shares/Total Shares and Borrowings 57.82 59.94 58.16 54.36 49.29 Total Loans/Total Shares 76.08 72.72 75.34 79.85 81.11 Total Loans/Total Assets 64.63 61.86 63.55 66.68 67.13 Cash + Short-Term Investments/Assets 16.50 18.10 16.37 16.39 16.37 Total Shares, Deposits and Borrows/Earning Assets 89.14 89.11 88.84 87.90 87.40 Reg Shares+Share Drafts/Total Shares&Borrowings 65.67 68.34 67.05 63.66 58.89 Borrowings/Total Shares and Net Worth 0.00 0.07 0.30 0.22 0.44
22
fàtàx@V{tÜàxÜxw VÜxw|à hÇ|ÉÇá
ê
ECCI
OFI
AN
NU
AL
REP
OR
T |
SELECTED COMPOSITE OPERATING RATIOS
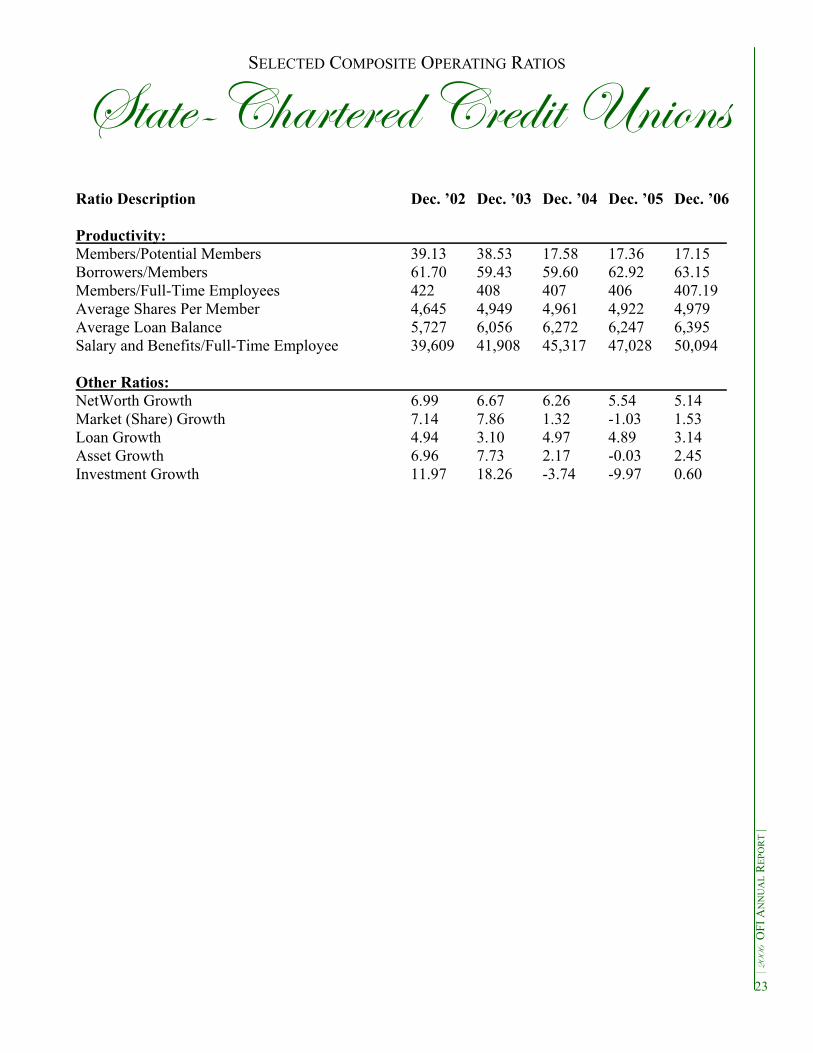
Ratio Description Dec. ’02 Dec. ’03 Dec. ’04 Dec. ’05 Dec. ’06 Productivity: Members/Potential Members 39.13 38.53 17.58 17.36 17.15 Borrowers/Members 61.70 59.43 59.60 62.92 63.15 Members/Full-Time Employees 422 408 407 406 407.19 Average Shares Per Member 4,645 4,949 4,961 4,922 4,979 Average Loan Balance 5,727 6,056 6,272 6,247 6,395 Salary and Benefits/Full-Time Employee 39,609 41,908 45,317 47,028 50,094 Other Ratios: NetWorth Growth 6.99 6.67 6.26 5.54 5.14 Market (Share) Growth 7.14 7.86 1.32 -1.03 1.53 Loan Growth 4.94 3.10 4.97 4.89 3.14 Asset Growth 6.96 7.73 2.17 -0.03 2.45 Investment Growth 11.97 18.26 -3.74 -9.97 0.60
23
fàtàx@V{tÜàxÜxw VÜxw|à hÇ|ÉÇá
ê ECCI OFI A
NN
UA
L REPO
RT | ,
REPORT OF CONDITION
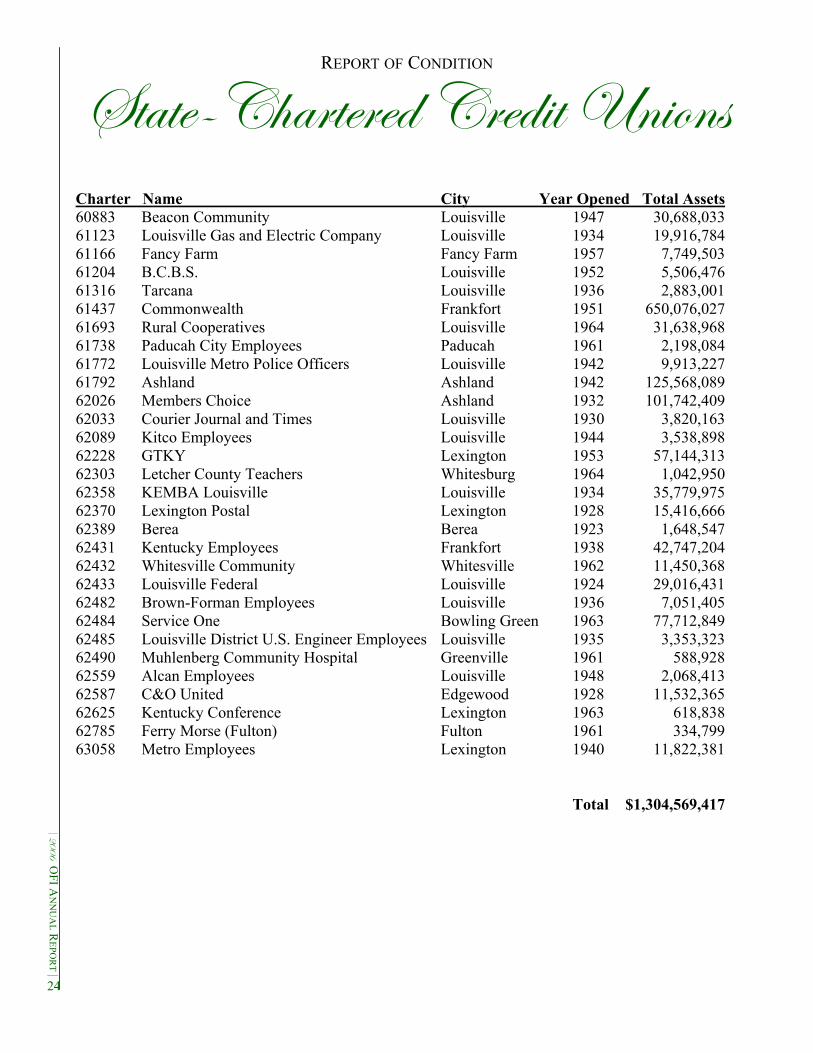
Charter Name City Year Opened Total Assets 60883 Beacon Community Louisville 1947 30,688,033 61123 Louisville Gas and Electric Company Louisville 1934 19,916,784 61166 Fancy Farm Fancy Farm 1957 7,749,503 61204 B.C.B.S. Louisville 1952 5,506,476 61316 Tarcana Louisville 1936 2,883,001 61437 Commonwealth Frankfort 1951 650,076,027 61693 Rural Cooperatives Louisville 1964 31,638,968 61738 Paducah City Employees Paducah 1961 2,198,084 61772 Louisville Metro Police Officers Louisville 1942 9,913,227 61792 Ashland Ashland 1942 125,568,089 62026 Members Choice Ashland 1932 101,742,409 62033 Courier Journal and Times Louisville 1930 3,820,163 62089 Kitco Employees Louisville 1944 3,538,898 62228 GTKY Lexington 1953 57,144,313 62303 Letcher County Teachers Whitesburg 1964 1,042,950 62358 KEMBA Louisville Louisville 1934 35,779,975 62370 Lexington Postal Lexington 1928 15,416,666 62389 Berea Berea 1923 1,648,547 62431 Kentucky Employees Frankfort 1938 42,747,204 62432 Whitesville Community Whitesville 1962 11,450,368 62433 Louisville Federal Louisville 1924 29,016,431 62482 Brown-Forman Employees Louisville 1936 7,051,405 62484 Service One Bowling Green 1963 77,712,849 62485 Louisville District U.S. Engineer Employees Louisville 1935 3,353,323 62490 Muhlenberg Community Hospital Greenville 1961 588,928 62559 Alcan Employees Louisville 1948 2,068,413 62587 C&O United Edgewood 1928 11,532,365 62625 Kentucky Conference Lexington 1963 618,838 62785 Ferry Morse (Fulton) Fulton 1961 334,799 63058 Metro Employees Lexington 1940 11,822,381 Total $1,304,569,417
24
VÉÅÑÄ|tÇvx UÜtÇv{
ê
ECCI
OFI
AN
NU
AL
REP
OR
T |
10th ANNUAL COMPLIANCE BRANCH REPORT
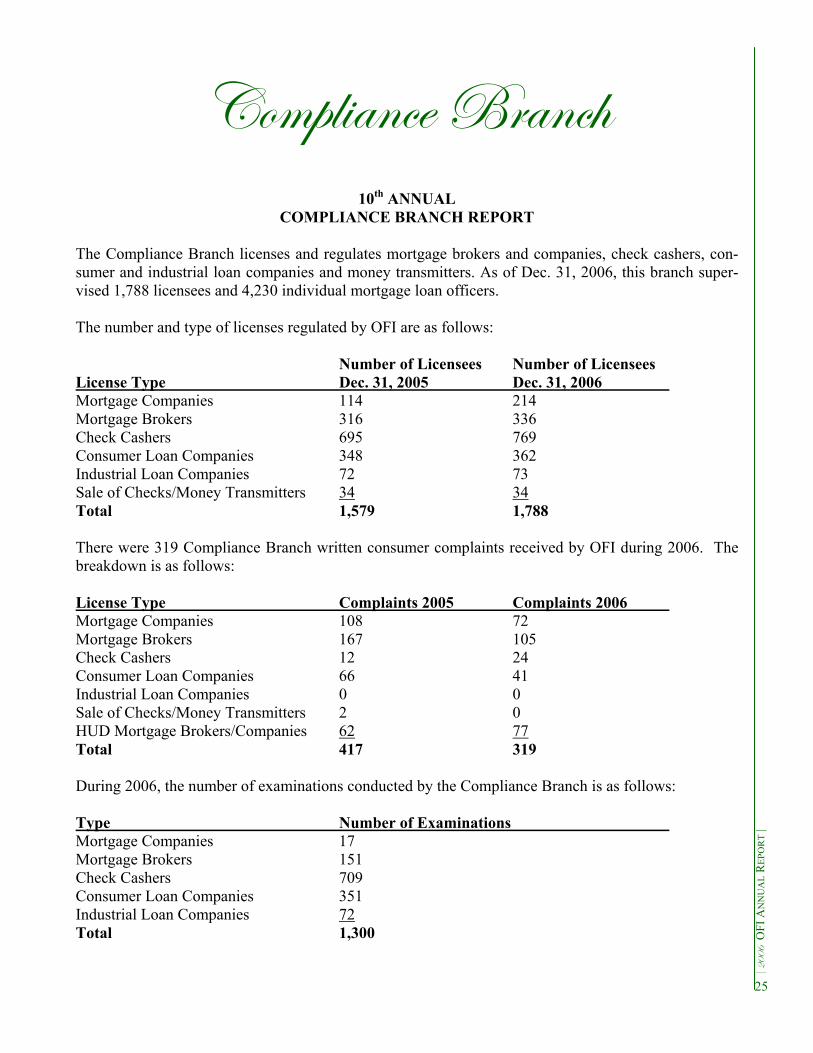
The Compliance Branch licenses and regulates mortgage brokers and companies, check cashers, con-sumer and industrial loan companies and money transmitters. As of Dec. 31, 2006, this branch super-vised 1,788 licensees and 4,230 individual mortgage loan officers. The number and type of licenses regulated by OFI are as follows: Number of Licensees Number of Licensees License Type Dec. 31, 2005 Dec. 31, 2006 Mortgage Companies 114 214 Mortgage Brokers 316 336 Check Cashers 695 769 Consumer Loan Companies 348 362 Industrial Loan Companies 72 73 Sale of Checks/Money Transmitters 34 34 Total 1,579 1,788 There were 319 Compliance Branch written consumer complaints received by OFI during 2006. The breakdown is as follows: License Type Complaints 2005 Complaints 2006 Mortgage Companies 108 72 Mortgage Brokers 167 105 Check Cashers 12 24 Consumer Loan Companies 66 41 Industrial Loan Companies 0 0 Sale of Checks/Money Transmitters 2 0 HUD Mortgage Brokers/Companies 62 77 Total 417 319 During 2006, the number of examinations conducted by the Compliance Branch is as follows: Type Number of Examinations Mortgage Companies 17 Mortgage Brokers 151 Check Cashers 709 Consumer Loan Companies 351 Industrial Loan Companies 72 Total 1,300
25
VÉÅÑÄ|tÇvx UÜtÇv{
ê ECCI OFI A
NN
UA
L REPO
RT | ,
In 2006, a total of $29,000 in fines was assessed against various mortgage companies and mortgage brokers. The Compliance Branch is staffed with 10 examiners. Three are assigned to consumer loan companies and industrial loan companies, three to check cashers and four to mortgage companies and mortgage brokers. These examiners are highly trained in their respective areas. The examiners reside in Bowling Green, Frankfort, Irvine, Lexington, Louisville, Union, Campbellsville and Shelbyville. Check casher, consumer loan company and industrial loan company licensees are examined annually as required by statute. Mortgage company and mortgage broker examination frequency is not set by stat-ute; however, licensees are examined every 18 to 24 months. Each examiner has his/her own portfolio of licensees; every effort is made by OFI to keep an examiner’s portfolio in a geographic area close to their residence in order to keep travel to a minimum. Field offices located in Eddyville, Bowling Green, Louisville and Lexington are used by examiners for administrative purposes.
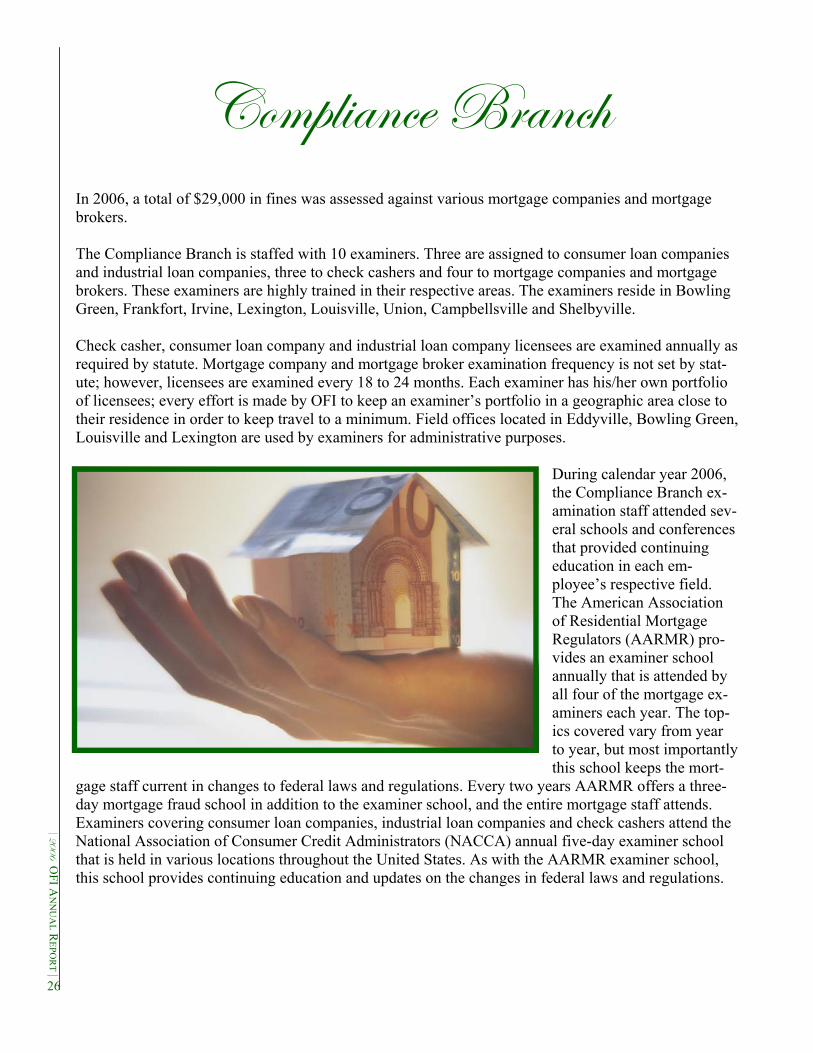
During calendar year 2006, the Compliance Branch ex-amination staff attended sev-eral schools and conferences that provided continuing education in each em-ployee’s respective field. The American Association of Residential Mortgage Regulators (AARMR) pro-vides an examiner school annually that is attended by all four of the mortgage ex-aminers each year. The top-ics covered vary from year to year, but most importantly this school keeps the mort-
gage staff current in changes to federal laws and regulations. Every two years AARMR offers a three-day mortgage fraud school in addition to the examiner school, and the entire mortgage staff attends. Examiners covering consumer loan companies, industrial loan companies and check cashers attend the National Association of Consumer Credit Administrators (NACCA) annual five-day examiner school that is held in various locations throughout the United States. As with the AARMR examiner school, this school provides continuing education and updates on the changes in federal laws and regulations.
26
VÉÇáâÅxÜ _ÉtÇ VÉÅÑtÇ|xá
ê
ECCI
OFI
AN
NU
AL
REP
OR
T |
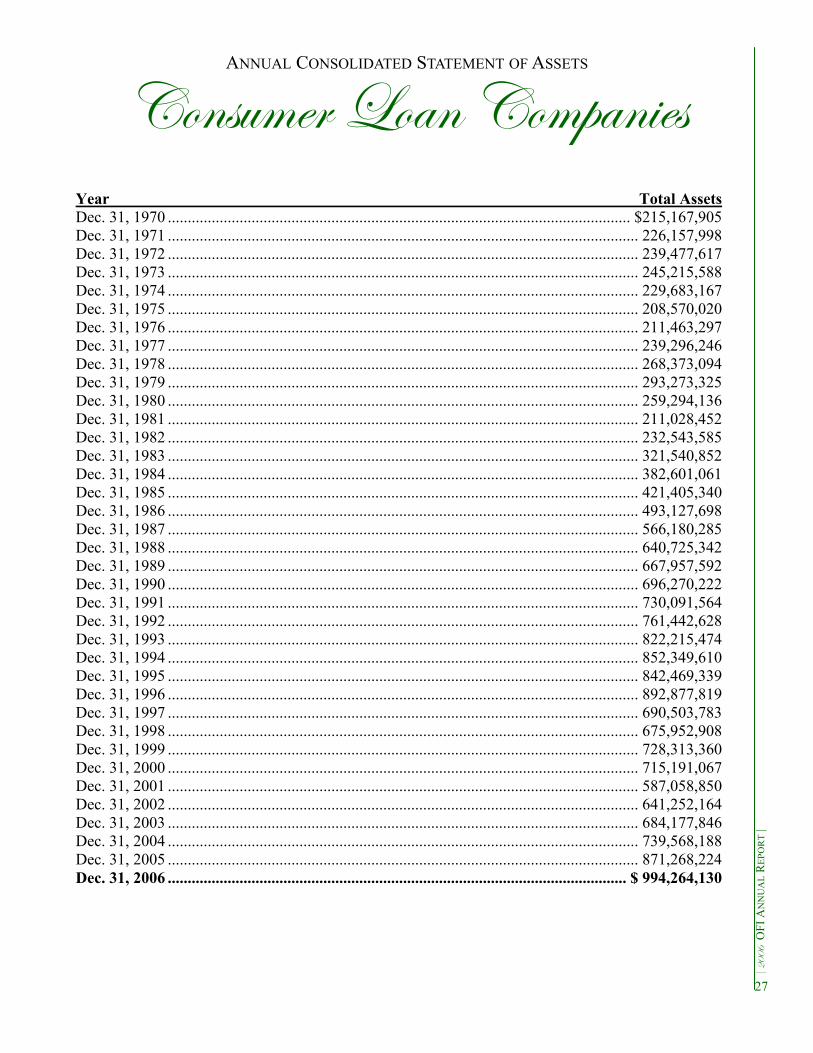
ANNUAL CONSOLIDATED STATEMENT OF ASSETS
Year Total Assets Dec. 31, 1970 .................................................................................................................... $215,167,905 Dec. 31, 1971 ...................................................................................................................... 226,157,998 Dec. 31, 1972 ...................................................................................................................... 239,477,617 Dec. 31, 1973 ...................................................................................................................... 245,215,588 Dec. 31, 1974 ...................................................................................................................... 229,683,167 Dec. 31, 1975 ...................................................................................................................... 208,570,020 Dec. 31, 1976 ...................................................................................................................... 211,463,297 Dec. 31, 1977 ...................................................................................................................... 239,296,246 Dec. 31, 1978 ...................................................................................................................... 268,373,094 Dec. 31, 1979 ...................................................................................................................... 293,273,325 Dec. 31, 1980 ...................................................................................................................... 259,294,136 Dec. 31, 1981 ...................................................................................................................... 211,028,452 Dec. 31, 1982 ...................................................................................................................... 232,543,585 Dec. 31, 1983 ...................................................................................................................... 321,540,852 Dec. 31, 1984 ...................................................................................................................... 382,601,061 Dec. 31, 1985 ...................................................................................................................... 421,405,340 Dec. 31, 1986 ...................................................................................................................... 493,127,698 Dec. 31, 1987 ...................................................................................................................... 566,180,285 Dec. 31, 1988 ...................................................................................................................... 640,725,342 Dec. 31, 1989 ...................................................................................................................... 667,957,592 Dec. 31, 1990 ...................................................................................................................... 696,270,222 Dec. 31, 1991 ...................................................................................................................... 730,091,564 Dec. 31, 1992 ...................................................................................................................... 761,442,628 Dec. 31, 1993 ...................................................................................................................... 822,215,474 Dec. 31, 1994 ...................................................................................................................... 852,349,610 Dec. 31, 1995 ...................................................................................................................... 842,469,339 Dec. 31, 1996 ...................................................................................................................... 892,877,819 Dec. 31, 1997 ...................................................................................................................... 690,503,783 Dec. 31, 1998 ...................................................................................................................... 675,952,908 Dec. 31, 1999 ...................................................................................................................... 728,313,360 Dec. 31, 2000 ...................................................................................................................... 715,191,067 Dec. 31, 2001 ...................................................................................................................... 587,058,850 Dec. 31, 2002 ...................................................................................................................... 641,252,164 Dec. 31, 2003 ...................................................................................................................... 684,177,846 Dec. 31, 2004 ...................................................................................................................... 739,568,188 Dec. 31, 2005 ...................................................................................................................... 871,268,224 Dec. 31, 2006 ................................................................................................................... $ 994,264,130
27
VÉÇáâÅxÜ _ÉtÇ VÉÅÑtÇ|xá
ê ECCI OFI A
NN
UA
L REPO
RT | ,
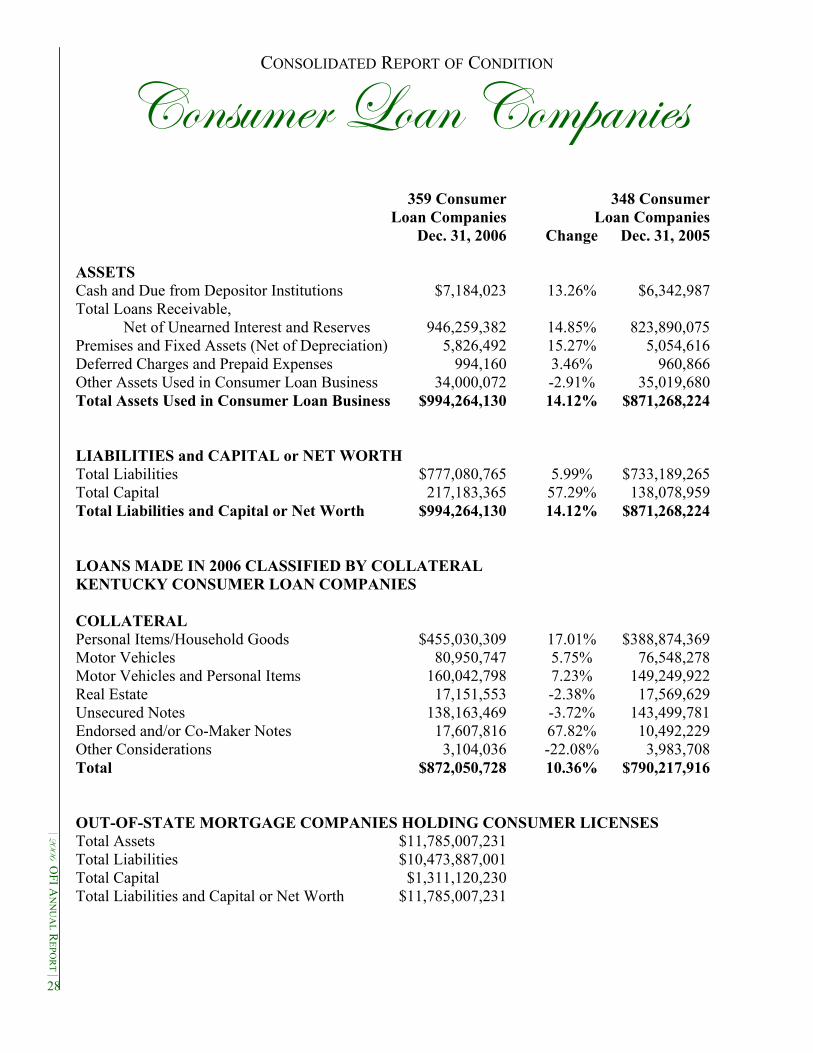
CONSOLIDATED REPORT OF CONDITION
359 Consumer 348 Consumer Loan Companies Loan Companies Dec. 31, 2006 Change Dec. 31, 2005 ASSETS Cash and Due from Depositor Institutions $7,184,023 13.26% $6,342,987 Total Loans Receivable, Net of Unearned Interest and Reserves 946,259,382 14.85% 823,890,075 Premises and Fixed Assets (Net of Depreciation) 5,826,492 15.27% 5,054,616 Deferred Charges and Prepaid Expenses 994,160 3.46% 960,866 Other Assets Used in Consumer Loan Business 34,000,072 -2.91% 35,019,680 Total Assets Used in Consumer Loan Business $994,264,130 14.12% $871,268,224 LIABILITIES and CAPITAL or NET WORTH Total Liabilities $777,080,765 5.99% $733,189,265 Total Capital 217,183,365 57.29% 138,078,959 Total Liabilities and Capital or Net Worth $994,264,130 14.12% $871,268,224 LOANS MADE IN 2006 CLASSIFIED BY COLLATERAL KENTUCKY CONSUMER LOAN COMPANIES COLLATERAL Personal Items/Household Goods $455,030,309 17.01% $388,874,369 Motor Vehicles 80,950,747 5.75% 76,548,278 Motor Vehicles and Personal Items 160,042,798 7.23% 149,249,922 Real Estate 17,151,553 -2.38% 17,569,629 Unsecured Notes 138,163,469 -3.72% 143,499,781 Endorsed and/or Co-Maker Notes 17,607,816 67.82% 10,492,229 Other Considerations 3,104,036 -22.08% 3,983,708 Total $872,050,728 10.36% $790,217,916 OUT-OF-STATE MORTGAGE COMPANIES HOLDING CONSUMER LICENSES Total Assets $11,785,007,231 Total Liabilities $10,473,887,001 Total Capital $1,311,120,230 Total Liabilities and Capital or Net Worth $11,785,007,231
28
\ÇwâáàÜ|tÄ _ÉtÇ VÉÅÑtÇ|xá
ê
ECCI
OFI
AN
NU
AL
REP
OR
T |
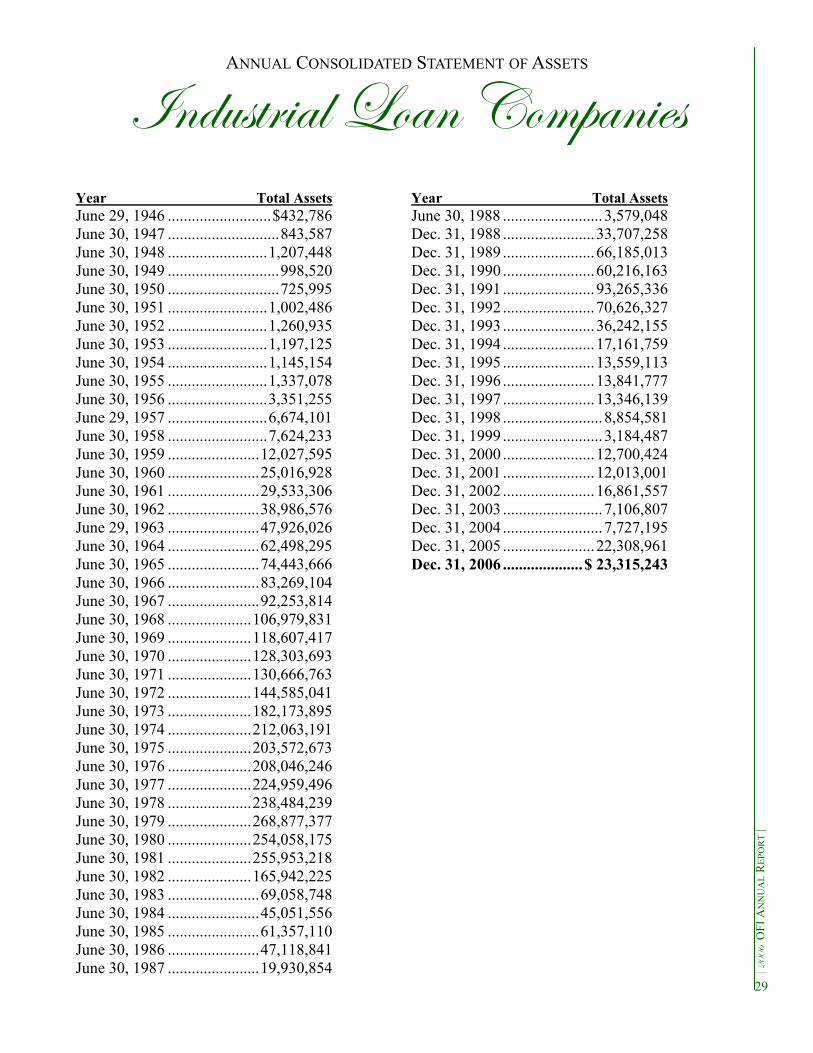
ANNUAL CONSOLIDATED STATEMENT OF ASSETS
Year Total Assets June 29, 1946 ..........................$432,786 June 30, 1947 ............................843,587 June 30, 1948 .........................1,207,448 June 30, 1949 ............................998,520 June 30, 1950 ............................725,995 June 30, 1951 .........................1,002,486 June 30, 1952 .........................1,260,935 June 30, 1953 .........................1,197,125 June 30, 1954 .........................1,145,154 June 30, 1955 .........................1,337,078 June 30, 1956 .........................3,351,255 June 29, 1957 .........................6,674,101 June 30, 1958 .........................7,624,233 June 30, 1959 .......................12,027,595 June 30, 1960 .......................25,016,928 June 30, 1961 .......................29,533,306 June 30, 1962 .......................38,986,576 June 29, 1963 .......................47,926,026 June 30, 1964 .......................62,498,295 June 30, 1965 .......................74,443,666 June 30, 1966 .......................83,269,104 June 30, 1967 .......................92,253,814 June 30, 1968 .....................106,979,831 June 30, 1969 .....................118,607,417 June 30, 1970 .....................128,303,693 June 30, 1971 .....................130,666,763 June 30, 1972 .....................144,585,041 June 30, 1973 .....................182,173,895 June 30, 1974 .....................212,063,191 June 30, 1975 .....................203,572,673 June 30, 1976 .....................208,046,246 June 30, 1977 .....................224,959,496 June 30, 1978 .....................238,484,239 June 30, 1979 .....................268,877,377 June 30, 1980 .....................254,058,175 June 30, 1981 .....................255,953,218 June 30, 1982 .....................165,942,225 June 30, 1983 .......................69,058,748 June 30, 1984 .......................45,051,556 June 30, 1985 .......................61,357,110 June 30, 1986 .......................47,118,841 June 30, 1987 .......................19,930,854
Year Total Assets June 30, 1988 .........................3,579,048 Dec. 31, 1988 .......................33,707,258 Dec. 31, 1989 .......................66,185,013 Dec. 31, 1990 .......................60,216,163 Dec. 31, 1991 .......................93,265,336 Dec. 31, 1992 .......................70,626,327 Dec. 31, 1993 .......................36,242,155 Dec. 31, 1994 .......................17,161,759 Dec. 31, 1995 .......................13,559,113 Dec. 31, 1996 .......................13,841,777 Dec. 31, 1997 .......................13,346,139 Dec. 31, 1998 .........................8,854,581 Dec. 31, 1999 .........................3,184,487 Dec. 31, 2000 .......................12,700,424 Dec. 31, 2001 .......................12,013,001 Dec. 31, 2002 .......................16,861,557 Dec. 31, 2003 .........................7,106,807 Dec. 31, 2004 .........................7,727,195 Dec. 31, 2005 .......................22,308,961 Dec. 31, 2006 ....................$ 23,315,243
29

\ÇwâáàÜ|tÄ _ÉtÇ VÉÅÑtÇ|xá
ê ECCI OFI A
NN
UA
L REPO
RT | ,
CONSOLIDATED REPORT OF CONDITION
70 Industrial 72 Industrial Loan Companies Loan Companies Dec. 31, 2006 Change Dec. 31, 2005 ASSETS Cash on hand 0 0.00% 0 Cash in Depository Institutions 63,125 213.96% 20,106 Investments 0 0.00% 0 Industrial Loans 9,228,039 -23.44% 12,053,607 Conditional Sales Contracts 0 0.00% 0 Other Loans 9,695,956 1.37% 9,565,073 Total Loans 18,923,995 -12.46% 21,618,680 Less: Unearned Interest 63,930 -23.30% 83,347 Reserve for Loan Loss 647,606 -14.86% 760,632 Loans, Net of Unearned Interest and Reserves 18,212,459 -12.21% 20,744,701 Premises and Fixed Assets 13,197 0 Other Assets 5,026,463 231.97% 1,514,154 Total Assets $23,315,243 4.51% $22,308,961 LIABILITIES Certificates of Investment 0 0.00% 0 Other Borrowed Money 14,201,273 -13.04% 16,331,493 Other Liabilities 189,266 -91.58% 2,247,388 Total Liabilities $14,390,539 -22.54% $18,578,881 EQUITY CAPITAL Capital Stock 1,250,000 0.00% 1,250,000 Surplus and Undivided Profits 12,366,931 165.49% 4,658,106 Current Earnings -4,692,227 115.43% -2,178,026 Total Equity Capital $8,924,704 139.26% $3,730,080 TOTAL LIABILITIES & EQUITY CAPITAL $23,315,243 4.51% $22,308,961
30
W|ä|á|ÉÇ Éy fxvâÜ|à|xá
ê
ECCI
OFI
AN
NU
AL
REP
OR
T |
21st ANNUAL SECURITIES REPORT
The mission of the Division of Securities is to 1) protect investors by preventing and remedying, when-ever possible, investment fraud and related illegal conduct, 2) educate the investing public on how to make informed investment decisions and 3) assist companies in their legitimate attempts to raise capital and transact securities business in Kentucky. To fulfill its mission, the Division of Securities performs the various functions set forth below. Each of these activities is intended to provide protection to the citizens of the commonwealth by helping to en-sure that securities transactions are effected in compliance with the Securities Act and that investors have thorough and accurate information available to them when they are evaluating an investment in a security or contemplating doing business with a securities professional. • Licensing – The licensing staff assists in the registration of, or determination to deny registration to, broker-dealers, investment advisers and their employees. The licensing staff also may provide informa-tion to the public concerning a broker’s discipli-nary history. • Compliance – Examiners in the Compliance Branch perform routine (but often unannounced) examinations of broker-dealers, investment advis-ers and their employees in the commonwealth in order to determine whether they are complying with the securities laws. • Enforcement – Investigators in the Enforcement Branch investigate allegations of securities fraud or other illegal conduct. In coordination with OFI’s legal staff, the investigators assist in the administrative actions the office may pursue against alleged violators of the Securities Act. Further, the division may refer cases to criminal authorities to prosecute the most serious occurrences of securities fraud. • Corporation Finance – Corporation Finance staff assists in the registration or exemption from registration of entities that issue securities in the commonwealth. The staff in this area also processes notice filings by issuers of federally covered securities such as mutual funds. In addition, the corpora-tion finance staff answers questions from the general public about the requirements for offerings of se-curities in Kentucky. The Securities Division staff distributes informational brochures to Kentuckians through public librar-ies and county cooperative extension agencies and regularly speaks to high school students and com-munity groups about saving and investing.
31
fxvâÜ|à|xá _|vxÇá|Çz
ê ECCI OFI A
NN
UA
L REPO
RT | ,
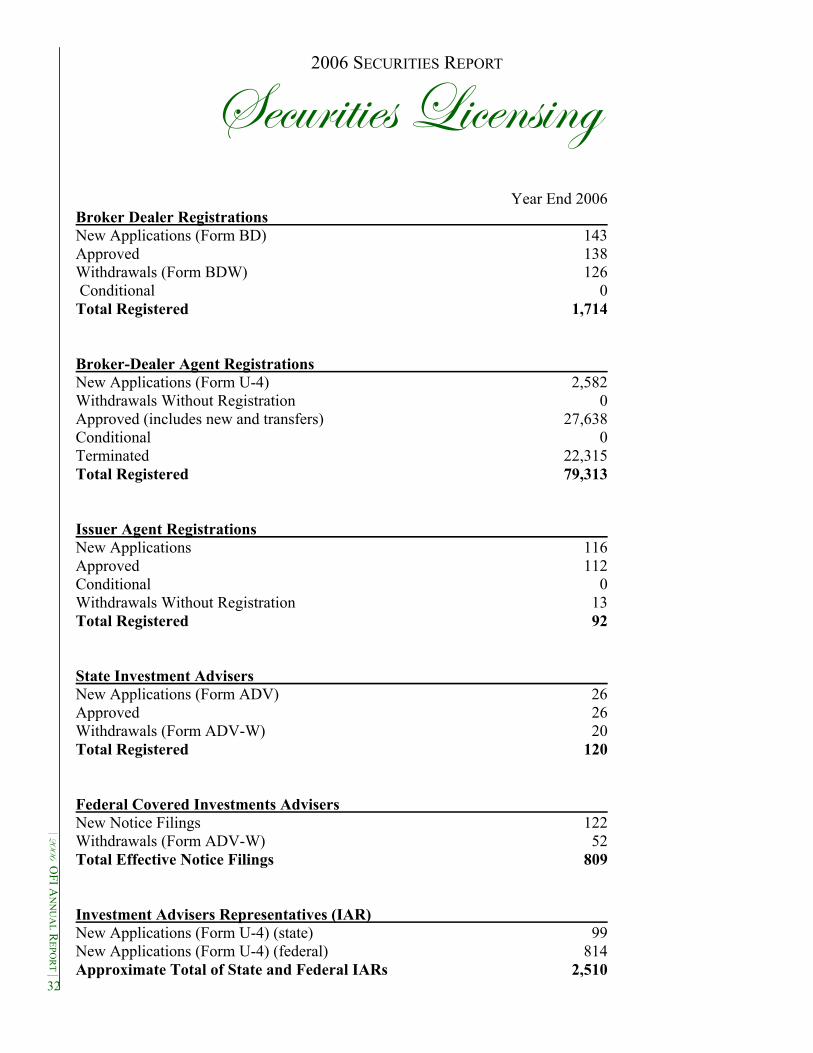
2006 SECURITIES REPORT
Year End 2006 Broker Dealer Registrations New Applications (Form BD) 143 Approved 138 Withdrawals (Form BDW) 126 Conditional 0 Total Registered 1,714 Broker-Dealer Agent Registrations New Applications (Form U-4) 2,582 Withdrawals Without Registration 0 Approved (includes new and transfers) 27,638 Conditional 0 Terminated 22,315 Total Registered 79,313 Issuer Agent Registrations New Applications 116 Approved 112 Conditional 0 Withdrawals Without Registration 13 Total Registered 92 State Investment Advisers New Applications (Form ADV) 26 Approved 26 Withdrawals (Form ADV-W) 20 Total Registered 120 Federal Covered Investments Advisers New Notice Filings 122 Withdrawals (Form ADV-W) 52 Total Effective Notice Filings 809 Investment Advisers Representatives (IAR) New Applications (Form U-4) (state) 99 New Applications (Form U-4) (federal) 814 Approximate Total of State and Federal IARs 2,510
32

ê
ECCI
OFI
AN
NU
AL
REP
OR
T |
Year End 2006 CORPORATIONS FINANCE Registrations By Coordination 16 By Qualification 0 By Notification 0 Notice Filings Investment Companies - New 508 Investment Companies - Renewals 3,445 Unit Investment Trusts 786 Reg. D, Rule 506 Offerings 583 Exemptions Claims of Exemption Requested 56 Total 5,394 COMPLIANCE BRANCH Broker-Dealer Number of Examinations Main Office 2 Branch Office 28 Non-Branch Office 10 Investment Adviser Main Office 54 Issuer Agent Main Office 1 Total Examinations 95 ENFORCEMENT BRANCH Year End Totals 2006 Referrals/Assistance to Outside Agency/Entity 15 Referrals From Outside Agency/Entity 8 Investigations Opened 37 Investigations Closed 32 Investigations Pending 30 Fines $235,257 33
2006 SECURITIES REPORT
fxvâÜ|à|xá VÉÜÑÉÜtà|ÉÇá Y|ÇtÇvx? VÉÅÑÄ|tÇvx tÇw XÇyÉÜvxÅxÇà
The financial information in this report is based upon unverified figures furnished in Dec. 31, 2006, call reports. Subsequent amendments to call reports are not reflected.
PAID FOR WITH STATE FUNDS
byy|vx Éy Y|ÇtÇv|tÄ \Çáà|àâà|ÉÇá DCEH VtÑ|àtÄ VxÇàxÜ WÜ|äx
fâ|àx ECC YÜtÇ~yÉÜà? ^l GCICD
HCE@HJF@FFLC KCC@EEF@EHJL
YtåM HCE@HJF@KJKJ ãããA~y|A~çAzÉä