C-H Activation through Photocatalytic Sulfoxidation of … · C-H Activation through Photocatalytic...
159
C-H Activation through Photocatalytic Sulfoxidation of Alkanes Der Naturwissenschaftlichen Fakultät der Friedrich-Alexander-Universität Erlangen-Nürnberg zur Erlangung des Doktorgrades vorgelegt von Francesco Parrino aus Palermo (Italien)
Transcript of C-H Activation through Photocatalytic Sulfoxidation of … · C-H Activation through Photocatalytic...
C-H Activation through Photocatalytic Sulfoxidation
of Alkanes
Der Naturwissenschaftlichen Fakultät der Friedrich-Alexander-Universität Erlangen-Nürnberg
zur Erlangung des Doktorgrades
vorgelegt von Francesco Parrino
aus Palermo (Italien)

Als Dissertation genehmigt von der Naturwissenschaftlichen Fakultät der Universität Erlangen-Nürnberg
Tag der mündlichen Prüfung: 27. 03. 2009
Vorsitzender der Promotionskommission: Prof. Dr. Eberhard Bänsch
Erstberichterstatter: Prof. Dr. Horst Kisch
Zweitberichterstatter: Prof. Dr. Ulrich Zenneck

1
Acknowledgements
I wish to thank Prof. Dr. Horst Kisch for the supervision of this work and many fruitful discussions. I am particularly grateful for his advice, his trust in me, and his generous support of my work.
Parts of this work would not have been possible without the help of several people. I thank Christina Wronna for elemental analyses, Cornelia Damm for time resolved photovoltage measurements, Siegfried Smolny for surface area measurements, Helga Hildebrand for XPS measurements, and Martin Bachmueller for MS analysis. Manfred Weller, Peter Igel and their colleagues from the “Werkstatt” are acknowledged for the assistance with technical problems. I am also indebted to Dr. Matthias Moll for his manifold help, Uwe Reißer for his help with electronic equipment, Ronny Wiefel for glass work, and to Dr. Jörg Sutter for computer assistance.
Many thanks to all my colleagues for contributing to the very good atmosphere in the group – Marc, Ayyappan, Sakthi, Joachim, Sina, Christian, Darek, Przemek and Radim – and also to all my friends outside the institute.
I am very grateful towards my parents for their lifelong love and encouragement, and I dedicate this work to them.

2
3
“This work presents very novel results that may have a significant impact not only to
the field of semiconductor photocatalysis but also in terms of organic synthesis. If scale-
up of this process proves viable there could be very important industrial implications.”
Unknown referee
Trova il tempo di pensare, di pregare, di ridere
E’ la fonte del potere più grande sulla terra,
E’ la musica dell’anima.
Trova il tempo per giocare, per amare ed essere amato
Trova il tempo di dare
E’ il segreto dell’eterna giovinezza, il privilegio dato da Dio.
La giornata è troppo corta per essere egoisti.
Trova il tempo di leggere, di essere amico, di lavorare
E’ la fonte della saggezza, la strada della felicità,
Il prezzo del successo
Trova il tempo di fare la carità
È la chiave del paradiso.
Madre Teresa di Calcutta

4

5
Die vorliegende Arbeit entstand in der Zeit von April 2006 bis Februar 2009 am
Institut für Anorganische Chemie der Universität Erlangen-Nürnberg unter Anleitung
von Herrn Prof. Dr. Horst Kisch.

6

7
Contents
Acknowledgements.............................................................................................. 1
Contents................................................................................................................ 7
1. Introduction .................................................................................................. 9
2. Literature Review....................................................................................... 15
2.1 Heterogeneous Photocatalysis ........................................................................15 2.1.1 Fundamental Properties of Semiconductors ........................................................15 2.1.2 Properties of Titanium Dioxide ...........................................................................17 2.1.3 Photocatalysis Mechanism ..................................................................................20 2.1.4 Visible Light Activity of Modified Titania .........................................................22
2.2 Activation of C-H Bonds by Metal Complexes..............................................24 2.2.1 Activation via σ-Organyl Derivatives .................................................................24 2.2.2 Activation through Electron and Hydrogen Transfer ..........................................31 2.2.3 Indirect Activation via Reactive Oxygen Species ...............................................32
2.3 Alkane Activation at Titania...........................................................................35
3. Visible-light Photocatalysis by a Titania-Rhodium (III) Complex........ 39
3.1 Introduction.....................................................................................................39 3.2 Synthesis and Characterization.......................................................................41
3.2.1 Desorption Experiments ......................................................................................41 3.2.2 Diffuse Reflectance Spectra ................................................................................42
3.2.2.1 Principles of DRIFTS................................................................................................42 3.2.2.2 Diffuse Reflectance Measurements...........................................................................45
3.2.3 Determination of Band Edge Positions ...............................................................50 3.2.3.1 Semiconductor-Electrolyte Interface.........................................................................50 3.2.3.2 Concept of Quasi Fermi Level ..................................................................................53 3.2.3.3 Photovoltage Measurements .....................................................................................53
3.2.4 Photocatalytic Activity ........................................................................................57 3.2.5 Understanding the Mechanism ............................................................................60
3.3 Experimental...................................................................................................63 3.3.1 Instruments ..........................................................................................................63 3.3.2 Determination of Absorptivity of [RhCl6]3- ........................................................63 3.3.3 Preparation of Photocatalysts ..............................................................................64 3.3.4 Preparation of 4.0%RhCl3/TH and Charge Transfer Absorption ........................64 3.3.5 Determination of Cl/Rh Ratio .............................................................................65 3.3.6 Measurement of Quasi-Fermi Potentials .............................................................65 3.3.7 Desorption Experiments ......................................................................................65 3.3.8 Photodegradation Procedure and Product Analysis ............................................66
3.4 Conclusions.....................................................................................................68
4. C-H Activation through Catalytic Photosulfoxidation of Alkanes........ 69
4.1 Introduction.....................................................................................................69 4.1.1 Industrial Importance of Photosulfoxidation.......................................................70 4.1.2 Industrial Processes .............................................................................................70
8
4.1.2.1 Mechanism of Industrial Sulfoxidation ....................................................................70 4.1.2.2 Light-Water-Process..................................................................................................73 4.1.2.3 Acetic Anhydride Process .........................................................................................75 4.1.2.4 Other Processes .........................................................................................................76
4.1.3 State of Knowledge before this work ..................................................................78 4.2 Results and Discussion: Reaction in Liquid Alkanes.....................................80
4.2.1 Product Characterization .....................................................................................81 4.2.1.1 Principle of IPC and Measurements .........................................................................81 4.2.1.2 IR Spectra and Amount of Sulphate .........................................................................84 4.2.1.3 Elemental Analysis ...................................................................................................87
4.2.2 Dependence on Photocatalyst Concentration ......................................................88 4.2.3 Deactivation and Regeneration of the Photocatalyst ...........................................89 4.2.4 Surface Modifications of the Catalyst .................................................................91 4.2.5 Interaction between SO2 and TiO2 ......................................................................95 4.2.6 XPS Results .........................................................................................................97
4.2.6.1 XPS Principles ..........................................................................................................97 4.2.6.2 XPS Spectra ..............................................................................................................99
4.2.7 PEMF Results ....................................................................................................101 4.2.7.1 PEMF Basics...........................................................................................................101 4.2.7.2 PEMF Measurements and Discussion ....................................................................103
4.2.8 Reaction Mechanism .........................................................................................110 4.2.8.1 Evidences of Radical Chain Reaction.....................................................................112 4.2.8.2 Evidence for Formation of a TiO2-SO2 CT Complex .............................................117
4.2.9 Oxidation Products ............................................................................................123 4.2.10 Preparative Synthesis of Heptanesulfonic Acid Sodium Salt............................124
4.3 Results and Discussion: Reaction in Acetic Acid ........................................124 4.3.1 System Description and Product Characterization ............................................125 4.3.2 Acetic Acid Adsorption at TiO2 ........................................................................127 4.3.3 Influence of Water .............................................................................................129
4.4 Experimental part..........................................................................................130 4.4.1 Materials ............................................................................................................130 4.4.2 Standard Photosulfoxidation .............................................................................130 4.4.3 Instruments and Methods ..................................................................................133 4.4.4 Surface Modification of Titania ........................................................................139
5. Summary ................................................................................................... 141
6. Zusammenfassung .................................................................................... 146
7. References ................................................................................................. 151
1. Introduction
9
1. Introduction
Alkanes are major constituents of natural gas and petroleum, the feedstocks of
chemical industry, but there are very few processes for converting them directly to
more valuable products such alcohols, ketones, acids, peroxides. The reason of this is
reflected in the other name “paraffins” (from the Latin “parum affinis”) that means
“not enough affinity”. This chemical inertness arises from the strong and localized C-
C and C-H bonds (the value of the C-H dissociation energy for methane is 104
kcal/mol), so that the molecules have no empty orbitals of low energy or filled orbitals
of high energy that could readily participate in a chemical reaction.1
Alkanes may be called the “noble gases of organic chemistry”; however this
comparison is not fully accurate. In fact, whereas noble gases do not react easily with
any usual compound, there is at least one well-known substance which activates
paraffins very well: this substance is the oxygen. Alkanes undergo complete oxidation
in air in the presence of a catalyst and at high temperature to produce water and carbon
dioxide.2 The currently prevalent use of alkanes in combustion applications exploits
their energy content, but not their potential as precursors for more important
chemicals. Most of them, especially oxygenates, are produced from olefins, in turn
obtained from alkanes by fairly inefficient and energy intensive processes like
cracking and thermal dehydrogenation.1 Furthermore, some active reagents, such as
atoms, free radical and carbenes can react with saturated hydrocarbons at room
temperature. But these reactive species are usually demanding to make and offer little
control over product selectivity.
Milder and better-controlled direct conversion of alkanes into e.g. olefins and
alcohols may thus offer large chemical, energetic, and economic benefits. Exploitation
of natural gas resources is hampered by the high cost of both gas transportation and
conversion hydrocarbon into more readily transportable liquid. The available
conversion methods are indirect, involving production of synthesis gas followed by
conversion to the desired product. Developing efficient strategies for the direct

1. Introduction
10
conversion of alkanes to the final products could thus allow us to exploit hydrocarbons
more efficiently. 1
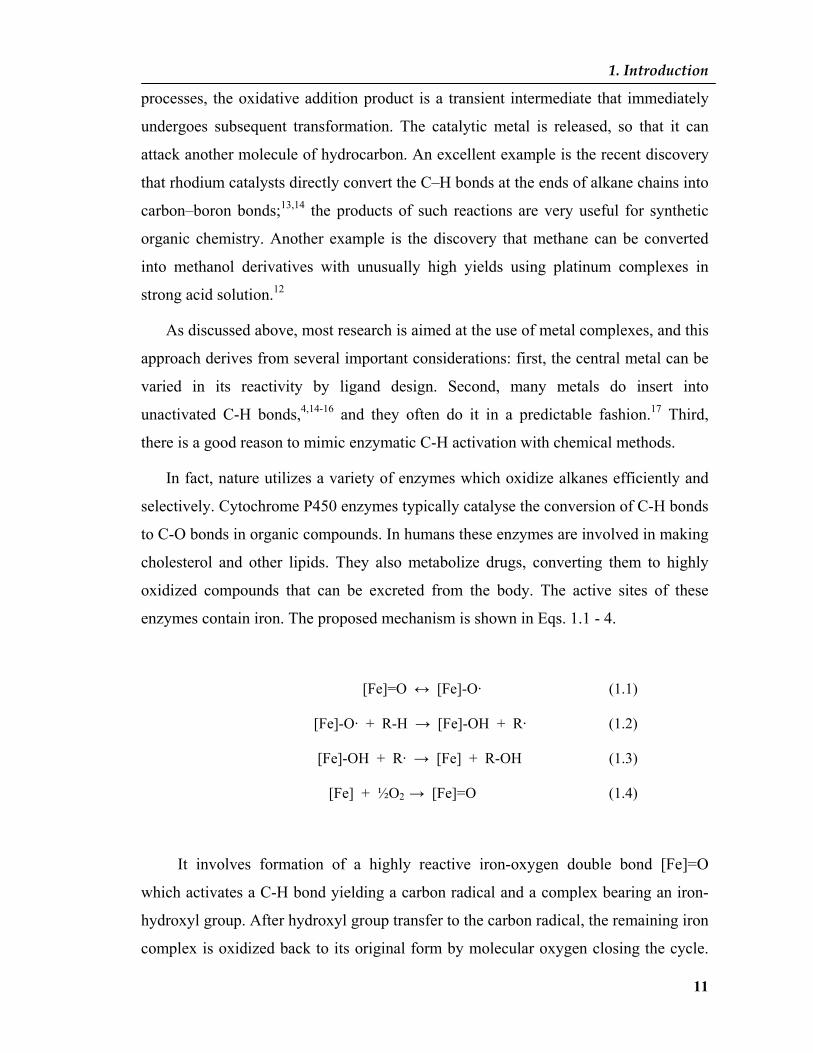
For these reasons C-H activation is certainly a problem of global importance, a
“holy grail” of chemistry as noted by Bard, Whitesides, Zare and McLafferty in
19953,4 and this can be documented by the steady growth of interest in this field in
recent years ( Fig. 1.1).
1985 1990 1995 2000 20050
50
100
150
200
Num
ber o
f pub
blic
atio
ns/Y
ear
Year
Figure 1.1: Annual number of papers published in which “C-H activation” are mentioned in the last 23 years (till July 2008). Literature search was done using SciFinder® Scholar™ searching tool.
In 1969 the first activation of C-H bonds in alkanes was discovered. It was found
that platinum(II) salts catalyze the H-D exchange between methane and D2O at
100°C.5 In the 1970s it was shown that alkanes are oxidized by platinum(IV)6,
palladium(II)7, ruthenium(IV)8, and cobalt(III)9 compounds and that complexes of
iridium(III)10 and titanium(II)11 catalyze the H-D exchange. The field took off during
the 1980s, when there was a dramatic increase in the number of metal salts and
complexes that were found to initiate C–H activation by oxidative addition. But the
drawback was that most of these transformations required equal amounts, in moles, of
the hydrocarbon and the metal, and both partners were consumed during the reaction.12
The next decade was marked by an explosion of interest in the use of catalytic
reactions for bringing about oxidative addition for C–H activation. In these catalytic
1. Introduction
11
processes, the oxidative addition product is a transient intermediate that immediately
undergoes subsequent transformation. The catalytic metal is released, so that it can
attack another molecule of hydrocarbon. An excellent example is the recent discovery
that rhodium catalysts directly convert the C–H bonds at the ends of alkane chains into
carbon–boron bonds;13,14 the products of such reactions are very useful for synthetic
organic chemistry. Another example is the discovery that methane can be converted
into methanol derivatives with unusually high yields using platinum complexes in
strong acid solution.12
As discussed above, most research is aimed at the use of metal complexes, and this
approach derives from several important considerations: first, the central metal can be
varied in its reactivity by ligand design. Second, many metals do insert into
unactivated C-H bonds,4,14-16 and they often do it in a predictable fashion.17 Third,
there is a good reason to mimic enzymatic C-H activation with chemical methods.
In fact, nature utilizes a variety of enzymes which oxidize alkanes efficiently and
selectively. Cytochrome P450 enzymes typically catalyse the conversion of C-H bonds
to C-O bonds in organic compounds. In humans these enzymes are involved in making
cholesterol and other lipids. They also metabolize drugs, converting them to highly
oxidized compounds that can be excreted from the body. The active sites of these
enzymes contain iron. The proposed mechanism is shown in Eqs. 1.1 - 4.
[Fe]=O ↔ [Fe]-O· (1.1)
[Fe]-O· + R-H → [Fe]-OH + R· (1.2)
[Fe]-OH + R· → [Fe] + R-OH (1.3)
[Fe] + ½O2 → [Fe]=O (1.4)
It involves formation of a highly reactive iron-oxygen double bond [Fe]=O
which activates a C-H bond yielding a carbon radical and a complex bearing an iron-
hydroxyl group. After hydroxyl group transfer to the carbon radical, the remaining iron
complex is oxidized back to its original form by molecular oxygen closing the cycle.

1. Introduction
12
However, the details of this process are still a source of controversy. Another example
of enzymatic C-H activation is the transformation of methane to methanol by methane
monooxygenase. This iron containing enzyme was discovered in a class of bacteria
that lives at the interface of aerobic and anaerobic environments. The direct use of
such biological organisms for industrial alkane conversion is in principle possible but
the scale-up step seems to be problematic.12
Another approach to tackle this problem is the metal-free alternative. Many
reactions claimed to be metal-catalyzed produce similar results even in the absence of
a metal. Many transition metal C-H activations are oxygen and water-sensitive and
sometimes involve very expensive and poisonous metals. Furthermore, a costly water
treatment is required often. On the other hand high-temperature radical or even
surface-catalyzed reactions are easy to carry out on a large scale. In general these
reactions exhibit poor selectivity, except some highly selective alkane
functionalizations, induced by nitroxyl radicals and radical reactions conducted under
phase-transfer conditions.18
Figure 1.2: Alkane C-H bond activation paths with uncharged (E) and charged (E+) electrophiles as well as with radicals (E· ) and electron-acceptors (-e-). (Adapted from ref.18)
R-H
E
E+
-e-
E·
δ+· R--H--E δ-·
-EH·
R·
δ+· R--H--E δ+· -EH
TS1: molecule-induced homolytic
δ+· R--H--E δ+·-EH
R·
R---H + ·
- H+ - H·
R· R+
solution gas-phase
TS4: oxidative
TS3: radical TS2: electrophilic
R+
1. Introduction
13
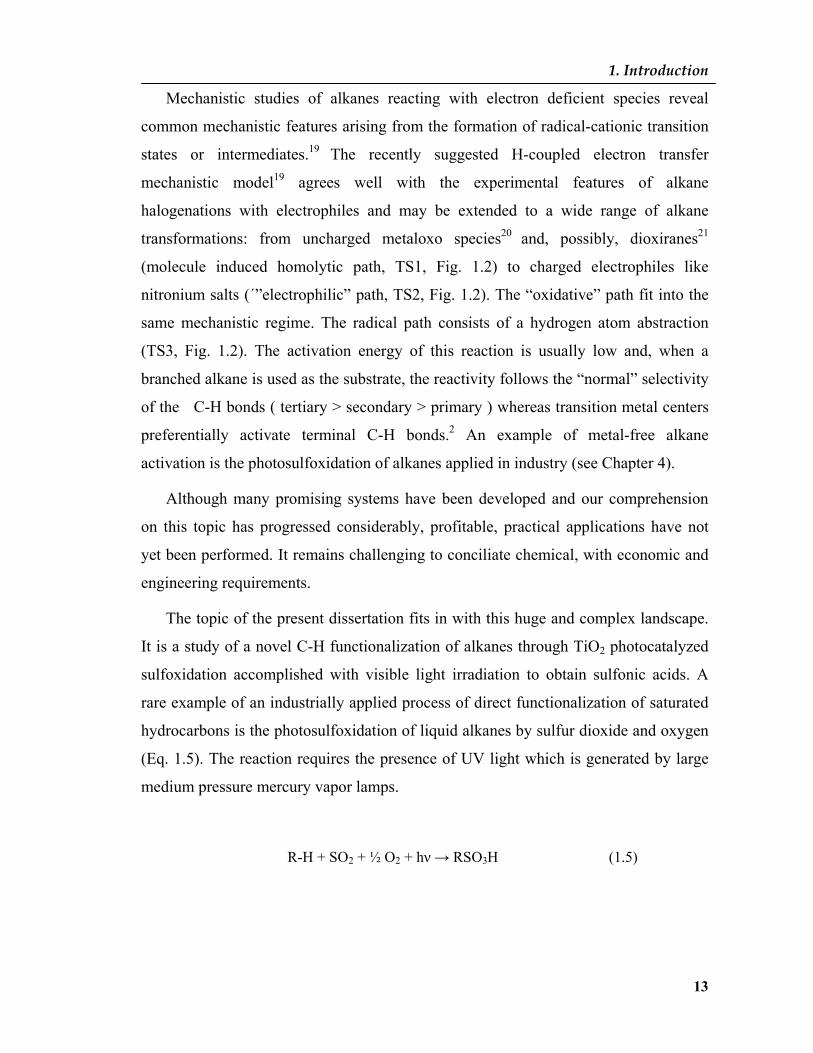
Mechanistic studies of alkanes reacting with electron deficient species reveal
common mechanistic features arising from the formation of radical-cationic transition
states or intermediates.19 The recently suggested H-coupled electron transfer
mechanistic model19 agrees well with the experimental features of alkane
halogenations with electrophiles and may be extended to a wide range of alkane
transformations: from uncharged metaloxo species20 and, possibly, dioxiranes21
(molecule induced homolytic path, TS1, Fig. 1.2) to charged electrophiles like
nitronium salts (´”electrophilic” path, TS2, Fig. 1.2). The “oxidative” path fit into the
same mechanistic regime. The radical path consists of a hydrogen atom abstraction
(TS3, Fig. 1.2). The activation energy of this reaction is usually low and, when a
branched alkane is used as the substrate, the reactivity follows the “normal” selectivity
of the C-H bonds ( tertiary > secondary > primary ) whereas transition metal centers
preferentially activate terminal C-H bonds.2 An example of metal-free alkane
activation is the photosulfoxidation of alkanes applied in industry (see Chapter 4).
Although many promising systems have been developed and our comprehension
on this topic has progressed considerably, profitable, practical applications have not
yet been performed. It remains challenging to conciliate chemical, with economic and
engineering requirements.
The topic of the present dissertation fits in with this huge and complex landscape.
It is a study of a novel C-H functionalization of alkanes through TiO2 photocatalyzed
sulfoxidation accomplished with visible light irradiation to obtain sulfonic acids. A
rare example of an industrially applied process of direct functionalization of saturated
hydrocarbons is the photosulfoxidation of liquid alkanes by sulfur dioxide and oxygen
(Eq. 1.5). The reaction requires the presence of UV light which is generated by large
medium pressure mercury vapor lamps.
R-H + SO2 + ½ O2 + hν → RSO3H (1.5)
1. Introduction
14
In the case of linear C16-20 chain alkanes the resulting alkanesulfonic acids are used
as biodegradable surfactants.
The aim of the present work was to find out if a similar reaction could be
performed with visible light irradiation and without use of toxic mercury containing
lamps.
At the beginning we focused our research on a photocatalyst known to be active in
visible light photooxidations of 4-chlorophenol (4-CP), an ubiquitous pollutant. This
novel RhCl3-modified titania was synthesized, characterized and its role in 4-CP
photodegradation a me was investigated. Chapter 3 presents our results on RhCl3/TiO2.
Further investigations allowed us to observe that commercial titania P25 (75%
anatase / 25% rutile) was even more active in the visible photocatalytic sulfoxidation
although, as known, TiO2 absorbs only in UV range. Chapter 4 of this dissertation is
devoted to this reaction.
2. Literature Review
15
2. Literature Review
2.1 Heterogeneous Photocatalysis
Heterogeneous photocatalysis is a field of chemistry focused on liquid or gas
catalytic reactions occurring in presence of irradiated solids (normally
semiconductors).
Semiconductors can be excited by light with higher energy than the band gap and
an energy-rich electron-hole pair is formed. This mechanism can either be used
directly to generate electricity in photovoltaic solar cells or to drive a chemical
reaction in which the oxidation and reduction of substrates occur simultaneously. In
general, photocatalytic reactions are aimed to organic synthesis, degradation of
pollutants or to some special reactions like fixation of nitrogen or splitting of water.
In this section a brief overview on the fundamental properties of semiconductors
will be given and the basics of semiconductor photocatalysis will be discussed.
2.1.1 Fundamental Properties of Semiconductors
A very useful way to examine the properties of a semiconductor is the energy band
model.22-26 A solid can be viewed as “very large molecule” in which the number of
molecular orbital is so high that we can neglect the energy difference between them
until they can be considered a continuum forming energy band. The key electronic and
optical properties of a semiconductor are determined by two bands: the lowest
unoccupied energy band, called conduction band, and the highest occupied energy
band, called conduction band. The band gap is defined as the energy difference
between the lower edge of the conduction band and the higher edge of the valence
band.
Metals are good electronic conductors because their conduction and valence band
overlap allowing electron to occupy empty states in the conduction band and to move
freely in the lattice. Materials with Ebg ≥ 4 eV are defined as insulators and it is hardly
possible to promote an electron to the conduction band. In semiconductors the band
gap is small enough (typically 1.0 – 4.0 eV) to allow for increase in conductivity

2. Literature Review
16
through thermal- or photo-excitation. An electron can be excited to the conduction
band leaving mobile holes (positively charged vacancies) behind in the valence band.
The energy level at the top of the valence band determines the oxidizing ability of
photoholes, while the energy level at the bottom of the conduction band is actually the
reduction potential of the photoelectrons.
Figure 2.1: Formation of energy bands in the Si crystal. 3s and 3p orbitals of a single Si atom (a) become mixed to form 4 hybridized sp3 orbitals (ψhyb) (b). (c) The hybridized ψhyb orbitals on two neighboring Si atoms can overlap to form a bonding (full) orbital (ψB) and an antibonding (empty) orbital (ψA). (d) A cluster of Si atoms. With increasing the number of atoms the overlapping bonding and antibonding orbitals become more numerous and more closely spaced in energy, which, finally, leads to continuous bands of energy levels (e) in a Si crystal – the valence band (full) and the conduction band (empty) separated by a bandgap (Eg); (taken from Refs. 27 and 24).
The energy at which the probability of a level being occupied by an electron is 0.5
is referred to as Fermi level EF. From a thermodynamical point of view the Fermi level
is the electrochemical potential of the electron in the solid. In intrinsic semiconductors
the Fermi level is approximatively in the middle of the band gap and, when the band
gap is small enough, some electrons can be thermally excited from the valence band to
the conduction band at ambient temperature. In “extrinsic” semiconductors the
conductivity can be achieved by doping. When donor energy levels are present just
2. Literature Review
17
under the conduction band edge, the electrons can be easily thermally excited into the
conduction band, the electrons are the majority charge carrier and the material is a n-
type semiconductor. Accordingly, in an n-type semiconductor the Fermi level is right
below the conduction band. Similarly if acceptor energy levels are present above the
valence band edge, the electron can be thermally excited into these states leaving thus
positive holes in the valence band behind. In this case the holes are the majority
carriers, the semiconductor is a p-type and its Fermi level lies just above the valence
band edge.
When a semiconductor is irradiated by light with energy greater than the band gap
energy, an electron-hole pair is generated. Obviously, when the equilibrium state is
perturbed by light excitation, the semiconductor tends to return to the equilibrium.
Normally, this happens through recombination whereby the energy excess can be
dissipated as heat (radiationless process) or emitted as a photon (radiative emission).
In competition to this process the charges can be trapped at reactive surface states
capable of exchanging electrons with appropriate substrates.
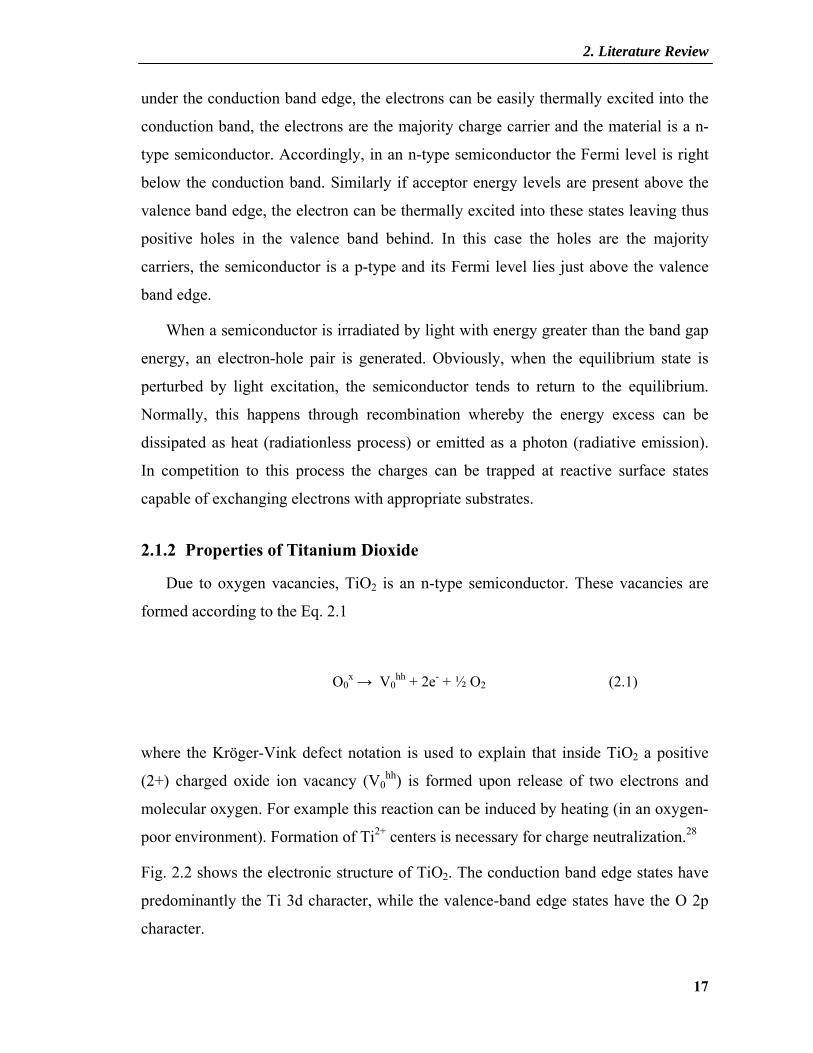
2.1.2 Properties of Titanium Dioxide
Due to oxygen vacancies, TiO2 is an n-type semiconductor. These vacancies are
formed according to the Eq. 2.1
O0x → V0
hh + 2e- + ½ O2 (2.1)
where the Kröger-Vink defect notation is used to explain that inside TiO2 a positive
(2+) charged oxide ion vacancy (V0hh) is formed upon release of two electrons and
molecular oxygen. For example this reaction can be induced by heating (in an oxygen-
poor environment). Formation of Ti2+ centers is necessary for charge neutralization.28
Fig. 2.2 shows the electronic structure of TiO2. The conduction band edge states have
predominantly the Ti 3d character, while the valence-band edge states have the O 2p
character.
2. Literature Review
18
Figure 2.2: Molecular orbital bonding scheme for anatase TiO2 (taken from Ref. 29): (a) atomic levels, (b) crystal- field split levels, and (c) final levels. The thin-solid and dashed lines represent large and small contributions, respectively. Note that the Fermi level (in the scheme drawn in the middle of the bandgap) will be, in reality, shifted to the vicinity of the conduction band edge due to oxygen vacancies.
Titanium dioxide is mainly found in three modifications: rutile (tetragonal),
anatase (tetragonal) and brookite (orthorhombic). Rutile is the stablest phase but
anatase is the polymorph most widely used for photocatalytic applications. The
reported band gap of anatase (3.2 eV) and rutile (3.06 eV) are very similar but the
former modification in general has a better photocatalytic activity.30 The reasons are
yet a source of debate. It has been suggested that the slightly higher anatase Fermi
level, the higher capacity to adsorb oxygen, the better electrons mobility, and the
higher degree of hydroxylation might explain this fact.31-34 That is why in the first part
of this work anatases modification with rhodium salts was performed. However, the
photocatalytic sulfoxidation of heptane turned out to give the best yield by using

2. Literature Review
19
Degussa P25, a commercial mixed phase of rutile (25%) and anatase (75%). The
enhanced activity of P25 is a general trend. As proposed by Thurnauer et al., the
electron generated on rutile is transferred to anatase. This special separation largely
prevents recombination and therefore increases the photocatalytic activity.35
The TiO2 surface is schematically depicted in Fig. 2.3. In reality both the titanium
and oxygen atoms are not coordinatively saturated giving rise to the so-called surface
defects. Water molecules through dissociative adsorption can fill up these sites so that
the surface presents a high concentration of OH groups (about 5 OH groups per nm2).
Some of them are bidentately bound (Ti(OH)Ti) and have acid character (pKS = 2.9)
while the monodentately bonded OH groups (≡Ti-OH) have basic character (pKS =
12.7).
For these reasons the TiO2 surface can be protonated or deprotonated depending on
the pH value of the aqueous suspension.
Figure 2.3: Simplified scheme of the protonation and deprotonation of hydroxylated TiO2 surface leading to positive and negative net charge at the surface, respectively.(Taken from ref.36) The isoelectric point (pHIEP) of TiO2 is typically about 5.8–7.5.37-41 The pKA values of monodentate and bidentate OH groups are reported to be 12.7 and 2.9, respectively.40
The pH value at which the net surface charge is zero is called pHIEP (isoelectric point).
If pH > pHIEP there are not positive charges on the surface, if pH < pHiep there are not
negative charges on the surface. Such a pH dependence on the surface charge
2. Literature Review
20
influences also the energetic position of the valence and conduction bands (see
Paragraph 3.2.1).
2.1.3 Photocatalysis Mechanism
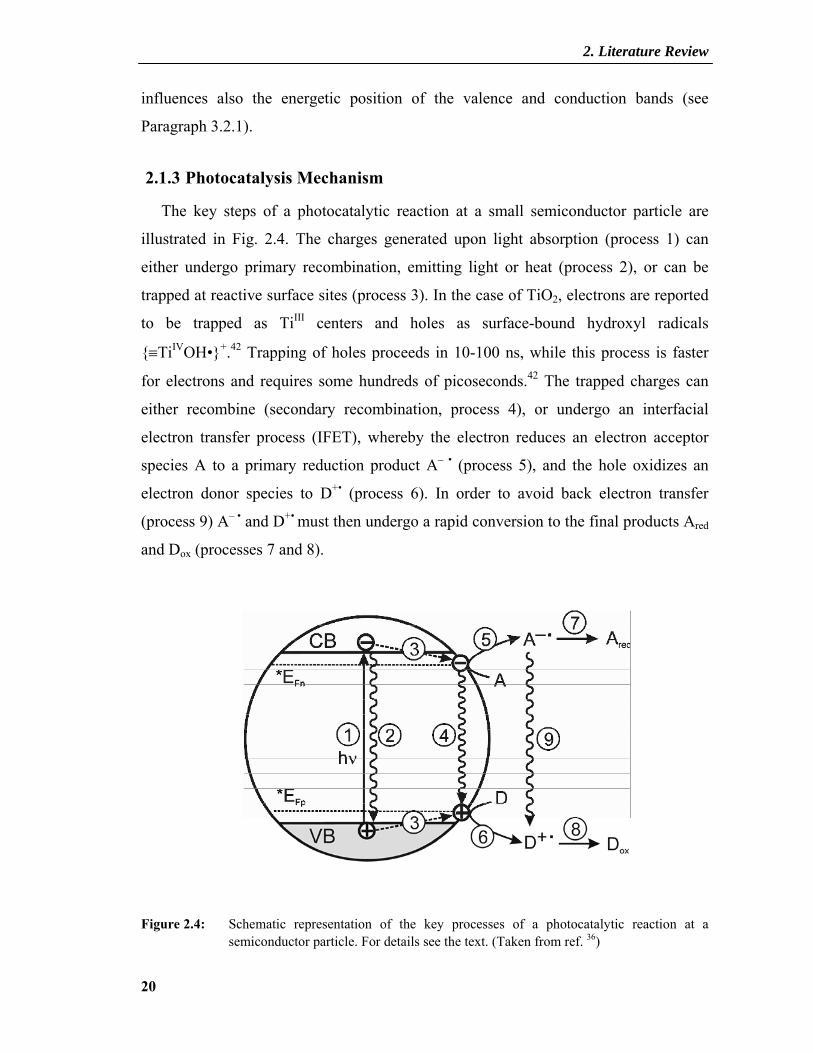
The key steps of a photocatalytic reaction at a small semiconductor particle are
illustrated in Fig. 2.4. The charges generated upon light absorption (process 1) can
either undergo primary recombination, emitting light or heat (process 2), or can be
trapped at reactive surface sites (process 3). In the case of TiO2, electrons are reported
to be trapped as TiIII centers and holes as surface-bound hydroxyl radicals
≡TiIVOH•+.42 Trapping of holes proceeds in 10-100 ns, while this process is faster
for electrons and requires some hundreds of picoseconds.42 The trapped charges can
either recombine (secondary recombination, process 4), or undergo an interfacial
electron transfer process (IFET), whereby the electron reduces an electron acceptor
species A to a primary reduction product A– • (process 5), and the hole oxidizes an
electron donor species to D+• (process 6). In order to avoid back electron transfer
(process 9) A– • and D+• must then undergo a rapid conversion to the final products Ared
and Dox (processes 7 and 8).
Figure 2.4: Schematic representation of the key processes of a photocatalytic reaction at a semiconductor particle. For details see the text. (Taken from ref. 36)
2. Literature Review
21
Hence, for example, in a typical photocatalytic oxidation of organic water
pollutants on TiO2 the reacting holes are scavenged either directly by the pollutant or
by adsorbed hydroxyl ions to produced hydroxyl radicals which can then oxidize the
pollutant due to their high oxidizing power. Simultaneously, the photogenerated
electrons reduce molecular oxygen to a superoxide radical which can then undergo
further reactions to produce hydroxyl radicals via following reactions:33,42-45
O2 + eCB– → O2
•– (2.2)
O2•– + H+ → HO2
• (2.3)
HO2• + HO2
• → H2O2 + O2 (2.4)
O2•– + HO2
• → O2 + HO2– (2.5)
HO2– + H+ → H2O2 (2.6)
H2O2 + O2•– → •OH + OH– (2.7)
H2O2 + eCB– → •OH + OH– + O2 (2.8)
The thus produced hydroxyl radicals can again contribute to the mineralization of
the pollutant.
The general equation of degradation of 4-CP on TiO2 can be written as follows.
2p-ClC6H4OH + 13O2 → 12CO2 +2H+ +2Cl- + 4H2O (2.9)
in the case of total mineralization.
2. Literature Review
22
2.1.4 Visible Light Activity of Modified Titania
Ideally, a semiconductor photocatalyst should be chemically and biologically inert,
photocatalitically stable, easy to produce and to use, cheap and without risks for
environment or humans. Titanium dioxide is close to being an ideal photocatalyst, the
only problem is that it does not absorb visible light and only 4% of the solar spectrum
can be utilized. A shift of the absorption edge of TiO2 to larger wavelengths is
expected to increase the solar light conversion efficiency.
Visible light photosensitization consists of photoinduced electron transfer. It can
be achieved by four main approaches: 1) bulk doping, 2) formation of coupled
semiconductors, 3) metal-semiconductor composites, and 4) surface modification.
Bulk doping29,46-48 in a very few cases induces a band gap narrowing. The most
important example is the Cr doped anatase produced by ion implantation.49 Coupled
semiconductors50-54 are formed when TiO2 interacts with particles of semiconductors
of smaller band gap and different band edge potentials like CdS (Eg = 2.5 eV). Visible
light irradiation leads to charge separation only in the smaller band gap semiconductor
and subsequently an electron can be injected into the CB of TiO2 whereas the hole
remains in the valence band of the other semiconductor avoiding charge
recombination.
The most commonly used technique of TiO2 photosensitization is surface
modification. It involves formation of covalent or ionic bonds between a
semiconductor surface and chromophoric molecules (sensitization mechanism) or
formation of chromophoric surface species upon interaction with chromogenic
molecules (charge transfer complex mechanism CTC) .55
In the first case diverse organic dyes (erythrosin B, porphyrins56,57,
phtalocyanines,58,59 thiacarbocyanine dyes60) and metal complexes (Fe(II),55 Pt(IV)
complexes61) adsorbed on the TiO2 surface, absorb a photon of visible light (the
adsorbate itself is colored) and subsequently inject an electron into the conduction
band of the semiconductor. This can result in destruction of the dye and potentially of
other solutes. The above described mechanism, known also as photoinduced electron
transfer, is summarized in Eqs. 2.9 and 2.10.

2. Literature Review
23
TiO2---S + hν → TiO2---S* (2.9)
TiO2---S* → TiO2(e-cb)---S+· (2.10)
The CTC mechanism can allow visible light activation of a system in which neither
the catalyst nor the adsorbate (generally enediols, chlorophenols62) absorbs visible
light by itself. The adsorbate is colorless but becomes colored when adsorbed to TiO2.
This mechanism is also known as optical electron transfer and could be summarized
as in Eqs. 2.11 and 2.12.
TiO2 + S ↔ [TiO2-S] (2.11)
[TiO2-S] + hνCT → TiO2(e-cb)-S+· (2.12)
The mechanism presented in the Chapter 3 of this work, devoted to the synthesis and
characterization of the novel RhCl3-TiO2 catalyst, can be seen as a sensitization
mechanism whereas the catalytic photosulfoxidation of alkanes (Chapter 4) is initiated
through a CTC mechanism.
2. Literature Review
24
2.2 Activation of C-H Bonds by Metal Complexes
The knowledge of the most important theories and experimental evidences about
the role of the metal center in C-H activation is obviously a necessary prerequisite for
understanding the mechanism of the reaction presented in this dissertation. Therefore,
in this part a very brief outline of the most significant reactions will be given. C-H
activation is conveniently classified into three groups based on the mutual interaction
between the metal center and the hydrocarbon. The reactions frequently occur in
solutions at room temperature although sometimes heating is required and certain
reactions are stimulated by irradiation. Either light or heat is essential for the
abstraction of several ligands from the initial complex to form a coordinatively
unsaturated species capable of oxidatively adding the C-H compound.
2.2.1 Activation via σ-Organyl Derivatives
In this group are collected the reactions in which there is a direct contact
between the C-H bond and the metal ion. An organometallic derivative, i.e. a
compound containing a M-C σ-bond63, is formed in which a metal centre interact with
the electron pair forming the C-H σ bond. Fig. 2.5 shows two possible intermediate
structures. Structure (a) is the most probable one because of direct analogies with well
known agostic species64.
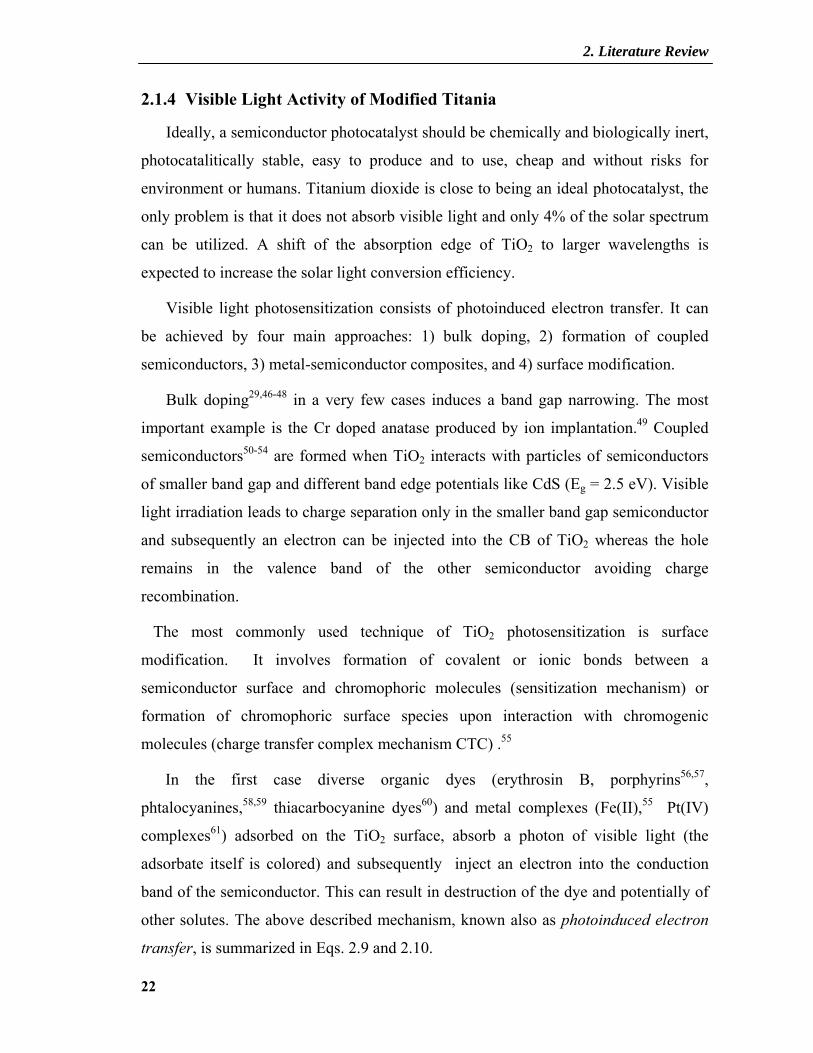
a b
Figure 2.5: Two possible structures of intermediates: a) the simplest structure analogous to that observed in agostic complexes b) structure with two coordinated C-H bonds, suggested by theoretical calculations.
LnM CHR
H
H
CH2R
H LnM
2. Literature Review
25
However, theoretical calculations suggest a range of other possible structure as
well.65 No stable σ-complexes have yet been isolated but many evidences suggest that
they should exist. The M-C bond should be cleaved in order to make the process
catalytic. Once an alkane complex has formed, the coordinated C-H bond is cleaved to
yield the product.
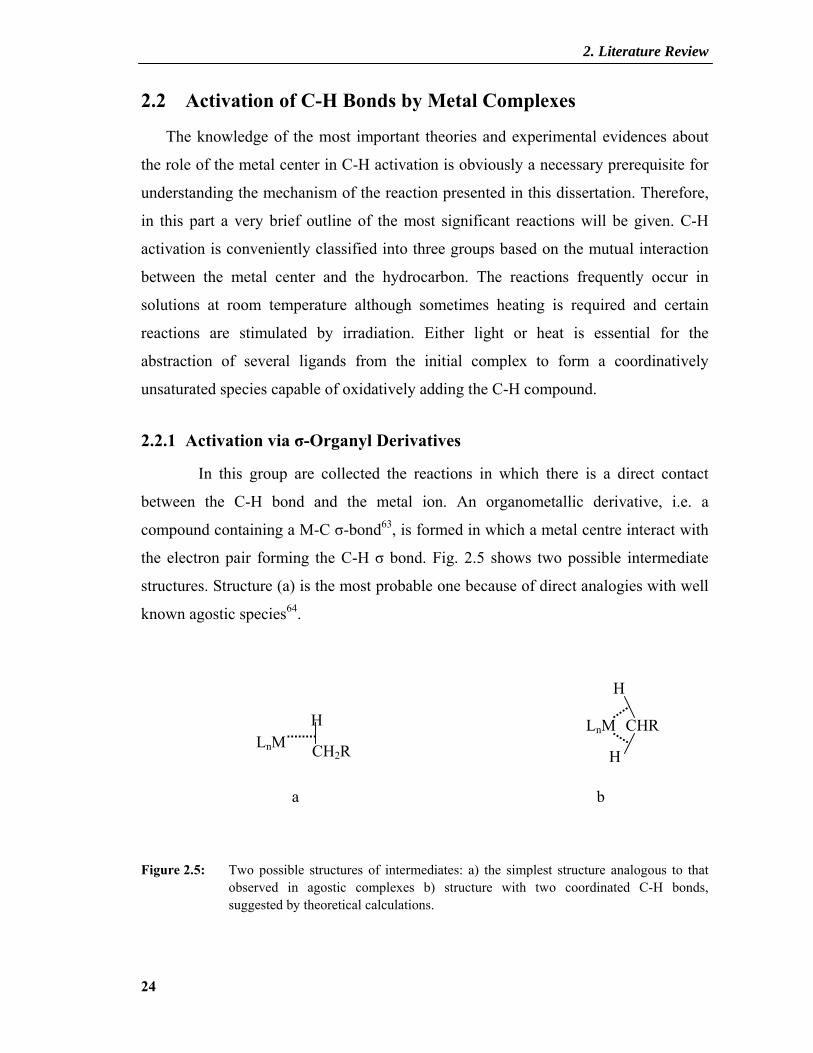
The cleavage of the C-H bond by direct participation of a transition metal ion
proceeds via an oxidative addition mechanism or an electrophilic substitution
mechanism. The former is typical for electron-rich, low-valent complexes of the
transition metals at the right side of the periodic table (Re, Fe, Ru, Os, Rh, Ir, Pt).
Metals in high oxidation states take part in electrophilic substitution reactions.
A general oxidative addition reaction is illustrated in Fig. 2.6.
Figure 2.6: General scheme of oxidative addition reactions
A metal atom (M) inserts itself between the atoms of the C–H bond. The metals
oxidation state is two units higher in the organyl hydride complex than it was in the
initial metal compound. This step is formally analogous to the interconversion between
dihydride and dihydrogen complexes, which is often extremely facile.2
An estimation of the heat of oxidative addition via the following Eq. 2.13
LnM + RH → R-LnM-H (2.13)
shows that this reaction is usually endothermic with ΔH ≈ +10 Kcal/mol. The above
consideration refers to complexes of the first series of transition metals, as the alkyl-
metal bonds may be stronger in the case of heavy metals.66
[LnMx] + RH → LnMx+2
H
R

2. Literature Review
26
The oxidative addition of alkanes to form alkyl hydride complexes was definitively
demonstrated by Bergman in 1982 in studies using iridium complexes67(Fig. 2.7).
Figure 2.7: Oxidative addition of cyclohexane with Cp*Ir(H)2PMe3.
The complex Cp*Ir(H)2PMe3 (Cp* = pentamethylcyclopentadienyl) was irradiated
in a cyclohexane solution to produce the complex Cp* PMe3Ir (H)(C6H11) which was
then converted into the more stable derivative Cp* PMe3Ir (Br)(C6H11), by treatment
with CHBr3 at -60°C.
It is interesting to note that thermal and photochemical activation sometimes afford
the formation of different products. Heating a solution of RhHBPz*(CO)(C2H4) (Pz* =
3,5 dimethylpirazole) in benzene entails the elimination of the ethylene π ligand and
formation of a phenylrhodium hydride complex.68 However irradiation of the same
solution causes the hydride ligand to add to the ethylene molecule, rather than to metal
atom, which results in the appearance of an σ-ethyl group in the complex.69
A considerable proportion of processes initially proceed by an oxidative addition
mechanism. The first stage forms an alkyl hydride complex which undergoes further
transformations. The resulting reaction may be a H-D exchange, dehydrogenation, or
the introduction of a functional group into a C-H compound.2 Transformation such as
dehydrogenation (Eq. 2.14) and carbonylation (Eq. 2.15)
RCH2CH3 → RCH2=CH2 + H2 (2.14)
CH4 + CO → CH3CHO (2.15)
Ir (PMe3)
IrH
PMe3 H
H

2. Literature Review
27
should be readily accomplished at centers that activate C-H bonds, but both of these
reactions are thermodynamically uphill anywhere near room temperature. The partial
oxidation of alkanes to alcohols, aldehydes, acids and other oxygenates, is in contrast
thermodynamically favored. However, many of the known C-H activating centers are
highly sensitive to oxygen and other oxidants.1
Various transition metal complexes readily abstract hydrogen atoms from alkanes to
produce π-olefin complexes. If the π-complex is relatively unstable, the π-ligand
dissociates making the reaction catalytic with respect to metal complex. An example
of thermally induced reaction of this type is shown in Fig. 2.8.70
Figure 2.8: Dehydrogenation of cyclooctane. L: PPh(CH2CH2PPh2)2.
Continuous removal of the hydrogen evolved (through reflux or by adding a
molecular hydrogen acceptor such as norbonene) displaces the equilibrium toward the
olefin.
Complexes of rhodium and iridium are known to be the most effective
photocatalysts for alkane dehydrogenation. The full light irradiation of a solution of
RhCl(CO)(PMe3)2 in cyclohexane at room temperature by a mercury high pressure
lamp, induce the formation of cyclohexene and molecular hydrogen.71 Analogously,
the dehydrogenation of n-hexane and alkylcyclohexane affords a mixture of hexenes
and alkylcyclohexenes respectively.72 After photolytic expulsion of a carbonyl ligand
from the complex RhCl(CO)(PMe3)2, oxidative addition to RhCl(PMe3)2 is rapidly
established, followed by elimination of hydrogen from the β-position to yield the
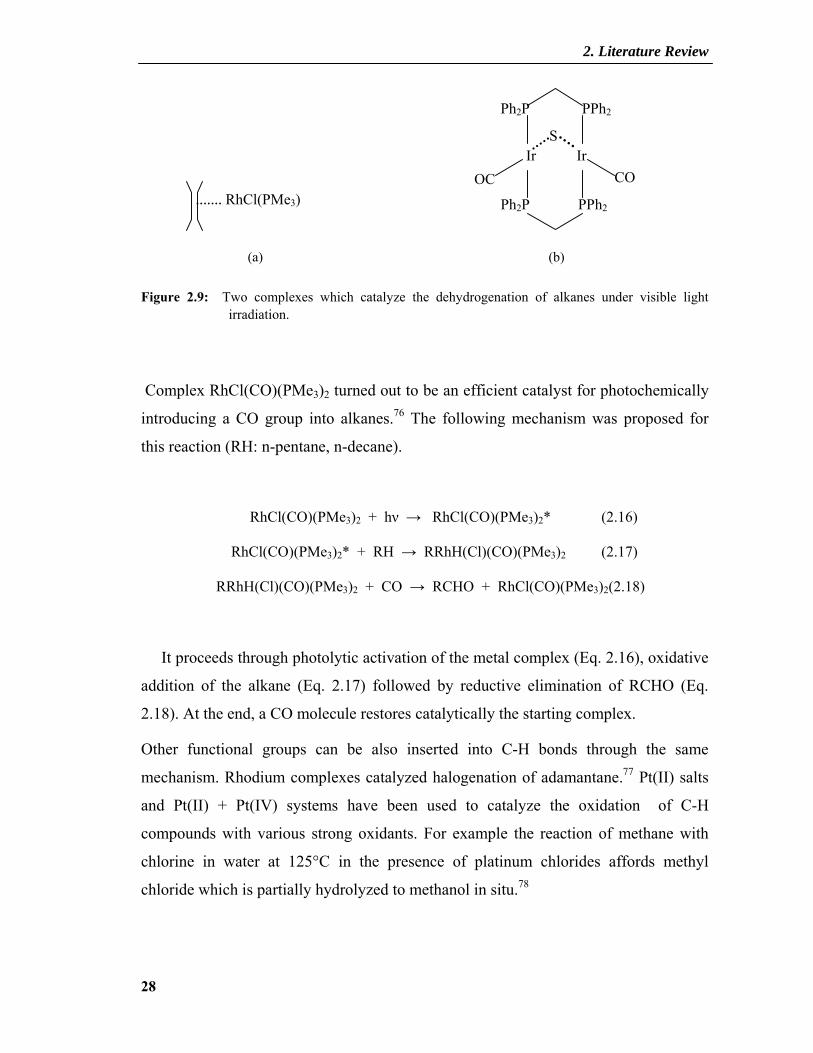
olefin.73 UV light was used in almost all cases but complexes a74 and b75 in Fig. 2.9
catalyze the dehydrogenation of alkanes under irradiation with λ > 375 nm and λ > 450
nm, respectively.
LReH5 or LWH6
Hydrogen acceptor
2. Literature Review
28
(a) (b)
Figure 2.9: Two complexes which catalyze the dehydrogenation of alkanes under visible light irradiation.
Complex RhCl(CO)(PMe3)2 turned out to be an efficient catalyst for photochemically
introducing a CO group into alkanes.76 The following mechanism was proposed for
this reaction (RH: n-pentane, n-decane).
RhCl(CO)(PMe3)2 + hν → RhCl(CO)(PMe3)2* (2.16)
RhCl(CO)(PMe3)2* + RH → RRhH(Cl)(CO)(PMe3)2 (2.17)
RRhH(Cl)(CO)(PMe3)2 + CO → RCHO + RhCl(CO)(PMe3)2(2.18)
It proceeds through photolytic activation of the metal complex (Eq. 2.16), oxidative
addition of the alkane (Eq. 2.17) followed by reductive elimination of RCHO (Eq.
2.18). At the end, a CO molecule restores catalytically the starting complex.
Other functional groups can be also inserted into C-H bonds through the same
mechanism. Rhodium complexes catalyzed halogenation of adamantane.77 Pt(II) salts
and Pt(II) + Pt(IV) systems have been used to catalyze the oxidation of C-H
compounds with various strong oxidants. For example the reaction of methane with
chlorine in water at 125°C in the presence of platinum chlorides affords methyl
chloride which is partially hydrolyzed to methanol in situ.78
RhCl(PMe3)
Ir Ir S
Ph2P
Ph2P
PPh2
PPh2
CO OC
2. Literature Review
29
Complexes of metals in high oxidation state normally activate alkanes through
electrophilic attack usually in a strongly polar medium such as water or an anhydrous
strong acid.79
This type of reaction is illustrated in Eq. 2.19 without showing the presumed
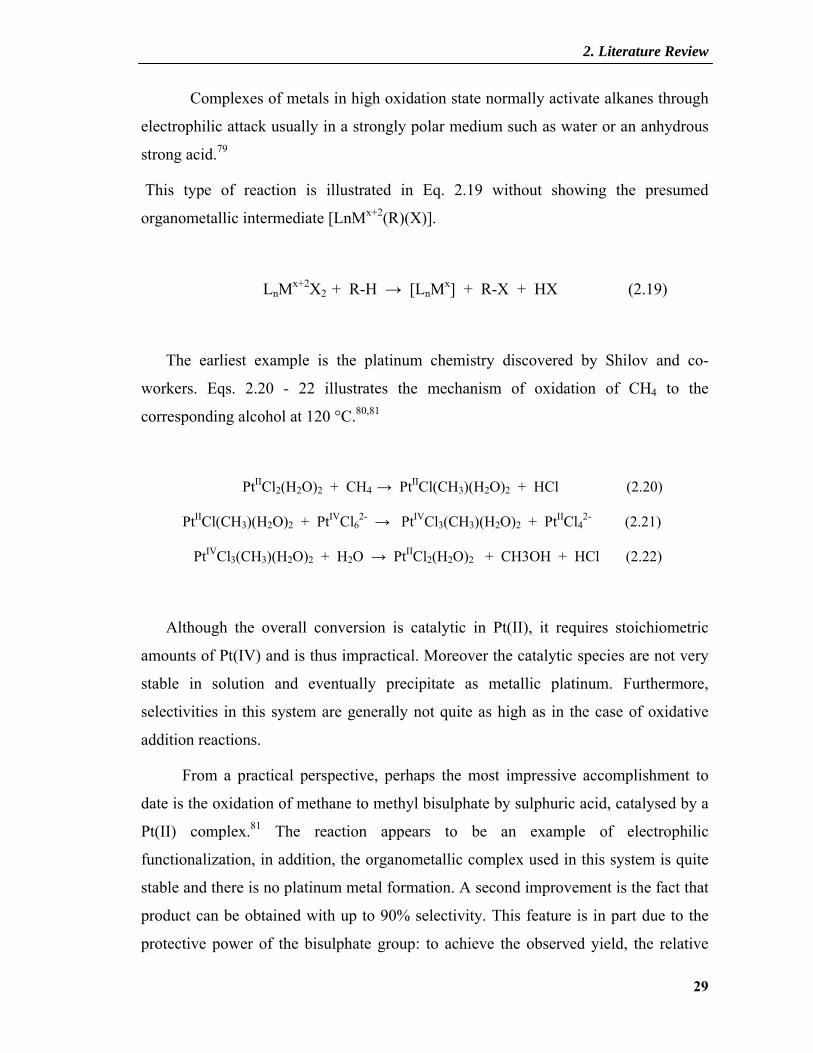
organometallic intermediate [LnMx+2(R)(X)].
LnMx+2X2 + R-H → [LnMx] + R-X + HX (2.19)
The earliest example is the platinum chemistry discovered by Shilov and co-
workers. Eqs. 2.20 - 22 illustrates the mechanism of oxidation of CH4 to the
corresponding alcohol at 120 °C.80,81
PtIICl2(H2O)2 + CH4 → PtIICl(CH3)(H2O)2 + HCl (2.20)
PtIICl(CH3)(H2O)2 + PtIVCl62- → PtIVCl3(CH3)(H2O)2 + PtIICl4
2- (2.21)
PtIVCl3(CH3)(H2O)2 + H2O → PtIICl2(H2O)2 + CH3OH + HCl (2.22)
Although the overall conversion is catalytic in Pt(II), it requires stoichiometric
amounts of Pt(IV) and is thus impractical. Moreover the catalytic species are not very
stable in solution and eventually precipitate as metallic platinum. Furthermore,
selectivities in this system are generally not quite as high as in the case of oxidative
addition reactions.
From a practical perspective, perhaps the most impressive accomplishment to
date is the oxidation of methane to methyl bisulphate by sulphuric acid, catalysed by a
Pt(II) complex.81 The reaction appears to be an example of electrophilic
functionalization, in addition, the organometallic complex used in this system is quite
stable and there is no platinum metal formation. A second improvement is the fact that
product can be obtained with up to 90% selectivity. This feature is in part due to the
protective power of the bisulphate group: to achieve the observed yield, the relative
2. Literature Review
30
reactivity of methane versus methyl bisulphate must be of the order of 100:1.
However, the high selectivity achieved comes at a price: the product is of little direct
use and would need to be separately converted to a more useful compound, such as
methanol.
Another type of reaction which occurs between a saturated C-H bond and a
highvalent metal complex is the metathesis, which occurs according to Eq. 2.23:
M-R + R′-H → M-R′ + R-H (2.23)
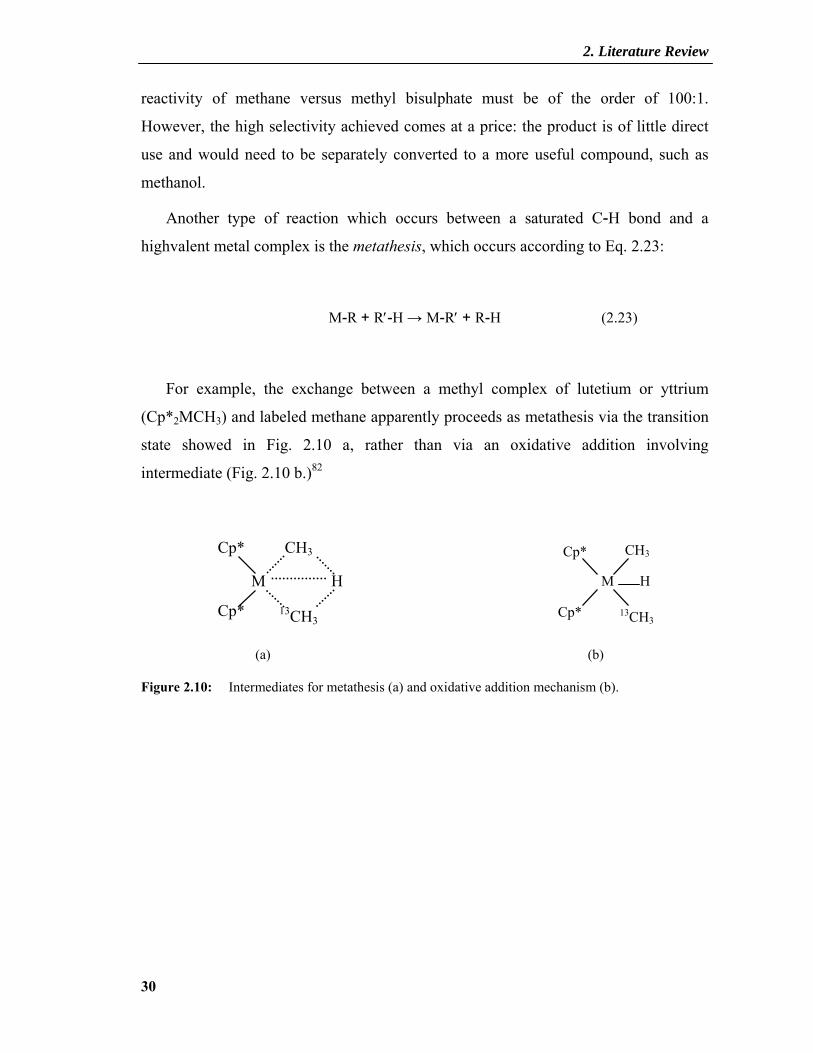
For example, the exchange between a methyl complex of lutetium or yttrium
(Cp*2MCH3) and labeled methane apparently proceeds as metathesis via the transition
state showed in Fig. 2.10 a, rather than via an oxidative addition involving
intermediate (Fig. 2.10 b.)82
(a) (b)
Figure 2.10: Intermediates for metathesis (a) and oxidative addition mechanism (b).
M
Cp*
Cp*
CH3
13CH3
H M
Cp*
Cp*
CH3
13CH3
H
2. Literature Review
31
2.2.2 Activation through Electron and Hydrogen Transfer
In this second group we include reactions in which a metal complex cleaves a C-H
bond but no σ-C-M bond is formed. The function of the metal complex usually
consists of abstracting an electron or a hydrogen atom from the hydrocarbon RH. The
radical ions RH+· or radicals R· formed thereof interact with other species, such as
molecular oxygen which is present in the solution or with one of the ligands of the
metal complex. For example, in the hydroxylation of an alkane by an oxo complex of a
high-valent metal, an alkyl radical is generated and subsequently reacts with a
hydroxyl ligand according to Eq. 2.24:
RH + O=[Mn+] → R· + HO-M(n-1)+ → ROH + M(n-2)+ (2.24)
The remaining metal complex can be then oxidized back to its original form. In
this reaction the metal-oxo complex is a strong oxidant of the type CrO42- or MnO4
- or
an oxoferryl species.83 The addition of strong acids accelerates the reaction giving rise
to protonated species such as O=Cr(OH)3+ and HCrO3
+. Furthermore, the oxidation of
alkanes by oxoderivatives of Cr(VI) is greatly accelerated by irradiation.84,85 Acetic
acid and acetonitrile have been used as solvents and the products were alcohol and
carbonyl compounds. Also complexes containing ruthenium(IV) oxidize in the same
way alkanes both in the dark and under irradiation.86,87
In many cases it can not be decided if the hydrogen transfer step is preceeded by
electron transfer activation step. The final result would be also a metal hydride and an
alkyl radical as showed in Eq. 2.25.
[Mn+] + RH → [RH]+· + [M(n-1)+] → [Mn+]-H + R· (2.25)
The mechanism of aerobic alkane photooxidation catalyzed by metal oxo
complexes includes the formation of a photoexcited species which is capable of

2. Literature Review
32
abstracting a hydrogen atom from an alkane. The alkyl radical thus formed rapidly
adds a molecule of oxygen. The resulting species eventually forms an alkyl
hydroperoxide which decomposes to produce a ketone and an alcohol.
MVI=O + hν → MV-O· (2.26)
MV-O· + RH → MV-OH + R· (2.27)
R· + O2 → ROO· (2.28)
ROO· + MV-OH → ROOH + MVI=O (2.29)
2MV-OH + ½O2 → 2MVI=O + H2O (2.30)
2.2.3 Indirect Activation via Reactive Oxygen Species
Whereas the reactions included in the first and second group require direct contact
between a molecule of the C-H compound and the metal complex (albeit via the
ligand), complexes belonging to the third type initially activate some other reactant
(e.g. O2 or H2O2) to form a reactive species which then attacks the hydrocarbon
molecule. The reactive species is usually a radical, such as a hydroxyl radical, which
attacks the hydrocarbon independent of any participation of the metal complex.
Many industrial processes are based on these reactions and this is a field of
growing interest due to the mechanistic similarities with enzymatic reactions.
The industrial oxidation of alkanes proceeds through heating them under oxygen
at rather high temperature (usually above 100°C). These reactions are always
termodynamically favored due their high exothermicity. The main problem is to
prevent various parallel and consecutive reactions which make these processes
unselective. Being radical chain processes, any additive which can react with free
radicals and form stable adducts, will inhibit deep oxidation.88 Ions of transition metals
are used as catalyst in these reactions.89 The role of the metal ion Mn+ is to produce
free radical reacting with a molecule AB according to the Eqs. 2.31 and 2.32.

2. Literature Review
33
Mn+ + A-B → M(n+1)+ + A· + B- (2.31)
M(n+1)+ + A-B → Mn+ + A+ + B· (2.32)
The metal ion can alternately increase or decrease its oxidation state; thus, it plays
the role of a catalyst. Furthermore, it can also reacts with hydroperoxides formed in the
course of the oxidation to produce new free radicals as in Eq. 2.33 - 35 with Co (II/III)
as catalyst.90,91
ROOH + CoIII → ROO· + H+ + CoII (2.33)
CoII + ROO· → ROO- + CoIII (2.34)
ROOH + CoII → RO· + OH- + CoIII (2.35)
Thermal reactions operating at milder conditions have been developed recently.
The weakly solvated acetonitrile complex [Co(NCMe)4](PF6)2, catalyzes the air
oxidation of cyclohexane and adamantane at 75 °C to the corresponding ketones and
alcohols.92 Halogenated metalloporphyrins are catalysts for the selective air oxidation
of light alkanes to the corresponding ketones.93 Worth to mention are the Gif systems94
(from Gif-sur-Yvette) for selective oxidation and oxidative functionalization of
alkanes in mild conditions by molecular oxygen in the presence of a reducing agent, an
iron complex, a carboxylic acid and pyridine. Despite of numerous works devoted to
Gif systems, their mechanism is not clear and they are of no technical relevance.
In 1989 a few groups simultaneously described the aerobic photo-oxygenation of
alkanes in solution containing catalytic amounts of metal oxo complexes to alcohols
and ketones. These complexes were heteropolymetalates95 and polyoxotungstate96 in
various solvents. Other oxo compounds which also photocatalyze alkane oxygenation
include K2Cr2O7,97 CrO3,98 (nBu4N)Cr4O13,99 and UO2Cl2.100 Also molybdenum and
vanadium complexes have been reported to catalyze alkane photooxidation.101
2. Literature Review
34
Also iron(III) chloride has been found to be a photocatalyst for alkane oxidation
with atmospheric oxygen.102 The first step of this process seems to be the
photoexcitation of the iron chloride followed by homolysis of the Fe-Cl bond. The
chlorine radical then attacks the alkane. The resulting Fe(II) can be back oxidized by
molecular oxygen or by an alkylperoxo radical. Final products are the corresponding
alcohols and ketones. Other transition metal chlorides such as CuCl2, AuCl4-, PtCl6
2-,
CrCl3 also catalyze this reaction. The ketone:alcohol ratio can be varied through
choosing different solvents. Furthermore, in the presence of small amount of
hydroquinone, the formation rate of ketone sharply decreases while the formation rate
of alcohol does not. Thus, free radicals may participate in the ketone formation while
alcohol formation does not involve them.
In summary, although a large group of alkane activation reactions have been
reported in the literature, no technical application could be developed from these basic
studies.

2. Literature Review
35
2.3 Alkane Activation at Titania
Heterogeneous catalysis in selective organic synthesis is not frequently employed,
although nowadays the demand for replacement of traditional oxidation methods with
cleaner ones is increasing. TiO2 sensitized organic photosynthetic reactions include
oxidation and oxidative cleavage, reduction, isomerization, substitution and
polymerization.103,104 Alkanes activation through UV-light irradiation of TiO2
suspensions is well documented in literature. Highly oxidizing OH radicals (the
oxidizing potential of this radical is 2.8 V, being exceeded only by fluorine) formed
through reductive and/or oxidative paths are able to oxidize alkanes to alkyl radicals
which then afford the end products through a radical chain.
VB holes can also react directly with organic compounds before they are trapped.
A thermodynamic estimation for the concerted process in aqueous solution reveals that
RH → R· + H+ + e- (2.36)
the reaction (Eq. 2.36) is endergonic by at least 1.85 eV. This value can be obtained by
using E0 (H+/H) = -2.42 V (H20)105 and a bond dissociation energy of 3.22 eV (for n-
heptane) and converting these values to the ΔG(H2O) values by substracting 0.1 eV
for the solvent contribution. Assuming a potential of 2.5 V for the photogenerated hole
in the valence band of TiO2 make this oxidation thermodynamically possible.
In this sense almost every photosynthetic reaction with TiO2 can be included in the
third class of the classification made in Paragraph 2.1. In fact, TiO2 may be seen as an
non conventional Ti(IV) complex which forms active species which in turn activate a
substrate. Generally, photocatalytic oxidation of alkanes at TiO2 affords products
depending on the reaction medium. The oxidation of neat liquid n-heptane and 2,2-
dimethylbutane at Pt/TiO2 under UV light irradiation (the presence of deposited
platinum is, in fact, not necessary), is reported to lead to three ketones and one ketone,
respectively, as is expected if the oxidation takes place only on secondary C-atoms. No
cleavage products were found in contrast to the same reaction performed with the
2. Literature Review
36
corresponding gases. Furthermore, different selectivities can be obtained by operating
in the gas phase or in neat-liquid phase, depending on the organic substrate. In fact, the
liquid alkane can act as a solvent of the products of primary oxidation and prevent
them from further oxidation.104
The oxidation of cycloalkanes leads to ketones as major products. The highest
reactivity is achieved for cyclohexane. Cyclohexanol and cyclohexanone, key products
in the synthesis of adipic acid and caprolactam, are obtained conventionally by
catalytical oxidation of cyclohexane with molecular oxygen at elevated temperatures
and pressures in a series of liquid-phase reactors. The single step conversion is kept
low, usually under 10% to minimize deep oxidation and formation of CO2. Using
photocatalysis with TiO2 under UV light irradiation, the oxidation of cyclohexane can
be obtained in the liquid phase at room temperature and pressure.40,106,107 Utilizing a
proper solvent (that minimizes the adsorption strength of the desired products on TiO2,
does not compete with cyclohexane and oxygen for adsorption sites, and does not form
radicals on the illuminated TiO2 surface) leads to an increase of the reaction rate and
the selectivity to cyclohexanol and cyclohexanone and a higher ratio
cyclohexanol/cyclohexanone over the use of neat cyclohexane (in which 85% of the
product was cyclohexanone, 2% was cyclohexanol and 12% CO2). The highest
product formation rate mentioned in literature is observed for dichloromethane as
solvent, which preferentially adsorbs on the TiO2 surface forming a reactive radical
which then abstracts a hydrogen atom from cyclohexane.
It is worth to note that the concentration of the monooxygenation products
increases rapidly in the partial pressure range from 10 to 100 Torr and that above 200
Torr the dependence on pO2 becomes negligible. After formation of alkyl radicals,
cyclohexanol is likely obtained by reaction of species formed via valence band
oxidation process as shown in Eqs. 2.37 - 41.
R· + (OH·)ads → (ROH)ads (2.37)
R· + O2 → ROO· (2.38)
ROO· + RH → R· + ROOH (2.39)
2. Literature Review
37
ROOH + e- (TiIII) → RO· + TiIV-OH (2.40)
RO· + RH → ROH + R· (2.41)
Cyclohexanone is mainly formed by reaction of intermediate radicals with
activated oxygen species as illustrated in Eqs. 2.42 - 45.
(R2CHOH)ads + 2OH· → R2C=O + 2H2O (2.42)
R2CHOO· + e- (TiIII) → R2C=O + TiIV-OH (2.43)
R2CH· + O2- → R2C=O + OH- (2.44)
R2CH· + HO2· → RO + H2O (2.45)
An interesting study of functionalization was performed with adamantane.108 This
C-H activation has been obtained with TiO2 under UV light irradiation through either
oxygen incorporation109 or C-C bond forming reactions.108 Both oxygen and
inorganic/organic oxidants have been used as electron scavengers. Whereas in MeCN
under air 1- and 2-adamantanol and adamantanone are produced with limited
degradation and preference for functionalization at the 1-position, the oxidation is less
selective in CH2Cl2. In N2-flushed CH3CN solutions with Ag+ as electron acceptor,
products from trapping of both 1-adamantyl radical (adamantyl methyl ketone) and
cation (N-adamantylacetamide) are obtained. Irradiation in a mixed solvent of CH3CN
(2.0 g) and C3H7CN (1.96 g) containing adamantane (40 mg) and TiO2 powder as the
photocatalyst at λ < 340 nm affords 30 μmol of 1-adamatanol, 5 μmol of 2-
adamantanone and minor amounts of other isomers.
In summary, it is recalled that all these photoactivation reactions require the use of
expensive UV light. In artificial systems it is produced by gas discharge lamps
containing toxic mercury, whereas in the natural system (solar light) it is present only
in a very small amount (4%).

2. Literature Review
38
The starting point of this dissertation was to find a TiO2-based catalyst which
enables alkane activation under visible light irradiation. The novel rhodium modified
titania, described in the next chapter, induces a fast degradation of the model pollutant
4-chlorophenol and it is quite active in the visible catalytic photosulfoxidation of
alkanes described in Chapter 4.
3. Visible-Light Photocatalysis by a Titania-Rhodium (III) Complex
39
3. Visible-light Photocatalysis by a Titania-Rhodium (III) Complex∗
3.1 Introduction
In the Kisch group was recently found that surface-modification of titania by
platinum(IV) chloride affords photocatalysts active in the mineralization of 4-
chlorophenol (4-CP) and many other pollutants with visible light (λ ≥ 455 nm).61,110
These novel materials are easily obtained through stirring a suspension of anatase
powder (TH) in hexachloroplatinate solution and subsequent thermal treatment. From
desorption experiments it was concluded that chemisorption took place affording an
oxygen bound surface complex of the proposed composition [Ti]OPtCl4Ln-, (L =
H2O, OH-, n = 1, 2,)61 abbreviated as Pt(IV)/TH in the following. Thus, the
semiconductor may be considered as an unconventional ligand in a transition metal
coordination complex. The quasi-Fermi level of electrons (nEF*) of this hybrid
semiconductor was changed considerably as a function of surface loading. At pH 7 the
value of −0.54 V as found for the anatase hydrate powder TH was shifted to −0.49,
−0.45, and −0.28 V (vs. NHE) when the surface was covered by 1.0, 2.0, and 4.0wt%
of platinum, respectively. This resembles the corresponding anodic shift observed
upon adsorption of fluoride ions.111 One of the most active photocatalysts in 4-CP
mineralization was 4.0%Pt(IV)/TH, a high surface area (260 m2g-1) material
containing 4.0wt% of platinum. Both upon visible and ultraviolet excitation this novel
titania complex is a superior photocatalyst as compared to previously known titania
materials. It even catalyzes the mineralization of cyanuric acid, which is usually the
final product in atrazine degradation by titania and other advanced oxidation
processes. Fig. 3.1 summarizes the proposed mechanism for the primary reaction
steps.112,113
∗ Part of this work has been published.

3. Visible-Light Photocatalysis by a Titania-Rhodium (III) Complex
40
O2/O2–
CB
VB
TiO2
LnPtIII···Cl0
LnPtIV - Cl
hν
ArOH
BET - H+
ArO·
O2/O2–
CB
VB
TiO2
LnPtIII···Cl0
LnPtIV - Cl
hν
ArOH
BET - H+
ArO·
Figure 3.1: Mechanistic scheme of titania sensitization by Pt(IV) chloride complexes (according to ref.61 ).
According to this the excited platinum surface complex undergoes first homolytic
PtIV-Cl bond cleavage affording a PtIII intermediate and a surface bound chlorine
atom.48,114-117 In the reductive reaction path the platinum(III) species injects an electron
into the titania conduction band from where it is subsequently transferred to oxygen.
Since the titania semiconductor ligand is covalently attached to the chloroplatinate
chromophore, a strong electronic coupling is expected rendering this step fast enough
to efficiently compete with the undesired back electron transfer (Fig. 3.1, process
BET). In the oxidative reaction pathway 4-chlorophenol (ArOH) transfers an electron
to the chlorine atom. As summary of both pathways the PtIV-Cl fragment is reformed.
To find out whether analogous surface modification is feasible also with
chlorides of other d6 metals, we report here on the preparation and photocatalytic
properties of a rhodium (III) chloride modified titania.
3. Visible-Light Photocatalysis by a Titania-Rhodium (III) Complex
41
3.2 Synthesis and Characterization
The novel hybrid photocatalysts x%RhCl3/TiO2 containing 0.5, 1.0, 2.0, and
5.0wt% of rhodium were prepared by stirring a suspension of TiO2 in a corresponding
amount of aqueous rhodium(III) chloride and subsequent heating at 200 0C. The best
commercial titania material for this modification turned out to be the titania hydrate
TH. Modified Hombikat and P25 exhibited less activity in the standard degradation of
4-CP. Therefore in the following we will consider only TH modification.
Maximum loading was observed at 5.0wt% of rhodium since the use of higher
metal chloride concentrations afforded powders from which excess rhodium is
completely removed during washing (see experimental part). In order to understand
the role of the halogen ligand, also 2.0%RhBr3/TH and 4.0%RhBr3/TH were
synthesized.
3.2.1 Desorption Experiments
RhCl3/TH and RhBr3/TH have a pink and a dark yellow color, respectively, and
are surprisingly stable to desorption of the rhodium component as compared with the
previously reported platinum modified TH.61,117 In aqueous suspension upon stirring
either in the dark or under irradiation with visible light, no dissolved rhodium complex
was detectable by UV-vis absorption spectroscopy.
Although it is known that F- ions form very stable Ti-F bonds, both
4.0%RhCl3/TH and 4.0%RhBr3/TH did not undergo desorption of the rhodium
surface-complex even after stirring for five days in the dark in 0.5 M KF. Thus, by
analogy with Pt(IV)/TH one can conclude that Rh(III) is covalently bound to titania
through a bridging oxygen ligand. This fluorinated sample, within experimental error,
exhibited the same photoactivity as the unfluorinated samples in the standard
degradation of 4-CP.
Whereas in 0.1 mol dm-3 HCl the previously reported 4.0%Pt(IV)/TH upon UV
irradiation61 for 24 h suffers almost complete desorption to [PtCl6]2-, only 40% of
[RhCl6]3− were detectable in the case of 4.0%RhCl3/TH. This difference may reflect
the fact that the metal-oxygen bond is about 40 kJ mol-1 stronger in the case of
3. Visible-Light Photocatalysis by a Titania-Rhodium (III) Complex
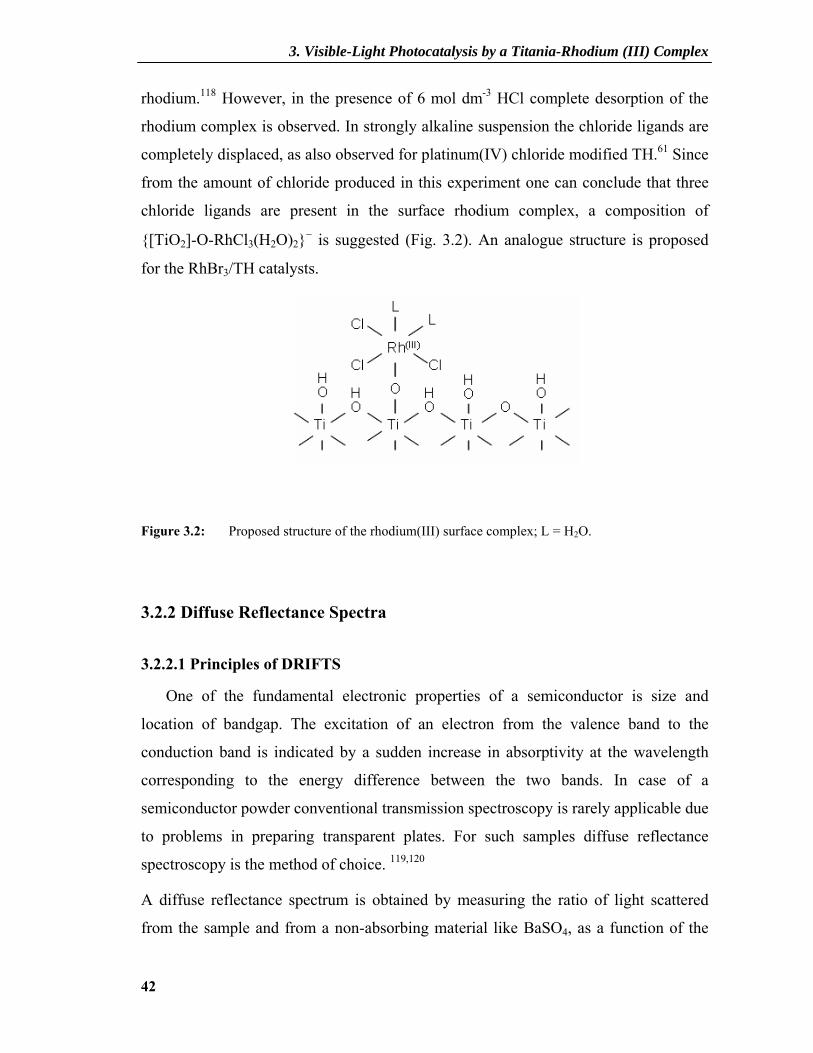
42
rhodium.118 However, in the presence of 6 mol dm-3 HCl complete desorption of the
rhodium complex is observed. In strongly alkaline suspension the chloride ligands are
completely displaced, as also observed for platinum(IV) chloride modified TH.61 Since
from the amount of chloride produced in this experiment one can conclude that three
chloride ligands are present in the surface rhodium complex, a composition of
[TiO2]-O-RhCl3(H2O)2− is suggested (Fig. 3.2). An analogue structure is proposed
for the RhBr3/TH catalysts.
Figure 3.2: Proposed structure of the rhodium(III) surface complex; L = H2O.
3.2.2 Diffuse Reflectance Spectra
3.2.2.1 Principles of DRIFTS
One of the fundamental electronic properties of a semiconductor is size and
location of bandgap. The excitation of an electron from the valence band to the
conduction band is indicated by a sudden increase in absorptivity at the wavelength
corresponding to the energy difference between the two bands. In case of a
semiconductor powder conventional transmission spectroscopy is rarely applicable due
to problems in preparing transparent plates. For such samples diffuse reflectance
spectroscopy is the method of choice. 119,120
A diffuse reflectance spectrum is obtained by measuring the ratio of light scattered
from the sample and from a non-absorbing material like BaSO4, as a function of the

3. Visible-Light Photocatalysis by a Titania-Rhodium (III) Complex
43
wavelength. Assuming wavelength independent scattering, the absorption coefficient
of the powder can be considered proportional to the Kubelka-Munk function F(R∞)
that can be obtained from diffuse reflectance data as
F(R∞) = ∞
∞−RR
2)1( 2
= sα (3.1)
where R∞ is diffuse reflectance from an infinitely thick sample layer relative to the
reflectance of a standard (e.g. BaSO4). α and s are the absorption- and scattering-
coefficients, respectively. Eq. 3.1 is valid only under well defined conditions:
• Monochromatic irradiation
• Infinitely thick sample (normally about 5 mm)
• Low sample concentration
• Uniform distribution
• Absence of fluorescence.
The absorption coefficient varies with wavelength and its magnitude depends on
whether the semiconductor is a direct or indirect semiconductor.
In direct semiconductors the minimum of the conduction band has the same
momentum k of the maximum of the conduction band and, since for any collision
energy and momentum must be conserved, the direct transition requires only the
absorption of a photon. In contrast for an indirect semiconductor the absorption of a
photon leads to a change in momentum. Therefore the absorption of a photon with its
negligible momentum is not enough to cause this change and a third particle with
significant momentum, a phonon (quantisized lattice vibration) must be emitted or
absorbed additionally. The indirect transition is a two-step process and it is less
probable than the single step direct transition, which typically leads to higher
absorption coefficients for direct semiconductors as compared to indirect ones.
3. Visible-Light Photocatalysis by a Titania-Rhodium (III) Complex
44
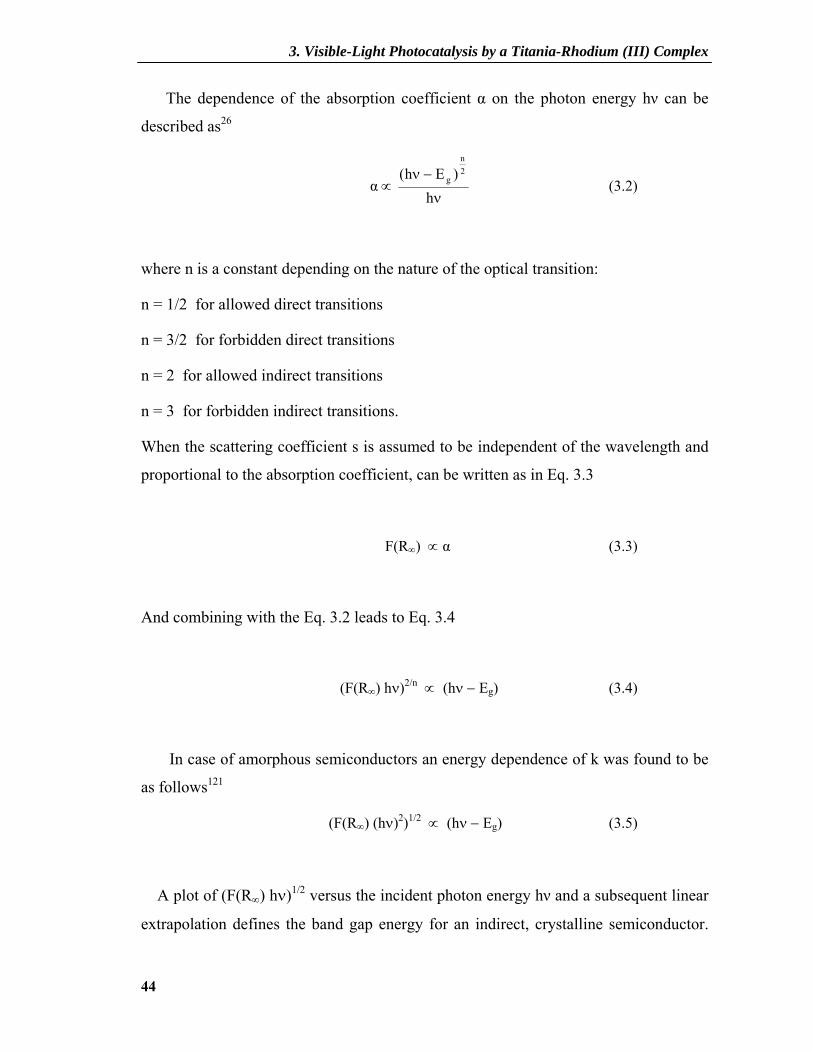
The dependence of the absorption coefficient α on the photon energy hν can be
described as26
α ∝ ν
−ν
h)Eh( 2
n
g (3.2)
where n is a constant depending on the nature of the optical transition:
n = 1/2 for allowed direct transitions
n = 3/2 for forbidden direct transitions
n = 2 for allowed indirect transitions
n = 3 for forbidden indirect transitions.
When the scattering coefficient s is assumed to be independent of the wavelength and
proportional to the absorption coefficient, can be written as in Eq. 3.3
F(R∞) ∝ α (3.3)
And combining with the Eq. 3.2 leads to Eq. 3.4
(F(R∞) hν)2/n ∝ (hν − Eg) (3.4)
In case of amorphous semiconductors an energy dependence of k was found to be
as follows121
(F(R∞) (hν)2)1/2 ∝ (hν − Eg) (3.5)
A plot of (F(R∞) hν)1/2 versus the incident photon energy hν and a subsequent linear
extrapolation defines the band gap energy for an indirect, crystalline semiconductor.

3. Visible-Light Photocatalysis by a Titania-Rhodium (III) Complex
45
Analogously a plot of (F(R∞) hν)2 and (F(R∞) (hν)2)1/2 versus hν affords the band gap
of a direct crystalline and amorphous semiconductor, respectively.
3.2.2.2 Diffuse Reflectance Measurements
Comparison of the diffuse reflectance spectra of TH and 4.0%Rh(III)/TH clearly
indicates novel absorption at 400 - 500 nm and 500 – 700 nm (Fig. 3.3, curves a, c).
400 500 600 700 800
0,0
0,1
0,2
0,3
0,4
F(R
∞)
Wavelength / nm
a
b
c
Figure 3.3: Diffuse reflectance spectra of TH, 2.0%RhCl3/TH and 2.0%RhBr3/TH. The Kubelka-Munk function, F(R∞), is used as the equivalent of absorbance; a: TH, b: 2.0%RhCl3/TH, c: 2.0%RhBr3/TH.
The shoulder at about 500 nm compares well with the lowest d,d transition of
[RhCl6]3− observed in hydrochloric acid at 518 nm 122 (Fig. 3.4).
3. Visible-Light Photocatalysis by a Titania-Rhodium (III) Complex
46
400 500 600 7000,000
0,005
0,010
0,015
0,020
0,025
0,030
Abso
rban
ce /
a.u.
λ / nm
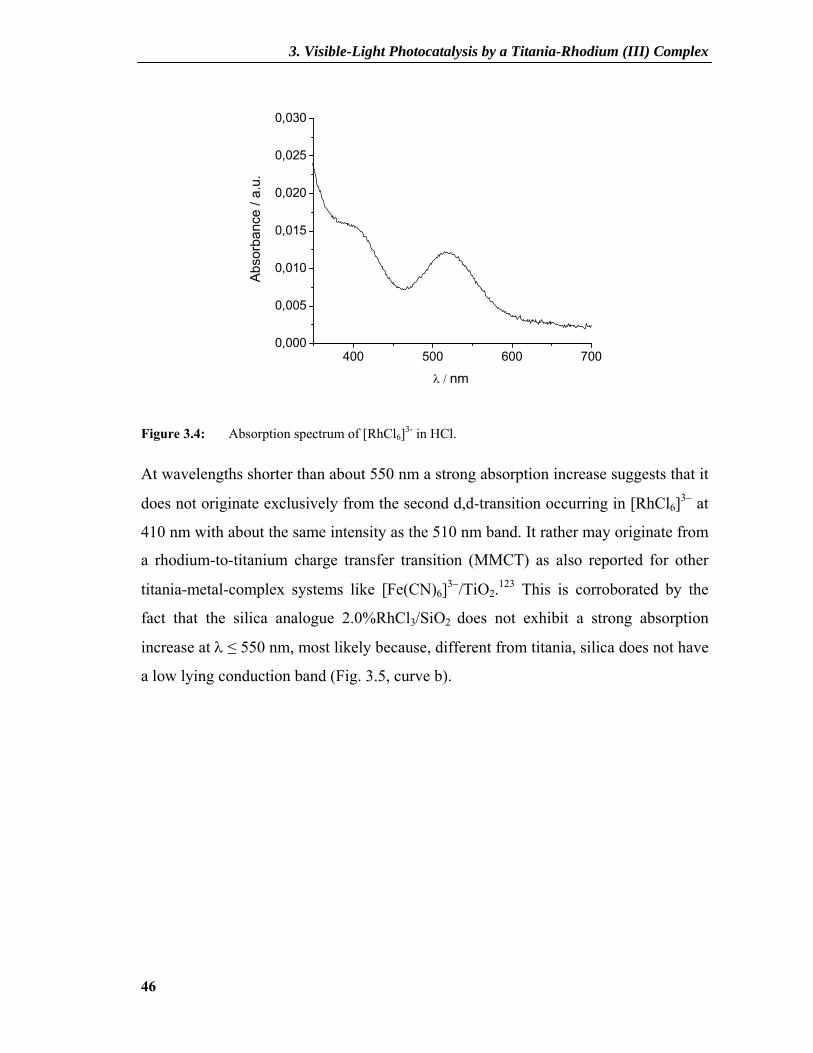
Figure 3.4: Absorption spectrum of [RhCl6]3- in HCl.
At wavelengths shorter than about 550 nm a strong absorption increase suggests that it
does not originate exclusively from the second d,d-transition occurring in [RhCl6]3− at
410 nm with about the same intensity as the 510 nm band. It rather may originate from
a rhodium-to-titanium charge transfer transition (MMCT) as also reported for other
titania-metal-complex systems like [Fe(CN)6]3−/TiO2.123 This is corroborated by the
fact that the silica analogue 2.0%RhCl3/SiO2 does not exhibit a strong absorption
increase at λ ≤ 550 nm, most likely because, different from titania, silica does not have
a low lying conduction band (Fig. 3.5, curve b).
3. Visible-Light Photocatalysis by a Titania-Rhodium (III) Complex
47
300 400 500 6000,0
0,1
0,2
0,3
F(R
∞)
λ / nm
c
a
d
b
380nm
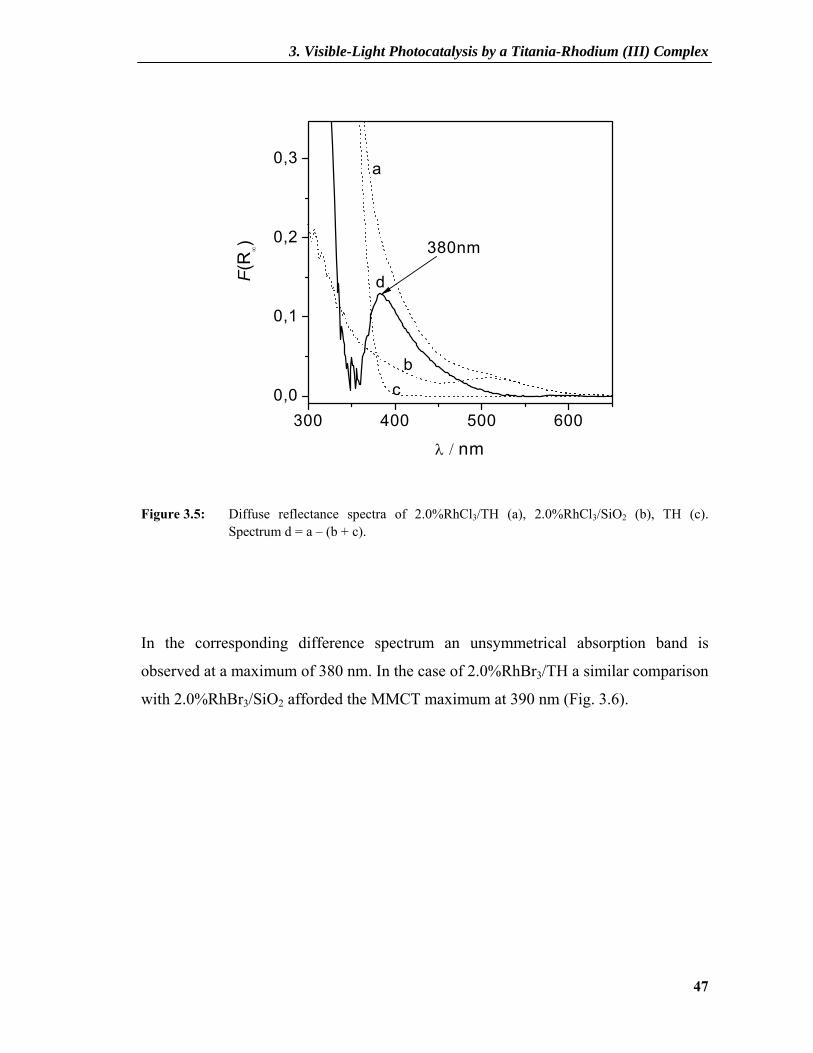
Figure 3.5: Diffuse reflectance spectra of 2.0%RhCl3/TH (a), 2.0%RhCl3/SiO2 (b), TH (c). Spectrum d = a – (b + c).
In the corresponding difference spectrum an unsymmetrical absorption band is
observed at a maximum of 380 nm. In the case of 2.0%RhBr3/TH a similar comparison
with 2.0%RhBr3/SiO2 afforded the MMCT maximum at 390 nm (Fig. 3.6).
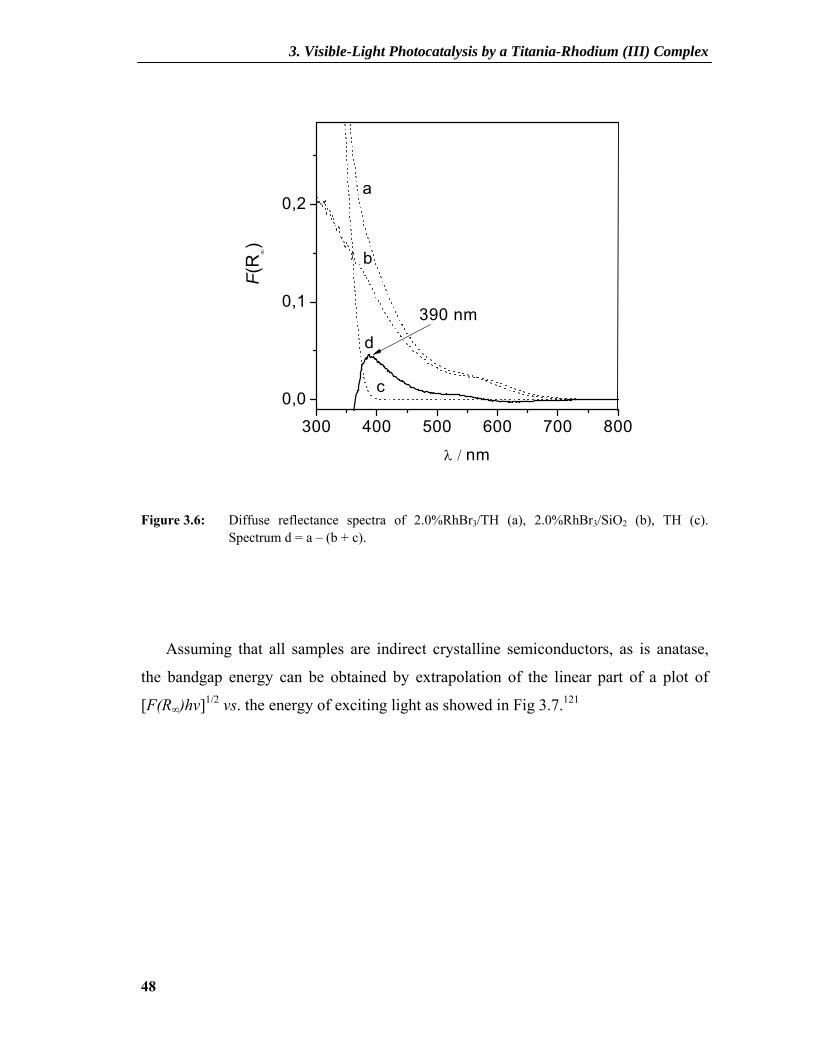
3. Visible-Light Photocatalysis by a Titania-Rhodium (III) Complex
48
300 400 500 600 700 8000,0
0,1
0,2
F(R
∞)
λ / nm
a
390 nm
b
c
d
Figure 3.6: Diffuse reflectance spectra of 2.0%RhBr3/TH (a), 2.0%RhBr3/SiO2 (b), TH (c). Spectrum d = a – (b + c).
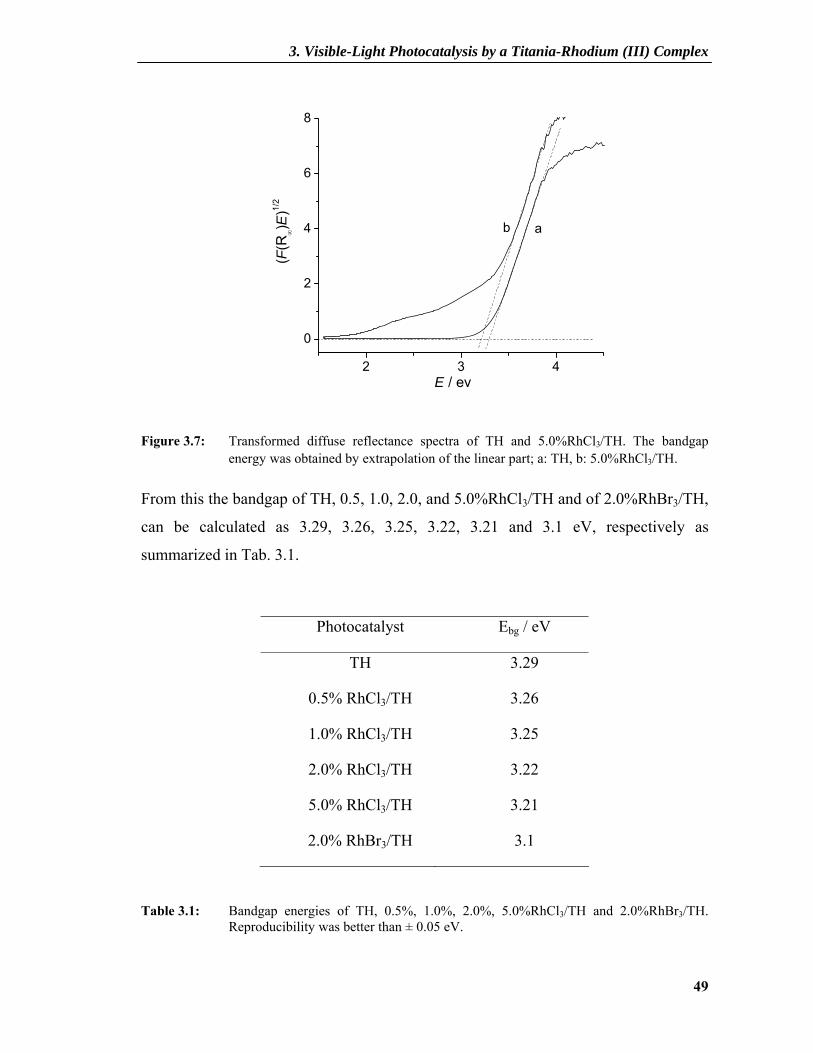
Assuming that all samples are indirect crystalline semiconductors, as is anatase,
the bandgap energy can be obtained by extrapolation of the linear part of a plot of
[F(R∞)hν]1/2 vs. the energy of exciting light as showed in Fig 3.7.121
3. Visible-Light Photocatalysis by a Titania-Rhodium (III) Complex
49
2 3 4
0
2
4
6
8
(F(R
∞)E
)1/2
E / ev
b a
Figure 3.7: Transformed diffuse reflectance spectra of TH and 5.0%RhCl3/TH. The bandgap energy was obtained by extrapolation of the linear part; a: TH, b: 5.0%RhCl3/TH.
From this the bandgap of TH, 0.5, 1.0, 2.0, and 5.0%RhCl3/TH and of 2.0%RhBr3/TH,
can be calculated as 3.29, 3.26, 3.25, 3.22, 3.21 and 3.1 eV, respectively as
summarized in Tab. 3.1.
Photocatalyst Ebg / eV
TH
0.5% RhCl3/TH
1.0% RhCl3/TH
2.0% RhCl3/TH
5.0% RhCl3/TH
2.0% RhBr3/TH
3.29
3.26
3.25
3.22
3.21
3.1
Table 3.1: Bandgap energies of TH, 0.5%, 1.0%, 2.0%, 5.0%RhCl3/TH and 2.0%RhBr3/TH. Reproducibility was better than ± 0.05 eV.
3. Visible-Light Photocatalysis by a Titania-Rhodium (III) Complex
50
3.2.3 Determination of Band Edge Positions
3.2.3.1 Semiconductor-Electrolyte Interface
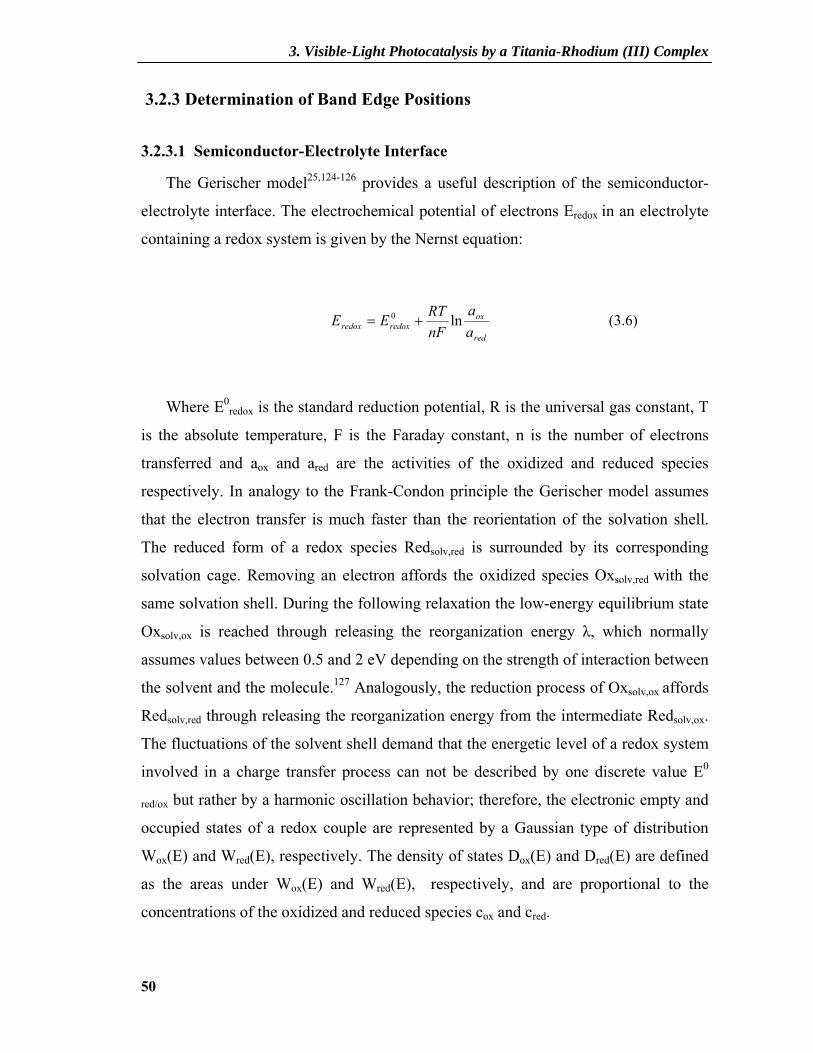
The Gerischer model25,124-126 provides a useful description of the semiconductor-
electrolyte interface. The electrochemical potential of electrons Eredox in an electrolyte
containing a redox system is given by the Nernst equation:
red
oxredoxredox a
anFRTEE ln0 += (3.6)
Where E0redox is the standard reduction potential, R is the universal gas constant, T
is the absolute temperature, F is the Faraday constant, n is the number of electrons
transferred and aox and ared are the activities of the oxidized and reduced species
respectively. In analogy to the Frank-Condon principle the Gerischer model assumes
that the electron transfer is much faster than the reorientation of the solvation shell.
The reduced form of a redox species Redsolv,red is surrounded by its corresponding
solvation cage. Removing an electron affords the oxidized species Oxsolv,red with the
same solvation shell. During the following relaxation the low-energy equilibrium state
Oxsolv,ox is reached through releasing the reorganization energy λ, which normally
assumes values between 0.5 and 2 eV depending on the strength of interaction between
the solvent and the molecule.127 Analogously, the reduction process of Oxsolv,ox affords
Redsolv,red through releasing the reorganization energy from the intermediate Redsolv,ox.
The fluctuations of the solvent shell demand that the energetic level of a redox system
involved in a charge transfer process can not be described by one discrete value E0
red/ox but rather by a harmonic oscillation behavior; therefore, the electronic empty and
occupied states of a redox couple are represented by a Gaussian type of distribution
Wox(E) and Wred(E), respectively. The density of states Dox(E) and Dred(E) are defined
as the areas under Wox(E) and Wred(E), respectively, and are proportional to the
concentrations of the oxidized and reduced species cox and cred.
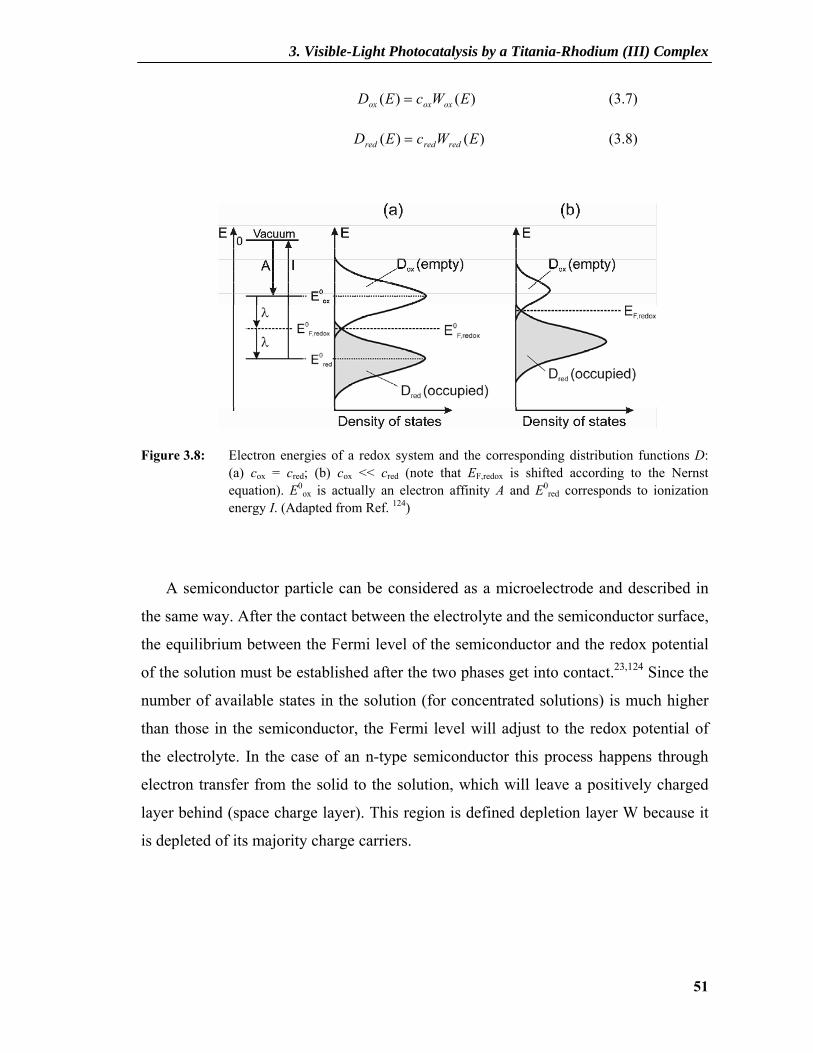
3. Visible-Light Photocatalysis by a Titania-Rhodium (III) Complex
51
)()( EWcED oxoxox = (3.7)
)()( EWcED redredred = (3.8)
Figure 3.8: Electron energies of a redox system and the corresponding distribution functions D: (a) cox = cred; (b) cox << cred (note that EF,redox is shifted according to the Nernst equation). E0
ox is actually an electron affinity A and E0red corresponds to ionization
energy I. (Adapted from Ref. 124)
A semiconductor particle can be considered as a microelectrode and described in
the same way. After the contact between the electrolyte and the semiconductor surface,
the equilibrium between the Fermi level of the semiconductor and the redox potential
of the solution must be established after the two phases get into contact.23,124 Since the
number of available states in the solution (for concentrated solutions) is much higher
than those in the semiconductor, the Fermi level will adjust to the redox potential of
the electrolyte. In the case of an n-type semiconductor this process happens through
electron transfer from the solid to the solution, which will leave a positively charged
layer behind (space charge layer). This region is defined depletion layer W because it
is depleted of its majority charge carriers.
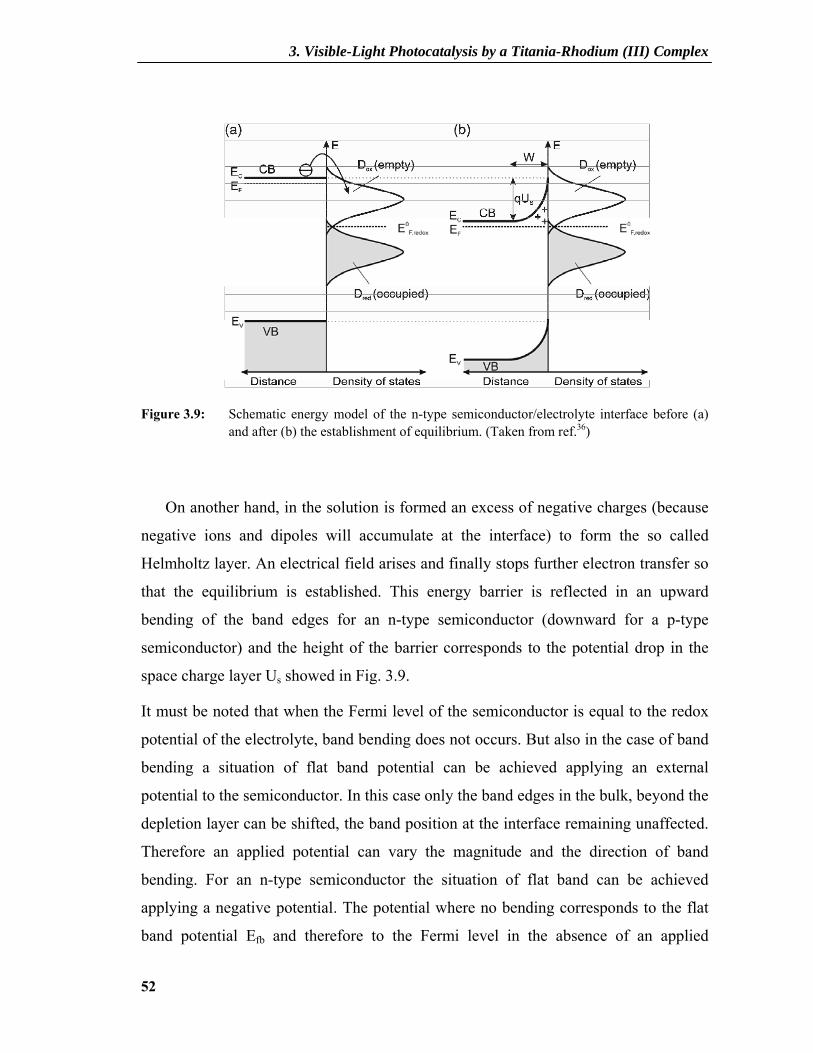
3. Visible-Light Photocatalysis by a Titania-Rhodium (III) Complex
52
Figure 3.9: Schematic energy model of the n-type semiconductor/electrolyte interface before (a) and after (b) the establishment of equilibrium. (Taken from ref.36)
On another hand, in the solution is formed an excess of negative charges (because
negative ions and dipoles will accumulate at the interface) to form the so called
Helmholtz layer. An electrical field arises and finally stops further electron transfer so
that the equilibrium is established. This energy barrier is reflected in an upward
bending of the band edges for an n-type semiconductor (downward for a p-type
semiconductor) and the height of the barrier corresponds to the potential drop in the
space charge layer Us showed in Fig. 3.9.
It must be noted that when the Fermi level of the semiconductor is equal to the redox
potential of the electrolyte, band bending does not occurs. But also in the case of band
bending a situation of flat band potential can be achieved applying an external
potential to the semiconductor. In this case only the band edges in the bulk, beyond the
depletion layer can be shifted, the band position at the interface remaining unaffected.
Therefore an applied potential can vary the magnitude and the direction of band
bending. For an n-type semiconductor the situation of flat band can be achieved
applying a negative potential. The potential where no bending corresponds to the flat
band potential Efb and therefore to the Fermi level in the absence of an applied

3. Visible-Light Photocatalysis by a Titania-Rhodium (III) Complex
53
potential. The flat band potential is particularly important because it allows to extimate
the position of the conduction band in a n-type semiconductor and of the valence band
in a p-type semiconductor. Assuming that both semiconductors are heavily doped, the
distance of the flat band potential to the band edges should be so small (0.05 - 0.1 eV)
that it can be neglected for the purpose of this investigation.
3.2.3.2 Concept of Quasi Fermi Level
As already mentioned the Fermi level represents the free energy of the electron and
holes under equilibrium conditions, i.e. in the dark. In an n-type semiconductor in the
dark there is a higher concentration of electrons respect to the holes. Therefore one can
neglect them and the Fermi level lies close to the conduction band. Nevertheless under
radiative conditions, the concentration of holes increases dramatically whereas the
concentration of electron does not change considerably. Therefore the free energy of
electrons and holes can not be expressed by only one Fermi level, thus it is splitted
into two “quasi-Fermi levels” one for holes pEF* and one for electrons nEF*.126 The
former lies near the conduction band, the latter near the valence band. If the particle is
big enough to form a space charge layer, the photogenerated exciton is separated due
to the associated electric field: the electron move to the bulk and the hole to the
interface.
Several methods have been used in order to measure the flat band potential. In the
case of semiconductor powders it can be measured with a method first developed by
Bard et al. based on photocurrent measurements128-130 and then modified by Roy at al.
who performed photovoltage measurements.131
3.2.3.3 Photovoltage Measurements
The quasi Fermi level of the novel rhodium(III) modified titania catalysts was
determined by the method of Roy et al.131 In short, the pH dependence of the potential
of a platinum electrode immersed in an irradiated semiconductor suspension is
recorded in the presence of an electron acceptor with pH independent reduction
potential. A schematic view of the experimental set up for these measurements is
showed in Fig. 3.10.
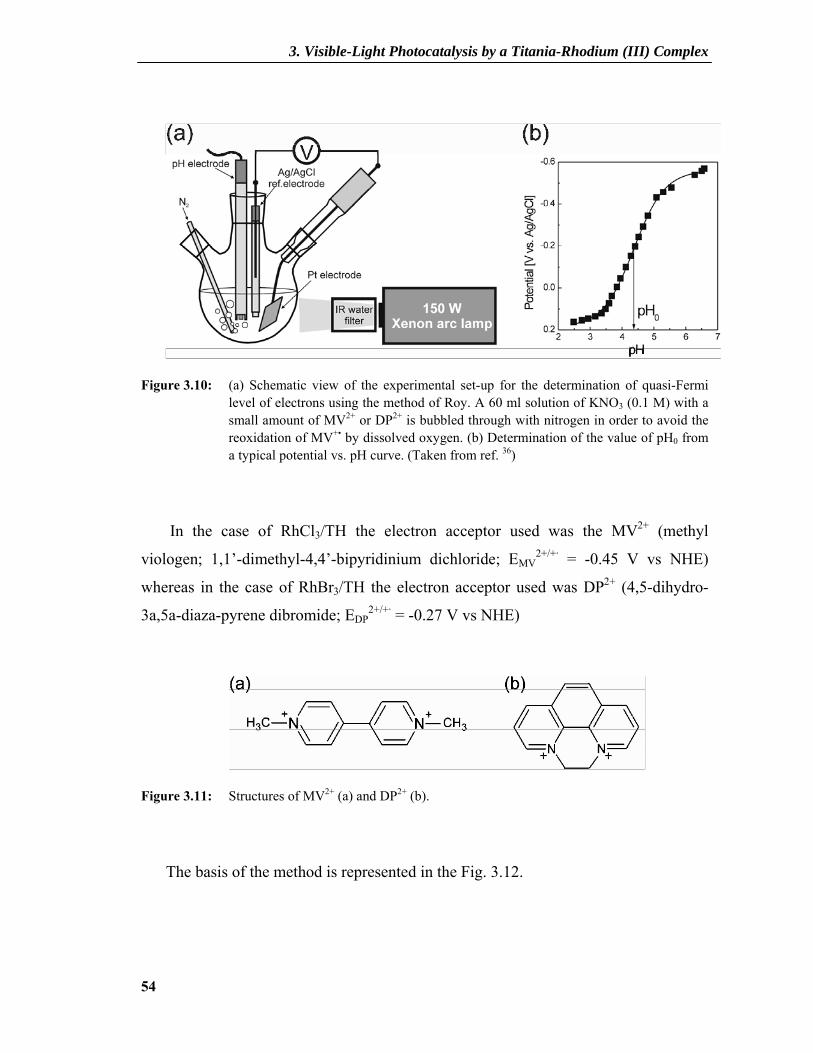
3. Visible-Light Photocatalysis by a Titania-Rhodium (III) Complex
54
Figure 3.10: (a) Schematic view of the experimental set-up for the determination of quasi-Fermi level of electrons using the method of Roy. A 60 ml solution of KNO3 (0.1 M) with a small amount of MV2+ or DP2+ is bubbled through with nitrogen in order to avoid the reoxidation of MV+• by dissolved oxygen. (b) Determination of the value of pH0 from a typical potential vs. pH curve. (Taken from ref. 36)
In the case of RhCl3/TH the electron acceptor used was the MV2+ (methyl
viologen; 1,1’-dimethyl-4,4’-bipyridinium dichloride; EMV2+/+· = -0.45 V vs NHE)
whereas in the case of RhBr3/TH the electron acceptor used was DP2+ (4,5-dihydro-
3a,5a-diaza-pyrene dibromide; EDP2+/+· = -0.27 V vs NHE)
Figure 3.11: Structures of MV2+ (a) and DP2+ (b).
The basis of the method is represented in the Fig. 3.12.
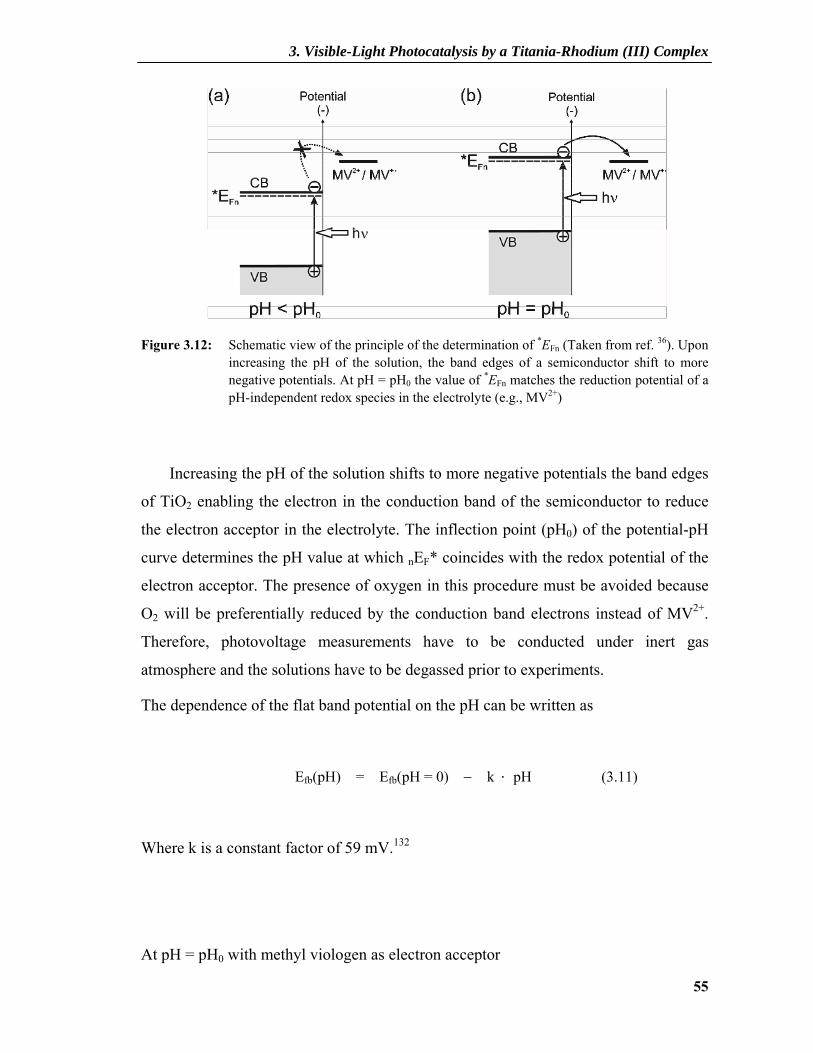
3. Visible-Light Photocatalysis by a Titania-Rhodium (III) Complex
55
Figure 3.12: Schematic view of the principle of the determination of *EFn (Taken from ref. 36). Upon increasing the pH of the solution, the band edges of a semiconductor shift to more negative potentials. At pH = pH0 the value of *EFn matches the reduction potential of a pH-independent redox species in the electrolyte (e.g., MV2+)
Increasing the pH of the solution shifts to more negative potentials the band edges
of TiO2 enabling the electron in the conduction band of the semiconductor to reduce
the electron acceptor in the electrolyte. The inflection point (pH0) of the potential-pH
curve determines the pH value at which nEF* coincides with the redox potential of the
electron acceptor. The presence of oxygen in this procedure must be avoided because
O2 will be preferentially reduced by the conduction band electrons instead of MV2+.
Therefore, photovoltage measurements have to be conducted under inert gas
atmosphere and the solutions have to be degassed prior to experiments.
The dependence of the flat band potential on the pH can be written as
Efb(pH) = Efb(pH = 0) − k • pH (3.11)
Where k is a constant factor of 59 mV.132
At pH = pH0 with methyl viologen as electron acceptor

3. Visible-Light Photocatalysis by a Titania-Rhodium (III) Complex
56
E0MV2+/+· = Efb(pH0) = Efb(pH = 0) − k · pH0 (3.12)
Thus, subtracting Eq. 3.11 from Eq. 3.12 the value of nEF* at pH = 7 can be obtained
according to Eq. 3.13
Efb(pH) = E0MV2+/+· + k (pH0 − pH) (3.13)
The experimental results obtained with our catalysts are shown in Fig. 3.13.
4 6 8 10
-0.2
0.0
0.2
0.4
0.6
edcba
Pho
tovo
ltage
/ V
pH
Figure 3.13: Photovoltage recorded for 20 mg of TH (a) and 20 mg of 0.5%(b), 1.0%(c), 2.0%(d), and 5.0%RhCl3/TH (e) suspended in 100 cm3 of 0.1 mol dm-3 KNO3 in the presence of 15 mg of methylviologen dichloride and irradiated with UV light (λ ≥ 320 nm); The position of the inflection point pH0 is marked with a dotted line.
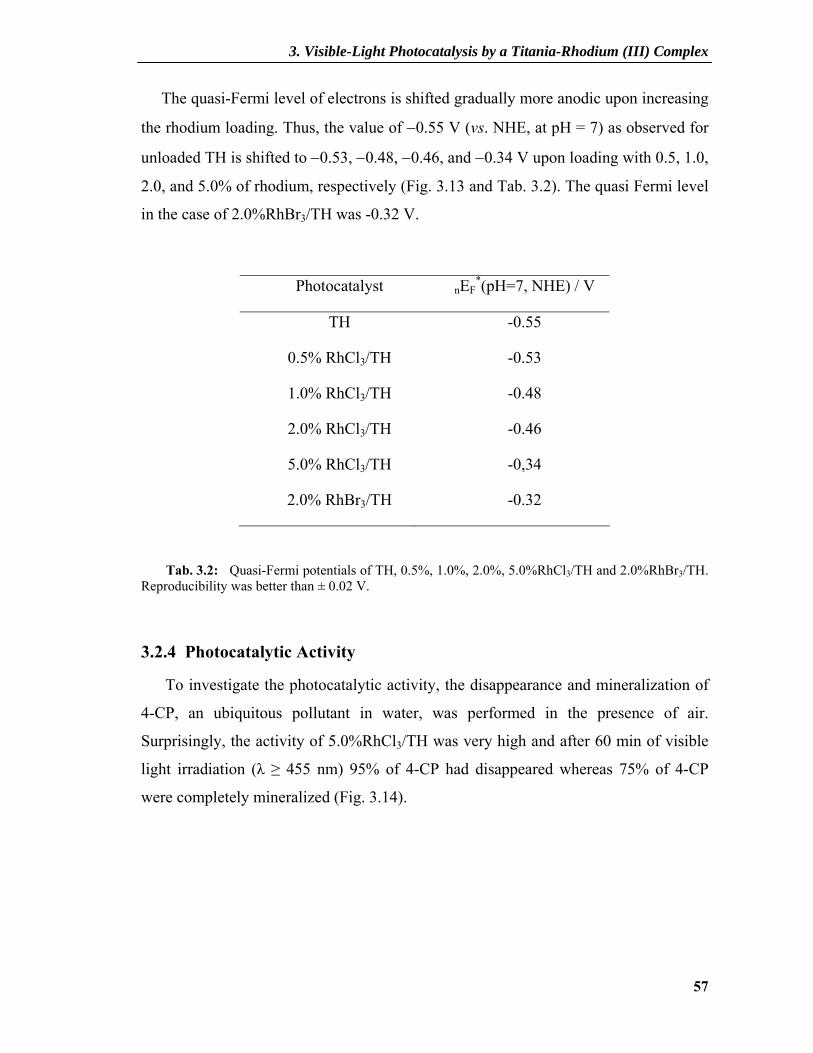
3. Visible-Light Photocatalysis by a Titania-Rhodium (III) Complex
57
The quasi-Fermi level of electrons is shifted gradually more anodic upon increasing
the rhodium loading. Thus, the value of −0.55 V (vs. NHE, at pH = 7) as observed for
unloaded TH is shifted to −0.53, −0.48, −0.46, and −0.34 V upon loading with 0.5, 1.0,
2.0, and 5.0% of rhodium, respectively (Fig. 3.13 and Tab. 3.2). The quasi Fermi level
in the case of 2.0%RhBr3/TH was -0.32 V.
Photocatalyst nEF*(pH=7, NHE) / V
TH
0.5% RhCl3/TH
1.0% RhCl3/TH
2.0% RhCl3/TH
5.0% RhCl3/TH
2.0% RhBr3/TH
-0.55
-0.53
-0.48
-0.46
-0,34
-0.32
Tab. 3.2: Quasi-Fermi potentials of TH, 0.5%, 1.0%, 2.0%, 5.0%RhCl3/TH and 2.0%RhBr3/TH. Reproducibility was better than ± 0.02 V.
3.2.4 Photocatalytic Activity
To investigate the photocatalytic activity, the disappearance and mineralization of
4-CP, an ubiquitous pollutant in water, was performed in the presence of air.
Surprisingly, the activity of 5.0%RhCl3/TH was very high and after 60 min of visible
light irradiation (λ ≥ 455 nm) 95% of 4-CP had disappeared whereas 75% of 4-CP
were completely mineralized (Fig. 3.14).
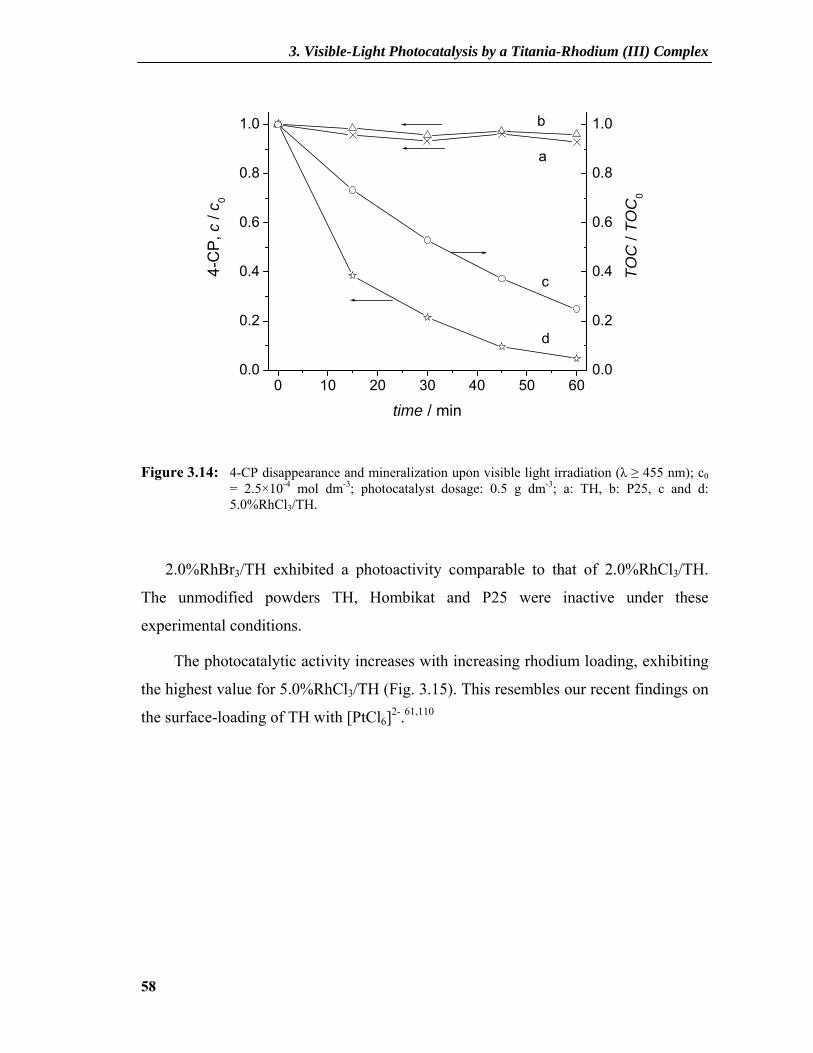
3. Visible-Light Photocatalysis by a Titania-Rhodium (III) Complex
58
0 10 20 30 40 50 600.0
0.2
0.4
0.6
0.8
1.0
0.0
0.2
0.4
0.6
0.8
1.0
d
c
b
a
TOC
/ TO
C0
4-C
P, c
/ c 0
time / min
Figure 3.14: 4-CP disappearance and mineralization upon visible light irradiation (λ ≥ 455 nm); c0 = 2.5×10⁻⁴ mol dm-3; photocatalyst dosage: 0.5 g dm-3; a: TH, b: P25, c and d: 5.0%RhCl3/TH.
2.0%RhBr3/TH exhibited a photoactivity comparable to that of 2.0%RhCl3/TH.
The unmodified powders TH, Hombikat and P25 were inactive under these
experimental conditions.
The photocatalytic activity increases with increasing rhodium loading, exhibiting
the highest value for 5.0%RhCl3/TH (Fig. 3.15). This resembles our recent findings on
the surface-loading of TH with [PtCl6]2-.61,110
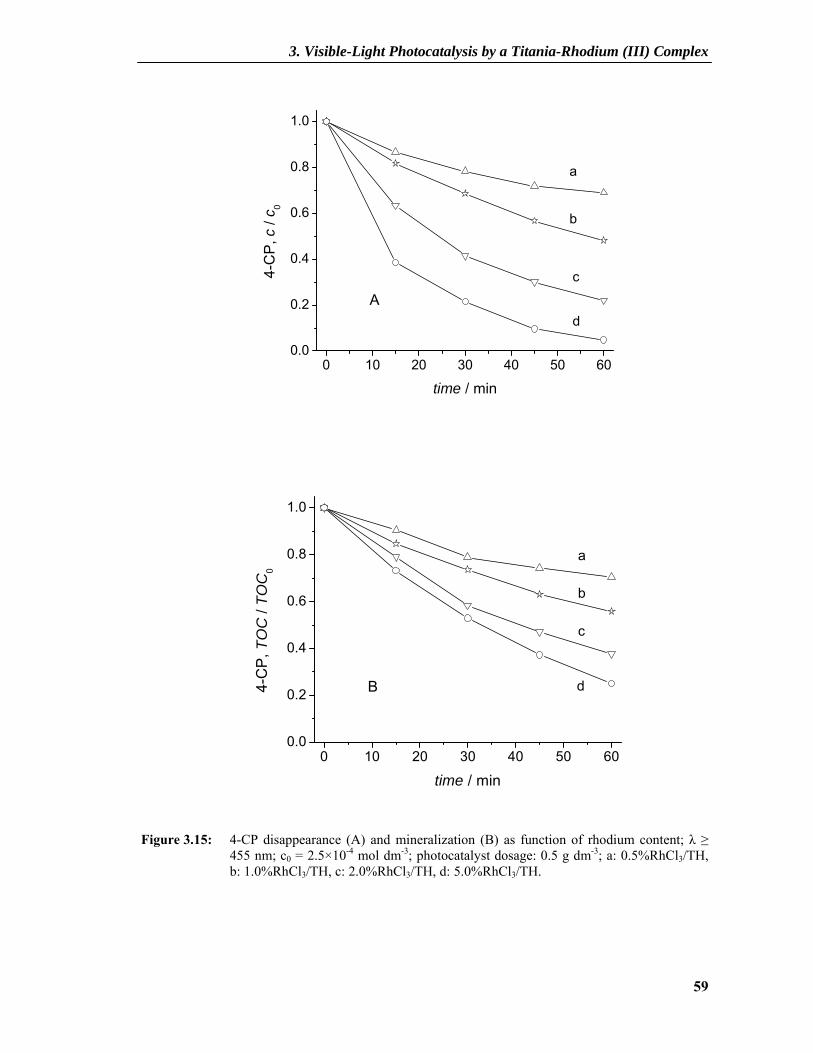
3. Visible-Light Photocatalysis by a Titania-Rhodium (III) Complex
59
0 10 20 30 40 50 600.0
0.2
0.4
0.6
0.8
1.0
Ad
c
b
a
4-C
P, c
/ c 0
time / min
0 10 20 30 40 50 600.0
0.2
0.4
0.6
0.8
1.0
B d
c
b
a
4-C
P, T
OC
/ TO
C0
time / min
Figure 3.15: 4-CP disappearance (A) and mineralization (B) as function of rhodium content; λ ≥ 455 nm; c0 = 2.5×10⁻⁴ mol dm-3; photocatalyst dosage: 0.5 g dm-3; a: 0.5%RhCl3/TH, b: 1.0%RhCl3/TH, c: 2.0%RhCl3/TH, d: 5.0%RhCl3/TH.
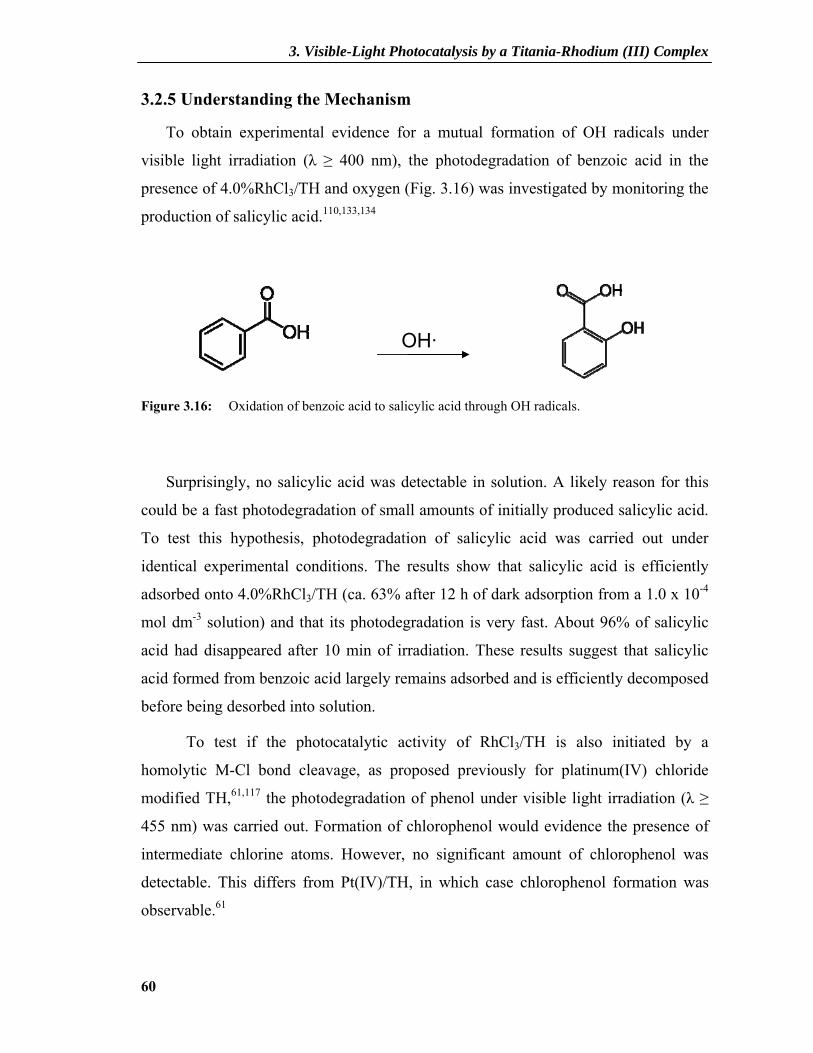
3. Visible-Light Photocatalysis by a Titania-Rhodium (III) Complex
60
3.2.5 Understanding the Mechanism
To obtain experimental evidence for a mutual formation of OH radicals under
visible light irradiation (λ ≥ 400 nm), the photodegradation of benzoic acid in the
presence of 4.0%RhCl3/TH and oxygen (Fig. 3.16) was investigated by monitoring the
production of salicylic acid.110,133,134
Figure 3.16: Oxidation of benzoic acid to salicylic acid through OH radicals.
Surprisingly, no salicylic acid was detectable in solution. A likely reason for this
could be a fast photodegradation of small amounts of initially produced salicylic acid.
To test this hypothesis, photodegradation of salicylic acid was carried out under
identical experimental conditions. The results show that salicylic acid is efficiently
adsorbed onto 4.0%RhCl3/TH (ca. 63% after 12 h of dark adsorption from a 1.0 x 10⁻⁴
mol dm-3 solution) and that its photodegradation is very fast. About 96% of salicylic
acid had disappeared after 10 min of irradiation. These results suggest that salicylic
acid formed from benzoic acid largely remains adsorbed and is efficiently decomposed
before being desorbed into solution.
To test if the photocatalytic activity of RhCl3/TH is also initiated by a
homolytic M-Cl bond cleavage, as proposed previously for platinum(IV) chloride
modified TH,61,117 the photodegradation of phenol under visible light irradiation (λ ≥
455 nm) was carried out. Formation of chlorophenol would evidence the presence of
intermediate chlorine atoms. However, no significant amount of chlorophenol was
detectable. This differs from Pt(IV)/TH, in which case chlorophenol formation was
observable.61
OH·
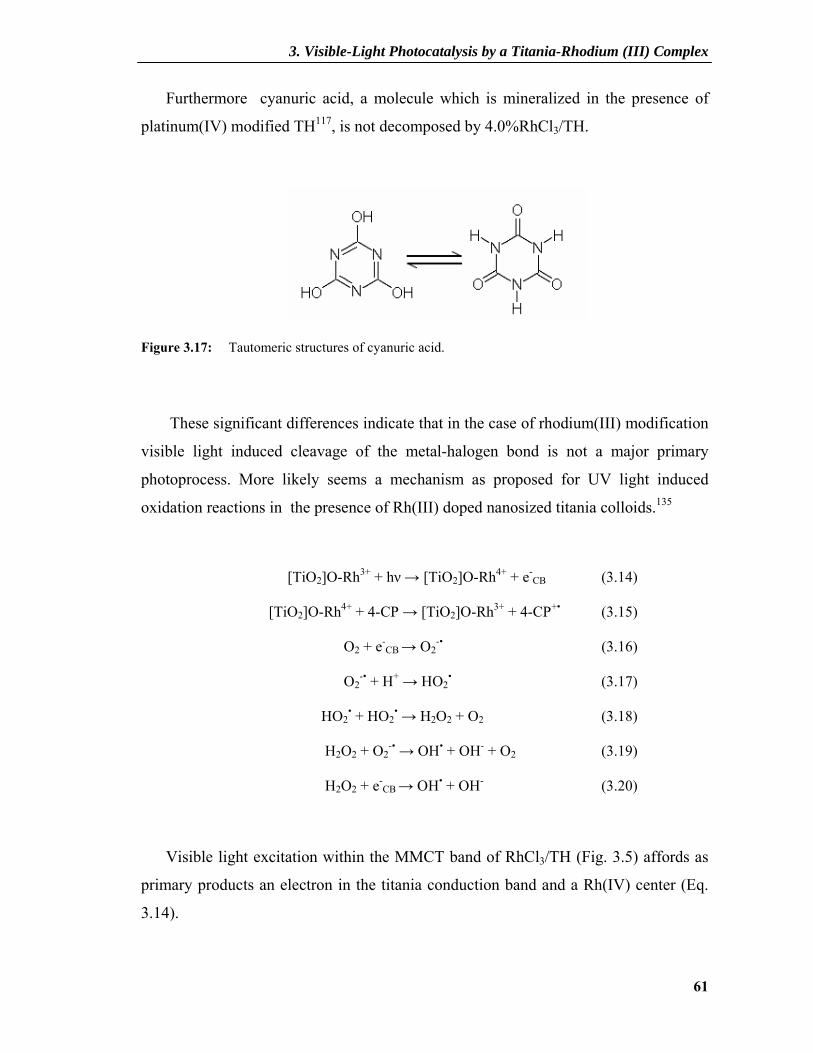
3. Visible-Light Photocatalysis by a Titania-Rhodium (III) Complex
61
Furthermore cyanuric acid, a molecule which is mineralized in the presence of
platinum(IV) modified TH117, is not decomposed by 4.0%RhCl3/TH.
Figure 3.17: Tautomeric structures of cyanuric acid.
These significant differences indicate that in the case of rhodium(III) modification
visible light induced cleavage of the metal-halogen bond is not a major primary
photoprocess. More likely seems a mechanism as proposed for UV light induced
oxidation reactions in the presence of Rh(III) doped nanosized titania colloids.135
[TiO2]O-Rh3+ + hν → [TiO2]O-Rh4+ + e-CB (3.14)
[TiO2]O-Rh4+ + 4-CP → [TiO2]O-Rh3+ + 4-CP+• (3.15)
O2 + e-CB → O2
-• (3.16)
O2-• + H+ → HO2
• (3.17)
HO2• + HO2
• → H2O2 + O2 (3.18)
H2O2 + O2-• → OH• + OH- + O2 (3.19)
H2O2 + e-CB → OH• + OH- (3.20)
Visible light excitation within the MMCT band of RhCl3/TH (Fig. 3.5) affords as
primary products an electron in the titania conduction band and a Rh(IV) center (Eq.
3.14).
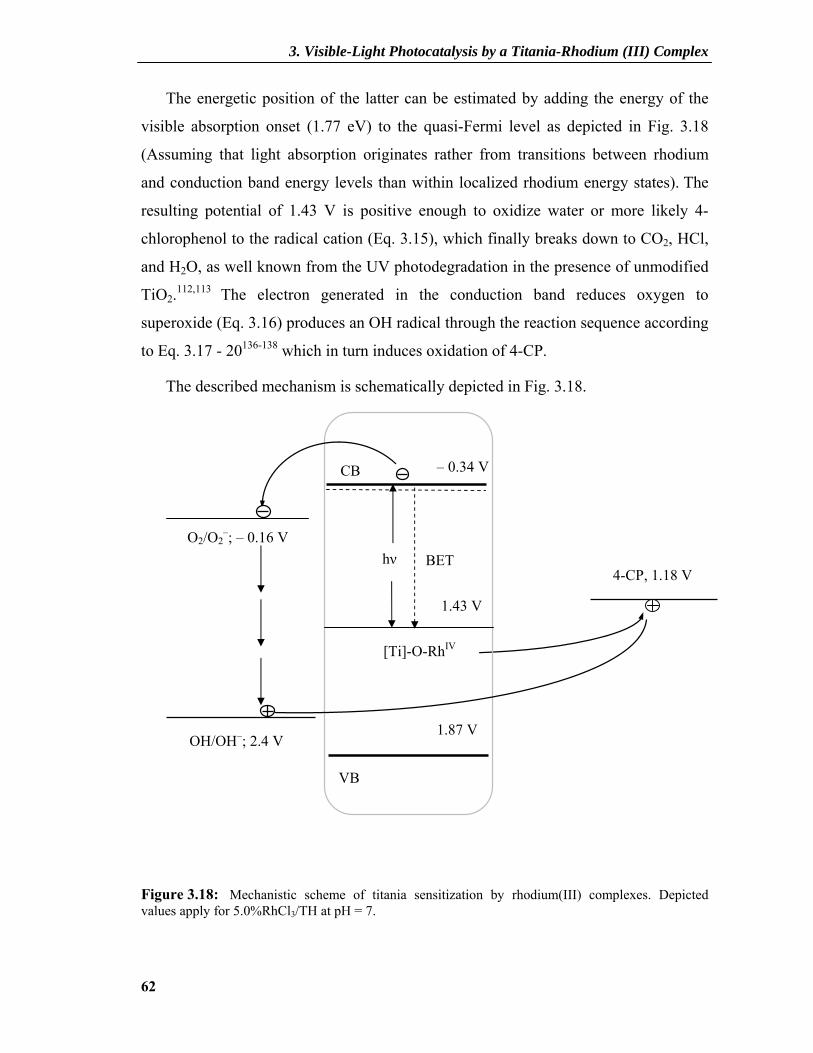
3. Visible-Light Photocatalysis by a Titania-Rhodium (III) Complex
62
The energetic position of the latter can be estimated by adding the energy of the
visible absorption onset (1.77 eV) to the quasi-Fermi level as depicted in Fig. 3.18
(Assuming that light absorption originates rather from transitions between rhodium
and conduction band energy levels than within localized rhodium energy states). The
resulting potential of 1.43 V is positive enough to oxidize water or more likely 4-
chlorophenol to the radical cation (Eq. 3.15), which finally breaks down to CO2, HCl,
and H2O, as well known from the UV photodegradation in the presence of unmodified
TiO2.112,113 The electron generated in the conduction band reduces oxygen to
superoxide (Eq. 3.16) produces an OH radical through the reaction sequence according
to Eq. 3.17 - 20136-138 which in turn induces oxidation of 4-CP.
The described mechanism is schematically depicted in Fig. 3.18.
Figure 3.18: Mechanistic scheme of titania sensitization by rhodium(III) complexes. Depicted values apply for 5.0%RhCl3/TH at pH = 7.
4-CP, 1.18 V
1.43 V
hν
VB
CB
[Ti]-O-RhIV
OH/OH–; 2.4 V
O2/O2–; – 0.16 V
– 0.34 V
1.87 V
BET
3. Visible-Light Photocatalysis by a Titania-Rhodium (III) Complex
63
3.3 Experimental
3.3.1 Instruments
Diffuse reflectance spectra of the solids were recorded on a Shimadzu UV-2401PC
UV-Vis recording spectrophotometer. Samples were spread onto BaSO4 plates, the
background reflectance of BaSO4 was measured before. Reflectance was converted by
the instrument software to F(R∞) values according to the Kubelka-Munk theory. The
bandgap was obtained from a plot of F(R∞ )1/2 vs energy of exciting light assuming that
TH and 5.0%Rh(III)/TH are indirect crystalline semiconductors.
TOC measurements were made on a Shimadzu Total Carbon Analyzer TOC-
500/5050 with NDIR optical system detector.
Chloride was measured by ion chromatography (Dionex-120, Ion Pac AS 14
column, conductivity detector, NaHCO3/NaCO3 = 0.001/0.0035 M as eluating agent).
UV-vis spectra were recorded on a Shimadzu UV-3101 PC UV-Vis-NIR Scanning
Spectrophotometer, Quarz cuvette with d = 1 cm.
Specific surface measurements were carried out on a Gemini 2370 according to the
Brunauer – Emmet – Teller theory.
3.3.2 Determination of Absorptivity of [RhCl6]3-
22.5 mg of pure RhCl3×3H2O were dissolved in 100 cm3 of 6 M HCl, and then
refluxed for 4 h. Under these conditions, almost all of rhodium is present as [RhCl6]3-.
The resulting solution was diluted with 6 M HCl to a volume of 250 cm3. Thereafter
the absorbance of [RhCl6]3- was measured by UV-vis spectroscopy at the maximum of
the LMCT band at 252 nm. The absorptivity of [RhCl6]3- at 252 nm at 20 0C was
determined as 1.97 × 10⁴ mol-1 dm3 cm-1. In the same spectrum one can observe the
two weak bands at 410 and 518 nm corresponding to 1A1g → 1T1g and 1A1g → 2T2g
transitions, respectively.
A similar procedure was performed to obtain absorption spectrum of [RhBr6]3- .

3. Visible-Light Photocatalysis by a Titania-Rhodium (III) Complex
64
3.3.3 Preparation of Photocatalysts
To a suspension 1.0 g of titania (TH, Titanhydrat-0, Kerr-McGee) in 10 ml of H2O
were added appropriate amounts of RhCl3×3H2O or RhBr3x3H2O followed by
sonication for 10 min. A pH value of 3-4 was measured for these suspensions. After
stirring for 24 h in the dark, water was removed in vacuo and the residue was dried
under vacuum at room temperature for 3 h. Careful washing with water removed
physisorbed rhodium chloride as indicated by UV-vis absorption spectroscopy. The
resulting powder was heated in air for 2 h at 200 0C, washed four times with 50 ml
portions of doubly distilled water affording acidic solutions of pH 1-2. Drying as
described above and a subsequent second heating for 2 h at 200 0C, gave pink
RhCl3/TH and a dark yellow RhBr3/TH having a specific surface area of 230 m2/g as
obtained from BET measurements. The amount of rhodium present in the RhCl3/TH
powder was determined as follows. 80 mg of RhCl3/TH were suspended in 30 cm3 of 6
M HCl, and then refluxed for 4 h. The resulting suspension was diluted with 6 M HCl
to a volume of 50 cm3. After filtration of the photocatalyst with a Millipore membrane
filter (0.22 μm, Merck), the filtrate was analyzed as described above.
3.3.4 Preparation of 4.0%RhCl3/TH and Charge Transfer Absorption
Attempts to modify SiO2 (Silica gel 60, Merck) through the procedure described
above for TiO2 failed. In fact, during washing the surface complex was almost
removed, affording very weak colored powders. Therefore, modification of SiO2 was
accomplished by grinding an appropriate quantity of RhCl3x3H2O with SiO2 to obtain
4.0%RhCl3/SiO2. The diffuse reflectance spectrum of 4.0%RhCl3/SiO2 was multiplied
by the factor 2.3 in order to obtain the same Kubelka-Munk function as measured for
4.0%RhCl3/TH at λ = 518 nm.

3. Visible-Light Photocatalysis by a Titania-Rhodium (III) Complex
65
3.3.5 Determination of Cl/Rh Ratio
60 mg of 5.0%RhCl3/TH (0.029 mmol Rh) were suspended in 40 ml of
concentrated NaOH and refluxed for 24 h. After filtration 5 ml of the solution were
neutralized with 0.1 ml of concentrated sulfuric acid. Quantitative determination by
ion chromatography afforded 0.081 mmol/40 ml of chloride from which a Cl/Rh ratio
of 2.79 is obtained.
3.3.6 Measurement of Quasi-Fermi Potentials
Quasi-Fermi levels of electrons were measured according to the literature [14]. 20
mg of TH (a) and 20 mg of 0.5%(b), 1.0%(c), 2.0%(d), and 5.0%RhCl3/TH(e) were
suspended in 100 cm3 of 0.1 M KNO3 in the presence of 15 mg of methylviologen
dichloride. Irradiation was performed with UV light (λ ≥ 320 nm, the light source was
the same as used in the photodegradation). Suspensions were stirred and bubbled with
N2 prior to and during the measurement. The pH was adjusted with HNO3 and NaOH
solutions and monitored with a pH - meter. A large surface platinum flag (5 cm2) and
Ag/AgCl were working and reference electrodes, respectively. Stable photovoltages
were recorded about 2 min after adjusting the pH value. In the case of 2.0%RhBr3/TH
the electron acceptor used was DP2+. The measured pH0 values were converted to the
Fermi potential at pH 7 by the equations EF(pH = 7) = -0.44 + 0.059 (pH0 -7) and
EF(pH = 7) = -0.27 + 0.059 (pH0 -7) when MV2+ and DP2+ were used, respectively.
3.3.7 Desorption Experiments
A suspension of 5.0%RhCl3/TH (30 mg) in 0.1 M HCl (15 cm3) was irradiated
with UV light (λ ≥ 320 nm) for 24 h as described below. After filtration of the
photocatalyst with a Millipore membrane filter (0.22 μm, Merck), the filtrate (10 cm3)
was added to 12 M HCl (10 cm3) and then refluxed and analyzed as described above.

3. Visible-Light Photocatalysis by a Titania-Rhodium (III) Complex
66
3.3.8 Photodegradation Procedure and Product Analysis
The photocatalytic degradation of 4-CP was carried out in a jacketed cylindrical 15
cm3 quartz cuvette attached to an optical train.
Figure 3.19: Schematic front and side view of the quartz cuvette
Irradiation was performed with an Osram XBO 150 W xenon arc lamp (Io (400-
520 nm) = 2 × 10⁻⁶ Einstein s−1 cm−2) installed in a light condensing lamp housing
(PTI, A1010S) on an optical train.
Figure 3.20: Emission spectrum of the XBO 150 W xenon arc lamp.
350 400 450 500 550 6000,0
0,5
1,0
1,5
2,0
pow
er /
a.u.
λ / nm

3. Visible-Light Photocatalysis by a Titania-Rhodium (III) Complex
67
A water cooled cylindrical 15 cm3 quartz cuvette was mounted at a distance of 30 cm
from the lamp. Appropriate cut-off filters were placed in front of the cuvette. The
suspension was stirred magnetically. In the standard experiment, 15 cm3 of 0.5 g l-1
powder suspension containing 2.5 × 10⁻⁴ mol l-1 of 4-CP was sonicated for 15 min and
then transferred to the cuvette. During an illumination run ca. 1.2 cm3 of the reaction
solution was sampled at given time intervals. The samples were filtered through a
Millipore membrane filter (0.22 µm) and then analyzed by UV-vis spectroscopy and
TOC analysis. In Fig. 3.20 the absorption spectrum of 4-CP shows two maxima at 280
nm and 221 nm which correspond to a n-π* and π-π* transition, respectively.
Figure 3.20: UV-Vis spectrum of an aqueous solution of 4-CP (1.25 × 10⁻⁴ M)
The same procedure was applied in the photocatalytic degradation of cyanuric
acid followed by TOC measurements. The starting suspension was adjusted to pH = 9
with NaOH solutions and irradiated with visible light (λ ≥ 455 nm).
200 300 400 500 6000.0
0.2
0.4
0.6
0.8
1.0π - π*
n - π*
Abs
. / a
.u.
λ / nm
3. Visible-Light Photocatalysis by a Titania-Rhodium (III) Complex
68
3.4 Conclusions
Titania hybrid photocatalysts containing 0.5, 1.0, 2.0, and 5.0wt% of rhodium(III)
were prepared by chemisorption of RhCl3×3H2O onto anatase hydrate powder (TH).
Analytical data suggest that a titania-trichlororhodate complex is produced containing
a [TiO2]-O-Rh bond.
Similar results are found in the case of modification by RhBr3x3H2O. Diffuse
reflectance spectra exhibit an absorption shoulder throughout the visible region down
to 700 nm. Photoelectrochemical measurements indicate that the quasi-Fermi level of
electrons is gradually shifted to more anodic potentials with increasing rhodium
loading reaching a value of -0.34 V at pH 7 (vs. NHE) in the case of 5.0%RhCl3/TH.
This is more anodic by 210 mV as compared to unmodified TH. Upon visible light
irradiation this photocatalyst induces a fast mineralization of 4-chlorophenol but not of
cyanuric acid. Since the latter is mineralized in the presence of 4.0%H2PtCl4/TH, the
rhodium modified titania photocatalyses 4-CP oxidation by a different mechanism. It
seems likely that the primary photoprocess is not cleavage of the metal-halogen bond
but rather a charge transfer from Rh(III) to titania. This affords an electron in the
conduction band and a Rh(IV) species located within the band gap at about 1.43 V.
4.C-H Activation through Catalytic Photosulfoxidation of Alkanes
69
4. C-H Activation through Catalytic Photosulfoxidation of Alkanes
4.1 Introduction
The name sulfoxidation is referred to the concerted action of sulfur dioxide and
oxygen on n-paraffins (alkanes) or cyclo-paraffines to produce sulfonic acids. The
general reaction can be written as follow
R-H +SO2 +½O2 → RSO3H (4.1)
Sulfoxidation was discovered in Germany by C. Platz in 1940 irradiating with UV-
light a mixture of n-paraffins, sulfur dioxide and oxygen.139 This reaction represents a
rare example of an industrially applied process of C-H bond activation.140 It found
immediately great interest because it constitutes an easy way to produce straight chain
alkanesulfonates (SAS) which are applied as effective surfactants, good wetting agents
and emulsifiers.141 From then on, many processes were developed (see Paragraph
4.1.2) in order to reduce the use of UV-light or the formation of byproducts such as
sulfuric acid. But many of these methods have not satisfying yields or are quite
expensive (γ-ray) or use toxic sensitizers (Hg-sensitized process).
Drawing on these considerations and on the actual growing interest on green
chemistry, we decided to investigate new ways for obtaining alkanesulfonates which
do not require UV irradiation and produce less by-products.
In this chapter we report on the first catalytic photosulfoxidation of alkanes. This
reaction does not require UV lamps and toxic sensitizers, but only a non-toxic
semiconductor powder inducing alkane functionalization through visible light
excitation.
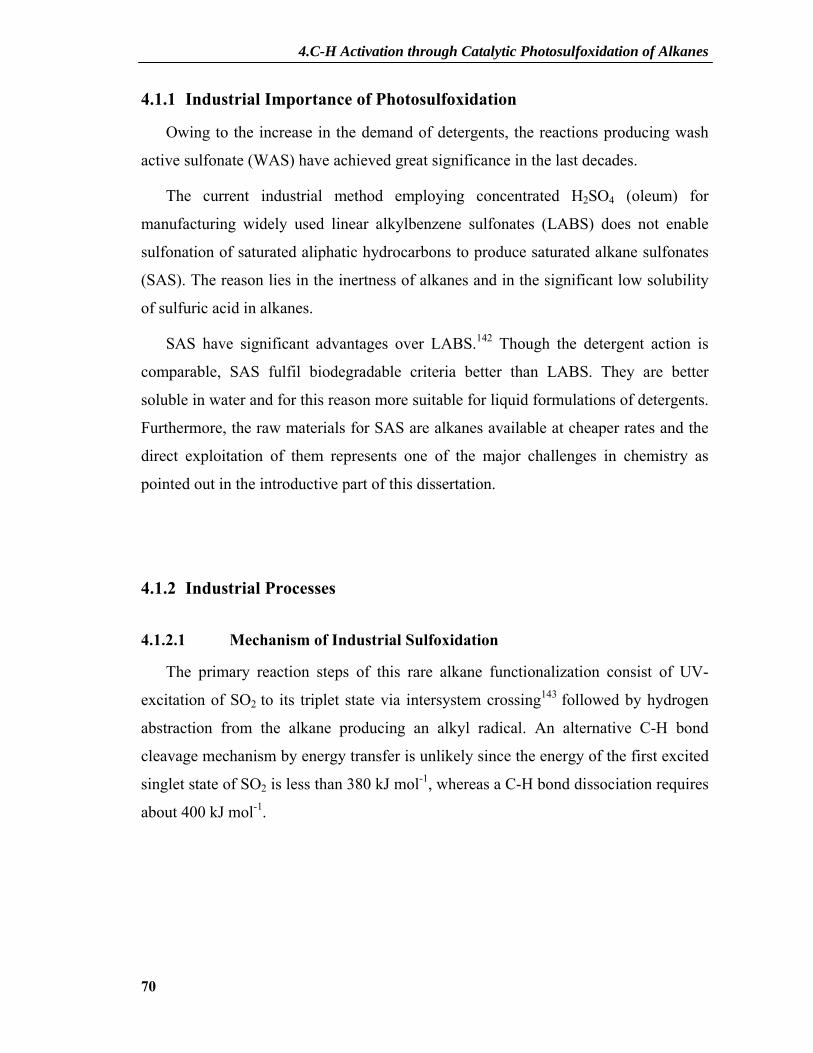
4.C-H Activation through Catalytic Photosulfoxidation of Alkanes
70
4.1.1 Industrial Importance of Photosulfoxidation
Owing to the increase in the demand of detergents, the reactions producing wash
active sulfonate (WAS) have achieved great significance in the last decades.
The current industrial method employing concentrated H2SO4 (oleum) for
manufacturing widely used linear alkylbenzene sulfonates (LABS) does not enable
sulfonation of saturated aliphatic hydrocarbons to produce saturated alkane sulfonates
(SAS). The reason lies in the inertness of alkanes and in the significant low solubility
of sulfuric acid in alkanes.
SAS have significant advantages over LABS.142 Though the detergent action is
comparable, SAS fulfil biodegradable criteria better than LABS. They are better
soluble in water and for this reason more suitable for liquid formulations of detergents.
Furthermore, the raw materials for SAS are alkanes available at cheaper rates and the
direct exploitation of them represents one of the major challenges in chemistry as
pointed out in the introductive part of this dissertation.
4.1.2 Industrial Processes
4.1.2.1 Mechanism of Industrial Sulfoxidation
The primary reaction steps of this rare alkane functionalization consist of UV-
excitation of SO2 to its triplet state via intersystem crossing143 followed by hydrogen
abstraction from the alkane producing an alkyl radical. An alternative C-H bond
cleavage mechanism by energy transfer is unlikely since the energy of the first excited
singlet state of SO2 is less than 380 kJ mol-1, whereas a C-H bond dissociation requires
about 400 kJ mol-1.
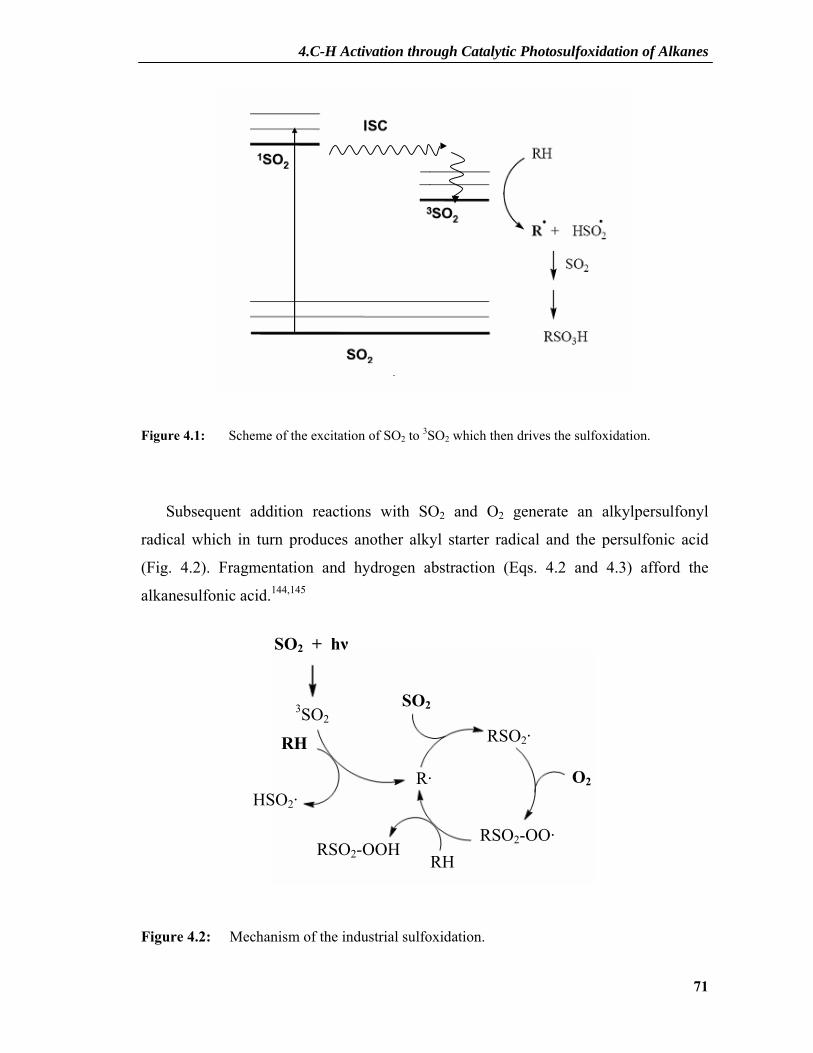
4.C-H Activation through Catalytic Photosulfoxidation of Alkanes
71
Figure 4.1: Scheme of the excitation of SO2 to 3SO2 which then drives the sulfoxidation.
Subsequent addition reactions with SO2 and O2 generate an alkylpersulfonyl
radical which in turn produces another alkyl starter radical and the persulfonic acid
(Fig. 4.2). Fragmentation and hydrogen abstraction (Eqs. 4.2 and 4.3) afford the
alkanesulfonic acid.144,145
Figure 4.2: Mechanism of the industrial sulfoxidation.
SO2 + hν
HSO2· O2
3SO2
RH
R·
SO2
RSO2·
RSO2-OO· RH
RSO2-OOH
4.C-H Activation through Catalytic Photosulfoxidation of Alkanes
72
RSO2-O-O-H → RSO2-O· + OH· (4.2)
RSO2-O· + R-H → RSO3H + R· (4.3)
R-H + OH· → R· + H2O (4.4)
According to this reaction scheme, photosulfoxidation is a photoinduced radical
chain reaction and therefore proceeds without further irradiation in the case of lower
alkanes (<C10) devoid of impurities. In the case of long unbranched alkanes of
insufficient purity termination steps like radical dimerization and radical-radical
recombination dominates and the reaction requires permanent irradiation. However,
addition of radical initiators or promoters like acetic anhydride again induces a chain
reaction.144,146 In general regioisomeric alkyl radicals are formed in the hydrogen
abstraction step except in the case of adamantane photosulfoxidation in the presence of
hydrogen peroxide affording regioselectively 1-adamantanesulfonic acid.147
The more interesting paraffin-mixture to produce WAS is the C8-C22 fraction. This
mixture is called Mepasin and is obtained from deep dehydrogenation of Kogasin II
(bp 230°C – 320°C), a hydrocarbon mixture achieved directly from the Fischer-
Tropsch synthesis.141
Not only aliphatic hydrocarbons can be sulfoxidized but also substituted
hydrocarbons such as alkylchloride, carbonic acids, esters, nitriles, alcohols and ethers.
Nevertheless, sulfoxidation of these products is not preparatively applied. Also low
molecular paraffins in the gas form such as butane can be sulfoxidized in solvents like
CCl4.144
Olefins, aromatic hydrocarbons and branched alkanes like 2,3-dimethylbutane are
not easily sulfoxidized and moreover are potential inhibitors for this reaction. In the
case of 2,3-dimethylbutane the abstraction of a tertiary hydrogen atom during the
chain reaction is more favorable and the resulting radical is too stable to propagate the
chain reaction. The inhibitory action of olefins and aromatic hydrocarbons was

4.C-H Activation through Catalytic Photosulfoxidation of Alkanes
73
explained by Calvert et al.148 They showed that these compounds react 100 times faster
than paraffins with 3SO2 but do not lead to sulfoxidation products.
Theoretically all expected isomers can be found in a sulfoxidation mixture.
However, in a hydrocarbon secondary carbon atoms are more reactive than the
primary atoms. The distribution of isomers has been determined for a few compounds
like n-hexane, n-heptane, and n-dodecane. In the case of n-heptane the ratio of the
relative reactivity between primary and secondary atoms turned out to be 1:30.149,150
In the sulfoxidation are also formed disulfonic acids. They are found in greater
amount than statistically expected. Probably, SO2 and O2 are better soluble in the
water phase (water is added in the light-water-process or formed through Eq. 4.4) and
further sulfoxidation occurs in greater extent. When the proportion of di- and poly-
sulfonic acids is higher than 13 %, the detergent properties of the sulfonates are greatly
diminished. For every 1% alkane conversion to sulfonic acid there is about 10% of di-
and poly-sulfonic acids formation. Nevertheless, higher proportion of di- and poly-
sulfonic acid conversion is avoided by limiting the alkane conversion to ca. 1%.144
Sulfoxidation is practically carried out in a continuous mode. According to the
stoichiometry of the reaction the optimal ratio of SO2/O2 would be 2:1, but since SO2
is 10-fold better soluble in the reaction mixture than O2, an equimolar flow of the two
gases is an essential prerequisite for a reasonable yield. The products have to be
continuously extracted from the reactor. Separation steps become necessary and the
unreacted reagents are recycled and fed into the reactor (vide infra).144
Sulfoxidation is carried out under UV irradiation in the case of light-water-
process,151 acetic anhydride-process,152 and chlorine-process153 or without irradiation
by using initiators like peracids, organic peroxides, ozone152 or γ-rays.154
4.1.2.2 Light-Water-Process
In this process light acts as reaction initiator and water as both reactant and solvent
to extract the product. The reaction is carried out continuously in a cylindrical reactor
into which the mercury medium pressure lamp is immersed. The reason of the
4.C-H Activation through Catalytic Photosulfoxidation of Alkanes
74
continuous mode operation is principally to avoid following two problems: during the
reaction the medium becomes turbid and the sulfonic acids which are not very soluble
in the alkane separate at the bottom of the reactor and in these conditions di- and poly-
sulfoxidation occurs more rapidly. Extracting the products with water limits further
sulfoxidation. Furthermore sulfonic acidssticks to the wall surrounding the light source
forming tarry deposits which block the passage of light.
The alkylpersulfonic acid formed according to the mechanism depicted in Fig. 4.2
does not generate new radicals according to Eq. 4.2 but reacts instantly with SO2 and
H2O to give sulfonic acid and sulfuric acid as shown in Eq. 4.5.
RSO2OOH + SO2 + H2O → RSO3H + H2SO4 (4.5)
Therefore, formation of starter radicals is inhibited in the presence of water and the
radical chain reaction can proceed only under permanent irradiation.
The optimal reaction-temperature is between 30 – 38 °C. Above 40 °C the yield
decreases quickly.
The light-water-process allowed sulfoxidation of high-molecular aliphatic
hydrocarbons and represents the best sulfoxidation process with regarding to yield and
quality of the product. In fact, in this case the ratio between mono- and poly-
sulfoxidized products is 9:1 whereas in the other processes it is much smaller.
Furthermore, because of the immediate and direct transformation of persulfonic acid
into the product, the formation of by products is very low.
The method of operation consists of five phases:
REACTION: The reactor is fed continuously with mepasin and water and from its
bottom a gas mixture of SO2 and O2 in the ratio 1:2 is introduced. The reaction is
carried out under pressure (normally 5 atm) and at temperature of about 30°C. The
circulating gases and powerful stirrers ensure intensive mixing in the reactor. 60kW
mercury arc lamps are used as the light source to initiate and maintain the reaction.

4.C-H Activation through Catalytic Photosulfoxidation of Alkanes
75
FIRST SEPARATION: in this step the unreacted mepasin is separated from the
aqueous phase containing sulfonic acid, sulphuric acid and a small amount of mepasin.
The unreacted mepasin is refluxed again into the reactor and the aqueous phase
undergoes the second separation.
SECOND SEPARATION: The former aqueous phase is preheated and fed in a second
fractionating column. The lower phase contains aqueous sulphuric acid (22%), the
upper phase is cooled and transferred to the neutralization step.
NEUTRALIZATION. The necessary amount of NaOH is fed in order to obtain
sulfonate and sulphate.
PURIFICATION: in the last step the remaining mepasin is removed from the
neutralized extract at 200°C in vacuo through an evaporator obtaining sodium
sulfonate, water and mepasin.
4.1.2.3 Acetic Anhydride Process
During the second world war was desired a process which could be carried out
without permanent irradiation because of the problems related with glass production
transport and installation. The acetic anhydride process turned out to be a suitable
alternative to the light-water-process.
This process is based on the experimental observation that the persulfonic acid can
react with acetic anhydride to give a stable and isolable alkyl-persulfonyl-acetic
anhydride according to the following equation
RSO2OOH + (CH3CO)2O → RSO2OOCOCH3 + CH3COOH (4.6)
The mixed anhydride decomposes in the presence of SO2 and H2O forming two
radicals (Eq. 4.7) which in turn through further H-abstraction react to sulfonic acid and
acetic acid (Eqs. 4.3 and 4.8).
RSO2OOCOCH3 → RSO2O· + CH3COO· (4.7)
4.C-H Activation through Catalytic Photosulfoxidation of Alkanes
76
CH3COO· + RH → CH3COOH + R· (4.8)
The reaction proceeds in this way after an initial imput (UV-light, ozone, γ-rays)
without further irradiation, although acetic anhydride has to be introduced
continuously into the reactor (the concentration of acetic anhydride should remain at
about 2.5 %).
As observed in the light-water-process, also in this case the product should be removed
continuously from the reactor. The reaction step is divided in two part: in the first
reactor (40°C) the mixed anhydride is formed which after an appropriate reaction time
is pumped in the second reactor (60°C) containing water or diluite acetic acid but no
more acetic anhydride. The persulfonic acids formed in the first step is now
transformed into sulfonic acid. The subsequent separation and purification steps occur
similarly to the light-water-process.
This process solves the problem of permanent irradiation and produces sulphuric acid
in a smaller extent. On the other hand, a higher amount of by-products is formed and
the produced acetic acid should be eliminated because it is not desirable for the
detergent properties of the sulfonate. These problems make the industrial scale
operation expensive and complicated.
4.1.2.4 Other Processes
OZONE PROCESS: Sulfoxidation of paraffins may be performed in the dark by
bubbling through them SO2 and ozone-containing oxygen. The product yield is
proportional to the amount of ozone introduced. Irradiating a paraffin suspension with
UV light and bubbling SO2 and ozone leads to a decrease in yield as compared to the
case in which oxygen is introduced.
CHLORINE PROCESS: Weghofer et al. developed a system in which the starter
radical is Cl· produced through UV irradiation of Cl2 (2%). Cl· abstracts a hydrogen
atom from the alkane and the reaction proceeds similarly to the other processes.

4.C-H Activation through Catalytic Photosulfoxidation of Alkanes
77
Cl2 2Cl· (4.9)
Cl· + RH → HCl + R· (4.10)
γ-RADIATION: Black and Baxter from the company ESSO in USA found that γ-
radiation from a Cobalt-60 source promotes sulfoxidation of alkanes. There are several
advantages:
(i) the presence of water is not necessary and therefore the separation step is simple
and less expensive.
(ii) only a relatively low intensity power source is required.
The disadvantage of this system is that the yield of di- and poly-sulfonic acid is very
high (up to 40% of the total mixture of sulfonic acid).
PERACIDS AND PEROXIDES: Saturated linear chain peracids such as peracetic acid
and its homologues, aromatic peracids or persulfonic acids are known to be good
initiators of sulfoxidation. However, it is required that the initiators are continuously
added during the reaction.
Organic peroxides are another important class of initiators although their utilization
demands a higher reaction temperature, which is more risky on the industrial scale. It
has been found that cyclohexanepersulfonyl peracetate, which decomposes at around
70°C, initiates sulfoxidation effectively. As already mentioned this type of initiator is
generally formed in situ when acetic anhydride is present during the sulfoxidation.
MERCURY PHOTOSENSITIZED PROCESS: A rare example for a sensitized
process (not industrially applied) is the mercury photosensitized sulfination of alkanes
with SO2 (Crabtree et al.155) producing initially sulfinic acids (RSOOH) and sulfinic
esters which have to be further oxidized to sulfonic acids by hydrogen peroxide. The
mechanism of this process is summarized in the following reactions.
Hg + hν (254 nm) → Hg* (4.11)
h ν

4.C-H Activation through Catalytic Photosulfoxidation of Alkanes
78
SO2 → SO2* (4.12)
RH + SO2* → R· + HSO2· (4.13)
SO2 + R· → RSO2· (4.14)
RSO2· + (H·, R·) → RSOO-(H, R) (4.15)
RSO2· + RH → RSOOH + R· (4.16)
RSOOH → RSO3H (4.17)
Since a low pressure Hg lamp was used for the irradiation, it is unlikely that direct
absorption by SO2 could be occurring at 254 nm (the most intense Hg line) because of
the small absorption coefficient of SO2 at that wavelength (ε = 1.1 atm-1 cm-1);
therefore, all the light should be absorbed by Hg. SO2 traps then R· (Eq. 4.14) and by
successive addition of H· or R· (Eq. 4.15) leaves to the sulfinic acid and sulfinic ester,
respectively. The latters have to be further oxidized to sulfonic acids by hydrogen
peroxide (Eq. 4.17).
4.1.3 State of Knowledge before this work
One of the most successful approach to visible light active titania photocatalysts,
was the synthesis of PtCl4 modified titania, carried out in our research group (see also
Chapter 3). Its great activity in degradation of various pollutants suggested to
investigate whether this novel catalyst possessed also photocatalytic activity in alkane
sulfoxidation. Since it was known that visible irradiation of TiO2-O-PtCl4 produced Cl·
and OH· it seemed likely that these radicals should be able to abstract hydrogen from
alkanes and therefore initiate sulfoxidation.
Hg*
H2O2
4.C-H Activation through Catalytic Photosulfoxidation of Alkanes
79
In 2002 first investigations on sulfoxidation were started in a system similar to that
described in the light-water-process. It consisted of two liquid phases (water and n-
heptane) in which PtCl4 modified titania was suspended and a mixture of SO2/O2 was
continuously bubbled through the suspension.156 The system was efficiently mixed by
magnetic stirring and irradiated with visible light. Unfortunately, the first positive
results could not be reproduced and no sulfonic acid could be detected anymore. In
fact, the catalyst was not suitable and the presence of water in this heterogeneous
system inhibited the reaction.
After that disappointing result also the sulfoxidation of solid alkanes was
attempted. The alkane chosen was adamantane for its high symmetry and because its
UV and thermal sulfoxidation were well known in literature. Adamantane was
dissolved in methanol, and after addition of titania the mixture was stirred under
SO2/O2 atmosphere and irradiated by visible light.157 However, the reported formation
of adamantane sulfonic acid could not be reproduced. It was therefore one aim of this
work to find out what the reason for the irreproducibility could be.
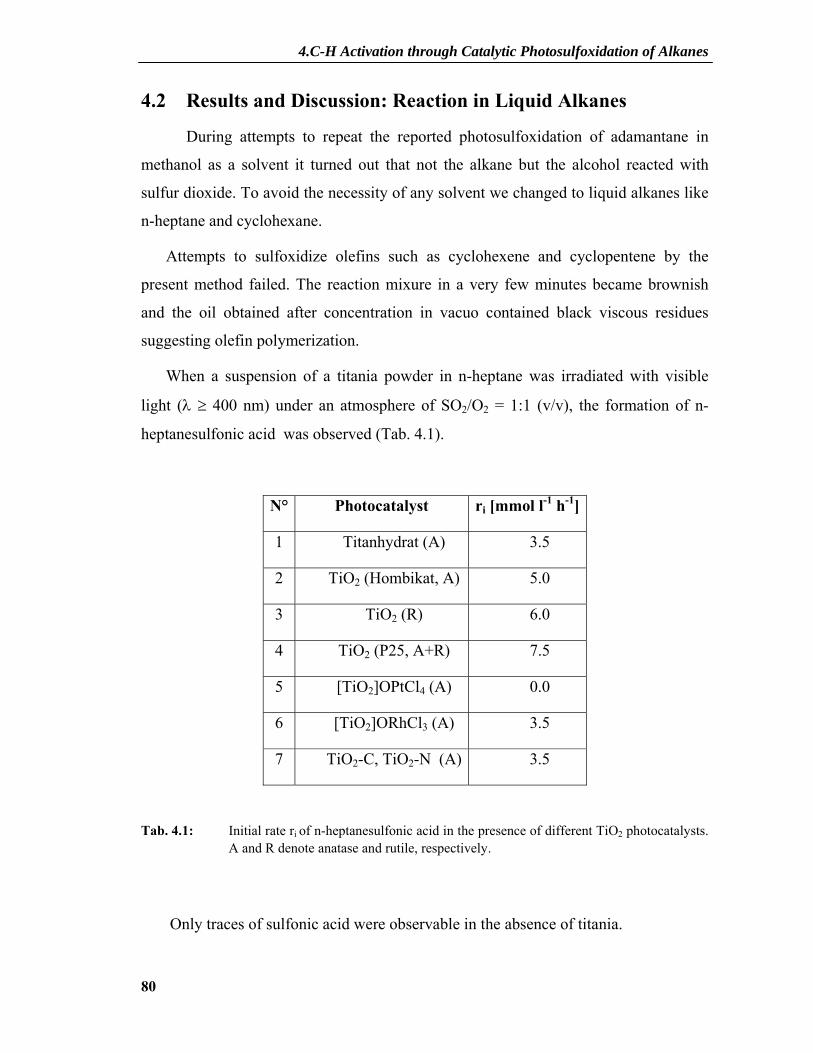
4.C-H Activation through Catalytic Photosulfoxidation of Alkanes
80
4.2 Results and Discussion: Reaction in Liquid Alkanes
During attempts to repeat the reported photosulfoxidation of adamantane in
methanol as a solvent it turned out that not the alkane but the alcohol reacted with
sulfur dioxide. To avoid the necessity of any solvent we changed to liquid alkanes like
n-heptane and cyclohexane.
Attempts to sulfoxidize olefins such as cyclohexene and cyclopentene by the
present method failed. The reaction mixure in a very few minutes became brownish
and the oil obtained after concentration in vacuo contained black viscous residues
suggesting olefin polymerization.
When a suspension of a titania powder in n-heptane was irradiated with visible
light (λ ≥ 400 nm) under an atmosphere of SO2/O2 = 1:1 (v/v), the formation of n-
heptanesulfonic acid was observed (Tab. 4.1).
N° Photocatalyst ri [mmol l-1 h-1]
1 Titanhydrat (A) 3.5
2 TiO2 (Hombikat, A) 5.0
3 TiO2 (R) 6.0
4 TiO2 (P25, A+R) 7.5
5 [TiO2]OPtCl4 (A) 0.0
6 [TiO2]ORhCl3 (A) 3.5
7 TiO2-C, TiO2-N (A) 3.5
Tab. 4.1: Initial rate ri of n-heptanesulfonic acid in the presence of different TiO2 photocatalysts. A and R denote anatase and rutile, respectively.
Only traces of sulfonic acid were observable in the absence of titania.

4.C-H Activation through Catalytic Photosulfoxidation of Alkanes
81
Initial product formation rates were 3.5 mmol/l.h and 5.0 mmol/l.h for the anatase
materials Titanhydrat and Hombikat, respectively, whereas for rutile and the mixed
phase powder P25 (75% anatase / 25% rutile) values of 6.0 mmol/l.h and 7.5 mmol/l.h
were observed. These surprisingly high rates for rutile may be due to the reported
better adsorption of SO2 as compared to anatase and to the fact that the rutile powder
employed (kindly provided from Prof. T. Egerton) had an unusual high specific
surface area (140 m2 g-1).
Out of the modified titania powders (entries 5-7), which are all good photocatalysts
in 4-chlorophenol visible light oxidation,117,133,158,159only the titania-chlororhodate
complex and carbon- or nitrogen-modified titania exhibited moderate rates of 3.5
mmol/l.h. The platinum chloride modified TH was totally inactive under these reaction
conditions. The same reaction was also carried out with cyclohexane. In the following,
if not otherwise specified, we will report on the n-heptane sulfoxidation taking into
account that similar results are obtained also for cyclohexane. The successful
sulfoxidation of this second alkane ensures the general applybility of the method.
4.2.1 Product Characterization
In a standard experiment, after 5 h of irradiation time the photocatalyst was filtered
through a micropore filter and the filtrate was concentrated in vacuo. The slightly
yellow, oily residue was dissolved in 3 ml of methanol and analyzed by HPLC with
indirect photometric chromatography (IPC) (for experimental details see Paragraph
4.4).
4.2.1.1 Principle of IPC and Measurements
Indirect photometric liquid chromatography (IPC)160,161 is the name given to a
technique which uses a UV-absorbing counter-ion in an ion-exchange mode with an
UV detector to determine UV-transparent ionic species. IPC, as described in detail by
Small and Miller, was first used for the determination of inorganic ions and then also
for quaternary ammonium salts (Later Larson and Pfeiffer), alkylamines and
alkanolamines.

4.C-H Activation through Catalytic Photosulfoxidation of Alkanes
82
Alkyl sulfonates are also UV-transparent compounds. Larson reported in 1985 on
their detection by means of this method. As already mentioned this approach is based
on the use of UV-absorbing eluents, made so by including in the eluent light absorbing
ions of the same charge as the ions to be separated. These ions have a dual role: (1) of
selectively displacing the sample ions from the chromatographic column; (2) of
revealing the sample ions to be separated. The appearance of sample ions in the
effluent is signaled by dips or troughs (negative peacks) in the baseline absorbance of
the effluent as the transparent sample ions substitute for the light-absorbing displacing
ions in the column.
Consider an ion exchange column which has been pumped and equilibrated with
an electrolyte UV-absorbing denoted as Na+E- so that the sites in the column are
occupied by E-. If the feed concentration of the eluent is maintained constant, a
detector placed at the outlet of the column would reveal a steady level of Na+ and E-
(Fig. 4.3).
Figure 4.3: Schematic representation of the principle of indirect photometric detection. A: before injection of the sample, B: after injection of the sample.(Taken from ref.161)
When a sample electrolyte denominated as Na+S- is injected, the anion S- will
generally retarded by the stationary phase and will exit at a characteristic elution time
depending on capacity of the exchanger, concentration of the solution and affinity of
the stationary phase for S- relatively to E-. A direct detection would show the
Abs
orba
nce
(a.u
.)
Abs
orba
nce
(a.u
.)
Elution Volume Elution Volume

4.C-H Activation through Catalytic Photosulfoxidation of Alkanes
83
concentration of S- rise and fall in a positive peak. Nevertheless, according to the
principle of electroneutrality and equivalence of exchange, the appearance of S- must
be accompanied from a concerted and equivalent change in E-, since the concentration
of sodium counter-ions is fixed. It therefore follows that the concentration of S- can be
indirectly (hence the name of this technique) monitored by continuously monitoring
the level of eluent ion E- and the troughs generated in the base line absorbance as
transparent sample ions elute.
Notable advantages of this technique are its single column simplicity, its
applicability to a wide range of ionic species and inherent great sensitivity.
In our case the role of E- is played by a hydrogenphthalate ion and of S- by the
sulfonic acid salt. At the beginn the chromatogram presents an off-scale deflection.
This is due to the ion exchange displacement of hydrogenphthalate by the injected
sample anions as a whole. After 2 minutes the equilibrium is again established and the
straight baseline shows at about 4 minutes a negative peak, the area of which is
proportional to the concentration of the alkylsulfonate contained in the sample.
Through a calibration curve we obtained the values summarized in the Table 4.1.
Abs
orba
nce
(a.u
.)
t / min0 1 2 3 4 5 6 7 8 9 10
0
0.2
0.4
0.6
0.8
-0.2
-0.4
-0.8
Figure 4.4: HPLC-chromatogram of the reaction product obtained in the photosulfoxidation of n-heptane (−) and of authentic 1-heptanesulfonic acid sodium salt (---). The presence of small amounts of 2-heptanesulfonic acid and other regioisomers cannot be excluded.
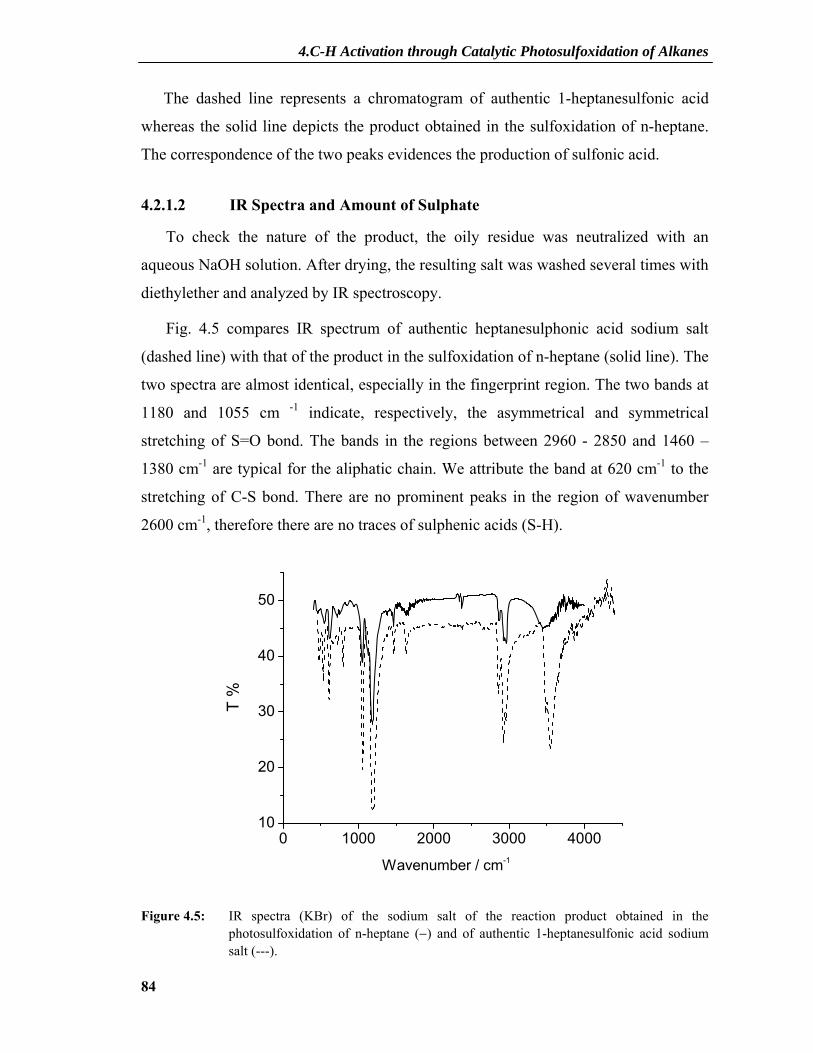
4.C-H Activation through Catalytic Photosulfoxidation of Alkanes
84
The dashed line represents a chromatogram of authentic 1-heptanesulfonic acid
whereas the solid line depicts the product obtained in the sulfoxidation of n-heptane.
The correspondence of the two peaks evidences the production of sulfonic acid.
4.2.1.2 IR Spectra and Amount of Sulphate
To check the nature of the product, the oily residue was neutralized with an
aqueous NaOH solution. After drying, the resulting salt was washed several times with
diethylether and analyzed by IR spectroscopy.
Fig. 4.5 compares IR spectrum of authentic heptanesulphonic acid sodium salt
(dashed line) with that of the product in the sulfoxidation of n-heptane (solid line). The
two spectra are almost identical, especially in the fingerprint region. The two bands at
1180 and 1055 cm -1 indicate, respectively, the asymmetrical and symmetrical
stretching of S=O bond. The bands in the regions between 2960 - 2850 and 1460 –
1380 cm-1 are typical for the aliphatic chain. We attribute the band at 620 cm-1 to the
stretching of C-S bond. There are no prominent peaks in the region of wavenumber
2600 cm-1, therefore there are no traces of sulphenic acids (S-H).
Figure 4.5: IR spectra (KBr) of the sodium salt of the reaction product obtained in the photosulfoxidation of n-heptane (−) and of authentic 1-heptanesulfonic acid sodium salt (---).
0 1000 2000 3000 400010
20
30
40
50
T %
Wavenumber / cm-1
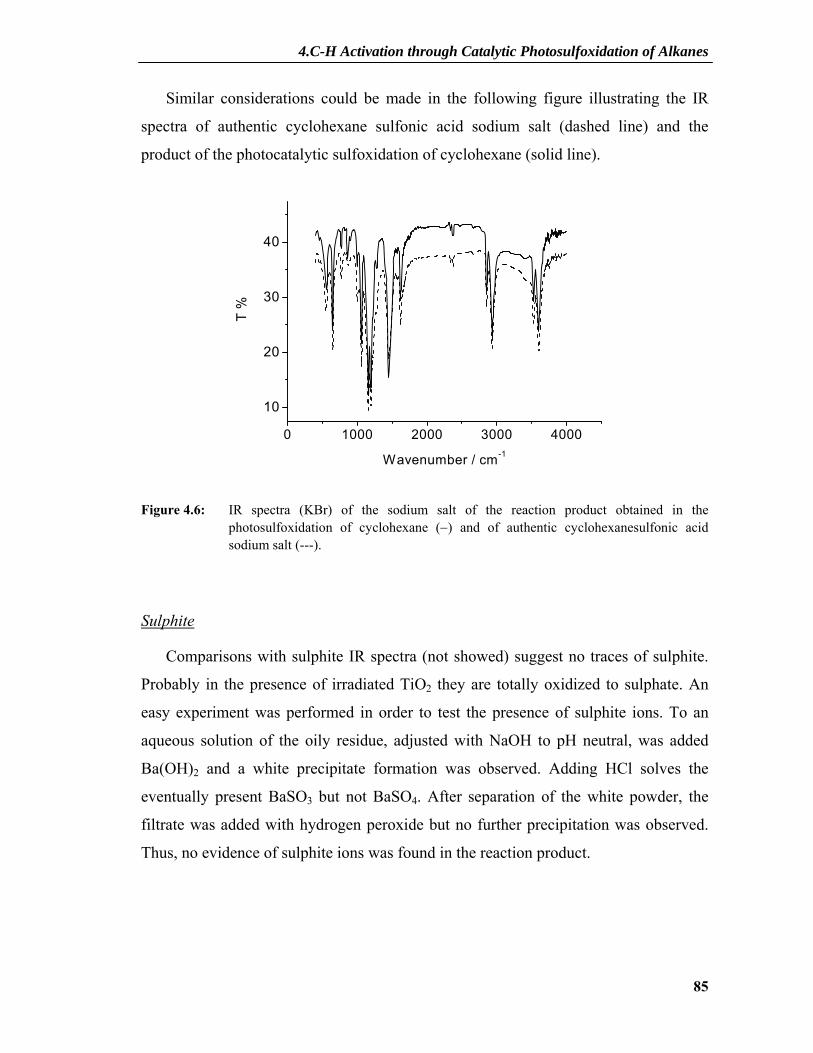
4.C-H Activation through Catalytic Photosulfoxidation of Alkanes
85
Similar considerations could be made in the following figure illustrating the IR
spectra of authentic cyclohexane sulfonic acid sodium salt (dashed line) and the
product of the photocatalytic sulfoxidation of cyclohexane (solid line).
Figure 4.6: IR spectra (KBr) of the sodium salt of the reaction product obtained in the photosulfoxidation of cyclohexane (−) and of authentic cyclohexanesulfonic acid sodium salt (---).
Sulphite
Comparisons with sulphite IR spectra (not showed) suggest no traces of sulphite.
Probably in the presence of irradiated TiO2 they are totally oxidized to sulphate. An
easy experiment was performed in order to test the presence of sulphite ions. To an
aqueous solution of the oily residue, adjusted with NaOH to pH neutral, was added
Ba(OH)2 and a white precipitate formation was observed. Adding HCl solves the
eventually present BaSO3 but not BaSO4. After separation of the white powder, the
filtrate was added with hydrogen peroxide but no further precipitation was observed.
Thus, no evidence of sulphite ions was found in the reaction product.
0 1000 2000 3000 4000
10
20
30
40T
%
Wavenumber / cm-1
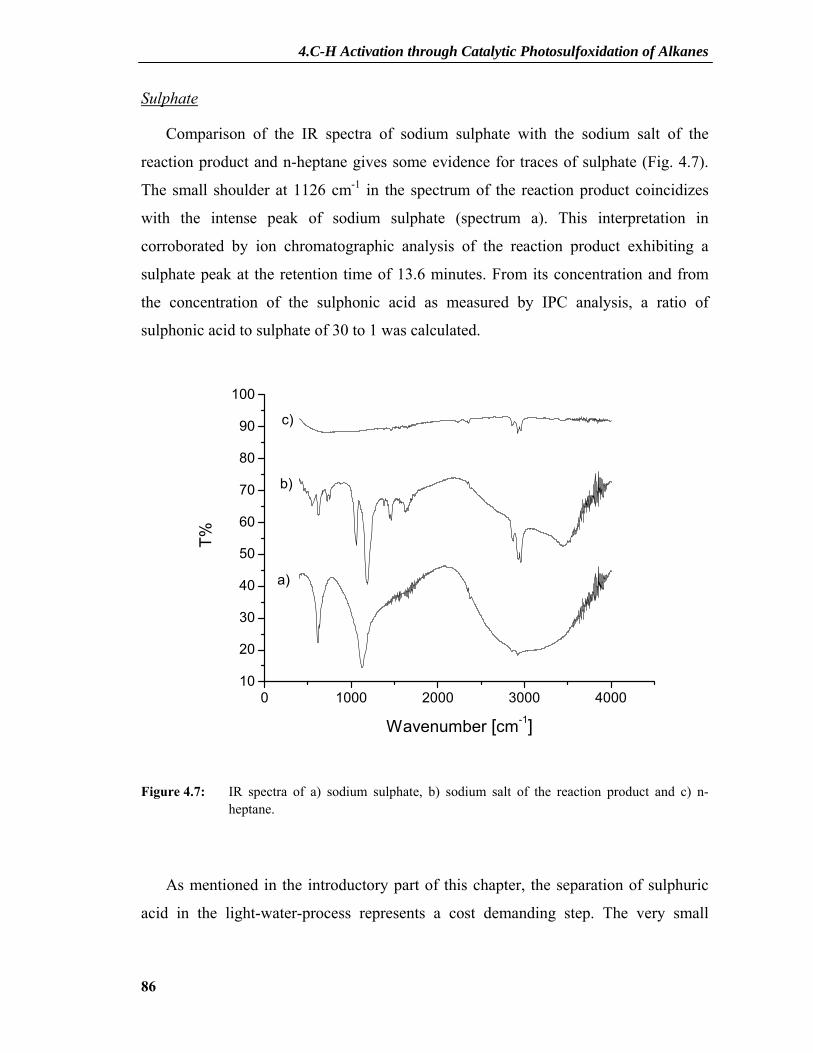
4.C-H Activation through Catalytic Photosulfoxidation of Alkanes
86
Sulphate
Comparison of the IR spectra of sodium sulphate with the sodium salt of the
reaction product and n-heptane gives some evidence for traces of sulphate (Fig. 4.7).
The small shoulder at 1126 cm-1 in the spectrum of the reaction product coincidizes
with the intense peak of sodium sulphate (spectrum a). This interpretation in
corroborated by ion chromatographic analysis of the reaction product exhibiting a
sulphate peak at the retention time of 13.6 minutes. From its concentration and from
the concentration of the sulphonic acid as measured by IPC analysis, a ratio of
sulphonic acid to sulphate of 30 to 1 was calculated.
0 1000 2000 3000 400010
20
30
40
50
60
70
80
90
100
T%
Wavenumber [cm-1]
c)
b)
a)
Figure 4.7: IR spectra of a) sodium sulphate, b) sodium salt of the reaction product and c) n-heptane.
As mentioned in the introductory part of this chapter, the separation of sulphuric
acid in the light-water-process represents a cost demanding step. The very small

4.C-H Activation through Catalytic Photosulfoxidation of Alkanes
87
amount of sulphate produced in the present visible light sulfoxidation is therefore
remarkable.
4.2.1.3 Elemental Analysis
Elemental analysis of the oily residue obtained after filtration and concentration in
vacuo of the reaction suspension afforded 43.06% C, 8.59%H, 17.74% S. These
values, within experimental error, are in good correlation with the theoretical values
(46.6% C, 8.8% H, 17.7% S) and suggest that this sulfoxidation affords mono-
heptanesulfonic acid.

4.C-H Activation through Catalytic Photosulfoxidation of Alkanes
88
4.2.2 Dependence on Photocatalyst Concentration
The concentration of P25 was varied in order to achieve optimal light absorption
with a minimum amount of catalyst.
0 1 2 3 4 5
0
10
20
30
40
Pro
duct
con
c. [m
M]
Catalyst conc. [ g/l ]
Figure 4.8: Dependence of the product concentration on the catalyst concentration obtained after 5 h irradiation.
After the concentration of 2 g/l a plateau is reached and a further increase in
catalyst concentration does not induce increase the sulfonic acid concentration. The
high photocatalyst concentration of 2 g/l ensures complete light absorption in each
experiment and therefore the initial rates in Tab. 4.1 (calculated from the product
concentration at 5 h irradiation time) are comparable.

4.C-H Activation through Catalytic Photosulfoxidation of Alkanes
89
4.2.3 Deactivation and Regeneration of the Photocatalyst
Fig. 4.9 illustrates the dependence of sulfonic acid concentration on the irradiation
time. Six standard reactions are shown, each performed with a different irradiation
time. The yield increases with increasing irradiation time up to 7 h, when a plateau is
reached. About at the same time, the initially perfect suspension separated into a clear
solution and a sticky catalyst layer, adhering to the bottom of the reactor. The color of
the catalyst has slowly changed to grey-yellowisch. Similar deactivation was found for
all catalysts summarized in Tab. 4.1.
0 2 4 6 8 10
0
5
10
15
20
25
30
Pro
duct
con
c. [m
M]
T im e / h
tota l deactivation
Figure 4.9: Dependence of sulfonic acid concentration on the irradiation time.
The catalyst could be fully reactivated by the following procedure: after 10 h
irradiation (to ensure total deactivation), n-heptane was removed from the reaction
mixture in vacuum, giving a thick slurry containing deactivated TiO2 and sulphonic
acid. Washing ultrasonically with methanol, changed the colour of the photocatalyst to
white. Then, the photocatalyst was separated from the methanolic phase by
centrifugation. The methanol solution was analyzed by IPC, while the TiO2 was dried
in vacuum at 40°C and reused for another reaction. This procedure was repeated three
times and the yield was almost the same after each successive reaction as shown in
Fig. 4.10. This indicates the catalytic nature of this photosulfoxidation.

4.C-H Activation through Catalytic Photosulfoxidation of Alkanes
90
0
10
20
30
40
hνhν
c(1)
/ m
M
hν
R R R
0 10 0 10 0 10
Time / h
Figure 4.10: Sequential photosulfoxidation of n-heptane. λirr ≥ 400 nm. R = regeneration.
This observation suggested that the reaction is inhibited by strong product
adsorption and that washing desorbs the sulfonic acid. Accordingly, no product
formation was observable when heptane sulfonic acid was added to the suspension
prior to irradiation.
A similar deactivation and activation was observed by Shang et al.162 during photo-
oxidation of sulfur dioxide in the presence of gaseous n-heptane and oxygen at UV-
irradiated titania powder at room temperature. In the n-C7H16/O2/TiO2 system, no
catalyst deactivation was observed, while for SO2/O2/TiO2 and n-C7H16/SO2/O2/TiO2,
the photocatalytic activity of TiO2 powder showed decreasing and eventually no
activity after used consecutively. Sulfur trioxide and sulfuric acid are supposed to be
the poisoning species. In this gas phase reaction presence of water vapor does not
influence the reactivity.
4.C-H Activation through Catalytic Photosulfoxidation of Alkanes
91
However, in our case product formation was inhibited when small amounts of
water like 0.3 vol% were present in the suspension. This may be due to blocking of the
reactive surface centres for heptane oxidation by preferential adsorption.
The influence of water will be discussed in detail in Paragraph 4.4, describing the
acetic acid system.
4.2.4 Surface Modifications of the Catalyst
In order to improve the reaction we tried to modify the surface of the catalyst in
two ways:
1. Enhance visible light absorption
2. Improve the dispersion of the catalyst (polar) in the suspension (apolar).
Many techniques are suitable in order to improve the visible light absorption as
already mentioned in the introductory part of this dissertation. Since in our group
surface modifications through transition metal salts and organic nitrogen- or carbon-
compounds have been extensively investigated, similar attempts were made in this
work.
Besides the rhodium159 and platinum modified titania61, we accomplished also
titania modification by RuCl3 · xH2O and IrCl3 · 3H2O with a similar method as
described for rhodium in Chapter 3. In all case we observed a new absorption in the
visible spectral region.

4.C-H Activation through Catalytic Photosulfoxidation of Alkanes
92
300 400 500 600 7000,00
0,05
0,10
0,15
0,20
0,25
F(R
∞)
Wavelength / nm
a b c d
Figure 4.11: Diffuse reflectance spectra of 4.0%Pt(IV)/TH (a), 2.0%IrCl3/TH (b), 4.0%RuCl3/TH (c), and 2.0%RhCl3/TH (d). The Kubelka-Munk function, F(R∞), is used as the equivalent of absorbance.
However, out of the mentioned catalysts only the rhodium modification was active
in sulfoxidation, whereas the other catalysts were not stable under the given
experimental conditions as could be noticed by colour losses during the reaction and
absence of sulfonic acid formation.
The well known carbon133 and nitrogen158 modified titania extend as well the onset
of light absorption of titania to the visible region (Fig. 4.12). They induced sulfonic
acid production (as summarized in Tab. 4.1) but to smaller extent than unmodified
titania.
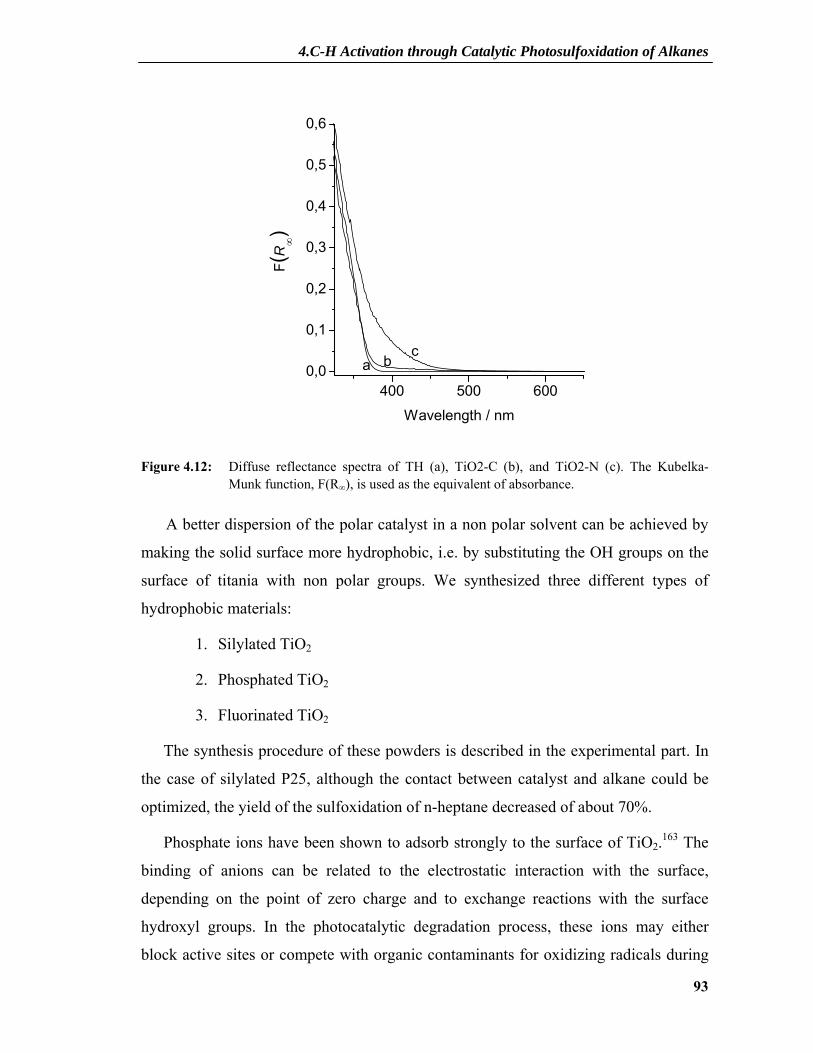
4.C-H Activation through Catalytic Photosulfoxidation of Alkanes
93
400 500 6000,0
0,1
0,2
0,3
0,4
0,5
0,6
F(R
∞)
Wavelength / nm
a bc
Figure 4.12: Diffuse reflectance spectra of TH (a), TiO2-C (b), and TiO2-N (c). The Kubelka-
Munk function, F(R∞), is used as the equivalent of absorbance.
A better dispersion of the polar catalyst in a non polar solvent can be achieved by
making the solid surface more hydrophobic, i.e. by substituting the OH groups on the
surface of titania with non polar groups. We synthesized three different types of
hydrophobic materials:
1. Silylated TiO2
2. Phosphated TiO2
3. Fluorinated TiO2
The synthesis procedure of these powders is described in the experimental part. In
the case of silylated P25, although the contact between catalyst and alkane could be
optimized, the yield of the sulfoxidation of n-heptane decreased of about 70%.
Phosphate ions have been shown to adsorb strongly to the surface of TiO2.163 The
binding of anions can be related to the electrostatic interaction with the surface,
depending on the point of zero charge and to exchange reactions with the surface
hydroxyl groups. In the photocatalytic degradation process, these ions may either
block active sites or compete with organic contaminants for oxidizing radicals during
4.C-H Activation through Catalytic Photosulfoxidation of Alkanes
94
the photocatalysis process. Abdullah et al.164 showed that the presence of phosphate in
solution reduced the rate of titania photocatalyzed oxidation of model organic
contaminants by as much as 70%. Similarly, using phosphated P25 as a catalyst of
sulfoxidation, reduces the product yield by about 90%.
Since the flatband potential and the bandgap energy of titania does not change after
silylation or phosphatation, these results could be explained by blocking of the active
sites due to the surface modification.
Fluoride ions represent the sole exception in this context. Surface fluorination of
TiO2, strongly modifies its surface properties.165-168 The formed ≡Ti-F species
dominate at acidic pH, with an almost complete displacement of surface –OH groups
at pH 3.7. The effect of such adsorption has not been completely clarified yet. TiO2
fluorination in aqueous media has been reported to either increase or decrease the rate
of photocatalytic reaction involving different substrates. The results of a decreased
reaction rate have been related to the inhibition of hole transfer oxidation, consequent
to the hindered adsorption of substrates and to the reduced IFET rates due to the strong
electronegativity of fluorine. At the same time cases of enhanced activity were
explained by the generation of “bulk” hydroxyl radicals which are expected to be
stronger oxidants than OH radicals bound to the surface of the unmodified TiO2.
Macyk et al.165 observed that surface modification with fluoride ions or silyl groups
induced UV light photoactivity of TiO2 toward cyanuric acid degradation. They
attribute these results to the formation of highly oxidizing singlet oxygen. In fact,
surface modification enhances the energy transfer pathway and suppresses the
interfacial electron transfer which lead to formation of OH radicals.
In our case using fluorinated TiO2 enhanced the reaction rate by about 35%. The
reason of this is not easily understandable. In fact, the flatband potential of titania is
the same also after fluorination. The hypothesis of an energy transfer and consequent
singlet oxygen formation seems unlikely, because the silylated samples do not show
similar behaviour. Furthermore, formation of product was inhibited in the presence of
methanol which scavenges effectively OH radicals but not singlet oxygen. Perhaps a
4.C-H Activation through Catalytic Photosulfoxidation of Alkanes
95
higher availability of “bulk” OH radicals and a better contact between substrate and
catalyst could explain these results.
4.2.5 Interaction between SO2 and TiO2
The interaction between SO2 and TiO2 is well documented in literature162,169-174 for
at least three reasons:
• SO2 is one of the most common catalyst poisons.
• The Claus reaction is a well known process for the recovery of sulfur from
acidic gases containing hydrogen sulfide. In the modified Claus reaction, H2S is first
oxidized to SO2 and then the catalytic reaction between SO2 and the rest of H2S takes
place to produce sulfur and water according to Eq. 4.18:
2H2S + SO2 → 2H2O + 3/x Sx (4.18)
In practice γ-Al2O3 has long been used as the catalyst for the Claus reaction.
However, it was often found that it is readily deactivated due to the formation of
sulfate or strongly adsorbed species on the catalytic surface.175 Moreover small
amounts of oxygen may lead to a dramatic decrease of the catalytic activity. Since
1980, it has been increasingly reported that TiO2 based catalysts show superior
catalytic properties for this important reaction.176
• SO2 is one of the most important air pollutants and a very corrosive
molecule.
On the other hand, TiO2 is a widely used catalyst support for many technological
applications. Therefore, knowledge of the interaction, adsorption and desorption
processes of SO2 on TiO2 is of basic importance.
The results of previous work on this topic are somewhat contradictory, with one
study reporting little reaction and another evidencing formation of a surface sulphite-
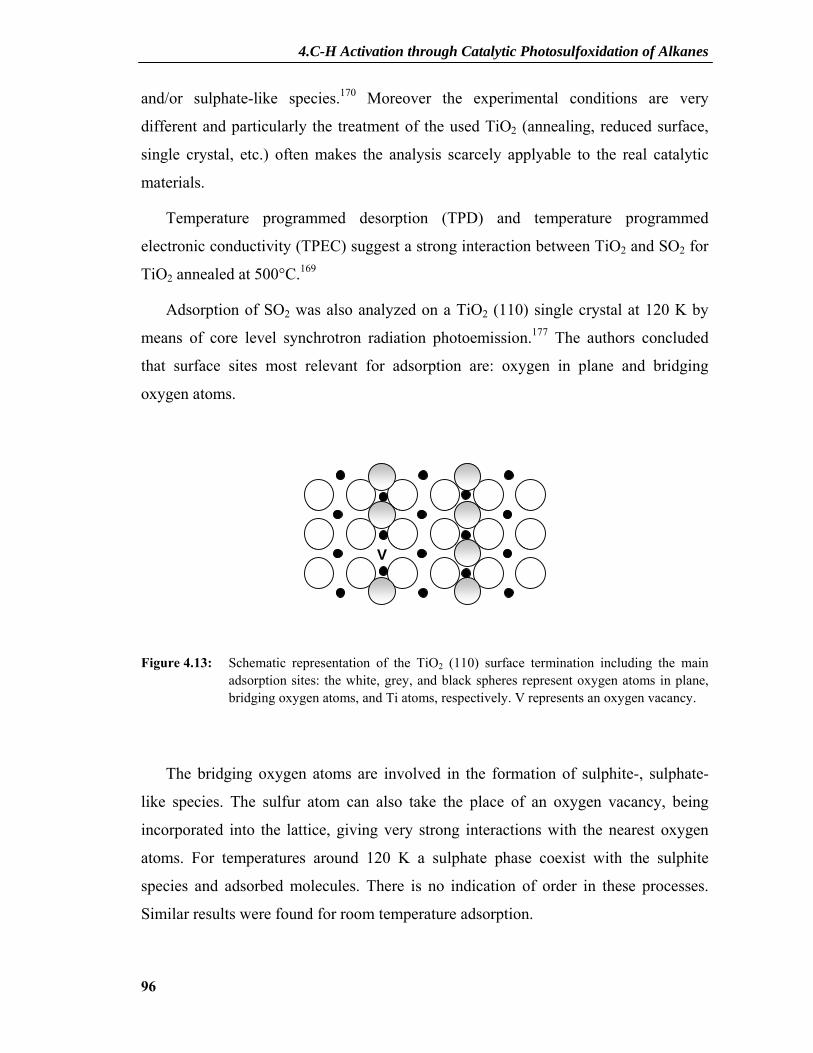
4.C-H Activation through Catalytic Photosulfoxidation of Alkanes
96
and/or sulphate-like species.170 Moreover the experimental conditions are very
different and particularly the treatment of the used TiO2 (annealing, reduced surface,
single crystal, etc.) often makes the analysis scarcely applyable to the real catalytic
materials.
Temperature programmed desorption (TPD) and temperature programmed
electronic conductivity (TPEC) suggest a strong interaction between TiO2 and SO2 for
TiO2 annealed at 500°C.169
Adsorption of SO2 was also analyzed on a TiO2 (110) single crystal at 120 K by
means of core level synchrotron radiation photoemission.177 The authors concluded
that surface sites most relevant for adsorption are: oxygen in plane and bridging
oxygen atoms.
Figure 4.13: Schematic representation of the TiO2 (110) surface termination including the main adsorption sites: the white, grey, and black spheres represent oxygen atoms in plane, bridging oxygen atoms, and Ti atoms, respectively. V represents an oxygen vacancy.
The bridging oxygen atoms are involved in the formation of sulphite-, sulphate-
like species. The sulfur atom can also take the place of an oxygen vacancy, being
incorporated into the lattice, giving very strong interactions with the nearest oxygen
atoms. For temperatures around 120 K a sulphate phase coexist with the sulphite
species and adsorbed molecules. There is no indication of order in these processes.
Similar results were found for room temperature adsorption.
V

4.C-H Activation through Catalytic Photosulfoxidation of Alkanes
97
Yanagisawa173 reported of oxygen exchange between SO2 adsorbate and TiO2
surfaces. Adsorption processes of 18O-enriched SO2 were analyzed on vacuum-
annealed powders with temperature-programmed desorption, gas analysis, and Auger
electron spectroscopy. At room temperature a fair amount of oxygen exchange
between SO2 and lattice oxygens takes place on the surface.
A very interesting study for the aim of this dissertation is reported from Shang et
al.162 on the deactivation and regeneration of TiO2 nanoparticles in three photocatalytic
oxidation systems: n-C7H16, SO2 and n-C7H16/SO2 carried out at room temperature, in
a gas-solid phase batch reactor under UV irradiation. It was obwerved that the
oxidation of n-heptane was inhibited by the presence of SO2. Inhibition was
accompanied by oxidation of SO2 to SO3 adsorbed on the catalyst surface.
Furthermore, the catalyst acquired a yellow color and also further oxidation of SO2
was inhibited. This indicates that the adsorbed products block the active sites of TiO2.
Poisoning species are proposed to be SO3, sulfuric acid, as well as others not identified
organic byproducts. When the adsorbed products were removed by sonicating in water
or methanol, the deactivated catalyst was regenerated. Although this work does not
have any synthetic aspects and was performed under different experimental conditions,
it may enlighten some aspects of the photosulfoxidation discussed in this dissertation.
In order to investigate the poisoning species responsible of the deactivation process
and the related changes on the surface properties of titania we performed XPS
measurements and photo-electromotiv force experiments (PEMF).
4.2.6 XPS Results
4.2.6.1 XPS Principles
X-ray photoelectron spectroscopy (XPS) is a quantitative spectroscopic technique
that measures the binding energy of an electron as a function of the type of atom and
of its chemical environment.
4.C-H Activation through Catalytic Photosulfoxidation of Alkanes
98
When an atom is irradiated with monochromatic X-rays, electrons will be removed
(photoelectric effect). XPS spectra are obtained by irradiating a material with a beam
of aluminium or magnesium X-rays while simultaneously measuring the kinetic
energy (Ekin) and number of electrons that escape from the top 1 to 10 nm of the
material being analyzed. All of the deeper photo-emitted electrons, which were
generated as the X-rays penetrated 1–5 micrometers of the material, are either
recaptured or trapped in various excited states within the material.
Because the energy of a particular X-ray wavelength equals a known quantity, we
can determine the electron binding energy of each of the emitted electrons by using the
Eq. 4.19, based on the work of Rutherford (1914)
BE = hν - Ekin – Φ (4.19)
where BE is the energy of the electron emitted from one electron configuration
within the atom, hν is the energy of the X-ray photons being used, Ekin is the kinetic
energy of the emitted electron as measured by the instrument and Φ is the spectrometer
work function which can be compensated artificially. To count the number of electrons
at each Ekin value, with the minimum of error, XPS must be performed under ultra-
high vacuum conditions.
A typical XPS spectrum is a plot of the number of electrons detected versus the
binding energy of the electrons detected. Each element produces a characteristic set of
XPS peaks at characteristic binding energy values that directly identify each element
that exists in or on the surface of the material being analyzed. These characteristic
peaks correspond to the electron configuration of the electrons within the atoms, e.g.,
1s, 2s, 2p, 3s, etc.. To generate atomic percentage values, each raw XPS signal must be
corrected by dividing its signal intensity (number of electrons detected) by a "relative
sensitivity factor" (RSF) and normalized over all of the elements detected.
To fit experimental XPS peaks or to deconvolve multiple peaks typically means to
compare them with a theoretical model curve composed of model peaks. For modeling
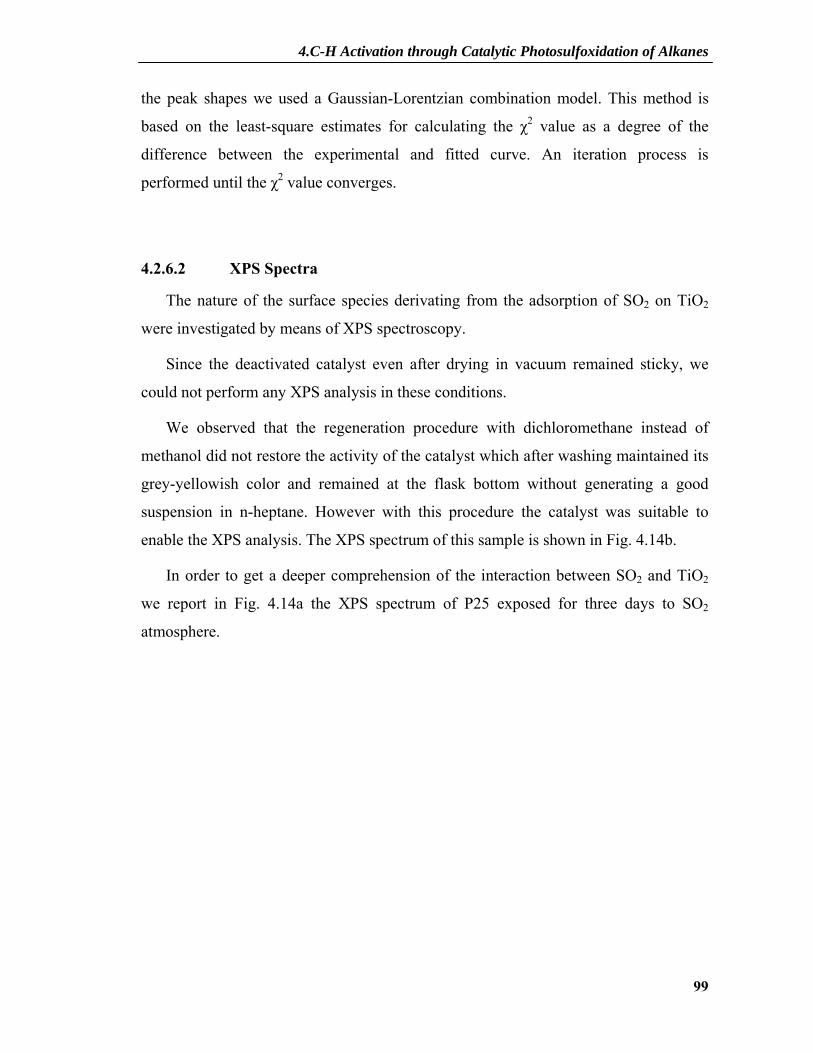
4.C-H Activation through Catalytic Photosulfoxidation of Alkanes
99
the peak shapes we used a Gaussian-Lorentzian combination model. This method is
based on the least-square estimates for calculating the χ2 value as a degree of the
difference between the experimental and fitted curve. An iteration process is
performed until the χ2 value converges.
4.2.6.2 XPS Spectra
The nature of the surface species derivating from the adsorption of SO2 on TiO2
were investigated by means of XPS spectroscopy.
Since the deactivated catalyst even after drying in vacuum remained sticky, we
could not perform any XPS analysis in these conditions.
We observed that the regeneration procedure with dichloromethane instead of
methanol did not restore the activity of the catalyst which after washing maintained its
grey-yellowish color and remained at the flask bottom without generating a good
suspension in n-heptane. However with this procedure the catalyst was suitable to
enable the XPS analysis. The XPS spectrum of this sample is shown in Fig. 4.14b.
In order to get a deeper comprehension of the interaction between SO2 and TiO2
we report in Fig. 4.14a the XPS spectrum of P25 exposed for three days to SO2
atmosphere.
4.C-H Activation through Catalytic Photosulfoxidation of Alkanes
100
164 166 168 170 172
Inte
nsity
(a.u
.)
Binding Energy (eV)
A
B
C
a)
166 168 170 172
Inte
nsity
(a.u
.)
Binding Energy (eV)
B
Db)
Figure 4.14: a) XPS spectrum of P25 exposed for three days to SO2 atmosphere; b) XPS spectrum of the deactivated P25 washed with dichloromethane
The broad peak in spectrum 4.14a has a maximum at about 168.5 eV and two
shoulders at 167.1 eV and 169.7 eV. In the case of the deactivated P25 the peak
maximum is shifted to 169.3 eV and curve fitting gives the best result assuming the
presence of two peaks at binding energy of 168.7 eV (B) and 169.6 eV (D).
In the literature it is known that sulphur dioxide upon interaction with titania leads
to physisorption and chemisorption affording sulphur trioxide and sulphate exhibiting
binding energes from 164 to 169 eV.171 We therefore assigne the peak at 167.1 eV (A)
to adsorbed SO2, the peak at 168.5 eV (B) to adsorbed sulphur trioxide and the peak at
169.7 eV (C) to sulphate. Since the deactivated P25 powder was washed with
dichloromethane, the absence of an SO2 signal in Fig. 4.14b becomes understandable.
The higher intensity of the B component in Fig. 4.14a suggests that the SO3-like
species is the most probable surface intermediate in the SO2 adsorption process.

4.C-H Activation through Catalytic Photosulfoxidation of Alkanes
101
4.2.7 PEMF Results
4.2.7.1 PEMF Basics
To understand the deactivation process and in which extent the adsorbed species
on the deactivated titania influence the electron transfer, we performed photo-
electromotive force (PEMF) experiments. This technique provides informations about
the natural behaviour of photogenerated electron-hole pairs, since the measurements
are carried out without a contact electrode and without any external electric field and
therefore charge carrier concentration gradients and/or internal space charges are the
sole driving forces for PEMF generation.178 PEMF is sensitive to all factors
influencing the mobility of the charge carriers, like traps or structural changes. Fig.
4.15 depicts the principle of PEMF measurements.
Figure 4.15: Principle of PEMF measurement for an n-type semiconductor. (1) transparent NESA glass electrode, (2) insulating foils, (3) sample, (4) metal electrode.(Taken from ref..178)
Consider a single crystal illuminated from one side. Charge separation occurs and
the light intensity decreases exponentially with the penetration distance into the crystal
according to the Lambert-Beer law.

4.C-H Activation through Catalytic Photosulfoxidation of Alkanes
102
A (λ) = log I0 / I = ε (λ) c d (4.20)
where A(λ) is the absorbance, I0 the incident light intensity, I the light intensity at the
exit of the crystal, ε(λ) the absorption coefficient and d the path length.
The gradient of light absorption creates a charge carrier concentration gradient
which is the driving force of the charge carrier diffusion into the bulk. If electron and
holes have different mobilities, a spatial charge separation takes place and an internal
electric field between the illuminated and the dark side of the sample arises. This field
can be measured as an electric potential difference, the so called Dember potential or
photo-electromotive force. The same effect is observed if the single crystal is replaced
by a polymer film containing a semiconductor fine powder.
The maximum Dember potential179 can be expressed as
where kb is the Boltzmann constant, T the absolute temperature, e the charge of
electron, μh and μe the mobility of holes and electrons, respectively. Eq. 4.21 is valid
only for life times of the charge carriers longer than the light pulse and a high light
intensity is required to fill all the traps with charge carrriers. Therefore a laser is used
for flash illumination.
The most important kinetic parameters in the PEMF measurements are the
following:
• Sign of the signal: in an n-type semiconductor the electrons are more mobile
than the holes hence they will induce a positive charge on the dark electrode
leading to a positive voltage. Analogously, in a p-type semiconductor the
Umax (λ) = kb T
e
μe - μh
μe + μh
ε(λ) d (4.21)
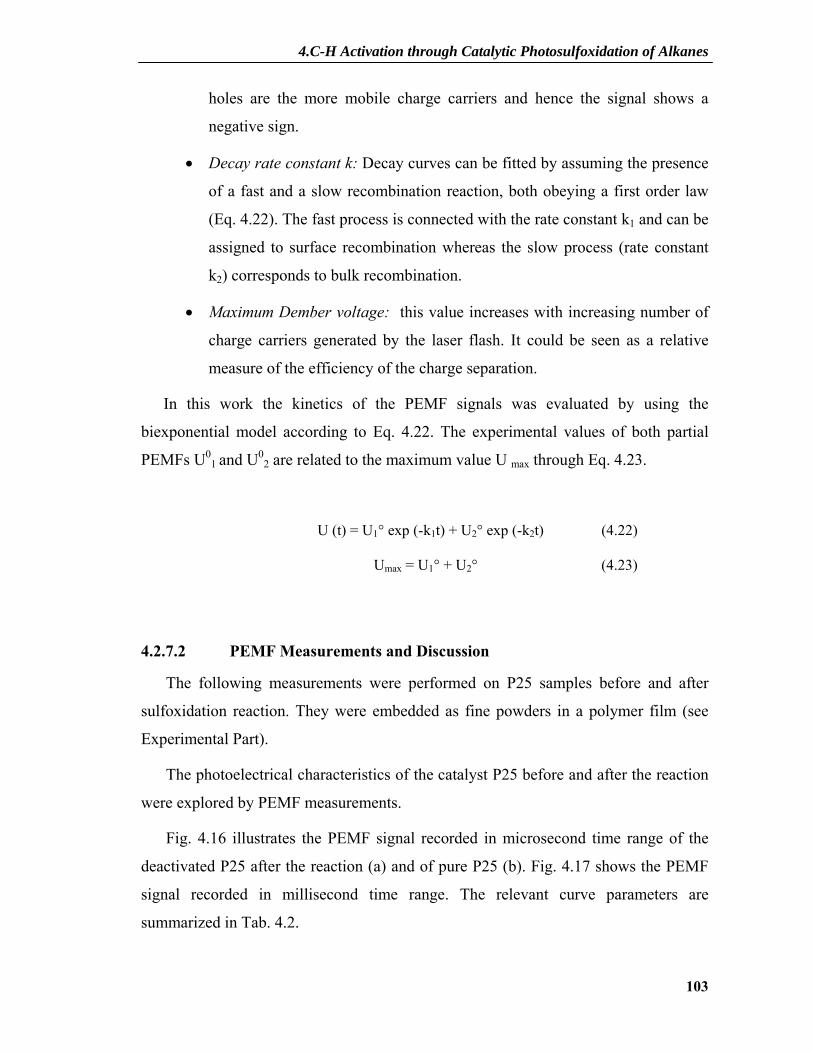
4.C-H Activation through Catalytic Photosulfoxidation of Alkanes
103
holes are the more mobile charge carriers and hence the signal shows a
negative sign.
• Decay rate constant k: Decay curves can be fitted by assuming the presence
of a fast and a slow recombination reaction, both obeying a first order law
(Eq. 4.22). The fast process is connected with the rate constant k1 and can be
assigned to surface recombination whereas the slow process (rate constant
k2) corresponds to bulk recombination.
• Maximum Dember voltage: this value increases with increasing number of
charge carriers generated by the laser flash. It could be seen as a relative
measure of the efficiency of the charge separation.
In this work the kinetics of the PEMF signals was evaluated by using the
biexponential model according to Eq. 4.22. The experimental values of both partial
PEMFs U01 and U0
2 are related to the maximum value U max through Eq. 4.23.
U (t) = U1° exp (-k1t) + U2° exp (-k2t) (4.22)
Umax = U1° + U2° (4.23)
4.2.7.2 PEMF Measurements and Discussion
The following measurements were performed on P25 samples before and after
sulfoxidation reaction. They were embedded as fine powders in a polymer film (see
Experimental Part).
The photoelectrical characteristics of the catalyst P25 before and after the reaction
were explored by PEMF measurements.
Fig. 4.16 illustrates the PEMF signal recorded in microsecond time range of the
deactivated P25 after the reaction (a) and of pure P25 (b). Fig. 4.17 shows the PEMF
signal recorded in millisecond time range. The relevant curve parameters are
summarized in Tab. 4.2.
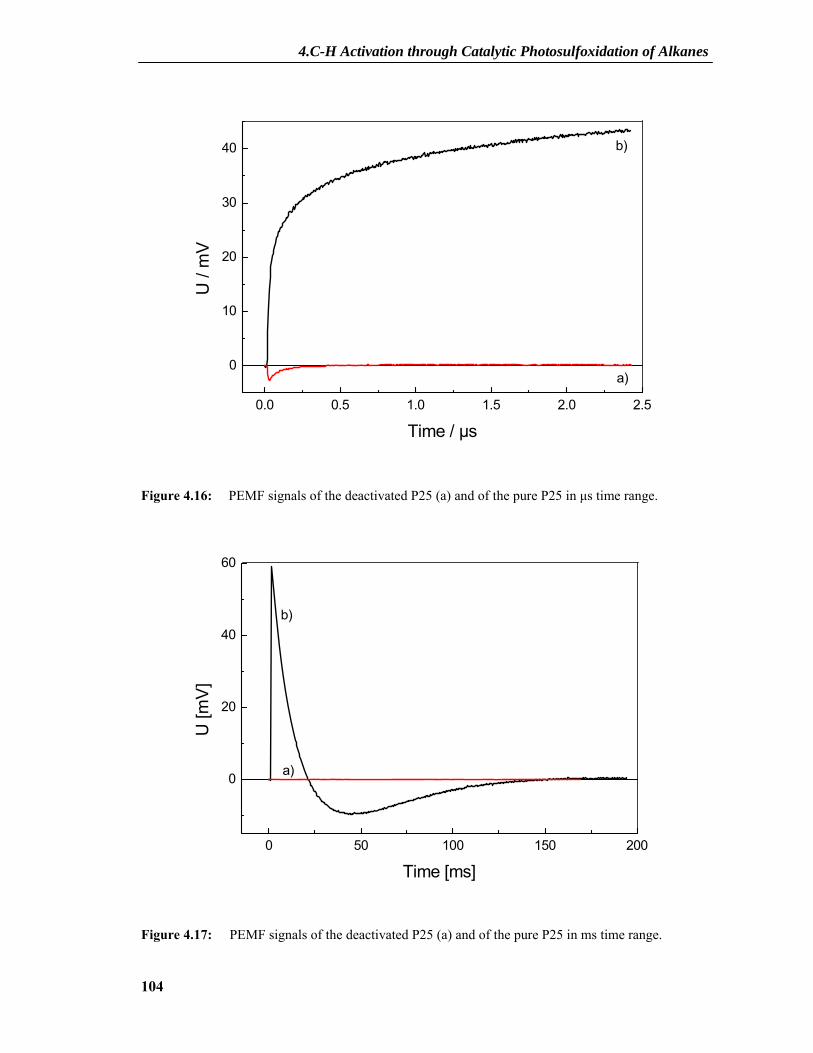
4.C-H Activation through Catalytic Photosulfoxidation of Alkanes
104
0.0 0.5 1.0 1.5 2.0 2.5
0
10
20
30
40
U /
mV
Time / µs
a)
b)
Figure 4.16: PEMF signals of the deactivated P25 (a) and of the pure P25 in μs time range.
0 50 100 150 200
0
20
40
60
U [m
V]
Time [ms]
a)
b)
Figure 4.17: PEMF signals of the deactivated P25 (a) and of the pure P25 in ms time range.
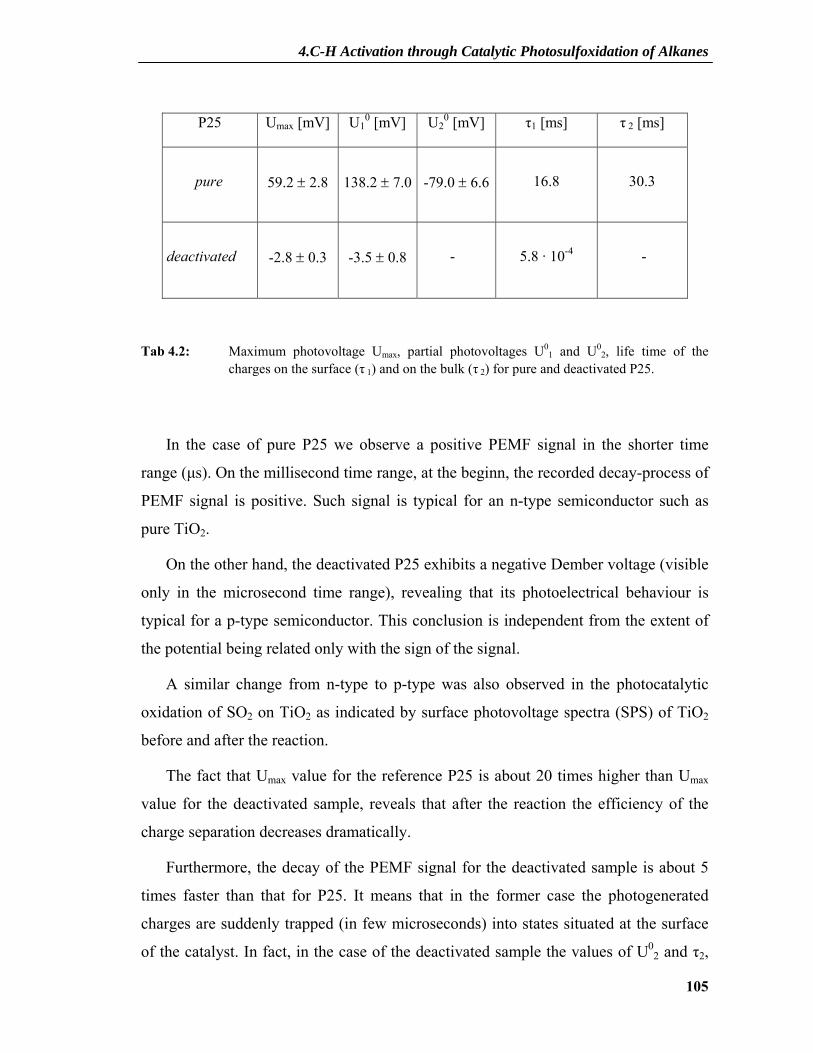
4.C-H Activation through Catalytic Photosulfoxidation of Alkanes
105
Tab 4.2: Maximum photovoltage Umax, partial photovoltages U01 and U0
2, life time of the charges on the surface (τ 1) and on the bulk (τ 2) for pure and deactivated P25.
In the case of pure P25 we observe a positive PEMF signal in the shorter time
range (μs). On the millisecond time range, at the beginn, the recorded decay-process of
PEMF signal is positive. Such signal is typical for an n-type semiconductor such as
pure TiO2.
On the other hand, the deactivated P25 exhibits a negative Dember voltage (visible
only in the microsecond time range), revealing that its photoelectrical behaviour is
typical for a p-type semiconductor. This conclusion is independent from the extent of
the potential being related only with the sign of the signal.
A similar change from n-type to p-type was also observed in the photocatalytic
oxidation of SO2 on TiO2 as indicated by surface photovoltage spectra (SPS) of TiO2
before and after the reaction.
The fact that Umax value for the reference P25 is about 20 times higher than Umax
value for the deactivated sample, reveals that after the reaction the efficiency of the
charge separation decreases dramatically.
Furthermore, the decay of the PEMF signal for the deactivated sample is about 5
times faster than that for P25. It means that in the former case the photogenerated
charges are suddenly trapped (in few microseconds) into states situated at the surface
of the catalyst. In fact, in the case of the deactivated sample the values of U02 and τ2,
P25 Umax [mV] U10 [mV] U2
0 [mV] τ1 [ms] τ 2 [ms]
pure
59.2 ± 2.8
138.2 ± 7.0
-79.0 ± 6.6
16.8
30.3
deactivated
-2.8 ± 0.3
-3.5 ± 0.8
-
5.8 · 10-4
-
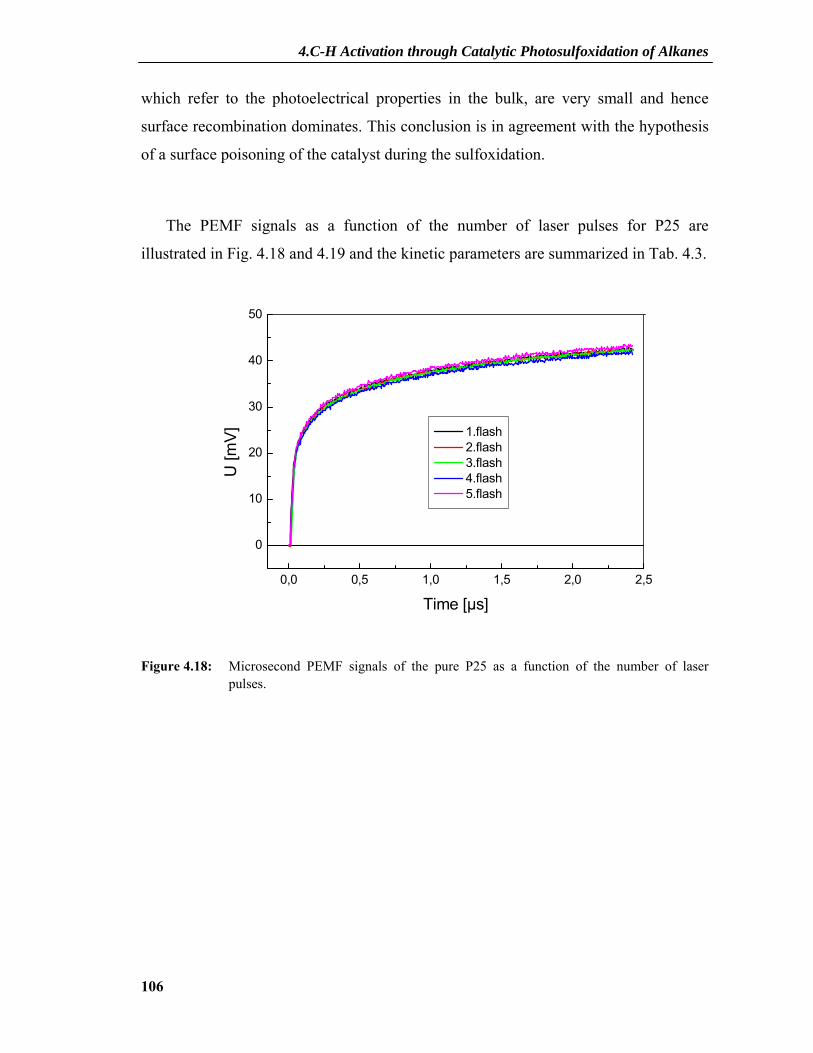
4.C-H Activation through Catalytic Photosulfoxidation of Alkanes
106
which refer to the photoelectrical properties in the bulk, are very small and hence
surface recombination dominates. This conclusion is in agreement with the hypothesis
of a surface poisoning of the catalyst during the sulfoxidation.
The PEMF signals as a function of the number of laser pulses for P25 are
illustrated in Fig. 4.18 and 4.19 and the kinetic parameters are summarized in Tab. 4.3.
0,0 0,5 1,0 1,5 2,0 2,5
0
10
20
30
40
50
1.flash 2.flash 3.flash 4.flash 5.flash
U [m
V]
Time [µs]
Figure 4.18: Microsecond PEMF signals of the pure P25 as a function of the number of laser pulses.
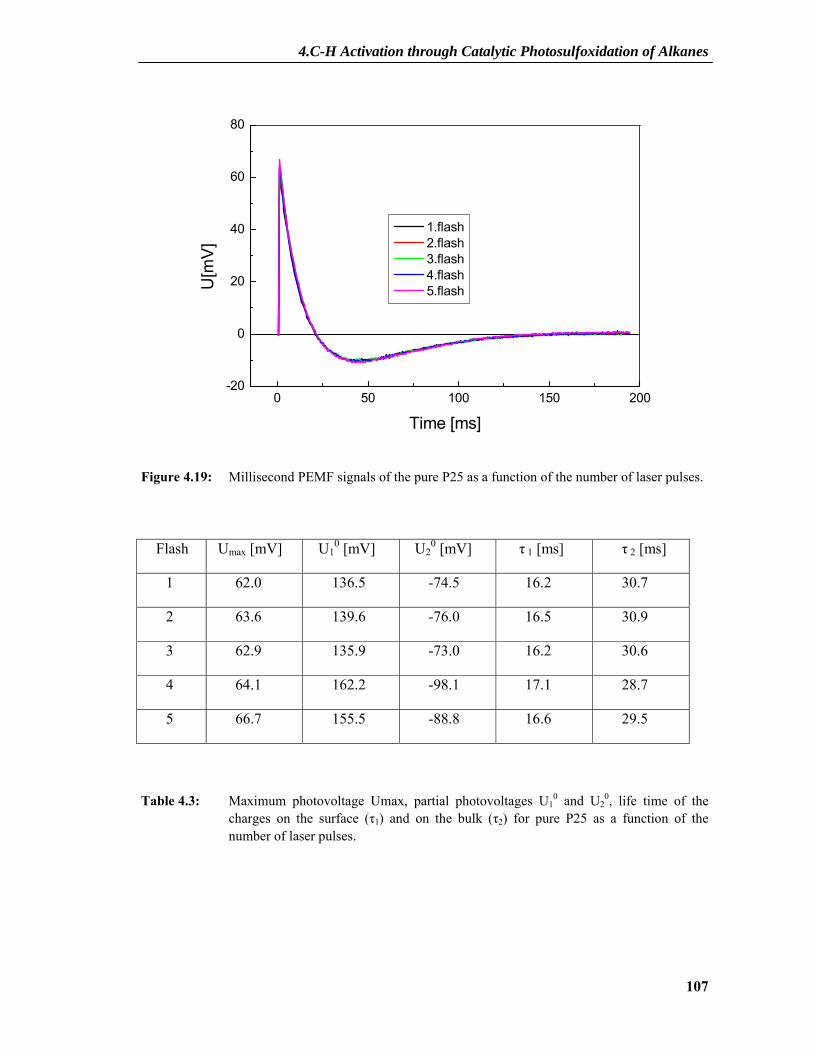
4.C-H Activation through Catalytic Photosulfoxidation of Alkanes
107
0 50 100 150 200-20
0
20
40
60
80
1.flash 2.flash 3.flash 4.flash 5.flashU
[mV]
Time [ms]
Figure 4.19: Millisecond PEMF signals of the pure P25 as a function of the number of laser pulses.
Table 4.3: Maximum photovoltage Umax, partial photovoltages U10 and U2
0, life time of the charges on the surface (τ1) and on the bulk (τ2) for pure P25 as a function of the number of laser pulses.
Flash Umax [mV] U10 [mV] U2
0 [mV] τ 1 [ms] τ 2 [ms]
1 62.0 136.5 -74.5 16.2 30.7
2 63.6 139.6 -76.0 16.5 30.9
3 62.9 135.9 -73.0 16.2 30.6
4 64.1 162.2 -98.1 17.1 28.7
5 66.7 155.5 -88.8 16.6 29.5
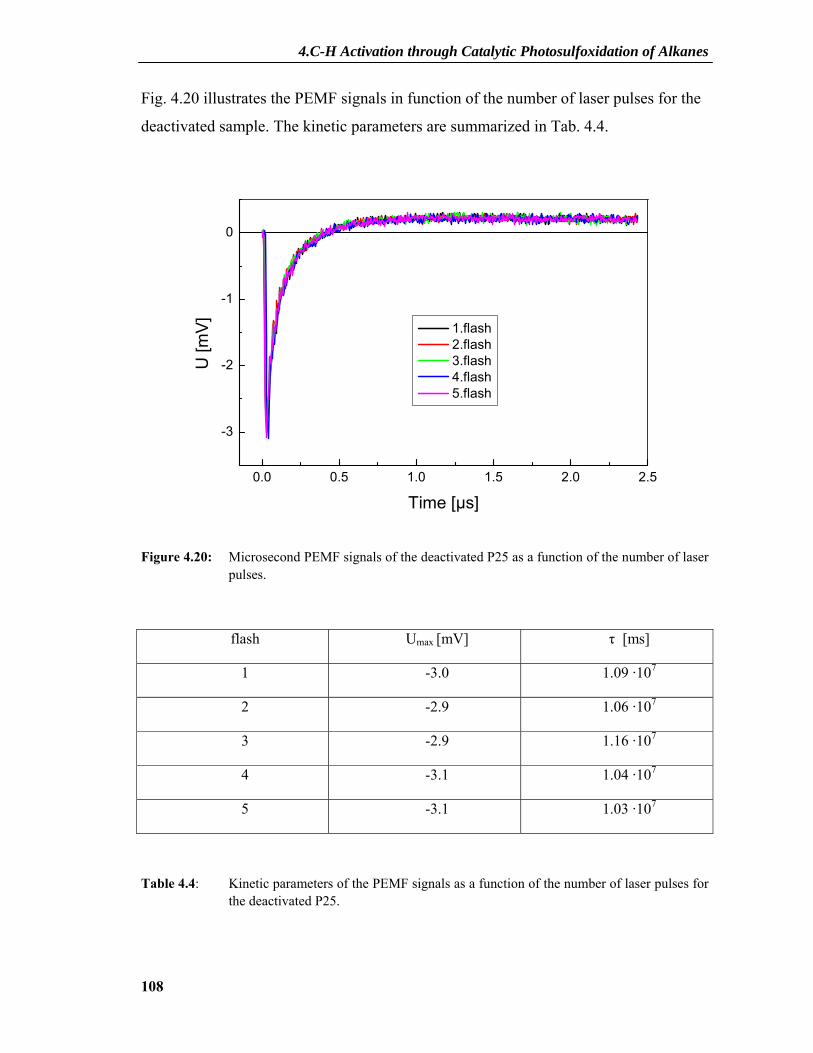
4.C-H Activation through Catalytic Photosulfoxidation of Alkanes
108
Fig. 4.20 illustrates the PEMF signals in function of the number of laser pulses for the
deactivated sample. The kinetic parameters are summarized in Tab. 4.4.
0.0 0.5 1.0 1.5 2.0 2.5
-3
-2
-1
0
1.flash 2.flash 3.flash 4.flash 5.flash
U [m
V]
Time [µs]
Figure 4.20: Microsecond PEMF signals of the deactivated P25 as a function of the number of laser
pulses.
Table 4.4: Kinetic parameters of the PEMF signals as a function of the number of laser pulses for the deactivated P25.
flash Umax [mV] τ [ms]
1 -3.0 1.09 ·107
2 -2.9 1.06 ·107
3 -2.9 1.16 ·107
4 -3.1 1.04 ·107
5 -3.1 1.03 ·107
4.C-H Activation through Catalytic Photosulfoxidation of Alkanes
109
We did not observe neither for the reference nor for the deactivated P25 a PEMF
signal change with the number of laser flashes in the μs and in the ms time range. It
means that also for the deactivated sample in 120 seconds (time between two
consecutive flashes) there are no charge effects, suggesting that the energy traps are
not extremely deep.
In conclusion, during the photocatalytic sulfoxidation P25 changes its
photoelectrical behaviour from n-type to p-type and the charge carrier lifetime
decreases from 16.8 to 5.8 · 10-4 ms.
According to the XPS and PEMF results we attribute the type change to the
presence of oxidized sulphur compounds (mainly SO3) strongly adsorbed on the
surface. Being in a high oxidation state, they can act as efficient electron traps making
the holes the majority charge carriers and titania achieves a p-type character.
To sum up, the chemical deactivation process is due mainly to strong preferential
product adsorption on the TiO2 surface, so that further reagent adsorption is hindered:
in addition, the change from n- to p-type may decrease the efficiency of IFET
reactions.

4.C-H Activation through Catalytic Photosulfoxidation of Alkanes
110
4.2.8 Reaction Mechanism
Fig. 4.21 summarizes absorption spectra of P25 and SO2 dissolved in n-heptane
(saturated solution). From this and the experimental fact that photosulfoxidation is
initiated by visible light (λ ≥ 400 nm) one must conclude that a previously unknown
species must be responsible for the observed reaction.
300 400 500
0
2
4
Abs
orba
nce
/ a.u
.
λ / nm
a
b
Figure 4.21: Absorption spectra of P25 (a) and SO2 dissolved in n-heptane (saturated solution) (b).
Since only the modified titania powders (Table 1, entries 5-7) are able to absorb
visible light, it seemed likely that the unmodified materials may form a charge-transfer
complex with sulfur dioxide. As depicted in Fig. 4.22, visible light excitation of the
charge-transfer complex affords a conduction band electron [TiO2(e−)] and an
adsorbed sulfur dioxide radical cation. Oxygen reduction by [TiO2(e−)] produces
superoxide whereas the adsorbed sulfur radical cation may oxidize the alkane to the
alkyl radical and a proton (see Paragraph 2.3). Superoxide may also generate an alkyl
radical through protonation by adsorbed water or surface OH groups to the
hydroperoxyl radical103 and subsequent hydrogen abstraction from the alkane.

4.C-H Activation through Catalytic Photosulfoxidation of Alkanes
111
Figure 4.22: Mechanistic scheme of the visible light photosulfoxidation.
The alkyl radical thus produced is expected to initiate a radical chain reaction as
formulated for the stoichiometric UV-photosulfoxidation (Fig. 4.2).
Accordingly, experiments of flatband potential determination of P25 with visible
light (λ ≥ 400 nm) failed due to the absence of light absorption of titania
In summary, this novel visible light induced C-H activation can be classified as a
photocatalysis type B reaction, extending the previously known two-substrate addition [20] to the present three-substrate addition scheme A + B + C = D.
Many blank tests were performed:
• In the absence of TiO2 or using SiO2 instead of TiO2, only traces of product
could be detected.
• In the absence of SO2 no product formation was observed.
• In the absence of O2 (degassing by freeze-thaw cycles) only traces of
product were detected.
• In the dark or with irradiation at λ ≥ 455 nm the reaction does not proceed.
[TiO2(e-)---SO2+·]
[TiO2---SO2]
O2
RH RH
R· R· + H+
Vis
4.C-H Activation through Catalytic Photosulfoxidation of Alkanes
112
4.2.8.1 Evidences of Radical Chain Reaction
As discussed in the introduction the UV induced photosulfoxidation is a radical
chain reaction. Since the mechanism proposed for the present visible light induced
reaction (Fig. 4.22) generates also an alkyl starter radicalthe following experiments
were performed.
• Isopropanol
Complete inhibition was observed in the presence of only 10 vol% of isopropanol,
which should be much faster oxidized than the alkane and which is also an efficient
OH radical scavenger (the reaction rate of isopropanol with OH radical is extimated
1.9 · 109 M-1 s-1).180
• Sulfur hexafluoride
Sulfur hexafluoride181,182 is known to be one of the most inert inorganic
molecules. Its high electron affinity, however, has rendered it an extremlely valuable
specific electron scavenger. Nevertheless, its use as electron scavenger in aqueous
solution has been limited from its low solubility in water and from the fact that OH
radicals are also involved in its reaction path.
SF6 in water reacts with an electron with a rate constant of 1.65 · 1010 M-1 s-1
SF6 + e- → ·SF5 + F- (4.24)
The SF5 radical formed oxidizes water to an OH radical (with a lower reaction
rate of 6.3 · 103 M-1 s-1) giving also sulfur tetrafluoride and fluoride.
·SF5 + 2H2O → ·OH + F- + H3O+ + SF4 (4.25)

4.C-H Activation through Catalytic Photosulfoxidation of Alkanes
113
The sulfur tetrafluoride then is hydrolyzed according to
SF4 + 9H2O → SO32- + 4F- + 6H3O+ (4.26)
and SO32- is subsequently oxidized to SO4
2- by species such as ·OH, ·SF5 , H2O2,
so that the general equation can be written as
SF6 + e- 6F- + SO42- + 7H3O+ (4.27)
In our system the amount of water is negligible and the solubility of SF6 in n-
heptane is obviously higher than in water, SF6 being an apolar molecule. These
considerations justified the use of SF6 as electron scavenger in our system.
Adding 35 ml of gaseous SF6 at 1 atm into the reactor strongly inhibited the
reaction. SF6 competes with oxygen as electron scavenger, hindering the reductive
path of the process.
• Dimerization and dehydrogenation products
A mutual formation of dimerization and dehydrogenation products in the
sulfoxidation of cyclohexane was investigated through mass spectroscopy analysis.
In Fig. 4.23 we can observe the signals at m/z 165 and 81 attributed to the
fragments formed by cleavage of cyclohexylcyclohexane and cyclohexene,
respectively. These compounds must be produced if the reaction mechanism proceeds
through alkyl radical formation.
H2O, ·OH
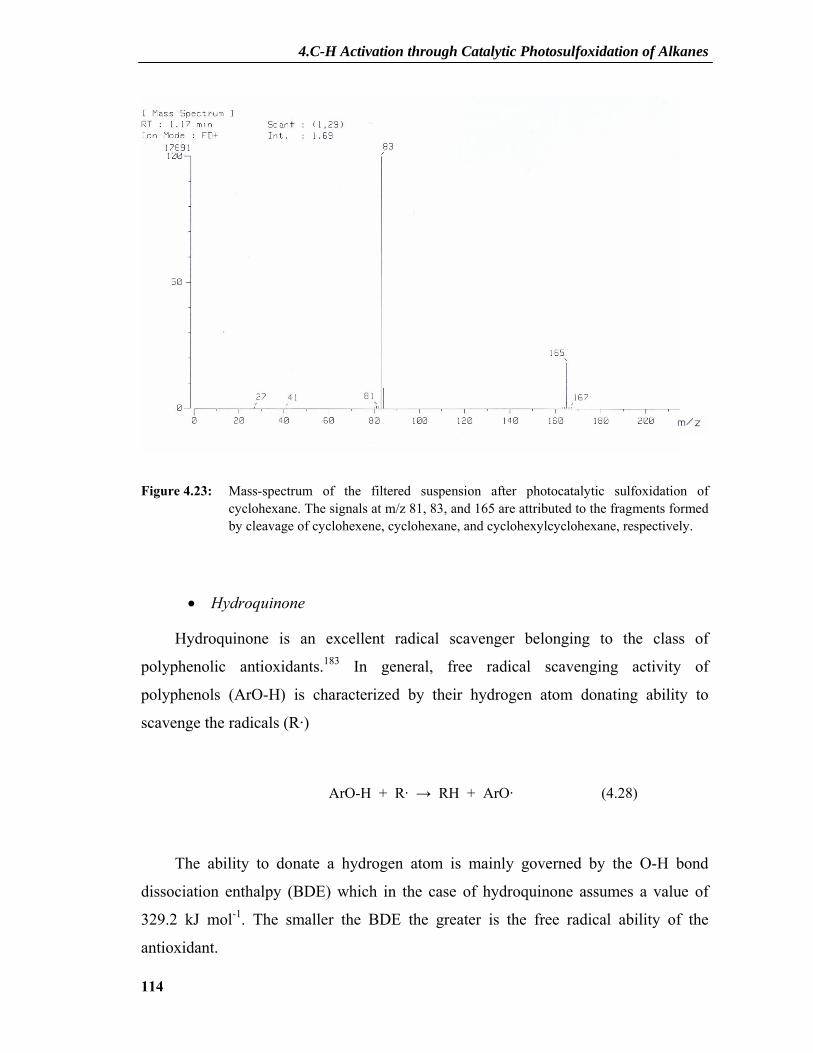
4.C-H Activation through Catalytic Photosulfoxidation of Alkanes
114
Figure 4.23: Mass-spectrum of the filtered suspension after photocatalytic sulfoxidation of cyclohexane. The signals at m/z 81, 83, and 165 are attributed to the fragments formed by cleavage of cyclohexene, cyclohexane, and cyclohexylcyclohexane, respectively.
• Hydroquinone
Hydroquinone is an excellent radical scavenger belonging to the class of
polyphenolic antioxidants.183 In general, free radical scavenging activity of
polyphenols (ArO-H) is characterized by their hydrogen atom donating ability to
scavenge the radicals (R·)
ArO-H + R· → RH + ArO· (4.28)
The ability to donate a hydrogen atom is mainly governed by the O-H bond
dissociation enthalpy (BDE) which in the case of hydroquinone assumes a value of
329.2 kJ mol-1. The smaller the BDE the greater is the free radical ability of the
antioxidant.
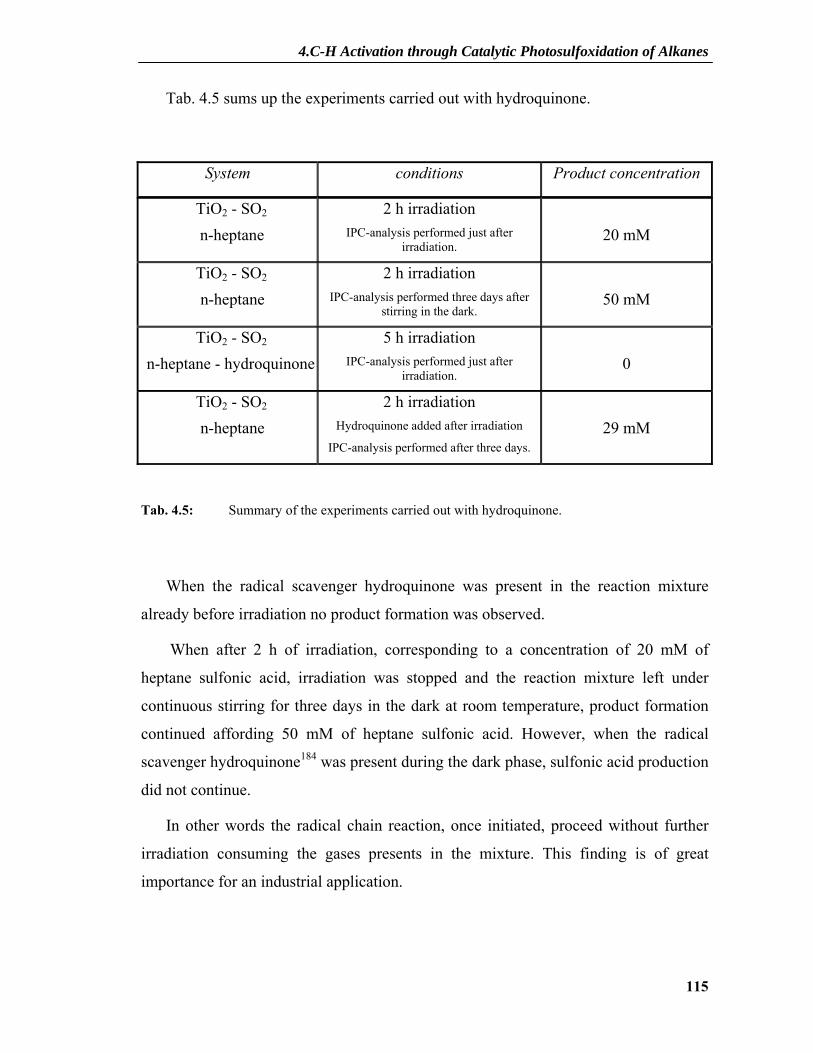
4.C-H Activation through Catalytic Photosulfoxidation of Alkanes
115
Tab. 4.5 sums up the experiments carried out with hydroquinone.
Tab. 4.5: Summary of the experiments carried out with hydroquinone.
When the radical scavenger hydroquinone was present in the reaction mixture
already before irradiation no product formation was observed.
When after 2 h of irradiation, corresponding to a concentration of 20 mM of
heptane sulfonic acid, irradiation was stopped and the reaction mixture left under
continuous stirring for three days in the dark at room temperature, product formation
continued affording 50 mM of heptane sulfonic acid. However, when the radical
scavenger hydroquinone184 was present during the dark phase, sulfonic acid production
did not continue.
In other words the radical chain reaction, once initiated, proceed without further
irradiation consuming the gases presents in the mixture. This finding is of great
importance for an industrial application.
System conditions Product concentration
TiO2 - SO2 n-heptane
2 h irradiation IPC-analysis performed just after
irradiation.
20 mM
TiO2 - SO2 n-heptane
2 h irradiation IPC-analysis performed three days after
stirring in the dark.
50 mM
TiO2 - SO2 n-heptane - hydroquinone
5 h irradiation IPC-analysis performed just after
irradiation.
0
TiO2 - SO2 n-heptane
2 h irradiation Hydroquinone added after irradiation
IPC-analysis performed after three days.
29 mM

4.C-H Activation through Catalytic Photosulfoxidation of Alkanes
116
• OH radicals scavenging
A well known method to provide evidence of OH radical formation exploits the
selective oxidation of benzoic acid to salycilic acid through OH radicals.
Detection of salycilic acid can be easily carried out by fluorescence spectroscopy.
Unfortunately attempts of providing evidences of OH radical formation failed,
perhaps because of the multiphase complexity of the system. A signal at 420 nm could
be detected in the fluorescence spectra of the filtered reaction mixture, but from the
absence of a band at 360 nm one must conclude that the emission spectrum is not
generated from salycilic acid.
Figure 4.24: Fluorescence spectra of the filtered reaction mixture after 0, 1 and 2 hours. It is also showed a fluorescence spectrum of a solution of salicylic acid in n-heptane.
COOH COOH
OH
OH· (4.29)
350 400 450 500 5500
102030405060708090
100110
Inte
nsity
/ a.
u.
W avelength / nm
0h
1h
2h
salicylic acid in n-heptane

4.C-H Activation through Catalytic Photosulfoxidation of Alkanes
117
Although no traces of salycilic acid can be detected with this method, the presence
of OH radicals during the reaction cannot be excluded.
4.2.8.2 Evidence for Formation of a TiO2-SO2 CT Complex
Since P25, n-heptane and SO2 are not able to absorb visible light, it seemed likely
that sulfur dioxide may form a charge transfer complex with the titania surface.
In the following we provide some evidence for this hypothesis.
• Color test
Exposure of P25 to sulfur dioxide resulted in a yellowish coloration of the
powder. This color change implies that the system TiO2-SO2 is able to absorb visible
light although, in contrast to titania and SO2.
The same coloration was observed when small quantities of n-heptane were
present. The effect became even more noticeable when some drops of acetonitrile were
added. In fact, the presence of a polar solvent should stabilize the charge-transfer
complex.
• DRS spectra
In Fig. 4.25 are summarized the Kubelka-Munk functions of P25 (a) and of a
sample of P25 previously treated with SO2 (b).
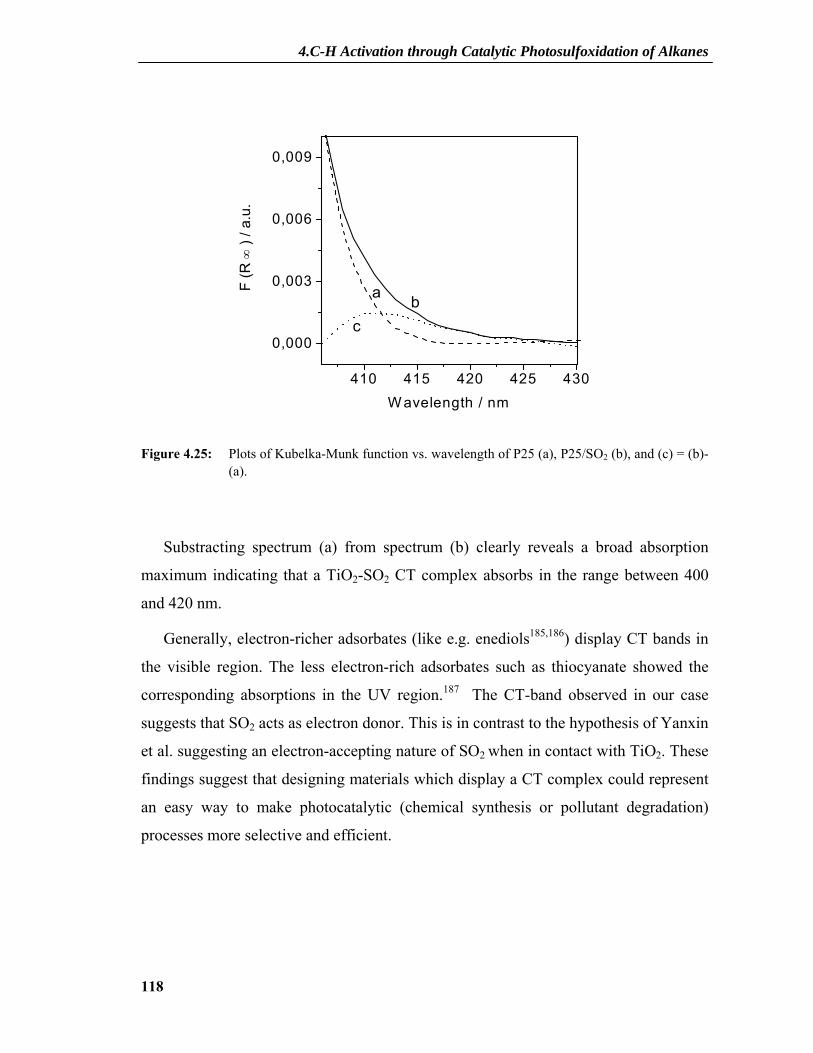
4.C-H Activation through Catalytic Photosulfoxidation of Alkanes
118
Figure 4.25: Plots of Kubelka-Munk function vs. wavelength of P25 (a), P25/SO2 (b), and (c) = (b)- (a).
Substracting spectrum (a) from spectrum (b) clearly reveals a broad absorption
maximum indicating that a TiO2-SO2 CT complex absorbs in the range between 400
and 420 nm.
Generally, electron-richer adsorbates (like e.g. enediols185,186) display CT bands in
the visible region. The less electron-rich adsorbates such as thiocyanate showed the
corresponding absorptions in the UV region.187 The CT-band observed in our case
suggests that SO2 acts as electron donor. This is in contrast to the hypothesis of Yanxin
et al. suggesting an electron-accepting nature of SO2 when in contact with TiO2. These
findings suggest that designing materials which display a CT complex could represent
an easy way to make photocatalytic (chemical synthesis or pollutant degradation)
processes more selective and efficient.
410 415 420 425 430
0,000
0,003
0,006
0,009
F (R
∞ )
/ a.u
.
W avelength / nm
c
a b
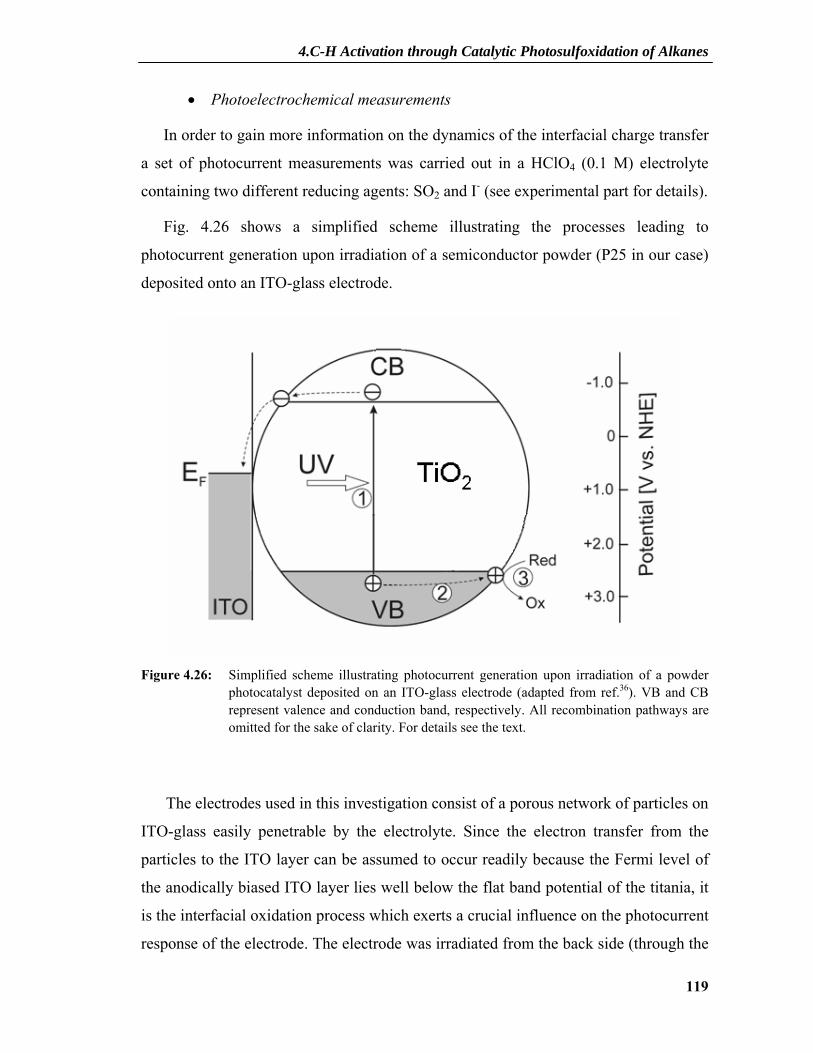
4.C-H Activation through Catalytic Photosulfoxidation of Alkanes
119
• Photoelectrochemical measurements
In order to gain more information on the dynamics of the interfacial charge transfer
a set of photocurrent measurements was carried out in a HClO4 (0.1 M) electrolyte
containing two different reducing agents: SO2 and I- (see experimental part for details).
Fig. 4.26 shows a simplified scheme illustrating the processes leading to
photocurrent generation upon irradiation of a semiconductor powder (P25 in our case)
deposited onto an ITO-glass electrode.
Figure 4.26: Simplified scheme illustrating photocurrent generation upon irradiation of a powder
photocatalyst deposited on an ITO-glass electrode (adapted from ref.36). VB and CB represent valence and conduction band, respectively. All recombination pathways are omitted for the sake of clarity. For details see the text.
The electrodes used in this investigation consist of a porous network of particles on
ITO-glass easily penetrable by the electrolyte. Since the electron transfer from the
particles to the ITO layer can be assumed to occur readily because the Fermi level of
the anodically biased ITO layer lies well below the flat band potential of the titania, it
is the interfacial oxidation process which exerts a crucial influence on the photocurrent
response of the electrode. The electrode was irradiated from the back side (through the

4.C-H Activation through Catalytic Photosulfoxidation of Alkanes
120
ITO glass) with intermittent light at wavelength varying between 0 and 700 nm. UV
excitation affords an electron-hole pair (1). The electron should be easily transported
to the ITO glass support. The hole can either recombine directly with a conduction
band electron (primary recombination) or relax to an energy level lying close to the
valence band edge (2). From there it can again either recombine (secondary
recombination) or react with a reducing agent present in the electrolyte (3), whereby
only in the latter case a net photocurrent is observable. When no additional reducing
agent is added, the hole is supposed to oxidize water to oxygen. The photocurrent thus
observed, originates from oxidation processes at the contact surface between working-
electrode and electrolyte is called anodic photocurrent.
Fig. 4.27a shows the photocurrent action spectra of P25 in HClO4 1M solution
with (dashed line) and without (solid line) SO2 as reducing agent. The spectra in Fig.
4.27b were found analogously in LiClO4 1M with iodide as reducing agent.
320 340 360 380 400 420 4400
100
200
300
400
500
Cur
rent
den
sity
/ μA
cm-2
Wavelenght / nm
(a)

4.C-H Activation through Catalytic Photosulfoxidation of Alkanes
121
320 340 360 380 400 420 4400
100
200
300
400
500
Cur
rent
den
sity
/ μA
cm
-2
Wavelenght / nm
(b)
Figure 4.27: Photocurrent measured under intermittent irradiation (5s light, 5s dark) as a function of irradiation wavelength. (a): P25 coated electrode in HClO4 1M solution with (dashed line) and without (solid line) SO2 as reducing agent. (b) P25 coated electrode in LiClO4 1M solution with (dashed line) and without (solid line) iodide as reducing agent.
For TiO2 a typical behavior is observed with anodic photocurrent disappearing at
wavelength above 400 nm, the edge of the light absorption for titania.
The addition of a reducing agent increases the photocurrent. In fact, the reacting
holes can escape recombination more easily since the oxidation of iodide or of SO2 is
thermodynamically more favorable than water oxidation which is a very slow reaction
and requires a potential of about 2.0 V vs. NHE at pH 7. Thus, in absence of I- or SO2,
the photogenerated holes preferentially undergo fast recombination. This is also
evident observing the clearly different photocurrent transients in absence and presence
of added reducing agents. In the former case, after the initial rise of photocurrent
immediately after switching on the light, a rapid exponential decay is observed. Such a
shape of photocurrent transient is a typical fingerprint of surface recombination
processes.
The intensity of the photocurrent signal is obviously proportional to the number of
electrons injected into the ITO glass. A ratio between the intensity of this signal in the
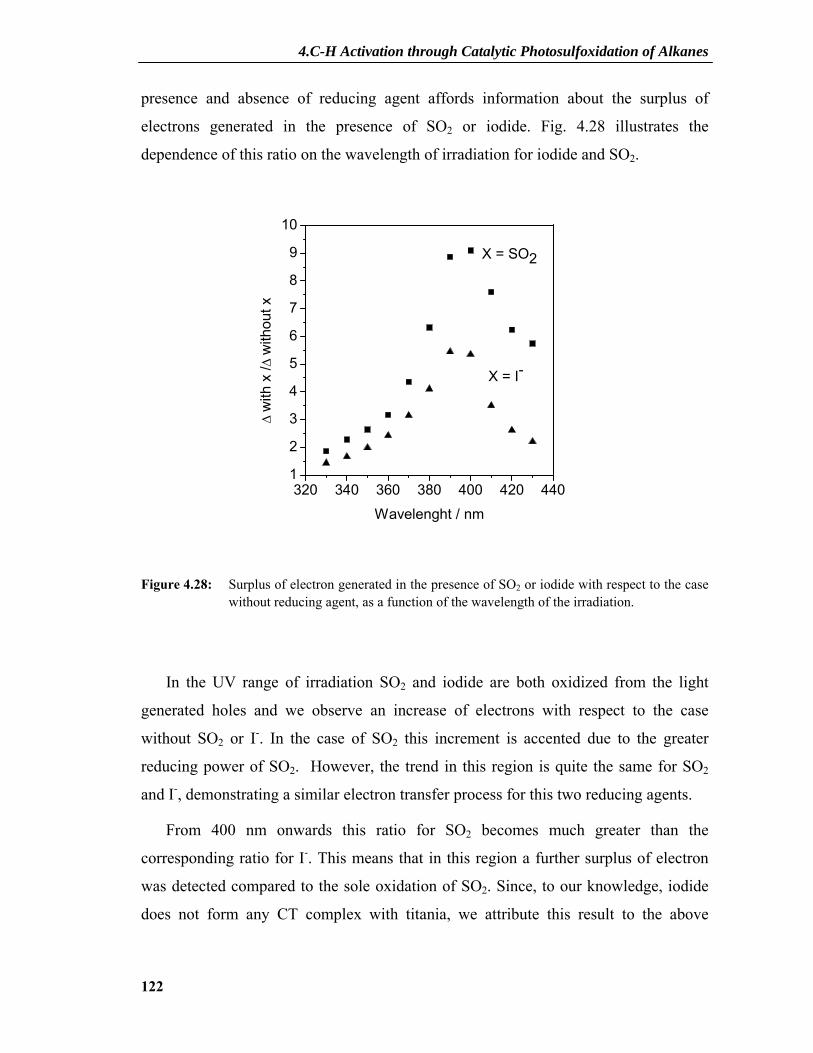
4.C-H Activation through Catalytic Photosulfoxidation of Alkanes
122
presence and absence of reducing agent affords information about the surplus of
electrons generated in the presence of SO2 or iodide. Fig. 4.28 illustrates the
dependence of this ratio on the wavelength of irradiation for iodide and SO2.
Figure 4.28: Surplus of electron generated in the presence of SO2 or iodide with respect to the case without reducing agent, as a function of the wavelength of the irradiation.
In the UV range of irradiation SO2 and iodide are both oxidized from the light
generated holes and we observe an increase of electrons with respect to the case
without SO2 or I-. In the case of SO2 this increment is accented due to the greater
reducing power of SO2. However, the trend in this region is quite the same for SO2
and I-, demonstrating a similar electron transfer process for this two reducing agents.
From 400 nm onwards this ratio for SO2 becomes much greater than the
corresponding ratio for I-. This means that in this region a further surplus of electron
was detected compared to the sole oxidation of SO2. Since, to our knowledge, iodide
does not form any CT complex with titania, we attribute this result to the above
320 340 360 380 400 420 4401
2
3
4
5
6
7
8
9
10
Δ w
ith x
/Δ w
ithou
t x
Wavelenght / nm
X = SO2
X = I-
4.C-H Activation through Catalytic Photosulfoxidation of Alkanes
123
mentioned TiO2-SO2 CT complex whose visible light excitation generates additional
electrons in the conduction band.
4.2.9 Oxidation Products
With the sole exception of Takahara et al.188 who reported on the photooxidation of
cyclohexane in solutions containing hydrogen peroxide and titania particles under
visible light, photocatalytic oxidation of alkanes to the corresponding alcohols and
ketones occurs in oxygenated suspensions of TiO2 only under UV light irradiation.
However, in our system formation of oxidation products is also expected since the
visible light generated alkyl radical R· should undergo a fast reaction with oxygen.
Surprisingly, in the system cyclohexane/SO2/O2/P25 no traces of alcohol or ketone
or CO2 could be detected in the gas phase by gas chromatography. However, in the
liquid phase very small amounts of cyclohexanone and cyclohexanol were observable.
After 2 h of irradiation (λ ≥ 400 nm) about 6 x 10⁻³ mmol of sulfonic acid, 60 x 10-3
μmol of cyclohexanone and negligible quantities of cyclohexanol were produced.
These results show that the oxidation products are really minor byproducts of this
surprisingly selective alkane activation.
Why is sulfoxidation such a preferential reaction path? Why is the first step after
radical formation addition of SO2 to form RSO2· and not addition of O2 to form RO2· ?
The answer can be given by discussion of some basic kinetic aspects.
The rate constants of the reaction of alkyl radicals with SO2 and O2 in the gas
phase have been measured by Good and Thynne189. They found that the rate constant
with oxygen is about 70 time faster than with sulfur dioxide.
In our photosulfoxidation system these reactions probably occur on the titania
surface. As mentioned before SO2 forms a CT-complex with titania and therefore one
expects that its surface concentration should be much higher than that of oxygen.
Therefore, the rate of reaction with an alkyl radical should become faster as compared
to the addition reaction with O2.

4.C-H Activation through Catalytic Photosulfoxidation of Alkanes
124
4.2.10 Preparative Synthesis of Heptanesulfonic Acid Sodium Salt.
In order to demonstrate the practical aspects of this new sulfoxidation, we
performed the reaction in a 200 ml immersion lamp apparatus. Through the cooling
jacket a solution of 1 M NaNO2 was circulated as a cut-off filter to ensure irradiation
at λ ≥ 400 nm. More details about the reaction system are reported in the experimental
section.
After 5 h irradiation time and 5 days stirring in the dark it was possible to isolate
600 mg of heptane sulfonic acid sodium salt.
4.3 Results and Discussion: Reaction in Acetic Acid
In this dissertation we focused our interest on the role of the solvent choosen to
carry out the reaction. Many solvents have been tested but only acetic acid turned out
to be suitable for the sulfoxidation.
Tetrahydrofuran, methanol and butanol reacted under the given conditions and
competed with the sulfoxidation of n-heptane being more reactive molecules.
Tetrachloromethane did not show react in a blank test without alkane (other conditions
being equal) but in its presence sulfoxidation was inhibited. Probably, because of its
electron scavenging properties, it competed with oxygen inhibiting the reductive path
of the reaction.
On the other hand, blank tests without alkane showed that acetic acid was stable
under the reaction conditions and we went on to investigate possible advantages of this
solvent. Surprisingly, n-heptane photosulfoxidation proceeded without any noticeable
catalyst deactivation. The catalyst remained in suspension even after 15 hours of
irradiation and no color change of the powder was noticeable. This finding justified
further efforts for investigation of this system.
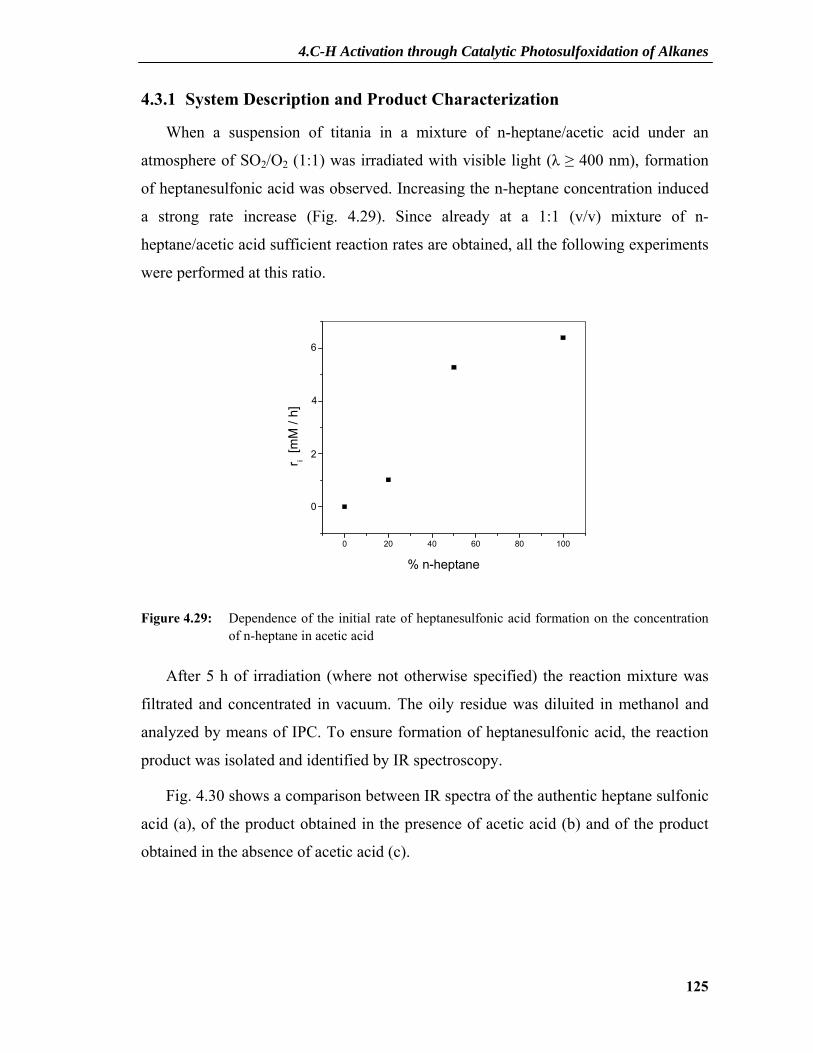
4.C-H Activation through Catalytic Photosulfoxidation of Alkanes
125
4.3.1 System Description and Product Characterization
When a suspension of titania in a mixture of n-heptane/acetic acid under an
atmosphere of SO2/O2 (1:1) was irradiated with visible light (λ ≥ 400 nm), formation
of heptanesulfonic acid was observed. Increasing the n-heptane concentration induced
a strong rate increase (Fig. 4.29). Since already at a 1:1 (v/v) mixture of n-
heptane/acetic acid sufficient reaction rates are obtained, all the following experiments
were performed at this ratio.
0 20 40 60 80 100
r i [m
M /
h]
% n-heptane
0
2
4
6
Figure 4.29: Dependence of the initial rate of heptanesulfonic acid formation on the concentration of n-heptane in acetic acid
After 5 h of irradiation (where not otherwise specified) the reaction mixture was
filtrated and concentrated in vacuum. The oily residue was diluited in methanol and
analyzed by means of IPC. To ensure formation of heptanesulfonic acid, the reaction
product was isolated and identified by IR spectroscopy.
Fig. 4.30 shows a comparison between IR spectra of the authentic heptane sulfonic
acid (a), of the product obtained in the presence of acetic acid (b) and of the product
obtained in the absence of acetic acid (c).
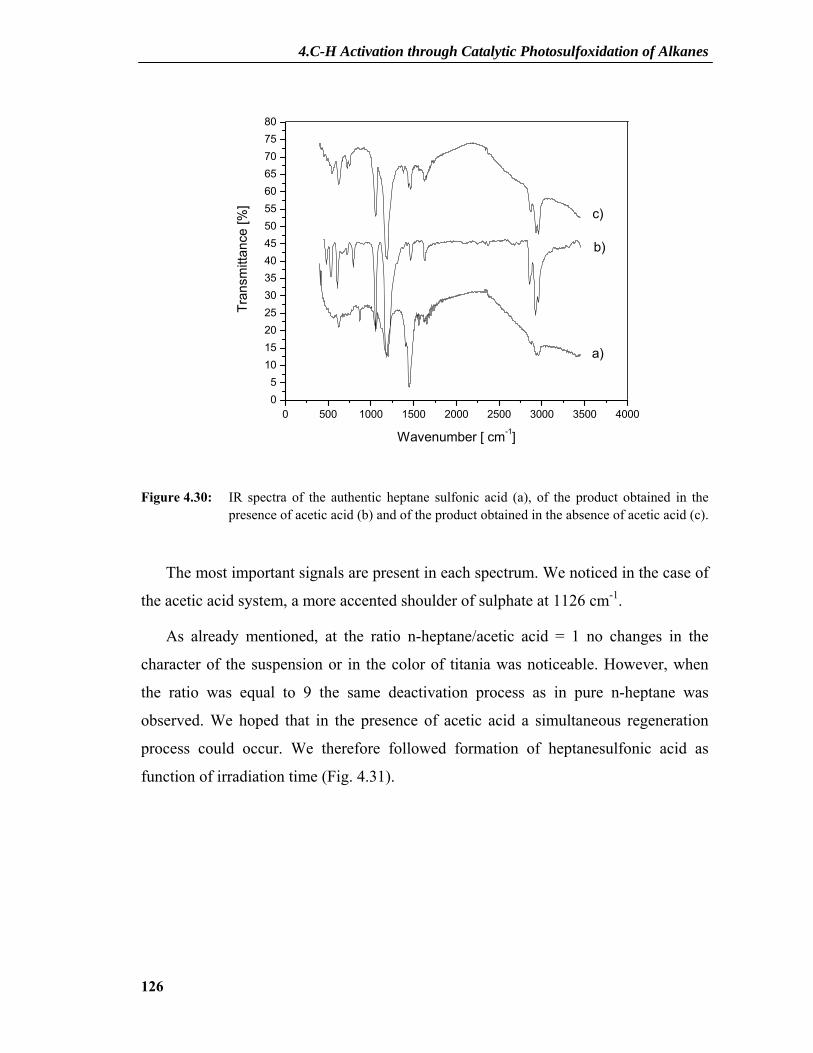
4.C-H Activation through Catalytic Photosulfoxidation of Alkanes
126
0 500 1000 1500 2000 2500 3000 3500 400005
101520253035404550556065707580
Tran
smitt
ance
[%]
Wavenumber [ cm-1]
a)
b)
c)
Figure 4.30: IR spectra of the authentic heptane sulfonic acid (a), of the product obtained in the presence of acetic acid (b) and of the product obtained in the absence of acetic acid (c).
The most important signals are present in each spectrum. We noticed in the case of
the acetic acid system, a more accented shoulder of sulphate at 1126 cm-1.
As already mentioned, at the ratio n-heptane/acetic acid = 1 no changes in the
character of the suspension or in the color of titania was noticeable. However, when
the ratio was equal to 9 the same deactivation process as in pure n-heptane was
observed. We hoped that in the presence of acetic acid a simultaneous regeneration
process could occur. We therefore followed formation of heptanesulfonic acid as
function of irradiation time (Fig. 4.31).

4.C-H Activation through Catalytic Photosulfoxidation of Alkanes
127
-2 0 2 4 6 8 10 12 14 16-505
101520253035
c (H
SA
) [m
M]
Time / h
Figure 4.31: Dependence of formation of heptanesulfonic acid (HSA) on irradiation time in acetic acid/n-heptane = 1:1 (v/v).
Surprisingly, although no visible changes were observable in the suspension, after
6 h product formation reached a plateau as in the case without acetic acid. Because of
the evidence of a still good suspension and of a white color of the powder, a strong
product adsorption cannot be given as the only explanation. Furthermore, the
hypothesis of lack of reagents (limitant reagent) during the reaction could be excluded.
The reason of this finding may be understood taking in consideration the interaction
between acetic acid and titania.
4.3.2 Acetic Acid Adsorption at TiO2
Acetic acid adsorption on TiO2 is a well known topic in literature190-194 and was
extensively studied in the solid/gas and solid/liquid regime. Photocatalytic oxidation of
acetic acid can be achieved under UV irradiation in the presence of titania. The α-
carbon leads to formation of CO2 without forming any long-lived intermediates, while
the β-carbon forms CO2 through metoxy, formaldehyde, and formate. Water is also
produced both during the degradation process and the adsorption process.194
Acetic acid adsorbs both molecularly and dissociatively as acetate on TiO2. The
latter results in titanium surface complexes containing a bidentate or monodentate
acetate ligand (structures I and II, Fig. 4.32).
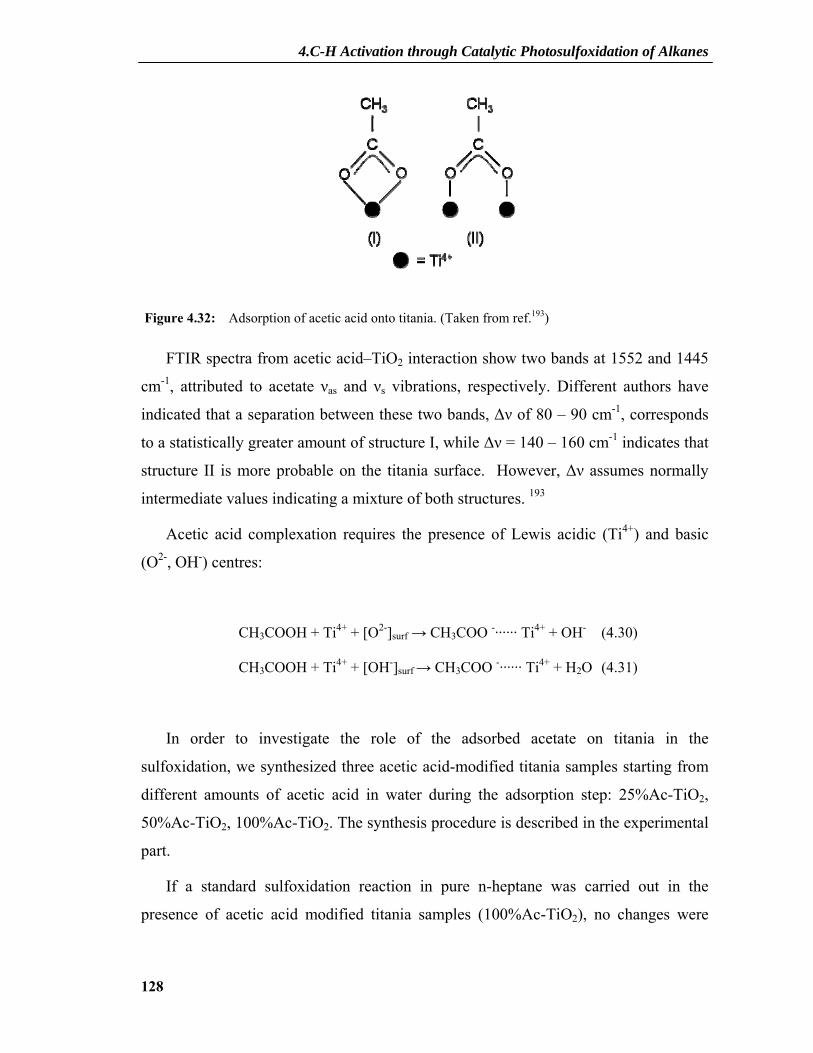
4.C-H Activation through Catalytic Photosulfoxidation of Alkanes
128
Figure 4.32: Adsorption of acetic acid onto titania. (Taken from ref.193)
FTIR spectra from acetic acid–TiO2 interaction show two bands at 1552 and 1445
cm-1, attributed to acetate νas and νs vibrations, respectively. Different authors have
indicated that a separation between these two bands, Δν of 80 – 90 cm-1, corresponds
to a statistically greater amount of structure I, while Δν = 140 – 160 cm-1 indicates that
structure II is more probable on the titania surface. However, Δν assumes normally
intermediate values indicating a mixture of both structures. 193
Acetic acid complexation requires the presence of Lewis acidic (Ti4+) and basic
(O2-, OH-) centres:
CH3COOH + Ti4+ + [O2-]surf → CH3COO -······ Ti4+ + OH- (4.30)
CH3COOH + Ti4+ + [OH-]surf → CH3COO -······ Ti4+ + H2O (4.31)
In order to investigate the role of the adsorbed acetate on titania in the
sulfoxidation, we synthesized three acetic acid-modified titania samples starting from
different amounts of acetic acid in water during the adsorption step: 25%Ac-TiO2,
50%Ac-TiO2, 100%Ac-TiO2. The synthesis procedure is described in the experimental
part.
If a standard sulfoxidation reaction in pure n-heptane was carried out in the
presence of acetic acid modified titania samples (100%Ac-TiO2), no changes were
4.C-H Activation through Catalytic Photosulfoxidation of Alkanes
129
noticed in the yield of the reaction indicating that the plateau reached in Fig. 4.31
cannot be attributed to the influence of adsorbed acetate species.
4.3.3 Influence of Water
In most photocatalytic systems at least traces of water are necessary to observe the
desired reaction. The reason for this may be the formation of intermediate OH radicals
as very reactive intermediates and a positive influence of water on the interfacial
electron transfer. In the photooxidation of pollutants both enhancement and inhibition
of the degradation rate can be caused by water vapor. Water vapor inhibited the gas
phase degradation of ethylene195 whereas enhanced the gas phase photooxidation of
cyclohexane196 and toluene197 but no significant effects on benzene198 oxidation were
noted.
Another parameter that has to be evaluated studying the influence of water is the
hydrophobicity of the organic substrate. In this case water can totally solvate TiO2
inhibiting the contact between the titania particles and the organic substrate.This effect
is already noticed in the system without acetic acid where amounts of water like 0.3 %
(V/V) totally inhibited the sulfoxidation of n-heptane.
Taking into consideration that the acetic acid adsorption process affords one
molecule of water for every acetic acid molecule adsorbed, the amount of water in this
way produced on the titania surface should be enough to generate a hydrated TiO2
surface and to block further product formation.
In order to check this hypothesis a suspension of P25 in a solution n-heptane/acetic
acid (1:1) was stirred three days in the dark. Then the mixture was transferred in the
reactor and SO2 and O2 were metered into it. After 5 h of visible irradiation the powder
was still white and well suspended but only negligible amounts of sulfonic acid could
be detected. This suggests that the water produced in the acetic acid absorption process
inhibited photosulfoxidation.
We tried to remove water traces from the reaction mixture during the reaction
using zeolites, MgSO4 or CaSO4 but unfortunately these attempts failed because the
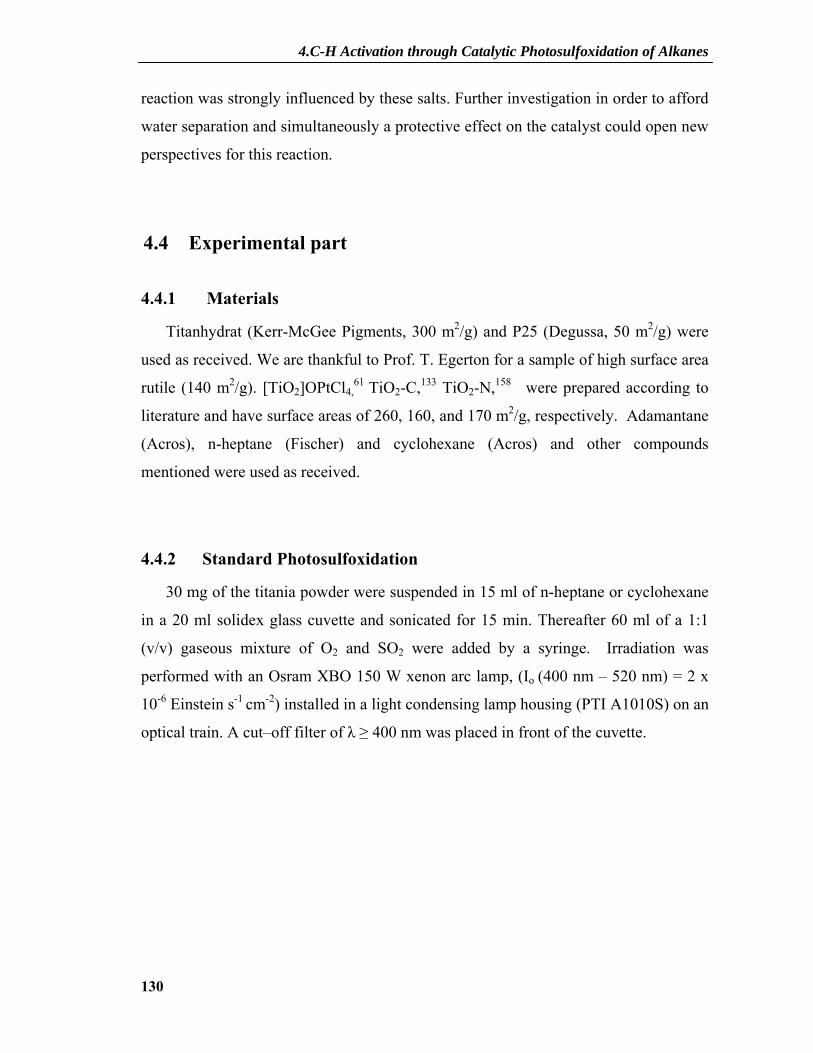
4.C-H Activation through Catalytic Photosulfoxidation of Alkanes
130
reaction was strongly influenced by these salts. Further investigation in order to afford
water separation and simultaneously a protective effect on the catalyst could open new
perspectives for this reaction.
4.4 Experimental part
4.4.1 Materials
Titanhydrat (Kerr-McGee Pigments, 300 m2/g) and P25 (Degussa, 50 m2/g) were
used as received. We are thankful to Prof. T. Egerton for a sample of high surface area
rutile (140 m2/g). [TiO2]OPtCl4,61 TiO2-C,133 TiO2-N,158 were prepared according to
literature and have surface areas of 260, 160, and 170 m2/g, respectively. Adamantane
(Acros), n-heptane (Fischer) and cyclohexane (Acros) and other compounds
mentioned were used as received.
4.4.2 Standard Photosulfoxidation
30 mg of the titania powder were suspended in 15 ml of n-heptane or cyclohexane
in a 20 ml solidex glass cuvette and sonicated for 15 min. Thereafter 60 ml of a 1:1
(v/v) gaseous mixture of O2 and SO2 were added by a syringe. Irradiation was
performed with an Osram XBO 150 W xenon arc lamp, (Io (400 nm – 520 nm) = 2 x
10-6 Einstein s-1 cm-2) installed in a light condensing lamp housing (PTI A1010S) on an
optical train. A cut–off filter of λ ≥ 400 nm was placed in front of the cuvette.
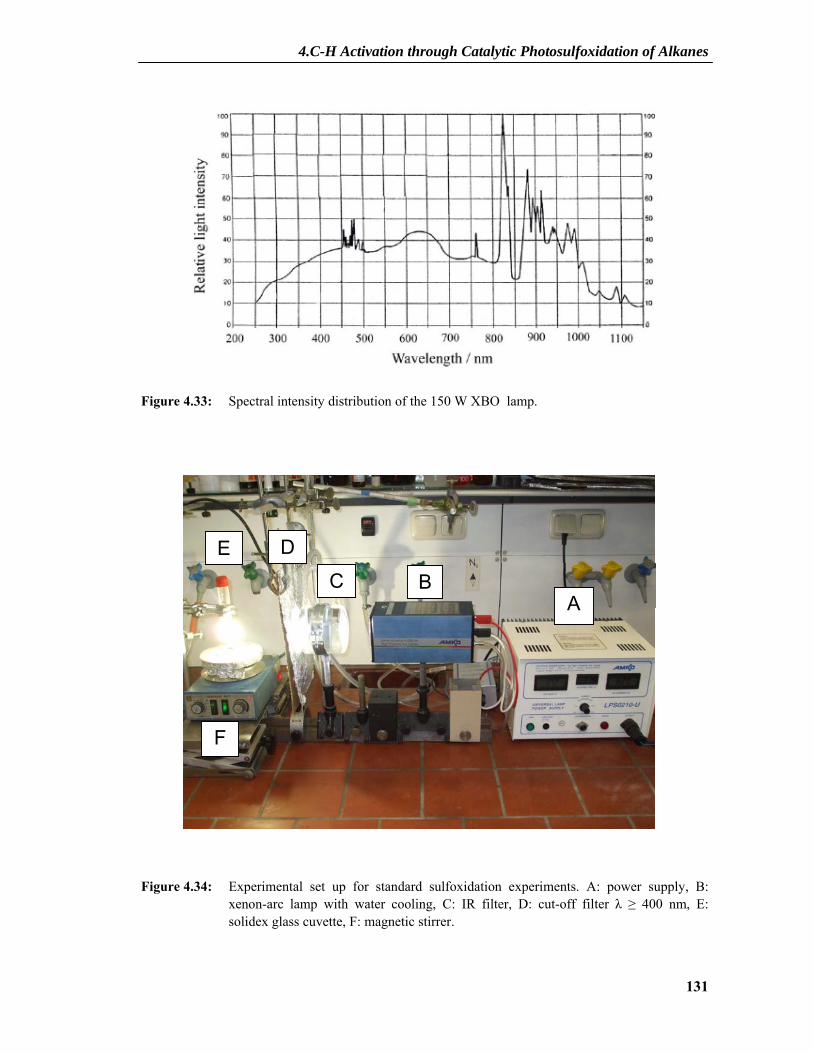
4.C-H Activation through Catalytic Photosulfoxidation of Alkanes
131
Figure 4.33: Spectral intensity distribution of the 150 W XBO lamp.
Figure 4.34: Experimental set up for standard sulfoxidation experiments. A: power supply, B: xenon-arc lamp with water cooling, C: IR filter, D: cut-off filter λ ≥ 400 nm, E: solidex glass cuvette, F: magnetic stirrer.
A
E
F
D
C B
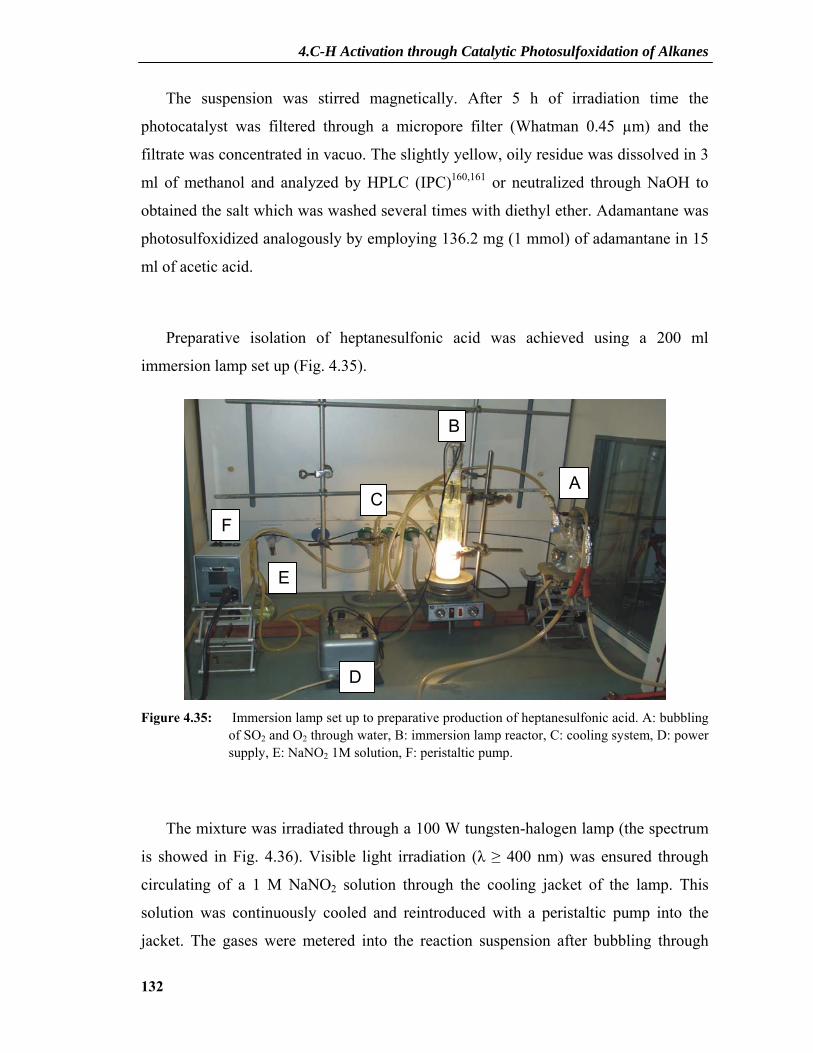
4.C-H Activation through Catalytic Photosulfoxidation of Alkanes
132
The suspension was stirred magnetically. After 5 h of irradiation time the
photocatalyst was filtered through a micropore filter (Whatman 0.45 µm) and the
filtrate was concentrated in vacuo. The slightly yellow, oily residue was dissolved in 3
ml of methanol and analyzed by HPLC (IPC)160,161 or neutralized through NaOH to
obtained the salt which was washed several times with diethyl ether. Adamantane was
photosulfoxidized analogously by employing 136.2 mg (1 mmol) of adamantane in 15
ml of acetic acid.
Preparative isolation of heptanesulfonic acid was achieved using a 200 ml
immersion lamp set up (Fig. 4.35).
Figure 4.35: Immersion lamp set up to preparative production of heptanesulfonic acid. A: bubbling
of SO2 and O2 through water, B: immersion lamp reactor, C: cooling system, D: power supply, E: NaNO2 1M solution, F: peristaltic pump.
The mixture was irradiated through a 100 W tungsten-halogen lamp (the spectrum
is showed in Fig. 4.36). Visible light irradiation (λ ≥ 400 nm) was ensured through
circulating of a 1 M NaNO2 solution through the cooling jacket of the lamp. This
solution was continuously cooled and reintroduced with a peristaltic pump into the
jacket. The gases were metered into the reaction suspension after bubbling through
A
D
B
CF
E

4.C-H Activation through Catalytic Photosulfoxidation of Alkanes
133
water to control the flow rate. After 5 h irradiation the suspension was stirred
magnetically during 5 days and the product was isolated as described in the case of the
standard reaction.
Figure 4.36: Spectrum of the 100 W tungsten-halogen lamp employed in the immersion apparatus.
4.4.3 Instruments and Methods
• UV-Vis spectroscopy
Shimadzu UV – 3101 PC UV-Vis-NIR Scanning Spectrophotometer, Quarz
cuvette with d = 1 cm.
• Diffuse reflectance spectroscopy
Shimadzu UV-2401 PC UV-Vis Recording Spectrophotometer equipped with a
diffuse reflectance accessory. The samples were spread over a BaSO4 pellet after
this was used for measuring the background reflectance. The reflectance was
converted by the instrument software to F(R∞) according to the Kubelka-Munk
theory.
• IR spectroscopy
Perkin Elmer 16 PC FT – IR

4.C-H Activation through Catalytic Photosulfoxidation of Alkanes
134
• Elemental analysis
Carlo Erba Elemental Analyser Model 1108
• Specific surface
Gemini 2370, surface calculated according to the Brunauer-Emmet- Teller theory
• Ion chromatography
Dionex – 120, Ion Pac AS 14 column, conductivity detector, eluent NaHCO3 /
NaCO3 = 0.001 / 0.0035 M
• Gas Chromatography
Shimadzu GC-17A gas chromatograph. Column: Supelcowax TMC 30m, d: 0.54
mm - 1μ. Carrying gas: N2
• Mass spectroscopy
JEOL JMS 700 (EI 70 eV, FD 2kV)
• XPS
XPS spectra were recorded using a Phi 5600 ESCA instrument (pass energy of
46.95 eV, Al std, 300.0 W, 45.0°). The binding energy reference was taken as the
C1s peak from carbon contamination of the samples at 284.8 eV. Fitting of the
experimental XPS data was done after a background correction using the Shirley
method.199 For modeling the peak shapes, Gaussian-Lorentzian combinations were
used.
• Fluorescence spectroscopy
Perkin Elmer LS 50B luminescence spectrometer
• HPLC with IPC
SCL 10 AVP system controller, SIL -10A autosampler, SP10AVP model UV
detector, Column (250 x 4.6 mm I.D.) filled with Partisil 10 SAX (Whatman) which is
a strong anion exchanger. Water-acetonitrile (60/40, v/v) with 0.01 M potassium
hydrogenphthalate as UV absorbing counter ion was employed as eluent. Detections

4.C-H Activation through Catalytic Photosulfoxidation of Alkanes
135
were made at 304 nm and the pH value of the eluent was 5.8. Detector SP10AVP
model UV detector (304 nm).
• PEMF measurements
One hundred milligrams of the powder were dispersed by ultrasonics in 3 g of a
10% solution of polyvinylbutyrale in 1, 2-dichloroethane. The suspension was placed
on a glass plate (47 cm2 in area). After drying in a solvent atmosphere, the polymer
film was removed from the glass support. The remaining solvent was removed from
the film under vacuum. The resulting sheet had a thickness of 60 to 80 µm and exhibits
total light absorption in the UV.
The cell for PEMF measurements (Fig. 4.15) is constructed like a capacitor with
the sample as dielectric layer. The sample is flash-illuminated by a nitrogen laser type
“PNL 100” (LTB Lasertechnik Berlin, λflash = 337 nm, τ1/2 = 0.3 ns, 2.7 x 10⁻³ quanta
per flash).
The resulting PEMF is measured without any galvanic contact because there are
insulating foils between sample sheet and electrodes. This prevents charge injection
from the electrodes into the sample. The preamplifier has an impedance of about 1TΩ
and the PEMF measurements take place without any external electric field.
All experiments were carried out in air under normal pressure and at 298 K. The
signals were recorded in two different time range:
- till 2,5 μs after flash in order to record the process of build-up and of the fast
decay.
- till 200 ms after flash in order to record the process of slow decay.
In all the cases the signal of the first laser flash was recorded. After that, sampling
of 4 signals was done in order to explore the charge effects.
For sampling experiments the time distance between two flashes was 120 s. All the
measured values and curves showed are an average of three independent
measurements.
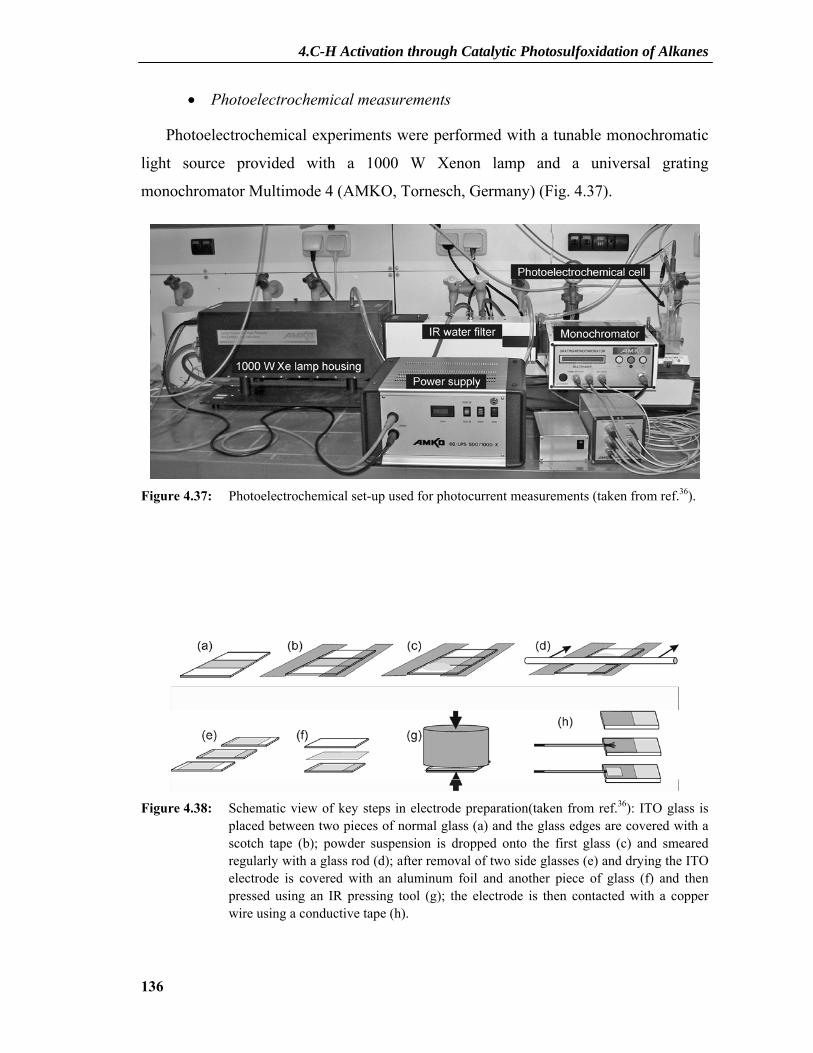
4.C-H Activation through Catalytic Photosulfoxidation of Alkanes
136
• Photoelectrochemical measurements
Photoelectrochemical experiments were performed with a tunable monochromatic
light source provided with a 1000 W Xenon lamp and a universal grating
monochromator Multimode 4 (AMKO, Tornesch, Germany) (Fig. 4.37).
Figure 4.37: Photoelectrochemical set-up used for photocurrent measurements (taken from ref.36).
Figure 4.38: Schematic view of key steps in electrode preparation(taken from ref.36): ITO glass is
placed between two pieces of normal glass (a) and the glass edges are covered with a scotch tape (b); powder suspension is dropped onto the first glass (c) and smeared regularly with a glass rod (d); after removal of two side glasses (e) and drying the ITO electrode is covered with an aluminum foil and another piece of glass (f) and then pressed using an IR pressing tool (g); the electrode is then contacted with a copper wire using a conductive tape (h).

4.C-H Activation through Catalytic Photosulfoxidation of Alkanes
137
For photocurrent measurements electrodes consisting of a porous nanocrystalline
film deposited on ITO-glass were prepared according to ref. 36(Fig. 4.38). The
conductive ITO-glass substrate (Präzision Glas & Optik, Iserlohn, Germany, sheet
resistance of ~10 Ω/sq.) was first cut into 2.5 × 1.5 cm pieces and then subsequently
degreased by sonicating in acetone and boiling NaOH (0.1M), rinsed with
demineralized water, and blown dry in a nitrogen stream. A suspension of 200 mg of
P25 TiO2 in 1 ml of ethanol was sonicated for 20 minutes and then deposited onto the
ITO glass by doctor blading using a scotch tape as frame and spacer. The electrodes
were then dried at 100 °C, covered with aluminum foil and a glass plate, pressed for 3
minutes at a pressure of 200 kg/cm2 using an IR pressing tool (Paul Weber, Stuttgart,
Germany) according to a procedure similar to that described in literature200. Such a
procedure yields a ~ 2.5 μm thick opaque and slightly translucent layer of TiO2 having
an excellent mechanical stability.
Figure 4.39: A photoelectrochemical cell used for photocurrent measurements viewed from the side (left) and from the front (right) (taken from ref.36).

4.C-H Activation through Catalytic Photosulfoxidation of Alkanes
138
The electrochemical setup consisted of a BAS Epsilon Electrochemistry
Potentiostat (BAS, West Lafayette, USA) and a three-electrode cell using a platinum
counter electrode and an Ag/AgCl (3 M KCl) reference electrode (Fig. 4.39). During
photoelectrochemical measurements the electrodes were pressed against an O-ring of
an electrochemical cell leaving a working area of 0.636 cm2. The photocurrent
experiments were carried out in a 0.1 M HClO4 solution when SO2 was used as
reducting agent, in a 0.1 M LiClO4 solution when iodide was used as reducting agent.
Nitrogen was passed through the electrolyte prior to the experiment whereas it was
supplied only to the gas phase above the electrolyte during the experiments. In the
experiment with iodide the KI concentration was 0.1 M. Presence of SO2 in the
electrolyte was achieved considering that SO2 is the stable form of S (IV) in acidic
solutions. After bubbling nitrogen in the electrolyte, stoichiometric amount of Na2S2O5
was introduced into the solution. Under these conditions this species is immediately
converted to SO2 according to Eqs. 4.32 and 4.33.
Na2S2O5 + H2O → 2NaHSO3 (4.32)
HSO3- + H+ → H2O + SO2 (4.33)
The bubbling was replaced with a nitrogen flow above the solution in order that
SO2 did not escape too much from the solution.
The wavelength dependence of photocurrent was measured at a constant potential
of 0.5 V vs. Ag/AgCl. The electrodes were irradiated from the back-side (through the
ITO glass) with light and dark phases of 5 and 10 s, respectively.
4.C-H Activation through Catalytic Photosulfoxidation of Alkanes
139
4.4.4 Surface Modification of Titania
• Metal salts modification
The ruthenium and iridium modified titania were obtained with a similar procedure
as described in Chapter 3 for the rhodium modification. The starting metal salts
were RuCl3 · xH2O and IrCl3 · 3H2O, respectively.
• Synthesis of 100%Ac-P25
1g of P25 was stirred during 12 h in the dark in 20 ml of glacial acetic acid. The
suspension was dried in vacuum at RT for 90 min.
The resulting powder was washed 9 times until the pH value of the washings
reached a constant value of 4.2. The powder was dried again at room temperature
under vacuum and finally ground. Analogous procedure was carried out to synthesize
25% Ac-P25 and 50%Ac-P25. In these cases P25 was stirred during 12 h in the dark in
a solution of water/glacial acetic acid 25% and 50% (v/v) respectively.
• Synthesis of Silylated P25
In a round bottom flask were mixed 1g of P25, 50 ml of n-hexane, 2 ml of
triethylamine and 7 g of C16H32Si(OCH3)3 (Wacker Silan 250, 2VP). The suspension
was boiled at 90° C for 24 h. The solid phase was separated from the liquid by
centrifugation and washed three times with n-hexane. The powder was dried at room
temperature in vacuum and finally ground.
The silylation process is described in Eqs. 4.34 and 4.35.
[Ti]OH + NEt3 → TiO- + HNEt3+ (4.34)
[Ti]O- + R-Si(OCH3)3 + HNEt3+→ [Ti]-O-Si(OCH3)2-R + CH3OH + NEt3 (4.35)

4.C-H Activation through Catalytic Photosulfoxidation of Alkanes
140
The base triethylamine reacts with the acidic groups on titania giving the strong
base TiO- which in turn attacks the silicon atom under formation of an oxygen bridge
between Ti and Si. Concomitant elimination of CH3OH reforms triethylamine.
Similarly, the remaining methoxy groups (OCH3) can be also replaced by other TiO-
groups.
• Synthesis of phosphated P25
A suspension of 1g P25, 2.76 g NaH2PO4 in 50 ml water was mixed during 12
hours. After centrifugation, the powder was washed three times with 50 ml H2O, dried
under vacuum at room temperature and finally ground.
• Synthesis of fluorinated P25
Fluorinated P25 was prepared by the impregnation method. 1g of P25 was
impregnated in 50 ml of 4% NaF solution at pH 3.2 (pH adjusted by HNO3) for 2 days
at room temperature. The powder separated by centrifuge was washed two times with
water at pH 3.2, dried in vacuum at 80°C for 2h and finally ground.
5. Summary
141
5. Summary
C-H bond activation and functionalization of alkanes is one of the major
challenges in chemistry. A rare example of an industrially applied process is the
photosulfoxidation of liquid alkanes by sulfur dioxide and oxygen in the presence of
UV light (Eq. 5.1).
R-H +SO2 +1/2 O2 + hν → RSO3H (5.1)
In the case of linear C16-20 chain alkanes the resulting alkanesulfonic acids are used
as biodegradable surfactants. The primary reaction steps of this rare alkane
functionalization consist of UV-excitation of SO2 followed by hydrogen abstraction
from the alkane producing an alkyl radical. Subsequent addition reactions with SO2
and O2 generate an alkylpersulfonyl radical which in turn produces another alkyl
starter radical and the persulfonic acid. Fragmentation and hydrogen abstraction afford
the alkanesulfonic acid. In general regioisomeric alkyl radicals are formed in the
hydrogen abstraction step. A rare example for a sensitized process is the mercury
photosensitized sulfination of alkanes with SO2 producing initially sulfinic acids
(RSOOH) and sulfinic esters which have to be further oxidized to sulfonic acids by
hydrogen peroxide. All the reactions mentioned above occur only upon excitation of
sulfur dioxide or mercury with UV light. In this dissertation we report on the first
catalytic photosulfoxidation of alkanes. This reaction does not require UV lamps and
toxic sensitizers, but only a non-toxic semiconductor powder inducing alkane
functionalization through visible light excitation.
In a preceeding dissertation157 some basic features of this novel reaction were
investigated, however reproducibility problems and basic mechanistic questions
required a more detailed investigation of this photocatalytic C-H activation reaction.
5. Summary
142
n° Photocatalyst ri [mmol l-1 h-1]
1 Titanhydrat(A) 3.5
2 TiO2 (Hombikat, A) 5.0
3 TiO2 (R) 6.0
4 TiO2 (P25, A+R) 7.5
5 [TiO2]OPtCl4 (A) 0.0
6 [TiO2]ORhCl3 (A) 3.5
7 TiO2-C, TiO2-N (A) 3.5
Table 5.1: Initial rate ri of n-heptanesulfonic acid in the presence of different TiO2 photocatalysts. A = anatase, R = rutile.
When a suspension of a titania powder in n-heptane was irradiated with visible
light (λ ≥ 400 nm) under an atmosphere of SO2/O2 = 1:1 (v/v), the formation of n-
heptanesulfonic acid (1) was observed (Tab. 5.1). Only traces of the sulfonic acid were
observable in the absence of titania. Initial product formation rates were 3.5 mmol/l.h
and 5.0 mmol/l.h for the anatase materials Titanhydrat and Hombikat, respectively,
whereas for rutile and the mixed phase powder P25 (75% anatase/25% rutile) values of
6.0 mmol/l.h and 7.5 mmol/l h were observed. Out of the modified titania powders
(entries 5-7), which are all good photocatalysts in 4-chlorophenol visible light
oxidation, only the titania-chlororhodate complex and carbon- or nitrogen-modified
titania exhibited moderate rates of 3.5 mmol/l.h.
Under the given experimental conditions, formation of 1 stopped after 6 h of
irradiation time. However, separating the catalyst powder and washing with methanol
restored the activity. Repeating this procedure three times, the photocatalyst still
retained its original activity (Fig. 5.1). This observation suggested that the reaction is
inhibited by strong product adsorption and that washing desorbs the sulfonic acid.
Accordingly, no product formation was observable when 1 was added to the
suspension prior to irradiation. Fuhermore, during the photocatalytic sulfoxidation P25

5. Summary
143
changes its photoelectrical behaviour from n-type to p-type as indicated by time-
resolved photovoltage measurements; this may decrease the reaction efficiency.
Product formation was also inhibited when small amounts of water like 0.3 vol% were
present in the suspension. This may be due to blocking the reactive surface centres for
heptane oxidation by preferential product adsorption.
0
10
20
30
40
hνhν
c(1)
/ m
M
hν
R R R
0 10 0 10 0 10
Time / h
Figure 5.1: Sequential photosulfoxidation of n-heptane. λirr ≥ 400 nm. R = regeneration.
When after 2 h of irradiation, corresponding to a concentration of 15 mM of 1,
irradiation was stopped and the reaction left for three days in the dark at room
temperature, product formation continued affording 50 mM of 1. However, when the
radical scavenger hydroquinone was present during the dark phase, sulfonic acid
production did not continue.
These findings suggest that also this novel photosulfoxidation is a radical chain
reaction. However, in this case the alkyl starter radical is generated not via UV
excitation of sulfur dioxide but through visible light absorption of the TiO2/n-
heptane/SO2/O2 system. Since only the modified titania powders (Tab. 5.1, entries 5-7)
5. Summary
144
are able to absorb visible light, it seemed likely that the unmodified materials may
form a charge-transfer complex with sulfur dioxide. In fact, exposure of P25 to sulfur
dioxide resulted in a yellowish coloration of the powder originating from a broad
absorption maximum in the diffuse reflectance spectrum at 410-420 nm. Accordingly,
a preliminary mechanism for alkyl radical generation is proposed as schematically
depicted in Fig. 5.2. Visible light excitation of the charge-transfer complex affords a
conduction band electron [TiO2(e−)] and an adsorbed sulfur dioxide radical cation.
Oxygen reduction by [TiO2(e−)] produces superoxide whereas the adsorbed sulfur
radical cation may oxidize the alkane to the alkyl radical and a proton. Superoxide
may also generate an alkyl radical through protonation by adsorbed water or surface
OH groups to the hydroperoxyl radical and subsequent hydrogen abstraction from the
alkane.
Figure 5.2: Proposed mechanism of photocatalytic sulfoxidation of alkanes with visible light.
The alkyl radical thus produced is expected to initiate a radical chain reaction as
formulated for the stoichiometric UV-photosulfoxidation. In agreement with the
proposed mechanism is the complete inhibition observed in the presence of only 10
vol% of isopropanol, which should be much faster oxidized than the alkane and which
is also an efficient OH radical scavenger.
[TiO2(e-)---SO2+·]
[TiO2---SO2]
O2
RH RH
R· R· + H+
Vis
5. Summary
145
In summary, this novel visible light induced C-H activation can be classified as
a photocatalysis type B reaction, extending the previously known two-substrate
addition to the present three-substrate addition scheme A + B + C = D.
Surprisingly other expected by-products like ketones, alcohols and CO2 are
formed, if at all, only in negligible amounts. In the case of cyclohexane
photosulfoxidation only about 0.1% of cyclohexanone (relative to cyclohexanesulfonic
acid) were observed. As mentioned before SO2 forms a CT-complex with titania and
therefore one expects that its surface concentration should be much higher than that of
oxygen. Therefore, the rate of reaction with an alkyl radical should become faster as
compared to the addition reaction with O2. This could be the reason for the unexpected
selectivity of this reaction.

6. Zusammenfassung
146
6. Zusammenfassung
Die Aktivierung und Funktionalisierung von C-H Bindungen gehört zu den großen
Herausforderungen der Chemie. Das seltene Beispiel eines bereits industriell
angewandten Prozesses ist die Sulfoxidation flüssiger Alkane durch Schwefeldioxid
und molekularen Sauerstoff in Gegenwart von UV-Licht (Gl. 6.1).
R-H +SO2 +1/2 O2 + hν → RSO3H (6.1)
Im Falle von C16-20 Alkanen finden die daraus resultierenden Alkansulfonsäuren
als bioabbaubare Waschmittel Verwendung. Die primären Reaktionsschritte dieser
Alkanfunktionalisierung bestehen aus der UV-Anregung von SO2, dessen
Triplettzustand mit dem Alkan unter H-Abstraktion ein Alkylradikal erzeugt.
Anschließende Additionsreaktionen mit SO2 und O2 führen zu einem
Alkylpersulfonylradikal, welches über eine H-Abstraktion zum Alkylradikal und zur
Alkanpersulfonsäure führt. Nachfolgende Fragmentierung und Wasserstoffabstraktion
ergeben schließlich die Alkansulfonsäure und weitere Starterradikale. Im Allgemeinen
entstehen im ersten H-Abstraktionsschritt regioisomere Alkylradikale. Ein sehr
seltenes Beispiel für eine photosensibilisierte Variante ist die
Quecksilbersensibilisierte Sulfinierung von Alkanen mit SO2 zu Sulfinsäuren
(RSOOH) und Sulfinsäureestern. Nachfolgende Oxidation mit Wasserstoffperoxid
führt ebenfalls zu Alkansulfonsäuren. Alle oben erwähnten Reaktionen erfordern die
UV-Anregung von Schwefeldioxid oder Quecksilber. In dieser Dissertation berichten
wir dagegen über die katalytische Photosulfoxidation von Alkanen, die mit sichtbarem
Licht abläuft. Sie benötigt keine UV-Lampe oder einen toxischen Photosensibilisator,
sondern lediglich ein nicht-toxisches Halbleiterpulver als heterogenen
Photokatalysator. Manche grundlegenden Aspekte dieser neuen Reaktion wurden in
einer vorherigen Dissertation157 untersucht. Trotzdem traten Reproduzierbarkeit

6. Zusammenfassung
147
Probleme und mechanistische Fragen auf, die nach einer detalierteren Untersuchung
der photokatalytischen Aktivierung der C-H Bindung verlangten.
n° Photocatalysatoren ri [mmol l-1 h-1]
1 Titanhydrat (A) 3.5
2 TiO2 (Hombikat, A) 5.0
3 TiO2 (R) 6.0
4 TiO2 (P25, A+R) 7.5
5 [TiO2]OPtCl4 (A) 0.0
6 [TiO2]ORhCl3 (A) 3.5
7 TiO2-C, TiO2-N (A) 3.5
Tabelle 6.1: Anfangsgeschwindigkeit ri der Bildung von n-Heptansulfonsäure (1) in Gegenwart verschiedener Titandioxidphotokatalysatoren. A und R bezeichnen Anatas- und Rutilmodifikationen.
Wurde eine Suspension von Titandioxid in n-Heptan unter einer Atmosphäre von
SO2/O2 = 1:1 (v/v) mit sichtbarem Licht (λ ≥ 400 nm) bestrahlt, ließ sich die Bildung
von n-Heptansulfonsäure (1) nachweisen (Tab. 6.1). Nur Spuren dieses Produkts
entstanden, wenn Titandioxid weggelassen wurde. Die Anfangsgeschwindigkeiten der
Produktbildung betrugen für die Anatasmodifikation Titanhydrat und Hombikat 3.5
mmol/l.h bzw. 5.0 mmol/l.h, während Werte von 6.0 mmol/l.h und 7.5 mmol/l.h für
Rutil bzw. das gemischtphasige P25 (75% Anatas/25% Rutil) erhalten wurden. Von
den modifizierten Titandioxiden (Tab. 6.1, Zeilen 5-7), die alle gute
Photokatalysatoren für die vollständige Oxidation von 4-Chlorophenol mit sichtbarem
Licht sind, [9-12] induzierten lediglich der Titandioxid-Chlororhodatkomplex sowie
Kohlenstoff- und Stickstoff-modifiziertes Titandioxid moderate
Reaktionsgeschwindigkeiten von 3.5 mmol/l.h. Unter den gegebenen experimentellen
6. Zusammenfassung
148
Bedingungen kam die Reaktion nach 6 h Belichtungszeit zum Erliegen. Wurde
allerdings anschließend das Katalysatorpulver abgetrennt und mit Methanol
gewaschen, konnte seine ursprüngliche Aktivität wieder hergestellt werden. Auch nach
dreimaliger Wiederholung dieser Prozedur änderte sich die Anfangsgeschwindigkeit
kaum (Abb. 6.1). Diese Befunde deuteten auf das Vorliegen einer Inhibierung durch
Produktadsorption, die durch Waschen mit Methanol wieder aufgehoben werden kann.
Dementsprechend entsteht keine weitere Sulfonsäure, wenn diese vor
Belichtungsbeginn zur Suspension zugesetzt wurde. Des Weiteren ändern sich bei der
photokatalytischen Sulfoxidation, die photoelektrische Eigenschaften des P25, von n-
type zum p-type (PEMF Ergebnisse). Dieser Vorgang kann die Effizienz der IFET
Reaktion verringern.
Die Bildung von n-Heptansulfonsäure wurde auch inhibiert, wenn die Suspension
geringe Mengen an Wasser (0.3vol%) enthielt. Dies könnte auf Blockierung der n-
Heptan adsorptionszentren durch bevorzugte Wasseradsorption zurückzuführen sein.
0
10
20
30
40
hνhν
c(1)
/ m
M
hν
R R R
0 10 0 10 0 10
Time / h
Abbildung 6.1. Sequentielle Photosulfoxidation von n-Heptan. λirr ≥ 400 nm. R = Katalysatorregenerierung.
6. Zusammenfassung
149
Wurde die Reaktion nach 2 h Belichtungszeit gestoppt, entsprechend der Bildung
einer 15 mM Lösung von (1), und die Suspension anschließend drei Tage im Dunkeln
aufbewahrt, stieg die Konzentration an (1) auf 50 mM. War dagegen während dieser
Dunkelphase der Radikalfänger Hydrochinon anwesend, konnte keine weitere
Sulfonsäurebildung beobachtet werden.
Obige Ergebnisse deuten darauf hin, daß auch diese neuartige
Photosulfoxidation eine Radikalkettenreaktion ist. Jedoch entsteht das
Alkylstarterradikal nicht durch UV-Anregung von Schwefeldioxid, sondern durch Vis-
Anregung des TiO2/n-Heptan/SO2/O2 - Systems. Da aber nur die modifizierten
Titandioxide (Tabelle 1, Zeilen 5-7) sichtbares Licht absorbieren können, erschien es
möglich, daß die unmodifizierten Titandioxide (Tabelle 1, Zeilen 1-4) mit
Schwefeldioxid einen im Sichtbaren absorbierenden Charge-Transferkomplex bilden.
In der Tat tritt eine schwache Gelbfärbung auf, wenn P25 mit Schwefeldioxid in
Kontakt gebracht wird. Eine entsprechende CT-Bande taucht im Diffusen
Reflexionsspektrum bei 410 - 420 nm auf. Auf Grund dieser Beobachtungen wird der
in Abbildung 6.2 skizzierte Mechanismus vorgeschlagen.
Abbildung 6.2: Mechanistischer Vorschlag zur lichtinduzierten Bildung von Alkylradikalen.
[TiO2(e-)---SO2+·]
[TiO2---SO2]
O2
RH RH
R· R· + H+
Vis

6. Zusammenfassung
150
Vis-Anregung des CT-Komplexes ergibt ein Elektron im Leitungsband
[TiO2(e−)] und ein adsorbiertes Schwefeldioxidradikalkation. Das erstere reduziert
Sauerstoff zu Superoxid, das zweite kann das Alkan unter Deprotonierung zum
Alkylradikal und zu einem Proton oxidieren. Nach Protonierung von O2− durch
Oberflächenhydroxylgruppen entsteht das Hydroperoxylradikal, welches über eine H-
Abstraktion ebenfalls das Alkylradikal erzeugen kann. Die auf beiden Wegen
erhaltenen Alkylstarterradikale reagieren weiter wie bei der stoichiometrischen UV –
sulfoxidation beschrieben.
Im Einklang mit diesem mechanistischen Vorschlag ist die vollständige
Inhibierung durch 10vol% Methanol, welches viel schneller als das Alkan oxidiert
werden sollte und außerdem noch ein effizienter OH-Radikalfänger ist.
Zusammenfassend läßt sich diese durch sichtbares Licht induzierte C-H –
Aktivierung als “Halbleiterphotokatalyse Typ B” klassifizieren. Sie erweitert den
bisher als Zweikomponentenaddition definierten Reaktionstyp um eine dritte
Komponente.
Andere erwartete Neben-produkte wie Ketone, Alcohole und CO2 entstehen, wenn
überhaupt, nur in vernachlässigbaren Mengen. Bei der Cyclohexan-photosulfoxidation
entsteht nur 0.1% Cyclohexanon (auf 100% Cyclohexansulfon-Säure). Wie schon
erwähnt, bildet SO2 mit Titandioxid einen im Sichtbaren absorbierenden Charge-
Transferkomplex. Auf Grund dessen kann man erwarten, dass die SO2 Konzentration
an der Katalysator Oberfläche viel grösser ist als die von O2. Daher sollte die Addition
des Alkylradicals schneller sein als die Addition von Sauerstoff. Dies kann der Grund
für die Selektivität dieser Reaktion sein.
151
7. References
(1)Labinger, J. A.; Bercaw, J. E. Nature 2002, 417, 507.
(2)Shilov, A. E.; Shul'pin, G. B. Chem. Rev. 1997, 97, 2879.
(3)Bard, A. J.; Whitesides, G. M.; Zare, R. N.; McLafferty, F. W. Acc. Chem. Res. 1995, 28, 91.
(4)Arndtsen, B. A.; Bergman, R. G.; Mobley, T. A.; Peterson, T. H. Acc. Chem. Res. 1995, 28, 154.
(5)Gol'dshleger, N. F.; Tyabin, M. B.; Shilov, A. E.; Shteinman, A. A. Zh. Fiz. Khim. 1969, 43, 2174.
(6)Gol'dshleger, N. F.; Es'kova, V. V.; Shilov, A. E.; Shteinman, A. A. Zh. Fiz. Khim. 1972, 46, 1353.
(7)Rudakov, E. S.; Zamashchikov, V. V.; Belyaeva, N. P.; Rudakova, R. I. Zh. Fiz. Khim. 1973, 47, 2732.
(8)Tret'yakov, V. P.; Arzamaskova, L. N.; Ermakov, Y. I. Kinet. Katal. 1974, 15, 538.
(9)Cooper, T. A.; Waters, W. A. Journal of the Chemical Society [Section] B: Physical Organic 1967, 687.
(10) Garnett, J. L.; Long, M. A.; Peterson, K. B. Aust. J. Chem. 1974, 27, 1823.
(11) Grigoryan, E. A.; D'Yachkovskii, F. S.; Mullagaliev, I. R. Dokl. Akad. Nauk SSSR 1975, 224, 859.
(12) Bergman, R. G. Nature 2007, 446, 391.
(13) Chen, H.; Schlecht, S.; Semple, T. C.; Hartwig, J. F. Science 2000, 287, 1995.
(14) Crabtree, R. H. Journal of the Chemical Society, Dalton Transactions 2001, 2437.
(15) Crabtree, R. H. Chem. Rev. 1995, 95, 987.
(16) Shilov, A. E.; Shteinman, A. A. Acc. Chem. Res. 1999, 32, 763.
(17) Jones, W. D.; Feher, F. J. J. Am. Chem. Soc. 1984, 106, 1650.
(18) Fokin, A. A.; Schreiner, P. R. Adv. Synth. Catal. 2003, 345, 1035.
(19) Fokin, A. A.; Schreiner, P. R. Chem. Rev. 2002, 102, 1551.
(20) Mayer, J. M. Acc. Chem. Res. 1998, 31, 441.
(21) Adam, W.; Curci, R.; Edwards, J. O. Acc. Chem. Res. 1989, 22, 205.
(22) Rajeshwar, K. Encyclopedia of Electrochemistry 2003, 6, 1.
(23) Tan, M. X.; Laibinis, P. E.; Nguyen, S. T.; Kesselman, J. M.; Stanton, C. E.; Lewis, N. S. Prog. Inorg. Chem. 1994, 41, 21.
(24) Cox, P. A. The Electronic Structure and Chemistry of Solids, 1987.
(25) Finklea, H. O.; Editor Studies in Physical and Theoretical Chemistry, 55: Semiconductor Electrodes, 1988.
(26) Pankove, J. I. Optical Processes in Semiconductors, 1971.
(27) Kasap, S. O. Principles of Electronic Materials and Devices, 3rd ed.; McGraw-Hill New York, 2006.
152
(28) Dung, D.; Ramsden, J.; Graetzel, M. J. Am. Chem. Soc. 1982, 104, 2977.
(29) Asahi, R.; Morikawa, T.; Ohwaki, T.; Aoki, K.; Taga, Y. Science 2001, 293, 269.
(30) Mardare, D.; Tasca, M.; Delibas, M.; Rusu, G. I. Appl. Surf. Sci. 2000, 156, 200.
(31) Tanaka, K.; Capule, M. F. V.; Hisanaga, T. Chem. Phys. Lett. 1991, 187, 73.
(32) Maruska, H. P.; Ghosh, A. K. Solar Energy 1978, 20, 443.
(33) Gerischer, H.; Heller, A. J. Electrochem. Soc. 1992, 139, 113.
(34) Bickley, R. I.; Gonzalez-Carreno, T.; Lees, J. S.; Palmisano, L.; Tilley, R. J. D. J. Solid State Chem. 1991, 92, 178.
(35) Hurum, D. C.; Agrios, A. G.; Gray, K. A.; Rajh, T.; Thurnauer, M. C. J. Phys. Chem. B 2003, 107, 4545.
(36) Beranek, R. PhD thesis, Friedrich - Alexander Universität, 2007.
(37) Butler, M. A.; Ginley, D. S. J. Electrochem. Soc. 1978, 125, 228.
(38) Morrison, S. R. Electrochemistry at Semiconductor and Oxidized Metal Electrodes; Plenum Press: New York, 1980.
(39) Paz, Y. C. R. Chim. 2006, 9, 774.
(40) Sclafani, A.; Herrmann, J. M. J. Phys. Chem. 1996, 100, 13655.
(41) Kormann, C.; Bahnemann, D. W.; Hoffmann, M. R. Environ. Sci. Technol. 1991, 25, 494.
(42) Hoffmann, M. R.; Martin, S. T.; Choi, W.; Bahnemann, D. W. Chem. Rev. 1995, 95, 69.
(43) Cundall, R. B.; Rudham, R.; Salim, M. S. J. Chem. Soc., Faraday Trans. 1 1976, 72, 1642.
(44) Sawyer, D. T.; Gibian, M. J. Tetrahedron 1979, 35, 1471.
(45) Okamoto, K.; Yamamoto, Y.; Tanaka, H.; Tanaka, M.; Itaya, A. Bull. Chem. Soc. Jpn. 1985, 58, 2015.
(46) Lettmann, C.; Hildenbrand, K.; Kisch, H.; Macyk, W.; Maier, W. F. Appl. Catal., B 2001, 32, 215.
(47) Goto, H.; Hanada, Y.; Ohno, T.; Matsumura, M. J. Catal. 2004, 225, 223.
(48) Zang, L.; Macyk, W.; Lange, C.; Maier, W. F.; Antonius, C.; Meissner, D.; Kisch, H. Chem.-Eur. J. 2000, 6, 379.
(49) Anpo, M. Pure Appl. Chem. 2000, 72, 1787.
(50) Peter, L. M.; Wijayantha, K. G. U.; Riley, D. J.; Waggett, J. P. J. Phys. Chem. B 2003, 107, 8378.
(51) Qian, X.; Qin, D.; Bai, Y.; Li, T.; Tang, X.; Wang, E.; Dong, S. J. Solid State Electrochem. 2001, 5, 562.
(52) Vogel, R.; Hoyer, P.; Weller, H. J. Phys. Chem. 1994, 98, 3183.
(53) Ho, W.; Yu, J. C. J. Mol. Catal. A: Chem. 2006, 247, 268.
(54) Tristao, J. C.; Magalhaes, F.; Corio, P.; Sansiviero, M. T. C. J. Photochem. Photobiol., A 2006, 181, 152.
(55) Macyk, W.; Stochel, G.; Szacilowski, K. Chem.-Eur. J. 2007, 13, 5676.
(56) Kroeze, J. E.; Koehorst, R. B. M.; Savenije, T. J. Adv. Funct. Mater. 2004, 14, 992.
153
(57) Winnischofer, H.; Formiga, A. L. B.; Nakamura, M.; Toma, H. E.; Araki, K.; Nogueira, A. F. Photochem. Photobiol. Sci. 2005, 4, 359.
(58) Ingrosso, C.; Petrella, A.; Curri, M. L.; Striccoli, M.; Cosma, P.; Cozzoli, P. D.; Agostiano, A. Appl. Surf. Sci. 2005, 246, 367.
(59) Iliev, V. J. Photochem. Photobiol., A 2002, 151, 195.
(60) Ehret, A.; Stuhl, L.; Spitler, M. T. J. Phys. Chem. B 2001, 105, 9960.
(61) Burgeth, G.; Kisch, H. Coord. Chem. Rev. 2002, 230, 41.
(62) Kim, S.; Choi, W. J Phys Chem B FIELD Full Journal Title:The journal of physical chemistry. B 2005, 109, 5143.
(63) Gubin, S. P.; Shul'pin, G. B. Chemistry of Complexes with Metal-Carbon Bonds, 1984.
(64) Dawoodi, Z.; Green, M. L. H.; Mtetwa, V. S. B.; Prout, K. J. Chem. Soc., Chem. Commun. 1982, 802.
(65) Hall, C.; Perutz, R. N. Chem. Rev. 1996, 96, 3125.
(66) Halpern, J. Inorg. Chim. Acta 1985, 100, 41.
(67) Janowicz, A. H.; Bergman, R. G. J. Am. Chem. Soc. 1982, 104, 352.
(68) Ghosh, C. K.; Rodgers, D. P. S.; Graham, W. A. G. J. Chem. Soc., Chem. Commun. 1988, 1511.
(69) Ghosh, C. K.; Graham, W. A. G. J. Am. Chem. Soc. 1989, 111, 375.
(70) Michos, D.; Luo, X. L.; Crabtree, R. H. Inorg. Chem. 1993, 32, 2118.
(71) Sakakura, T.; Sodeyama, T.; Tokunaga, Y.; Tanaka, M. Chem. Lett. 1988, 263.
(72) Maguire, J. A.; Boese, W. T.; Goldman, A. S. J. Am. Chem. Soc. 1989, 111, 7088.
(73) Spillett, C. T.; Ford, P. C. J. Am. Chem. Soc. 1989, 111, 1932.
(74) Sakakura, T.; Abe, F.; Tanaka, M. Chem. Lett. 1991, 297.
(75) Itagaki, H.; Einaga, H.; Saito, Y. Journal of the Chemical Society, Dalton Transactions: Inorganic Chemistry (1972-1999) 1993, 1689.
(76) Sakakura, T.; Sodeyama, T.; Sasaki, K.; Wada, K.; Tanaka, M. J. Am. Chem. Soc. 1990, 112, 7221.
(77) Khusnutdinov, R. I.; Shchadneva, N. A.; Dzhemilev, U. M. Izvestiya Akademii Nauk SSSR, Seriya Khimicheskaya 1991, 2897.
(78) Horvath, I. T.; Cook, R. A.; Millar, J. M.; Kiss, G. Organometallics 1993, 12, 8.
(79) Stahl, S.; Labinger, J. A.; Bercaw, J. E. Angew. Chem., Int. Ed. 1998, 37, 2181.
(80) Luinstra, G. A.; Wang, L.; Stahl, S. S.; Labinger, J. A.; Bercaw, J. E. J. Organomet. Chem. 1995, 504, 75.
(81) Periana, R. A.; Taube, D. J.; Gamble, S.; Taube, H.; Satoh, T.; Fujii, H. Science 1998, 280, 560.
(82) Watson, P. L. J. Am. Chem. Soc. 1983, 105, 6491.
(83) Muzart, J. Chem. Rev. 1992, 92, 113.
(84) Shul'pin, G. B.; Druzhinina, A. N.; Nizova, G. V. Izvestiya Akademii Nauk SSSR, Seriya Khimicheskaya 1990, 212.
(85) Shul'pin, G. B.; Kats, M. M. React. Kinet. Catal. Lett. 1990, 41, 239.
154
(86) Bakke, J. M.; Braenden, J. E. Acta Chem. Scand. 1991, 45, 418.
(87) Tenaglia, A.; Terranova, E.; Waegell, B. Tetrahedron Lett. 1989, 30, 5271.
(88) Denisov, E. T.; Khudyakov, I. V. Chem. Rev. 1987, 87, 1313.
(89) Hsu, Y. F.; Yen, M. H.; Cheng, C. P. J. Mol. Catal. A: Chem. 1996, 105, 137.
(90) Felzenstein, A.; Goosen, A.; Marsh, C.; McCleland, C. W.; Van Sandwyk, K. S. S. Afr. J. Chem. 1989, 42, 143.
(91) Dugmore, G. M.; Powels, G. J.; Zeelie, B. J. Mol. Catal. A: Chem. 1995, 99, 1.
(92) Goldstein, A. S.; Drago, R. S. Inorg. Chem. 1991, 30, 4506.
(93) Ellis, P. E., Jr.; Lyons, J. E. Chromium-haloporphyrin complexes for the oxidation of butane to methyl ethyl ketone; (Sun Refining and Marketing Co., USA). Application: US, 1990; pp 4 pp.
(94) Barton, D. H. R.; Taylor, D. K. Stereoselective Reactions of Metal-Activated Molecules, Proceedings of the Symposium, 2nd, Wuerzburg, Germany, Sept. 21-23, 1994 1995, 3.
(95) Attanasio, D.; Suber, L.; Shul'pin, G. B. Izvestiya Akademi Nauk, Seriya Khimicheskaya 1992, 1918.
(96) Chambers, R. C.; Hill, C. L. Inorg. Chem. 1989, 28, 2509.
(97) Shul'pin, G. B.; Kats, M. M. Zhurnal Obshchei Khimii 1989, 59, 2738.
(98) Shul'pin, G. B.; Druzhinina, A. N. Izvestiya Akademii Nauk SSSR, Seriya Khimicheskaya 1989, 1185.
(99) Shul'pin, G. B.; Druzhinina, A. N.; Nizova, G. V. Izvestiya Akademii Nauk SSSR, Seriya Khimicheskaya 1991, 2463.
(100)Nizova, G. V.; Shul'pin, G. B. Zhurnal Obshchei Khimii 1990, 60, 2124.
(101)Shul'pin, G. B.; Nizova, G. V. React. Kinet. Catal. Lett. 1991, 45, 7.
(102)Shul'pin, G. B.; Nizova, G. V.; Kats, M. M. Zhurnal Obshchei Khimii 1990, 60, 2730.
(103)Carp, O.; Huisman, C. L.; Reller, A. Prog. Solid State Chem. 2004, 32, 33.
(104)Pichat, P. Catal. Today 1994, 19, 313.
(105)Parker, V. D. J. Am. Chem. Soc. 1992, 114, 7458.
(106)Boarini, P.; Carassiti, V.; Maldotti, A.; Amadelli, R. Langmuir 1998, 14, 2080.
(107)Almquist, C. B.; Biswas, P. Appl. Catal., A 2001, 214, 259.
(108)Cermenati, L.; Dondi, D.; Fagnoni, M.; Albini, A. Tetrahedron 2003, 59, 6409.
(109)Ohno, T.; Mitsui, T.; Matsumura, M. J. Photochem. Photobiol., A 2003, 160, 3.
(110)Macyk, W.; Kisch, H. Chem.-Eur. J. 2001, 7, 1862.
(111)Wang, C. M.; Mallouk, T. E. J. Phys. Chem. 1990, 94, 4276.
(112)Cunningham, J.; Al-Sayyed, G. J. Chem. Soc., Faraday Trans. 1990, 86, 3935.
(113)Theurich, J.; Lindner, M.; Bahnemann, D. W. Langmuir 1996, 12, 6368.
(114)Kisch, H.; Macyk, W. ChemPhysChem 2002, 3, 399.
(115)Kisch, H.; Zang, L.; Lange, C.; Maier, W. F.; Antonius, C.; Meissner, D. Angew. Chem., Int. Ed. 1998, 37, 3034.
(116)Zang, L.; Lange, C.; Abraham, I.; Storck, S.; Maier, W. F.; Kisch, H. J. Phys. Chem. B 1998, 102, 10765.
155
(117)Macyk, W.; Burgeth, G.; Kisch, H. Photochem. Photobiol. Sci. 2003, 2, 322.
(118)Cundari, T. R.; Moody, E. W. THEOCHEM 1998, 425, 43.
(119)Kortuem, G.; Braun, W.; Herzog, G. Angew. Chem. 1963, 75, 653.
(120)Edreva- Kardjieva, R. Bulg. Chem. Commun. 1992, 25, 166.
(121)Tauc, J.; Grigorovici, R.; Vancu, A. Physica Status Solidi 1966, 15, 627.
(122)Alimarin, I. P.; Shlenskaya, V. I.; Efremenko, O. A. Zh. Neorg. Khim. 1970, 15, 1040.
(123)Szacilowski, K.; Macyk, W.; Stochel, G. J. Mater. Chem. 2006, 16, 4603.
(124)Nozik, A. J.; Memming, R. J. Phys. Chem. 1996, 100, 13061.
(125)Gerischer, H. Z. Phys. Chem. 1960, 26, 223.
(126)Gerischer, H. Electrochim. Acta 1990, 35, 1677.
(127)Memming, R.; Moellers, F. Ber. Buns. Ges. Phys. Chem. 1972, 76, 475.
(128)Ward, M. D.; White, J. R.; Bard, A. J. J. Am. Chem. Soc. 1983, 105, 27.
(129)White, J. R.; Bard, A. J. J. Phys. Chem. 1985, 89, 1947.
(130)Finlayson, M. F.; Wheeler, B. L.; Kakuta, N.; Park, K. H.; Bard, A. J.; Campion, A.; Fox, M. A.; Webber, S. E.; White, J. M. J. Phys. Chem. 1985, 89, 5676.
(131)Roy, A. M.; De, G. C.; Sasmal, N.; Bhattacharyya, S. S. Int. J. Hydrogen Energy 1995, 20, 627.
(132)Bolts, J. M.; Wrighton, M. S. J. Phys. Chem. 1976, 80, 2641.
(133)Sakthivel, S.; Kisch, H. Angew. Chem., Int. Ed. 2003, 42, 4908.
(134)Sakthivel, S.; Kisch, H. ChemPhysChem 2003, 4, 487.
(135)Choi, W.; Termin, A.; Hoffmann, M. R. J. Phys. Chem. 1994, 98, 13669.
(136)Carraway, E. R.; Hoffman, A. J.; Hoffmann, M. R. Environ. Sci. Technol. 1994, 28, 786.
(137)Hoffman, A. J.; Carraway, E. R.; Hoffmann, M. R. Environ. Sci. Technol. 1994, 28, 776.
(138)Kormann, C.; Bahnemann, D. W.; Hoffmann, M. R. Environ. Sci. Technol. 1988, 22, 798.
(139)Platz, C.; Schimmelschmidt, K. DRP 735 096. In (I.G. Farben Industrie), 1940.
(140)Ullmann's Encyclopedia of industrial chemistry Wiley-VCH: Weinheim; Vol. A 25,772.
(141)Orthner, L. Angew. Chem. 1950, 62A, 302.
(142)Asinger, F. Paraffins, Chemistry and Technology, 1968.
(143)Ogata, Y.; Izawa, Y.; Tsuda, T. Tetrahedron 1965, 21, 1349.
(144)Ramloch, H.; Taeuber, G. Chemie in unserer Zeit 1979, 5, 157.
(145)Graf, R. Justus Liebigs Ann. Chem. 1952, 578, 50.
(146)Braun, M.; Maurette, M. T.; Oliveros, E. Photochemical Technology 1991, 354.
(147)Smith, G. W.; Williams, H. D. J. Org. Chem. 1961, 26, 2207.
(148)Sidebottom, H. W.; Badcock, C. C.; Calvert, J. C.; Rabe, B. R.; Damon, E. K. J. Am. Chem. Soc. 1971, 93, 3121.
(149)Asinger, F.; Geiseler, F.; Eckoldt, H. Chem. Ber. 1956, 89, 1037.

156
(150)Asinger, F.; Fell, B.; Pottkaemper, S. Chem. Ber. 1964, 97, 3092.
(151)Schimmelschmidt, K.; Cramer, G.; Graf, R. DRP.-Anm. J 68893. In Farbenindustrie A.G., 1941.
(152)Orthner, L.; Wagner, H.; Gruschke, H. DRP.-Anm. J 69611. In I. G. Farbenindustrie A.G., 1941.
(153)Weghofer, H. Fette und Seifen 1952, 54, 260.
(154)Roesinger, S. Chem. Ing. Tech. 1970, 42, 1236.
(155)Ferguson, R. R.; Crabtree, R. H. J. Org. Chem. 1991, 56, 5503.
(156)Burgeth, G. PhD thesis, Friedrich - Alexander Universität, 2002.
(157)Ramakrishnan, A. phD thesis, Friedrich - Alexander Universität, 2006.
(158)Sakthivel, S.; Janczarek, M.; Kisch, H. J. Phys. Chem. B 2004, 108, 19384.
(159)Dai, Z.; Burgeth, G.; Parrino, F.; Kisch, H. Journal of Organometallic Chemistry, in press 2008.
(160)Larson, J. R. J. Chromatogr. 1986, 356, 379.
(161)Small, H.; Miller, T. E., Jr. Anal. Chem. 1982, 54, 462.
(162)Shang, J.; Zhu, Y.; Du, Y.; Xu, Z. J. Solid State Chem. 2002, 166, 395.
(163)Nelson, B. P.; Candal, R.; Corn, R. M.; Anderson, M. A. Langmuir 2000, 16, 6094.
(164)Abdullah, M.; Low, G. K. C.; Matthews, R. W. J. Phys. Chem. 1990, 94, 6820.
(165)Janczyk, A.; Krakowska, E.; Stochel, G.; Macyk, W. J. Am. Chem. Soc. 2006, 128, 15574.
(166)Mrowetz, M.; Selli, E. Phys. Chem. Chem. Phys. 2005, 7, 1100.
(167)Minero, C.; Mariella, G.; Maurino, V.; Vione, D.; Pelizzetti, E. Langmuir 2000, 16, 8964.
(168)Minero, C.; Mariella, G.; Maurino, V.; Pelizzetti, E. Langmuir 2000, 16, 2632.
(169)Chen, Y.; Yi, J.; Li, W.; Jin, R.; Tang, S.; Hu, W. Catal. Today 1999, 50, 39.
(170)Thornton, G. Vacuum 1992, 43, 1133.
(171)Sayago, D. I.; Serrano, P.; Bohme, O.; Goldoni, A.; Paolucci, G.; Roman, E.; Martin-Gago, J. A. Phys. Rev. B: Condens. Matter Mater. Phys. 2001, 64, 205402/1.
(172)Jing, L.; Xin, B.; Yuan, F.; Wang, B.; Shi, K.; Cai, W.; Fu, H. Appl. Catal., A 2004, 275, 49.
(173)Yanagisawa, Y. Appl. Surf. Sci. 1997, 115, 377.
(174)Casarin, M.; Ferrigato, F.; Maccato, C.; Vittadini, A. J Phys Chem B FIELD Full Journal Title:The journal of physical chemistry. B 2005, 109, 12596.
(175)Chang, C. C. J. Catal. 1978, 53, 374.
(176)Thierry, D.; Robert, V. GB 2112597A, 1981.
(177)Sayago, D. I.; Serrano, P.; Bohme, O.; Goldoni, A.; Paolucci, G.; Roman, E.; Martin-Gago, J. A. Surf. Sci. 2001, 482-485, 9.
(178)Schiller, M.; Muller, F. W.; Damm, C. J. Photochem. Photobiol., A 2002, 149, 227.
(179)Karl, N. Organic semiconductors, 1974; Vol. 14.
(180)Docherty, K. S.; Ziemann, P. J. Aerosol Sci. Technol. 2003, 37, 877.
(181)Asmus, K. D.; Fendler, J. H. J. Phys. Chem. 1968, 72, 4285.
157
(182)Asmus, K. D.; Gruenbein, W.; Fendler, J. H. J. Am. Chem. Soc. 1970, 92, 2625.
(183)Thavasi, V.; Leong, L. P.; Bettens, R. P. A. J. Phys. Chem. A 2006, 110, 4918.
(184)Ishii, Y.; Matsunaka, K.; Sakaguchi, S. J. Am. Chem. Soc. 2000, 122, 7390.
(185)Wang, Y.; Hang, K.; Anderson, N. A.; Lian, T. J. Phys. Chem. B 2003, 107, 9434.
(186)Rajh, T.; Chen, L. X.; Lukas, K.; Liu, T.; Thurnauer, M. C.; Tiede, D. M. J. Phys. Chem. B 2002, 106, 10543.
(187)Kamat, P. V. Langmuir 1985, 1, 608.
(188)Takahara, Y. K.; Hanada, Y.; Ohno, T.; Ushiroda, S.; Ikeda, S.; Matsumura, M. J. Appl. Electrochem. 2005, 35, 793.
(189)Good, A.; Thynne, J. C. J. Trans. Farad. Soc. 1967, 63, 2720.
(190)Muggli, D. S.; Falconer, J. L. J. Catal. 1999, 187, 230.
(191)Bahnemann, D. W.; Kholuiskaya, S. N.; Dillert, R.; Kulak, A. I.; Kokorin, A. I. Appl. Catal., B 2002, 36, 161.
(192)Wang, C.-y.; Groenzin, H.; Shultz, M. J. J. Am. Chem. Soc. 2005, 127, 9736.
(193)Arana, J.; Rodriguez, J. M. D.; Diaz, O. G.; Melian, J. A. H.; Rodriguez, C. F.; Pena, J. P. Appl. Catal., A 2006, 299, 274.
(194)Backes, M. J.; Lukaski, A. C.; Muggli, D. S. Appl. Catal., B 2005, 61, 21.
(195)Yamazaki, S.; Tanaka, S.; Tsukamoto, H. J. Photochem. Photobiol., A 1999, 121, 55.
(196)Einaga, H.; Ibusuki, T.; Futamura, S. Environ. Sci. Technol. 2004, 38, 285.
(197)Martra, G.; Coluccia, S.; Marchese, L.; Augugliaro, V.; Loddo, V.; Palmisano, L.; Schiavello, M. Catal. Today 1999, 53, 695.
(198)Fu, X.; Zeltner, W. A.; Anderson, M. A. Appl. Catal., B 1995, 6, 209.
(199)Jo, M. Journal of Surface Analysis 1999, 5, 106.
(200)Lindstrom, H.; Magnusson, E.; Holmberg, A.; Sodergren, S.; Lindquist, S.-E.; Hagfeldt, A. Sol. Energy Mater. Sol. Cells 2002, 73, 91.