
Business 205. Review Two Group Independent Sample T-test Using Excel’s Add-In for Statistical...
26
Business 205
-
date post
19-Dec-2015 -
Category
Documents
-
view
215 -
download
0
Transcript of Business 205. Review Two Group Independent Sample T-test Using Excel’s Add-In for Statistical...

Business 205

Review
Two Group Independent Sample T-testUsing Excel’s Add-In for Statistical
AnalysisEntering in Survey Responses

Preview
Analysis of Variance (ANOVAs)

Designing Experiments
Random Sample
Took a job satisfaction survey
Took a job satisfaction survey
Interacted with a manager
Didn’t interact with a manager
What tests could your use to run an analysis of the survey data?
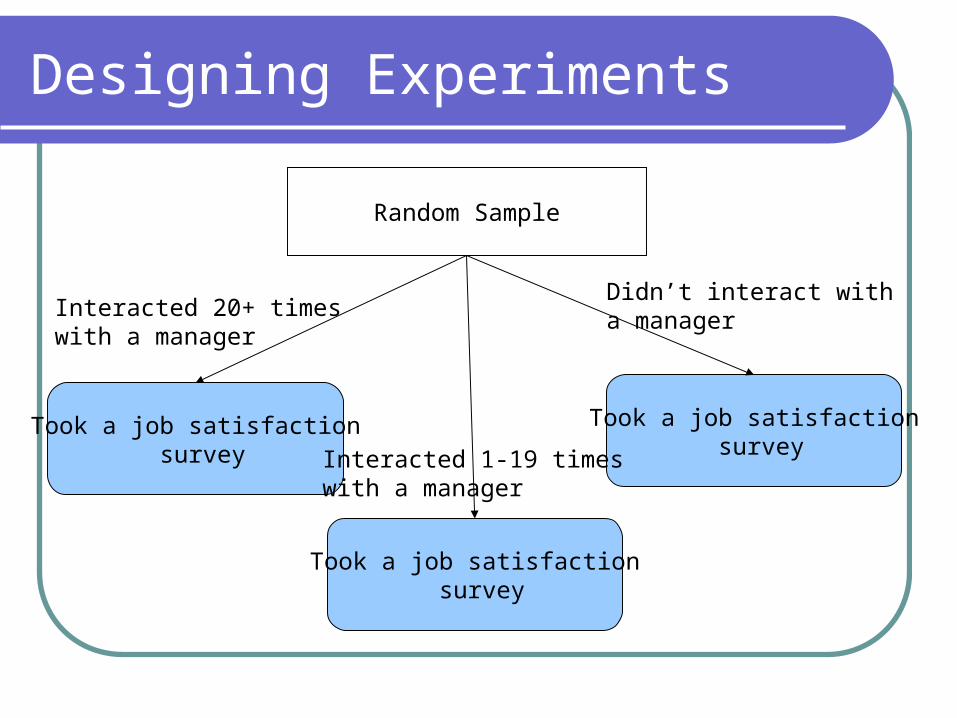
Designing Experiments
Random Sample
Took a job satisfaction survey
Took a job satisfaction survey
Interacted 20+ timeswith a manager
Didn’t interact with a manager
Took a job satisfaction survey
Interacted 1-19 timeswith a manager
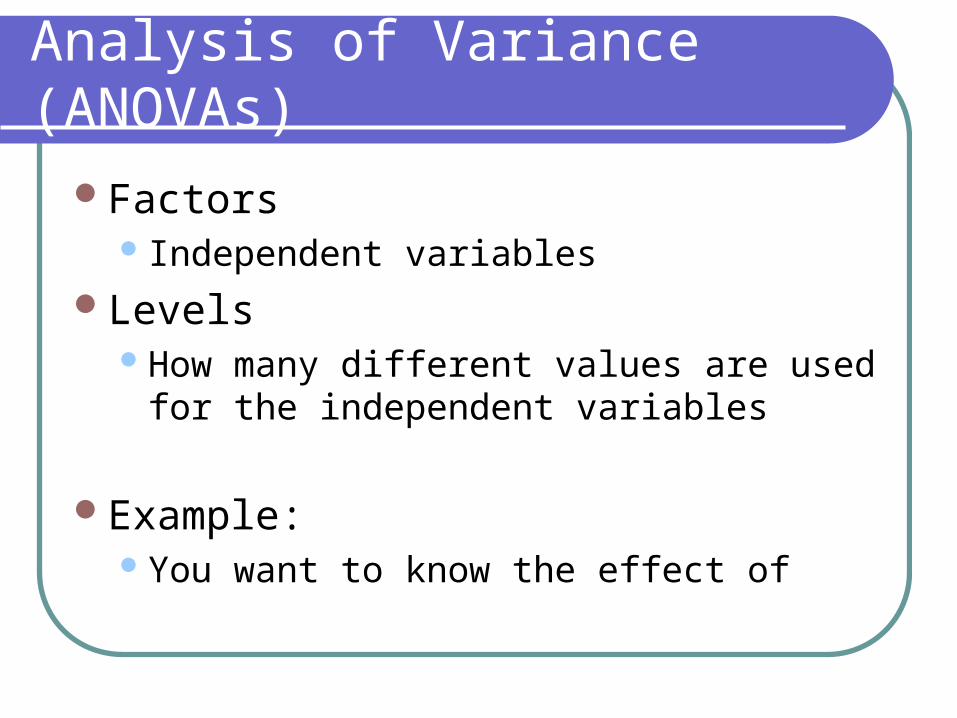
Analysis of Variance (ANOVAs)
Factors Independent variables
LevelsHow many different values are used for the
independent variables
Example:You want to know the effect of

Designing Experiments
Random Sample
Took a job satisfaction survey
Took a job satisfaction survey
Interacted 20+ timeswith a manager
Didn’t interact with a manager
Took a job satisfaction survey
Interacted 1-19 timeswith a manager
What are the factors? How many levels are there?
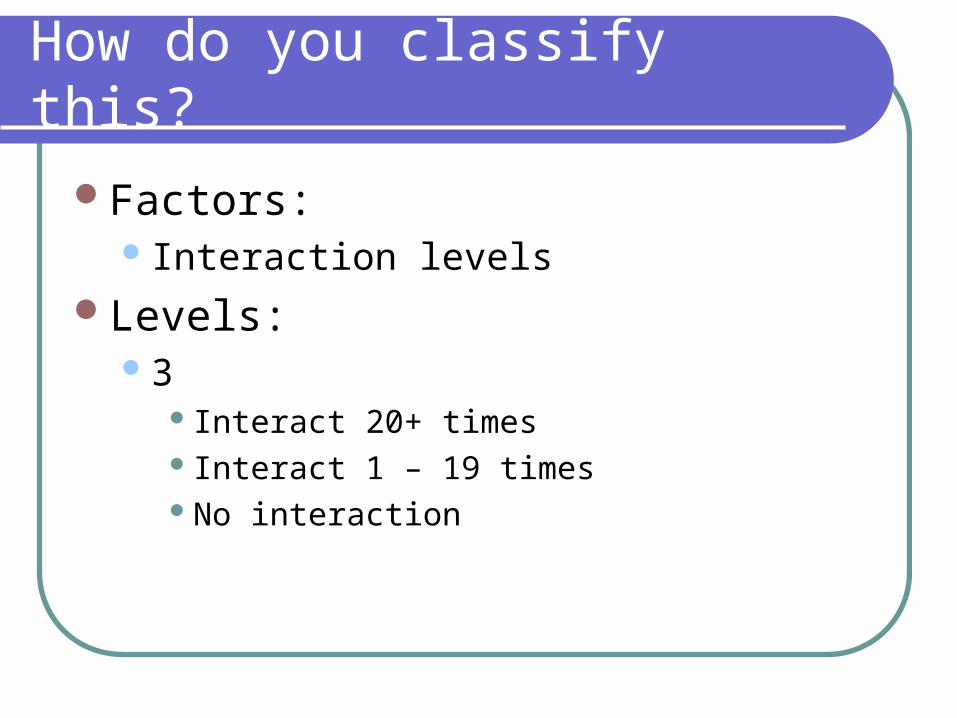
How do you classify this?
Factors: Interaction levels
Levels: 3
Interact 20+ times Interact 1 – 19 timesNo interaction

Try a few…
Example 1:You are test marketing different colas and
want to see which one a consumer would enjoy more. You tell them to taste New Coke, Coke Classic, Diet Coke, Coke with Lime.
What is your factor? What is the dependent variable?What is the level?
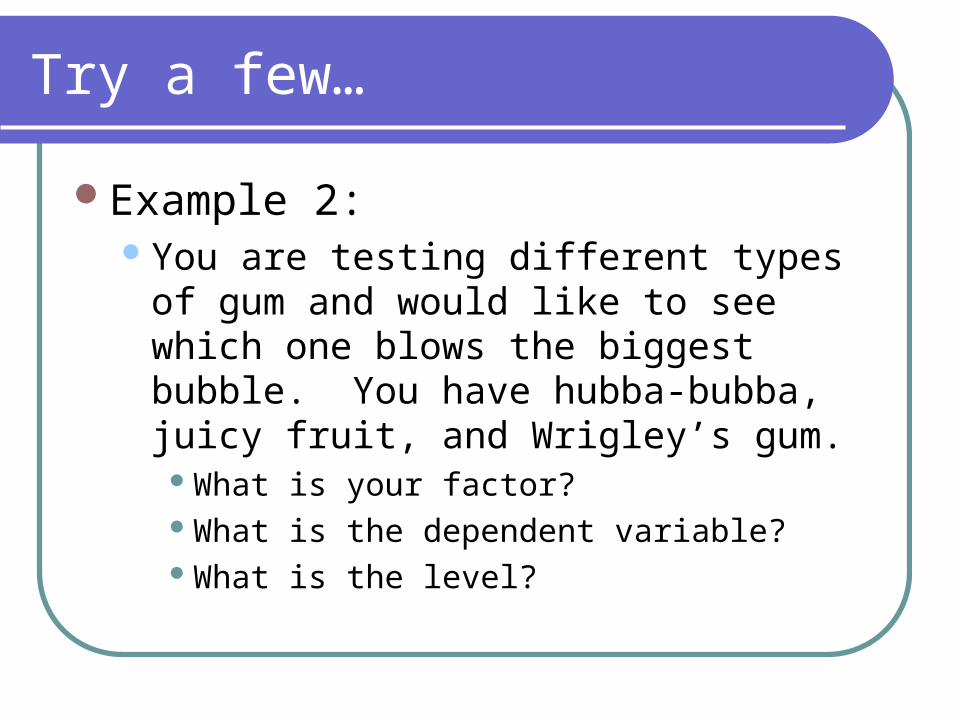
Try a few…
Example 2:You are testing different types of gum and
would like to see which one blows the biggest bubble. You have hubba-bubba, juicy fruit, and Wrigley’s gum.
What is your factor? What is the dependent variable?What is the level?

Components of an ANOVA
Symbol Definition
k number of treatment conditions
n number in each treatment condition
N total number in the study (across all conditions)
T sum of each individual score per treatment
SS sum of squares (X – Mean)2 for each treatment
G grand total; sums of all scores in an experiment
∑X2 each individual score squared then summed for each treatment

Formulas
k = ∑ all treatments N = ∑ n for all treatments n = number of scores in each INDIVIDUAL
treatment T = ∑ X (all scores in each INDIVIDUAL treatment) SS = ∑ (X-M)2 for each treatment M = mean for each treatment G = ∑ T ∑ (X2) = sum of all individual scores squared in all
treatments

Degrees Freedom
dfbetween = k - 1
dfwithin = N - k
dftotal = dfbetween + dfwithin
dftotal = N - 1

Sums of Squares Formulas
withinbetweentotal SSSSSS
N
GXSStotal
22 )(
nwithin SSSSSSSSSS ...21menteach treat inside
N
G
n
TSSbetween
22
)(
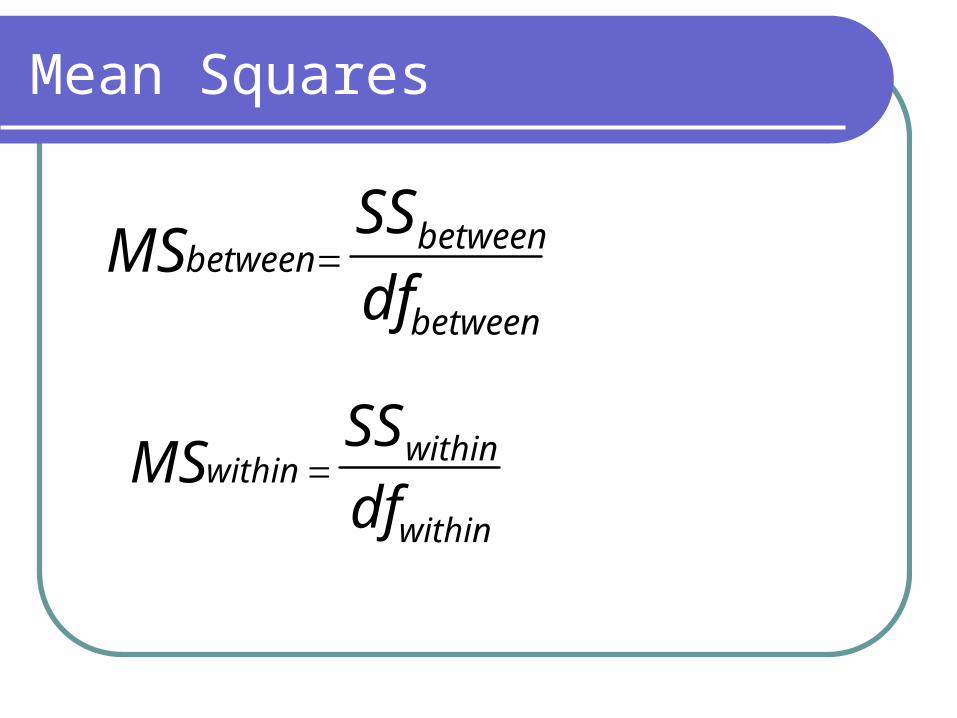
Mean Squares
between
betweenbetween
df
SSMS
within
withinwithin
df
SSMS

ANOVA F-Ratio
within
between
MS
MSF

For example…
You want to see if the office temperature affects employees’ ability to perform their job. You decided to set the temperature of the room at 50, 75, and 90 degrees.
What is the hypothesis?
What is the factor?
What is the level?
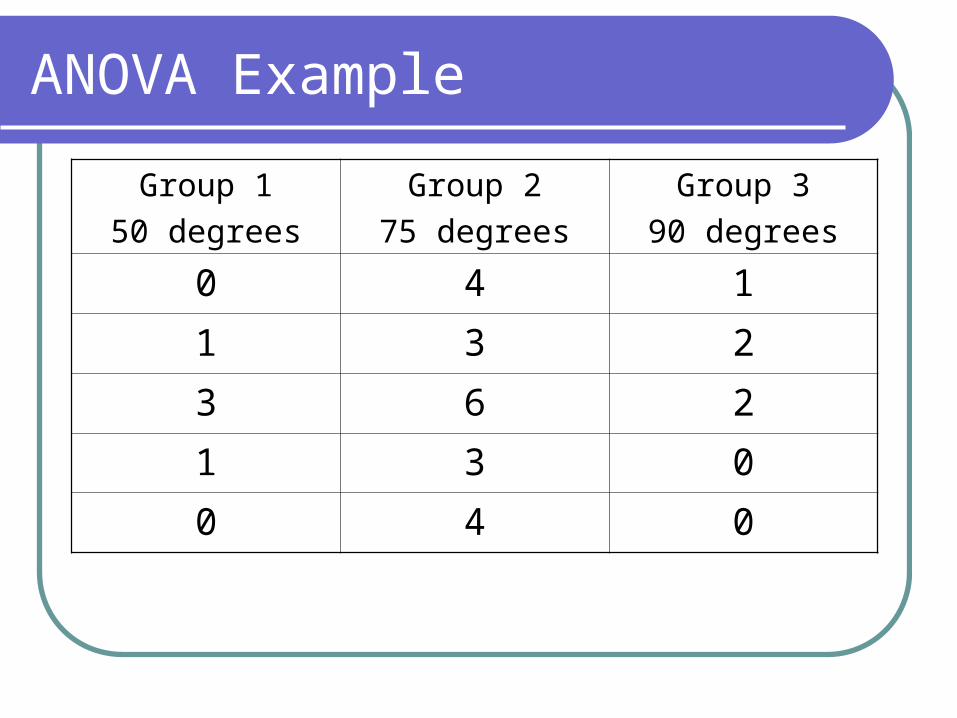
ANOVA Example
Group 1
50 degrees
Group 2
75 degrees
Group 3
90 degrees
0 4 1
1 3 2
3 6 2
1 3 0
0 4 0
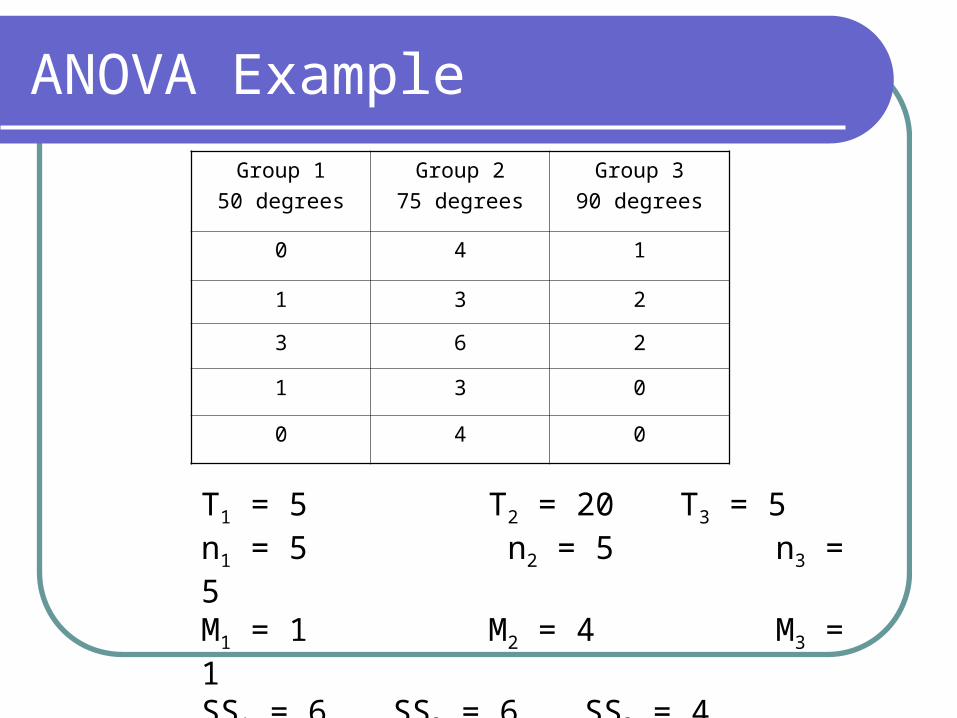
ANOVA Example
Group 1
50 degrees
Group 2
75 degrees
Group 3
90 degrees
0 4 1
1 3 2
3 6 2
1 3 0
0 4 0
T1 = 5 T2 = 20 T3 = 5n1 = 5 n2 = 5 n3 = 5M1 = 1 M2 = 4 M3 = 1SS1 = 6 SS2 = 6 SS3 = 4

ANOVA Example
T1 = 5 T2 = 20 T3 = 5n1 = 5 n2 = 5 n3 = 5M1 = 1 M2 = 4 M3 = 1SS1 = 6 SS2 = 6 SS3 = 4
G = 5 + 20 + 5 = 30N = 15k = 3∑(X2) = 106

ANOVA Example
dfbetween = k - 1 = 3 – 1 = 2dfwithin = N – k = 15 – 3 = 12dftotal = N – 1 = 15 – 1 = 14
SSbetween =[(25/5)+(400/5)+(25/5)] – (900/15) = 30
SSwithin = 6 + 6 + 4 = 16SStotal = 30 + 16 = 46

ANOVA Example
MSbetween = 30/2 = 15
MSwithin= 16/12 = 1.33
F = 15/1.33 = 11.28
Fcritical (2, 12) = ± 3.88

ANOVA Example
11.28
We accept our hypothesis; it is statistically significant.

Reporting Results in Table Form
-------------------------------------------------------------------------ANOVA summary
Source SS df MS-------------------------------------------------------------------------Between treatments 30 2 15 F = 11.28Within treatments 16 12 1.33Total 46 14-------------------------------------------------------------------------
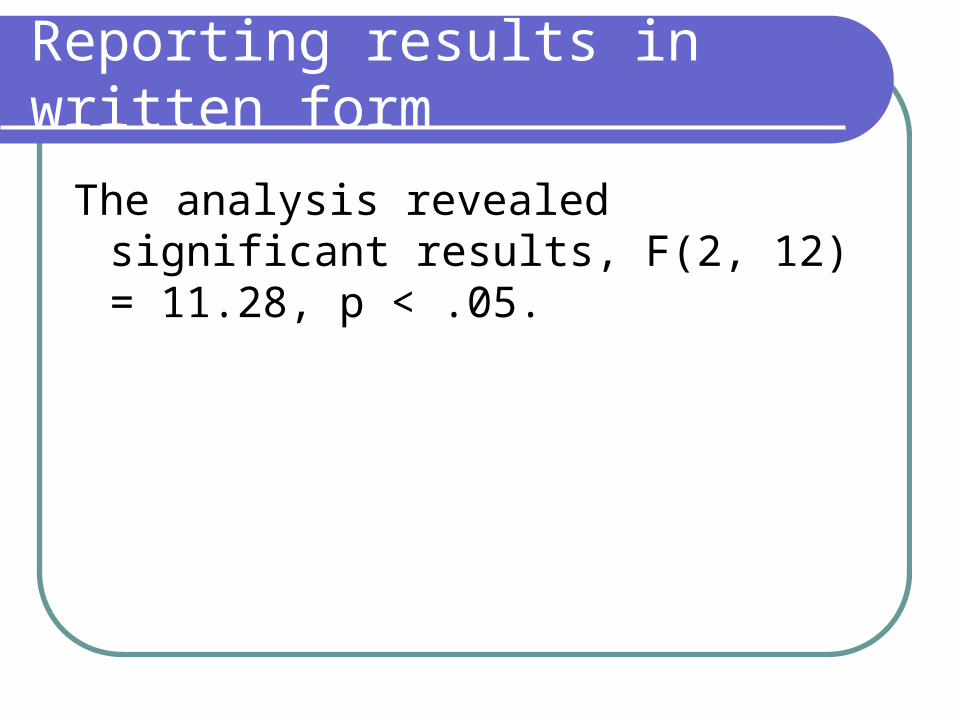
Reporting results in written form
The analysis revealed significant results, F(2, 12) = 11.28, p < .05.
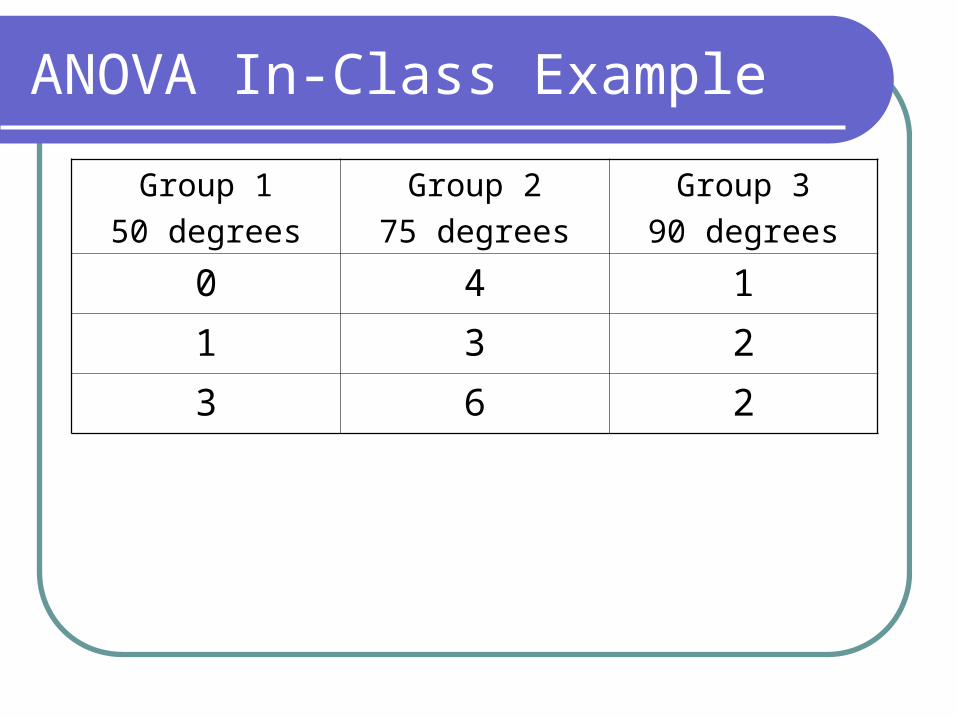
ANOVA In-Class Example
Group 1
50 degrees
Group 2
75 degrees
Group 3
90 degrees
0 4 1
1 3 2
3 6 2


![BAGIAN 1 PENGENALAN & INSTALASI · Terminal sdn@sdn-VirtualBox: — mtntnet/uttl/tnstall.sh -a Making install in cbench make[l]: Entering directory ' make[2]: Entering directory '](https://static.fdocument.pub/doc/165x107/5b15b8007f8b9afb0a8dd492/bagian-1-pengenalan-instalasi-terminal-sdnsdn-virtualbox-mtntnetuttltnstallsh.jpg)
