Bulletin of Labor Force Survey Results - الرئيسية of Labor... · Web viewBulletin of Labor...
27
Bulletin of Labor Force Survey Results 2014 0
Transcript of Bulletin of Labor Force Survey Results - الرئيسية of Labor... · Web viewBulletin of Labor...
Bulletin of Labor Force Survey Results
2014
Population Statistics SectionOctober, 2015
IntroductionThe statistics of labor force have a great importance in providing basic information about the workforce size and their social, economic and
0
demographic characteristics, which in turn, make the planning to the development of human resources possible and identifying the available workforce size during a specific period of time, and its convenience to the requirements and needs of the labor market, in addition to recognizing the level of training, qualification and skills among the population. The data collected during different times constitute the base to monitoring the current trends and the changes on the labor market and the positions of employment; in addition to these data, the other data about the economic aspects of the national economy constitutes the fundamental base to analyzing and evaluating the microeconomic policies, where the unemployment rate became, for example, one of the most important standards of the current performance of the national economy.In the framework of the strategic plan of the Dubai Statistics Center, which considers that one of the most important priorities of the center is to provide the necessary statistical support to implement Dubai Strategic Plan 2015, in the light of the strategic transformation and the accelerated growth witnessed by Dubai in all sectors and at different levels, this support is represented in providing the statistical data on the various economic, social and demographic types with accuracy and right timing.In this context, Dubai Statistics Center gives a special importance to providing comprehensive statistical data about the labor force on a regular basis, according to the latest methodologies and international standards which enable the policy-makers and the decision-makers to planning for developing the human resources and control on the macroeconomic performance, and also provides a modern database and made it available to data users like researchers, businessmen and others consistently.Dubai Statistics Center is pleased to issue this bulletin about the results of labor force survey, which was executed by the center in 2014. It comes within a series of releases and periodic statistical reports covering the results of statistical surveys which was executed by the center periodically within its annual plan. Arif Obaid Al Mehairi Executive Director
1
Index PageIntroduction 1Contents 2Preface 3The main results of the Labor Force Survey 2014 4First: The characteristics of the population at the age of 15 years and over 4
1. Population 15 years and over who are economically active 42. Population 15 years and over who are economically inactive 5
Second: The characteristics of the population 15 years and over who are economically active 7Employees 8
Employees 15 years and over by age groups 8Employees 15 years and over by educational status 9Employees 15 years and over by marital status 11Employees 15 years and over by profession 13Employees 15 years and over by economic activity 14Employees 15 years and over by working status 15
Unemployed 16Unemployed 15 years and over by unemployment status 16Unemployed 15 years and over by age groups 17Unemployed 15 years and over by educational status 19Unemployed 15 years and over by marital status 20
Third: Population 15 years and over who economically inactive 21
House wife 22
PrefaceIn 2014, Dubai Statistics Center conducted a specialized survey about labor force within a series of economic, social and demographic surveys that are executed periodically within its annual plan, and taking into its account, during design and implementation, the latest methodologies and international standards. The main objectives of this survey have been determined as follows:
Estimating the labor force size.
2

Estimating the participation rates in the economic activity according to the various characteristics such as age, sex, level of education and scientific specialization, marital status, professional structure, training, wages levels and the work average of hours and days per week …..Etc.
Identifying the extent and levels of unemployment and estimating the rates of unemployment and dependency ratios according to the different characteristics.
Identifying the social, economic and demographic characteristics for the job seekers and their bearings.
The sample of the survey included the Emirati Households, non-Emirati Households, collective household and communities of workers, the sample size was (4,000 Households) distributed as follows: (2,000) Emirati Households and (2,000) non-Emirati Households, and also the communities of workers were (1,000) worker, it should be noted that the social, economic and demographic characteristics are the same characteristics which resulted from the sample;And due to the fact that the survey was carried out in a special way, so, the samples must have had differences between the characteristics of the samples after enlarging the results and the characteristics previously estimated for the population such as the census, administrative records or from any other source. These differences are attributed to two main reasons: 1. random errors 2. Systematic / Bias errors, so, these types of error repeated in all results of surveys executed in a sample system, the volume of these errors may differ from survey to another.
The main results of the Labor Force Survey 2014First: The characteristics of the population 15 years and overThe international labor organization (ILO) classified the population who aged or exceed the minimum level of measuring the economically active population "the age of fifteen" into three separate groups as follow: Employed and unemployed they are called the labor force or economically active population. The third group is the people who are not part of the labor force, if added to this group "third group", the population less than the minimum level of measuring the economically active population - a group of children under fifteen – they will constitute what called economically inactive population. The following presentation will be limited on the population permanently residing in Dubai, who are fifteen years and over, with reference to that the size of the labor force does not include the employees in Dubai and who reside in other emirates whose number is estimated about 875,000 workers, most of them non-UAE and constitute 36.5% of the total size of the labor operating in Dubai, which amount 2.4 million employees.
3
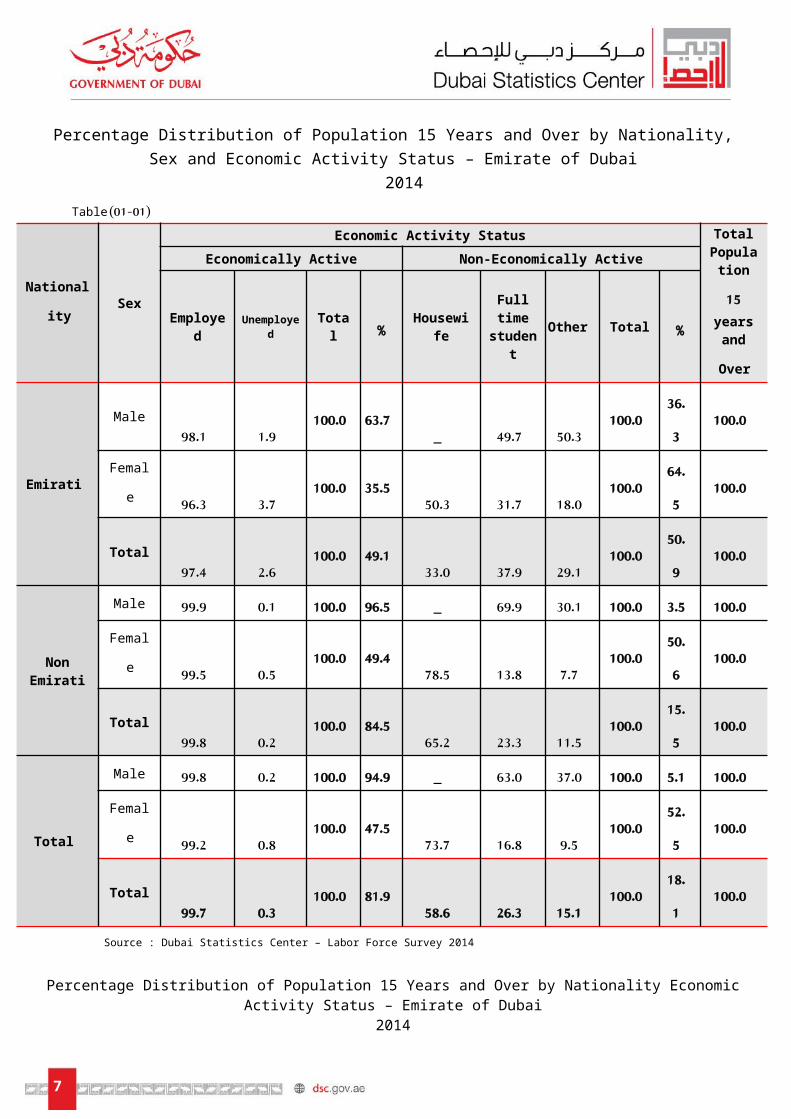
1. Population 15 years and over who are economically activeThe percentage of the economically active population (employed and unemployed) residing in Dubai, according to the survey results, reached to 81.9% of the total population 15 years and over in 2014, this percentage represents what is called the rate of the revised economic activity. On the other hand, the rate of the crude economic activity has reached to 69.2% of the total population permanently residing in Dubai, which amount (2,327,350) individuals in 2014, the data table (01-01) shows the relative distribution of the population 15 years and over who economically active between the UAE and non-UAE as follows:
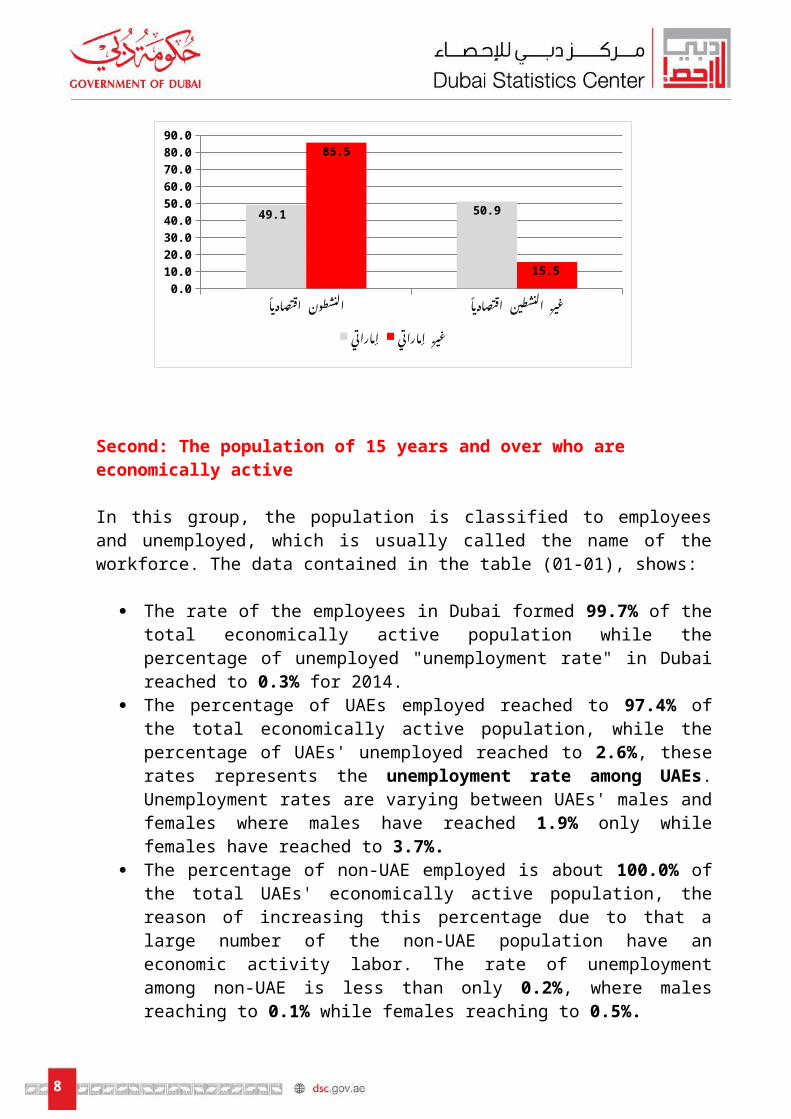
The percentage of the Emirati population of 15 years and over who are economically active reached to 49.1% of the total population of UAE 15 years and over, this percentage is the rate of the revised economic activity between the UAEs, this rate is different between males and females where the rate of the revised economic activity between Emirati males and females has reached to 63.7% for males vs. 35.5% for females.
The percentage of the non-Emirati population 15 years and over who economically active reached to 84.5% of the total non-Emirati population 15 years and over, this percentage represents the rate of the revised economic activity between non-Emirati where the rate of the revised economic activity between Emirati males and females has reached to 96.5% for males vs. 49.4% for females.
2. Population 15 years and over who economically inactiveThe percentage of the population of 15 years and over who are economically inactive has reached to 18.1% of the total population of 15 years and over. This group is distributed between the UAEs and non-UAEs population 15 years and over, as follows:
The percentage of Emirati population 15 years and over whom economically inactive 50.9% of the total UAE population 15 years and over, where the percentage of the economically inactive males reached to 36.3% of the total males, while the females' ratio was 64.5% of the total females.
The percentage of the non-Emirati population 15 years and over who economically inactive reached to 15.5% of the total non-UAE 15 years and over, where the percentage of the economically inactive males has reached to 3.5% of the total males, while the females ratio was 50.6% of the total females.
4
5
Percentage Distribution of Population 15 Years and Over by Nationality, Sex and Economic Activity Status – Emirate of Dubai
2014( 01-01 )Table
Total Populati
on15 years
and Over
Economic Activity Status
SexNationality
Non-Economically ActiveEconomically Active
%TotalOtherFull time studentHousewife%TotalUnemployedEmployed
100.036.3100.050.349.7_63.7100.01.998.1Male
Emirati 100.064.5100.018.031.750.335.5100.03.796.3Female
100.050.9100.029.137.933.049.1100.02.697.4Total
100.03.5100.030.169.9_96.5100.00.199.9Male
Non Emirati 100.050.6100.07.713.878.549.4100.00.599.5Female
100.015.5100.011.523.365.284.5100.00.299.8Total
100.05.1100.037.063.0_94.9100.00.299.8Male
Total 100.052.5100.09.516.873.747.5100.00.899.2Female
100.018.1100.015.126.358.681.9100.00.399.7Total
Source : Dubai Statistics Center – Labor Force Survey 2014
Percentage Distribution of Population 15 Years and Over by Nationality Economic Activity Status – Emirate of Dubai
2014
اقتصا8دي8ا8 ال8نشط8و8ن اقتصا8دي8ا8 ال8نشط8ين غير0.0
10.020.030.040.050.060.070.080.090.0
49.1 50.9
85.5
15.5
إما8رات8ي إما8رات8ي غير
Second: The population of 15 years and over who are economically active
6
In this group, the population is classified to employees and unemployed, which is usually called the name of the workforce. The data contained in the table (01-01), shows:
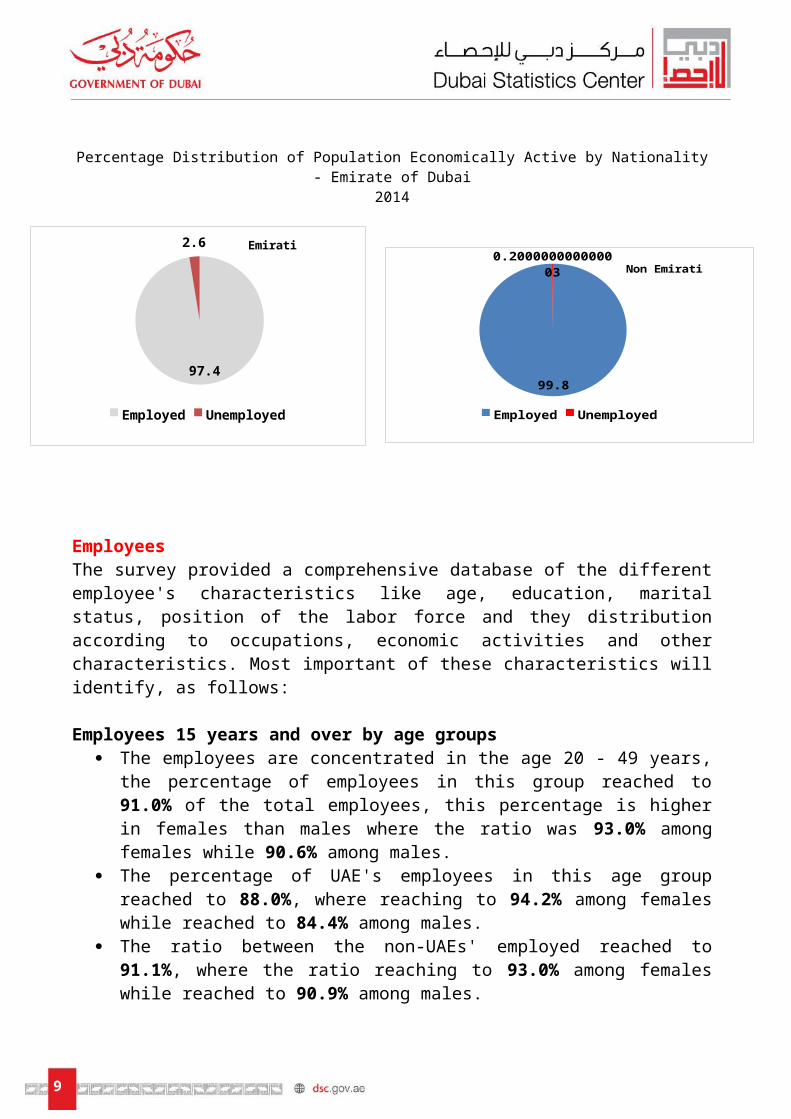
The rate of the employees in Dubai formed 99.7% of the total economically active population while the percentage of unemployed "unemployment rate" in Dubai reached to 0.3% for 2014.
The percentage of UAEs employed reached to 97.4% of the total economically active population, while the percentage of UAEs' unemployed reached to 2.6%, these rates represents the unemployment rate among UAEs. Unemployment rates are varying between UAEs' males and females where males have reached 1.9% only while females have reached to 3.7%.
The percentage of non-UAE employed is about 100.0% of the total UAEs' economically active population, the reason of increasing this percentage due to that a large number of the non-UAE population have an economic activity labor. The rate of unemployment among non-UAE is less than only 0.2%, where males reaching to 0.1% while females reaching to 0.5%.
Percentage Distribution of Population Economically Active by Nationality - Emirate of Dubai2014
97.4
2.6 Emirati
Employed Unemployed
99.8
0.200000000000003 Non Emirati
Employed Unemployed
EmployeesThe survey provided a comprehensive database of the different employee's characteristics like age, education, marital status, position of the labor force and they distribution according to occupations, economic activities and other characteristics. Most important of these characteristics will identify, as follows:
7
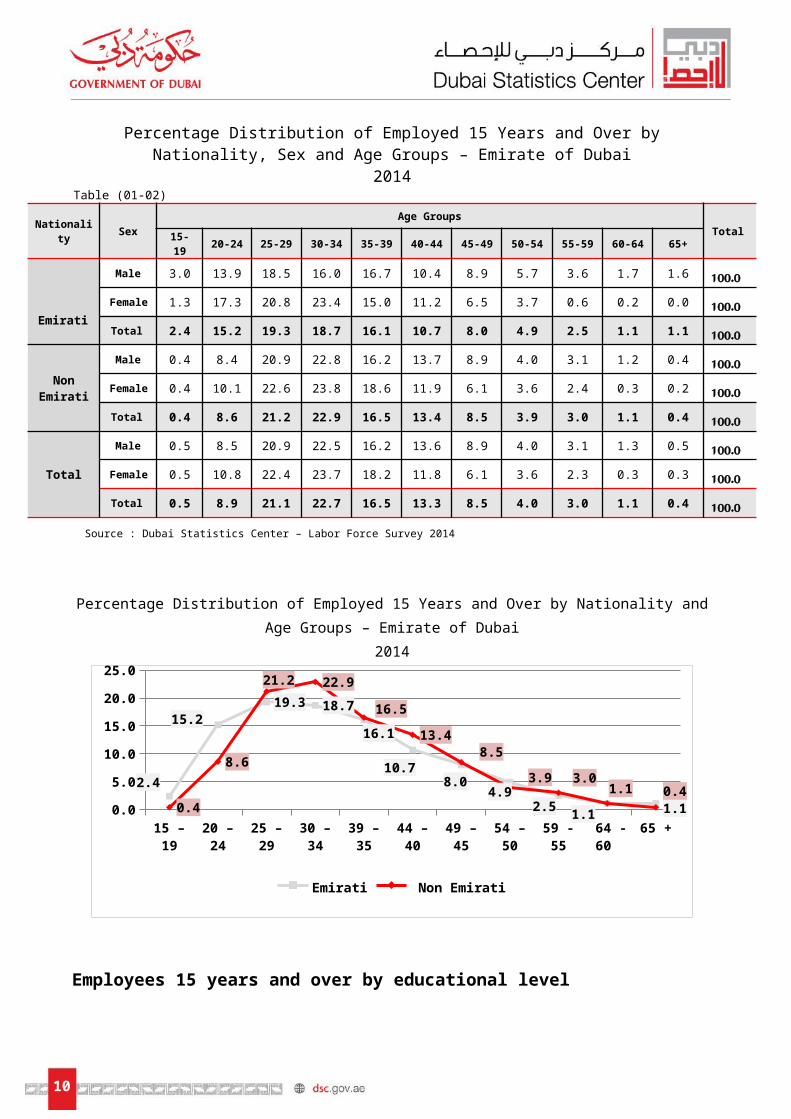
Employees 15 years and over by age groups The employees are concentrated in the age 20 - 49 years, the
percentage of employees in this group reached to 91.0% of the total employees, this percentage is higher in females than males where the ratio was 93.0% among females while 90.6% among males.
The percentage of UAE's employees in this age group reached to 88.0%, where reaching to 94.2% among females while reached to 84.4% among males.
The ratio between the non-UAEs' employed reached to 91.1%, where the ratio reaching to 93.0% among females while reached to 90.9% among males.
Percentage Distribution of Employed 15 Years and Over by Nationality, Sex and Age Groups – Emirate of Dubai
2014Table )01-02(
TotalAge Groups
SexNationality65+60-6455-5950-5445-4940-4435-3930-3425-2920-2415-19
100.01.61.73.65.78.910.416.716.018.513.93.0Male
Emirati100.
00.00.20.63.76.511.215.023.420.817.31.3Female
100.01.11.12.54.98.010.716.118.719.315.22.4 Total
100.00.41.23.14.08.913.716.222.820.98.40.4Male
Non Emirati
100.00.20.32.43.66.111.918.623.822.610.10.4Female
100.00.41.13.03.98.513.416.522.921.28.60.4 Total
100.00.51.33.14.08.913.616.222.520.98.50.5Male
Total 100.00.30.32.33.66.111.818.223.722.410.80.5Female
100.00.41.13.04.08.513.316.522.721.18.90.5 Total
Source : Dubai Statistics Center – Labor Force Survey 2014
Percentage Distribution of Employed 15 Years and Over by Nationality and Age Groups – Emirate of Dubai
2014
8
15 – 19 20 – 24 25 – 29 30 – 34 39 – 35 44 – 40 49 – 45 54 – 50 59 - 55 64 - 60 65 +0.0
5.0
10.0
15.0
20.0
25.0
2.4
15.2
19.3 18.7
16.1
10.78.0
4.92.5
1.1 1.10.4
8.6
21.2 22.9
16.5
13.4
8.5
3.9 3.01.1 0.4
Emirati Non Emirati
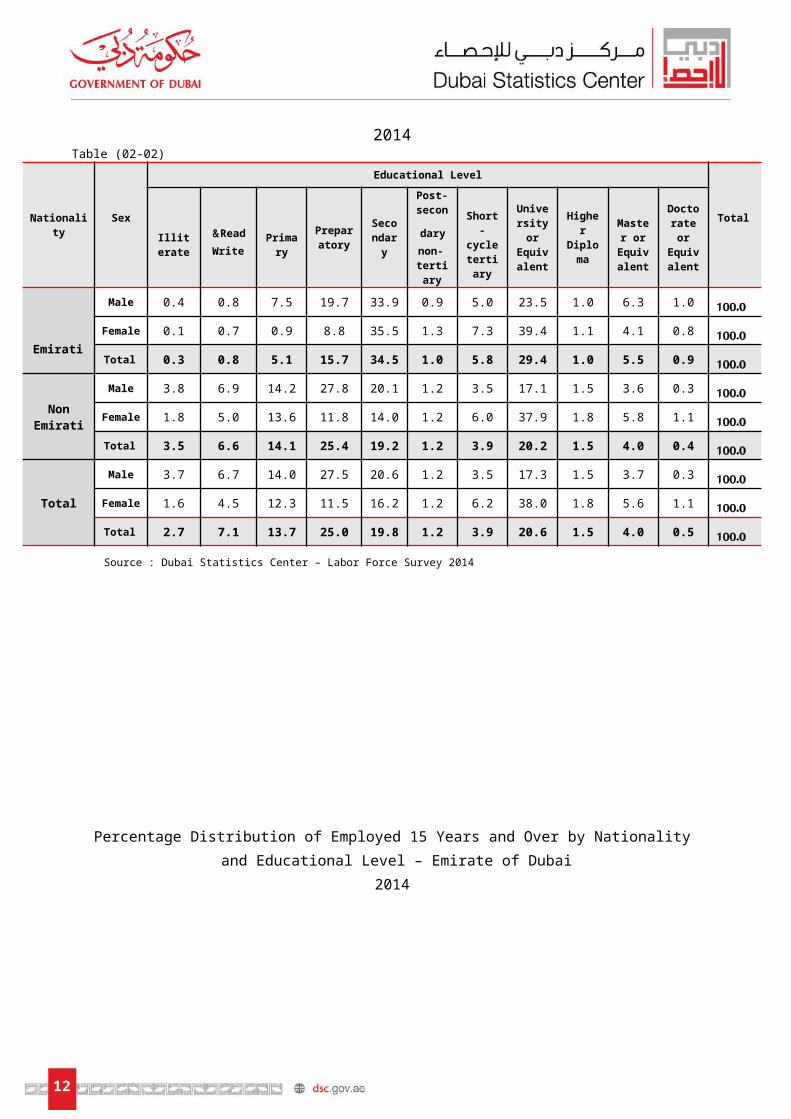
Employees 15 years and over by educational level The percentage of the employees according to educational level
varies considerably between Emiratis and non-Emiratis and between males and females. The percentage of employees who have got Prep-education and below is 48.5%; in males reached 51.9% while in females 29.9%. The percentage of employees who have got secondary and post-secondary education without university is 24.9%; in males reached 25.3% in while 23.6% in females. The percentage of an employees who have got college degree or higher is 26.6%; in females 46.5% while in males 22.8%.
The percentage of Emirati employees who have got Prep-education and below is 21.9%; in females 10.5% only while increasing in males to 28.4%, we can notice that the percentage of the employee women who illiterate is only 0.1%, the percentage of employees who have got secondary and post-secondary education without university is 41.3%; reached to 44.1% in females while 39.8% in males. The percentage of employees who have got college degree or higher reached 36.8%, in females higher than males; where females reached 45.4% compared with 31.8% among males.
The educational level of non-UAE employees is different from UAE employees, where the percentage of non-UAE employees which have prep-education and below educational cases have reached 49.6%; in females about 32.2% in males about 52.7%. The non-UAE employees distributed in other educational cases similar to their general distribution which presented at the beginning of this paragraph, the educational cases of secondary and post-secondary
9
education without university have reached 24.3%; in males 24.8% while 21.2% in females. The educational cases of college degree or higher have reached 26.1%; in males 22.5% while females 46.6%.
Percentage Distribution of Employed 15 Years and Over by Nationality, Sex andEducational Level – Emirate of Dubai
2014Table )02-02(
Total
Educational Level
SexNationality Doctorate or Equiva
lent
Master
or Equiva
lent
Higher Diploma
University or Equiva
lent
Short-cycle tertiar
y
Post-secondary
non-tertiar
y
Secondary
Preparatory
Primar
y
Read & Write
Illiterat
e
100.01.06.31.023.55.00.933.919.77.50.80.4Male
Emirati100.
00.84.11.139.47.31.335.58.80.90.70.1Female
100.00.95.51.029.45.81.034.515.75.10.80.3 Total
100.00.33.61.517.13.51.220.127.814.26.93.8Male
Non Emirati
100.01.15.81.837.96.01.214.011.813.65.01.8Female
100.00.44.01.520.23.91.219.225.414.16.63.5 Total
100.00.33.71.517.33.51.220.627.514.06.73.7Male
Total 100.01.15.61.838.06.21.216.211.512.34.51.6Female
100.00.54.01.520.63.91.219.825.013.77.12.7 Total
Source : Dubai Statistics Center – Labor Force Survey 2014
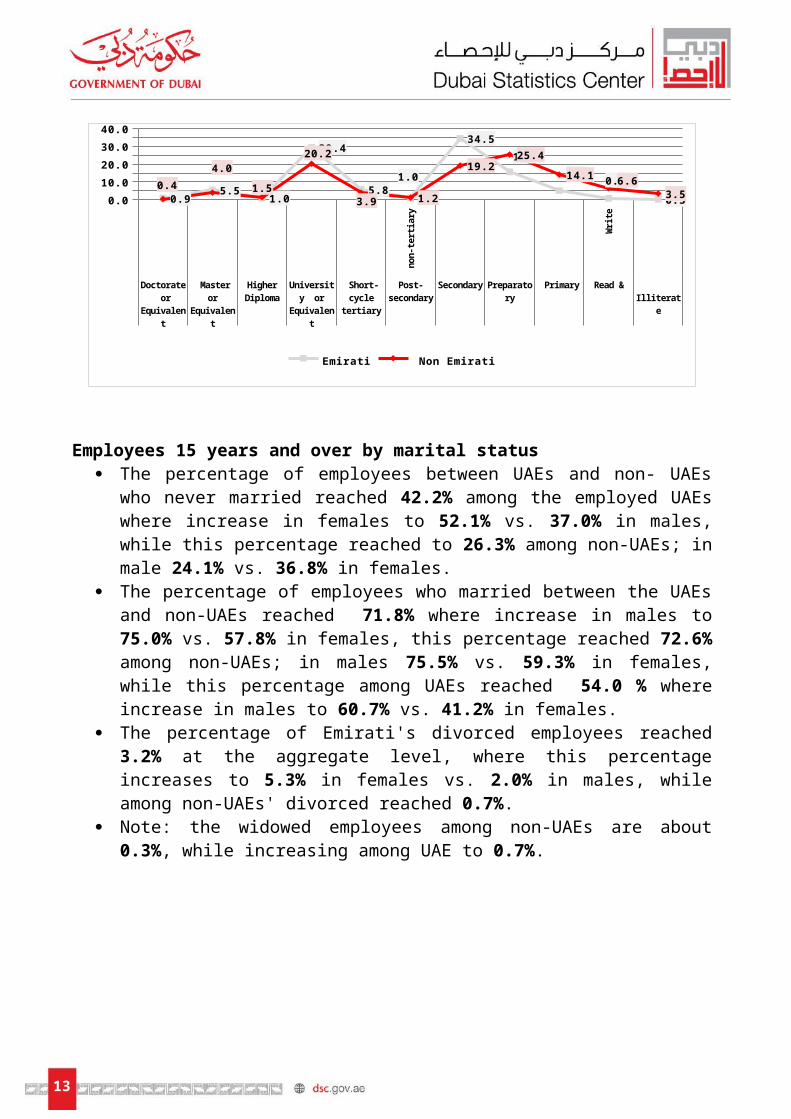
Percentage Distribution of Employed 15 Years and Over by Nationality and Educational Level – Emirate of Dubai
2014
10
non
-terti
ary
Writ
e
Doctorate or Equiva-
lent
Master or Equivalent
Higher Diploma
University or Equiva-
lent
Short-cycle tertiary
Post-sec-
ondary
Secondary Preparatory Primary Read & Illiterate
0.05.0
10.015.020.025.030.035.040.0
0.95.5
1.0
29.4
5.8 1.0
34.5
15.7
5.10.8
0.30.4
4.0
1.5
20.2
3.9 1.2
19.2
25.4
14.16.6
3.5
Emirati Non Emirati
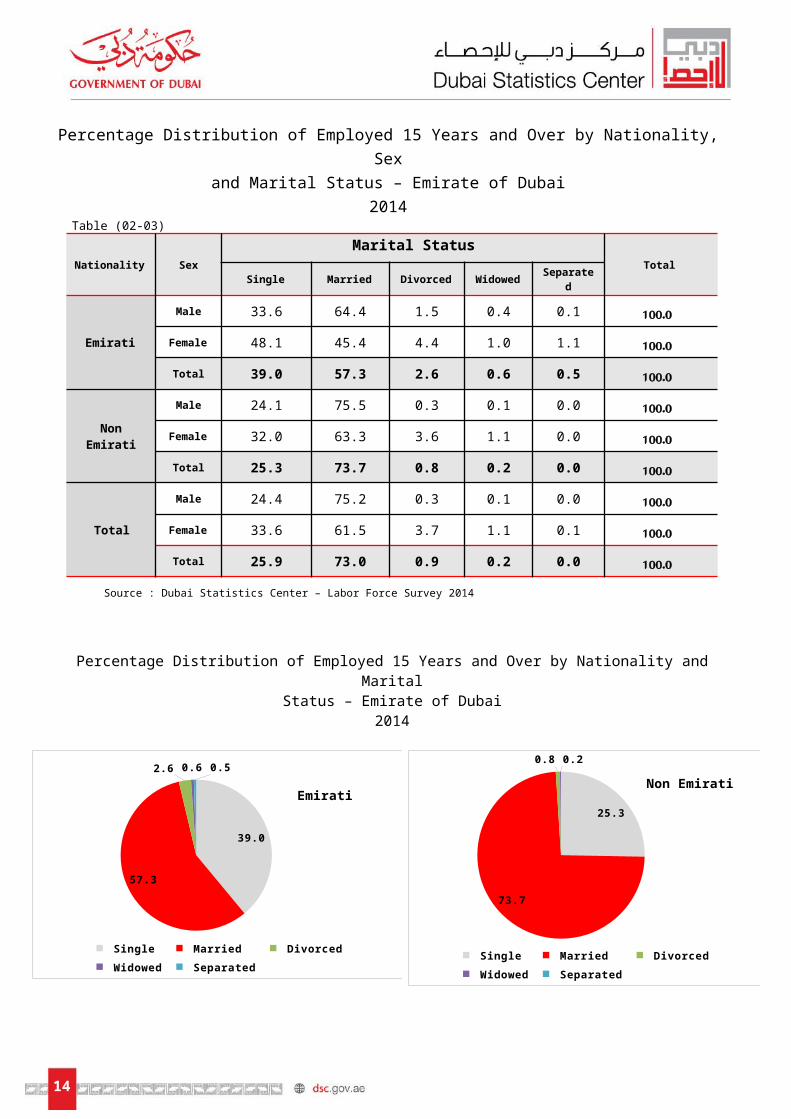
Employees 15 years and over by marital status The percentage of employees between UAEs and non- UAEs who
never married reached 42.2% among the employed UAEs where increase in females to 52.1% vs. 37.0% in males, while this percentage reached to 26.3% among non-UAEs; in male 24.1% vs. 36.8% in females.
The percentage of employees who married between the UAEs and non-UAEs reached 71.8% where increase in males to 75.0% vs. 57.8% in females, this percentage reached 72.6% among non-UAEs; in males 75.5% vs. 59.3% in females, while this percentage among UAEs reached 54.0 % where increase in males to 60.7% vs. 41.2% in females.
The percentage of Emirati's divorced employees reached 3.2% at the aggregate level, where this percentage increases to 5.3% in females vs. 2.0% in males, while among non-UAEs' divorced reached 0.7%.
Note: the widowed employees among non-UAEs are about 0.3%, while increasing among UAE to 0.7%.
Percentage Distribution of Employed 15 Years and Over by Nationality, Sex and Marital Status – Emirate of Dubai
2014 Table )02-03(
TotalMarital Status Sex Nationality
11
Separated Widowed Divorced Married Single
100.00.10.41.564.433.6Male
Emirati 100.01.11.04.445.448.1 Female
100.00.50.62.657.339.0Total
100.00.00.10.375.524.1MaleNon
Emirati 100.00.01.13.663.332.0 Female
100.00.00.20.873.725.3Total
100.00.00.10.375.224.4Male
Total 100.00.11.13.761.533.6 Female
100.00.00.20.973.025.9Total
Source : Dubai Statistics Center – Labor Force Survey 2014
Percentage Distribution of Employed 15 Years and Over by Nationality and Marital Status – Emirate of Dubai
2014
39.0
57.3
2.6 0.6 0.5
Emirati
Single Married Divorced Widowed Separated
25.3
73.7
0.8 0.2
Non Emirati
Single Married Divorced Widowed Separated
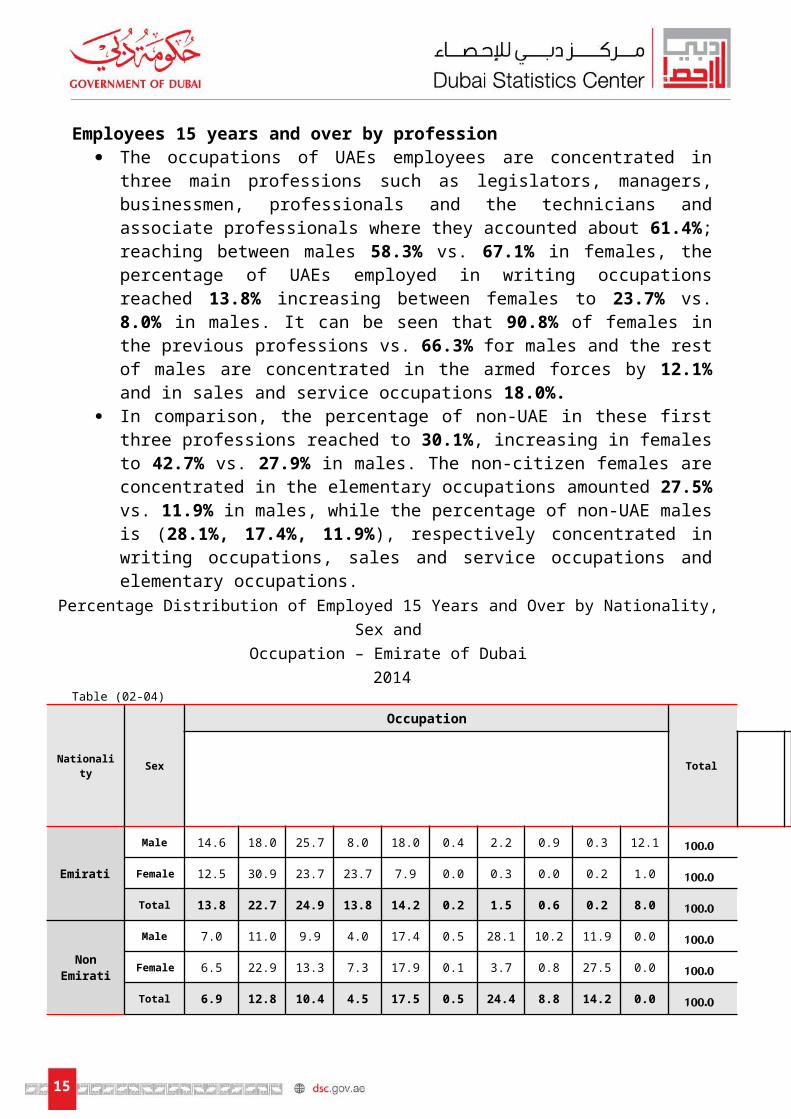
Employees 15 years and over by profession The occupations of UAEs employees are concentrated in three main
professions such as legislators, managers, businessmen, professionals and the technicians and associate professionals where they accounted about 61.4%; reaching between males 58.3% vs. 67.1% in females, the percentage of UAEs employed in writing occupations reached 13.8% increasing between females to 23.7% vs. 8.0% in males. It can be seen that 90.8% of females in the previous professions vs. 66.3% for males and the rest of males are concentrated in the armed forces by 12.1% and in sales and service occupations 18.0%.
12
In comparison, the percentage of non-UAE in these first three professions reached to 30.1%, increasing in females to 42.7% vs. 27.9% in males. The non-citizen females are concentrated in the elementary occupations amounted 27.5% vs. 11.9% in males, while the percentage of non-UAE males is (28.1%, 17.4%, 11.9%), respectively concentrated in writing occupations, sales and service occupations and elementary occupations.
Percentage Distribution of Employed 15 Years and Over by Nationality, Sex and Occupation – Emirate of Dubai
2014 Table )02-04(
Total
Occupation
Sex Nationality
100.012.10.30.92.20.418.08.025.718.014.6Male
Emirati 100.01.00.20.00.30.07.923.723.730.912.5Female
100.08.00.20.61.50.214.213.824.922.713.8Total
100.00.011.910.228.10.517.44.09.911.07.0Male
Non Emirati 100.00.027.50.83.70.117.97.313.322.96.5Female
100.00.014.28.824.40.517.54.510.412.86.9Total
100.00.411.59.927.20.517.44.210.411.37.2Male
Total 100.00.124.70.73.30.117.08.914.423.77.1Female
100.00.313.68.523.40.517.44.911.013.27.2Total
Source : Dubai Statistics Center – Labor Force Survey 2014
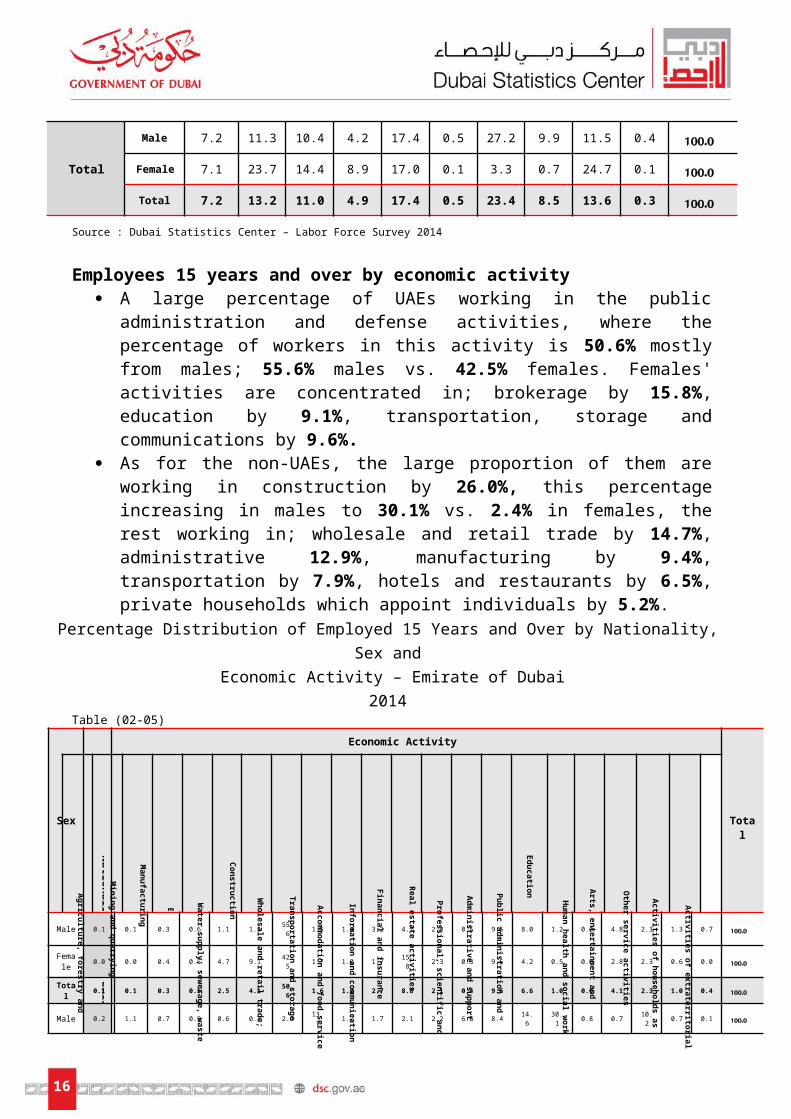
Employees 15 years and over by economic activity A large percentage of UAEs working in the public administration
and defense activities, where the percentage of workers in this activity is 50.6% mostly from males; 55.6% males vs. 42.5% females. Females' activities are concentrated in; brokerage by 15.8%, education by 9.1%, transportation, storage and communications by 9.6%.
As for the non-UAEs, the large proportion of them are working in construction by 26.0%, this percentage increasing in males to 30.1% vs. 2.4% in females, the rest working in; wholesale and retail trade by 14.7%, administrative 12.9%, manufacturing by 9.4%, transportation by 7.9%, hotels and restaurants by 6.5%, private households which appoint individuals by 5.2%.
Percentage Distribution of Employed 15 Years and Over by Nationality, Sex and
13
Economic Activity – Emirate of Dubai2014
Table )02-05(
Total
Economic Activity
Sex
Nationality
Agriculture, forestry and fishing
Mining and quarrying
Manufacturing
Electricity, gas, steam and air
conditioning supply
Water supply; sew
erage, waste
managem
ent and remediation
Construction Wholesale and retail trade; repair
of motor vehicles and m
otorcycles
Transportation and storage
Accomm
odation and food service
activities
Information and com
munication
Financial and insurance activities
Real estate activities
Professional, scientific and
technical activities
Administrative and support
service activities
Public administration and
defence; compulsory social
Education
Hum
an health and social work
activities
Arts, entertainment and
recreation
Other service activities
Activities of households as
employers
;
Activities of extraterritorial organizations and bodies
100.00.71.32.34.80.01.28.09.50.52.04.73.21.41.555.61.11.10.60.30.10.1Male
Emirati
100.00.00.62.32.80.00.54.29.60.32.315.81.71.01.742.59.14.70.50.40.00.0Female
100.00.41.02.34.10.01.06.69.60.42.18.82.71.21.650.64.12.50.50.30.10.1Total
100.00.10.710.20.70.830.114.68.46.62.22.11.71.713.72.20.70.60.90.71.10.2Male
Non
Em
irati
100.00.11.54.20.10.12.416.15.26.21.35.91.72.18.12.18.34.00.11.628.90.0Female
100.00.10.89.40.60.726.0
14.77.96.52.12.61.71.812.
92.21.81.10.80.95.20.2Total
100.00.10.710.20.80.729.214.48.46.42.22.11.71.713.33.90.70.60.90.71.10.2Male
Total 100.00.11.44.00.40.12.214.95.65.61.36.91.71.97.56.28.44.10.21.526.00.0Fema
le
100.00.10.89.00.80.624.8
14.58.06.32.12.91.71.812.
44.31.91.20.80.85.00.2Total
Source : Dubai Statistics Center – Labor Force Survey 2014
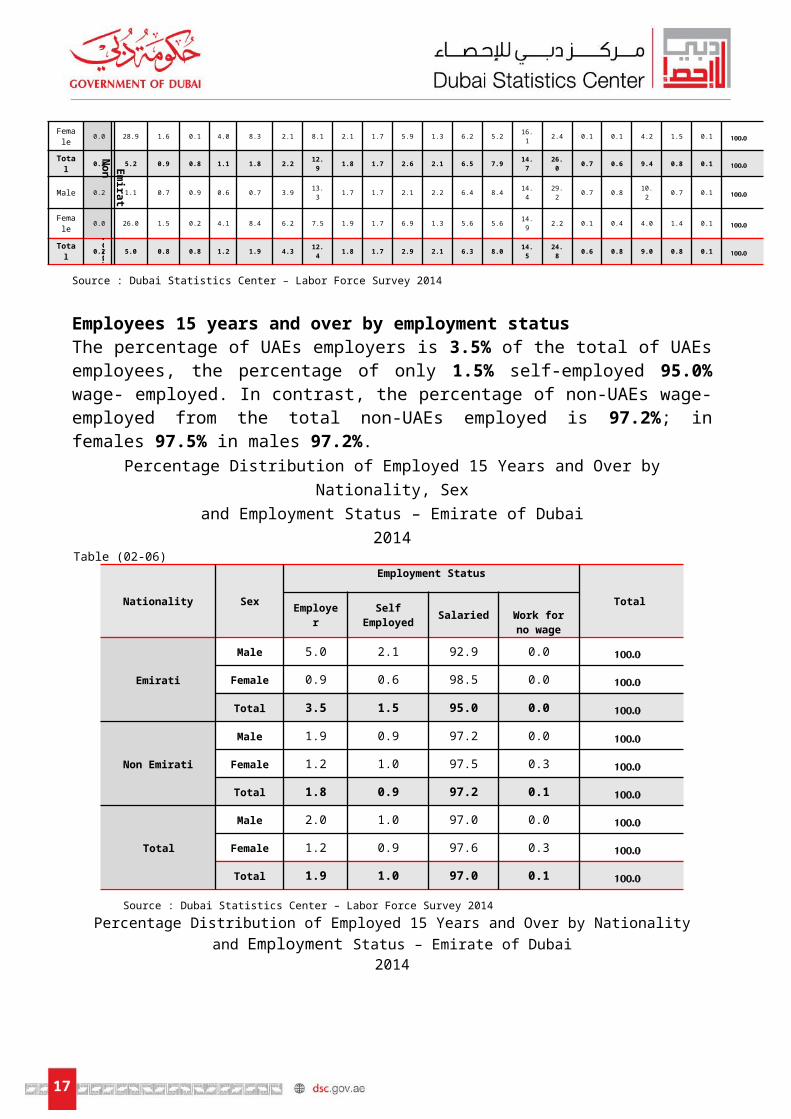
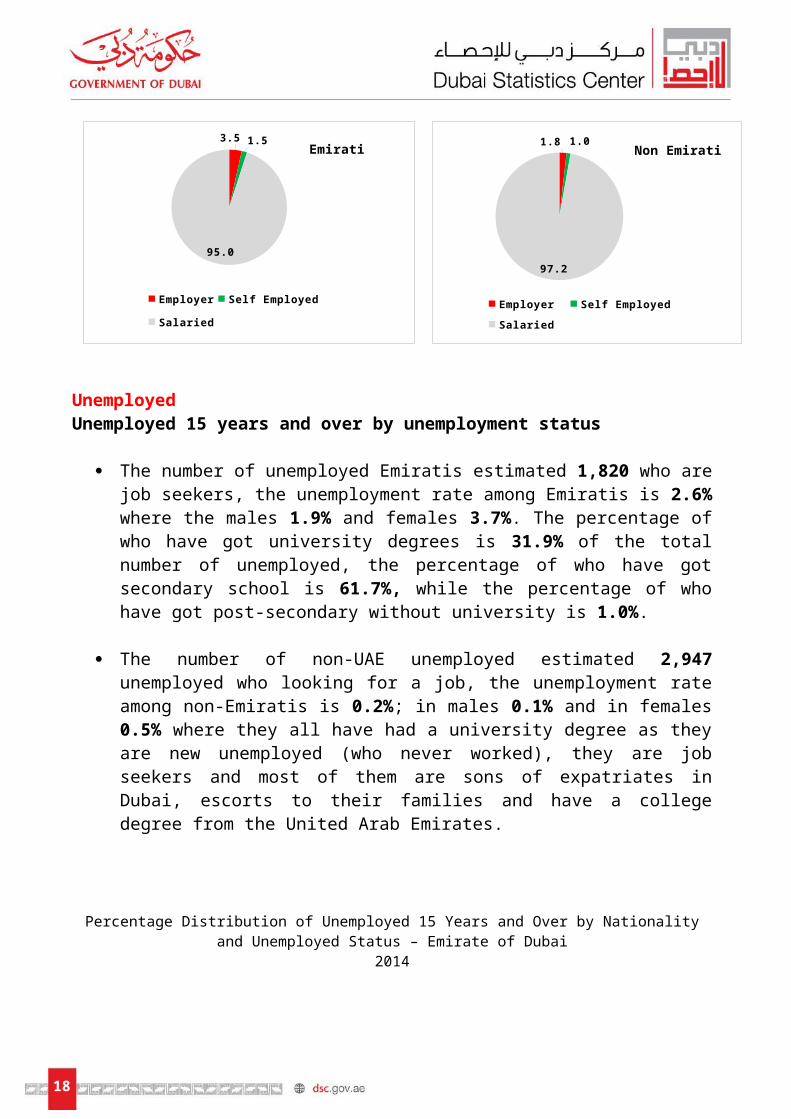
Employees 15 years and over by employment statusThe percentage of UAEs employers is 3.5% of the total of UAEs employees, the percentage of only 1.5% self-employed 95.0% wage- employed. In contrast, the percentage of non-UAEs wage- employed from the total non-UAEs employed is 97.2%; in females 97.5% in males 97.2%.
Percentage Distribution of Employed 15 Years and Over by Nationality, Sex and Employment Status – Emirate of Dubai
2014 Table )02-06(
Total
Employment Status
SexNationalityWork for no
wageSalariedSelf
EmployedEmployer
100.00.092.92.15.0Male
Emirati 100.00.098.50.60.9Female
100.00.095.01.53.5Total
100.00.097.20.91.9MaleNon Emirati
14
100.00.397.51.01.2Female
100.00.197.20.91.8Total
100.00.097.01.02.0Male
Total 100.00.397.60.91.2Female
100.00.197.01.01.9Total
Source : Dubai Statistics Center – Labor Force Survey 2014Percentage Distribution of Employed 15 Years and Over by Nationality
and Employment Status – Emirate of Dubai2014
3.5 1.5
95.0
Emirati
Employer Self Employed Salaried
1.8 1.0
97.2
Non Emirati
Employer Self Employed Salaried
UnemployedUnemployed 15 years and over by unemployment status
The number of unemployed Emiratis estimated 1,820 who are job seekers, the unemployment rate among Emiratis is 2.6% where the males 1.9% and females 3.7%. The percentage of who have got university degrees is 31.9% of the total number of unemployed, the percentage of who have got secondary school is 61.7%, while the percentage of who have got post-secondary without university is 1.0%.
The number of non-UAE unemployed estimated 2,947 unemployed who looking for a job, the unemployment rate among non-Emiratis is 0.2%; in males 0.1% and in females 0.5% where they all have had a university degree as they are new unemployed (who never worked), they are job seekers and most of them are sons of expatriates in Dubai, escorts to their families and have a college degree from the United Arab Emirates.
Percentage Distribution of Unemployed 15 Years and Over by Nationality
15
and Unemployed Status – Emirate of Dubai2014
Emirati Non Emirati Total 0.0
10.020.030.040.050.060.070.080.090.0
100.0
18.97.0
11.5
81.1
93.088.5
Worked Before Never Worked Before
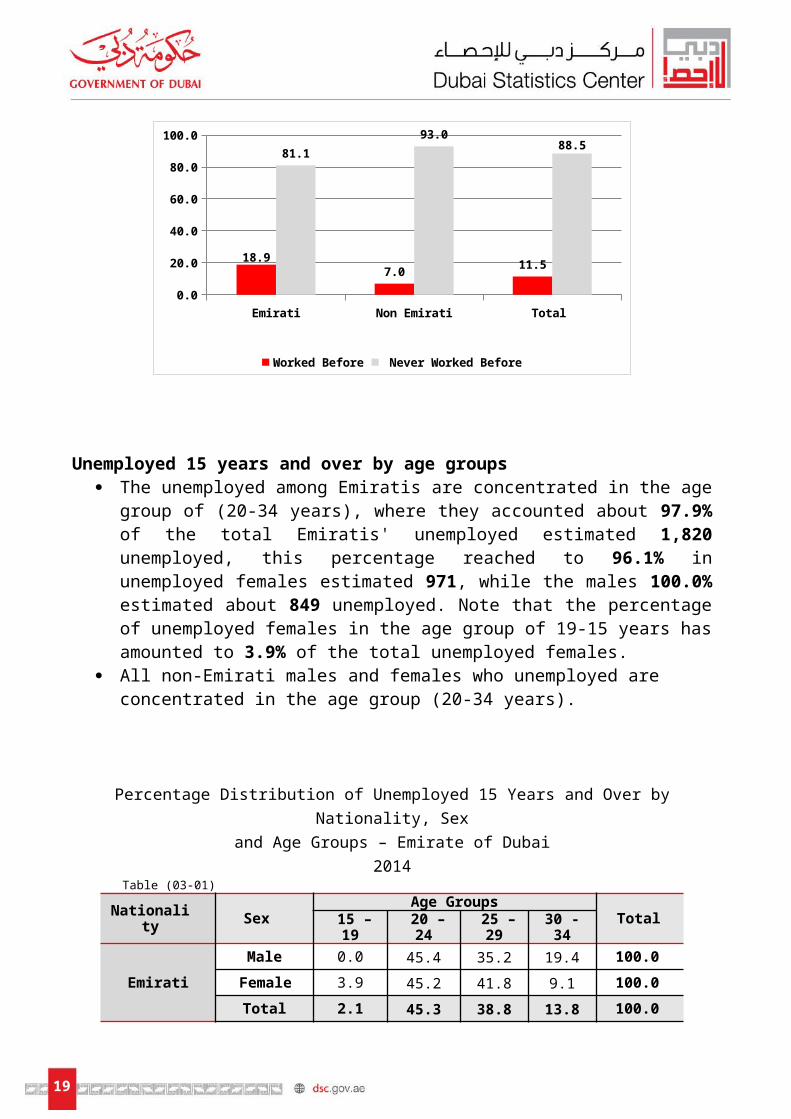
Unemployed 15 years and over by age groups The unemployed among Emiratis are concentrated in the age group
of (20-34 years), where they accounted about 97.9% of the total Emiratis' unemployed estimated 1,820 unemployed, this percentage reached to 96.1% in unemployed females estimated 971, while the males 100.0% estimated about 849 unemployed. Note that the percentage of unemployed females in the age group of 19-15 years has amounted to 3.9% of the total unemployed females.
All non-Emirati males and females who unemployed are concentrated in the age group (20-34 years).
Percentage Distribution of Unemployed 15 Years and Over by Nationality, Sex and Age Groups – Emirate of Dubai
2014 Table )03-01(
Total Age Groups
SexNationality 30 -
34 25 – 29
20 – 24
15 – 19
100.019.435.245.40.0MaleEmirati 100.09.141.845.23.9Female
100.013.838.845.32.1Total100.04.83.192.10.0Male
Non Emirati100.00.045.254.80.0Female
16
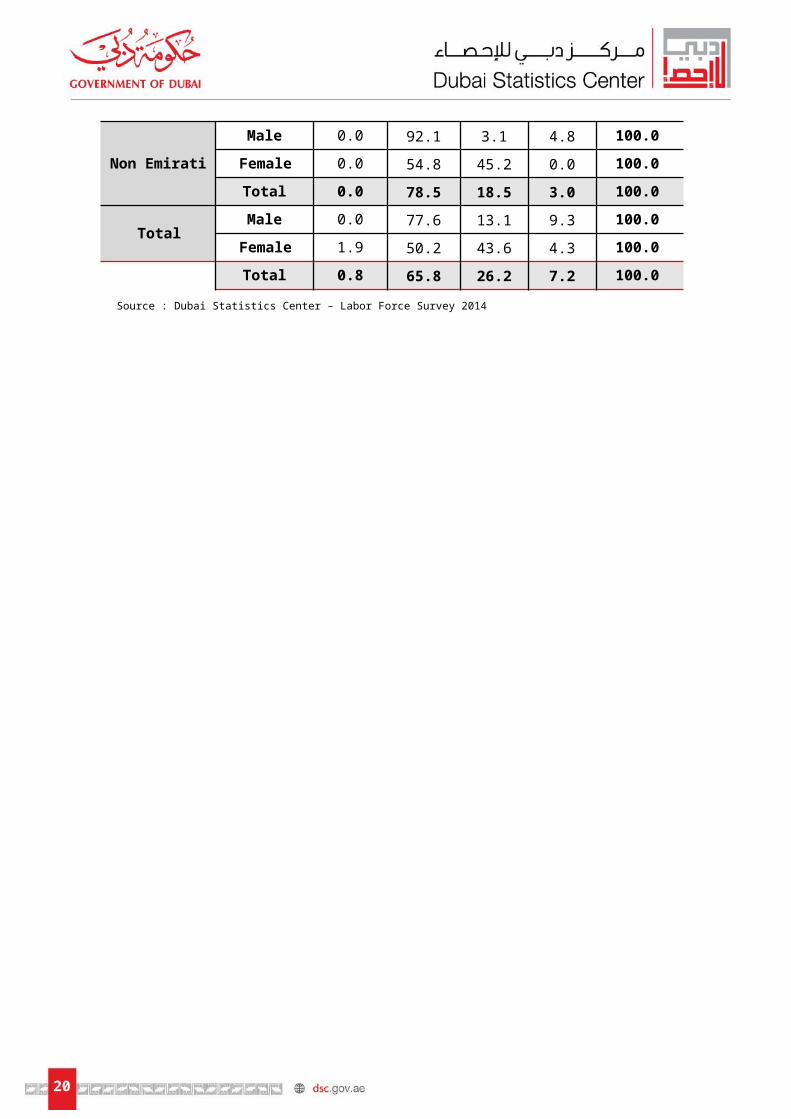
100.03.018.578.50.0Total100.09.313.177.60.0Male
Total 100.04.343.650.21.9Female 100.07.226.265.80.8Total
Source : Dubai Statistics Center – Labor Force Survey 2014
17
Percentage Distribution of Unemployed 15 Years and Over by Sex and Nationality– Emirate of Dubai
2014
i tarimE i tarimE noN latoT0.0
0.01
0.02
0.03
0.04
0.05
0.06
0.07
6.64
5.36
1.754.35
5.63
9.24
elaM elameF
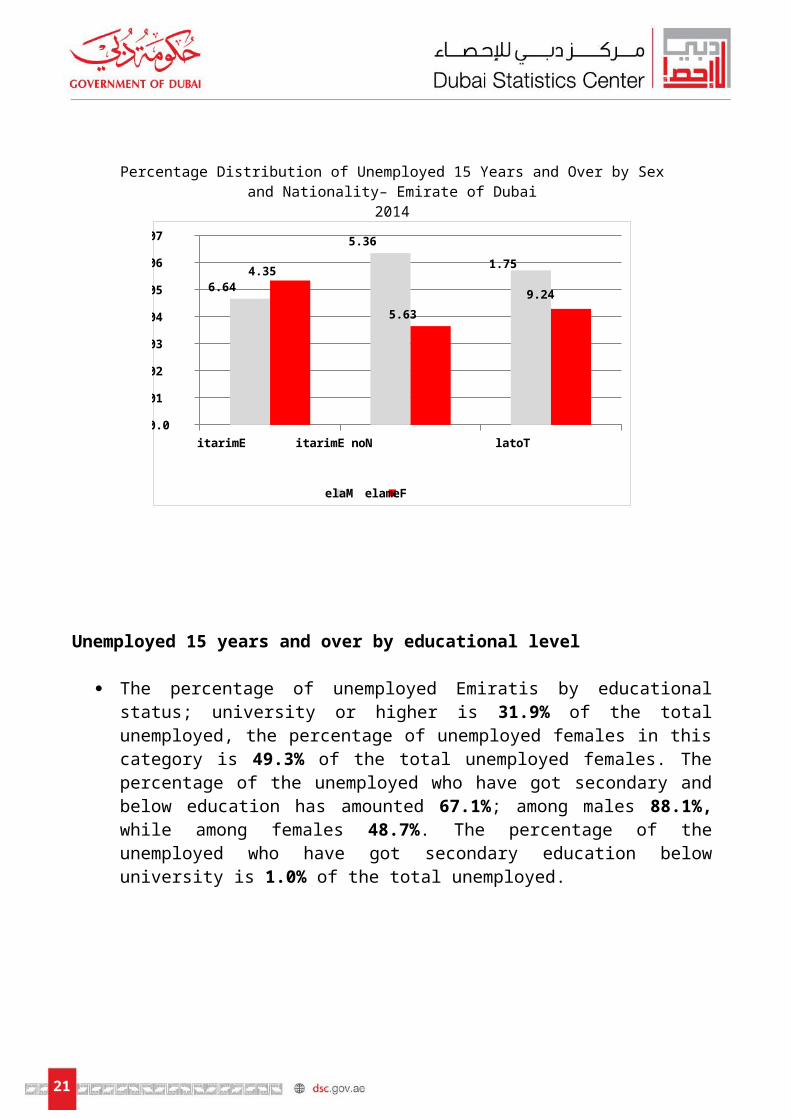
Unemployed 15 years and over by educational level
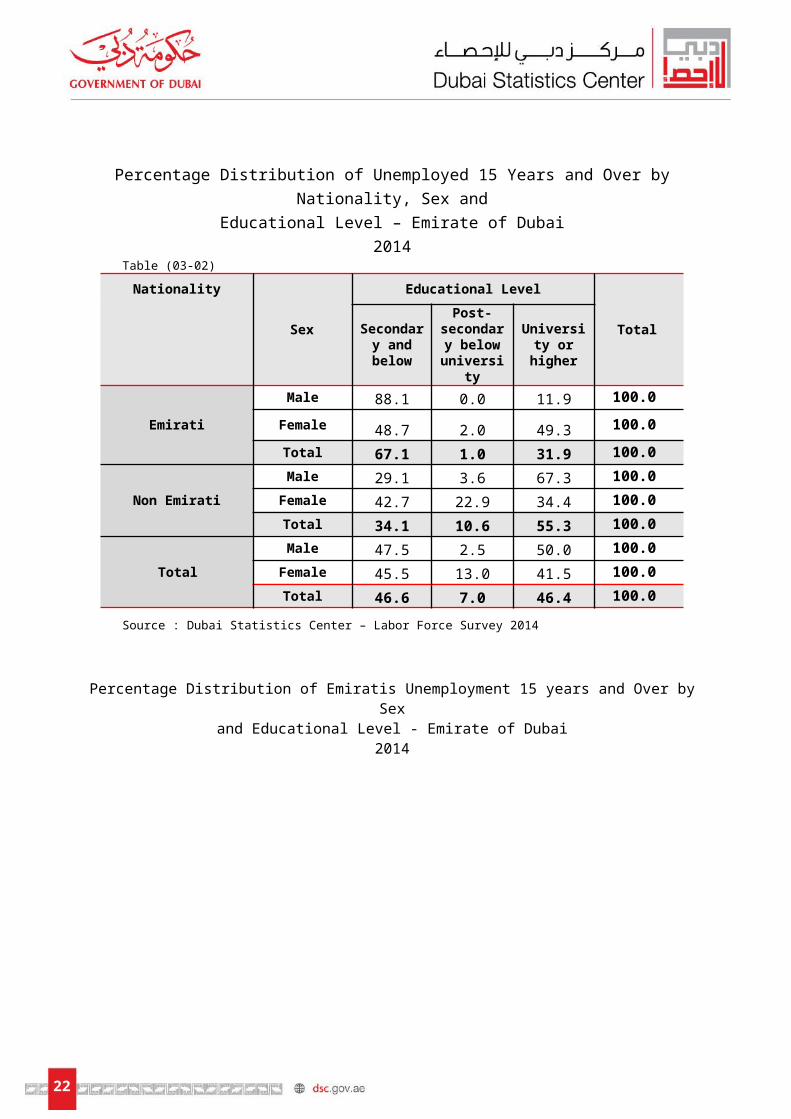
The percentage of unemployed Emiratis by educational status; university or higher is 31.9% of the total unemployed, the percentage of unemployed females in this category is 49.3% of the total unemployed females. The percentage of the unemployed who have got secondary and below education has amounted 67.1%; among males 88.1%, while among females 48.7%. The percentage of the unemployed who have got secondary education below university is 1.0% of the total unemployed.
18
Percentage Distribution of Unemployed 15 Years and Over by Nationality, Sex and
Educational Level – Emirate of Dubai2014
Table )03-02(
Total
Educational Level
Sex
Nationality
University or
higher
Post-secondary below universit
y
Secondary and below
100.011.90.088.1Male
Emirati 100.049.32.048.7Female
100.031.91.067.1Total100.067.33.629.1Male
Non Emirati 100.034.422.942.7Female100.055.310.634.1Total100.050.02.547.5Male
Total 100.041.513.045.5Female100.046.47.046.6Total
Source : Dubai Statistics Center – Labor Force Survey 2014
Percentage Distribution of Emiratis Unemployment 15 years and Over by Sex and Educational Level - Emirate of Dubai
2014
University or higher Post-secondary below university
Secondary and below0.0
10.0
20.0
30.0
40.0
50.0
60.0
50
2.5
47.5
41.5
13.0
45.5
Male Female
19
Unemployed 15 years and over by marital status While the percentage of unemployed non-Emirati females (who
never married) reached 82.5% of the total unemployed females, the percentage of unemployed females who are married has reached 17.5%.
With regard to the non-UAE unemployed, the results showed that all of them are singles (who never married) either for males 96.7% or females 100.0%.
Percentage Distribution of Unemployed 15 Years and Over by Nationality, Sex and Marital Status – Emirate of Dubai
2014 Table )03-03(
TotalMarital Status
SexNationalityDivorcedMarriedSingle
100.03.811.784.5Male
Emirati 100.00.017.582.5Female
100.01.814.783.5Total
100.00.03.396.7Male
Non Emirati 100.00.00.0100.0Female
100.00.02.197.9Total
100.01.25.992.9Male
Total 100.00.08.391.7Female
100.00.76.994.4Total
Source : Dubai Statistics Center – Labor Force Survey 2014
Third: Population 15 years and over who economically inactive Population of 15 years and over of Emiratis who are economically
inactive constitutes 50.9% of the total UAE population 15 years and over. The percentage of students has reached 37.9% of the total Emiratis population of 15 years and over who are economically inactive; 49.7% in males and 31.7% in females. The percentage of house wives is 50.3% where the percentage of women aged 65 years are 8.4% their proportion between males is
20
13.0%, about who retirees 7.6% respectively of the total UAE population who economically inactive.
With respect to non-Emiratis economically inactive who are aged 15 years and over has made 15.5% of the total non-Emiratis population who aged 15 years and over, where the percentage of students is 23.3%, the percentage of house wives is 65.2%, the percentage of who aged 65 years and over 2.9%.
Percentage Distribution of Population Non – Economically 15 Years and Over Active by
Nationality and Sex – Emirate of Dubai2014
Table )04-01(
Total
Non – Economically Active
Sex Nationalityother
Independent
income
Aged 65 or older
Retired
Unable to work (Disabl
ed, Illness
StudentHouseh
old duties
100.05.66.513.016.58.749.70.0Male
Emirati 100.01.63.06.12.94.431.750.3Female
100.03.04.28.47.65.937.933.0Total
100.03.411.69.12.03.669.90.0Male
Non Emirati 100.01.51.81.61.21.613.878.5Female
100.01.93.42.91.32.023.365.2Total
100.04.29.910.57.05.463.00.0Male
Total 100.01.62.02.31.52.116.873.7Female
100.02.13.64.02.62.826.358.6Total
Source : Dubai Statistics Center – Labor Force Survey 2014
Housewife The percentage of UAE house wives constitutes 11.6% of the total
house wives; this percentage has been concentrated in the age of 25 years and over about 94.5%. With respect to the educational
21
status, the percentage of women who have got secondary education and higher is 44.8%.
The percentage of non-citizen house wives reached 88.4% of the total house wives; this percentage has been concentrated in the age of 20-59 years about 89.5%, the percentage of women who have got secondary education and higher is 84.3% divided into 41.6% have a university degree and 24.1% who have got secondary education.
Percentage Distribution of Housewife 15 Years and Over by Nationality and Age Groups – Emirate of Dubai
2014Table )04-02(
TotalAge Groups
Nationality65+60-6455-5950-5445-4940-4435-3930-3425-2920-2415-19
100.03.46.610.012.714.314.19.814.49.25.00.5Emirati
100.00.51.84.47.08.313.019.122.117.84.31.7 Non Emirati
100.00.82.35.07.79.013.118.121.216.84.41.6Total
Source : Dubai Statistics Center – Labor Force Survey 2014
Percentage Distribution of Housewife 15 Years and Over by Nationality and Educational Level – Emirate of Dubai
2014Table )04-03(
Total
Educational Level
Nationality
Doctorate or Equivalent
Master or
Equivalent
Higher Diploma
University or Equivalent
Short-cycle tertiary
Post-secondary
non-tertiarySecondaryPreparatory PrimaryRead &
Write Illiterate
100.00.30.80.314.72.21.525.024.913.79.07.6Emirati
100.00.88.82.041.66.60.424.19.23.21.51.8 Non
Emirati
100.00.77.91.838.56.10.624.211.04.42.42.4Total
Source : Dubai Statistics Center – Labor Force Survey 2014
22
![Welcome [ ] · PDF fileair force spanish air force swedish air force tunisian air force turkish air force pakistan navy norwegian air force united states air force. painting](https://static.fdocument.pub/doc/165x107/5a78e67b7f8b9a83238e1215/welcome-force-spanish-air-force-swedish-air-force-tunisian-air-force-turkish.jpg)