Broadband dielectric measurement & simulation of e-field ...
10
PRIFYSGOL BANGOR / BANGOR UNIVERSITY Broadband dielectric measurement & simulation of e-field curing systems Parker, Nyle ; Cuenca, J; Gumbleton, R; Dimitriou, Athanasios; Ormondroyd, Graham; Slocombe, Daniel Timber 2018 Published: 26/06/2018 Peer reviewed version Cyswllt i'r cyhoeddiad / Link to publication Dyfyniad o'r fersiwn a gyhoeddwyd / Citation for published version (APA): Parker, N., Cuenca, J., Gumbleton, R., Dimitriou, A., Ormondroyd, G., & Slocombe, D. (2018). Broadband dielectric measurement & simulation of e-field curing systems. In M. Spear (Ed.), Timber 2018 (pp. 89-98). Hawliau Cyffredinol / General rights Copyright and moral rights for the publications made accessible in the public portal are retained by the authors and/or other copyright owners and it is a condition of accessing publications that users recognise and abide by the legal requirements associated with these rights. • Users may download and print one copy of any publication from the public portal for the purpose of private study or research. • You may not further distribute the material or use it for any profit-making activity or commercial gain • You may freely distribute the URL identifying the publication in the public portal ? Take down policy If you believe that this document breaches copyright please contact us providing details, and we will remove access to the work immediately and investigate your claim. 13. Feb. 2022
Transcript of Broadband dielectric measurement & simulation of e-field ...
PR
IFY
SG
OL
BA
NG
OR
/ B
AN
GO
R U
NIV
ER
SIT
Y
Broadband dielectric measurement & simulation of e-field curing systems
Parker, Nyle ; Cuenca, J; Gumbleton, R; Dimitriou, Athanasios; Ormondroyd,Graham; Slocombe, Daniel
Timber 2018
Published: 26/06/2018
Peer reviewed version
Cyswllt i'r cyhoeddiad / Link to publication
Dyfyniad o'r fersiwn a gyhoeddwyd / Citation for published version (APA):Parker, N., Cuenca, J., Gumbleton, R., Dimitriou, A., Ormondroyd, G., & Slocombe, D. (2018).Broadband dielectric measurement & simulation of e-field curing systems. In M. Spear (Ed.),Timber 2018 (pp. 89-98).
Hawliau Cyffredinol / General rightsCopyright and moral rights for the publications made accessible in the public portal are retained by the authors and/orother copyright owners and it is a condition of accessing publications that users recognise and abide by the legalrequirements associated with these rights.
• Users may download and print one copy of any publication from the public portal for the purpose of privatestudy or research. • You may not further distribute the material or use it for any profit-making activity or commercial gain • You may freely distribute the URL identifying the publication in the public portal ?
Take down policyIf you believe that this document breaches copyright please contact us providing details, and we will remove access tothe work immediately and investigate your claim.
13. Feb. 2022
BROADBAND DIELECTRIC MEASUREMENT & SIMULATION OF E-FIELD CURING SYSTEM
N. Parker1, J. Cuenca1, , R. Gumbleton1, A. Dimitrio2, G. Ormondroyd2, D. R.
Slocombe1
1Cardiff University, Queen’s Buildings, 14-17 The Parade CF24 3AA, Cardiff, UK 2BioComposites Centre, Bangor University, Deniol Rd, Bangor, LL57 2UW
SUMMARY Broadband temperature dependent dielectric measurements of Polyvinyl alcohol have been
taken for a frequency range of 100 MHz – 10 GHz. A numerical model of a high voltage
capacitive applicator has been used to demonstrate heating uniformity of such a system.
KEYWORDS: (RF, curing, dielectric, measurement, conductivity)
INTRODUCTION
RF curing is used by the timber industry in many applications, such as multi-timber lamination
(Pizzi, 2010). These are commonly known as, ‘Glulams’ which are used for structural elements
in construction. Application of RF readily heats the adhesive agent causing it to cure rapidly
while having minimal affect upon the timber. This is due to the large difference in dielectric
loss between the timber (low loss) and the adhesive (high loss). When this technique is used in
conjunction with pressing, a uniform well bonded laminate is formed. The complex dielectric
constant is very important to an RF designer, as it shows whether a material is suitable for
curing from an RF perspective.
Conventional methods ultimately rely upon convection/conduction to raise the adhesive to the
desired temperature. This requires the total component to be raised to the required curing
temperature. RF avoids the problems associated with a hot press, which must combat the low
thermal conductivity of the timber (Mehdizadeh, 2015). RF allows for volumetric heating of
the adhesive due to its dielectric properties.
Industry makes use of a wide variety of adhesives, which come in many variations. For this
simulation, PVA was chosen as a baseline to demonstrate how dielectric measurements of the
adhesive can be used to create an accurate numerical model. PVA is a semi crystalline polymer
which contains the presence of OH groups and the hydrogen bond formation (Rajeswari, 2011).
This paper will be using a generic PVA & water premix, it will be baked to remove the water
content.
RF can be defined as the frequency range of 3 KHz – 300 MHz. The application of a high
voltage, high frequency electric field to a lossy dielectric such as a water & PVA solution result
in rapid heating due to the polarisation of the electric dipoles. (Tang, 2015) Polar molecules
such as found in water, will continuously try to realign with an applied AC electric field.
Alternative to this mechanism is ionic heating where the friction due to oscillating ions causes
heating.
Timber 2018
DIELECTRIC THEORY
THEORY
The complex permittivity is divided into two portions, the real part is related to the phase and
is commonly called the dielectric constant. The imaginary accounts for the energy losses within
a material and is aptly named the dielectric loss factor.
∈∗= ∈′− 𝑗 ∈′′ Equation 1
Where,
ε' is Dielectric Constant, ε’’ is Dielectric Loss
𝐽 = (𝜎 + 𝜀0𝜀′′𝜔)𝐸 + 𝑗𝜀0𝜀′𝜔𝐸 Equation 2
Where,
σ DC or Free Charge Conductivity (S/m)
ε0 Permittivity of free space (F/m)
ε' Dielectric Constant
ε'' Dissipation Factor
ω Angular Frequency (rad/s)
�̅� Electric Field (V/m)
𝑃 = 𝜀0𝜀′′𝜔|𝐸|2 Equation 3
Both temperature and frequency play a contributing role to the currents generated when an AC
electric field is applied to a dielectric such as PVA or Pine Wood. 𝑃 = 𝜀0𝜀′′𝜔|𝐸|2
Equation 3 indicates that the dielectric loss sets the amount of
power which can be deposited into the dielectric material.
EXPERIMENTAL
Broadband Dielectric Probe Measurement Technique
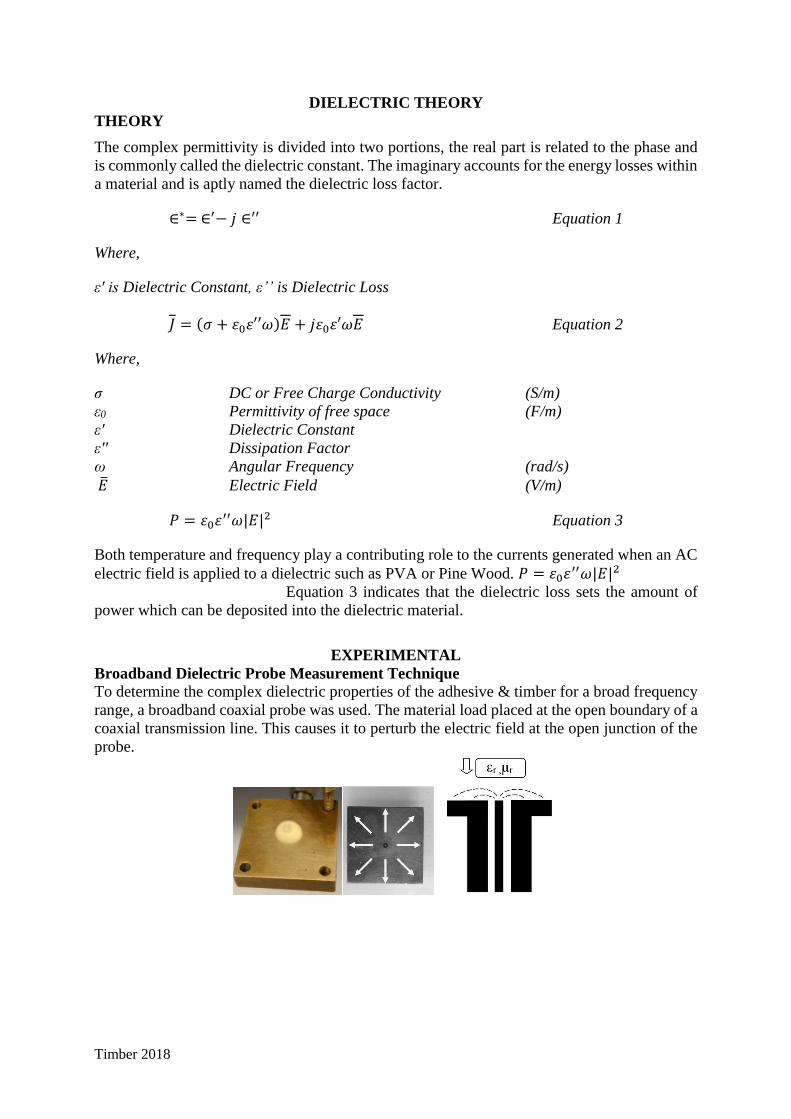
To determine the complex dielectric properties of the adhesive & timber for a broad frequency
range, a broadband coaxial probe was used. The material load placed at the open boundary of a
coaxial transmission line. This causes it to perturb the electric field at the open junction of the
probe.
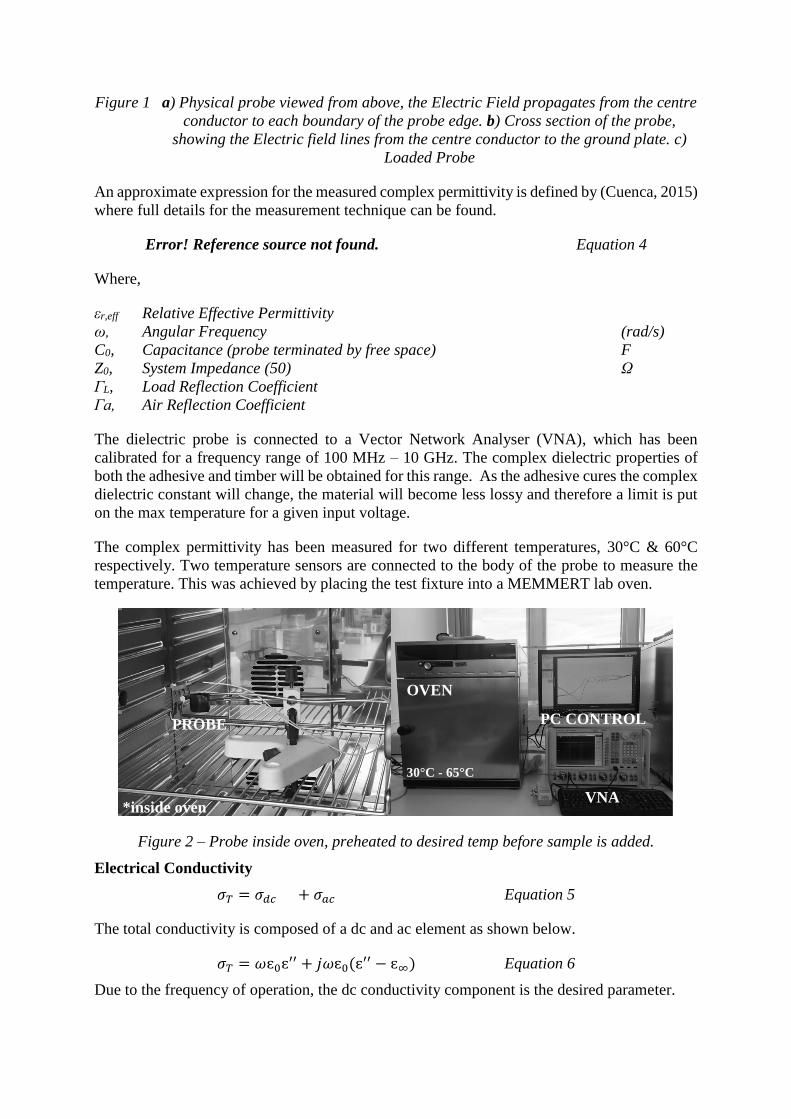
Figure 1 a) Physical probe viewed from above, the Electric Field propagates from the centre
conductor to each boundary of the probe edge. b) Cross section of the probe,
showing the Electric field lines from the centre conductor to the ground plate. c)
Loaded Probe
An approximate expression for the measured complex permittivity is defined by (Cuenca, 2015)
where full details for the measurement technique can be found.
Error! Reference source not found. Equation 4
Where,
εr,eff Relative Effective Permittivity
ω, Angular Frequency (rad/s)
C0, Capacitance (probe terminated by free space) F
Z0, System Impedance (50) Ω
ΓL, Load Reflection Coefficient
Γa, Air Reflection Coefficient
The dielectric probe is connected to a Vector Network Analyser (VNA), which has been
calibrated for a frequency range of 100 MHz – 10 GHz. The complex dielectric properties of
both the adhesive and timber will be obtained for this range. As the adhesive cures the complex
dielectric constant will change, the material will become less lossy and therefore a limit is put
on the max temperature for a given input voltage.
The complex permittivity has been measured for two different temperatures, 30°C & 60°C
respectively. Two temperature sensors are connected to the body of the probe to measure the
temperature. This was achieved by placing the test fixture into a MEMMERT lab oven.
Figure 2 – Probe inside oven, preheated to desired temp before sample is added.
Electrical Conductivity
𝜎𝑇 = 𝜎𝑑𝑐 + 𝜎𝑎𝑐 Equation 5
The total conductivity is composed of a dc and ac element as shown below.
𝜎𝑇 = 𝜔ɛ0ɛ′′ + 𝑗𝜔ɛ0(ɛ′′ − ɛ∞) Equation 6
Due to the frequency of operation, the dc conductivity component is the desired parameter.
OVEN
30°C - 65°C
VNA
PROBE PC CONTROL
*inside oven
Timber 2018
Experiment 1,2 – Time Dependent Complex Permittivity Measurement of PVA at 30°C,
60°C
This measurement was taken to determine the change in dielectric properties of the PVA as it
cures in time, where water is being evaporated off. The oven is preheated to 30°C, then a small
sample of the adhesive is applied to the dielectric probe end. The VNA is instructed to sample
every 2s where the S11 data is converted into the complex permittivity values. Maintaining a
constant temperature will show the change in complex dielectric constant as a function of time
for the measured frequency range. Data is recorded until the water have been driven off as
indicated by the loss in Debye characteristic at the higher frequency range. The measurement
is then repeated for 60°C.
Experiment 3 Dielectric Measurement Temperature Ramp Results
Complex dielectric permittivity for 5 samples is measured across a temperature ramp of 30 °C
- 65 °C. The system is first calibrated then the sample added to the probe, the oven is then set.
RESULTS AND DISCUSSION
Experiment 1
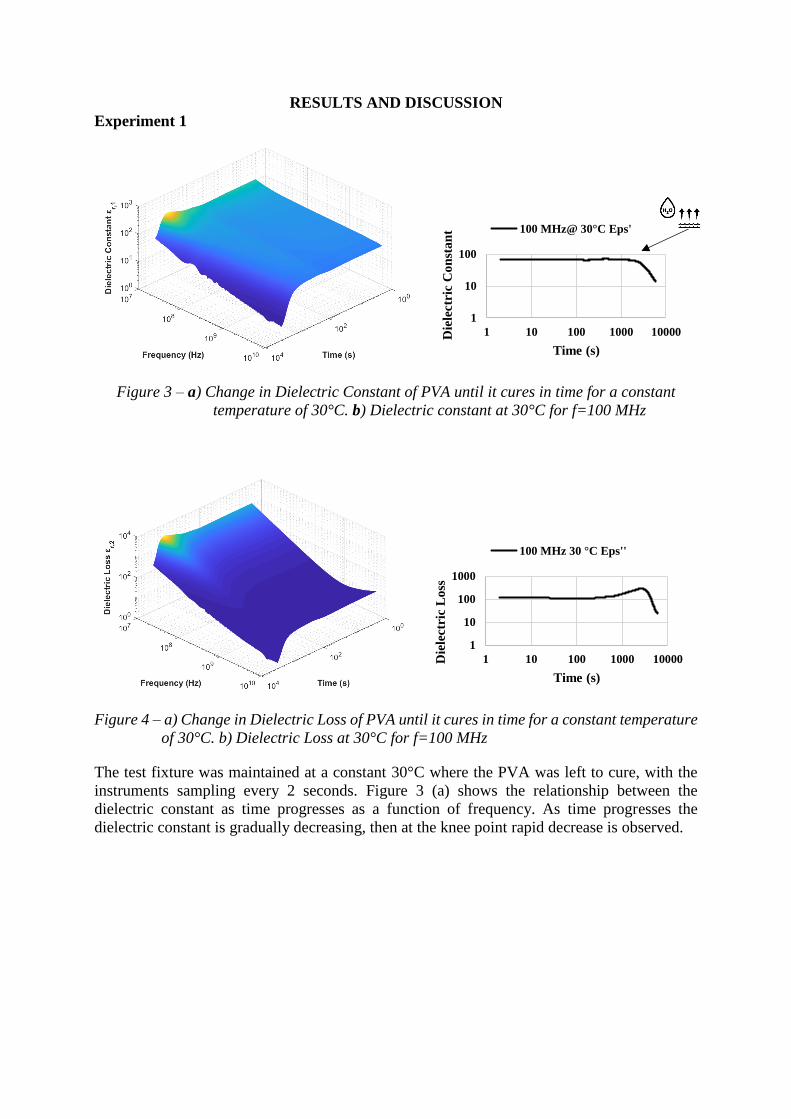
Figure 3 – a) Change in Dielectric Constant of PVA until it cures in time for a constant
temperature of 30°C. b) Dielectric constant at 30°C for f=100 MHz
Figure 4 – a) Change in Dielectric Loss of PVA until it cures in time for a constant temperature
of 30°C. b) Dielectric Loss at 30°C for f=100 MHz
The test fixture was maintained at a constant 30°C where the PVA was left to cure, with the
instruments sampling every 2 seconds. Figure 3 (a) shows the relationship between the
dielectric constant as time progresses as a function of frequency. As time progresses the
dielectric constant is gradually decreasing, then at the knee point rapid decrease is observed.
1
10
100
1 10 100 1000 10000Die
lectr
ic C
on
sta
nt
Time (s)
100 MHz@ 30°C Eps'
1
10
100
1000
1 10 100 1000 10000Die
lectr
ic L
oss
Time (s)
100 MHz 30 °C Eps''
Timber 2018
Experiment 2
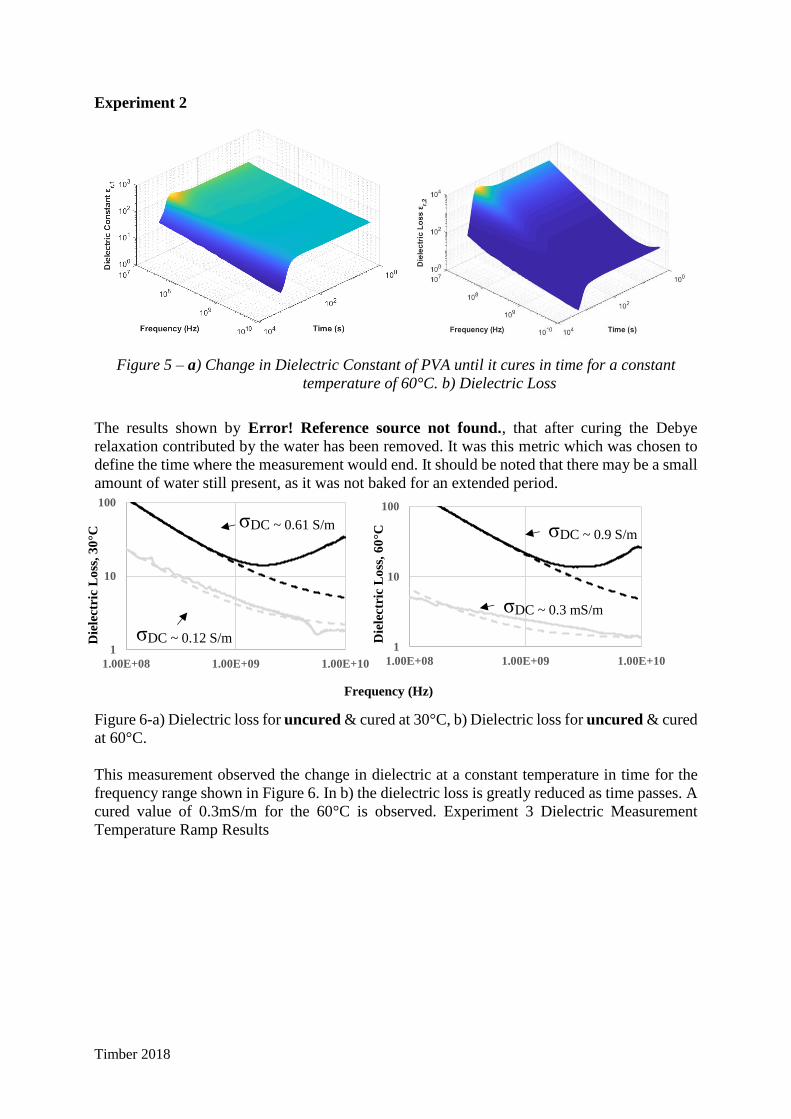
Figure 5 – a) Change in Dielectric Constant of PVA until it cures in time for a constant
temperature of 60°C. b) Dielectric Loss
The results shown by Error! Reference source not found., that after curing the Debye
relaxation contributed by the water has been removed. It was this metric which was chosen to
define the time where the measurement would end. It should be noted that there may be a small
amount of water still present, as it was not baked for an extended period.
Figure 6-a) Dielectric loss for uncured & cured at 30°C, b) Dielectric loss for uncured & cured
at 60°C.
This measurement observed the change in dielectric at a constant temperature in time for the
frequency range shown in Figure 6. In b) the dielectric loss is greatly reduced as time passes. A
cured value of 0.3mS/m for the 60°C is observed. Experiment 3 Dielectric Measurement
Temperature Ramp Results
1
10
100
1.00E+08 1.00E+09 1.00E+10
1
10
100
1.00E+08 1.00E+09 1.00E+10
σDC ~ 0.3 mS/m
σDC ~ 0.61 S/m σDC ~ 0.9 S/m
σDC ~ 0.12 S/m
Frequency (Hz)
Die
lectr
ic L
oss
, 3
0°C
Die
lectr
ic L
oss
, 6
0°C
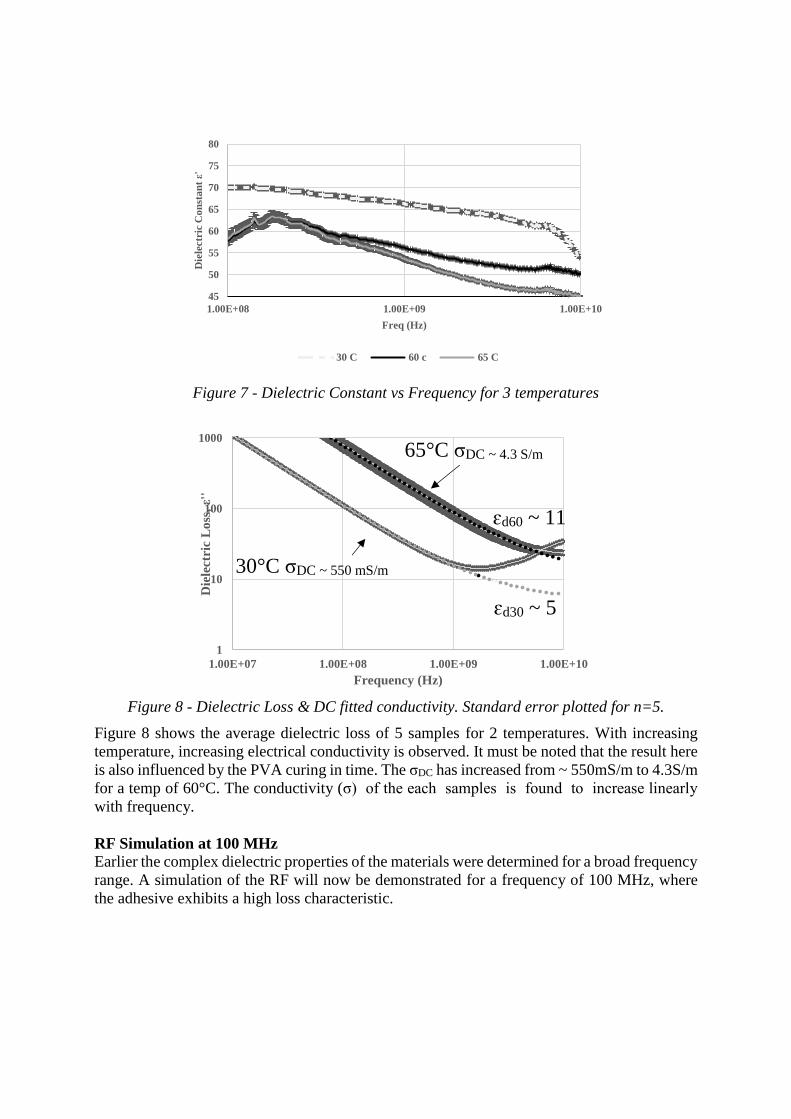
Figure 7 - Dielectric Constant vs Frequency for 3 temperatures
Figure 8 - Dielectric Loss & DC fitted conductivity. Standard error plotted for n=5.
Figure 8 shows the average dielectric loss of 5 samples for 2 temperatures. With increasing
temperature, increasing electrical conductivity is observed. It must be noted that the result here
is also influenced by the PVA curing in time. The σDC has increased from ~ 550mS/m to 4.3S/m
for a temp of 60°C. The conductivity (σ) of the each samples is found to increase linearly
with frequency.
RF Simulation at 100 MHz
Earlier the complex dielectric properties of the materials were determined for a broad frequency
range. A simulation of the RF will now be demonstrated for a frequency of 100 MHz, where
the adhesive exhibits a high loss characteristic.
45
50
55
60
65
70
75
80
1.00E+08 1.00E+09 1.00E+10
Die
lectr
ic C
on
sta
nt ε'
Freq (Hz)
30 C 60 c 65 C
1
10
100
1000
1.00E+07 1.00E+08 1.00E+09 1.00E+10
Die
lectr
ic L
oss
, ε'
'
Frequency (Hz)
30°C σDC ~ 550 mS/m
65°C σDC ~ 4.3 S/m
ɛd30 ~ 5
ɛd60 ~ 11
Timber 2018
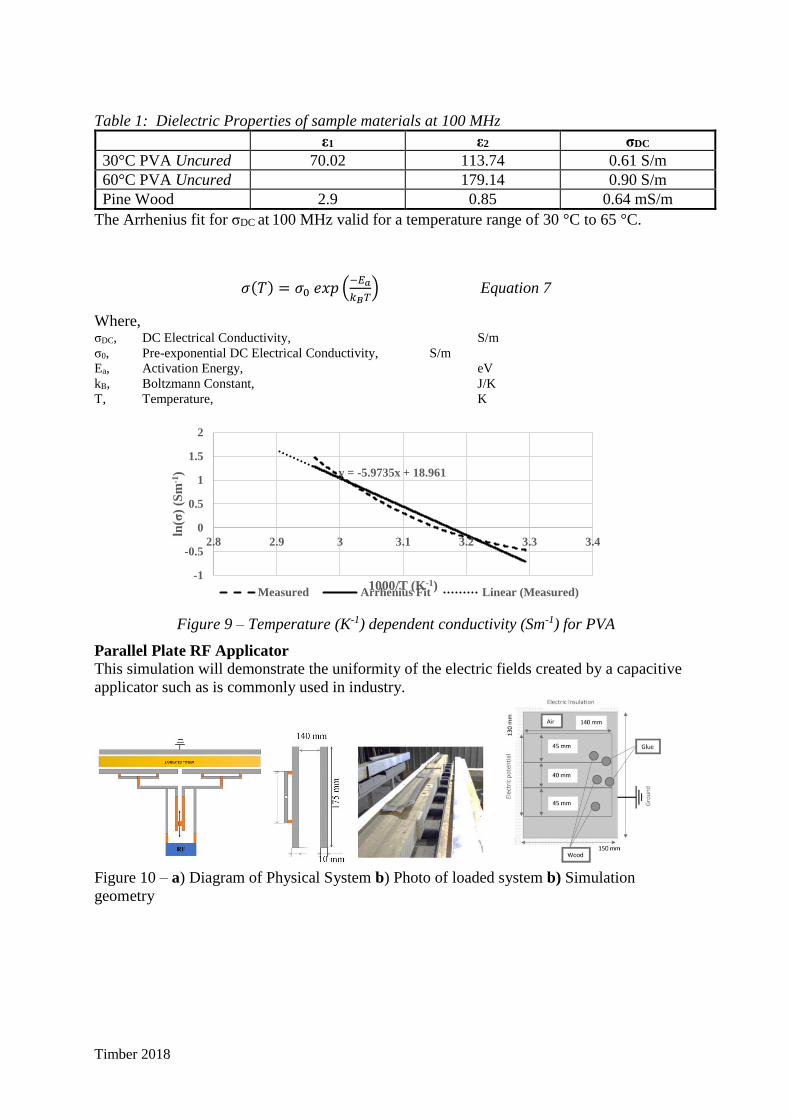
Table 1: Dielectric Properties of sample materials at 100 MHz
ε1 ε2 σDC
30°C PVA Uncured 70.02 113.74 0.61 S/m
60°C PVA Uncured 179.14 0.90 S/m
Pine Wood 2.9 0.85 0.64 mS/m
The Arrhenius fit for σDC at 100 MHz valid for a temperature range of 30 °C to 65 °C.
𝜎(𝑇) = 𝜎0 𝑒𝑥𝑝 (−𝐸𝑎
𝑘𝐵𝑇) Equation 7
Where, σDC, DC Electrical Conductivity, S/m
σ0, Pre-exponential DC Electrical Conductivity, S/m
Ea, Activation Energy, eV
kB, Boltzmann Constant, J/K
T, Temperature, K
Figure 9 – Temperature (K-1) dependent conductivity (Sm-1) for PVA
Parallel Plate RF Applicator
This simulation will demonstrate the uniformity of the electric fields created by a capacitive
applicator such as is commonly used in industry.
Figure 10 – a) Diagram of Physical System b) Photo of loaded system b) Simulation
geometry
y = -5.9735x + 18.961
-1
-0.5
0
0.5
1
1.5
2
2.8 2.9 3 3.1 3.2 3.3 3.4
ln(σ
) (S
m-1
)
1000/T (K-1)Measured Arrhenius Fit Linear (Measured)
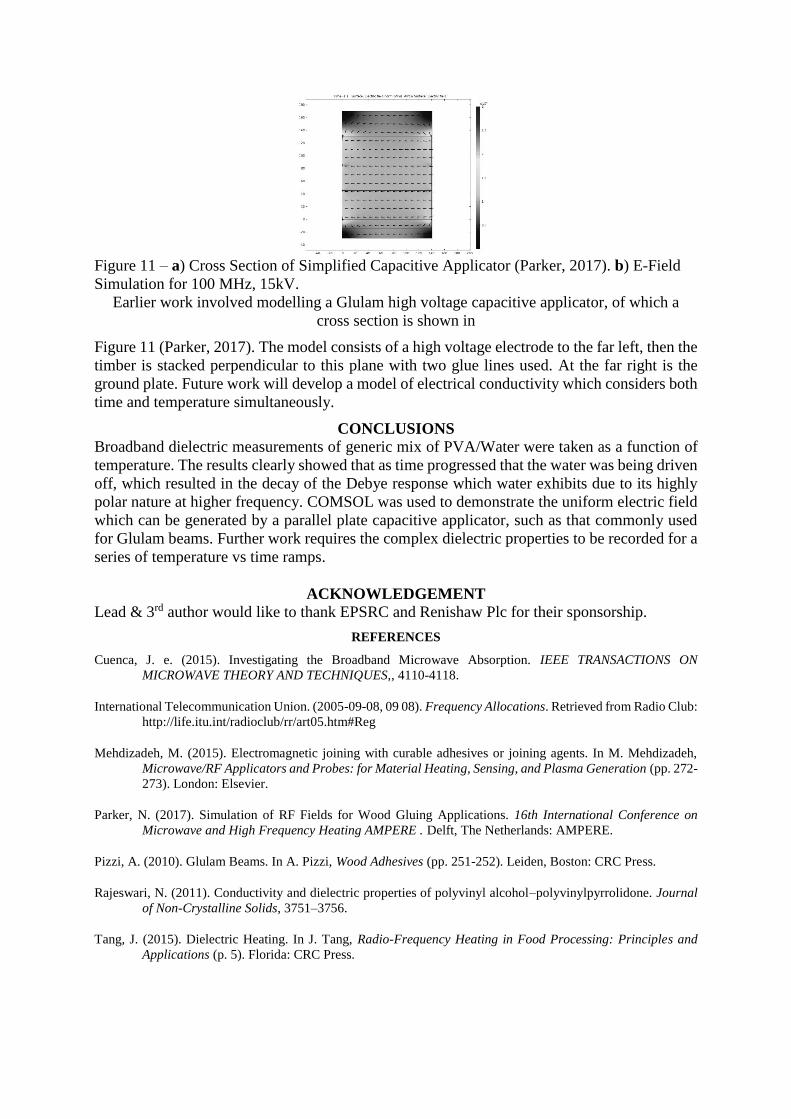
Figure 11 – a) Cross Section of Simplified Capacitive Applicator (Parker, 2017). b) E-Field
Simulation for 100 MHz, 15kV.
Earlier work involved modelling a Glulam high voltage capacitive applicator, of which a
cross section is shown in
Figure 11 (Parker, 2017). The model consists of a high voltage electrode to the far left, then the
timber is stacked perpendicular to this plane with two glue lines used. At the far right is the
ground plate. Future work will develop a model of electrical conductivity which considers both
time and temperature simultaneously.
CONCLUSIONS
Broadband dielectric measurements of generic mix of PVA/Water were taken as a function of
temperature. The results clearly showed that as time progressed that the water was being driven
off, which resulted in the decay of the Debye response which water exhibits due to its highly
polar nature at higher frequency. COMSOL was used to demonstrate the uniform electric field
which can be generated by a parallel plate capacitive applicator, such as that commonly used
for Glulam beams. Further work requires the complex dielectric properties to be recorded for a
series of temperature vs time ramps.
ACKNOWLEDGEMENT
Lead & 3rd author would like to thank EPSRC and Renishaw Plc for their sponsorship.
REFERENCES
Cuenca, J. e. (2015). Investigating the Broadband Microwave Absorption. IEEE TRANSACTIONS ON
MICROWAVE THEORY AND TECHNIQUES,, 4110-4118.
International Telecommunication Union. (2005-09-08, 09 08). Frequency Allocations. Retrieved from Radio Club:
http://life.itu.int/radioclub/rr/art05.htm#Reg
Mehdizadeh, M. (2015). Electromagnetic joining with curable adhesives or joining agents. In M. Mehdizadeh,
Microwave/RF Applicators and Probes: for Material Heating, Sensing, and Plasma Generation (pp. 272-
273). London: Elsevier.
Parker, N. (2017). Simulation of RF Fields for Wood Gluing Applications. 16th International Conference on
Microwave and High Frequency Heating AMPERE . Delft, The Netherlands: AMPERE.
Pizzi, A. (2010). Glulam Beams. In A. Pizzi, Wood Adhesives (pp. 251-252). Leiden, Boston: CRC Press.
Rajeswari, N. (2011). Conductivity and dielectric properties of polyvinyl alcohol–polyvinylpyrrolidone. Journal
of Non-Crystalline Solids, 3751–3756.
Tang, J. (2015). Dielectric Heating. In J. Tang, Radio-Frequency Heating in Food Processing: Principles and
Applications (p. 5). Florida: CRC Press.