Breakdowns and Breakthroughs: Handoffs Between Sales and Marketing
17
Oxymoron or greenfield opportunity? Process Discipline & Marketing John Donlon Research Director, Marketing Operations Strategies October 22, 2014
-
Upload
brad-power -
Category
Marketing
-
view
700 -
download
0
Transcript of Breakdowns and Breakthroughs: Handoffs Between Sales and Marketing
Oxymoron or greenfield opportunity?
Process Discipline & Marketing
John DonlonResearch Director, Marketing Operations Strategies
October 22, 2014
© 2014 SiriusDecisions. All Rights Reserved 2
Agenda• Process improvement examples in marketing• Marketing’s process priorities• Key takeaways• Q&A
© 2014 SiriusDecisions. All Rights Reserved 3
Example 1: Marketing Asset Production
Problem Statement:The cycle times for producing marketing assets that support demand generation activities have great variability. In particular, producing an email took between 6 and 84 calendar days, with an Interquartile Range (IQR) of 28 days. With inefficient asset production, lead generation was inconsistent, resulting in surges and droughts of leads for the sales team.
© 2014 SiriusDecisions. All Rights Reserved 4
Fewer Snowflakes
Goal Statement:In six months, shrink the variability of email production in half—from 28 to 14 calendar days—as measured by the IQR.
© 2014 SiriusDecisions. All Rights Reserved 5
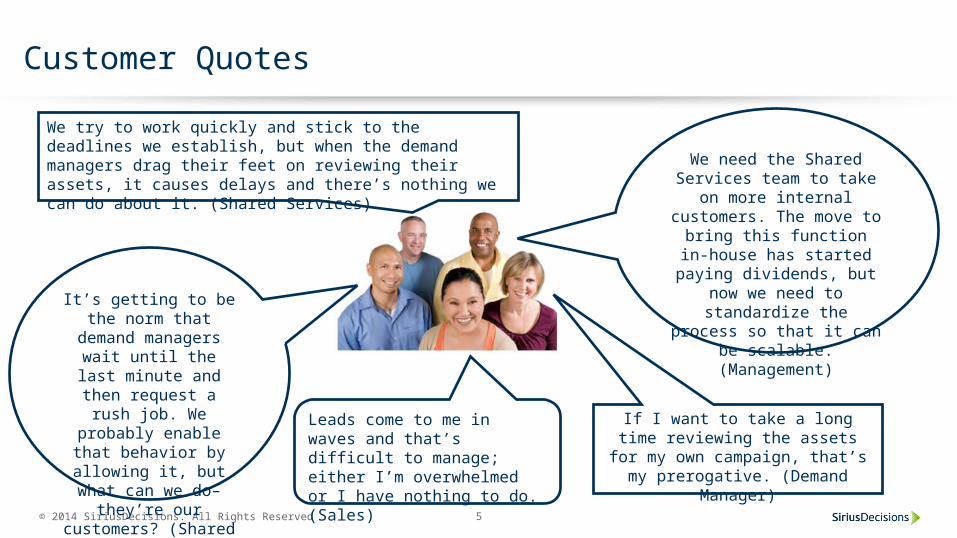
We try to work quickly and stick to the deadlines we establish, but when the demand managers drag their feet on reviewing their assets, it causes delays and there’s nothing we can do about it. (Shared Services)
We need the Shared Services team to take on more internal customers.
The move to bring this function in-house has
started paying dividends, but now we need to
standardize the process so that it can be scalable.
(Management)
If I want to take a long time reviewing the assets for my own campaign, that’s my prerogative.
(Demand Manager)
Leads come to me in waves and that’s difficult to manage; either I’m overwhelmed or I have nothing to do. (Sales)
It’s getting to be the norm that demand managers wait until the last minute and then request a rush
job. We probably enable that behavior
by allowing it, but what can we do–
they’re our customers? (Shared
Services)
Customer Quotes
© 2014 SiriusDecisions. All Rights Reserved 6
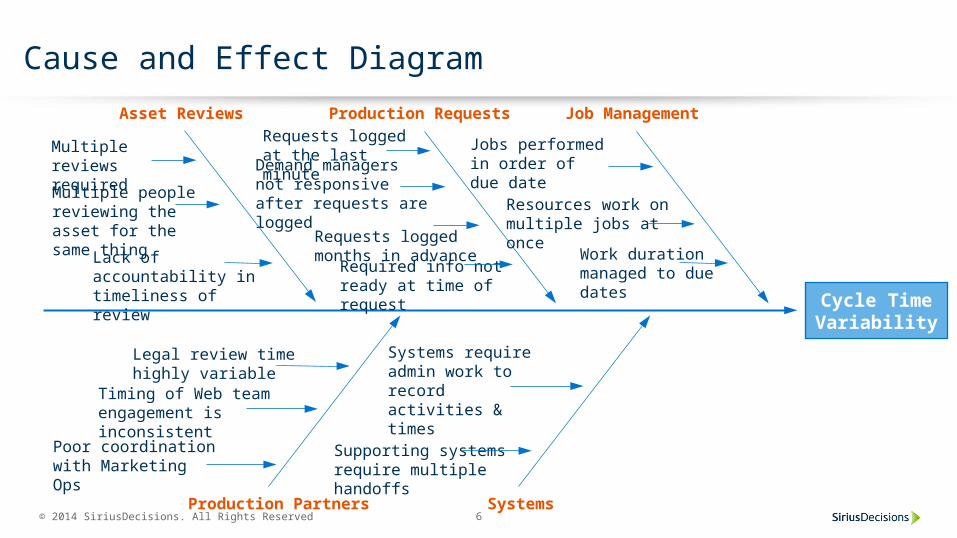
Cycle TimeVariability
Systems
Production Requests Job Management
Required info not ready at time of request
Requests logged months in advance
Demand managers not responsive after requests are logged
Systems require admin work to record activities & times
Supporting systems require multiple handoffs
Production Partners
Legal review time highly variable
Timing of Web team engagement is inconsistent
Poor coordination with Marketing Ops
Lack of accountability in timeliness of review
Multiple people reviewing the asset for the same thing
Asset Reviews
Resources work on multiple jobs at once
Jobs performed in order of due date
Multiple reviews required
Requests logged at the last minute
Work duration managed to due dates
Cause and Effect Diagram
© 2014 SiriusDecisions. All Rights Reserved 7
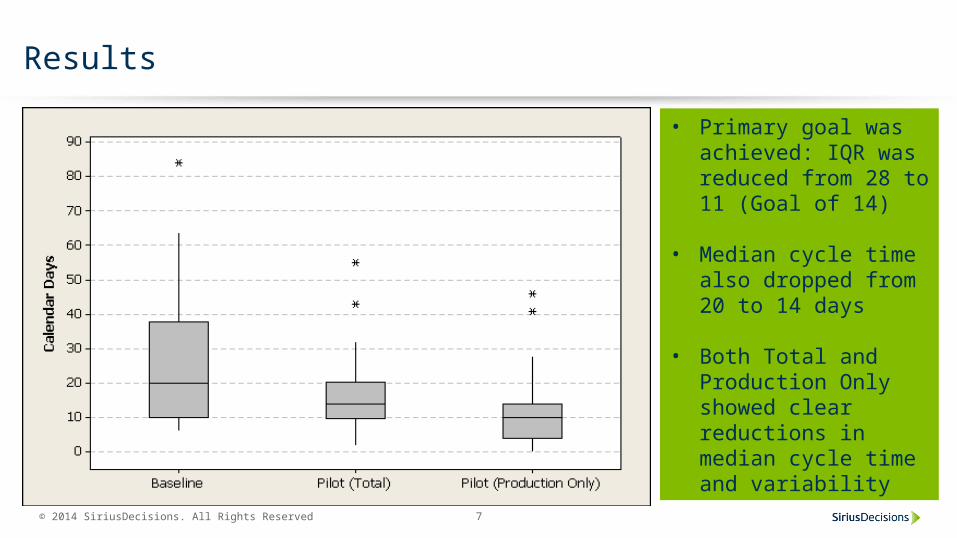
• Primary goal was achieved: IQR was reduced from 28 to 11 (Goal of 14)
• Median cycle time also dropped from 20 to 14 days
• Both Total and Production Only showed clear reductions in median cycle time and variability
Results
© 2014 SiriusDecisions. All Rights Reserved 8
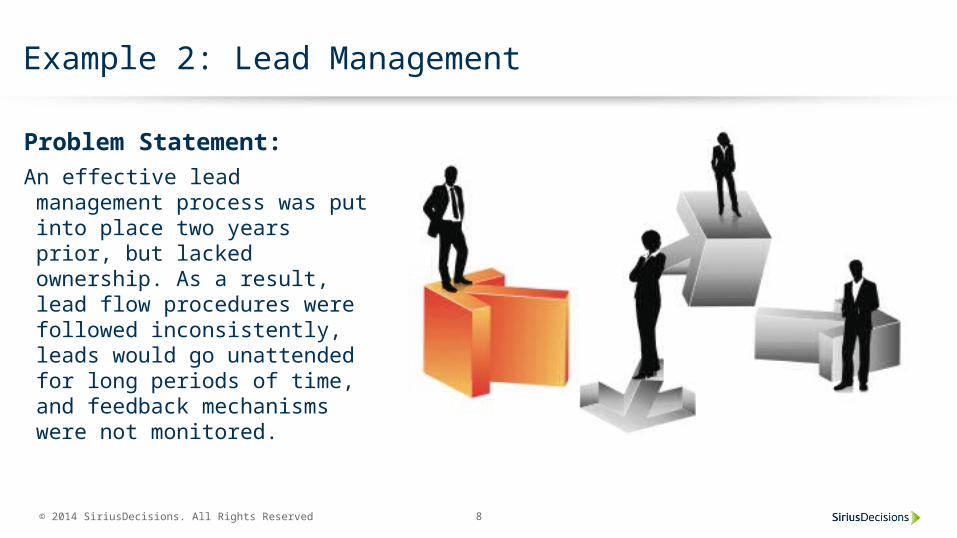
Example 2: Lead Management
Problem Statement:An effective lead management process was put into place two years prior, but lacked ownership. As a result, lead flow procedures were followed inconsistently, leads would go unattended for long periods of time, and feedback mechanisms were not monitored.
© 2014 SiriusDecisions. All Rights Reserved 9
Own It
Goal Statement:Assign distinct process ownership and improve MQL-to-Close conversion rate from 7.2% to 10% by end of year.
© 2014 SiriusDecisions. All Rights Reserved 10
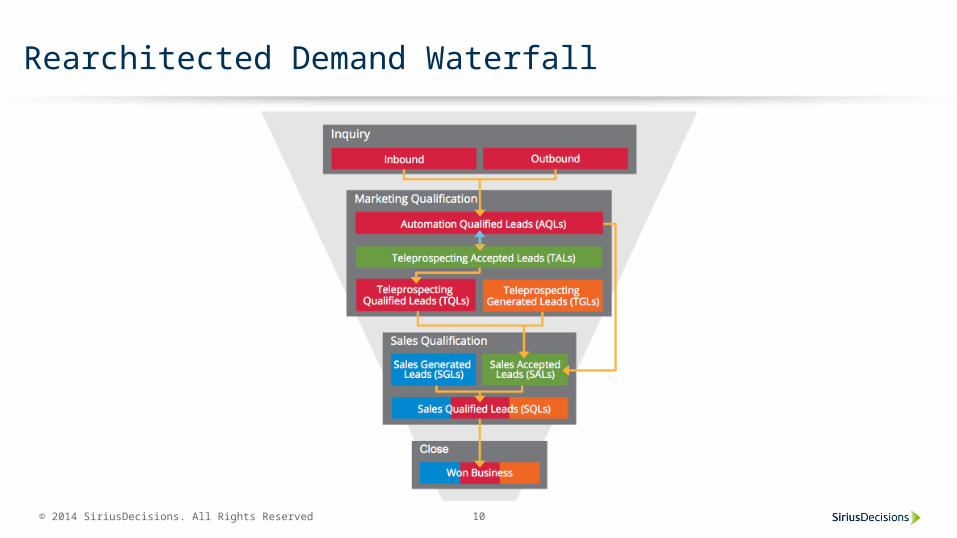
Rearchitected Demand Waterfall
© 2014 SiriusDecisions. All Rights Reserved 11
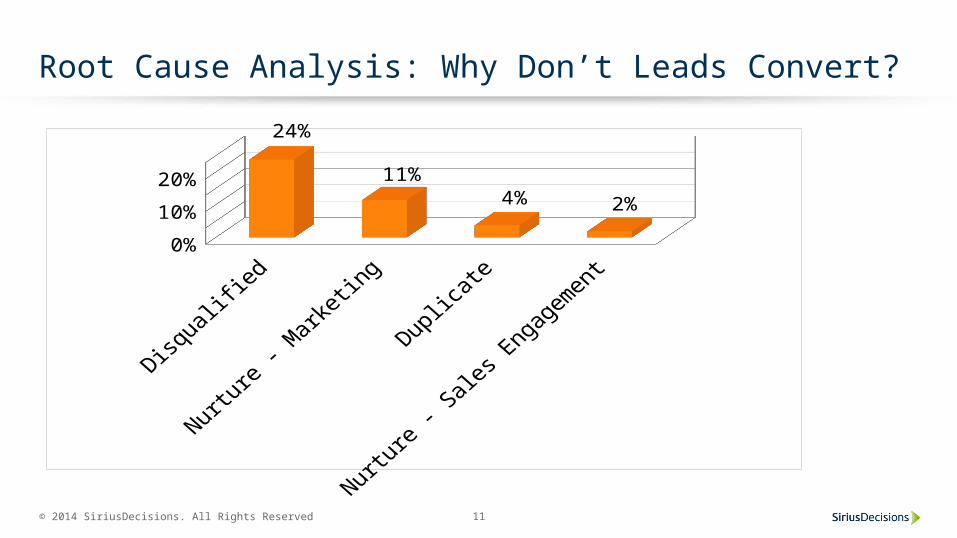
Root Cause Analysis: Why Don’t Leads Convert?
Disqualified Nurture - Marketing
Duplicate Nurture - Sales Engagement
0%
5%
10%
15%
20%
25%24%
11%
4%2%
© 2014 SiriusDecisions. All Rights Reserved 12
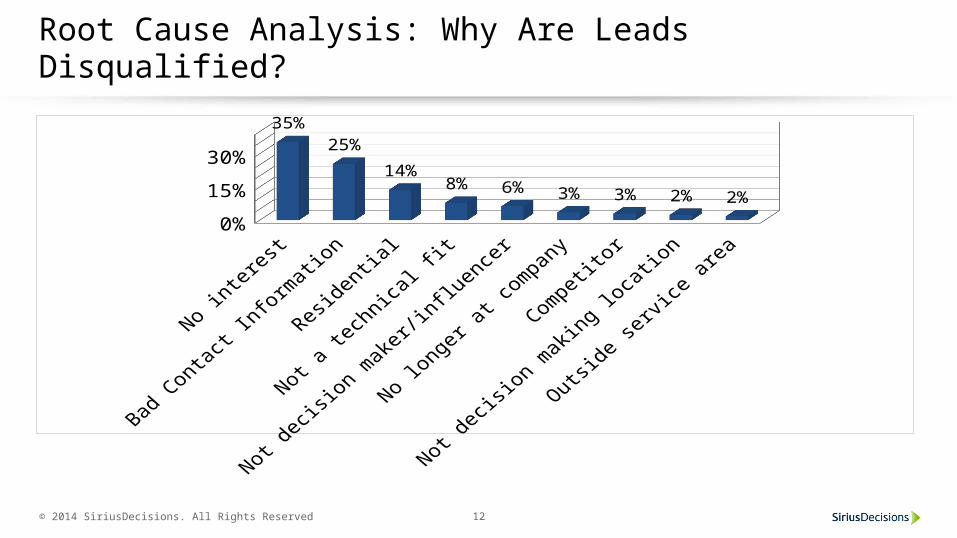
Root Cause Analysis: Why Are Leads Disqualified?
No inter
est
Bad Contac
t Inform
ation
Residen
tial
Not a te
chnica
l fit
Not deci
sion m
aker/
influencer
No longe
r at c
ompany
Competitor
Not deci
sion m
aking l
ocation
Outside s
ervice
area
0%10%20%30%40% 35%
25%
14%8% 6% 3% 3% 2% 2%
© 2014 SiriusDecisions. All Rights Reserved 13
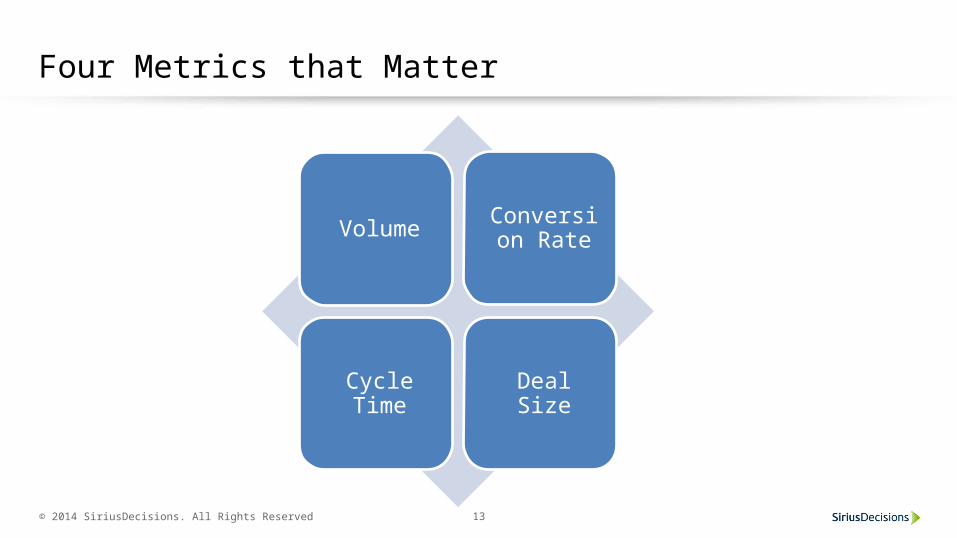
Four Metrics that Matter
Volume Conversion Rate
Cycle Time Deal Size
© 2014 SiriusDecisions. All Rights Reserved 14
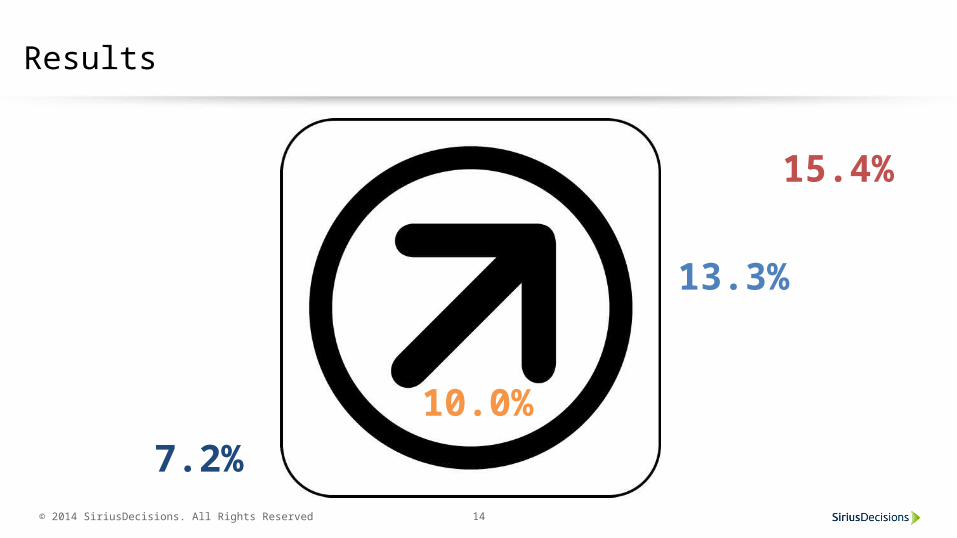
Results
7.2%10.0%
13.3%
15.4%
© 2014 SiriusDecisions. All Rights Reserved 15
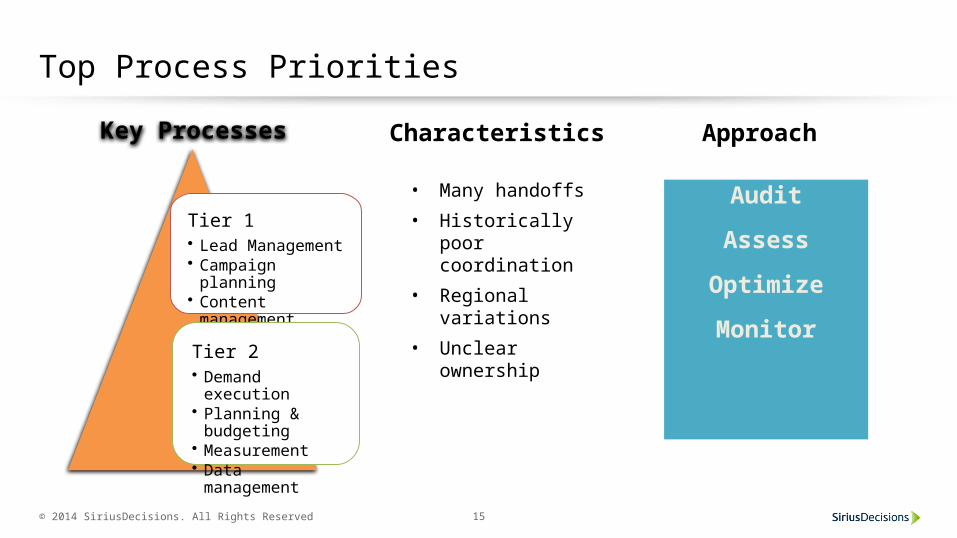
Top Process Priorities
AuditAssess
OptimizeMonitor
• Many handoffs• Historically poor
coordination• Regional
variations• Unclear
ownership
Tier 1• Lead Management• Campaign
planning• Content
managementTier 2• Demand
execution• Planning &
budgeting• Measurement• Data
management
Key Processes Characteristics Approach
© 2014 SiriusDecisions. All Rights Reserved 16
Key Takeaways• Alignment between sales and marketing is a constant challenge• Sales and marketing are more data-driven than ever• Lead with the business outcome, not the process mumbo-jumbo• Snap a baseline, measure results and publicize wins• Assign ownership, utilize playbooks and consider gamification
to kickstart compliance

© 2014 SiriusDecisions. All Rights Reserved 17
@L2R_Guy