Biochemical Analysis on the Interaction of Human...
75
Title Biochemical Analysis on the Interaction of Human Matrix Metalloproteinase 7 and Thermolysin with 8- Anilinonaphthalene 1-Sulfonate, Heparin, and Cholesterol Sulfate( Dissertation_全文 ) Author(s) VIMBAI, NETSAI CHARITY SAMUKANGE Citation Kyoto University (京都大学) Issue Date 2015-03-23 URL https://doi.org/10.14989/doctor.k19017 Right Type Thesis or Dissertation Textversion ETD Kyoto University
Transcript of Biochemical Analysis on the Interaction of Human...
Title
Biochemical Analysis on the Interaction of Human MatrixMetalloproteinase 7 and Thermolysin with 8-Anilinonaphthalene 1-Sulfonate, Heparin, and CholesterolSulfate( Dissertation_全文 )
Author(s) VIMBAI, NETSAI CHARITY SAMUKANGE
Citation Kyoto University (京都大学)
Issue Date 2015-03-23
URL https://doi.org/10.14989/doctor.k19017
Right
Type Thesis or Dissertation
Textversion ETD
Kyoto University
Biochemical Analysis on the Interaction of Human Matrix
Metalloproteinase 7 and Thermolysin with 8-Anilinonaphthalene
1-Sulfonate, Heparin, and Cholesterol Sulfate
VIMBAI NETSAI CHARITY SAMUKANGE
2015

Contents
Introduction 1
Chapter 1 4
Interaction of 8-Anilinonaphthalene 1-Sulfonate (ANS) and Human Matrix
Metalloproteinase 7 (MMP-7) as Examined by MMP-7 Activity and ANS
Fluorescence
Chapter 2 21
Effects of Heparin and Cholesterol Sulfate on the Activity and Stability of
Human Matrix Metalloproteinase 7
Chapter 3 41
Effects of Salts on the Interactions of 8-Anilinonaphthalene 1-Sulfonate
and Thermolysin
Summary 56
References 58
Acknowledgments 67
List of Publications 68

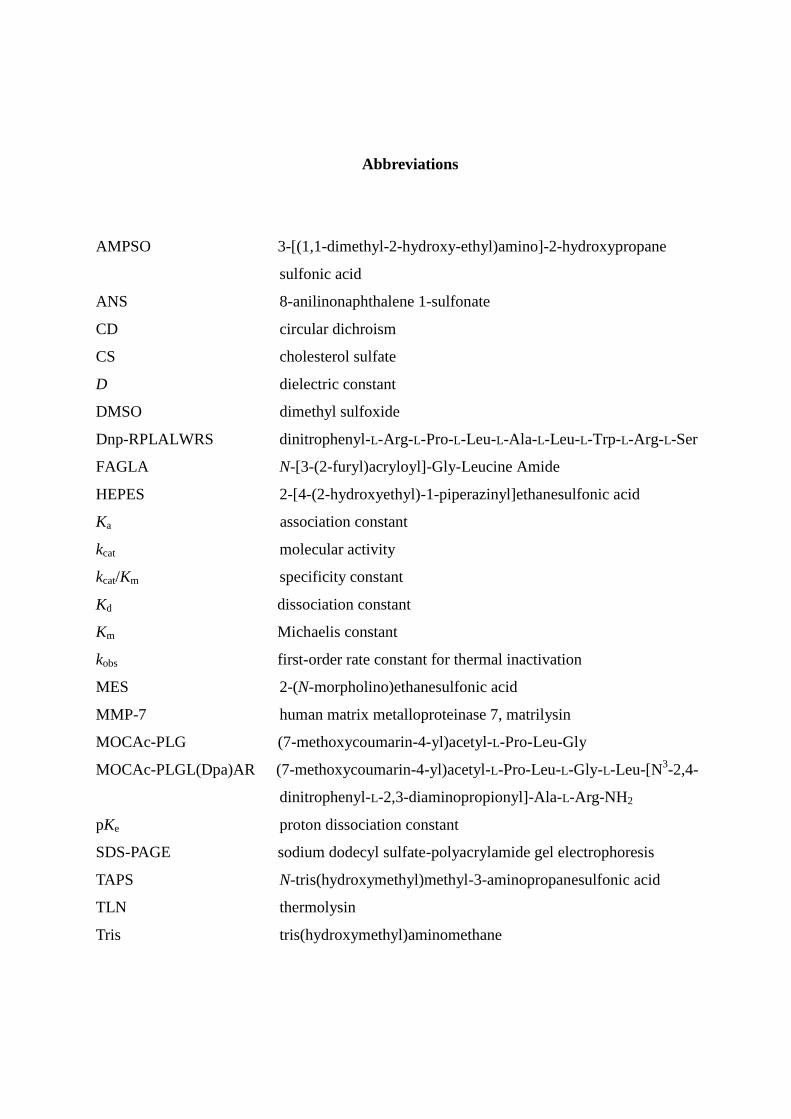
Abbreviations
AMPSO 3-[(1,1-dimethyl-2-hydroxy-ethyl)amino]-2-hydroxypropane
sulfonic acid
ANS 8-anilinonaphthalene 1-sulfonate
CD circular dichroism
CS cholesterol sulfate
D dielectric constant
DMSO dimethyl sulfoxide
Dnp-RPLALWRS dinitrophenyl-L-Arg-L-Pro-L-Leu-L-Ala-L-Leu-L-Trp-L-Arg-L-Ser
FAGLA N-[3-(2-furyl)acryloyl]-Gly-Leucine Amide
HEPES 2-[4-(2-hydroxyethyl)-1-piperazinyl]ethanesulfonic acid
Ka association constant
kcat molecular activity
kcat/Km specificity constant
Kd dissociation constant
Km Michaelis constant
kobs first-order rate constant for thermal inactivation
MES 2-(N-morpholino)ethanesulfonic acid
MMP-7 human matrix metalloproteinase 7, matrilysin
MOCAc-PLG (7-methoxycoumarin-4-yl)acetyl-L-Pro-Leu-Gly
MOCAc-PLGL(Dpa)AR (7-methoxycoumarin-4-yl)acetyl-L-Pro-Leu-L-Gly-L-Leu-[N3-2,4-
dinitrophenyl-L-2,3-diaminopropionyl]-Ala-L-Arg-NH2
pKe proton dissociation constant
SDS-PAGE sodium dodecyl sulfate-polyacrylamide gel electrophoresis
TAPS N-tris(hydroxymethyl)methyl-3-aminopropanesulfonic acid
TLN thermolysin
Tris tris(hydroxymethyl)aminomethane

1
Introduction
Zinc containing neutral metalloproteases are a homologous group of structurally
related proteases that have an absolute requirement for zinc ions for catalytic activity (1).
The Zinc containing metalloproteases, human matrix metalloproteinase 7 (MMP-7) [EC
3.4.24.23], the smallest matrix metalloprotease (MMP) (2, 3), and thermolysin (TLN)
[EC 3.4.24.27], the principal archetypal metalloprotease, (4) are the prime focus of this
research.
Human matrix metalloproteinase 7 (MMP-7) lacks a carboxyl terminal
haemopoxin-like domain that is conserved in most MMPs. The molecular mass of the
latent pro-form is 28 kDa and that of the mature form is 19 kDa (5). MMP-7 is
composed of a five-stranded -sheet and three -helices, and one zinc ion, essential for
catalytic activity and an additional zinc and two calcium ions that are considered
necessary for stability (6).
MMP-7 is frequently overexpressed in human cancer tissues (7-12) and degrades
extracellular material components (2, 3, 5), suggesting that MMP-7 plays an important
role in cancer metastasis/progression. From this view point, development of MMP-7
inhibitors is considered to be of therapeutic benefit. In recent years, target molecules
through which MMP-7 exerts biological functions have become apparent, including
heparin (13), heparan sulfate (13), cholesterol sulfate (14-16), and ErbB4 receptor (17).
Heparin is a highly negatively charged glycosaminoglycan. Glycosaminoglycans
play critical roles in the conversion of promatrilysin into the active form (18).
Extraction experiments and confocal microscopy studies have established that
glycosaminoglycans on or around the epithelial cells and in the underlying basement
membranes act as anchors or docking materials for MMP-7 (13). As anchors or docking
materials, glycosaminoglycans, particularly heparin sulfate, hold the enzyme thereby
preventing it from diffusing in the body fluids. The anchored protein is thus kept in a
fixed position that allows it to carry out its proteolytic functions (13).
Cholesterol sulfate (CS) is a highly amphipathic molecule containing a sulfate group,
a sterol ring, and hydrophobic side chains. It is widely distributed in various body fluids
2
and in tissues and cells, including erythrocytes, platelets, skin, hair, adrenals, lung, and
the brain. It has been reported that under physiological conditions, MMP-7 binds to the
CS present in the cellular membranes of colon cancer cells and causes proteolysis (14,
19, 20). These reports on heparin and CS have revealed that they are involved in the
biological functions of MMP-7.
8-Anilinonaphthalene 1-sulfonate (ANS) is a fluorescent probe widely used for the
analysis of proteins (21, 22). It has hydrophobic and hydrophilic groups. It emits large
fluorescence energy when the anilinonaphthalene group binds with proteins through
hydrophobic interaction, however it does not fluoresce when the sulfonic group binds
with proteins through electrostatic interaction (23). ANS is used in the analysis of
proteins to characterize folding intermediates because of its high affinity for partially
molten-like globule states which are absent in native or denatured protein (24-27), to
detect environmental or ligand-induced conformational changes (28-29), to measure
surface hydrophobicity (30), to characterize the binding sites of ligands on proteins, and
to detect aggregation or fibrillation (31-33).
To explore the mechanism of the binding of MMP-7 with naturally occurring
sulfated glycosaminoglycans and CS, ANS is the probe of choice due to the following
reasons (i) it contains a sulfonic group similar to the sulfated groups in
glycosaminoglycans and a hydrophobic group just like CS, thus raising the possibility
that the binding sites of MMP-7 for ANS are similar to those for the sulfated
glycosaminoglycans or CS and (ii) the binding of MMP-7 with ANS is more easily
characterized than that for sulfated glycosaminoglycans.
Thermolysin (TLN) is a thermostable neutral metalloprotease (34, 35). It consists of
316 amino acid residues (36), one zinc ion for activity, and four calcium ions required
for structural stability (37-39). X-ray crystallographic analysis has revealed that it
consists of a -rich N-terminal domain and an -helical C-terminal domain (40, 41). As
previously highlighted, TLN is the principal archetypal metalloprotease and for years
now it has served as a model system to study the inhibition and activation mechanisms
of other metalloproteinases (4, 42). To date much of the data used to derive the currently
held views of the chemical mechanisms of the metalloproteases is derived from detailed
3
structural and kinetic analysis of this protease (4). Thiorphan (44, 45) and silanediol
based compounds, (43) that were initially discovered as inhibitors of TLN activity, have
proved to be equally potent when used against other fellow metalloproteases. TLN, like
MMP-7, is also activated and stabilized by neutral salts (46-48). Both enzymes also
exhibit a bell shaped pH profile with pH optimal around 6-7 (49-53). Due to the
similarity in the interactions between TLN and other metalloproteases with various
compounds, we decided to also study the interactions of TLN with the above named
containing groups.
The objective of this study was to explore the interaction of MMP-7 and TLN with
ANS, heparin, and CS as a function of their catalytic activity, thermal, and
conformational stability, with the hope of understanding and comparing the speculated
and known invivo and invitro interactions of sulfated glycosaminoglycans and
cholesterol sulfate that lead MMP-7 to play a critical role in cancer progression. In
Chapter 1, we examined the effect of ANS on MMP-7 activity. In chapter 2, we
examined the effects of heparin and CS on MMP-7’s activity and stability. In chapter 3,
we explored the effects of salts on TLN using ANS.
4
Chapter 1
Interaction of 8-Anilinonaphthalene 1-Sulfonate (ANS) and Human Matrix
Metalloproteinase 7 (MMP-7) as Examined by MMP-7 Activity and ANS
Fluorescence
Introduction
MMP-7 has been detected in lesions of prostate (7), colon (8), brain (9), stomach
(10), lung (11), and breast (12), and degrades extracellular material components,
including gelatins of types I, III, IV, and V, type IV basement membrane collagen,
fibronectin, vitronectin, proteoglycan, laminin, and elastin (2, 3, 5). This suggests that
MMP-7 plays important roles in tumour invasion and metastasis. In recent years,
target molecules through which MMP-7 exerts biological functions have become
apparent, including heparin (13), heparan sulfate (13), CS (14-16), and ErbB4 receptor
(17). From this viewpoint, understanding the exact nature of MMP-7’s interactions
with the above biological molecules for the development of MMP-7 inhibitors is
considered to be of therapeutic benefit.
8-Anilinonaphthalene 1-sulfonate (ANS) (Fig. 1) is a fluorescent probe widely
used for the analysis of proteins (21, 22). It has hydrophobic and hydrophilic groups. It
emits large fluorescence energy when the anilinonaphthalene group binds with
proteins through hydrophobic interaction, however it does not emit fluorescence when
the sulfonic group binds with proteins through electrostatic interaction (23). ANS was
used to explore the mechanism of the binding of MMP-7 with naturally occurring
sulfated glycosaminoglycans, such as heparin, heparan sulfate, and CS, due to the
following reasons: (i) ANS contains a sulfonic group similar to the sulfate groups in
glycosaminglycans and CS and also a hydrophobic group just like CS, thus raising the
possibility that the binding sites of MMP-7 for ANS are similar to those for the
sulfated glycosaminoglycans or CS and (ii) the binding of MMP-7 with ANS is more
easily characterized than that for sulfated glycosaminoglycans. In this study, we
5
describe the interaction of ANS and MMP-7 by examining the effects of ANS on
MMP-7 activity and the effects of MMP-7 on ANS fluorescence.
Materials and Methods
Materials - MOCAc-PLGL(Dpa)AR (lot no. 491214, 1093.2 Da) (Fig 2) (54)
MOCAc-PLG (lot no. 510913, 501.54 Da) were purchased from Peptide Institute
(Osaka, Japan). Their concentrations were determined by the denoted molecular
weight. ANS (lot no. CM10-118, 299.34 Da) was from AnaSpec Inc. (San Jose, CA,
USA). Its concentration was determined spectrophotometrically using the molar
absorption coefficient at 350 nm, ε350, of 5,000 M−1
cm−1
(55, 56).
3-[(1,1-dimethyl-2-hydroxy-ethyl)amino]-2-hydroxypropane sulfonic acid (AMPSO)
was from Wako Pure Chemical (Osaka, Japan). All other chemicals were purchased
from Nacalai Tesque (Kyoto, Japan).
Expression and purification of MMP-7 - Expression in Escherichia coli and
purification of recombinant MMP-7 were carried out, as described previously (57, 58).
Briefly, mature MMP-7 (Tyr78–Lys250) was expressed in BL21(DE3) cells in the
form of inclusion bodies, solubilized with 6 M guanidine HCl, refolded with 1 M
L-arginine and purified by sequential ammonium sulfate precipitation and heparin
affinity column chromatography procedures of the refolded products. The
concentration of MMP-7 was determined spectrophotometrically using the molar
absorption coefficient at 280 nm, ε280, of 31,800 M −1
cm−1
(57, 58).
Fluorometric analysis of the MMP-7-catalysed hydrolysis of
MOCAc-PLGL(Dpa)AR - The reaction buffers were 50 mM acetate–NaOH buffer at
pH 3.5 and 4.5, 50 mM MES–NaOH buffer at pH 5.5 and 6.5, 50 mM HEPES–NaOH
buffer at pH 7.5, and 50 mM AMPSO–NaOH buffer at pH 8.5 and 9.5, each
containing 10 mM CaCl2. Pre-incubation (2,484 µl) was done by mixing 40 µl of the
MMP-7 solution (2 µM in the reaction buffer), 0–250 µl of the ANS solution (5 mM
6
in the reaction buffer), and 2,194–2,444 µl of the reaction buffer. After pre-incubation
at 25°C for 10 min, the reaction was initiated by adding 16 µl of the substrate solution
(234 µM) dissolved in DMSO. The initial concentrations of enzyme,
MOCAc-PLGL(Dpa)AR, and DMSO were 32 nM, 1.5 µM and 0.64% v/v,
respectively. The reaction was measured by following the increase in fluorescence
intensity at 393 nm with excitation at 328 nm using a Shimadzu RF-5300 fluorescence
spectrophotometer (Kyoto, Japan) for 1 min at 25°C. The temperature was maintained
in a range of ±0.2°C. The peptide bond of the Gly–L-Leu residues was cleaved by
MMP-7, and the amount of the product, MOCAc-PLG, was estimated by fluorescence
intensity by comparison with that of the MOCAc-PLG standard solution.
The increase in the fluorescence intensity at 393 nm due to the production of
MOCAc-PLG (ΔFI393) of the reaction mixture is affected by the presence of ANS.
Hence, FI393 was measured with various concentrations of ANS in the absence and in
the presence of 0.46 µM MOCAc-PLG. Based on the results, the ΔFI393 observed at x
µM ANS was corrected as follows:
The MMP-7-catalysed hydrolysis of the MOCAc-PLGL(Dpa)AR substrate was
carried out under pseudo-first order conditions, where the initial concentration (1.5
µM) of the substrate was much lower than Km (60 µM) (59). The Michaelis–Menten
equation is then expressed as:
Eq. 1: vo =
where vo, kcat, [E]o and [S]o mean the initial reaction rate, the molecular activity, the
initial enzyme concentration, and the initial substrate concentration, respectively.
HPLC analysis of the MMP-7-catalysed hydrolysis of MOCAc-PLGL(Dpa)AR -
Pre-incubation (950 µl) was initiated by mixing 16 µl of the MMP-7 solution (2 µM in
[( FI393 of 0.46 µM MOCAc-PLG)-(FI393 of buffer)]
{(FI393 of 0.46 µM MOCAc-PLG plus x µM ANS – (FI393 of x µM ANS)}
(kcat /Km) [E]o[S]o
7
the reaction buffer), 0, 25, 50, 100, 150, or 200 µl of the ANS solution (1 mM in 50
mM HEPES–NaOH buffer at pH 7.5) and 934, 909, 884, 834, 784, or 734 µl of the
reaction buffer. After pre-incubation at 25°C for 10 min, the reaction was initiated by
adding 50 µl of the MOCAc-PLGL(Dpa)AR (0–2.8 mM) dissolved in DMSO (the
total volume of 1,000 µl) at 25°C. The initial concentrations of MMP-7,
MOCAc-PLGL(Dpa)AR and DMSO were 32 nM, 0–140 µM and 5%, respectively.
The reaction was stopped at an appropriate time by mixing 100 µl of the reaction
solution with 400 µl of 1% trifluoroacetic acid (TFA). The mixture (100 µl) was then
applied to reversed-phase HPLC on a TSKgel ODS-80Ts column [4.6 mm (inner
diameter) × 150 mm] (Tosoh, Tokyo, Japan) equilibrated with 0.1% TFA. A linear
gradient was generated from 20% to 70% (v/v) acetonitrile at a retention time of 5 min
over 20 min at a flow-rate of 1.0 ml/min. The absorption of elutes was detected at 335
nm. The substrate and its two products, MOCAc-PLG and L(Dpa)AR, were separated
(48). They were evaluated by the respective peak areas. The vo was determined from
the time course of the production of MOCAc-PLG. The kinetic parameters, kcat and Km,
were determined based on the Michaelis–Menten equation using the nonlinear
least-squares methods. The HPLC apparatus consisted of a solvent delivery system
CCPM, a UV monitoring system UV-8010, a computer control system PX-8010 and
an integrator Chromatocorder 21.
Fluorometric analysis of ANS - Pre-incubation (1,000 µl) was carried out by
mixing 100 µl of the ANS solution (250 µM in the reaction buffer), 400 µl of the
reaction buffer and 500 µl of the MMP-7 solution (1,000 nM in the reaction buffer) at
25°C for 10 min. After the pre-incubation, the fluorescence spectra were measured
with excitation at 380 nm and emission at 400–600 nm with a Shimadzu RF-5300PC
fluorescence spectrophotometer at 25°C.
Circular dichroism (CD) measurement - Pre-incubation (500 µl) was carried out
by mixing 164 µl of the reaction buffer and 336 µl of the MMP-7 solution (10.4 µM in
the reaction buffer) at 25°C for 10 min. After the pre-incubation, the CD spectra were
8
measured using 2-mm cell with Jasco J-820 (Tokyo, Japan) spectropolarimeter
equipped with a Peltier system of cell temperature control. Ellipticity was reported as
mean residue molar ellipticity [θ] (deg cm2 dmol
−1). The spectrometer conditions
were: spectral range 200–270 nm; 100 mdeg sensitivity; 0.2 nm resolutions; 0.2 s
response time; 50 nm min−1
scan rate; and 5 accumulations. The control baseline was
obtained with solvent and all the components without the proteins.
Results
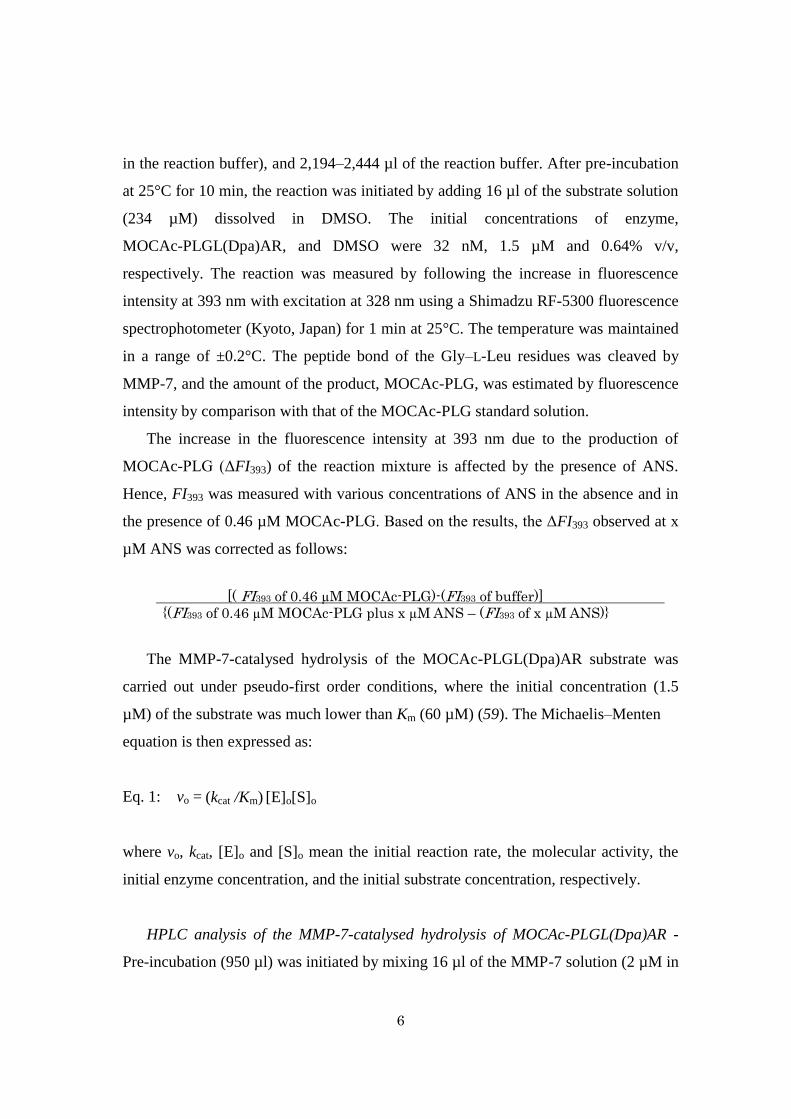
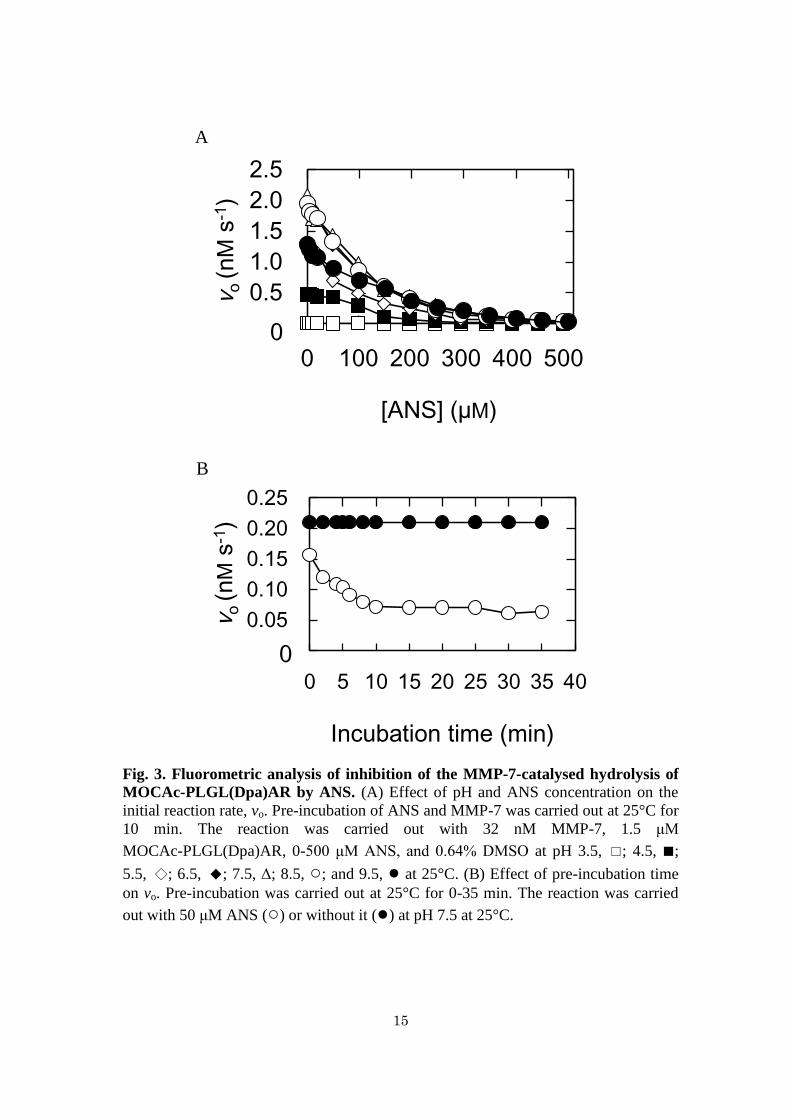
Inhibition of MMP-7 activity by ANS - Figure 3A shows the effects of increasing
concentrations of ANS on MMP-7 activity in the hydrolysis of MOCAc-PLGL(Dpa)AR.
MMP-7 (32 nM) and ANS (0–500 µM) were pre-incubated at pH 3.5–9.5 at 25°C for 10
min followed by the reaction at the same pH at 25°C. At pH 3.5, MMP-7 did not exhibit
activity. At pH 6.5–8.5, it exhibited the highest activity. It is known that MMP-7 has a
bell-shaped pH-dependence activity with the pKe1 and pKe2 values of 4.2–4.6 and
9.7–9.8 (52, 53, 60). The pH dependence of activity observed in the absence of ANS
was in good agreement with the previous results. At pH 4.5–9.5, the initial reaction rates
decreased with increasing ANS concentration, indicating that ANS inhibits MMP-7
activity. The ANS concentrations giving 50% inhibition (IC50 values) at pH 4.5, 5.5, 6.5,
7.5, 8.5, and 9.5 were 120, 64, 90, 96, 92, and 135 µM, respectively. Sodium sulfate
(0–500 µM) did not inhibit MMP-7 activity (data not shown), suggesting that
anilinonaphthalene group of ANS is required for the inhibition of MMP-7 activity.
Figure 3B shows the effects of pre-incubation time on MMP-7 activity. MMP-7 (32 nM)
and ANS (50 µM) were pre-incubated at pH 7.5 at 25°C for 0–35 min followed by the
reaction at pH 7.5 at 25°C. The initial reaction rates decreased with increasing
pre-incubation time and reached the minimum at 10 min, indicating that ANS exhibits
slow-binding inhibition of MMP-7.
Inhibitory manner of ANS against MMP-7 activity - To determine kcat and Km of
MMP-7 in the hydrolysis of MOCAc-PLGL(Dpa)AR separately, the initial reaction
9
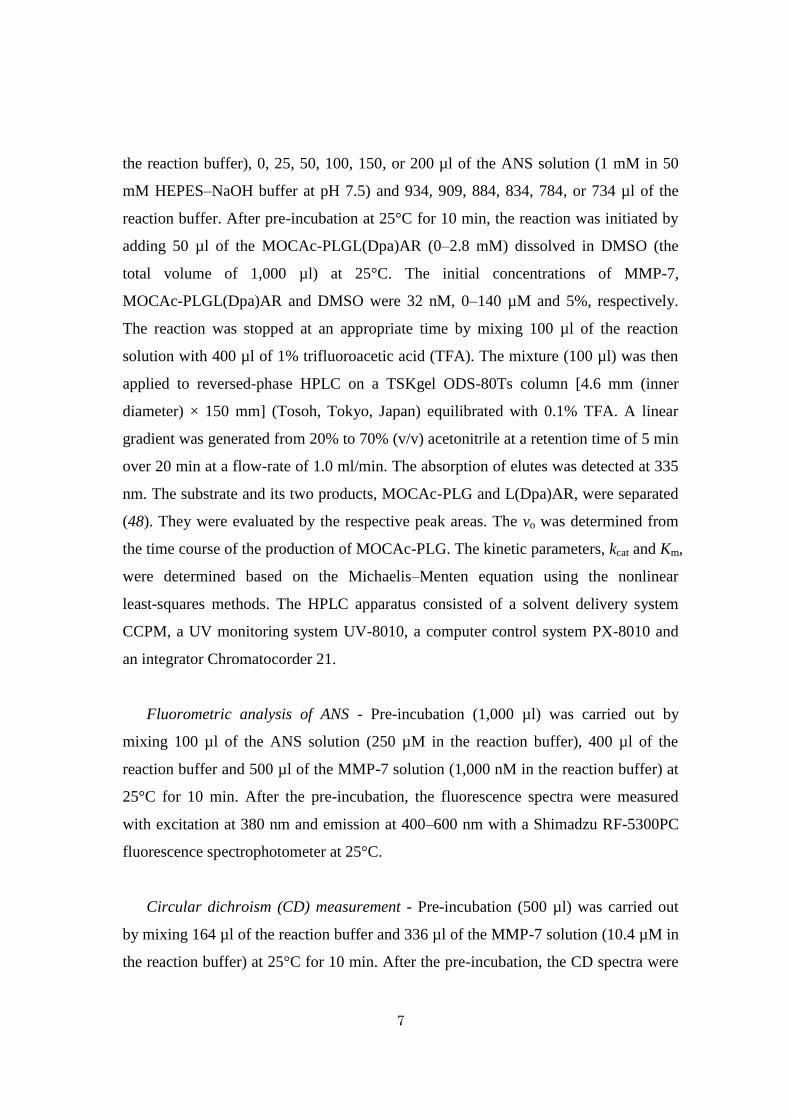
rates in the absence and in the presence of ANS were measured. It was necessary to
increase the concentration of MOCAc-PLGL(Dpa)AR up to 140 µM that is higher than
the Km value (60 µM) (59), and fluorescence detection was not available because of the
internal-filter effect of the substrate. Consequently, the products were detected by HPLC
on a TSK-gel ODS column (48). All the plots showed saturated profiles (Fig. 4A). The
plot of [S]o/vo versus [S]o (Hanes–Woolf plot) in the absence and in the presence of ANS
showed non-parallel lines intersecting at the X-axis, suggesting that the Km value was 52
µM and that the inhibition is non-competitive (Fig. 4B). The kcat values with 0, 25, 50,
100, 150, and 200 µM were determined to be 1.6 ± 0.1, 1.2 ± 0.1, 1.1 ± 0.1, 1.0 ± 0.1, 0.7
± 0.1, and 0.5 ± 0.1 s−1
, respectively. Based on this, the reaction rate can be described as,
Eq. 2: vo =
where [I]o is the initial inhibitor concentration, and Ki is the inhibitor constant. The Ki
value of ANS at pH 7.5 was calculated to be 110 ± 20 µM from Eq. 2, which was similar
to the IC50 at pH 7.5 (96 µM) as described above.
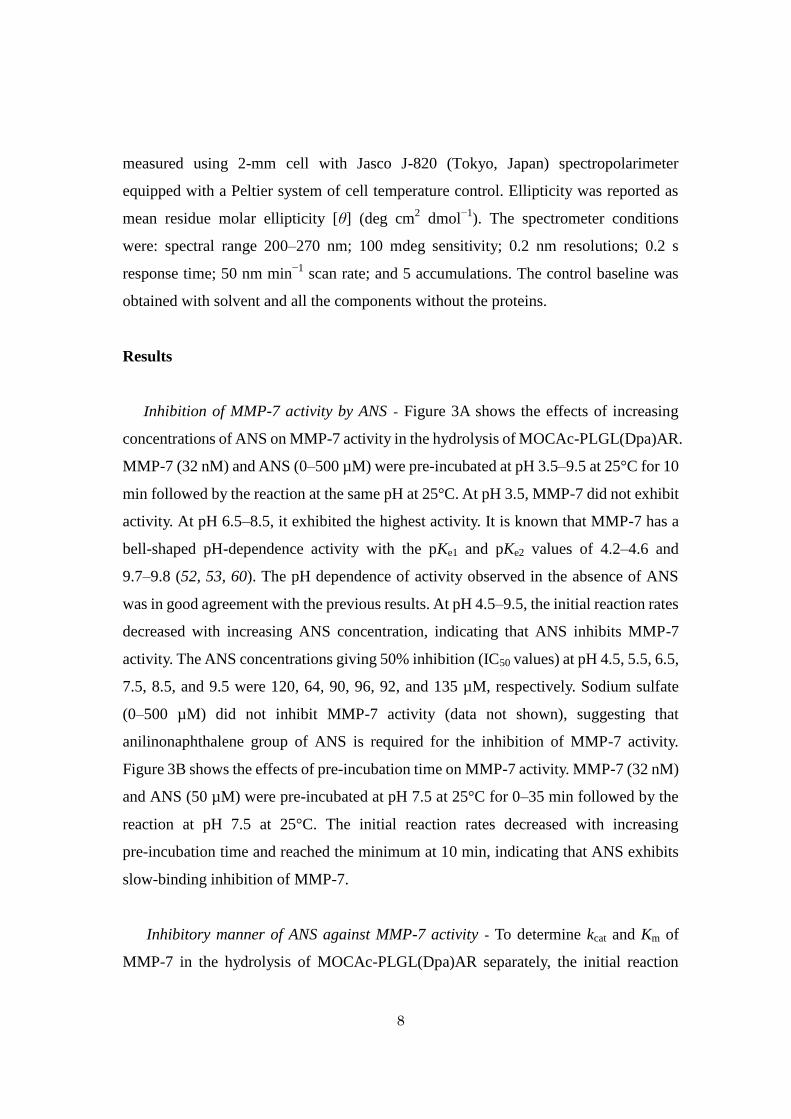
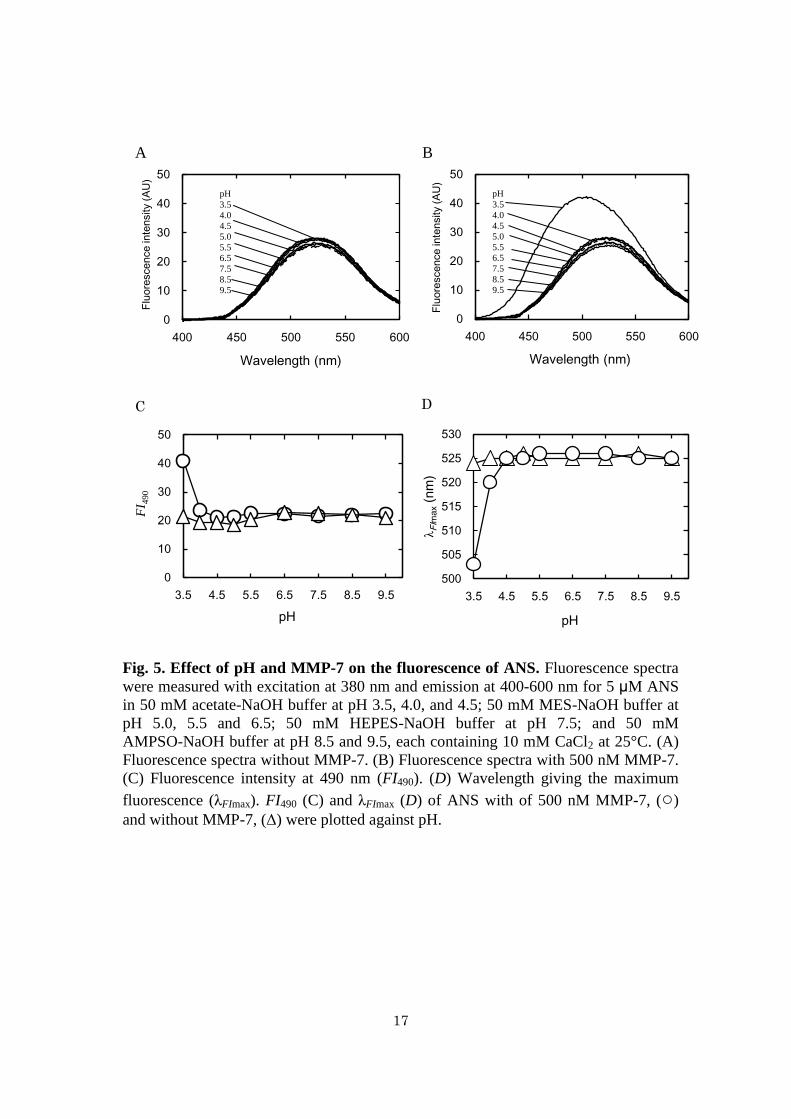
Effects of MMP-7 on the fluorescence of ANS - Fluorescence spectra of ANS in the
absence and in the presence of MMP-7 were measured (Fig. 5). The shape of the
fluorescence spectra of ANS measured at pH 3.5–9.5 in the absence of MMP-7 were
almost the same, although the intensity of those at pH 3.5–4.5 was slightly higher than
that of those at pH 5.0–9.5 (Fig. 5A), but the spectrum observed at pH 3.5 in the
presence of 500 nM MMP-7 was drastically changed in comparison to that in its
absence (Fig. 5B): the fluorescence intensity at 490 nm (FI490) with 500 nM MMP-7
was 200% of that without it (Fig. 5C), and the wavelength giving the maximum
fluorescence (λFImax) with 500 nM MMP-7 was shorter by 20 nm than that without it.
On the other hand, there were no differences in FI490 (Fig. 5C) and λFImax (Fig. 5D)
among the spectra without MMP-7 at pH 3.5–9.5 and those with 500 nM MMP-7 at
pH 4.0–9.5. These results suggest that the anilinonaphthalene group of ANS does not
kcat[E]o[S]o
(Km + [S]o) 1 + [I]o
Ki
10
bind with hydrophobic regions of MMP-7 at pH 4.0–9.5, but binds at pH 3.5.
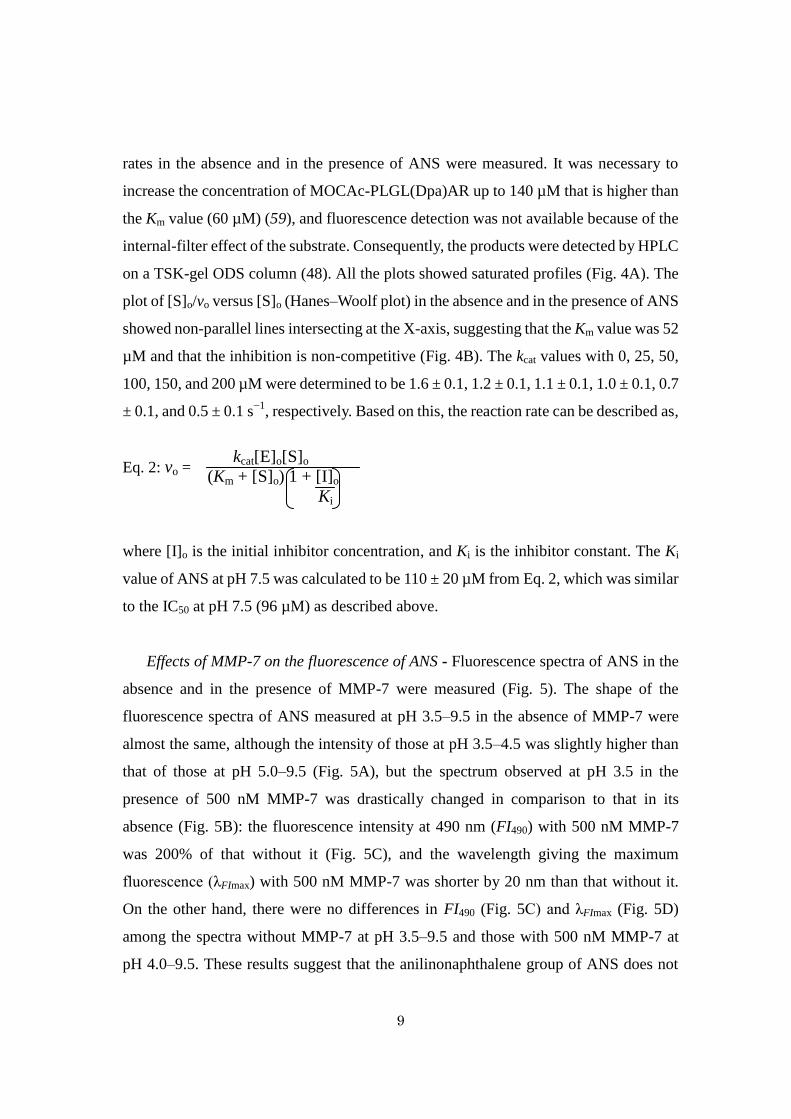
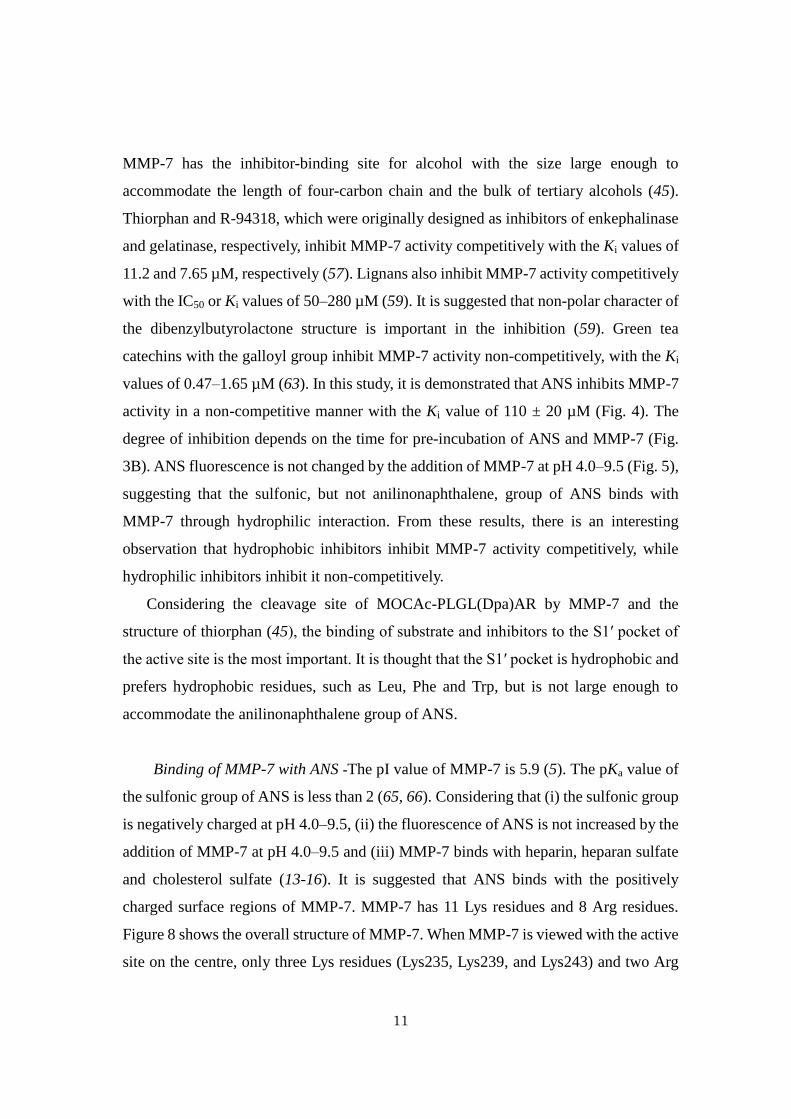
Effects of pH on the CD spectra of MMP-7 - CD spectra of MMP-7 in the absence of
ANS were measured at pH 3.5–9.5 (Fig. 6). Each spectrum was characterized by
negative ellipticities at around 206–230 nm with the peaks around 208 and 225 nm,
indicating that there is little difference in secondary structure. The ellipticities at
206–230 nm at pH 3.5 were slightly smaller than those at pH 4.5–9.5. The contents of
α-helix, β-sheet, calculated based on the reference spectra (61), at pH 3.5 were 31, 31,
and 38%, respectively, and those at pH 4.5–9.5 in average were 31, 34, and 35%,
respectively. This suggests that MMP-7 did not receive a drastic structural change at pH
3.5.
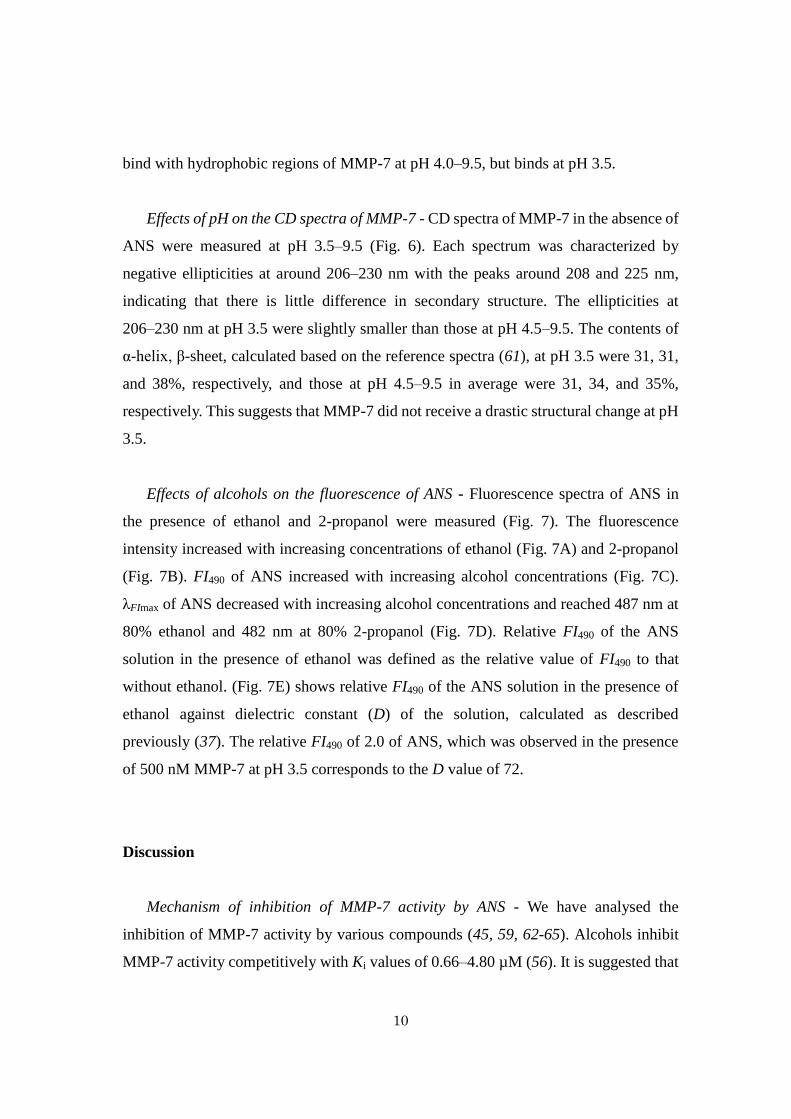
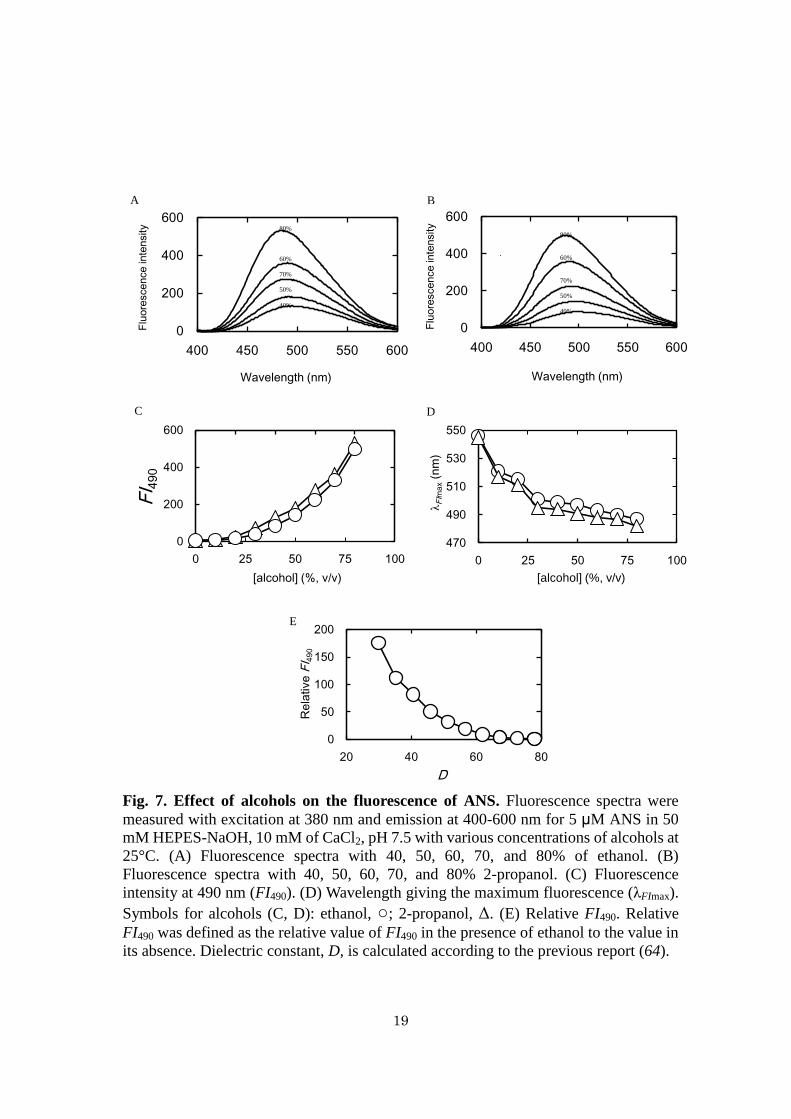
Effects of alcohols on the fluorescence of ANS - Fluorescence spectra of ANS in
the presence of ethanol and 2-propanol were measured (Fig. 7). The fluorescence
intensity increased with increasing concentrations of ethanol (Fig. 7A) and 2-propanol
(Fig. 7B). FI490 of ANS increased with increasing alcohol concentrations (Fig. 7C).
λFImax of ANS decreased with increasing alcohol concentrations and reached 487 nm at
80% ethanol and 482 nm at 80% 2-propanol (Fig. 7D). Relative FI490 of the ANS
solution in the presence of ethanol was defined as the relative value of FI490 to that
without ethanol. (Fig. 7E) shows relative FI490 of the ANS solution in the presence of
ethanol against dielectric constant (D) of the solution, calculated as described
previously (37). The relative FI490 of 2.0 of ANS, which was observed in the presence
of 500 nM MMP-7 at pH 3.5 corresponds to the D value of 72.
Discussion
Mechanism of inhibition of MMP-7 activity by ANS - We have analysed the
inhibition of MMP-7 activity by various compounds (45, 59, 62-65). Alcohols inhibit
MMP-7 activity competitively with Ki values of 0.66–4.80 µM (56). It is suggested that
11
MMP-7 has the inhibitor-binding site for alcohol with the size large enough to
accommodate the length of four-carbon chain and the bulk of tertiary alcohols (45).
Thiorphan and R-94318, which were originally designed as inhibitors of enkephalinase
and gelatinase, respectively, inhibit MMP-7 activity competitively with the Ki values of
11.2 and 7.65 µM, respectively (57). Lignans also inhibit MMP-7 activity competitively
with the IC50 or Ki values of 50–280 µM (59). It is suggested that non-polar character of
the dibenzylbutyrolactone structure is important in the inhibition (59). Green tea
catechins with the galloyl group inhibit MMP-7 activity non-competitively, with the Ki
values of 0.47–1.65 µM (63). In this study, it is demonstrated that ANS inhibits MMP-7
activity in a non-competitive manner with the Ki value of 110 ± 20 µM (Fig. 4). The
degree of inhibition depends on the time for pre-incubation of ANS and MMP-7 (Fig.
3B). ANS fluorescence is not changed by the addition of MMP-7 at pH 4.0–9.5 (Fig. 5),
suggesting that the sulfonic, but not anilinonaphthalene, group of ANS binds with
MMP-7 through hydrophilic interaction. From these results, there is an interesting
observation that hydrophobic inhibitors inhibit MMP-7 activity competitively, while
hydrophilic inhibitors inhibit it non-competitively.
Considering the cleavage site of MOCAc-PLGL(Dpa)AR by MMP-7 and the
structure of thiorphan (45), the binding of substrate and inhibitors to the S1′ pocket of
the active site is the most important. It is thought that the S1′ pocket is hydrophobic and
prefers hydrophobic residues, such as Leu, Phe and Trp, but is not large enough to
accommodate the anilinonaphthalene group of ANS.
Binding of MMP-7 with ANS -The pI value of MMP-7 is 5.9 (5). The pKa value of
the sulfonic group of ANS is less than 2 (65, 66). Considering that (i) the sulfonic group
is negatively charged at pH 4.0–9.5, (ii) the fluorescence of ANS is not increased by the
addition of MMP-7 at pH 4.0–9.5 and (iii) MMP-7 binds with heparin, heparan sulfate
and cholesterol sulfate (13-16). It is suggested that ANS binds with the positively
charged surface regions of MMP-7. MMP-7 has 11 Lys residues and 8 Arg residues.
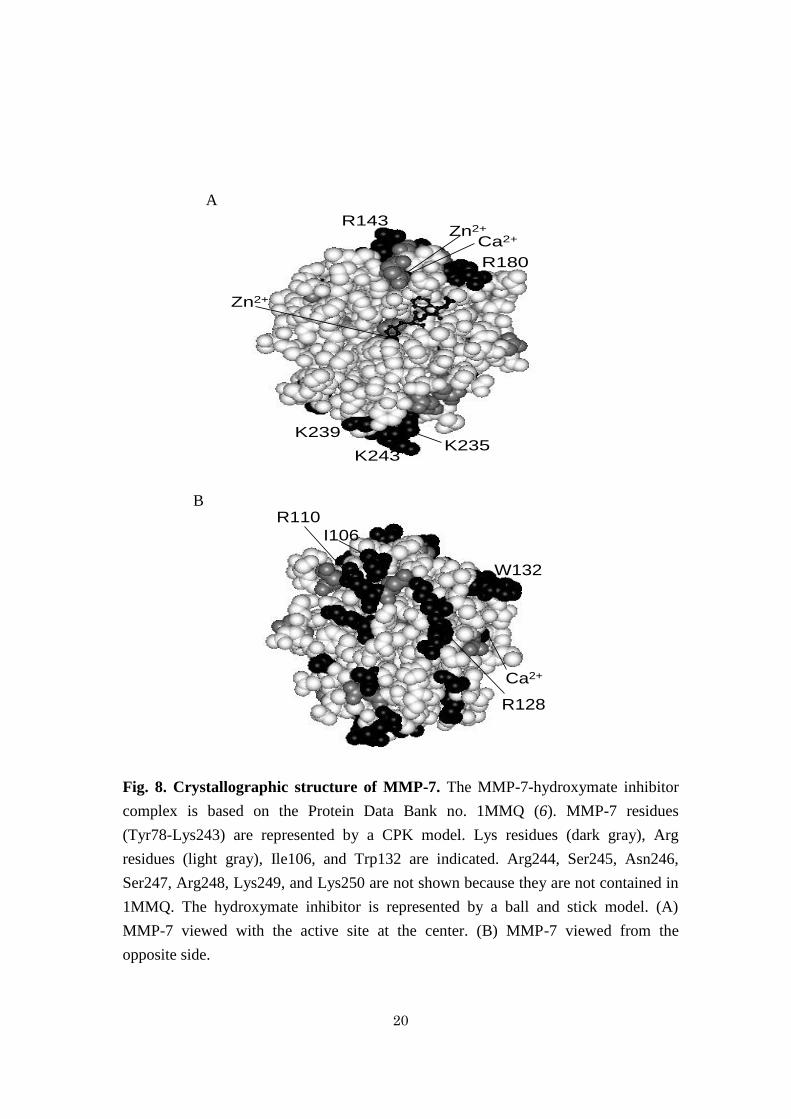
Figure 8 shows the overall structure of MMP-7. When MMP-7 is viewed with the active
site on the centre, only three Lys residues (Lys235, Lys239, and Lys243) and two Arg
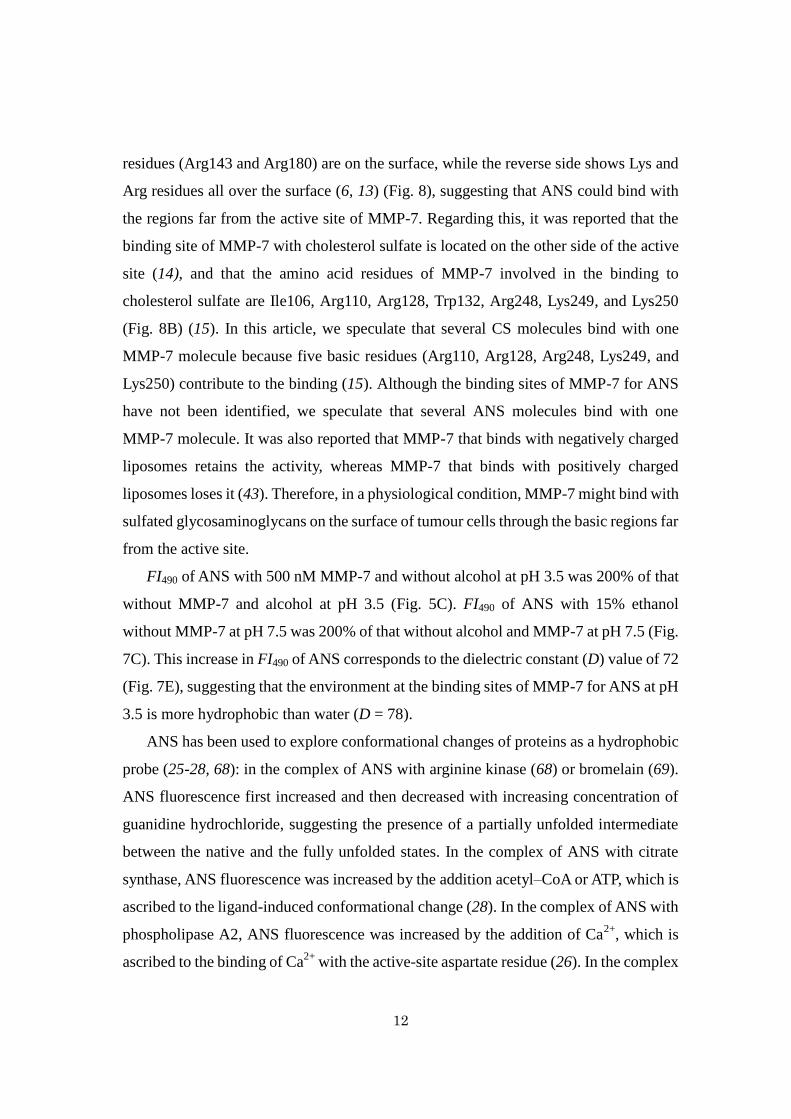
12
residues (Arg143 and Arg180) are on the surface, while the reverse side shows Lys and
Arg residues all over the surface (6, 13) (Fig. 8), suggesting that ANS could bind with
the regions far from the active site of MMP-7. Regarding this, it was reported that the
binding site of MMP-7 with cholesterol sulfate is located on the other side of the active
site (14), and that the amino acid residues of MMP-7 involved in the binding to
cholesterol sulfate are Ile106, Arg110, Arg128, Trp132, Arg248, Lys249, and Lys250
(Fig. 8B) (15). In this article, we speculate that several CS molecules bind with one
MMP-7 molecule because five basic residues (Arg110, Arg128, Arg248, Lys249, and
Lys250) contribute to the binding (15). Although the binding sites of MMP-7 for ANS
have not been identified, we speculate that several ANS molecules bind with one
MMP-7 molecule. It was also reported that MMP-7 that binds with negatively charged
liposomes retains the activity, whereas MMP-7 that binds with positively charged
liposomes loses it (43). Therefore, in a physiological condition, MMP-7 might bind with
sulfated glycosaminoglycans on the surface of tumour cells through the basic regions far
from the active site.
FI490 of ANS with 500 nM MMP-7 and without alcohol at pH 3.5 was 200% of that
without MMP-7 and alcohol at pH 3.5 (Fig. 5C). FI490 of ANS with 15% ethanol
without MMP-7 at pH 7.5 was 200% of that without alcohol and MMP-7 at pH 7.5 (Fig.
7C). This increase in FI490 of ANS corresponds to the dielectric constant (D) value of 72
(Fig. 7E), suggesting that the environment at the binding sites of MMP-7 for ANS at pH
3.5 is more hydrophobic than water (D = 78).
ANS has been used to explore conformational changes of proteins as a hydrophobic
probe (25-28, 68): in the complex of ANS with arginine kinase (68) or bromelain (69).
ANS fluorescence first increased and then decreased with increasing concentration of
guanidine hydrochloride, suggesting the presence of a partially unfolded intermediate
between the native and the fully unfolded states. In the complex of ANS with citrate
synthase, ANS fluorescence was increased by the addition acetyl–CoA or ATP, which is
ascribed to the ligand-induced conformational change (28). In the complex of ANS with
phospholipase A2, ANS fluorescence was increased by the addition of Ca2+
, which is
ascribed to the binding of Ca2+
with the active-site aspartate residue (26). In the complex
13
of ANS with interleukin-6 (IL-6), ANS fluorescence was increased by disrupting the
intramolecular disulphide by dithiothreitol (27). In this study, MMP-7 did not exhibit
activity at pH 3.5 after pre-incubation without ANS for 10 min at pH 3.5 (Fig. 3A). The
fluorescence of ANS was increased by the addition of MMP-7 at pH 3.5, but not at pH
4.0–9.5 (Fig. 5). This can be explained by that at pH 3.5, MMP-7 undergoes a structural
change and the anilinonaphthalene group of ANS binds with hydrophobic regions of
MMP-7 although the degree of structural change of MMP-7 at pH 3.5 is thought to be
small according to the results of CD spectra of MMP-7 (Fig. 6).

14
Fig. 1. Molecular structure of ANS. ANS is a fluorescent probe used in protein
analysis. It consists of a hydrophobic anilinonaphthalene ring and a negatively charged
sulfonate group. ANS fluorescence is enhanced when bound to hydrophobic regions of
proteins.
Fig. 2. Molecular structure of MOCAc-PLGL(Dpa)AR. MOCAc-PLGL(Dpa)AR is
a FRET peptide. The arrow above indicates the point of cleavage by MMP-7 or TLN.
NH SO3
Pro Leu LeuGly CH2CH(NH2) C
OMeO O
C
O
NO2
O
Ala Arg NH2
H2C
N
NO2
15
Fig. 3. Fluorometric analysis of inhibition of the MMP-7-catalysed hydrolysis of
MOCAc-PLGL(Dpa)AR by ANS. (A) Effect of pH and ANS concentration on the
initial reaction rate, vo. Pre-incubation of ANS and MMP-7 was carried out at 25°C for
10 min. The reaction was carried out with 32 nM MMP-7, 1.5 μM
MOCAc-PLGL(Dpa)AR, 0-500 μM ANS, and 0.64% DMSO at pH 3.5, ☐; 4.5, ■;
5.5, ◇; 6.5, ◆; 7.5, Δ; 8.5, ○; and 9.5, ● at 25°C. (B) Effect of pre-incubation time
on vo. Pre-incubation was carried out at 25°C for 0-35 min. The reaction was carried
out with 50 μM ANS (○) or without it (●) at pH 7.5 at 25°C.
0.0
0.5
1.0
1.5
2.0
2.5
0 100 200 300 400 500
vo
(n
M s
-1)
[ANS] (µM)
0.00
0.05
0.10
0.15
0.20
0.25
0 5 10 15 20 25 30 35 40
vo
(n
M s
-1)
Incubation time (min)
B
A
0
0

16
Fig. 4. HPLC analysis of inhibition of the MMP-7-catalyzed hydrolysis of
MOCAc-PLGL(Dpa)AR by ANS. The reaction was carried out with 32 nM MMP-7,
0-140 μM MOCAc-PLGL(Dpa)AR, 0, ○; 25, Δ; 50, ☐; 100, ●; 150, ▲; or 200, ■
μM ANS, and 5 % DMSO at 25°C, and stopped at an appropriate time. (A) Effect of
the initial substrate concentrations, [S]o on vo. Solid line represents the best fit of the
Michaelis-Menten equation using the nonlinear least-squares methods. (B)
Hanes-Woolf plot.
0
10
20
30
40
50
0 40 80 120 160
vo
(n
M s
-1)
[S]o(μM)
0
2
4
6
8
10
12
-80 -40 0 40 80 120 160
[S] o
/vox 1
0-3
(s)
[S]o (μM)
A
B
17
Fig. 5. Effect of pH and MMP-7 on the fluorescence of ANS. Fluorescence spectra
were measured with excitation at 380 nm and emission at 400-600 nm for 5 μM ANS
in 50 mM acetate-NaOH buffer at pH 3.5, 4.0, and 4.5; 50 mM MES-NaOH buffer at
pH 5.0, 5.5 and 6.5; 50 mM HEPES-NaOH buffer at pH 7.5; and 50 mM
AMPSO-NaOH buffer at pH 8.5 and 9.5, each containing 10 mM CaCl2 at 25°C. (A)
Fluorescence spectra without MMP-7. (B) Fluorescence spectra with 500 nM MMP-7.
(C) Fluorescence intensity at 490 nm (FI490). (D) Wavelength giving the maximum
fluorescence (λFImax). FI490 (C) and λFImax (D) of ANS with of 500 nM MMP-7, (○)
and without MMP-7, (Δ) were plotted against pH.
0
10
20
30
40
50
400 450 500 550 600
Flu
ore
scence in
tensity (
AU
)
Wavelength (nm)
pH
3.5
4.0
4.5
5.0
5.5
6.5
7.5
8.5
9.5
0
10
20
30
40
50
3.5 4.5 5.5 6.5 7.5 8.5 9.5
FI 4
90
pH
0
10
20
30
40
50
400 450 500 550 600
Flu
ore
scence in
tensity (
AU
)
Wavelength (nm)
pH
3.5
4.0
4.5
5.0
5.5
6.5
7.5
8.5
9.5
500
505
510
515
520
525
530
3.5 4.5 5.5 6.5 7.5 8.5 9.5
λF
Ima
x (
nm
)
pH
A B
D C

18
Fig. 6. Effect of pH on the CD spectra of MMP-7. CD spectra were measured for 7.0
μM MMP-7 in 50 mM acetate-NaOH buffer at pH 3.5 and 4.5, 50 mM MES-NaOH
buffer at pH 5.5 and 6.5, 50 mM Tris-HCl buffer at pH 7.5, and 50 mM AMPSO-NaOH
buffer at pH 8.5 and 9.5, each containing 10 mM CaCl2 at 25°C.
-16
-12
-8
-4
0
4
200 210 220 230 240 250 260 270
[ ] (
deg c
m2 d
mol-1
)
Wavelength (nm)
pH 3.5 4.5 5.5 6.5 7.5 8.5 9.5
19
Fig. 7. Effect of alcohols on the fluorescence of ANS. Fluorescence spectra were
measured with excitation at 380 nm and emission at 400-600 nm for 5 μM ANS in 50
mM HEPES-NaOH, 10 mM of CaCl2, pH 7.5 with various concentrations of alcohols at
25°C. (A) Fluorescence spectra with 40, 50, 60, 70, and 80% of ethanol. (B)
Fluorescence spectra with 40, 50, 60, 70, and 80% 2-propanol. (C) Fluorescence
intensity at 490 nm (FI490). (D) Wavelength giving the maximum fluorescence (λFImax).
Symbols for alcohols (C, D): ethanol, ○; 2-propanol, Δ. (E) Relative FI490. Relative
FI490 was defined as the relative value of FI490 in the presence of ethanol to the value in
its absence. Dielectric constant, D, is calculated according to the previous report (64).
0
200
400
600
400 450 500 550 600
Flu
ore
scence in
tensity
Wavelength (nm)
0
200
400
600
0 25 50 75 100
FI 4
90
[alcohol] (%, v/v)
0
200
400
600
400 450 500 550 600
Flu
ore
scence in
tensity
Wavelength (nm)
470
490
510
530
550
0 25 50 75 100
λF
Ima
x (
nm
)
[alcohol] (%, v/v)
0
50
100
150
200
20 40 60 80
Rela
tive
FI 4
90
D
A B
C D
E
80%
60%
70%
50%
40%
80%
60%
70%
50%
40%
20
Fig. 8. Crystallographic structure of MMP-7. The MMP-7-hydroxymate inhibitor
complex is based on the Protein Data Bank no. 1MMQ (6). MMP-7 residues
(Tyr78-Lys243) are represented by a CPK model. Lys residues (dark gray), Arg
residues (light gray), Ile106, and Trp132 are indicated. Arg244, Ser245, Asn246,
Ser247, Arg248, Lys249, and Lys250 are not shown because they are not contained in
1MMQ. The hydroxymate inhibitor is represented by a ball and stick model. (A)
MMP-7 viewed with the active site at the center. (B) MMP-7 viewed from the
opposite side.
Zn2+
Ca2+Zn2+
K235K243
K239
R180
R143
Ca2+
R110
R128
I106
W132
A
B
21
Chapter 2
Effects of Heparin and Cholesterol Sulfate on the Activity and Stability of
Human Matrix Metalloproteinase 7
Introduction
Sulfated glycosaminoglycans and sulfated lipids are involved in the biological
functions of human matrix metalloproteinase 7 (MMP-7). Heparin (Fig. 1) is a highly
negatively charged sulfated glycosaminoglycan, it contains glucosamine and glucuronic
acid or iduronic acid as disaccharide unit. Heparin is localized on the surface of various
cells and is involved in the activation or inhibition of a number of proteinases and
protein proteinase inhibitors an example of this being the activation of promatrilysin
into its active form (18). Extraction experiments and confocal microscopy studies have
established that glycosaminoglycans on or around the epithelial cells and in the
underlying basement membranes act as anchors/docking material for MMP-7 (13) that
hold the enzyme in position preventing it from diffusing in the body fluids, thus
allowing it to carry out its proteolytic functions (13).
CS (Fig. 2) is a highly amphipathic molecule containing a sulfate group, a sterol ring,
and hydrophobic side chains. It is widely distributed in various body fluids and in
tissues and cells, including erythrocytes, platelets, skin, hair, adrenals, lung, and the
brain. It has been reported that under physiological conditions, MMP-7 binds to the CS
present in the cellular membranes of colon cancer cells and causes proteolysis (14, 19,
20). These reports on heparin and CS have revealed that they are involved in the
biological functions of MMP-7. This chapter describes the effects of heparin and CS on
the activity and stability of MMP-7 in the hydrolysis of synthetic peptides. The results
indicate that heparin increases the activity and stability of MMP-7 while CS decreases
its activity.
22
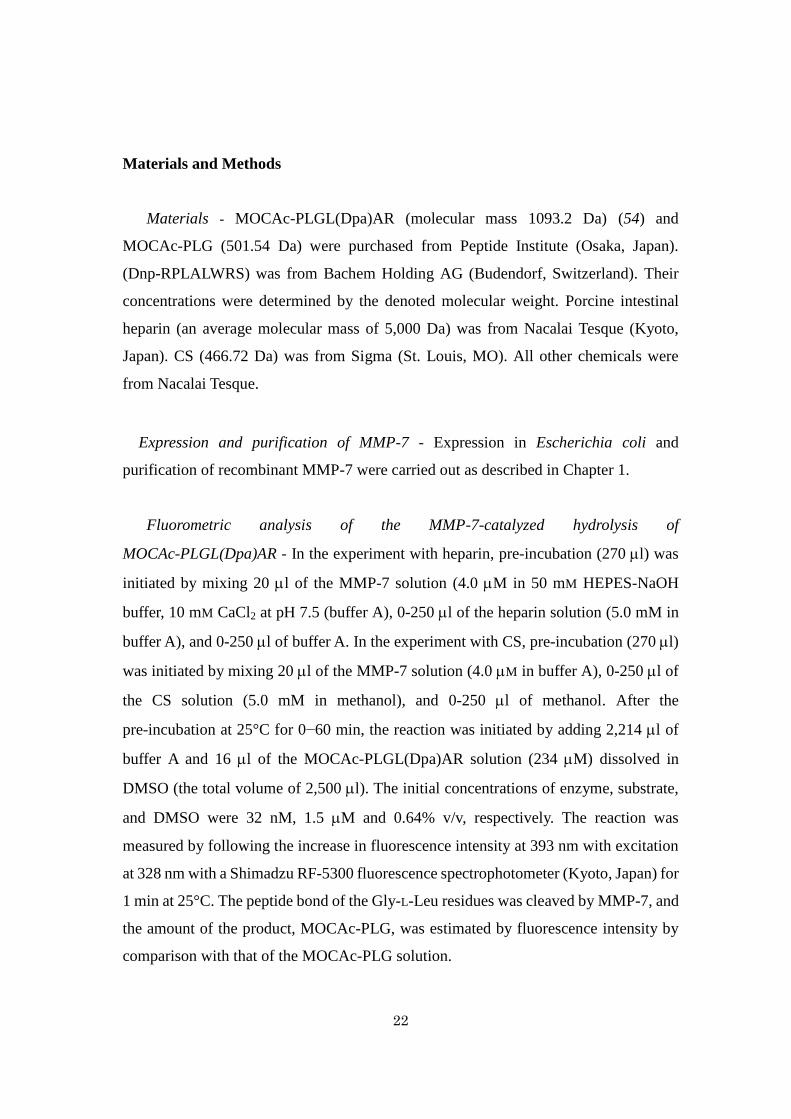
Materials and Methods
Materials - MOCAc-PLGL(Dpa)AR (molecular mass 1093.2 Da) (54) and
MOCAc-PLG (501.54 Da) were purchased from Peptide Institute (Osaka, Japan).
(Dnp-RPLALWRS) was from Bachem Holding AG (Budendorf, Switzerland). Their
concentrations were determined by the denoted molecular weight. Porcine intestinal
heparin (an average molecular mass of 5,000 Da) was from Nacalai Tesque (Kyoto,
Japan). CS (466.72 Da) was from Sigma (St. Louis, MO). All other chemicals were
from Nacalai Tesque.
Expression and purification of MMP-7 - Expression in Escherichia coli and
purification of recombinant MMP-7 were carried out as described in Chapter 1.
Fluorometric analysis of the MMP-7-catalyzed hydrolysis of
MOCAc-PLGL(Dpa)AR - In the experiment with heparin, pre-incubation (270 l) was
initiated by mixing 20 l of the MMP-7 solution (4.0 M in 50 mM HEPES-NaOH
buffer, 10 mM CaCl2 at pH 7.5 (buffer A), 0-250 l of the heparin solution (5.0 mM in
buffer A), and 0-250 l of buffer A. In the experiment with CS, pre-incubation (270 l)
was initiated by mixing 20 l of the MMP-7 solution (4.0 M in buffer A), 0-250 l of
the CS solution (5.0 mM in methanol), and 0-250 l of methanol. After the
pre-incubation at 25°C for 0−60 min, the reaction was initiated by adding 2,214 l of
buffer A and 16 l of the MOCAc-PLGL(Dpa)AR solution (234 M) dissolved in
DMSO (the total volume of 2,500 l). The initial concentrations of enzyme, substrate,
and DMSO were 32 nM, 1.5 M and 0.64% v/v, respectively. The reaction was
measured by following the increase in fluorescence intensity at 393 nm with excitation
at 328 nm with a Shimadzu RF-5300 fluorescence spectrophotometer (Kyoto, Japan) for
1 min at 25°C. The peptide bond of the Gly-L-Leu residues was cleaved by MMP-7, and
the amount of the product, MOCAc-PLG, was estimated by fluorescence intensity by
comparison with that of the MOCAc-PLG solution.
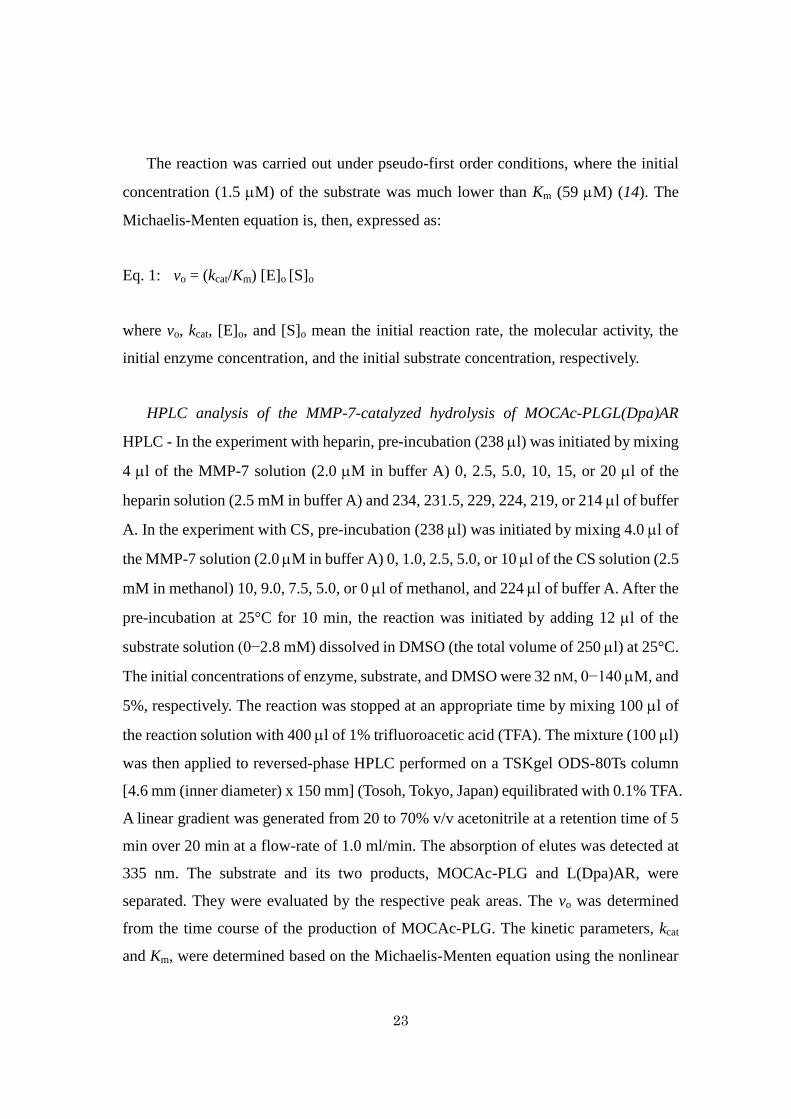
23
The reaction was carried out under pseudo-first order conditions, where the initial
concentration (1.5 M) of the substrate was much lower than Km (59 M) (14). The
Michaelis-Menten equation is, then, expressed as:
Eq. 1: vo = (kcat/Km) [E]o [S]o
where vo, kcat, [E]o, and [S]o mean the initial reaction rate, the molecular activity, the
initial enzyme concentration, and the initial substrate concentration, respectively.
HPLC analysis of the MMP-7-catalyzed hydrolysis of MOCAc-PLGL(Dpa)AR
HPLC - In the experiment with heparin, pre-incubation (238 l) was initiated by mixing
4 l of the MMP-7 solution (2.0 M in buffer A) 0, 2.5, 5.0, 10, 15, or 20 l of the
heparin solution (2.5 mM in buffer A) and 234, 231.5, 229, 224, 219, or 214 l of buffer
A. In the experiment with CS, pre-incubation (238 l) was initiated by mixing 4.0 l of
the MMP-7 solution (2.0 M in buffer A) 0, 1.0, 2.5, 5.0, or 10 l of the CS solution (2.5
mM in methanol) 10, 9.0, 7.5, 5.0, or 0 l of methanol, and 224 l of buffer A. After the
pre-incubation at 25°C for 10 min, the reaction was initiated by adding 12 l of the
substrate solution (0−2.8 mM) dissolved in DMSO (the total volume of 250 l) at 25°C.
The initial concentrations of enzyme, substrate, and DMSO were 32 nM, 0−140 M, and
5%, respectively. The reaction was stopped at an appropriate time by mixing 100 l of
the reaction solution with 400 l of 1% trifluoroacetic acid (TFA). The mixture (100 l)
was then applied to reversed-phase HPLC performed on a TSKgel ODS-80Ts column
[4.6 mm (inner diameter) x 150 mm] (Tosoh, Tokyo, Japan) equilibrated with 0.1% TFA.
A linear gradient was generated from 20 to 70% v/v acetonitrile at a retention time of 5
min over 20 min at a flow-rate of 1.0 ml/min. The absorption of elutes was detected at
335 nm. The substrate and its two products, MOCAc-PLG and L(Dpa)AR, were
separated. They were evaluated by the respective peak areas. The vo was determined
from the time course of the production of MOCAc-PLG. The kinetic parameters, kcat
and Km, were determined based on the Michaelis-Menten equation using the nonlinear
24
least-squares methods. The HPLC apparatus consisting of a solvent delivery system
CCPM, a UV monitoring system UV-8010, a computer control system PX-8010, and an
integrator Chromatocoder 21, were from Tosoh.
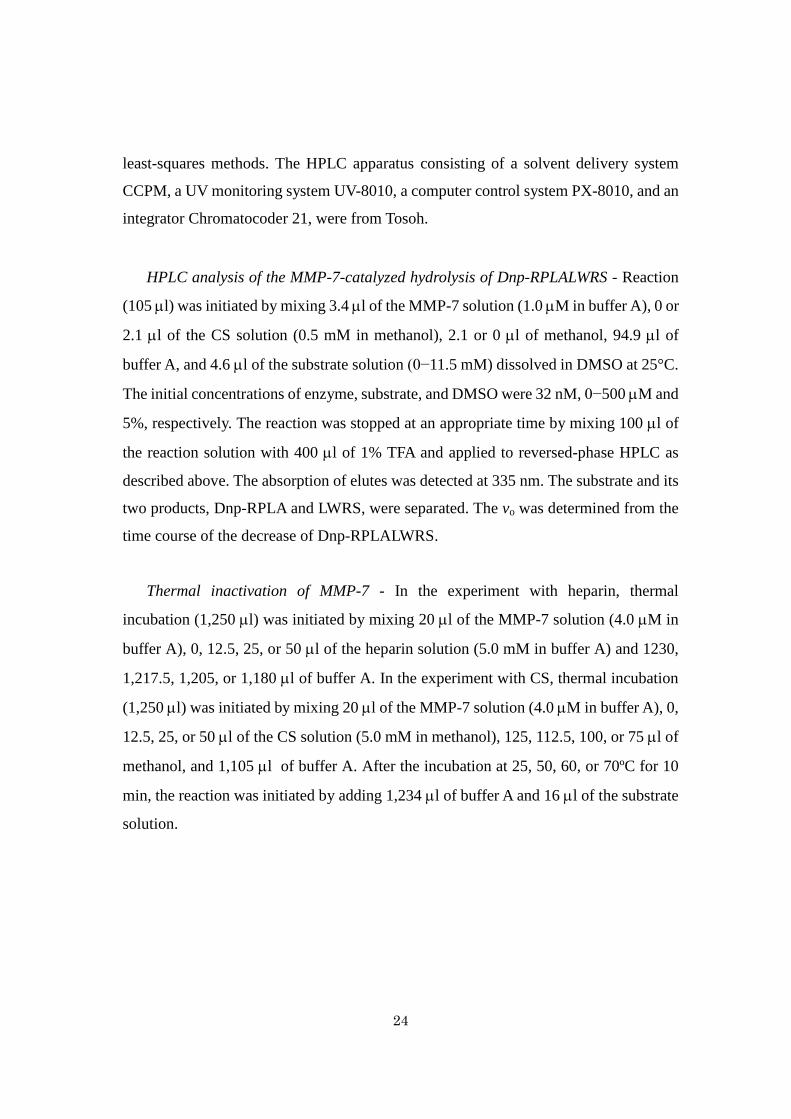
HPLC analysis of the MMP-7-catalyzed hydrolysis of Dnp-RPLALWRS - Reaction
(105 l) was initiated by mixing 3.4 l of the MMP-7 solution (1.0 M in buffer A), 0 or
2.1 l of the CS solution (0.5 mM in methanol), 2.1 or 0 l of methanol, 94.9 l of
buffer A, and 4.6 l of the substrate solution (0−11.5 mM) dissolved in DMSO at 25°C.
The initial concentrations of enzyme, substrate, and DMSO were 32 nM, 0−500 M and
5%, respectively. The reaction was stopped at an appropriate time by mixing 100 l of
the reaction solution with 400 l of 1% TFA and applied to reversed-phase HPLC as
described above. The absorption of elutes was detected at 335 nm. The substrate and its
two products, Dnp-RPLA and LWRS, were separated. The vo was determined from the
time course of the decrease of Dnp-RPLALWRS.
Thermal inactivation of MMP-7 - In the experiment with heparin, thermal
incubation (1,250 l) was initiated by mixing 20 l of the MMP-7 solution (4.0 M in
buffer A), 0, 12.5, 25, or 50 l of the heparin solution (5.0 mM in buffer A) and 1230,
1,217.5, 1,205, or 1,180 l of buffer A. In the experiment with CS, thermal incubation
(1,250 l) was initiated by mixing 20 l of the MMP-7 solution (4.0 M in buffer A), 0,
12.5, 25, or 50 l of the CS solution (5.0 mM in methanol), 125, 112.5, 100, or 75 l of
methanol, and 1,105 l of buffer A. After the incubation at 25, 50, 60, or 70ºC for 10
min, the reaction was initiated by adding 1,234 l of buffer A and 16 l of the substrate
solution.
25
Results
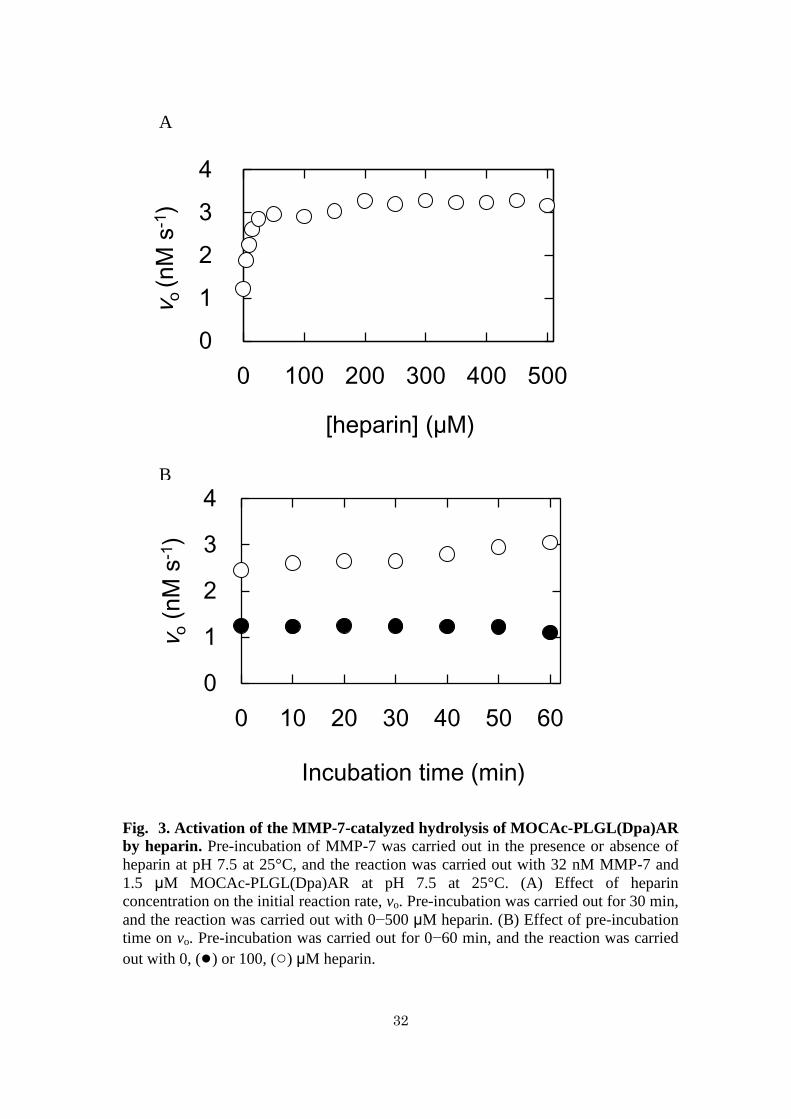
Activation of MMP-7 activity by heparin - Figure 3A shows the effects of
increasing concentrations of heparin on MMP-7 activity in the hydrolysis of
MOCAc-PLGL(Dpa)AR. MMP-7 and heparin were pre-incubated at pH 7.5 at 25°C
for 30 min followed by the reaction at pH 7.5 at 25°C. The initial reaction rate without
heparin was 1.2 nM s-1
. It increased with increasing concentrations of heparin and
reached almost the maximum (3.0 nM s-1
) at 50 M. Figure 3B shows the effects of
pre-incubation time on MMP-7 activity. MMP-7 was pre-incubated without or with
heparin for 0−60 min followed by the reaction. The initial reaction rates without and
with 100 M heparin were in the range 1.1−1.2 and 2.5−3.1 nM s-1
, respectively,
indicating that the duration of pre-incubation does not affect the activity of MMP-7.
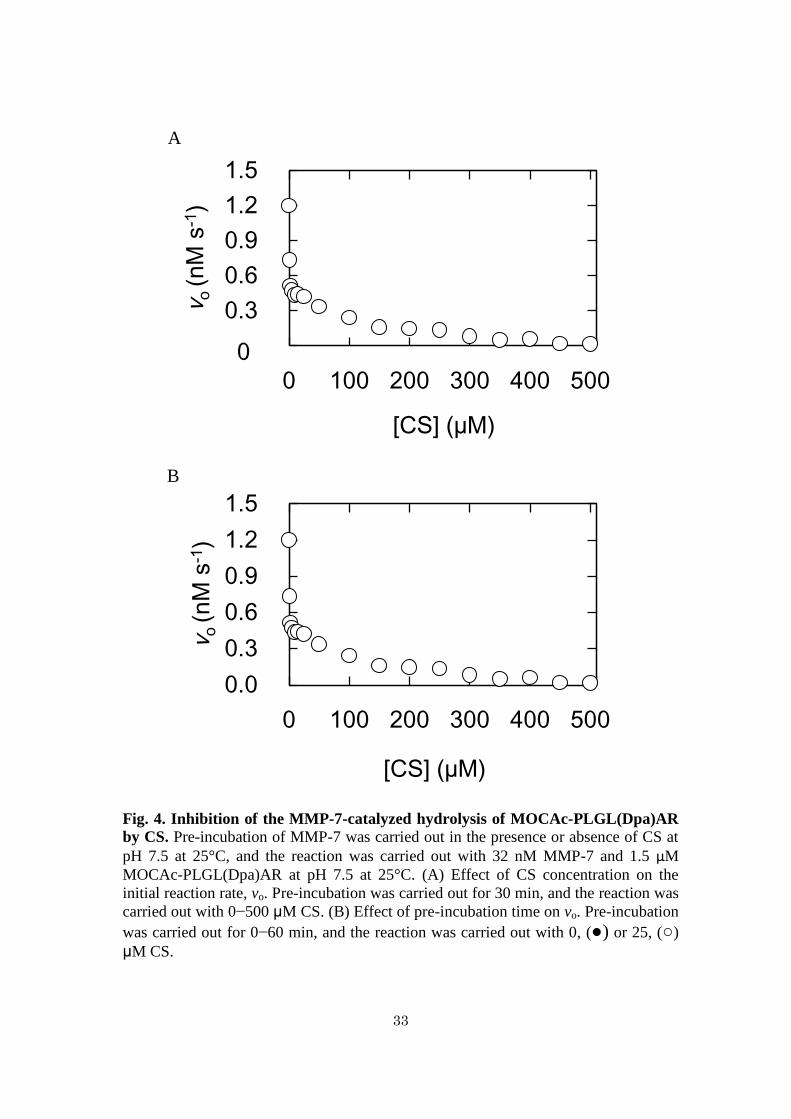
Inhibition of MMP-7 activity by CS - Figure 4A shows the effects of increasing
concentrations of CS on MMP-7 activity. MMP-7 and CS were pre-incubated at pH
7.5 at 25°C for 30 min followed by the reaction at pH 7.5 at 25°C. The initial reaction
rate decreased with increasing concentrations of CS and diminished almost completely
at 450 M. The CS concentration giving 50% inhibition (IC50 value) was 1.6 M.
Figure 4B shows the effects of pre-incubation time on MMP-7 activity. MMP-7 was
pre-incubated without or with CS for 0−60 min followed by the reaction. The initial
reaction rates without and with 25 M CS were in the range 1.1−1.2 and 0.4−0.6 nM
s-1
, respectively, indicating that the duration of pre-incubation does not affect the
activity of MMP-7.
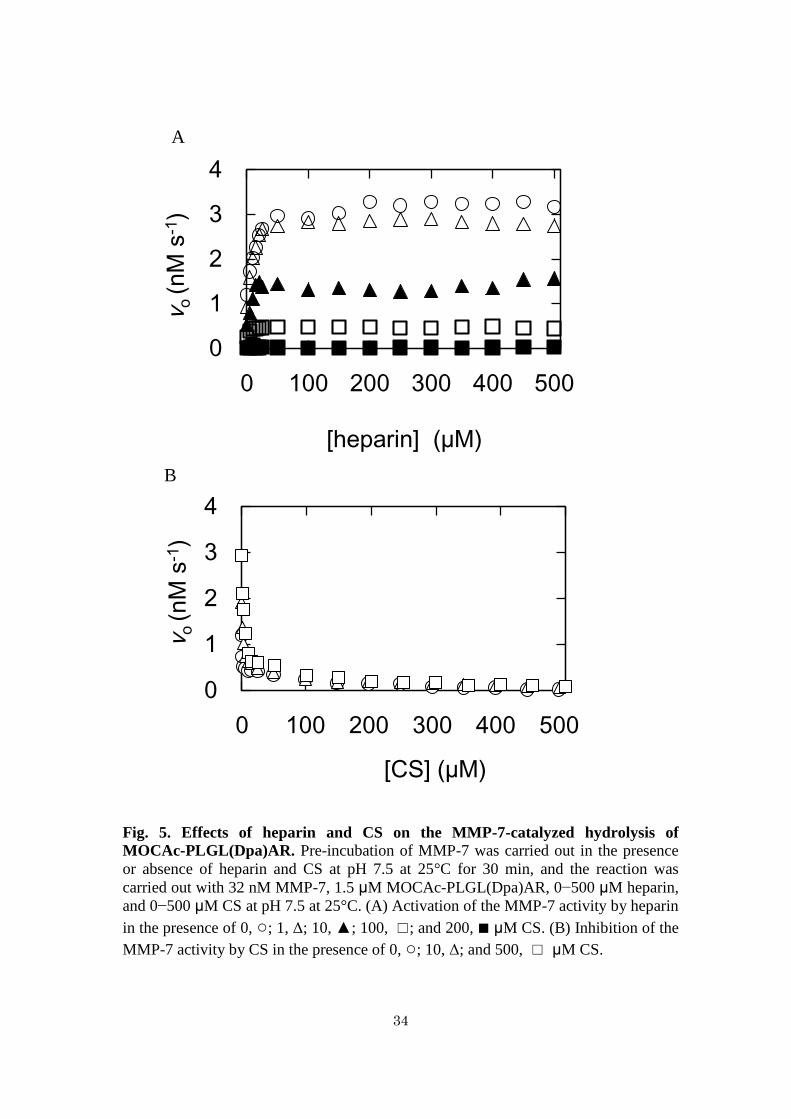
Activation of MMP-7 by heparin and inhibition of MMP-7 by CS – Figure 5A
shows the effects of increasing concentrations of heparin on MMP-7 activity in the
hydrolysis of MOCAc-PLGL(Dpa)AR in the presence of 0–500 M CS. MMP-7,
heparin, and CS were pre-incubated at pH 7.5 at 25°C for 30 min followed by the
reaction at pH 7.5 at 25°C. The initial reaction rate with 1, 10, and 100 M CS and 0
26
M heparin was 0.94, 0.52, and 0.26 nM s-1
, respectively, which were 78, 43, and 22%,
respectively, of that with 0 M CS and 0 M heparin (1.2 nM s-1
). Like the case
without CS (Fig. 3A), the initial reaction rates increased with increasing
concentrations of heparin and reached almost the maximum (2.7, 1.4, and 0.4 nM s-1
,
respectively) at 50 M, which were 90, 47, and 8% of that without CS (3.0 nM s-1
).
Figure 5B shows the effects of increasing concentrations of CS on MMP-7 activity in
the hydrolysis of MOCAc-PLGL(Dpa)AR in the presence of 0–500 M heparin. The
initial reaction rate with 10 and 500 M heparin and 0 M CS was 1.9 and 2.9 nM s-1
,
respectively, which were 160 and 240%, respectively, of that with 0 M CS and 0 M
heparin (1.2 nM s-1
). Like the case without heparin (Fig. 4A), the initial reaction rates
decreased with increasing concentrations of CS and reached 0.72 and 1.2 nM s-1
,
respectively, at 5 M, which were 150 and 250% of that without heparin (0.48 nM s-1
).
These results indicated that the dose-response curves of the activation of MMP-7 by
heparin in the presence of various concentrations of CS are similar and that those of
the inhibition of MMP-7 by CS in the presence of various concentrations of heparin
are similar. Hence, it is thought that the binding of heparin and that of CS to MMP-7
are non-competitive.
Activation manner of heparin against MMP-7 activity - To determine the kcat and
Km of MMP-7 in the hydrolysis of MOCAc-PLGL(Dpa)AR separately, the initial
reaction rates in the absence or presence of heparin were measured. It was necessary to
increase the concentration of MOCAc-PLGL(Dpa)AR up to 140 M that is higher
than the Km value (59 M), (14) and fluorescence detection was not available because
of the internal-filter effect of the substrate. Accordingly, the products were detected by
reversed-phase HPLC (48)
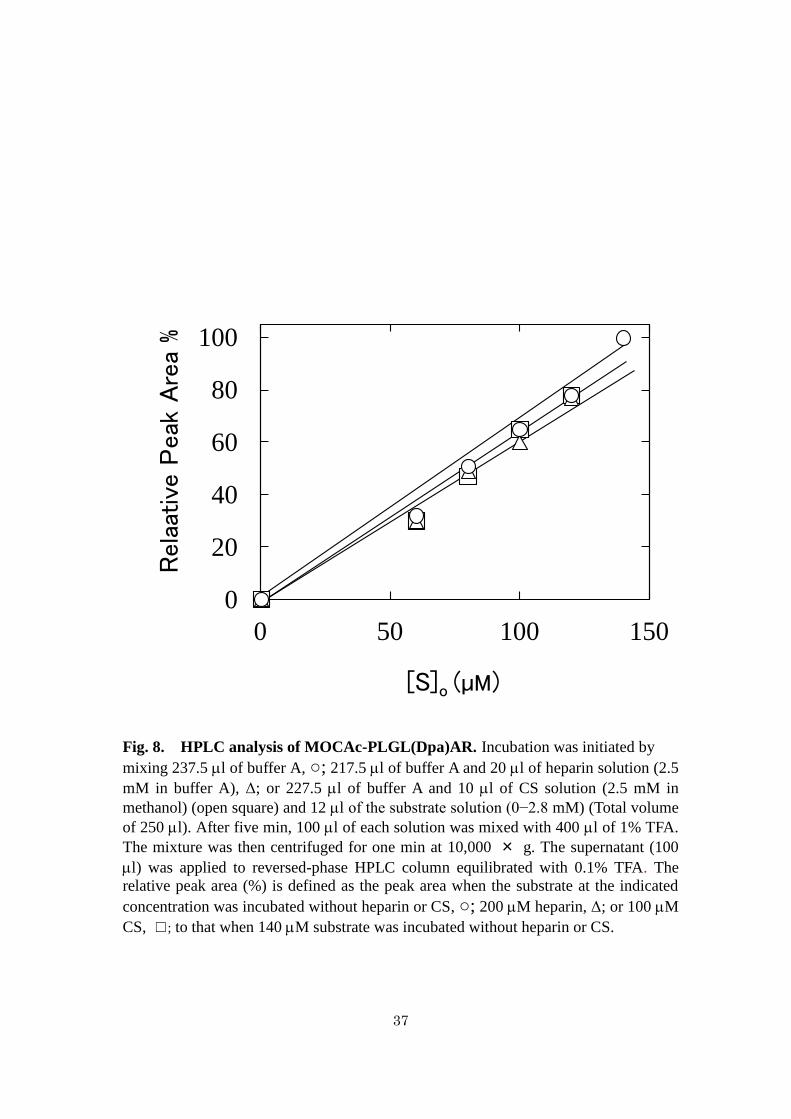
The effects of heparin and CS on the solubility of MOCAc-PLGL(Dpa)AR were
examined. MOCAc-PLGL(Dpa)AR (0−140 M) was incubated with heparin (200 M)
or CS (100 M) without MMP-7. After the centrifugation, the supernatant was applied
to reversed-phase HPLC (Fig. 8). The peak area of MOCAc-PLGL(Dpa)AR increased
27
proportionally with increasing MOCAc-PLGL(Dpa)AR concentration in the presence
of heparin or CS and in their absence, indicating that neither 200 M heparin nor 100
M CS affected the solubility of MOCAc-PLGL(Dpa)AR.
The initial reaction rates in the absence or presence of various concentrations of
heparin were measured. All plots showed saturated profiles (Fig. 5A), and the kcat and
Km values of MMP-7 were determined separately (Fig. 4B). The Km values at 25−200
M heparin were in the range 17−21 M, which was in the range 30−37% of that
without heparin (57 ± 8 M). The kcat values at 25−200 M heparin were 1.2 s-1
,
which was 75% of that without heparin (1.6 ± 0.1 s-1
). Consequently, the kcat/Km values
at 25−200 M heparin were 200−250% of that without heparin. This indicates that
heparin increased the activity by decreasing Km.
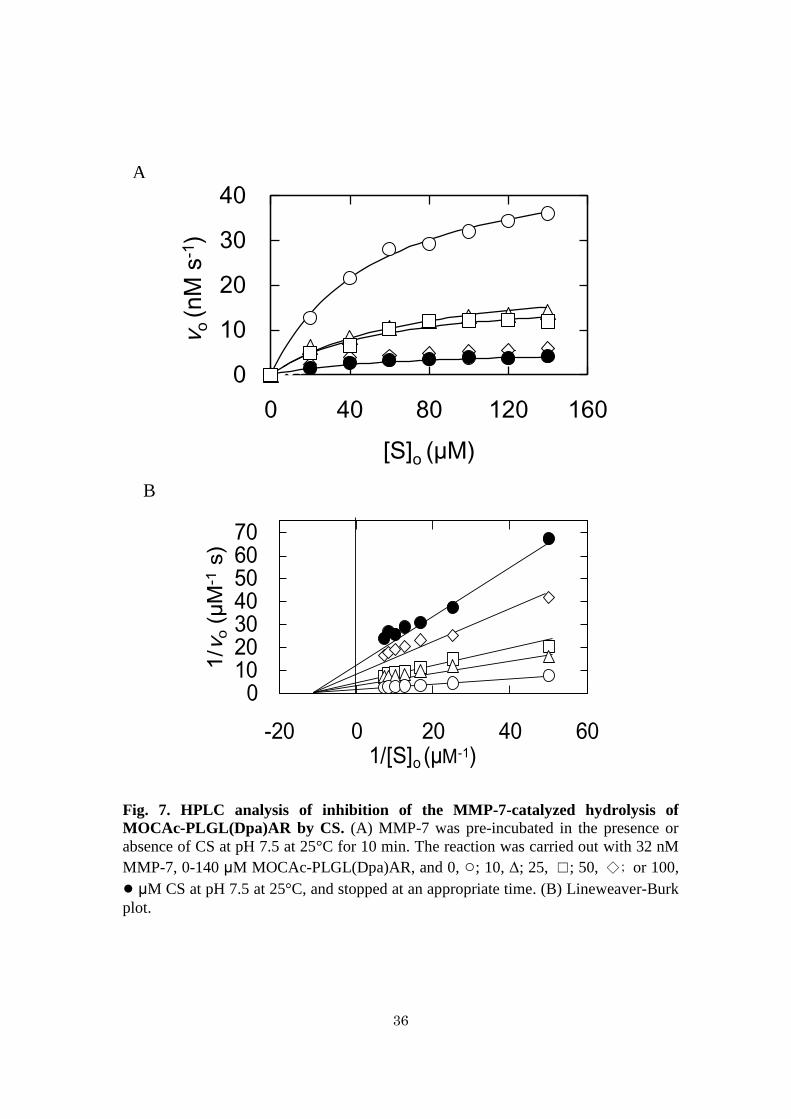
Inhibition manner of CS against MMP-7 activity - The initial reaction rates in the
absence or presence of various concentrations of CS were measured. All the plots
showed saturated profiles (Fig. 7A). The plot of 1/vo vs. 1/[S]o (Lineweaver-Burk plot)
in the absence and presence of CS showed non-parallel lines intersecting at the X-axis,
indicating that the Km value was 60 ± 7 M and that the inhibition is non-competitive
(Fig. 7B). The kcat values with 0, 10, 25, 50, and 100 M CS were determined to be 1.6
± 0.2, 0.71 ± 0.09, 0.57 ± 0.07, 0.26 ± 0.03, and 0.18 ± 0.02 s-1
, respectively. Based on
this, the reaction rate can be described as
Eq. 2:
where [I]o and Ki are the initial inhibitor concentration and the inhibitor constant,
respectively. The Ki value of CS at pH 7.5 was calculated to be 11 ± 3 M from eq. 2.
The initial reaction rates in the absence or presence of 10 M CS were measured.
All the plots showed saturated profiles (Fig. 9A). The Lineweaver-Burk plot in the
vo = kcat[E]o[S]o
(Km + [S]o) 1 + [I]o
Ki
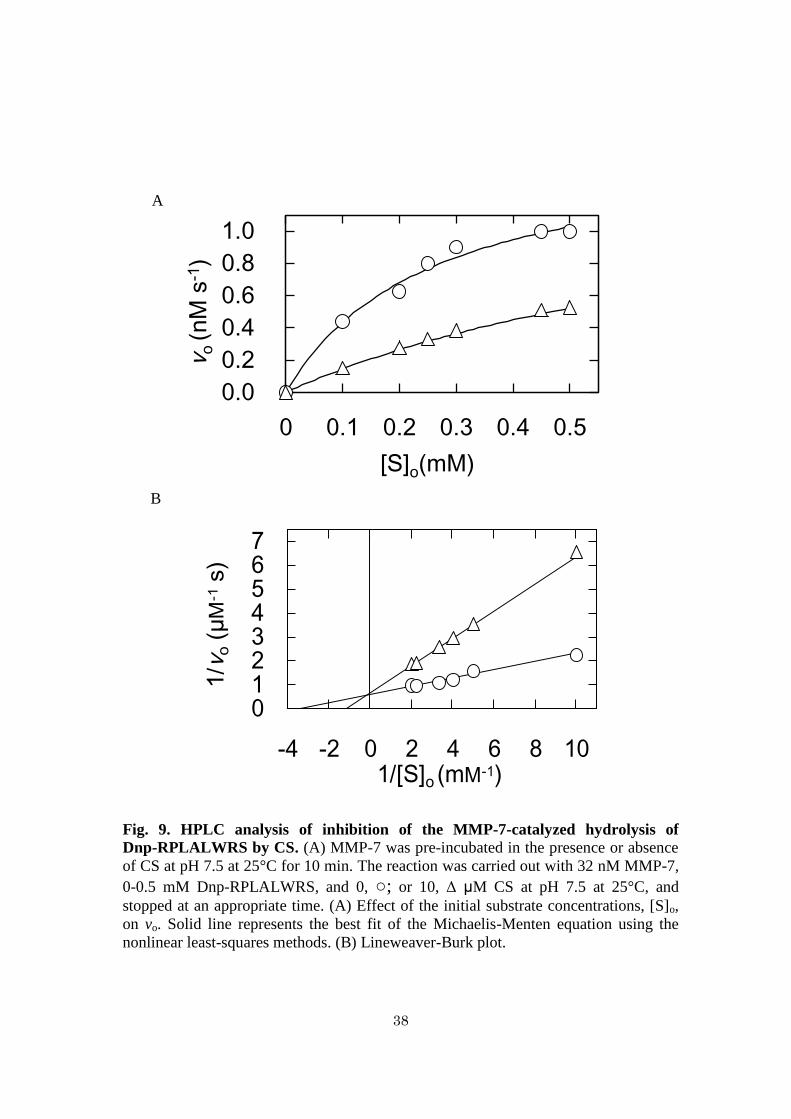
28
absence and presence of 10 M CS showed non-parallel lines intersecting at the Y-axis,
indicating that the kcat value was 47 ± 1 s-1
, and that the inhibition is competitive (Fig.
9B). The Km values with 0 and 10 M CS were determined to be 0.26 ± 0.02 and 0.92 ±
0.04 mM, respectively. The results coincided with the previously reported one that CS
inhibits MMP-7 activity competitively in the hydrolysis of Dnp-RPLALWRS with the
Km values of 0.26 mM for 0 M CS and 1.2 mM for 10 M CS (25).
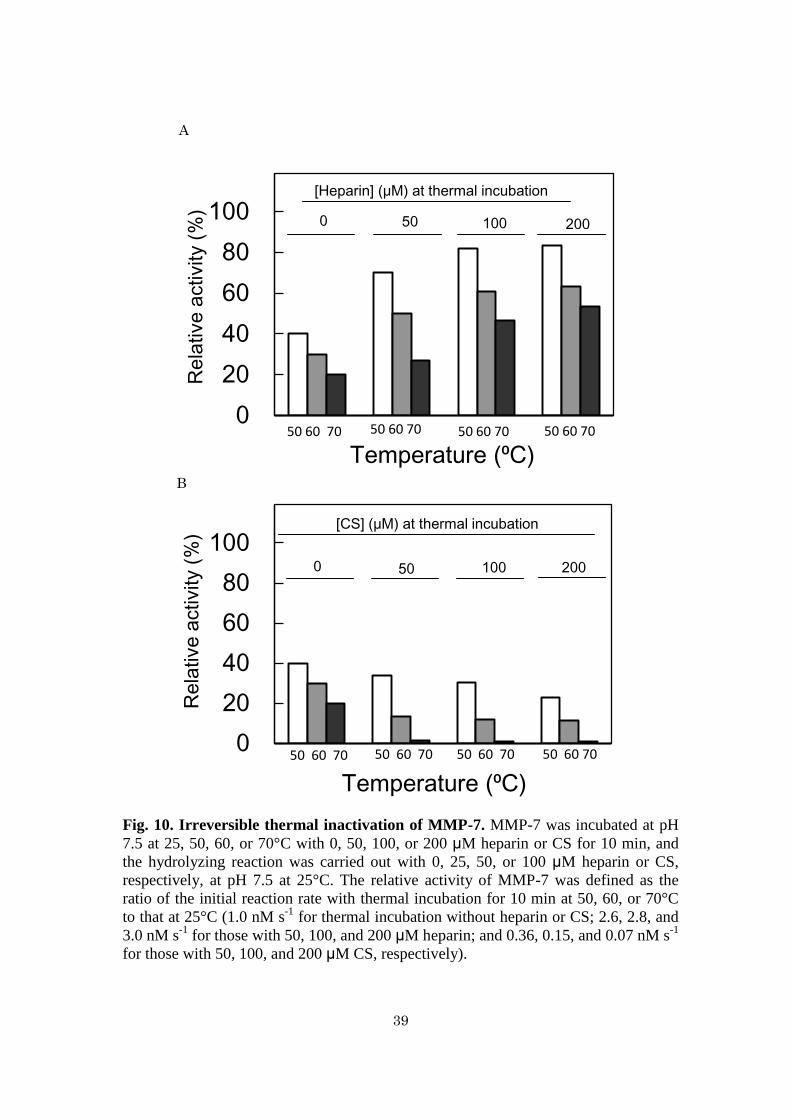
Stabilization of MMP-7 by heparin and destabilization of MMP-7 by CS - Figure
7 shows the remaining activities of MMP-7 to hydrolyze MOCAc-PLGL(Dpa)AR
after thermal treatment at 50–70ºC for 10 min. The relative activities, which were
defined as the ratio of the initial reaction rate with incubation at the indicated
temperature for 10 min to that without it, of MMP-7 without heparin or CS decreased
with increasing temperature. At all temperatures examined, the relative activities of
MMP-7 increased with increasing heparin concentration (Fig. 10A) while they
decreased with increasing CS concentration (Fig. 10B). This indicates that heparin
increased MMP-7 stability while CS decreased it.
Discussion
Mechanism of activation of MMP-7 by heparin - Heparin binds numerous proteins
including enzymes and inhibitors involved in the blood clotting cascade (68). In this
study, we found that heparin increased the activity (Figs. 3 and 6) and stability (Fig. 10)
of MMP-7. Activation was brought about by a decrease in Km. MMP-7 has 11 Lys and 8
Arg residues. According to the X-ray structure (Protein Data Bank accession number, all
Lys and Arg residues except for Arg143 and Arg180 are located on the reverse side
when MMP-7 is viewed with the active site at the center (6, 13) (Fig. 8). The pI value of
MMP-7 is 5.9 (7), suggesting that MMP-7 is positively charged at neutral and alkaline
pH. Although the amino acid residues of MMP-7 involved in binding to heparin are
unknown, we speculate that MMP-7 binds to heparin through its basic region far from
29
the active site.
It has been reported that the heparin-binding site of protein kinase CK2 consists the
four consecutive residues (Lys74-Lys75-Lys76-Lys77) and three residues (Arg191,
Arg195, and Lys198) (69) and that of phospholipase A2 is Lys49 (69). They are located
in the vicinity of their active sites, and heparin inhibits their activities competitively (69,
70). MMP-7, which binds with negatively charged liposomes, retains activity whereas
MMP-7, which binds with positively charged ones, loses activity (67) Hence it can be
said that heparin does not decrease enzyme activities except when the heparin-binding
sites are located near the active sites.
Mechanism of stabilization of MMP-7 by heparin - Heparin stabilizes basic
fibroblast growth factor (bFGF) (71), tissue transglutaminase (72), and
tripeptidyl-peptidase I (TPP I) (73), and destabilizes cytochrome c (74). The mechanism
of stabilization of MMP-7 by heparin is unknown. Considering that not only heparin but
also other sulfated glycosaminoglycans such as heparan sulfate and chondroitin sulfate
increase enzyme stability (73), we speculate that the negative charge density of heparin
protects MMP-7 against inactivation by heating. Heparin protects bFGF against
inactivation by heating it more strongly at high temperatures (71) and protects tissue
transglutaminase against inactivation by heating and also degradation by other proteases
(72). This evidence suggests that under physiological conditions, heparin is involved in
the stabilization of MMP-7.
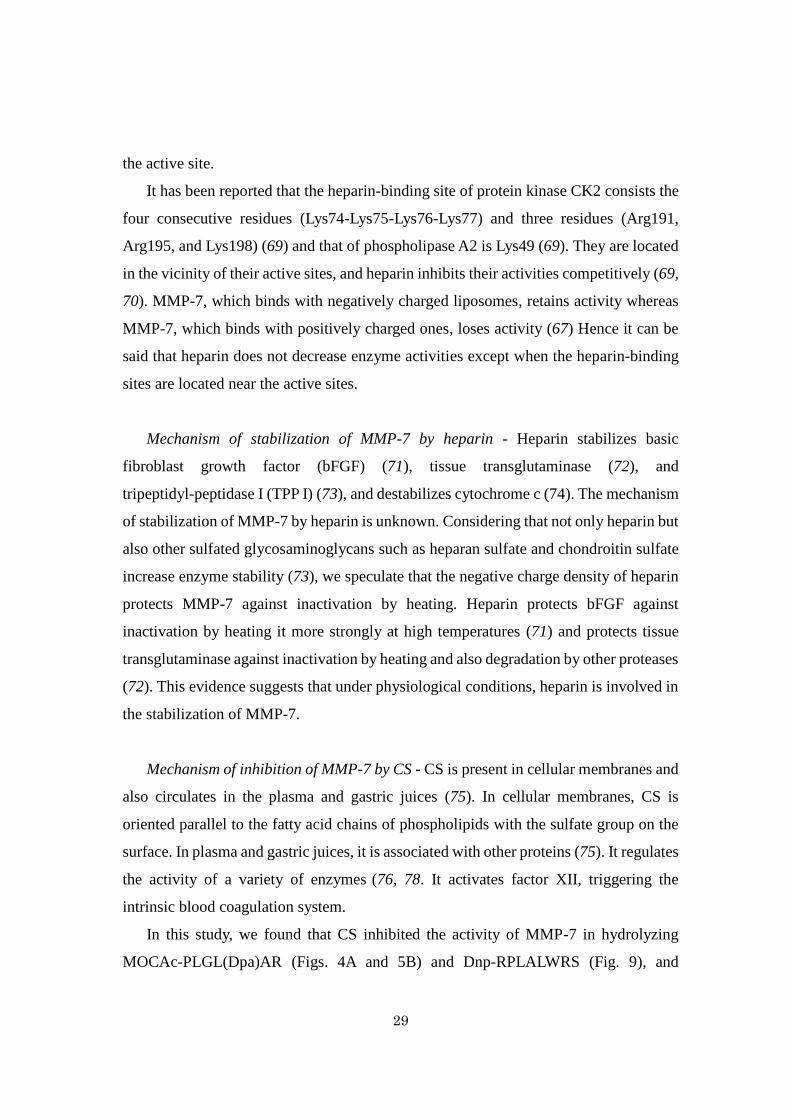
Mechanism of inhibition of MMP-7 by CS - CS is present in cellular membranes and
also circulates in the plasma and gastric juices (75). In cellular membranes, CS is
oriented parallel to the fatty acid chains of phospholipids with the sulfate group on the
surface. In plasma and gastric juices, it is associated with other proteins (75). It regulates
the activity of a variety of enzymes (76, 78. It activates factor XII, triggering the
intrinsic blood coagulation system.
In this study, we found that CS inhibited the activity of MMP-7 in hydrolyzing
MOCAc-PLGL(Dpa)AR (Figs. 4A and 5B) and Dnp-RPLALWRS (Fig. 9), and
30
decreased the stability (Fig. 10b) of MMP-7. The manner of inhibition was
non-competitive for MOCAc-PLGL(Dpa)AR (Fig. 7B), and competitive for
Dnp-RPLALWRS (Fig. 9). It has been reported that CS (10 µM) competitively inhibited
the activity of MMP-7 in hydrolyzing Dnp-RPLALWRS, suggesting that CS reduces
the affinity between Dnp-RPLALWRS and MMP-7 (15). The results suggest that CS
inhibits the activity in hydrolyzing MOCAc-PLGL(Dpa)AR without reducing the
affinity between MOCAc-PLGL(Dpa)AR and MMP-7. The reason for this discrepancy
is unknown, and calls for further study, but we speculate that the binding of CS imparts
a long-range interaction to the active site and affects substrate binding. Regarding the
difference in the manner of inhibition of MMP-7 by CS depending on the substrate, the
difference in the interaction modes of CS with substrates must be considered.
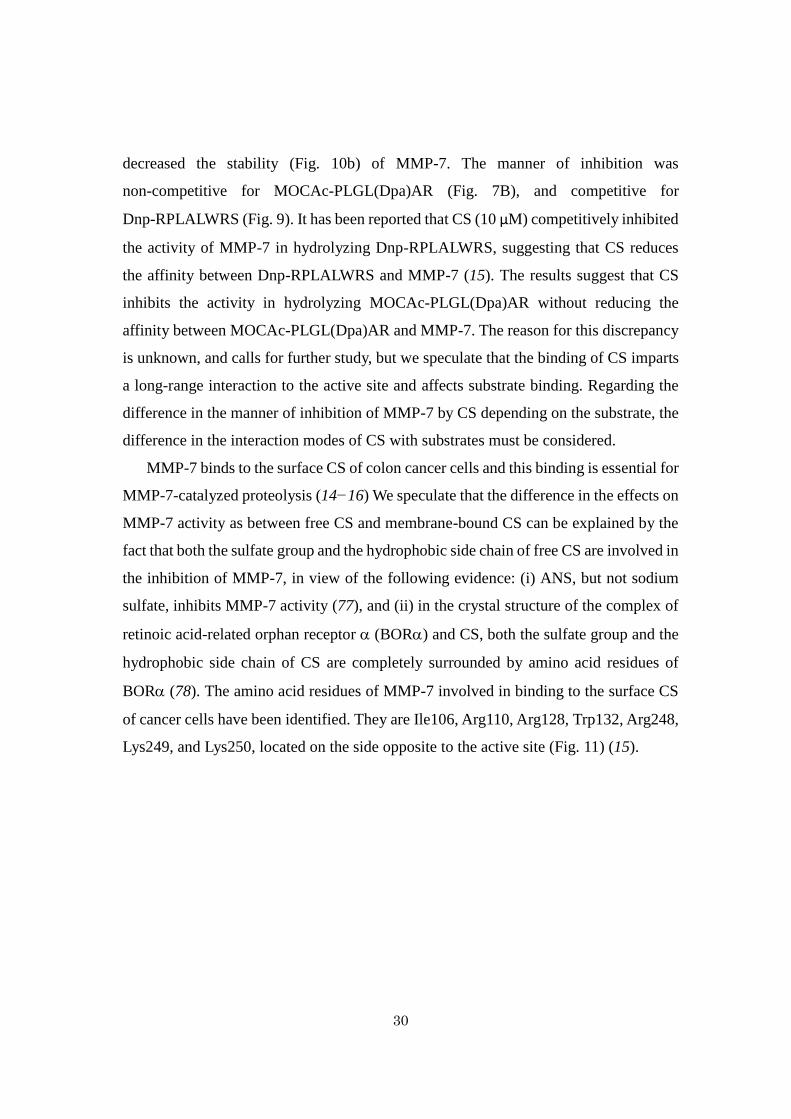
MMP-7 binds to the surface CS of colon cancer cells and this binding is essential for
MMP-7-catalyzed proteolysis (14−16) We speculate that the difference in the effects on
MMP-7 activity as between free CS and membrane-bound CS can be explained by the
fact that both the sulfate group and the hydrophobic side chain of free CS are involved in
the inhibition of MMP-7, in view of the following evidence: (i) ANS, but not sodium
sulfate, inhibits MMP-7 activity (77), and (ii) in the crystal structure of the complex of
retinoic acid-related orphan receptor (BOR) and CS, both the sulfate group and the
hydrophobic side chain of CS are completely surrounded by amino acid residues of
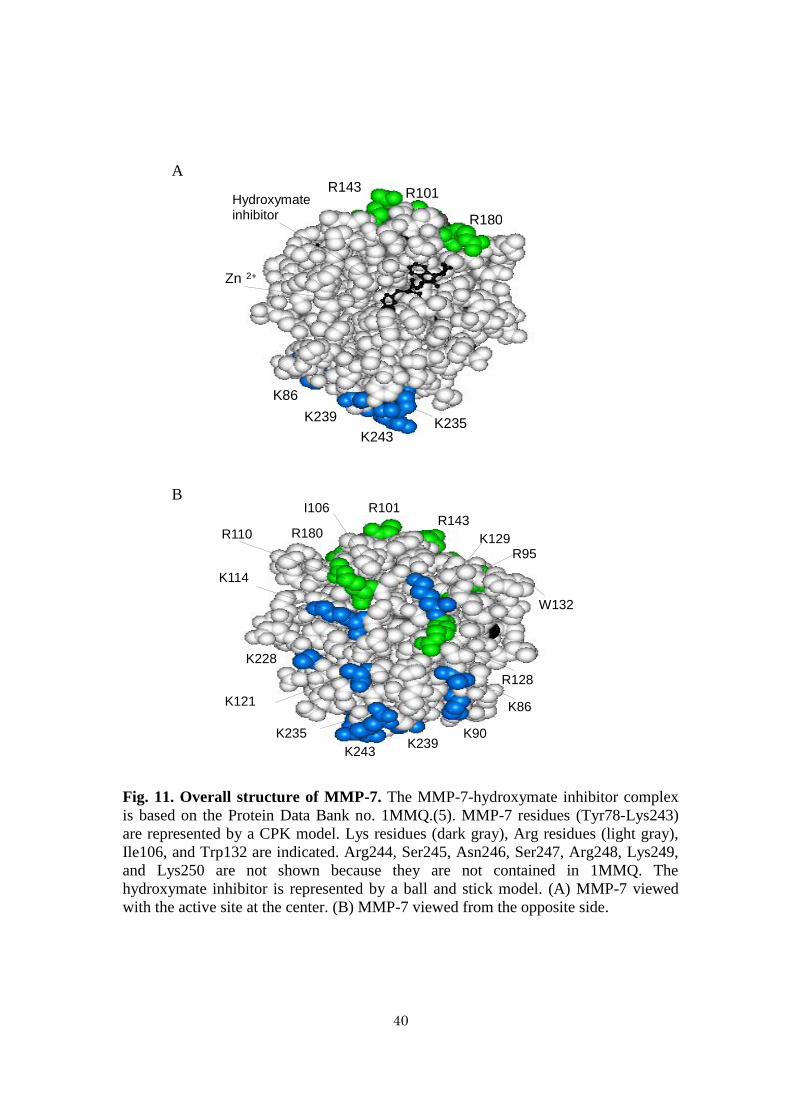
BOR (78). The amino acid residues of MMP-7 involved in binding to the surface CS
of cancer cells have been identified. They are Ile106, Arg110, Arg128, Trp132, Arg248,
Lys249, and Lys250, located on the side opposite to the active site (Fig. 11) (15).
31
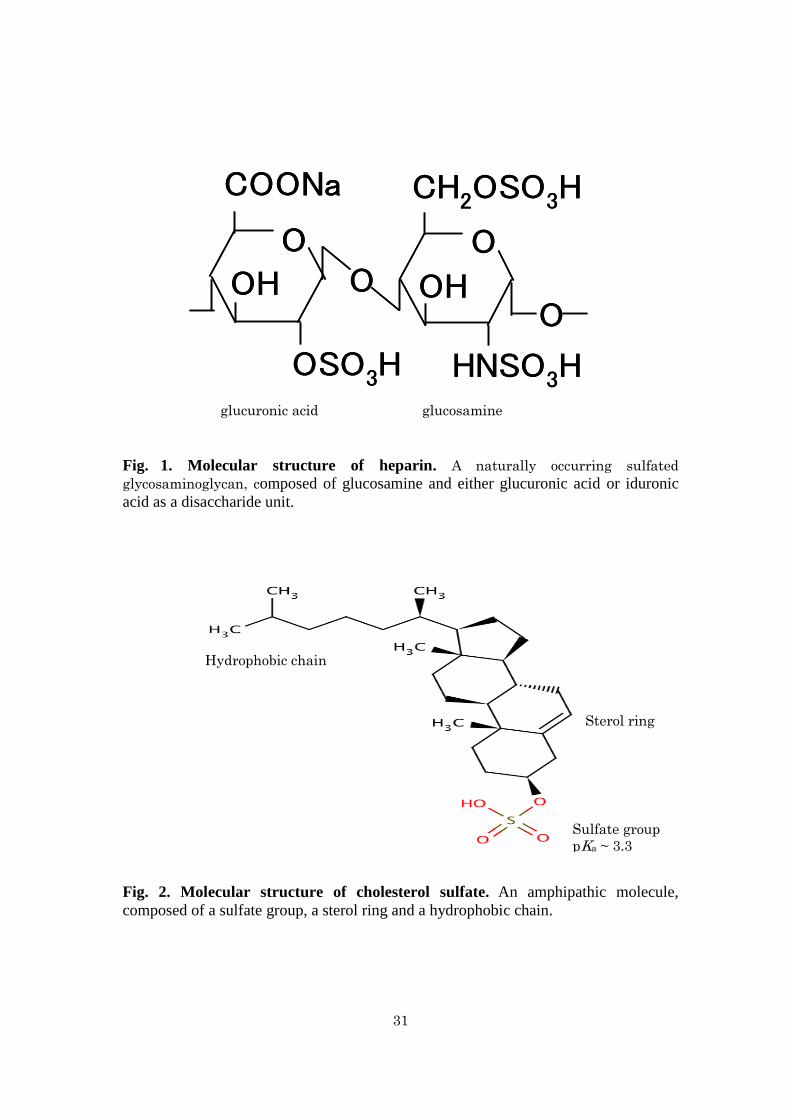
Fig. 1. Molecular structure of heparin. A naturally occurring sulfated
glycosaminoglycan, composed of glucosamine and either glucuronic acid or iduronic
acid as a disaccharide unit.
Fig. 2. Molecular structure of cholesterol sulfate. An amphipathic molecule,
composed of a sulfate group, a sterol ring and a hydrophobic chain.
COONa
O
OH
OSO3H
O
CH2OSO3H
O
OH
HNSO3H
O
COONa
O
OH
OSO3H
O
CH2OSO3H
O
OH
HNSO3H
O
Hydrophobic chain
Sterol ring
Sulfate group
pKa ~ 3.3
glucosamine glucuronic acid
32
Fig. 3. Activation of the MMP-7-catalyzed hydrolysis of MOCAc-PLGL(Dpa)AR
by heparin. Pre-incubation of MMP-7 was carried out in the presence or absence of
heparin at pH 7.5 at 25°C, and the reaction was carried out with 32 nM MMP-7 and
1.5 μM MOCAc-PLGL(Dpa)AR at pH 7.5 at 25°C. (A) Effect of heparin
concentration on the initial reaction rate, vo. Pre-incubation was carried out for 30 min,
and the reaction was carried out with 0−500 μM heparin. (B) Effect of pre-incubation
time on vo. Pre-incubation was carried out for 0−60 min, and the reaction was carried
out with 0, (●) or 100, (○) μM heparin.
0
1
2
3
4
0 100 200 300 400 500
vo
(nM
s-1
)
[heparin] (µM)
0
1
2
3
4
0 10 20 30 40 50 60
vo (
nM
s-1
)
Incubation time (min)
A
B
33
Fig. 4. Inhibition of the MMP-7-catalyzed hydrolysis of MOCAc-PLGL(Dpa)AR
by CS. Pre-incubation of MMP-7 was carried out in the presence or absence of CS at
pH 7.5 at 25°C, and the reaction was carried out with 32 nM MMP-7 and 1.5 µM
MOCAc-PLGL(Dpa)AR at pH 7.5 at 25°C. (A) Effect of CS concentration on the
initial reaction rate, vo. Pre-incubation was carried out for 30 min, and the reaction was
carried out with 0−500 μM CS. (B) Effect of pre-incubation time on vo. Pre-incubation
was carried out for 0−60 min, and the reaction was carried out with 0, (●) or 25, (○)
μM CS.
0.0
0.3
0.6
0.9
1.2
1.5
0 100 200 300 400 500
vo
(nM
s-1
)
[CS] (µM)
0.0
0.3
0.6
0.9
1.2
1.5
0 100 200 300 400 500
vo
(nM
s-1
)
[CS] (µM)
A
B
0
34
Fig. 5. Effects of heparin and CS on the MMP-7-catalyzed hydrolysis of
MOCAc-PLGL(Dpa)AR. Pre-incubation of MMP-7 was carried out in the presence
or absence of heparin and CS at pH 7.5 at 25°C for 30 min, and the reaction was
carried out with 32 nM MMP-7, 1.5 μM MOCAc-PLGL(Dpa)AR, 0−500 μM heparin,
and 0−500 μM CS at pH 7.5 at 25°C. (A) Activation of the MMP-7 activity by heparin
in the presence of 0, ○; 1, Δ; 10, ▲; 100, ☐; and 200, ■ μM CS. (B) Inhibition of the
MMP-7 activity by CS in the presence of 0, ○; 10, Δ; and 500, ☐ μM CS.
0
1
2
3
4
0 100 200 300 400 500
vo
(nM
s-1
)
[heparin] (µM)
0
1
2
3
4
0 100 200 300 400 500
vo
(nM
s-1
)
[CS] (µM)
A
B

35
Fig. 6. HPLC analysis of activation of the MMP-7-catalyzed hydrolysis of
MOCAc-PLGL(Dpa)AR by heparin. (A) MMP-7 was pre-incubated in the presence
or absence of heparin at pH 7.5 at 25°C for 10 min. The reaction was carried out with
32 nM MMP-7, 0-140 μM MOCAc-PLGL(Dpa)AR, and 0, ○; 25, Δ; and 200, ☐ μM.
(B) Effect of the heparin concentration on Km, (○); and kcat, (▲).
0
10
20
30
40
0 20 40 60 80 100 120 140
vo
(nM
s-1
)
[S]o (µM)
0.0
0.5
1.0
1.5
2.0
0
20
40
60
80
0 50 100 150 200
kca
t (s
-1)
( )
Km
(μM
) (
)
[heparin] (µM)
A
B
36
Fig. 7. HPLC analysis of inhibition of the MMP-7-catalyzed hydrolysis of
MOCAc-PLGL(Dpa)AR by CS. (A) MMP-7 was pre-incubated in the presence or
absence of CS at pH 7.5 at 25°C for 10 min. The reaction was carried out with 32 nM
MMP-7, 0-140 μM MOCAc-PLGL(Dpa)AR, and 0, ○; 10, Δ; 25, ☐; 50, ◇; or 100,
● μM CS at pH 7.5 at 25°C, and stopped at an appropriate time. (B) Lineweaver-Burk
plot.
0
10
20
30
40
0 40 80 120 160
vo
(nM
s-1
)
[S]o (µM)
010203040506070
-20 0 20 40 60
1/v
o(µ
M-1
s)
1/[S]o (µM-1)
A
B
37
Fig. 8. HPLC analysis of MOCAc-PLGL(Dpa)AR. Incubation was initiated by
mixing 237.5 l of buffer A, ○; 217.5 l of buffer A and 20 l of heparin solution (2.5
mM in buffer A), Δ; or 227.5 l of buffer A and 10 l of CS solution (2.5 mM in
methanol) (open square) and 12 l of the substrate solution (0−2.8 mM) (Total volume
of 250 l). After five min, 100 l of each solution was mixed with 400 l of 1% TFA.
The mixture was then centrifuged for one min at 10,000 × g. The supernatant (100
l) was applied to reversed-phase HPLC column equilibrated with 0.1% TFA. The
relative peak area (%) is defined as the peak area when the substrate at the indicated
concentration was incubated without heparin or CS, ○; 200 M heparin, Δ; or 100 M
CS, ☐; to that when 140 M substrate was incubated without heparin or CS.
0
20
40
60
80
100
0 50 100 150
Rel
aative
Pea
k A
rea
%
[S]o (µM)
38
Fig. 9. HPLC analysis of inhibition of the MMP-7-catalyzed hydrolysis of
Dnp-RPLALWRS by CS. (A) MMP-7 was pre-incubated in the presence or absence
of CS at pH 7.5 at 25°C for 10 min. The reaction was carried out with 32 nM MMP-7,
0-0.5 mM Dnp-RPLALWRS, and 0, ○; or 10, Δ μM CS at pH 7.5 at 25°C, and
stopped at an appropriate time. (A) Effect of the initial substrate concentrations, [S]o,
on vo. Solid line represents the best fit of the Michaelis-Menten equation using the
nonlinear least-squares methods. (B) Lineweaver-Burk plot.
0.0
0.2
0.4
0.6
0.8
1.0
0 0.1 0.2 0.3 0.4 0.5
vo
(nM
s-1
)
[S]o(mM)
01234567
-4 -2 0 2 4 6 8 10
1/v
o(µ
M-1
s)
1/[S]o (mM-1)
A
B
39
Fig. 10. Irreversible thermal inactivation of MMP-7. MMP-7 was incubated at pH
7.5 at 25, 50, 60, or 70°C with 0, 50, 100, or 200 μM heparin or CS for 10 min, and
the hydrolyzing reaction was carried out with 0, 25, 50, or 100 μM heparin or CS,
respectively, at pH 7.5 at 25°C. The relative activity of MMP-7 was defined as the
ratio of the initial reaction rate with thermal incubation for 10 min at 50, 60, or 70°C
to that at 25°C (1.0 nM s-1
for thermal incubation without heparin or CS; 2.6, 2.8, and
3.0 nM s-1
for those with 50, 100, and 200 μM heparin; and 0.36, 0.15, and 0.07 nM s-1
for those with 50, 100, and 200 μM CS, respectively).
0
20
40
60
80
100R
ela
tive
activity (
%)
Temperature (⁰C) 50 60 70 50 60 70 50 60 70 50 60 70
[Heparin] (μM) at thermal incubation
0 50 100
0
20
40
60
80
100
Rela
tive
activity (
%)
Temperature (⁰C)
[CS] (μM) at thermal incubation
50 60 70 50 60 70 50 60 70 50 60 70
50 100 200
0
A
200
A
B
40
Fig. 11. Overall structure of MMP-7. The MMP-7-hydroxymate inhibitor complex
is based on the Protein Data Bank no. 1MMQ.(5). MMP-7 residues (Tyr78-Lys243)
are represented by a CPK model. Lys residues (dark gray), Arg residues (light gray),
Ile106, and Trp132 are indicated. Arg244, Ser245, Asn246, Ser247, Arg248, Lys249,
and Lys250 are not shown because they are not contained in 1MMQ. The
hydroxymate inhibitor is represented by a ball and stick model. (A) MMP-7 viewed
with the active site at the center. (B) MMP-7 viewed from the opposite side.
R128
R101
R180 R143
R110 K129
K121
K228
K86
K90
K243
K235 K239
K114
R95
I106
W132
Zn 2+
R143 Hydroxymate inhibitor
R101
R180
K86
K235 K239
K243
A
B
41
Chapter 3
Interaction of 8-Anilinonaphthalene 1-Sulfonate (ANS) and Thermolysin as
Examined by ANS Fluorescence
Introduction
Thermolysin (TLN) is the principal archetypal metalloprotease and it has served
for years as a model system to study the inhibition and activation mechanisms of other
metalloproteinases (4, 42) such that to date much of the data used to derive the
currently held views of the chemical mechanisms of the metalloproteases is derived
from detailed structural and kinetic analysis of this protease (4). The activities of
thermolysin and human matrix metalloprotease are known to increase in an
exponential fashion with increasing concentrations of neutral salts. The degree of
activation has been shown to be different from that of the hofmeister series, with
sodium ions being more effective in enhancing the activity of thermolysin. However
the exact mechanism of salt-induced activation of thermolysin is still unknown.
ANS is a fluorescent probe widely used for the analysis of proteins (21, 22), to
characterize folding intermediates because of its high affinity for partially molten like
globule states which are absent in native or denatured protein (24-27), to detect
environmental or ligand induced conformational changes (28-29), to measure surface
hydrophobicity (30), to characterize the binding sites of ligands on proteins, and to
detect aggregation or fibrillation (31-33). In this chapter, we explore the mechanism of
salt induced activation of TLN by NaCl using ANS.
Materials and Methods
Materials. ANS (Lot CM10-118, 299.34 Da) was purchased from AnaSpec Inc.
(San Jose, CA). The concentration of ANS was determined spectrophotometrically
42
using the molar absorption coefficient at 350 nm, 350, of 5,000 M-1
cm-1
(55, 56). A
three-times-crystallized and lyophilized preparation of TLN (Lot TIDC391, 34.6 kDa)
was purchased from Daiwa Kasei (Osaka, Japan). The preparation was used without
further purification. The TLN solution was filtered through a Millipore membrane filter,
Type HA (pore size, 0.45 M), before use. The concentration of TLN was determined
using 277 of 63,000 M-1
cm-1
(46). FAGLA (Lot 111K1764) was purchased from Sigma
(St. Louis, MO). The concentration of FAGLA was determined using 345 of 766 M-1
cm-1
(55, 56). MOCAc-PLGL(Dpa)AR (1,093.2 Da) (19) and MOCAc-PLG (501.54
Da) were purchased from Peptide Institute (Osaka, Japan). Their concentrations were
determined by the denoted molecular weights. All other chemicals were from Nacalai
Tesque (Kyoto, Japan).
Fluorometric analysis of ANS - Pre-incubation (1,000 l) was initiated by mixing 10
l of the ANS solution (2,500 M in 40 mM HEPES buffer at 10 mM CaCl2, 0–4.0 M
NaCl at pH 7.5 (buffer A), 0–490 l of buffer A, and 0–500 l of the TLN solution (4.0
M in buffer A) at 25°C for 10 min. After the pre-incubation, the fluorescence spectra
were measured with excitation at 380 nm and emission at 400-600 nm with a Shimadzu
RF-5300PC fluorescence spectrophotometer at 25°C.
HPLC analysis of the TLN-catalyzed hydrolysis of MOCAc-PLGL(Dpa)AR.
MOCAc-PLGL(Dpa)AR - hydrolyzing activity was determined by methods described
previously (48). Briefly, pre-incubation (240 l) was initiated by mixing 0–50 l of the
ANS solution (2,500 M in buffer A), 0–236 l of buffer A, and 4 l of the TLN
solution (2.0 M in buffer A) at 25°C for 10 min. The reaction was initiated by adding
10 l of the substrate solution (0.5 mM) dissolved in DMSO to 240 l of the
pre-incubated solution (total volume 250 l) at 25°C. The initial concentrations of TLN,
substrate, ANS, and DMSO were 32 nM, 20 M, 0−500 M, and 4% v/v, respectively.
The reaction was stopped at appropriate times, by mixing 100 l of the reaction solution
with 400 l of 1% trifluoroacetic acid (TFA). This mixture (100 l) was then applied to
43
reversed-phase HPLC done on a TSKgel ODS-80Ts column (4.6 mm inner diameter x
150 mm) (Tosoh, Tokyo) equilibrated with 0.1% TFA, 20% v/v acetonitrile. A linear
gradient was generated from 20 to 70% acetonitrile at a retention time of 5 min over 20
min at a flow-rate of 1.0 ml/min. The absorption of elutes was detected at 335 nm. The
substrate and its two products, MOCAc-PLG and L(Dpa)AR, were separated, and they
were evaluated by the respective peak areas. Reaction rate was determined from the
time course of the production of MOCAc-PLG.
Thermal inactivation of TLN - The thermal inactivation of TLN was examined by
methods described previously (79). Briefly, 100 l of a solution containing 1.0 M
thermolysin, in 50 mM acetate-NaOH buffer at pH 3.5, 4.0, and 4.5, 50 mM
MES-NaOH buffer at pH 5.0, 5.5 and 6.5, 50 mM HEPES-NaOH buffer at pH 7.5 and
8.0 and 50 mM AMPSO-NaOH buffer at pH 8.5 and 9.0, each containing 10 mM CaCl2
was incubated at 70ºC for specified durations (30, 60, 90, 120, 150, or 180 min). Then it
was incubated at 25ºC for 5 min. Relative activity for FAGLA hydrolysis was
determined as described above. Under the assumption that the thermal inactivation of
TLN is irreversible and consists of only one step, the first-order rate constant (kobs) of
thermal inactivation was evaluated by plotting the logarithm of the activity (kcat/Km)
against the duration of thermal treatment.
Spectrophotometric analysis of the TLN-catalyzed hydrolysis of FAGLA -
FAGLA-hydrolyzing activity was determined by methods described previously (46).
Briefly, the reaction was initiated by adding 50 l of the TLN solution to 950 l of the
substrate solution in buffer at various pH above described (total volume 1,000 l) at
25°C. The initial concentrations of TLN and substrate were 0.1 M and 400 M,
respectively. A345 of the reaction solution was measured continuously. The amount of
FAGLA hydrolyzed was evaluated using the molar absorption difference due to
hydrolysis, Δ345 = –310 M-1
cm-1
, at 25ºC (46, 54) Reaction rate was determined from
the time course of the decrease of FAGLA.
44
Results
Effects of TLN on ANS fluorescence - Fluorescence spectra of ANS with varying
concentrations of thermolysin in 40 mM HEPES, 10 mM CaCl2, 0 M NaCl at pH 7.5
were measured (Fig. 1). The shapes of the fluorescence spectra of ANS measured with
0−2.0 M of TLN were almost the same, while the fluorescence intensity increased,
and the wavelength giving the maximum fluorescence (λFImax) decreased with
increasing concentrations of TLN (Fig. 1A). The fluorescence intensity at 490 nm
(FI490) at 2.0 M TLN was 133% of FI490 at 0 M TLN (Fig. 1B). λFImax at 2.0 M
TLN was shorter by 14 nm than λFImax at 0 M thermolysin (Fig. 1C). These results
indicate that the anilinonaphthalene group of ANS binds with TLN through
hydrophobic interaction.
Effects of ANS on TLN activity - FAGLA has widely been used as a substrate for
TLN (45-48). However, 345 detection was not available because of the effect of ANS.
Accordingly, MOCAc-PLGL(Dpa)AR was used,(48) and the products were detected
by reversed-phase HPLC (Fig. 2). TLN and ANS were pre-incubated at 25°C for 10
min, followed by the reaction at 25°C. The reaction rates were unchanged with
increasing concentration of ANS. This indicates that ANS neither activates nor inhibits
TLN activity.
Effects of salts on ANS fluorescence in the presence of TLN - Fluorescence
spectra of ANS in the presence of 1.0 M TLN in buffer A with varying
concentrations of NaCl, NaBr, LiCl, or KCl were measured. The change of FI490,
∆FI490, defined as FI490 in the presence of 1.0 M TLN minus FI490 in the absence of
TLn, increased with increasing salt concentrations from zero to 4.0 M (Fig. 3A).
∆FI490 at 4.0 M NaCl, NaBr, LiCl, and KCl were 249, 204, 168, and 128%,
respectively, of those at 0 M. In the presence of 1.0 M TLN, λFImax at 4.0 M NaCl,
NaBr, LiCl, and KCl were shorter by 17, 15, 11, and 8 nm, respectively, than λFImax at
45
0 M NaCl (Fig. 3B). In the absence of TLN, λFImax was unchanged (data not shown).
Thus, ∆λFImax, defined as λFImax in the presence of 1.0 M TLN minus λFImax in the
absence of TLN, decreased from −6 to −17 nm with increasing NaCl concentration
([NaCl]), −6 to −15 nm with increasing [NaBr], −6 to −8 nm with increasing [LiCl],
and −5 to −8 nm with increasing [KCl] from zero to 4.0 M. ∆FI490 and ∆λFImax at 0−4
M NaCl are summarized in Table 1. These results indicate that the magnitude of the
salt-induced changes in ANS fluorescence by 1.0 M TLN at pH 7.5 was in the order
of NaCl, NaBr, LiCl, and KCl, suggesting that Na+ ion potently and Li
+ and K
+ ions
slightly affect the ANS fluorescence in the presence of TLN, while Cl– and Br
– ions
hardly affect it.
Binding of ANS with TLN at various NaCl concentrations - To measure the
dissociation constants, Kd, of ANS with TLN, fluorescence area of varying
concentrations of ANS was measured in the presence of 1.0 M TLN at 0, 1.0, 2.0, 3.0,
and 4.0 M NaCl, pH 7.5. The plot of [ANS]/∆FI_area vs. [ANS] showed non-parallel
lines intersecting near at the Y-axis (Fig. 4A). Under the assumption that ANS binds
with TLN at a single site, the Kd values at pH 7.5 at 0, 1.0, 2.0, 3.0, and 4.0 M NaCl
were calculated to be 33 ± 2, 29 ± 2, 23 ± 4, 15 ± 4, and 9 ± 3 M, respectively.
Relative Kd was defined as the ratio of the Kd value at x M NaCl to that at 0 M NaCl
(33 ± 2 M). The plot of the reciprocal of relative Kd vs. [NaCl] indicated that the
reciprocal of relative Kd value increased with increasing [NaCl] (Fig. 4B). The
increase in logarithmic value of the reciprocal of relative Kd value was not
proportional to [NaCl] (Fig. 4C).
Binding of ANS with TLN at various salt concentrations - To measure Kd of ANS
with TLN, fluorescence area of varying concentrations of ANS was measured in the
presence of 1.0 M TLn at 4.0 M NaCl, NaBr, LiCl, or KCl at pH 7.5. The plot of
[ANS]/∆FI_area vs. [ANS] showed non-parallel lines which did not intersect (Fig. 5).
The Kd values at pH 7.5 at 4.0 M NaCl, NaBr, LiCl, and KCl were calculated to be 9 ±
46
3, 10 ± 2, 12 ± 3, and 15 ± 2 µM, which were 27–45% of that of Kd without salts (33 ±
2 M), indicating that the Kd values hardly depend on salt species at 4 M.
Effects of pH on ANS fluorescence in the presence of TLN - Fluorescence spectra
of ANS in the presence of 1.0 M thermolysin at 0 M NaCl with varying pH were
measured. ∆FI490, defined as FI490 in the presence of 1.0 M TLN minus FI490 in the
absence of TLn, increased with increasing pH from 4.0 to 9.0, and ∆FI490 at pH 9.0
was 500% of that at pH 4.0 and 170% of that at pH 7.5 (Fig. 6A). In the presence of
1.0 M TLN, λFImax at pH 9.0 was shorter by 17 nm than that at pH 4.0 and by 14 nm
than that at pH 7.5, while in the absence of TLn, it was stable (Fig. 6B). Thus, ∆λFImax
decreased from −3 to −16 nm with increasing pH (7.0–9.0) of NaCl. These results
indicate that the magnitude of the change in ANS fluorescence by 1.0 M TLN at 0 M
NaCl increased with increasing pH from 7.0 to 9.0.
Binding of ANS with TLN at various pH - TLN exhibits bell-shaped pH-activity
profile with the maximum at pH 6.5 and 7.0 (54) Thermal stabilities of TLN at 70°C at
pH 4.5–8.5 were measured (Fig. 7A). Relative stability was defined as the ratio of kobs
at pH 4.5 to that at given pH. The result indicated that the relative stability was highest
at pH 6.5. To measure the dissociation constants, Kd, of ANS with TLN, fluorescence
areas of varying concentrations of ANS were measured in the presence of 1.0 M
TLN at 0 M NaCl, pH 5.5, 6.5, 7.5, and 8.5. The plot of [ANS]/∆FI_area vs. [ANS]
showed non-parallel lines intersecting at the X-axis (Fig. 7B). Under the assumption
that ANS binds with TLN at a single site, the Kd values at 0 M NaCl at pH 5.5, 6.5, 7.5,
and 8.5 were 34 ± 3, 31 ± 2, 33 ± 2, and 32 ± 2 M, respectively (Fig. 7B), indicating
that that the Kd values were unchanged with varying pH from 5.5 to 8.5.
47
Discussion
It has been observed that the effectiveness of monovalent cations of neutral salts to
activate thermolysin is in the order of Na+ > K
+ > Li
+, an order different to that of the
Hofmeister series (Li+ > Na
+ > K
+) (80–82) or the ionic series of the monovalent cations
(K+ > Na
+ > Li
+). Based on this evidence, the activation of thermolysin by neutral salts
is not derived from changes in water structure or in the hydration of the enzyme or
substrate. Hence it has been speculated that the salt-induced activation of TLN might be
as a result of conformational changes brought about by the direct interactions of the ions
with charged residues on the enzyme (80–82).
In this study, we showed that ANS binds with TLN (Fig. 1), ANS does not inhibit
TLN activity (Fig. 2), and NaCl and other salts increase the affinity of TLN for ANS
(Figs 3–5). The degree of the salt-induced changes in ANS fluorescence by TLN was
in the order of NaCl, NaBr, LiCl, and KCl (Fig. 3), suggesting that Na+ affects ANS
fluorescence more potently than Cl–
ion. It also suggests that the effectiveness of
monovalent cations of neutral salts on the salt-induced changes in ANS fluorescence
by thermolysin is Na+ > Li
+ > K
+, being different from that of activation of
thermolysin (Na+ > K
+ > Li
+). The Kd value of ANS and TLN at 4.0 M salt was in the
order of KCl, LiCl, NaBr, and NaCl (Fig. 5), suggesting that the degree of the effects
of salts on the interaction of ANS and TLN depends on salt species. From the result
that the Kd values of ANS and TLN did not change with increasing pH from 5.5−8.5
(Fig. 7), we speculate that amino acid residues with side chains with pKa values of
around 5.5−8.5 might not be located in the ANS-binding site. However, from the
results presented in this study, it is difficult to precisely speculate the mechanism of
the effects of salts on the interaction of ANS and TLN.
In contrast to that little is known about the mechanism of salt-induced activation of
thermolysin, effects of ions on enzyme activity have been well studied in human
immunodeficiency virus type-1 (HIV-1) protease. HIV-1 protease is a homodimeric
aspartic protease, each containing 99 amino acid residues. Like TLN, HIV-1 is highly
activated and stabilized by neutral salts (1-2 M NaCl) (83-85). Recent molecular
48
dynamics simulations and conductivity measurement analysis of HIV-1 protease have
shown that Na+ binds at least twice as strongly to the surface of HIV-1 protease than K
+
does (86-88).
In conclusion, this study suggests that Na+ and /or Cl
- ions bind with thermolysin
and affect its binding with ANS. We also think that the activation and stabilization of
TLN by neutral salts might be due to the binding of ions with TLN.
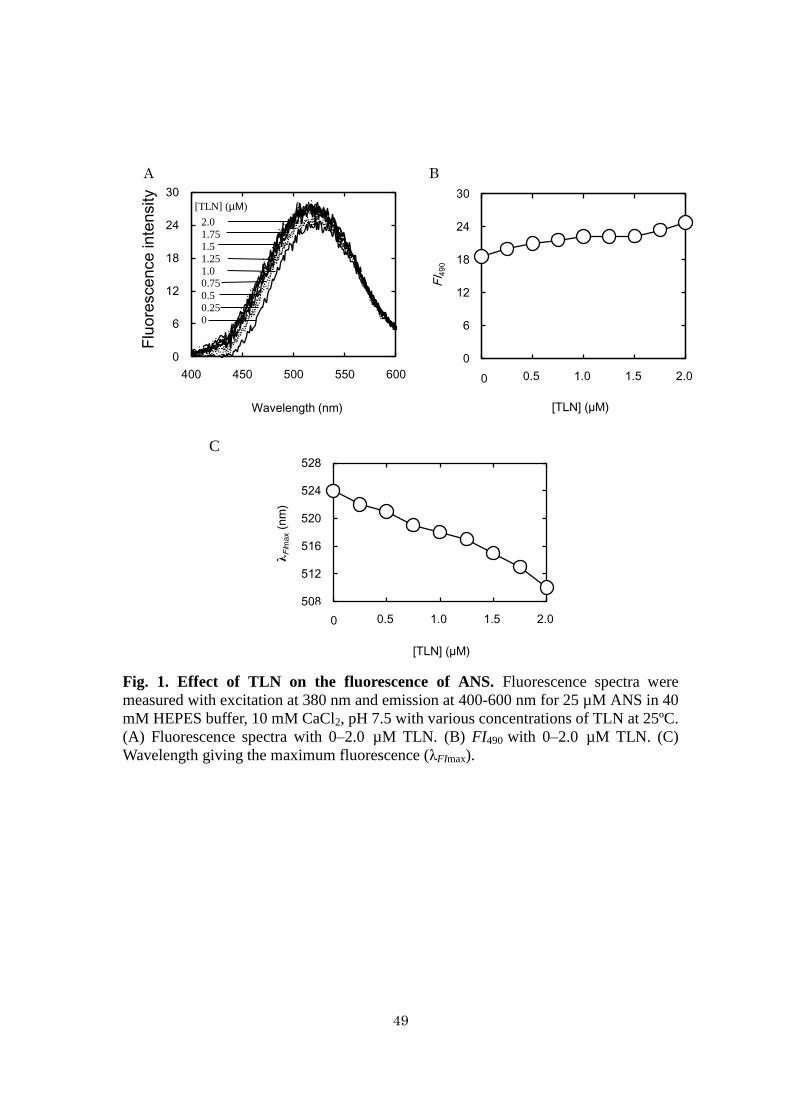
49
Fig. 1. Effect of TLN on the fluorescence of ANS. Fluorescence spectra were
measured with excitation at 380 nm and emission at 400-600 nm for 25 µM ANS in 40
mM HEPES buffer, 10 mM CaCl2, pH 7.5 with various concentrations of TLN at 25ºC.
(A) Fluorescence spectra with 0–2.0 µM TLN. (B) FI490 with 0–2.0 µM TLN. (C)
Wavelength giving the maximum fluorescence (λFImax).
0
6
12
18
24
30
400 450 500 550 600
Flu
ore
sce
nce
inte
nsity
Wavelength (nm)
2.0
1.75 1.5
1.25
1.0 0.75
0.5
0.25 0
[TLN] (µM)
508
512
516
520
524
528
0.0 0.5 1.0 1.5 2.0
λF
Ima
x (
nm
)
[TLN] (µM)
0
C
0
6
12
18
24
30
0.0 0.5 1.0 1.5 2.0
FI 4
90
[TLN] (µM)
0
A B
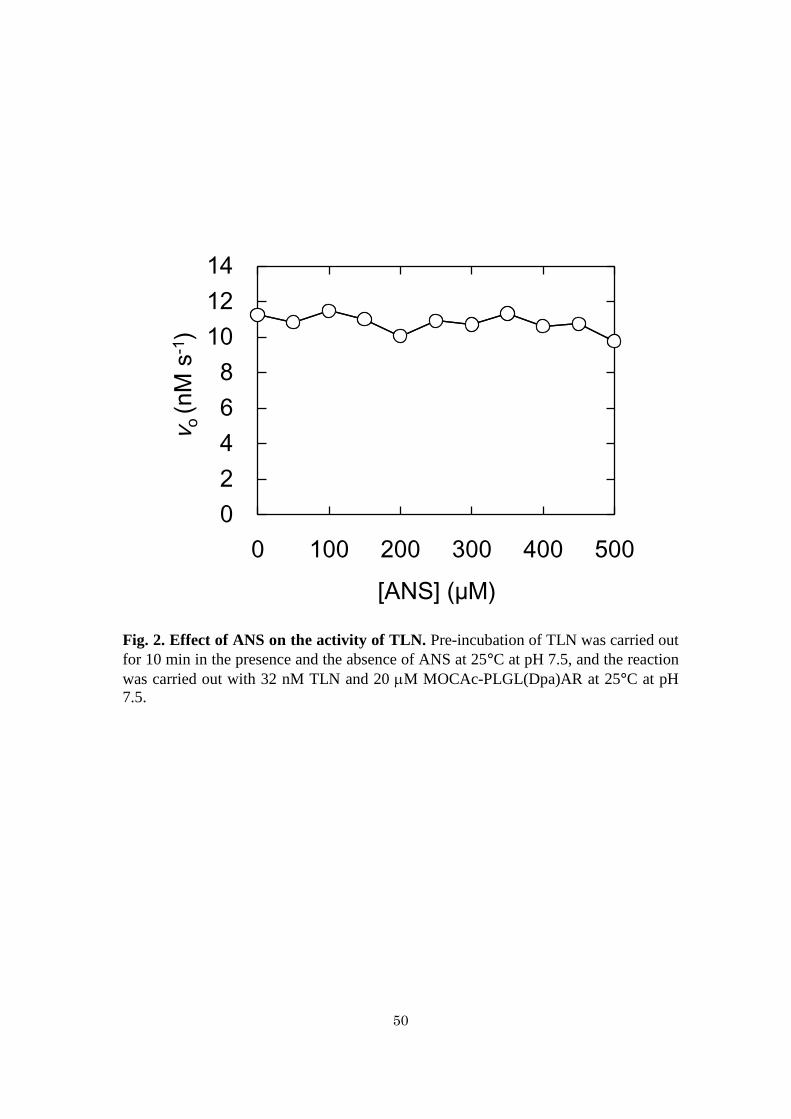
50
Fig. 2. Effect of ANS on the activity of TLN. Pre-incubation of TLN was carried out
for 10 min in the presence and the absence of ANS at 25°C at pH 7.5, and the reaction
was carried out with 32 nM TLN and 20 M MOCAc-PLGL(Dpa)AR at 25°C at pH
7.5.
0
2
4
6
8
10
12
14
0 100 200 300 400 500
vo
(nM
s-1
)
[ANS] (µM)
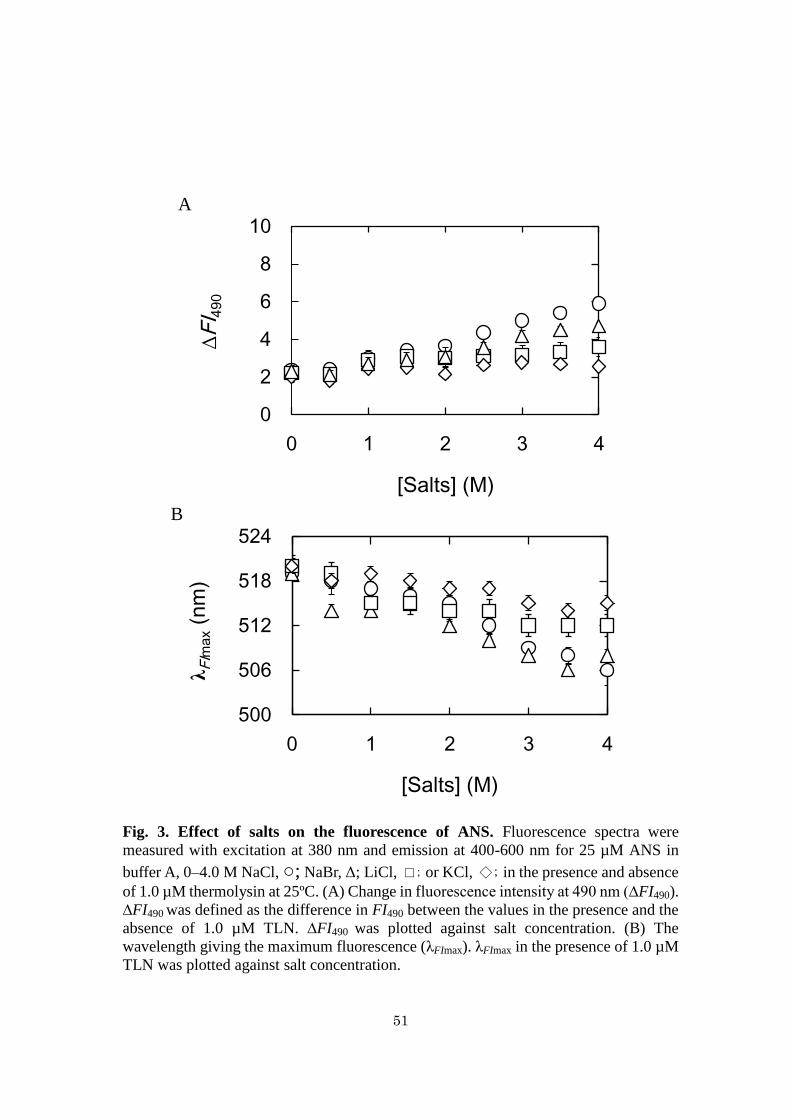
51
Fig. 3. Effect of salts on the fluorescence of ANS. Fluorescence spectra were
measured with excitation at 380 nm and emission at 400-600 nm for 25 µM ANS in
buffer A, 0–4.0 M NaCl, ○; NaBr, Δ; LiCl, ☐; or KCl, ◇; in the presence and absence
of 1.0 µM thermolysin at 25ºC. (A) Change in fluorescence intensity at 490 nm (∆FI490).
∆FI490 was defined as the difference in FI490 between the values in the presence and the
absence of 1.0 µM TLN. ∆FI490 was plotted against salt concentration. (B) The
wavelength giving the maximum fluorescence (λFImax). λFImax in the presence of 1.0 µM
TLN was plotted against salt concentration.
0
2
4
6
8
10
0 1 2 3 4
∆F
I 490
[Salts] (M)
500
506
512
518
524
0 1 2 3 4
λF
Imax (
nm
)
[Salts] (M)
A
B
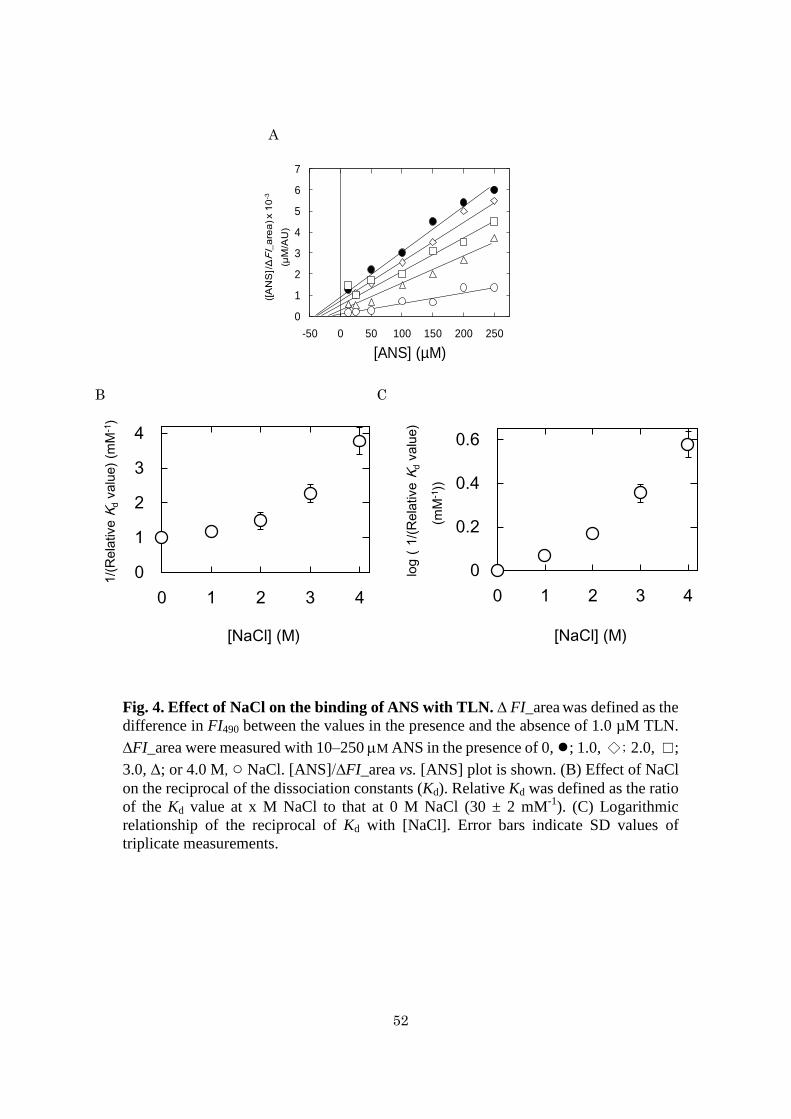
52
Fig. 4. Effect of NaCl on the binding of ANS with TLN. ∆ FI_area was defined as the
difference in FI490 between the values in the presence and the absence of 1.0 µM TLN.
∆FI_area were measured with 10–250 M ANS in the presence of 0, ●; 1.0, ◇; 2.0, ☐;
3.0, Δ; or 4.0 M, ○ NaCl. [ANS]/∆FI_area vs. [ANS] plot is shown. (B) Effect of NaCl
on the reciprocal of the dissociation constants (Kd). Relative Kd was defined as the ratio
of the Kd value at x M NaCl to that at 0 M NaCl (30 ± 2 mM-1
). (C) Logarithmic
relationship of the reciprocal of Kd with [NaCl]. Error bars indicate SD values of
triplicate measurements.
0
1
2
3
4
5
6
7
-50 0 50 100 150 200 250
([A
NS
]/Δ
FI_
are
a) x 1
0-3
(µM
/AU
)
[ANS] (µM)
0
1
2
3
4
0 1 2 3 4
1/(
Rela
tive K
d v
alu
e)
(mM
-1)
[NaCl] (M)
0
0.2
0.4
0.6
0 1 2 3 4
log(
1/(
Rela
tive K
d v
alu
e)
(mM
-1))
[NaCl] (M)
B C
A
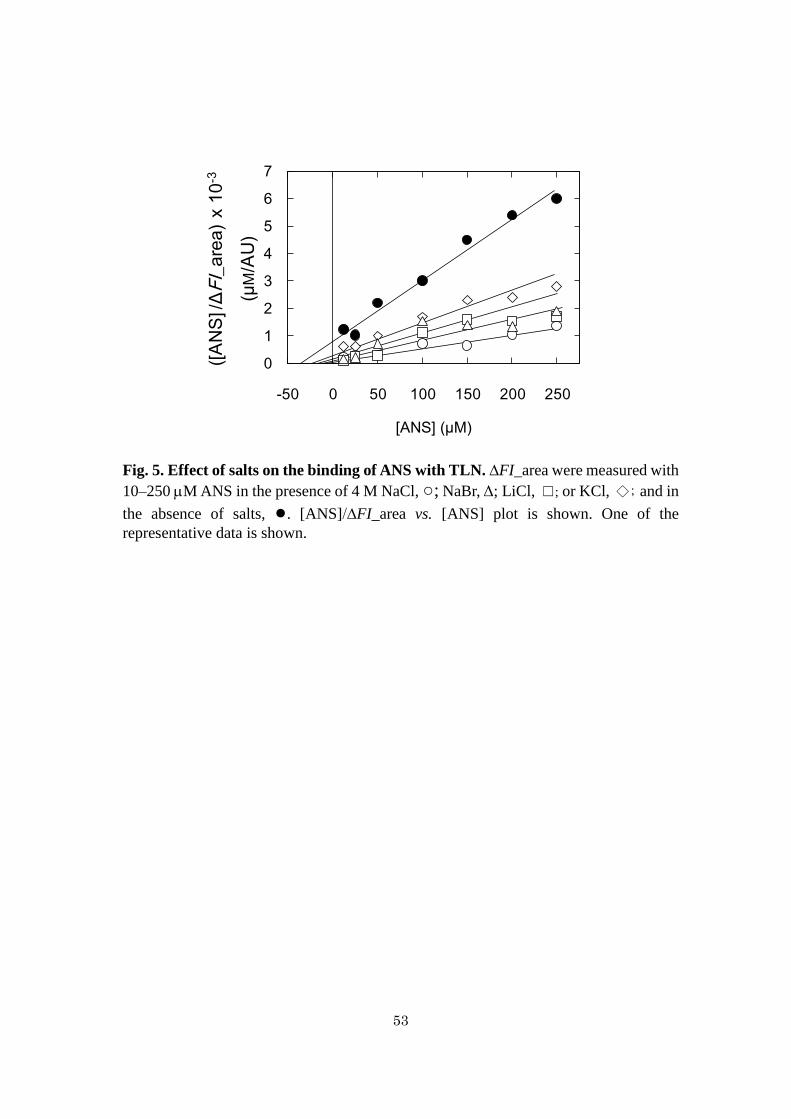
53
Fig. 5. Effect of salts on the binding of ANS with TLN. ∆FI_area were measured with
10–250 M ANS in the presence of 4 M NaCl, ○; NaBr, Δ; LiCl, ☐; or KCl, ◇; and in
the absence of salts, ●. [ANS]/∆FI_area vs. [ANS] plot is shown. One of the
representative data is shown.
0
1
2
3
4
5
6
7
-50 0 50 100 150 200 250
([A
NS
]/Δ
FI_
are
a)
x 1
0-3
(µM
/AU
)
[ANS] (µM)
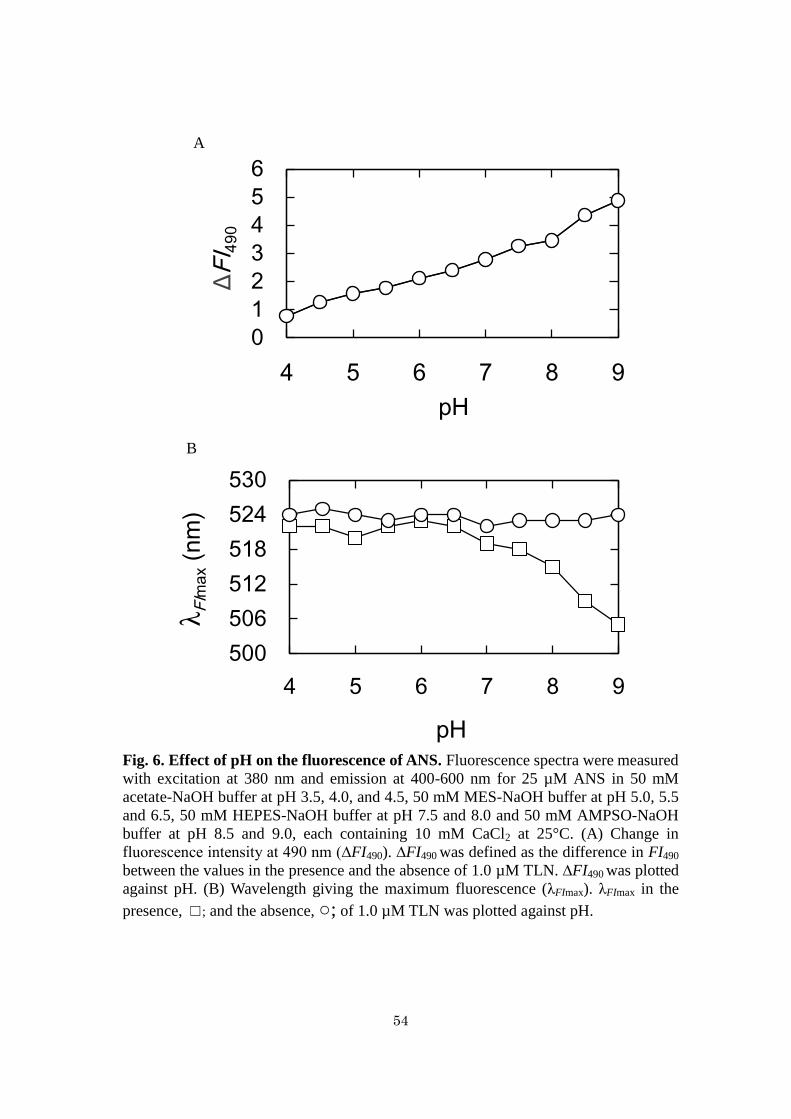
54
Fig. 6. Effect of pH on the fluorescence of ANS. Fluorescence spectra were measured
with excitation at 380 nm and emission at 400-600 nm for 25 µM ANS in 50 mM
acetate-NaOH buffer at pH 3.5, 4.0, and 4.5, 50 mM MES-NaOH buffer at pH 5.0, 5.5
and 6.5, 50 mM HEPES-NaOH buffer at pH 7.5 and 8.0 and 50 mM AMPSO-NaOH
buffer at pH 8.5 and 9.0, each containing 10 mM CaCl2 at 25°C. (A) Change in
fluorescence intensity at 490 nm (∆FI490). ∆FI490 was defined as the difference in FI490
between the values in the presence and the absence of 1.0 µM TLN. ∆FI490 was plotted
against pH. (B) Wavelength giving the maximum fluorescence (λFImax). λFImax in the
presence, ☐; and the absence, ○; of 1.0 µM TLN was plotted against pH.
0
1
2
3
4
5
6
4 5 6 7 8 9
ΔF
I 49
0
pH
500
506
512
518
524
530
4 5 6 7 8 9
λF
Ima
x (
nm
)
pH
B
A

55
Fig. 7. Effect of pH on the binding of ANS with TLN. (A) pH-stability profile. TLN
(1.0 M) in 40 mM HEPES-NaOH, 10 mM CaCl2, and 0–4.0 M NaCl at pH 7.5 was
incubated at 70°C for specified durations. The experimental conditions for FAGLA
hydrolysis were as described in the Materials and Methods section. Relative stability of
TLN variants was defined as the ratio of the first-order rate constant, kobs, of the thermal
inactivation at 0 M NaCl (1.2 ± 0.1 × 10⁻⁴
s-1
) to that at x M NaCl. (B) [ANS]/∆FI_area
vs. [ANS] plot. Symbols for pH: 5.5, ○; 6.5, Δ; 7.5, ☐; and 8.5, ◇. Error bars indicate
SD values of triplicate measurements.
0
0.6
1.2
1.8
2.4
4 5 6 7 8 9
Rela
tive s
tabili
ty
pH
0
6
12
18
24
30
-50 0 50 100 150 200 250
([A
NS
]/Δ
FI_
are
a) x 1
0-3
(µM
/AU
)
[ANS] (µM)
A
B
56
Summary
Chapter 1
Human matrix metalloproteinase 7 (MMP-7) is the smallest matrix
metalloproteinase. It plays important roles in tumor invasion and metastasis.
8-Anilinonaphthalene 1-sulfonate (ANS) is a fluorescent probe widely used for the
analysis of proteins. It emits a large fluorescence energy when its anilinonaphthalene
group binds with hydrophobic regions of protein. In this study, we analyzed the
interaction of ANS and MMP-7. At pH 4.5−9.5, ANS inhibited MMP-7 activity in the
hydrolysis of MOCAc-PLGL(Dpa)AR. The inhibition was a non-competitive manner
and depended on the time for pre-incubation of ANS and MMP-7. At pH 4.5−9.5, the
fluorescence of ANS was not changed by the addition of MMP-7. At pH 3.5, MMP-7
lacked activity, and the fluorescence of ANS was increased by the addition of MMP-7.
These results suggest that at pH 4.5−9.5, the sulfonic group of ANS binds with MMP-7
through electrostatic interaction, while at pH 3.5, the anilinonaphthalene group of ANS
binds with MMP-7 through hydrophobic interaction.
Chapter 2
Sulfated glycosaminoglycans and sulfated lipids are involved in the biological
functions of human matrix metalloproteinase 7 (MMP-7). In this study, the effects of
heparin and cholesterol sulfate (CS) on the activity and stability of MMP-7 in the
hydrolysis of a synthetic substrate, MOCAc-PLGL(Dpa)AR, were examined. Heparin
increased activity by decreasing Km, and the Km values for 0 and 50 M heparin were 57
± 8 and 19 ± 5 M, respectively. CS decreased activity in a non-competitive inhibitory
manner with a Ki value of 11 ± 3 M. In thermal incubation at 50−70ºC, heparin
increased relative activity (the ratio of kcat/Km of MMP-7 with incubation to that without
it), while CS decreased relative activity. These results indicate that heparin increases the
57
activity and stability of MMP-7, while CS decreases them.
Chapter 3
Neutral salts activate and stabilize thermolysin (TLN). In this study, to explore the
mechanism, we analyzed the interaction of 8-anilinonaphthalene 1-sulphonate (ANS)
and thermolysin by ANS fluorescence. At pH 7.5, the fluorescence of ANS increased
and blue-shifted with increasing concentrations (0–2.0 M) of TLN, indicating that the
anilinonaphthalene group of ANS binds with TLN through hydrophobic interaction.
ANS did not alter TLN activity. The dissociation constants (Kd) of the complex between
ANS and TLN was 33 ± 2 M at 0 M NaCl at pH 7.5, decreased with increasing NaCl
concentrations, and reached 9 ± 3 M at 4 M NaCl. The Kd values were not varied
(31−34 M) in a pH range of 5.5−8.5. This suggests that at high NaCl concentrations,
Na+ and/or Cl
– ions bind with TLN and affect the binding of ANS with TLN. Our results
also suggest that the activation and stabilization of TLN by NaCl are partially brought
about by the binding of Na+ and/or Cl
– ions with TLN.
58
References
1. Hase, C.C. and Finkeelstein, R.A. (1993) Bacterial extracellular zinc-containing
metalloproteases. Microbiol. Rev. 57, 823-837
2. Woessner, J.F. Jr (1991) Matrix metalloproteinases and their inhibitors in
connective tissue remodelling. FASEB J. 5, 2145-2154
3. Nagase, H. and Woessner, J.F. Jr (1999) Matrix metalloproteinases. J. Biol. Chem.
274, 21491-21494
4. Weiner, D.B. and Williams, V.W. (1993) Biologically active peptides: design,
synthesis and utilization. CRC. Press LLC, Florida, USA
5. Woessner, J.F. Jr and Taplin, C.J. (1988) Purification and properties of a small latent
matrix metalloproteinase of the rat uterus. J. Biol. Chem. 263, 16918-16925
6. Browner, M.F., Smith, W.W., and Castelhano, A.L. (1995) Matrilysin-inhibitor
complexes: common themes among metalloproteases. Biochemistry 34, 6602-6610
7. Pajouh, M.S., Nagle, R.B., Brethnach, R., Finch, J.S., Brawer, M.K., and Bowden,
G.T. (1991) Expression of metalloproteinase genes in human prostate cancer. J.
Cancer Res. Clin. Oncol. 117, 114-150
8. Yoshimoto, M., Itoh, F., Yamamoto, H., Hinoda, Y., Imai, K., and Yachi, A. (1993)
Expression of MMP-7 (PUMP-1) mRNA in human colorectal cancers. Int. J.
Cancer 54, 614-618
9. Nakano, A., Tani, E., Miyazaki, K., Yamamoto, Y., and Furuyama, J. (1995) Matrix
metalloproteinases and tissue inhibitors of metalloproteinases in human gliomas. J.
Neurosurg. 83, 298-307
10. Adachii, Y., Itoh, F., Yamamoto, H., Matsuno, K., Arimura, Y., Kusano, M., Endo,
T., Hinoda, Y., Oohara, M., Hosokawa, M., and Imai, K. (1998) Matrix
metalloproteinase matrilysin (MMP-7) participates in the progression of gastric and
esophageal cancers. Int. J. Oncol. 13, 1031-1035
11. Muller, D., Breathnach, R., Engelmann, A., Millon, R., Bronner, G., Flesch, H.,
59
Dumont, P., Eber, M., and Abecassis, J. (1991) Expression of collagenase-related
metalloproteinase genes in human lung or head and neck tumors. Int. J. Cancer 48,
550-556
12. Heppner, K.J., Matrisian, L.M., Jensen, R.A., and Rodgers, W.H. (1996)
Expression of most matrix metalloproteinase family members in breast cancer
represents a tumor-induced host response. Am. J. Pathol. 149, 273-282
13. Yu, W.-H. and Woessner, J.F. Jr (2000) Heparan sulfate proteoglycans as
extracellular docking molecules for matrilysin (matrix metalloproteinase 7). J. Biol.
Chem. 275, 4183-4191
14. Yamamoto, K., Higashi, S., Kioi, M., Tsunezumi, J., Honke, K., and Miyazaki, K.
(2006) Binding of active matrilysin to cell surface cholesterol sulfate is essential for
its membrane-associated proteolytic action and induction of homotypic cell
adhesion. J. Biol. Chem. 281, 9170-9180
15. Higashi, S., Oeda, M., Yamamoto, K., and Miyazaki, K. (2008) Identification of
amino acid residues of matrix metalloproteinase 7 essential for binding to
cholesterol sulfate. J. Biol. Chem. 283, 35735-35744
16. Yamamoto, K., Miyazaki, K., and Higashi, S. (2010) Cholesterol sulfate alters
substrate preference of matrix metalloproteinase-7 and promotes degradations of
pericellular laminin-332 and fibronectin. J. Biol. Chem. 285, 28862-28873
17. Lynch, C.C., Vargo-Gogola, T., Martin, M.D., Fingleton, B., Crawford, H.C., and
Matrisian, L.M. (2007) Matrix metalloproteinase 7 mediates mammary epithelial
cell tumorigenesis through the ErbB4 receptor. Cancer Res. 57
18. 6760-6767
19. Ra, H.J., Harju-Baker, S., Zhang, F., Linhardt, R.J., Wilson, C.L., and Parks, W.C.
(2009) Control of promatrilysin (MMP-7) activation and substrate-specific activity
by sulfated glycosaminglycans. J. Biochem. 41, 27924-27932
20. Bergers, G. and Coussens, L.M. (2000) Extrinsic regulators of epithelial tumor
progression: Metalloproteeinases. Curr. Opin. Genet. Dev. 10, 120-127
21. Muta, Y., Yasui, N., Matsumiya, Y., Kubo, M., and Inouye, K. (2010) Expression in
60
Escherichia coli, refolding, and purification of the recombinant mature form of
human matrix metalloproteinase 7 (MMP-7). Biosci. Biotechnol. Biochem. 74,
2515-2517
22. Hawe, A., Sutter, M., and Jiskoot, W. (2007) Extrinsic fluorescent dyes as tools for
protein characterization. Pharm. Res. 25, 1487-1499
23. Strier, L. (1965) The interaction of a naphthalene dye with apomyoglobin and
apohemoglobin. A fluorescent probe of non-polar binding sites. J. Mol. Biol. 13,
482-495
24. Slavik, J. (1982) Anilinonapthalene sulfonate as a probe of membrane composition
and function. Biochim. Biophys. Acta 694, 1-25
25. Goto, Y. and Fink, A.L. (1989) Conformational States of β-Lactamase:
Molten-globule states at acidic and alkaline pH with high salt. Biochemistry 28,
945-952
26. Gasymov, O.K., Abduragimov, A.R., and Glasgow, B.J (2007) Molten globule state
of tear lipocalm: ANS binding restores tertiary interactions. Biochem. Biophys. Res.
Commun. 2, 499-504
27. Van Eijk, J.H., Verheij, H. M., and De Haas, G.H. (1984) Interaction of native and
modified Naja melanoleuca phospholipases A2 with the fluorescent
8-anilinonaphtalene-1-sulfonate. Eur. J. Biochem. 140, 407-413
28. Zhang, J.G., Matthews, J.M., Ward, L.D., and Simpson, R.J. (1997) Disruption of
disulfide bonds of recombinant murine interleukin-6 induces formation of a
partially unfolded state. Biochemistry 36, 2380-2389
29. Kollmann-Koch, A. and Eggerer, H. (1989) Ligand-induced conformational
changes of citrate synthase studied with the fluorescent probe 8-anilinonaphtalene
1-sulfonate. Eur. J. Biochem. 185, 441-447
30. Ernst, S., Susanne, E., Karolin, L., Wolfgang, Ka., and Nikolaus, A. (2000).
Structural basis for the interaction of the fluorescence probe
8-anilino-1-naphthalene sulfonate (ANS) with the antibiotic target MurA. Proc.
Natl. Acad. Sci. U.S.A. 97, 6345-6349
61
31. Cardamone, M. and Puri, N.K. (1992) Spectrofluorimetric assessment of the
surface hydrophobicity of proteins. Biochem. J. 2, 589-593
32. Groves, M.R., Müller, I.B., Kreplin, X., and Müller-Dieckmann, J. (2007) A
method for the general identification of protein crystals in crystallization
experiments using a noncovalent fluorescent dye. Acta. Crystallogr. D. Biol.
Crystallogr. 63, 526-535
33. Lindgren, M., Sörgjerd, K., and Hammarström, P. (2005) Detection and
characterization of aggregates, prefibrillar amyloidogenic oligomers, and
protofibrils using fluorescence spectroscopy. Biophys. J. 88, 4200-4212
34. Vetri, V., Canale, C., Relini, A., Librizzi, F., Militello,V., Gliozzi, A., and Leone, M.,
(2007) Amyloid fibrils formation and amorphous aggregation in concanavalin A.
Biophys. Chem. 125, 184-190
35. Endo, S. (1962) Study on protease by thermophilic bacteria. J. Ferment. Technol.
40, 346-353
36. Matsubara, H. and Feder, H. (1971) Other bacteria mold and yeast protease.
Academic. Press. N.Y. 3, 721-795
37. Titani, K., Hermodson, M.A., Ericsson, L.H., Walsh, K.A., and Neurath, H. (1972)
Amino-acid sequence of thermolysin. Nature 238, 35-37
38. Latt, S.A. and Vallee, B.L. (1969) Thermolysin a zinc metalloenzyme. Biochem.
Biophys. Res. Commun. 37, 333-339
39. Feder, J., Garrett, L.R., and Wildi, B.S. (1971) Studies on the role of calcium in
thermolysin. Biochem. 10, 4552-4555
40. Tajima, M., Urabe, I., Yutani, K., and Okada, H. (1976) Role of calcium ions in
the thermostability of thermolysin and Bacillus subtilis var. amylosacchariticus
neutral protease. Eur. J. Biochem. 64, 243-247
41. Holmes, M.A and Matthews, B.W. J. (1982) Structure of thermolysin refined at 1.6
Å resolution. Mol. Biol. 160, 623-639
42. Hangauer, D.G., Monzingo, A.F., and Matthews, B.W. (1984) An interactive
computer graphics study of thermolysin-catalyzed peptide cleavage and inhibition
62
by N-carboxymethyl dipeptides. Biochemistry 23, 5730-5741
43. Jaeseung, K., Scott, McN., and Sieburth, A. (2002 ) Silanediol-based inhibitor of
thermolysin. Bioorg. Med. Chem. Lett. 12, 3625-3627
44. Jaeseung, K., Scott, McN., and Sieburth, A. (2004) Silanediol inhibitor of the
metalloprotease thermolysin: synthesis and comparison with a phosphinic acid
inhibitor 1. J. Org. Chem.69, 3008-3014
45. Benchertrit, T., Fournie, Z., and Roques, B.P. (1987) Relationship between the
inhibitory potencies of thiorphan and retrothiorphan enantiomers on thermolysin
and neutral endopeptidase 24.11 and their interactions with the thermolysin active
site by computer modelling. Biochem. Biophys. Res. Commun. 3, 1034-1040
46. Oneda, H. and Inouye, K. (2001) Interactions of human matrix metalloproteinase 7
(matrilysin) with the inhibitors thiorphan and R-941381. J. Biochem. 129, 429-435
47. Inouye, K., Lee S.-B., and Tonomura, B. (1996) Effect of amino acid residues at the
cleavable site of substrates on the remarkable activation of thermolysin by salts.
Biochem. J. 315, 133-138
48. Inouye, K., Lee, S.-B., Nambu, K., and Tonomura, B. (1997) Effects of pH,
temperature, and alcohols on the remarkable activation of thermolysin by salts. J.
Biochem. 122, 358-364
49. Oneda, H. and Inouye, K. (2000) Effects of dimethyl sulfoxide, temperature, and
sodium chloride on the activity of human matrix metalloproteinase 7 (matrilysin). J.
Biochem. 128, 785-791
50. Kunugi, S., Hirohara, H., and Ise, N. (1982) pH and temperature dependences of
thermolysin catalysis. J. Biochem. 124, 157-163
51. Inouye, K., Lee, S.-B., Nambu, K., and Tonomura, B. (1997) Effects of pH,
temperature, and alcohols on remarkable activation of thermolysin by salts. J.
Biochem. 122, 358-364
52. Kusano, M., Yasukawa, K., Hashida, Y., and Inouye, K. (2006) Engineering of the
pH-dependence of thermolysin activity as examined by site-directed mutagenesis
of Asn112 located at the active site of thermolysin. J. Biochem. 139, 1017-1023
63
53. Muta, Y. and Inouye, K. (2011) Tyr219 of human matrix metalloproteinase 7
(MMP-7) is not critical for catalytic activity, but is involved in the broad
pH-dependence of the activity. J. Biochem. 150, 183-188
54. Muta, Y., Oneda, H., and Inouye, K. (2005) Anomalous pH-dependence of the
activity of human matrilysin (matrix metalloproteinase-7) as revealed by nitration
and amination of its tyrosine residues. Biochem. J. 386, 263-270
55. Knight, C.G., Willenbrock, F., and Murphy, G. (1992) A novel coumarin-labelled
peptide for sensitive continuous assays of the matrix metalloproteinases. FEBS Lett.
296, 263-266
56. Khurana, R. and Udgaonkar, J.B. (1994) Equilibrium unfolding studies of barstar:
evidence for an alternative conformation which resembles a molten globule.
Biochemistry 33, 106-115
57. Haq, S.K., Rasheedi, S., and Khan, R.H. (2002) Characterization of a partially
folded intermediate of stem bromelain at low pH. Eur. J. Biochem. 269, 47-52
58. Oneda, H. and Inouye, K. (1999) Refolding and recovery of recombinant human
matrix metalloproteinase 7 (matrilysin) from inclusion bodies expressed by
Escherichia coli. J. Biochem. 126, 905-911
59. Muta, Y., Yasui, N., Matsumiya, Y., Kubo, M., and Inouye, K. (2010) Expression in
Escherichia coli, refolding, and purification of the recombinant mature form of
human matrix metalloproteinase 7 (MMP-7). Biosci. Biotechnol. Biochem. 74,
2515-2517
60. Muta, Y., Oyama, S., Umezawa, T., Shimada, M., and Inouye, K. (2004) Inhibitory
effects of lignans on the activity of human matrix metalloproteinase 7 (matrilysin).
J. Agric. Food Chem. 52, 5888-5894
61. Takeharu, H., Yasukawa, K., and Inouye, K. (2011) Thermodynamic analysis of
ionizable groups involved in the catalytic mechanism of human matrix
metalloproteinase 7 (MMP-7). Biochim. Biophys. Acta 1814, 1940-1946
62. Chen, Y.H., Yang, J.T., and Chau, K.H. (1974) Determination of the helix and
form of proteins in aqueous solution by circular dichroism. Biochemistry 13,
64
3350-3359
63. Muta, Y., Oneda, H., and Inouye, K. (2004) Inhibitory effects of alcohols on the
activity of human matrix metalloproteinase 7 (matrilysin). Biosci. Biotechnol.
Biochem. 68, 2649-2652
64. Oneda, H., Shiihara, M., and Inouye, K. (2003) Inhibitory effects of green tea
catechins on the activity of human matrix metalloproteinase 7 (matrilysin). J.
Biochem. 133, 571-576
65. Miyake, T., Yasukawa, K., and Inouye, K. (2011) Analysis of the mechanism of
inhibition of human matrix metalloproteinase 7 (MMP-7) activity by green tea
catechins. Biosci. Biotechnol. Biochem. 75, 1564-1569
66. Gasymov, O.K. and Glasgow, B.J. (2007) ANS fluorescence: potential to augment
the identification of the external binding sites of proteins. Biochim. Biophys. Acta
1774, 403-411
67. Andujar-Sanchez, M., Martinez-Rodriguez, S., Heras-Vazquez, F.J.,
Clemente-Jimenex, J.M., Rodriquez-Vico, F., and Jara-Perez, V. (2006) Binding
studies of hydantoin racemase from Sinorhizobium meliloti by calorimetric and
fluorescence analysis. Biochim. Biophys. Acta 1764, 292-298
68. Ganguly, B., Banerjee, J., Elegbede, A.I., Klocke, D.J., Mallik, S., and Srivastava,
D.K. (2007) Intrinsic selectivity in binding of matrix metalloproteinase-7 to
differently charged lipid membranes. FEBS Lett. 581, 5723-5726
69. Tang, H.M. and Yu, H. (2005) Intermediate studies on refolding of arginine kinase
denatured by guanidine hydrochloride. Biochem. Cell Biol. 83, 109-114
70. Gambetti, S., Dondi, A., Cervellati, C., Squerzanti, M., Pansini, F.S., and Bergamini,
C.M. (2005) Interaction with heparin protects tissue transglutaminase against
inactivation by heating and by proteolysis. Biochimie 87, 551−555
71. O’Farrell, F., Loog, M., Janson, I.M., and Ek P. (1999) Kinetic study of the
inhibition of CK2 by heparin fragments of different length. Biochim. Biophys. Acta
1433, 68-75
72. Thi, H., Sunge-Hye. K., Caitlin, G.D., Darice, Y.W., Joseph, A.L., and Heather, D.,
65
(2013) A heparin mimicking polymer conjugate stabilizes basic fibroblast growth
factor (bFGF). Nat. Chem. 5, 221-227
73. Bugs, M.R., Bortoleto-Bugs, R.K., and Cornelio, M.L. (2005) The interaction
between heparin and Lys49 phospholipase A2 reveals the natural binding of heparin
on the enzyme. Int. J. Biol. Macromol. 37, 21-27
74. Golabek, A.A., Walus, M., Wisniewski, K.E., and Kida, E. (2005)
Glycosaminoglycans modulate activation, activity, and stability of
tripeptidyl-peptidase I in vitro and in vivo. J. Biol. Chem. 280, 7550-7561
75. Bágel’ová, J., Antalík, M., and Bona, M. (1994). Studies on cytochrome c-heparin
interactions by differential scanning calorimetry. Biochem. J. 297, 99-101
76. Iwamori, S., Suzuki, H., Kimura, T., and Iwamori, Y. (2000) Shedding of sulfated
lipids into gastric fluid and inhibition of pancreatic DNase I by cholesterol sulfate
in concert with bile acids. Biochim. Biophys. Acta 1487, 268-274
77. Nakae. H., Hiroi, H., Momoeda, M., Koizumi, M., Iwamori, M., and Taketani, Y.
(2010) Inhibition of cell invasion and protease activity by cholesterol sulfate. Fertil.
Steril. 94, 2455-2457
78. Morishima, A., Yasukawa, K., and Inouye, K. (2012) A possibility of a
protein-bound water molecule as the ionizable group responsible for pKe at the
alkaline side in human matrix metalloproteinase 7 activity. J. Biochem. 151,
501-509
79. Kallen, J., Schlaeppi, J.M., Bitsch, F., Delhon, I., and Fournier, B. (2004) Crystal
structure of the human RORα ligand binding domain in complex with cholesterol
sulfate at 2.2 Å. J. Biol. Chem. 14, 14033-14038
80. Menach, E., Yasukawa, K., and Inouye, K. (2013) Effects of site directed
mutagenesis of the loop residue of the N-terminal domain of Gly117 of thermolysin
on its catalytic activity. Biosci. Biotechnol. Biochem. 77, 741-746
81. Zhang, Y. and Cremer, P.S. (2010) Chemistry of Hofmeister anions and osmolytes.
Ann. Rev. Phys. Chem. 61, 63-83
82. Inouye, K. (1992) Effects of salts on thermolysin: activation of hydrolysis and
66
synthesis of N-carbobenzoxy-L-aspartyl-L-phenylalanine methyl ester, and a unique
change in the absorption spectrum of thermolysin. J. Biochem. 112, 335-340
83. Collins, K.D. (1997) Charge density-dependent strength of hydration and biological
structure. Biophys. J. 72, 65-76
84. Wondrak, E.M., Louis J.M., and Oroszlan, S. (1991) The effect of salt on the
Michaelis Menten constant of the HIV-1 protease correlates with the Hofmeister
series. FEBS Lett. 280, 344-346
85. Szeltner, Z. and Polgár, L. (1996) Rate-determining Steps in HIV-1 Protease
Catalysis. J. Biol. Chem. 271, 5458-5463
86. Porter, D.J.T., Hanlon, M.H., Carter, L.H., III, Danger, D.P., and Furfine, E.S.
(2001) Effectors of protease peptidolytic activity. Biochemistry 40, 11131-11139
87. Vrbka, L., Vondráśek, J., Jagoda-Cwiklik, B., Vácha R., and Jungwirth, P. (2006)
Conformational stability and catalytic activity of HIV-1 protease are both enhanced
at high salt concentration. Proc. Natl. Acad. Sci. U.S.A. 103, 15440-15444
88. Heyda, J., Pokorná, J., Vrbka, L., Vácha, R., Jagoda-Cwiklik, B., Konvalinka, J.,
Jungwirth, P., and Vondráśek, J. (2009) Ion specific effects of sodium and
potassium on the catalytic activity of HIV-1 protease, Phys. Chem. Chem. Phys. 11,
7599-7604
89. Pokorná, J., Heyda, J., and Konvalinka, J. (2013) Ion specific effects of alkali
cations on the catalytic activity of HIV-1 protease. Faraday Discuss. 160, 359-370

67
Acknowledgements
This study was carried out in the laboratory of Enzyme Chemistry, Division of Food
Science and Biotechnology, Graduate School of Agriculture.
I would wholeheartedly like to thank Dr. Kuniyo Inouye, Professor Emeritus, Graduate
School of Agriculture, Kyoto University, for granting me the privilege to learn, train and
conduct research in his laboratory and for his invaluable advice and guidance.
My heartfelt thanks go to my academic advisor Dr. Kiyoshi Yasukawa, Professor,
Graduate School of Agriculture, Kyoto University, Dr. Teisuke Takita and Dr. Kenji
Kojima, Assistant Professors at Kyoto University, for their unconditional support,
mentorship, and academic guidance throughout my research
I would also like to thank all my other laboratory members particularly Dr. Evans
Menach, Dr. Tadessa Bedada, and Aiko Morishima for their academic assistance.
I am forever extremely grateful to the Japanese government (Monbukagaku-sho) for
granting me a scholarship to study in Japan.
Last but not least I would like to thank my family and friends for their mental, physical
and spiritual support.
March 2015
Vimbai Netsai Charity Samukange
68
List of Publications
Original papers
1. Samukange, V., Yasukawa, K., and Inouye, K. (2012) Interaction of
8-anilinonaphtalene 1-sulphonate (ANS) and human matrix metalloproteinase 7
(MMP-7) as examined by MMP-7 activity and ANS fluorescence. J. Biochem. 151,
533–540
2. Samukange, V., Yasukawa, K., and Inouye, K. (2014) Effects of heparin and
cholesterol sulfate on the activity and stability of human matrix metalloproteinase 7.
Biosci. Biotechnol. Biochem. 78, 41–48
3. Samukange, V., Kamo, M., Yasukawa, K., and Inouye, K. (2014) Effects of salts on
the interaction of 8-anilinonaphthalene 1-sulphonate (ANS) and thermolysin.
Biosci. Biotechnol. Biochem. 78, 1522–1528