![사회기반 d설 공격 동향 분 보고 ðdownload.ahnlab.com/kr/site/library/[Analysis Report]Critical Infrastructure Threats.pdf · 부 스마트tv, 스마트카에 변조된](https://static.fdocument.pub/doc/165x107/5d677b1d88c993d4378b7cb6/-d-d-analysis-reportcritical-infrastructure.jpg)
BIG DATA ANALYTICS FOR CRITICAL INFRASTRUCTURE … · Big Data Analytics for Critical...
129
Scuola Politecnica e delle Scienze di Base Corso di Laurea Magistrale in Ingegneria Informatica Tesi di Laurea Magistrale in Programmazione II BIG DATA ANALYTICS FOR CRITICAL INFRASTRUCTURE MONITORING Anno Accademico 2013/2014 relatore Ch.mo prof. Marcello Cinque correlatore Ing. Agostino Savignano candidato Daniele Esposito matr. M63/000183
Transcript of BIG DATA ANALYTICS FOR CRITICAL INFRASTRUCTURE … · Big Data Analytics for Critical...
Scuola Politecnica e delle Scienze di Base Corso di Laurea Magistrale in Ingegneria Informatica
Tesi di Laurea Magistrale in Programmazione II
BIG DATA ANALYTICS FOR CRITICAL INFRASTRUCTURE MONITORING
Anno Accademico 2013/2014 relatore Ch.mo prof. Marcello Cinque correlatore Ing. Agostino Savignano candidato Daniele Esposito matr. M63/000183

A chi ha sempre creduto in me

“Torture the data, and it will confess to anything.”
Ronald Coase, Economics, Nobel Prize Laureate
“Without big data, you are blind and deaf and in the middle of a freeway.”
Geoffrey Moore, author and consultant
“In God we trust. All others must bring data.”
W. Edwards Deming, statistician, professor, author, lecturer, and consultant
“It is a capital mistake to theorize before one has data.”
Sherlock Holmes, “A Study in Scarlett” (Arthur Conan Doyle)
“With data collection, ‘the sooner the better’ is always the best answer.”
Marissa Mayer, Yahoo! CEO
“I have travelled the length and breadth of this country and talked with the best people, and I can assure you
that data processing is a fad that won’t last out the year.”
Editor in charge of business books for Prentice Hall, 1957
“Anything that is measured and watched improves.”
Bob Parsons, American entrepreneur
Contents
Introduction 1
1 Big Data for Critical Infrastructure Protection 4
1.1 Critical Infrastructures . . . . . . . . . . . . . . . . . . . . . . . 4
1.1.1 Definitions . . . . . . . . . . . . . . . . . . . . . . . . . 6
1.1.2 Cyber Attacks Against Critical Infrastructures . . . . . . . 7
1.1.2.1 Examples of Known Attacks Against Critical Sys-
tems . . . . . . . . . . . . . . . . . . . . . . . 10
1.2 Big Data . . . . . . . . . . . . . . . . . . . . . . . . . . . . . . . 15
1.2.1 Definition . . . . . . . . . . . . . . . . . . . . . . . . . . 16
1.2.2 Big Data Analytics . . . . . . . . . . . . . . . . . . . . . 17
1.3 Security Analytics . . . . . . . . . . . . . . . . . . . . . . . . . . 19
ii
2 Analysis of Monitoring Tools 22
2.1 Introduction . . . . . . . . . . . . . . . . . . . . . . . . . . . . . 22
2.2 RAMS and DCACAS . . . . . . . . . . . . . . . . . . . . . . . . 23
2.3 Taxonomy . . . . . . . . . . . . . . . . . . . . . . . . . . . . . . 25
2.3.1 Real-Time Systems Monitoring . . . . . . . . . . . . . . 28
2.3.2 Distributed Systems Monitoring . . . . . . . . . . . . . . 29
2.4 Monitoring tools . . . . . . . . . . . . . . . . . . . . . . . . . . 32
2.4.1 RRDtool . . . . . . . . . . . . . . . . . . . . . . . . . . 32
2.4.2 Ganglia . . . . . . . . . . . . . . . . . . . . . . . . . . . 34
2.4.2.1 Ganglia Monitoring Daemon (gmond) . . . . . 35
2.4.2.2 Ganglia Meta Daemon (gmetad) . . . . . . . . 36
2.4.2.3 Ganglia PHP Web Front-end . . . . . . . . . . 36
2.4.3 Nagios . . . . . . . . . . . . . . . . . . . . . . . . . . . 37
2.4.4 Cacti . . . . . . . . . . . . . . . . . . . . . . . . . . . . 38
2.4.5 Chukwa . . . . . . . . . . . . . . . . . . . . . . . . . . . 39
2.4.6 Comparison . . . . . . . . . . . . . . . . . . . . . . . . . 41
2.4.7 Rule Based Logging and LogBus . . . . . . . . . . . . . 41
iii
3 Big Data Analytics 44
3.1 Introduction . . . . . . . . . . . . . . . . . . . . . . . . . . . . . 44
3.2 MapReduce . . . . . . . . . . . . . . . . . . . . . . . . . . . . . 46
3.2.1 Apache Hadoop . . . . . . . . . . . . . . . . . . . . . . . 48
3.2.1.1 Hadoop Architecture . . . . . . . . . . . . . . 49
3.2.1.2 Hadoop Distributed File System (HDFS) . . . . 51
3.2.1.3 The MapReduce engine . . . . . . . . . . . . . 51
3.2.1.4 Example . . . . . . . . . . . . . . . . . . . . . 52
3.3 Apache Storm . . . . . . . . . . . . . . . . . . . . . . . . . . . . 53
3.3.1 Components of a Storm cluster . . . . . . . . . . . . . . 55
3.3.1.1 Spouts and Bolts . . . . . . . . . . . . . . . . . 57
3.3.2 Parallelism in Storm . . . . . . . . . . . . . . . . . . . . 59
3.3.3 Example . . . . . . . . . . . . . . . . . . . . . . . . . . 60
3.4 Apache S4 . . . . . . . . . . . . . . . . . . . . . . . . . . . . . . 61
3.4.1 Components of a S4 cluster . . . . . . . . . . . . . . . . 62
3.4.2 Parallelism in S4 . . . . . . . . . . . . . . . . . . . . . . 63
iv
4 Design and Development of Security Monitoring Tools 64
4.1 Security Monitoring and Control . . . . . . . . . . . . . . . . . . 64
4.2 Requirements . . . . . . . . . . . . . . . . . . . . . . . . . . . . 66
4.3 Design . . . . . . . . . . . . . . . . . . . . . . . . . . . . . . . . 67
4.3.1 Bayesian Inference . . . . . . . . . . . . . . . . . . . . . 68
4.3.2 Statistical Correlation Analysis . . . . . . . . . . . . . . . 71
4.4 Case Study 1: the NCSA Monitoring Tools . . . . . . . . . . . . 72
4.4.1 Implemented Solution on Apache Hadoop . . . . . . . . . 76
4.4.2 Implemented Solution on Apache Storm . . . . . . . . . . 79
4.4.3 Implemented Solution on Apache S4 . . . . . . . . . . . 82
4.4.4 Comparison and remarks . . . . . . . . . . . . . . . . . . 84
4.5 Case Study 2: Statistical Analysis of the MEF Data . . . . . . . . 86
5 Experimental Results 95
5.1 Bayesian Inference Tool . . . . . . . . . . . . . . . . . . . . . . 96
5.1.1 Experiments Design . . . . . . . . . . . . . . . . . . . . 96
5.1.1.1 Configuration Parameters for Hadoop . . . . . . 98
5.1.1.2 Configuration Parameters for Storm . . . . . . . 98
v

5.1.2 Cluster Setup . . . . . . . . . . . . . . . . . . . . . . . . 99
5.1.3 Experimental Results . . . . . . . . . . . . . . . . . . . . 101
5.1.3.1 Hadoop . . . . . . . . . . . . . . . . . . . . . 101
5.1.3.2 Storm . . . . . . . . . . . . . . . . . . . . . . 103
5.1.4 Comparison and Remarks . . . . . . . . . . . . . . . . . 104
5.2 RStorm Statistical Analysis Tool . . . . . . . . . . . . . . . . . . 105
5.2.1 Cluster Setup . . . . . . . . . . . . . . . . . . . . . . . . 105
5.2.2 Experiments Design . . . . . . . . . . . . . . . . . . . . 106
5.2.3 Experimental Results . . . . . . . . . . . . . . . . . . . . 107
6 Conclusions and Future Work 109
vi
List of Figures
1.1 President’s Commission on Critical Infrastructure Protection logo 5
1.2 Nuclear plants are an example of critical infrastructure that must
be protected. . . . . . . . . . . . . . . . . . . . . . . . . . . . . . 7
1.3 The Blue Waters supercomputing infrastructure . . . . . . . . . . 8
1.4 An example of the interface of a SCADA system. . . . . . . . . . 11
1.5 A representation of Stuxnet’s state flow. . . . . . . . . . . . . . . 12
1.6 Saudi Aramco’s logo . . . . . . . . . . . . . . . . . . . . . . . . 14
1.7 Social media connections among Twitter users is an example of
Big Data. Taken from www.connectedaction.net. . . . . . . . . . 16
2.1 An example of a monitoring tool’s interface. . . . . . . . . . . . . 26
2.2 Screenshot of the RRDTool interface . . . . . . . . . . . . . . . . 33
2.3 A screenshot of Ganglia’s interface. . . . . . . . . . . . . . . . . 34
vii
2.4 Screenshot of Nagios’ interface. . . . . . . . . . . . . . . . . . . 37
2.5 Screenshot of Cacti’s interface . . . . . . . . . . . . . . . . . . . 38
2.6 Screenshot of Chukwa’s interface. . . . . . . . . . . . . . . . . . 39
2.7 Rule based logging example . . . . . . . . . . . . . . . . . . . . 42
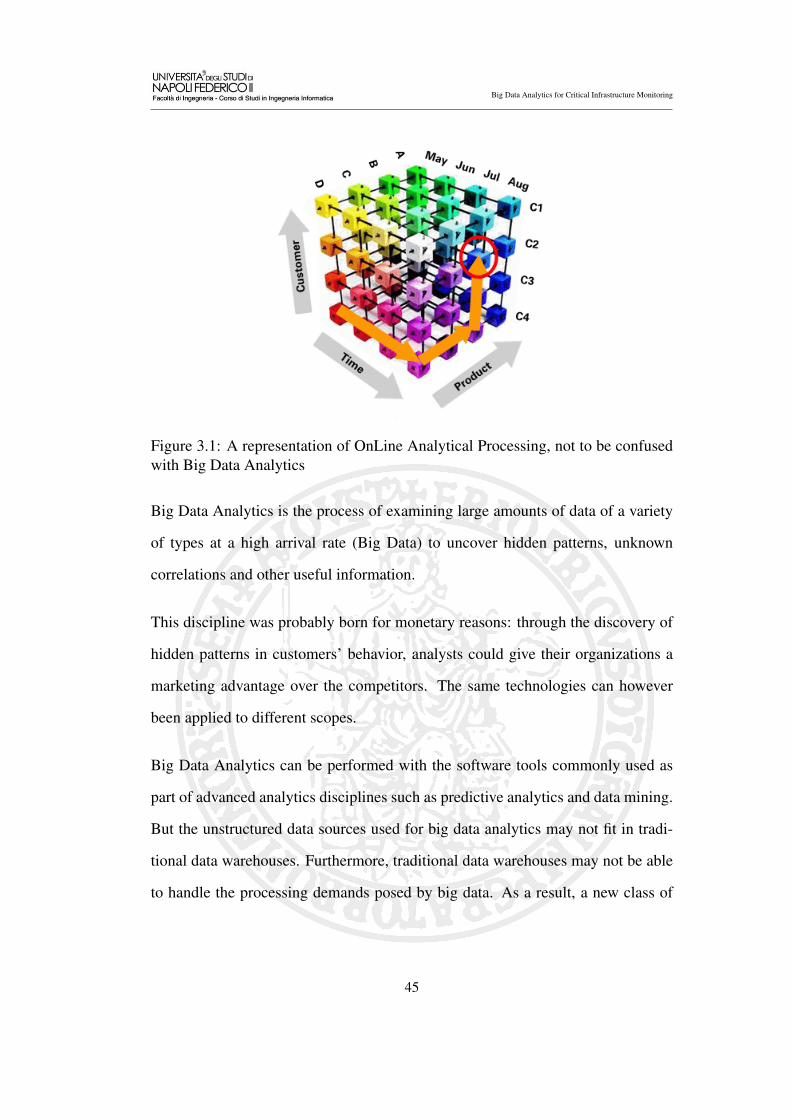
3.1 A representation of OnLine Analytical Processing, not to be con-
fused with Big Data Analytics . . . . . . . . . . . . . . . . . . . 45
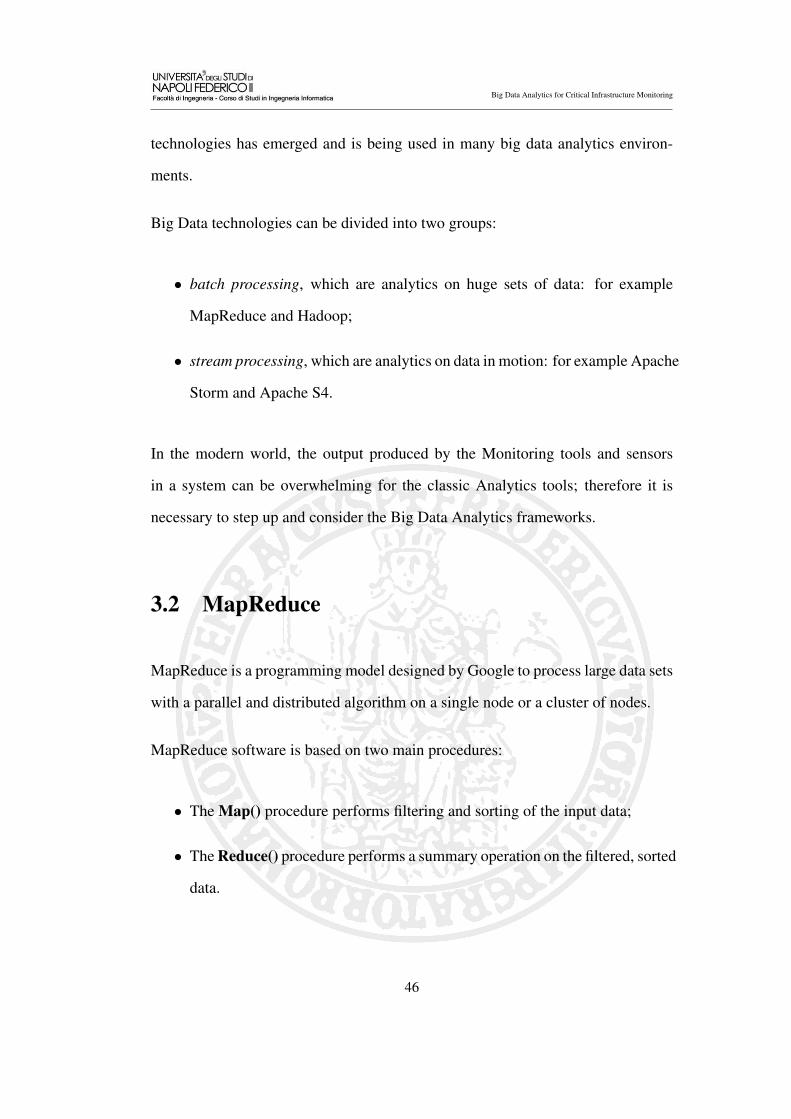
3.2 A representation of the MapReduce paradigm. . . . . . . . . . . . 47
3.3 Apache Hadoop logo . . . . . . . . . . . . . . . . . . . . . . . . 48
3.4 A representation of Hadoop applications and HDFS . . . . . . . . 49
3.5 Apache Storm logo . . . . . . . . . . . . . . . . . . . . . . . . . 53
3.6 Storm spouts can have multiple outputs, and bolts can have multi-
ple inputs and multiple outputs. . . . . . . . . . . . . . . . . . . . 58
3.7 Apache S4 logo . . . . . . . . . . . . . . . . . . . . . . . . . . . 61
4.1 Simplified architecture of the Security Monitoring and Control de-
scribed in the NAPOLI FUTURA project. . . . . . . . . . . . . . 68
4.2 The Bayesian network used in [2]. . . . . . . . . . . . . . . . . . 70
4.3 Statistical correlation of N input streams using Big Data Analytics
Frameworks and an external analytics language. . . . . . . . . . . 72
viii
4.4 Structure of the conditional probability table as described in [2] . . 76
4.5 Visual representation of the control flow of the Hadoop implemen-
tation of the Bayesian algorithm. . . . . . . . . . . . . . . . . . . 78
4.6 Visual representation of the control flow of the Storm implementa-
tion of the Bayesian algorithm. . . . . . . . . . . . . . . . . . . . 81
4.7 Visual representation of the control flow of the S4 implementation
of the Bayesian algorithm. . . . . . . . . . . . . . . . . . . . . . 83
4.8 Correlation found in [21] between the network traffic and the mea-
sured active power in the PDU. . . . . . . . . . . . . . . . . . . . 88
4.9 Extremely high spike in the variance of packets transmitted in the
MEF data. This is a logarithmic scale. . . . . . . . . . . . . . . . 89
4.10 Control flow of the RStorm tool. . . . . . . . . . . . . . . . . . . 90
4.11 The R Logo and the RCaller website header. . . . . . . . . . . . . 91
5.1 Computed Speed Up for the Hadoop Cluster . . . . . . . . . . . . 102
5.2 Computed Efficiency for the Hadoop Cluster . . . . . . . . . . . . 102
5.3 Computed Speed Up for the Storm Cluster . . . . . . . . . . . . . 103
5.4 Computed efficiency for the Storm Cluster . . . . . . . . . . . . . 104
ix

Introduction
Critical infrastructures like public health facilities, water and energy distribution,
telecommunications and big data centers are at the core of modern society: their
failure would cause catastrophic consequences. During the last twenty years, the
necessity to protect critical systems has been growing ceaselessly, along with the
fear of terrorist threats and cyber attacks.
Large scale data centers can be considered key factors in the protection of such
systems: thanks to them, it is possible to continuously monitor the critical infras-
tructures, keep track of their state, recognize unusual behaviors and detect attacks.
In some cases, the data centers are the actual critical infrastructure to monitor and
protect; for example, data centers belonging to banks, cloud computing providers
or corporations which handle sensible data and therefore can not tolerate failures
or intrusions.
These data centers are large, high-performance computing infrastructures, to which
users log in through the Internet or internal networks, using their private creden-
tials like username and password. Even when using well-known, secure and es-
tabilished authentication protocols such as SSH, credentials can be stolen using
1
Big Data Analytics for Critical Infrastructure Monitoring
spyware, keyloggers or even through social engineering. In this way, malicious
users can log into the system, being recognized as regular, authorized users: they
can thus damage or steal from the real user, infiltrate the system, download mali-
cious software or generally violate the users’ privacy [2].
The analysis of both the system logs and the outputs from security-monitoring
tools can often lead to the identification of credential compromise, denial of service
attacks or unforeseen behavioral patterns; however, this analysis is mainly executed
offline (i.e. after the attack, when the logs are collected) so far.
At the same time, the amount of data which has to be analyzed in order to quickly
identify attacks, identity theft or credential compromise is rapidly increasing: the
stored data is ceaselessly increasing and the input rates are growing at the same
time. Current batch processing technologies are not always able to deal with this
ever-increasing amount of data and an offline analysis is by definition late, thus new
online approaches are starting to be developed. In particular, Big Data Analytics
techniques and frameworks will be used in this context to analyze such data and an
existing statistical analytics tool will be used in a new context.
The purpose of this thesis is the development and testing of applications for the
online analysis of critical systems logs using Big Data Analytics tools. These appli-
cations can identify credential compromise events, attacks or correlation between
different measurements in the shortest possible time (ideally, in real time). This
thesis is organized as follows.
Chapter 1 gives an introduction on critical systems vulnerabilities and Big Data, to
assess and pinpoint the issues and the challenges arising from the above-mentioned
2

Big Data Analytics for Critical Infrastructure Monitoring
demand.
Chapter 2 presents a study on the state of the art of monitoring tools and techniques.
Chapter 3 contains an in-depth description of existing Big Data Analytics frame-
works, to define the tools and platforms that can be used in order to solve these
challenges.
Chapter 4 describes the design and the implementation of two different tools. The
first, designed on three different Big Data Analytics frameworks, is a security tool
which uses Bayesian inference to correlate different input streams and detect in-
trusions in a critical infrastructure; the second, designed on the best framework for
Big Data stream processing, is a monitoring tool that uses statistical correlation
through an external scripting language to detect unusual behavior in a real critical
system.
Chapter 5 shows the performance measurements of the implemented tools, com-
paring the first of them on different frameworks.
Chapter 6 contains conclusions and a discussion about future developments.
3

Chapter 1
Big Data for Critical Infrastructure
Protection
This chapter contains the definitions of critical infrastructure, Big Data and Secu-
rity Analytics; it also describes the role of critical infrastructures in modern soci-
ety and the importance of protecting such infrastructures from malicious attacks.
Some known attacks to critical infrastructures are also described to provide further
context and motivations for the work.
1.1 Critical Infrastructures
In recent years, critical infrastructure protection has emerged as an increasingly im-
portant framework for understanding and mitigating threats to security. Widespread
discussion of critical infrastructure protection began in the United States in 1996,
4

Big Data Analytics for Critical Infrastructure Monitoring
when former President Clinton formed a Commission on Critical Infrastructure
Protection. This commission produced a report in 1997, named “Critical Foun-
dations”, which established the central premise of infrastructure protection efforts:
the economic prosperity, military strength, and political vitality of the United States
all depend on the continuous functioning of the nation’s critical infrastructures. As
the report stated: “Reliable and secure infrastructures are [. . . ] the foundation for
creating the wealth of our nation and our quality of life as a people” [1].
Figure 1.1: President’s Commission on Critical Infrastructure Protection logo
Critical infrastructure protection is not only an American issue, even if this report
was probably the first to actually recognize the new risk. The European Programme
for Critical Infrastructure Protection (EPCIP) has been laid out in EU Directives by
the European Commission. It has proposed a list of European critical infrastruc-
tures based upon inputs by its Member States [13]. Each designated infrastructure
will have to define an Operator Security Plan (OSP) covering the identification of
important assets, a risk analysis based on major threat scenarios and the vulnera-
bility of each asset; they will also need to define processes for the identification,
selection and prioritisation of counter-measures and procedures [10].
This is an example of how technological progress often originates from military in-
ventions and discoveries: the words “critical infrastructure protection” were origi-
5

Big Data Analytics for Critical Infrastructure Monitoring
nally used to refer to air or artillery strikes; since then, they have developed a new
meaning. Critical systems now have to be protected from terrorist and denial of
service attacks, and the definition of “critical system” has broadened to include
data centers and computing infrastructures.
1.1.1 Definitions
A critical system is a generic system that, in case of failure, can cause disasters
such as:
• death or severe injury to people;
• loss or damage to infrastructures, vehicles and materials;
• heavy environmental damage.
Examples of critical infrastructures are power plants, gas production and distribu-
tion, telecommunications, water supply and public health facilities.
Critical systems are usually designed by security experts and engineers to fail less
than once every billion hours of functioning; redundancy is also a viable way to
further reduce the chance of a disaster.
As much as the different engineering techniques can focus their efforts on the im-
plementation of reliable and solid hardware, software and firmware processes, it is
impossible to guarantee the complete perfection of any system: it is clear that in a
critical system this constitutes a severe threat to security and safety.
6

Big Data Analytics for Critical Infrastructure Monitoring
Figure 1.2: Nuclear plants are an example of critical infrastructure that must beprotected.
A naively designed system can suddenly and completely interrupt its service, even
in the case of a simple processing error. A system is fault tolerant when it does
not interrupt its service even in case of faults. Fault tolerance is not fault immunity:
malfunctioning can occur at any time, but the system is able to keep doing its job,
gracefully degrade it, or interrupt it without causing any damage.
To make things worse, critical systems can be subject to attacks, e.g. from ter-
rorist groups, so protecting this kind of infrastructure is becoming more and more
essential.
1.1.2 Cyber Attacks Against Critical Infrastructures
In the last years there has been a growing demand for large, high-performance
computing infrastructures, built to execute business and scientific applications, to
manage critical systems or to support Cloud Computing providers.
7
Big Data Analytics for Critical Infrastructure Monitoring
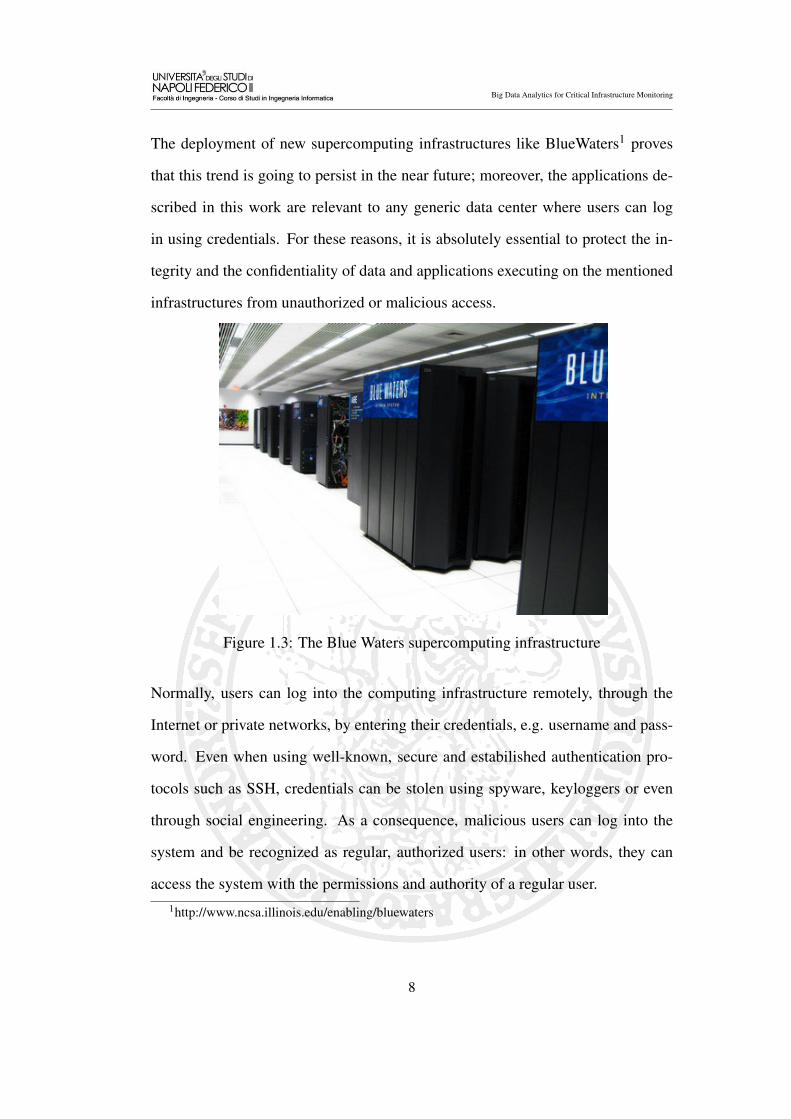
The deployment of new supercomputing infrastructures like BlueWaters1 proves
that this trend is going to persist in the near future; moreover, the applications de-
scribed in this work are relevant to any generic data center where users can log
in using credentials. For these reasons, it is absolutely essential to protect the in-
tegrity and the confidentiality of data and applications executing on the mentioned
infrastructures from unauthorized or malicious access.
Figure 1.3: The Blue Waters supercomputing infrastructure
Normally, users can log into the computing infrastructure remotely, through the
Internet or private networks, by entering their credentials, e.g. username and pass-
word. Even when using well-known, secure and estabilished authentication pro-
tocols such as SSH, credentials can be stolen using spyware, keyloggers or even
through social engineering. As a consequence, malicious users can log into the
system and be recognized as regular, authorized users: in other words, they can
access the system with the permissions and authority of a regular user.1http://www.ncsa.illinois.edu/enabling/bluewaters
8

Big Data Analytics for Critical Infrastructure Monitoring
Such an access is hard to detect with precision and can lead to severe consequences:
the credential thief may obtain root-level privileges on the machines, download
and install malicious software, steal confidential data or breach the privacy of the
credential theft victim.
The first cyber crime was reported in 2000 and concerned almost 45 million Inter-
net users [11]. Over the few past years cyber crimes have increased rapidly: cyber
criminals are, for various reasons, continuously exploring new ways to circumvent
security solutions to get illegal access to computer systems and networks. Some of
the most common cyber attacks are in the following list.
• Spamming is the sending of unsolicited bulk messages, often containing ad-
vertisement of illicit products or services, to huge numbers of recipients. The
spam volume already represents the biggest percentage of the total world-
wide email volume, and this situation is probably going to worsen over time.
• Search poisoning is the dishonest use of Search Engine Optimization tech-
niques to falsely improve the search engine ranking of a webpage. The first
case was reported in 2007 [12].
• Botnets are networks of computers infected by the same malware which
controls them to coordinate attacks to specific hosts. Infected computers in
a botnet are called zombies.
• A Denial of Service (DoS) attack makes a network resource inaccessible to
its intended users. It is launched by a large number of distributed or infected
hosts, e.g. botnets.
9

Big Data Analytics for Critical Infrastructure Monitoring
• Phishing is the fraudulent acquisition of confidential user data by counter-
feiting official e-mails and web sites. The user is lured into a fake website
which mimics a trusted organization’s website (e.g. a bank) and immediately
asks the user for his username and password.
• Malware is a general definition of software programmed to perform and
propagate malicious activities like viruses, worms and trojans. Viruses re-
quire human intervention for propagation, worms are self propagating and
trojans are not self replicating.
• Website threats are exploits of vulnerabilities in legitimate websites, infect-
ing them and attacking their visitors.
• Credential Compromise is the theft of sensitive information in order to
gain access to sensitive data, critical systems or other infrastructures; it can
be achieved using one of the previously listed cyber attacks.
1.1.2.1 Examples of Known Attacks Against Critical Systems
After the events of September 11th, 2001, cyber terrorism attacks were the focus
of the experts’ efforts. Cyber terrorism is a real, severe and relatively new threat
to the security of critical infrastructures, since their malfunctioning would have
devastating consequences for millions of people.
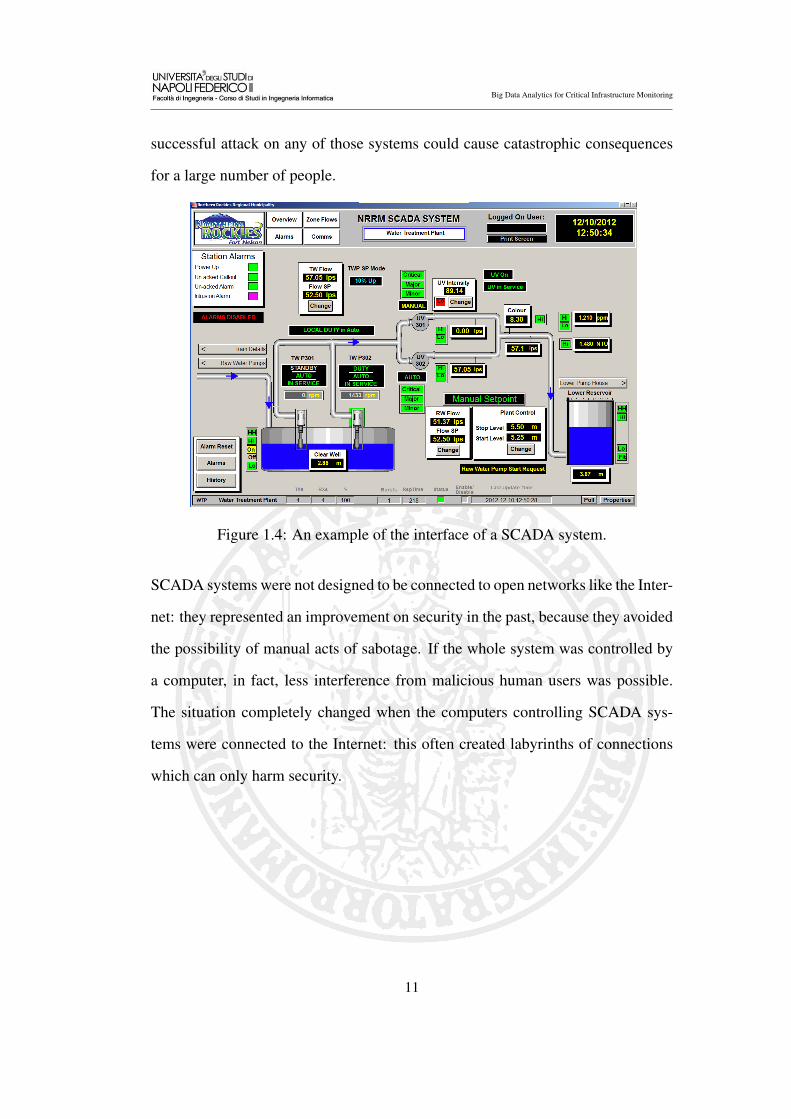
SCADA (Supervisory Control And Data Acquisition) systems are the most likely
targets of cyber terrorism attacks. These systems are used to physically control
electrical and electromechanical systems in important businesses, to manage dan-
gerous materials, to control nuclear power plants or chemical refineries. A single
10
Big Data Analytics for Critical Infrastructure Monitoring
successful attack on any of those systems could cause catastrophic consequences
for a large number of people.
Figure 1.4: An example of the interface of a SCADA system.
SCADA systems were not designed to be connected to open networks like the Inter-
net: they represented an improvement on security in the past, because they avoided
the possibility of manual acts of sabotage. If the whole system was controlled by
a computer, in fact, less interference from malicious human users was possible.
The situation completely changed when the computers controlling SCADA sys-
tems were connected to the Internet: this often created labyrinths of connections
which can only harm security.
11
Big Data Analytics for Critical Infrastructure Monitoring
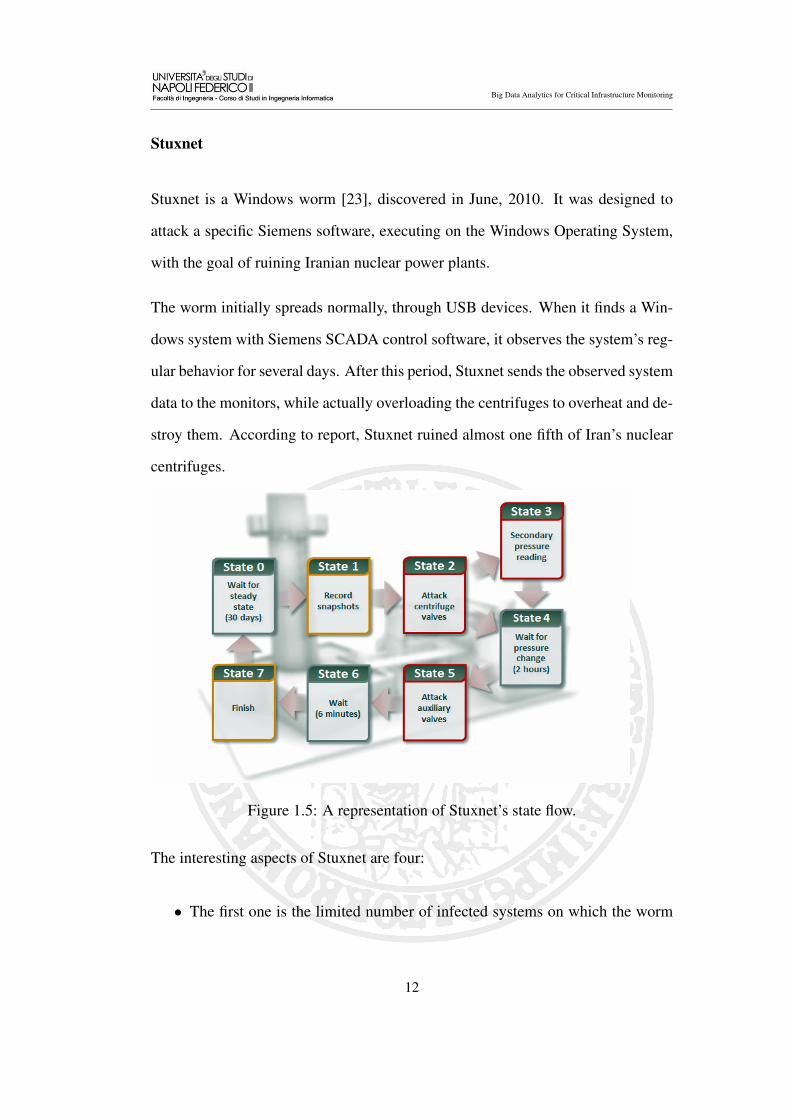
Stuxnet
Stuxnet is a Windows worm [23], discovered in June, 2010. It was designed to
attack a specific Siemens software, executing on the Windows Operating System,
with the goal of ruining Iranian nuclear power plants.
The worm initially spreads normally, through USB devices. When it finds a Win-
dows system with Siemens SCADA control software, it observes the system’s reg-
ular behavior for several days. After this period, Stuxnet sends the observed system
data to the monitors, while actually overloading the centrifuges to overheat and de-
stroy them. According to report, Stuxnet ruined almost one fifth of Iran’s nuclear
centrifuges.
Figure 1.5: A representation of Stuxnet’s state flow.
The interesting aspects of Stuxnet are four:
• The first one is the limited number of infected systems on which the worm
12

Big Data Analytics for Critical Infrastructure Monitoring
actively acts: Stuxnet has been allegedly designed by government agencies
and is developed with the goal of deactivating critical infrastructures in for-
eign countries. Unlike most of the worms, its goal is not to infect private
computers.
• The second one is the reason why it was created. Worms are usually created
as a proof of concept, to destroy private computers or to extort money from
the victims. Stuxnet was specifically created to infect and ruin nuclear power
plants; for this reason it can be considered as a new form of war.
• The third one is the extreme specificity of the worm: Stuxnet infected many
Windows computers, but it remains in an idle state in many of them, exclud-
ing the necessary steps to spread itself to new computers. The only com-
puters where it activates itself are the ones with a particular kind of SCADA
software produced by Siemens, and only in Iran.
• The fourth one is the monitor deceit: Stuxnet waits several days before acti-
vating, recording the normal behavior of the system, only to play it back to
the monitors during its destructive phase to trick them.
Saudi Aramco
Saudi Aramco, the national oil company of Saudi Arabia, reported that on August
15th, 2012, its computer network was attacked by a malware2. As a consequence,
it had to isolate its systems from external access to avoid further damage.
2More information on http://www.net-security.org/secworld.php?id=13493
13

Big Data Analytics for Critical Infrastructure Monitoring
The service interruption resulted from a virus which infected the personal work-
stations without affecting the primary components of the network.
Figure 1.6: Saudi Aramco’s logo
After two weeks, another system intrusion was detected: this time, the result was
the publication of the CEO’s password and the credentials to log into the security
devices used by Saudi Aramco.
Global Payments
Global Payments is a provider of electronic transaction processing services for
merchants, independent sales organizations, financial institutions, government agen-
cies and multi-national corporations located throughout the United States, Canada,
Europe, and the Asia-Pacific region.
The company was hit by a security breach in March 20123, affecting from 50,000 to
10 million Visa and MasterCard credit card holders. Global Payments announced
on Friday, March 30, 2012 that it identified and self-reported unauthorized access
3More information on http://www.net-security.org/secworld.php?id=12680
14
Big Data Analytics for Critical Infrastructure Monitoring
into its processing system. The company believed that the affected portion of its
processing system was confined to North America and less than 1,500,000 card
numbers may have been exported.
The company later declared that the incident was contained because there was no
fraudulent use of the stolen numbers and then stopped releasing statements about
the incident.
1.2 Big Data
The world’s technological per-capita capacity to store information has roughly
doubled every 40 months since the 1980s; as of 2012, every day 2.5 exabytes
(2,5 ∗ 1018) of data were created [4]. The rate of data creation has increased so
much that 90% of the data in the world, today, has been created in the last two
years alone [24].
Luckily, the technological advances in storage, processing and analysis of data has
led to:
• the rapidly decreasing cost of storage and CPU power;
• the flexibility and cost-effectiveness of datacenters and cloud computing for
elastic computation and storage;
• the development of new architectures, such as MapReduce and stream pro-
cessing architectures, which allow users to take advantage of these distributed
15
Big Data Analytics for Critical Infrastructure Monitoring
computing systems storing and analyzing large quantities of data through
flexible parallel processing.
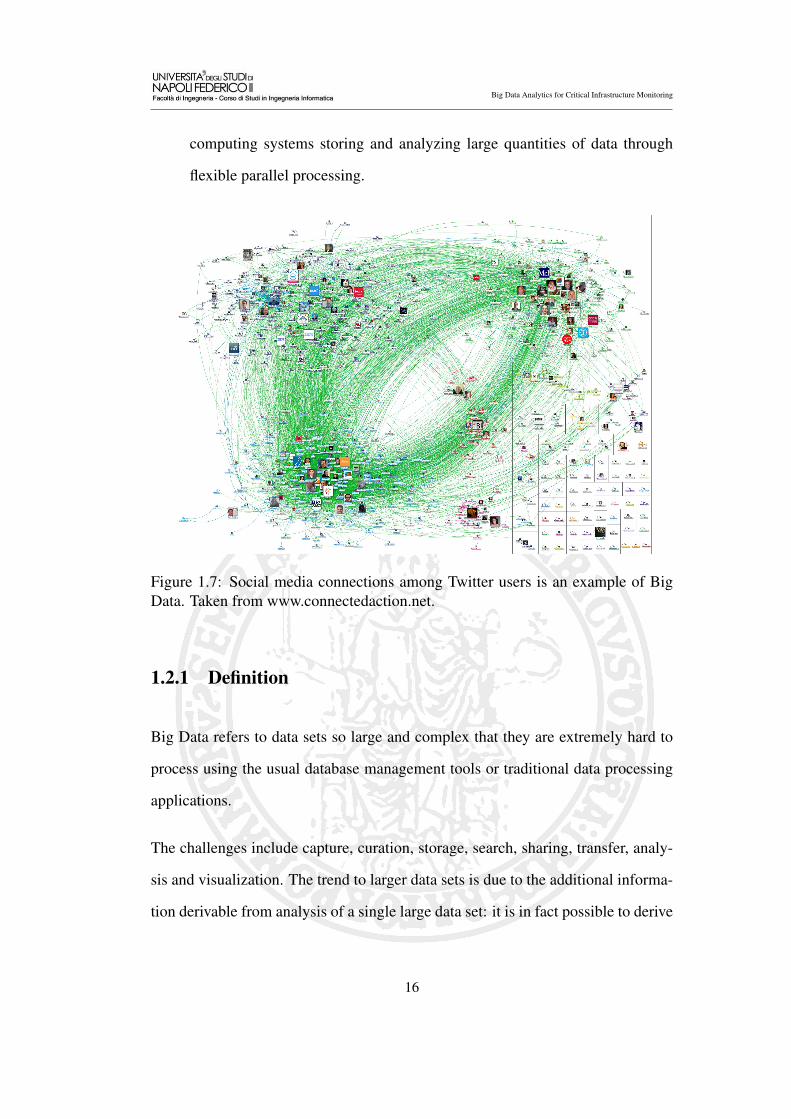
Figure 1.7: Social media connections among Twitter users is an example of BigData. Taken from www.connectedaction.net.
1.2.1 Definition
Big Data refers to data sets so large and complex that they are extremely hard to
process using the usual database management tools or traditional data processing
applications.
The challenges include capture, curation, storage, search, sharing, transfer, analy-
sis and visualization. The trend to larger data sets is due to the additional informa-
tion derivable from analysis of a single large data set: it is in fact possible to derive
16
Big Data Analytics for Critical Infrastructure Monitoring
more information from the analysis of a single large data set instead of separate
smaller sets with the same total amount of data.
As of 2012, limits on the size of data sets that were processable in a reasonable
amount of time were on the order of exabytes of data. Scientists regularly en-
counter limitations due to large data sets in many areas, including meteorology,
Internet search, finance and business, genomics, complex physics simulations, and
biological and environmental research [3].
The term Big Data is a blanket term, but when it is used, usually one or more of
these three meanings (the three Vs) are relevant:
• Volume, often extreme. It can be measured in terabytes or petabytes, number
of files, number of records, number of transactions and more.
• Velocity: data can often be received at very high rates, and the need to pro-
cess or storage it requests either extreme processing capabilities or extreme
storage capabilities.
• Variety: data can be very heterogeneous and non-structured [25].
1.2.2 Big Data Analytics
The single word Analytics does not refer to Big Data, just to data analysis tech-
niques, like OLAP (Online Analytical Processing) or OLTP (Online Transaction
Processing). Big Data Analytics is, instead, the set of techniques used to analyze
17
Big Data Analytics for Critical Infrastructure Monitoring
and study Big Data, discovering complex patterns which were not immediately
visible before.
Many businesses of different size and relevance have to constantly deal with ter-
abytes of data. The economy crisis which began in 2008 has increased the compet-
itivity level and the requirements for businesses to survive: much can depend on
their ability at taking advantage of the huge amounts of data they collect.
For example, by studying the behavior patterns of users while they are surfing
on a web site, their goals and desires can be automatically guessed, with a good
accuracy, by pattern recognition; the web site structure can then be changed so
that users can find what they really want sooner, in this way boosting the usability
and the customer satisfaction. In a data center or a computing cluster, systems
logs can be analyzed to understand and predict users’ behaviour and improve load
balancing.
A large number of enterprises do not know about Big Data and probably also store
terabytes of data in their disks, without really knowing how to analyze and manage
them. Existing analytical techniques do not work well at large scales and typically
produce so many wrong results that their efficacy is undermined [17]. Moreover,
retaining large quantities of data was not economically feasible before: many com-
panies just deleted their data after a fixed retention period of time.
New Big Data Analytics technologies are enabling the analysis of heterogeneous
large datasets at unprecedented scales and speeds. For example, a recent case
study presented by Zions Bancorporation [18] compared the analysis of the same
data using different security monitoring tools. With traditional SIEM (security
18
Big Data Analytics for Critical Infrastructure Monitoring
information and event management) tools, it took about an hour to get the results.
With a new system using specific Big Data Analytic tools, the same results were
reached in under a minute.
The enormous potential of Big Data Analytics also presents some challenges: pri-
vacy is a relevant issue. In particular, the principle of avoiding data reuse implies
that data should be only used for the purposes declared when it was collected.
This is the easiest principle to violate when analyzing Big Data, because it is not
always simple to determine and declare such purpose before collecting the data.
Moreover, some companies could be tempted to analyze their data to determine
behavioral patterns of their users in undeclared ways.
It’s worth noting that until recently, privacy relied mainly on the technological lim-
itations on the ability to extract, analyze and correlate sensitive data sets. With the
introduction of Big Data Analytics tools, this limitation is not an obstacle anymore,
making privacy violations easier.
1.3 Security Analytics
Security Analytics is the application of Big Data Analytics to security: generic
Big Data Analytics frameworks can be easily used to develop Security Analytics
applications and tools.
For example, in a big high-performance computer cluster, suspect behavior can be
noticed by analyzing the system logs and raising alerts regarding possible intrusion
or credential theft. It’s obvious that this objective must be actively pursued by
19
Big Data Analytics for Critical Infrastructure Monitoring
security engineers; the ideal intent is the real time detection of security breaches
and compromised users.
The data which can be analyzed in Security Analytics can be divided into passive
and active sources [14].
Passive data sources can include:
• Computer-based data, e.g., geographical IP location, computer security
health certificates, keyboard typing and clickstream patterns, WAP data.
• Mobile-based data, e.g., GPS location, network location, WAP data.
• Physical user data, e.g., time and location of physical access of network.
• Human Resource data, e.g., organizational role and privilege of the user.
• Travel data, e.g., travel patterns, destinations, and itineraries.
• SIEM data, e.g., network logs, threat database, application access data.
• Data from external sources, e.g., rogue IPs, external threats.
Active data sources can include:
• Credential data, e.g., user name and password.
• One-time passwords, e.g., for online access.
• Digital Certificates.
20
Big Data Analytics for Critical Infrastructure Monitoring
• Knowledge-based questions, e.g., “what is your typical activity on Satur-
days from 3 pm to 6 pm?”.
• Biometric identification data, e.g., fingerprint, facial recognition, voice
recognition, handwriting recognition.
• Social media data, e.g., Twitter, Facebook, internal office network, etc [15].
Applying analytics to these sources can provide a complete view of the internal
and external resources of a system; whenever an intrusion is detected, the system
administrators can take appropriate countermeasures and learn more about preven-
tion techniques.
Big Data technologies are already transforming security analytics, by collecting
data at a massive scale, performing deeper analytics on said data and achieving
real time analysis of streaming data.
The current largest applications of security analytics are in threat monitoring and
incident investigation, which are major concerns to both financial and military in-
stitutions. Their goal is to discover and learn both known and unknown cyber
attack patterns, which are expected to highly influence the efficiency in the identi-
fication of hidden threats in a shorter time, the accuracy in the prediction of future
attacks and the effectiveness in tracking down attackers.
The Big Data Analytics frameworks that are presented in the following chapters
can be appropriate tools for security analytics. They can be coupled with ware-
house resources such as dashboards, data maintenance or ETL4 tools.4Extract, transform, and load (ETL) refers to a process in database usage that extracts data from
outside sources, transforms it to fit operational needs and loads it into the end target.
21
Chapter 2
Analysis of Monitoring Tools
This chapter contains a discussion on the most popular monitoring tools. Mon-
itoring is the collection, storage and analysis of data regarding a system during
its activity. Its goal is to verify that, during the whole uptime of the system, cer-
tain properties are continuously met. Such properties represent the set of states in
which the system works properly and outputs the services it was designed and im-
plemented to produce. The system must therefore avoid using too many resources,
present correct outputs at all times and, in case of real time systems, respect every
single deadline.
2.1 Introduction
Monitoring is often necessary in critical and real time systems: even a long and te-
dious testing phase and the full compliance with international standards are always
22
Big Data Analytics for Critical Infrastructure Monitoring
insufficient to guarantee the total absence of failures in a system.
The early works on monitoring were exclusively about offline monitoring: the data
was collected during the uptime of a software and\or hardware system and its anal-
ysis was postponed. Online monitoring is a relatively new matter of discussion: in
this type of monitoring, the specifications that the system has to meet are compared
almost in real time with its properties during its service. It is obvious that online
monitoring requires great design and implementation efforts, new analysis tools
and an important amount of hardware, software and network resources.
These requirements are absolutely not trivial, but monitoring can be very interest-
ing in non-critical systems (e.g. for the production and analysis of statistics on
resource usage) and even essential in critical systems. An online monitoring tool
can actually prevent the disasters which can easily originate from a critical sys-
tem malfunction: monitoring tools can, in fact, automatically trigger recovery and
prevention software, saving businesses and lives.
For example, an online monitoring tool can detect a byzantine failure in a dis-
tributed system, or can automatically activate the backup hardware in case of mal-
functioning of the main hardware in complex systems like a plane or a battleship.
2.2 RAMS and DCACAS
A critical system, e.g. aeronautical or military, must obviously be designed and
built following the Reliability, Availability and Mantainability (RAM) constraints,
to which Security and Safety can be added (RAMS) [27]. These constraints are
23

Big Data Analytics for Critical Infrastructure Monitoring
determined by the customer; to ensure that the system follows the RAMS spec-
ifications, it can be monitored during its activity. In systems without monitor-
ing, service degradation is unavoidable: a hardware component can suddenly stop
working, there can be a race condition hidden in the source code, or a very rare bug
can affect the system. Thanks to monitoring, this degradation can be prevented by
warning the system administrator that an issue has arisen or, in some cases, auto-
matically executing actions to prevent negative consequences.
The goals of monitoring are keeping threats to Reliability, Availability, Mantain-
ability, Safety and Security under control, so that opportunities to improve them
can be identified and new data to build other systems can be collected and stored.
The attention to monitoring can help the system’s design in two more ways:
• monitoring can help preventing the catastrophic failures in the system, thus
avoiding very high maintenance costs;
• including the monitoring subsystems in a critical infrastructure design also
helps decreasing the unforeseen costs, since the monitoring expenses are
already included in the budget when the system is designed.
DCACAS (Data Collection Analysis and Corrective Action Systems) are the evo-
lution of FRACAS (Failure Reporting, Analysis and Corrective Action Systems):
they allow reporting, classification and analysis of the failures of a system. The
main difference between DCACAS and FRACAS is the addition of data collection
during the correct operation of the system, as well as failure data.
24

Big Data Analytics for Critical Infrastructure Monitoring
DCACAS is a process that allows to collect data from different sources (failure,
maintenance, correct operation, service and warranty data), to collect and to ana-
lyze them, and to pursue the following goals:
• Identify, select and assign priorities to the failures and the issues for a post-
poned analysis;
• Identify, implement and verify corrective actions to be executed to ensure
that a certain failure does not happen again;
• Supply access to the appropriate personnel to manage the failure;
• Collect failure and normal service data to allow control on the system’s per-
formance.
Obviously, the DCACAS validity is limited by the quality of the collected data.
The minimum recommended data to collect is:
• Which component identified the data (failure or correct operation);
• The result of the event (e.g. a failure);
• The physical position and the timestamp of the data collection;
• Other conditions (i.e. info on the system’s state).
2.3 Taxonomy
Runtime monitoring tools can be divided depending on four different features [16]:
25
Big Data Analytics for Critical Infrastructure Monitoring
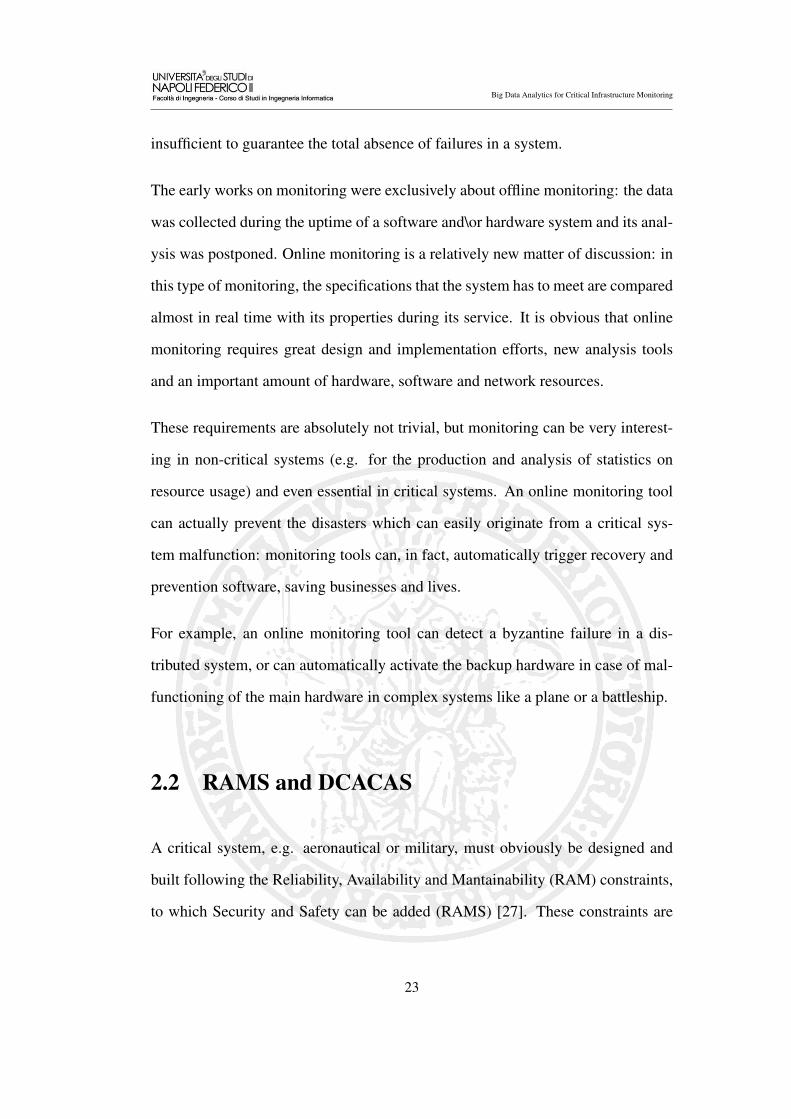
Figure 2.1: An example of a monitoring tool’s interface.
• Specification language: it is necessary to express the properties that the sys-
tems must comply with in a specification language. These languages can
have different levels of abstraction and can express different types of proper-
ties. The level of detail must also be specified. An example of specification
language is ANNA (Annotated Ada) for the Ada programming language.
• Monitor: the type of monitor can change on the basis of several different
subcharacteristics:
– where the monitoring points are in the system;
– whether the monitoring results are recorded automatically or manually;
– whether the monitoring is inline (in the case of a software monitor, the
control code is part of the executing software) or offline, which can in
turn be asynchronous or synchronous (the software must or must not
wait for the termination of the control code to continue);
– whether it’s hardware or software (a hardware monitor has dedicated
26

Big Data Analytics for Critical Infrastructure Monitoring
components for data collecting);
– whether it’s single process, multiprogrammed (executing on the same
processor but on a different process or thread) or multi-processor.
• Event Handler: how the monitor reacts to the violations, how it manages the
level of control (whether the countermeasures are single or common to all
violations) and how much these reactions weigh on the system (in a scale
from No Effect to Automated Termination).
• Operational Issues:
– the type of programming language to which the tool is applied (general
purpose, domain specific or category specific);
– the dependence on hardware, operating system or middleware;
– the level of maturity, i.e. the stage of the development process for the
monitoring tool: it can be still being developed, in a prototipal phase or
already available to the public.
An event based monitor only activates when some particular conditions arise in the
monitored system. These conditions can be hardware, process level or application
dependent. Events are generated by sensors, which can either keep track of all the
changes in the system or just receive messages from the network or the processes
in a distributed system. When an event occurs, the monitoring system can decide
to act accordingly. These actions can change the state space of the application,
perform signaling to the user or start a new process.
27

Big Data Analytics for Critical Infrastructure Monitoring
Monitoring tools can also be classified according to the level of interference effect
they have on the application: if they make use of the system’s hardware, bus or
network connection, they could degrade the system’s performance. An idea to
avoid this kind of interference is using dedicated hardware, but the cost would
obviously be higher and dedicated hardware is often very specific and not portable,
unlike the monitoring software.
2.3.1 Real-Time Systems Monitoring
Real-time systems are hardware and software systems that are subject to real-time
constraints, meaning that time is an issue: such systems are considered in a failure
state if they fail to meet the specified deadlines, expressed in terms of computing
time. Goodloe and Pike[5] suggested the following architectural constraints for
real-time systems:
• Functionality: the monitor must not interfere with the normal system func-
tionalities until the system violates its specifications;
• Schedulability: the monitor must not cause any violation of the real-time
constraints of the system;
• Reliability: the reliability of the extended system (i.e. the system including
the monitor) must not be lower than the reliability of the normal system;
• Certifiability: the architecture of the system must not require heavy struc-
tural or implementative alterations to include the monitor.
28

Big Data Analytics for Critical Infrastructure Monitoring
Only when the four listed contraints are met it is possible to declare that the system
has actually been improved by the monitor.
2.3.2 Distributed Systems Monitoring
A distributed system is a system composed by a number of independent, heteroge-
neous nodes that can only communicate through exchanging messages: they lack
shared memory. They can also fail independently from one another.
The fundamental properties of distributed systems are two:
• Liveness: something good eventually happens;
• Safety: something wrong never happens.
When the system stops following its specifications or these properties, it has gen-
erated a failure; this can be due to design or implementation faults, Heisenbugs or
random malfunctioning of hardware or network devices.
There are different kinds of monitors inside distributed systems, but monitors are
just other processes: therefore, the issues concerning reliable communicaton and
logical and physical clock synchronization persist. Distributed systems monitoring
must deal with these issues [26]:
• Variable delays during information transfer;
29

Big Data Analytics for Critical Infrastructure Monitoring
• Excessive number of event-generating objects (it is important to correctly set
up the granularity of the events which trigger a response from the monitor1);
• It is necessary to find a canonical form for the messages to be exchanged
among the monitor and the processes.
There are three possible architectures for monitors.
• Bus-Monitor is the simplest architecture. The monitor process simply ob-
serves the traffic on the system bus and receives the messages just like any
other process; after receiving a message, the monitor checks it for errors
and, if it finds any, it can trigger a corrective action. This monitor is very
simple, but it can only infer the health of other processes from the messages
they send on the system bus; therefore it can not exceed the level of fault
tolerance that the system would have if it were specifically designed.
• Single Process-Monitor: the monitor owns a dedicated bus and every pro-
cess in the system is instructed to send a copy of each message to the monitor,
both on the normal and the dedicated bus. The monitor process compares the
messages and signals any difference to the other processes: disparities are of-
ten the result of a failure. The necessary maintenance to install this monitor
is not very high, but every process still has to be changed so that it forwards
every sent message to the monitor. The use of a dedicated bus lowers the
chance to violate deadlines in real time systems.
1A monitor can execute algorithms to decide which countermeasure to apply in response to acertain event, or just have a lookup table linking events to actions.
30

Big Data Analytics for Critical Infrastructure Monitoring
• Distributed Process-Monitor: in this architecture, every process has its
own monitor, which can be implemented either on the same or on dedicated
hardware. The last solution allows reducing the probability that a hardware
fault ruins the monitor to a minimum. In this case, by adding an interconnec-
tion dedicated to the message exchange among the monitors, the fault toler-
ance level of the whole system can be artificially increased, while avoiding
any interference for the deadlines in real time systems. Known consensus
algorithms can also be used among the different monitors to detect possible
byzantine failures in the processes. Another added benefit is that a monitor
can avoid the input congestion for a process in case of the failure of other
processes. The downside is obviously the cost: such an architecture can cost
even more than the whole system without monitors. This third architecture
is therefore not viable in case of very specific requirements in terms of cost,
dimension, weight or energy consumption.
Another issue worth considering is what to monitor in a distributed system. In
these systems, the essential property that must be checked to ensure the absence of
byzantine faults is the consensus (every process receives the same message). In the
case of runtime monitoring, it’s necessary to check the messages that the processes
receive.
In a single-broadcast system where the transmitter sends the messages and every
other process is supposed to receive it (roles can change in time):
• the Bus-Monitor architecture is insufficient because the monitor is just an-
other receiver, therefore it can not discern failures; it is not possible to im-
31

Big Data Analytics for Critical Infrastructure Monitoring
prove the system’s fault tolerance;
• the Single Process-Monitor can work as a monitor if every other process
sends it a copy of the every received message with a unique ID. It’s a better
solution compared to the Bus-Monitor, but there could be false positives;
• the Distributed Process-Monitor implies a many-to-many communication, so
a reliable multicast algorithm must be used. Fault tolerance can be added to
the system using this architecture, but the costs are very high.
Monitoring to detect time-related faults is more complicated. Time constraints
can not be monitored directly, because they should compare local clocks, whose
synchronization can never be guaranteed.
2.4 Monitoring tools
In this paragraph several monitoring tools are presented. A monitoring tool is a
software dedicated to the collection, storage and analysis of operational data in a
system, often with the goal to detect and possibly correct failures or just to report
alerts to the system administrators.
2.4.1 RRDtool
RRDtool (Round-Robin Database Tool) is a tool designed to store data series pro-
duced from the monitoring of a system over time. Its name refers to the fact that
32
Big Data Analytics for Critical Infrastructure Monitoring
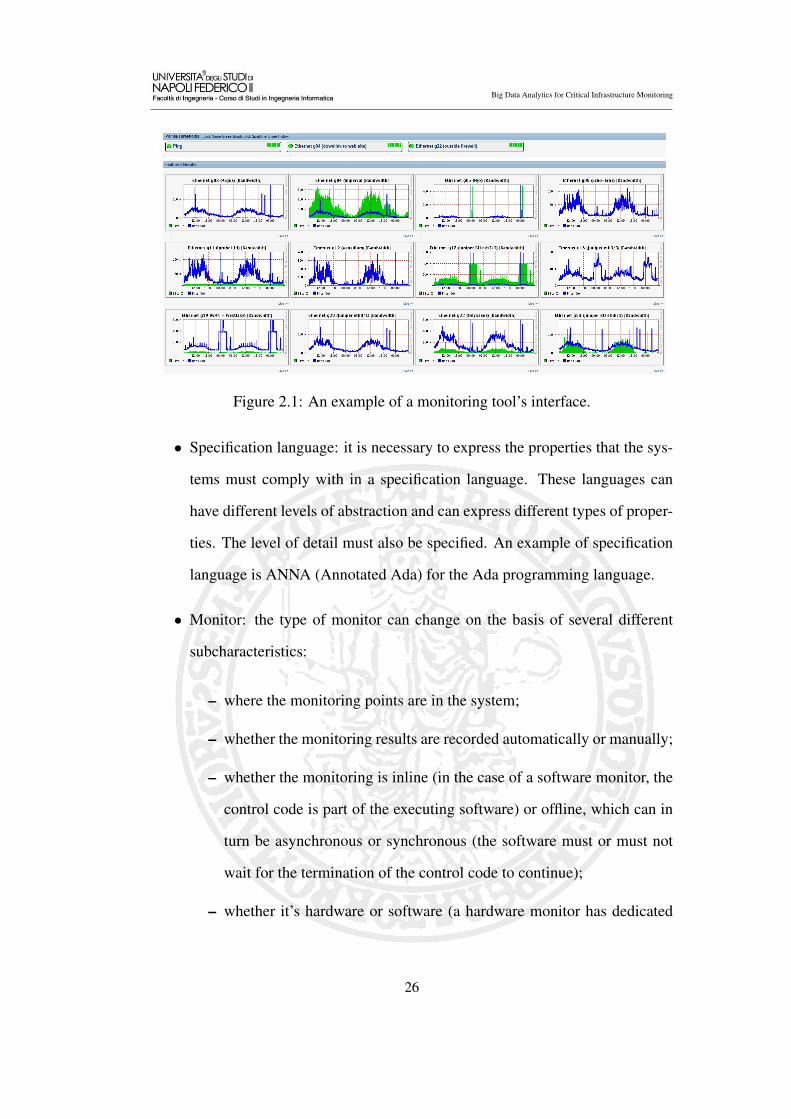
Figure 2.2: Screenshot of the RRDTool interface
data are stored in a round-robin database (circular buffer): this guarantees that the
system storage footprint remains constant over time.
The analyzed data series can include measurements of temperatures, CPU load,
network bandwidth, used memory and much more. RRDtool takes these measure-
ments at regular intervals of time, called steps, and shows them to the user on a
graphical user interface. The step length is specified in the configuration phase.
RRDtool is used as a data storage method by several other monitoring tools, Gan-
glia and Cacti included.
33
Big Data Analytics for Critical Infrastructure Monitoring
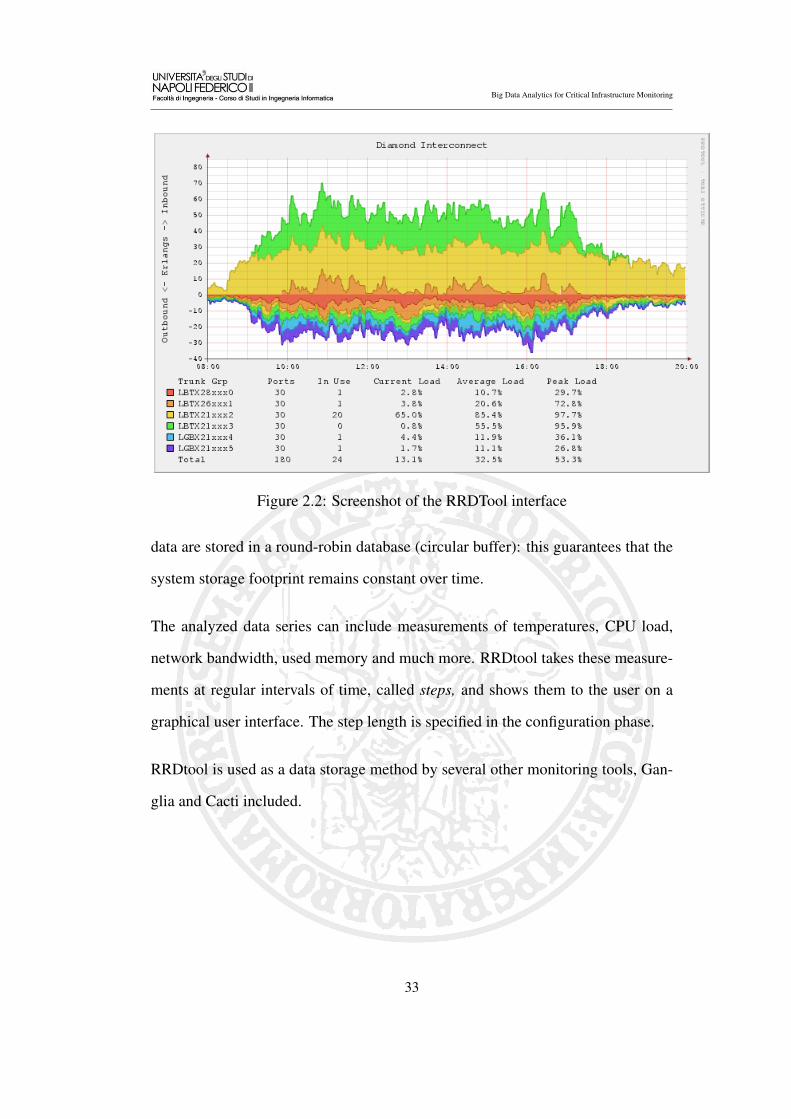
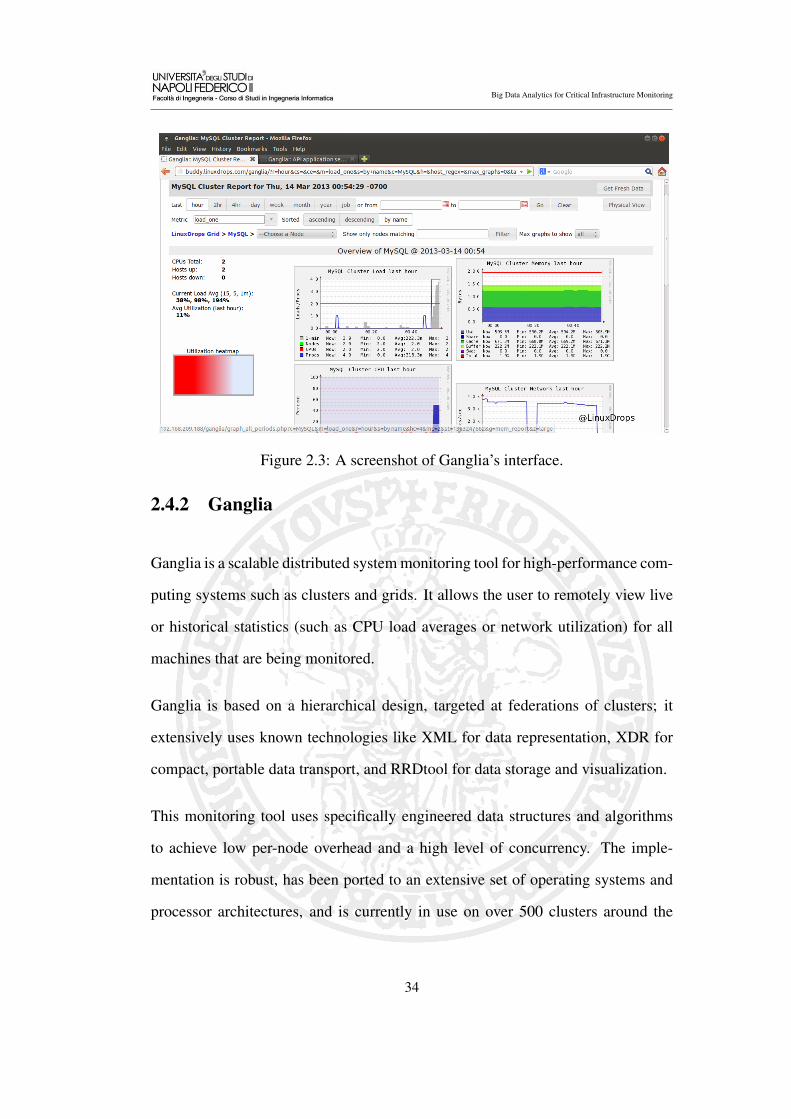
Figure 2.3: A screenshot of Ganglia’s interface.
2.4.2 Ganglia
Ganglia is a scalable distributed system monitoring tool for high-performance com-
puting systems such as clusters and grids. It allows the user to remotely view live
or historical statistics (such as CPU load averages or network utilization) for all
machines that are being monitored.
Ganglia is based on a hierarchical design, targeted at federations of clusters; it
extensively uses known technologies like XML for data representation, XDR for
compact, portable data transport, and RRDtool for data storage and visualization.
This monitoring tool uses specifically engineered data structures and algorithms
to achieve low per-node overhead and a high level of concurrency. The imple-
mentation is robust, has been ported to an extensive set of operating systems and
processor architectures, and is currently in use on over 500 clusters around the
34

Big Data Analytics for Critical Infrastructure Monitoring
world. It has been used to link clusters across university campuses and around the
world and can scale to handle clusters with 2000 nodes2.
Ganglia’s architecture is divided in three main parts:
2.4.2.1 Ganglia Monitoring Daemon (gmond)
Gmond is a multi-threaded daemon which runs on each cluster node that has to
be monitored. Installation does not require having a common NFS filesystem or a
database back-end, installing special accounts or maintaining configuration files.
Gmond has four main responsibilities:
• Monitor changes in host state.
• Announce relevant changes.
• Listen to the state of all other Ganglia nodes via a unicast or multicast chan-
nel.
• Answer requests for an XML description of the cluster state.
Each gmond instance can transmit information using XML over a TCP connection
or via unicast\multicast in XDR format using UDP messages.
2For the source and more information on Ganglia, visit http://ganglia.info/.
35
Big Data Analytics for Critical Infrastructure Monitoring
2.4.2.2 Ganglia Meta Daemon (gmetad)
Federation in Ganglia is achieved using a tree of point-to-point connections amongst
representative cluster nodes to aggregate the state of multiple clusters. At each
node in the tree, a Ganglia Meta Daemon periodically polls a collection of child
data sources, parses the collected XML, saves all the metrics to round-robin databases
and exports the aggregated XML over a TCP socket to clients.
Data sources may be either gmond daemons (for specific clusters), or other gmetad
daemons (for sets of clusters). Data sources use source IP addresses for access
control and can be specified using multiple IP addresses for failover. The latter
capability is useful for aggregating data from clusters since each gmond daemon
contains the entire state of its cluster.
2.4.2.3 Ganglia PHP Web Front-end
The Ganglia web front-end provides a view of the gathered information via real-
time dynamic web pages. Most importantly, it displays Ganglia data in a meaning-
ful and colorful way for system administrators and computer users.
This web front-end is dedicated to system administrators and users. For example,
users can view the CPU utilization over the past hour, day, week, month, or year.
The web front-end shows similar graphs for memory usage, disk usage, network
statistics, number of running processes, and all other Ganglia metrics.
The Ganglia web front-end is written in PHP, and uses graphs generated by gmetad
to display history information.
36
Big Data Analytics for Critical Infrastructure Monitoring
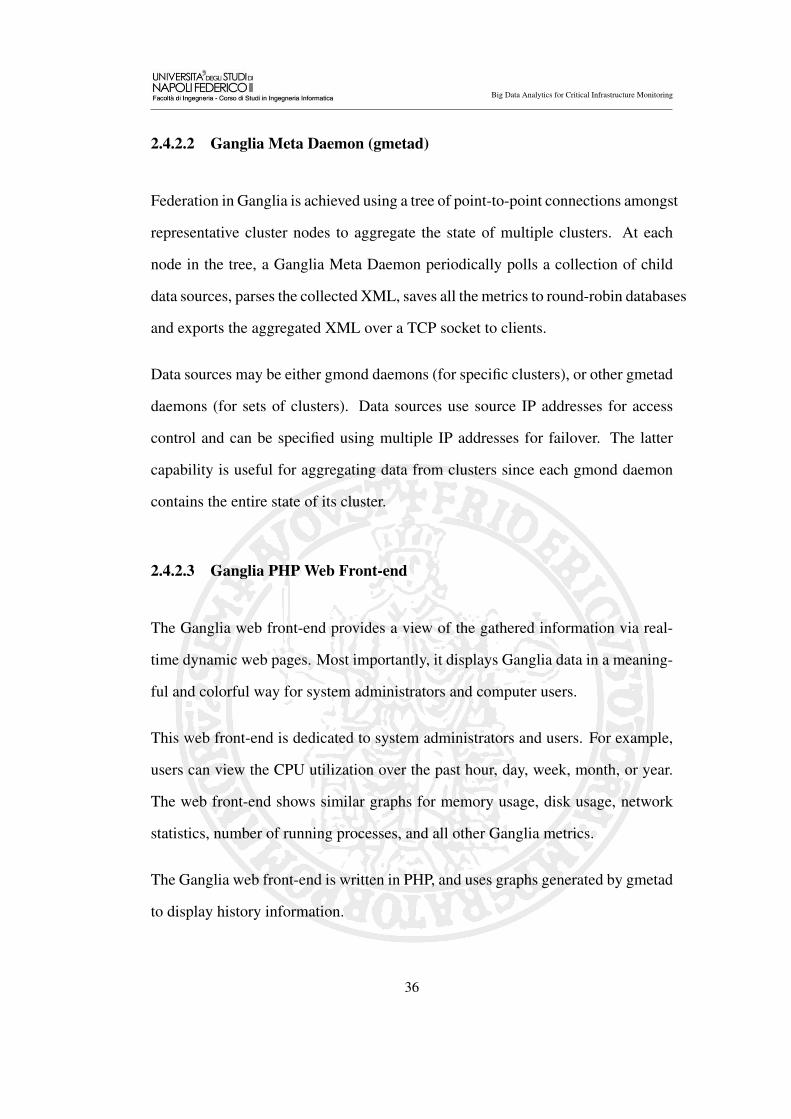
2.4.3 Nagios
Figure 2.4: Screenshot of Nagios’ interface.
Nagios is an open source monitoring tool for Unix systems, capable of manag-
ing internal and network resources. Its most important function is to check that
specified resources or services comply with certain defined properties, raising an
alert when said properties are violated and when normal values are reached again.
Nagios can monitor resources of differend kinds:
• Network services (POP, SMTP, HTTP, SSH and more);
• System resources (CPU load, hard disk usage and more);
• System log files.
Nagios can also monitor remote systems through SSH or SSL connections. This
37
Big Data Analytics for Critical Infrastructure Monitoring
tool also offers the possibility to define event handlers, i.e. actions to be automati-
cally executed when any alert gets raised or when it gets reset.
An optional web interface is provided; it shows the system status, notifications, log
files and other useful information.
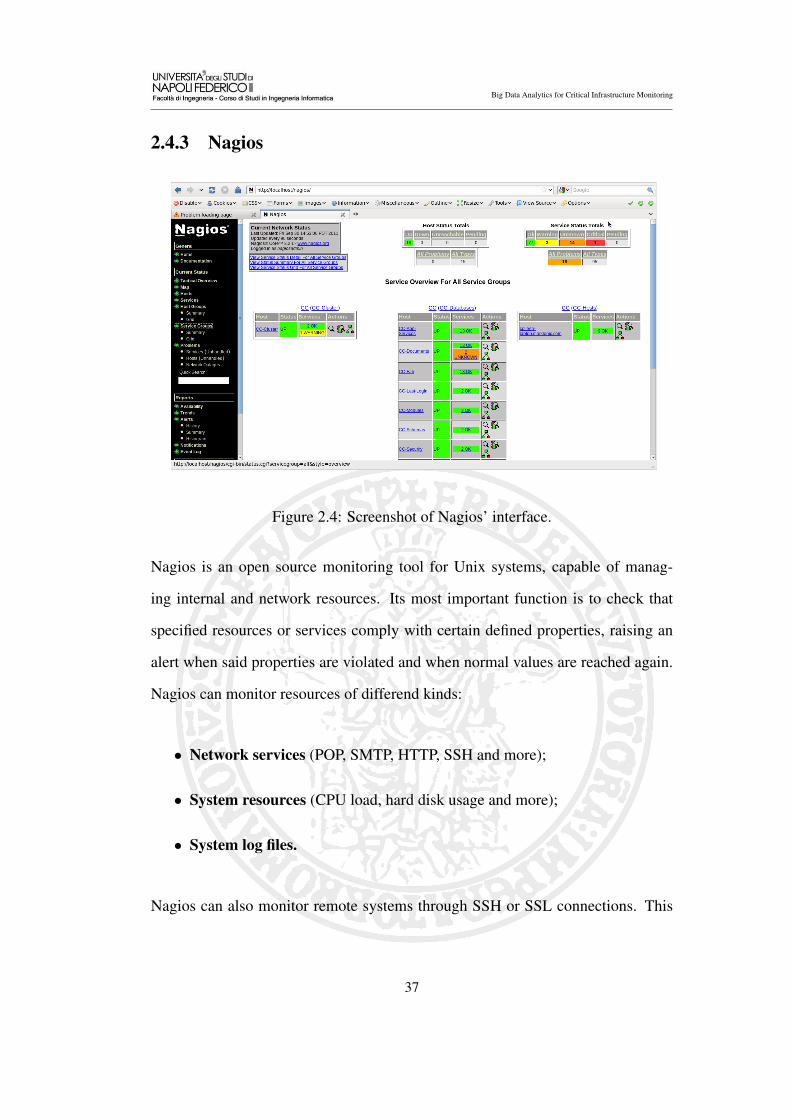
2.4.4 Cacti
Figure 2.5: Screenshot of Cacti’s interface
Cacti is a complete network graphing PHP driven solution, designed to harness
the power of RRDtool’s data storage and graphing functionality. Cacti provides a
fast poller, advanced graph templating, multiple data acquisition methods, and user
management features out of the box.
Cacti is a complete frontend to RRDtool: it stores all of the necessary information
to create graphs and populate them with data in a MySQL database.
38
Big Data Analytics for Critical Infrastructure Monitoring
This tool also offers user management: the system admin can decide which of the
many functionalities offered by Cacti are available to which users. For this reason
a permission management tool exists.
One of the Cacti’s strengths is its scalability: this tool is, in fact, suitable for use
in a domestic network like it is in a complex network with hundreds of nodes.
Another advantage of using Cacti is its usability, thanks to its intuitive and simple
interface.
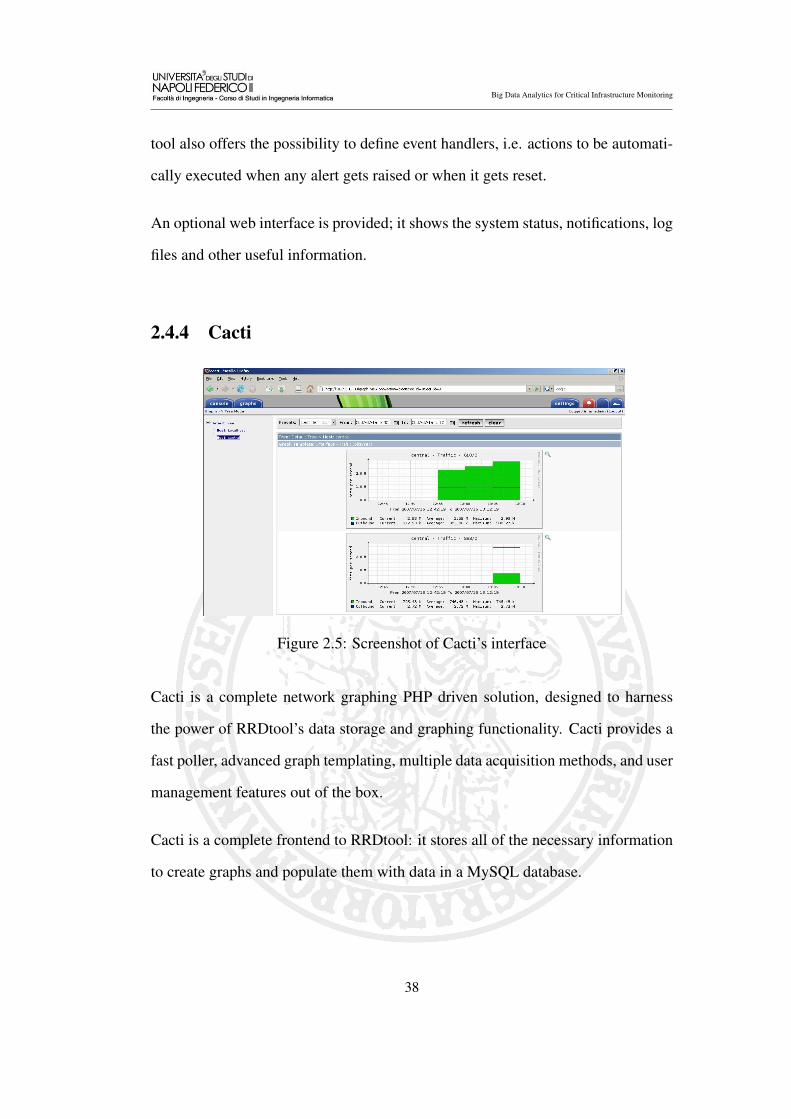
2.4.5 Chukwa
Figure 2.6: Screenshot of Chukwa’s interface.
Apache Chukwa is an open source data collection system for monitoring large
39

Big Data Analytics for Critical Infrastructure Monitoring
distributed systems. Chukwa is built on top of the Hadoop Distributed File Sys-
tem (HDFS) and Map/Reduce framework and inherits Hadoop’s scalability and
robustness. Chukwa also includes a flexible and powerful toolkit for displaying,
monitoring and analyzing results to make the best use of the collected data.
Chukwa is a Hadoop subproject: even though log analytics was among the original
Hadoop goals, the incremental log generation mechanism is very far from ideal for
Hadoop, which works better on a small number of large files. A possible solution
could be to merge multiple files, but this would require a dedicated MapReduce
job and a heavy overhead.
This monitoring tool was designed to cover this issue: Chukwa should be able to
parse logs mantaining Hadoop’s scalability.
Its architecture is based on five main components:
• An agent for each host, which collects data from the node and sends it to the
collectors;
• A collector every 100 agents, which receives their input data and writes it
on a stable memory;
• ETL Processes for data storage and parsing;
• Data Analytic Scripts for Hadoop’s health analysis;
• HICC (Hadoop Infrastructure Care Center) is a web portal which dis-
plays an interface to visualize data.
40

Big Data Analytics for Critical Infrastructure Monitoring
Chukwa only works on systems where Hadoop is already installed, therefore it is
not suitable for other kinds of architectures.
2.4.6 Comparison
A comparison among the described tools is presented in table 2.1. RRDtool is
not included because it is intended as a database for the collected data. All the
described tools are open source software monitors and are publicly available for
free, so their level of maturity is high.
Name Alerts Platform WebApp Distributed Access ControlGanglia No Linux Read Only Yes NoNagios Yes Linux, BSD Multiple Yes YesCacti Yes Linux, Win32 Full Yes Yes
Chukwa No HDFS Read Only Yes No
Table 2.1: Comparison among the different monitoring tools. For Cacti, Fullmeans that all aspects of the system can be controlled through the web app.
2.4.7 Rule Based Logging and LogBus
The logs a system produces can be helpful to understand its performance, its oper-
ational status and the conditions which brought to a particular failure. This tech-
nique involves the addition, in the source code of the observed system, of special
functions, needed to write log records in dedicated files.
It is possible to define formal and accurate rules, based on the system model (de-
veloped before the implementation phase), which determine the activation of said
41

Big Data Analytics for Critical Infrastructure Monitoring
Figure 2.7: Rule based logging example
logging rules. By using this formal rules, instead of adding calls to logging proce-
dures where they seem to be reasonable according to the programmer, it’s possible
to obtain a very low number of false positives and an high rate of reported failures,
i.e. failures for which there is an entry in the logs. False positives are alerts in the
logs which do not relate to any failure.
LogBus is a log based infrastructure which was developed to support the analysis of
some specified events at runtime [6]. These events are triggered thanks to defined
rules, e.g. the startup of a node in a distributed system or the truth of a certain
logical condition. Some examples are:
• Rules regarding service events (Service Start, Service End, Service Com-
plaint);
• Rules regarding interaction events (Interaction Start, Interaction End);
• Rules regarding life cycle events (Start Up, Heartbeat Shut Down).
42

Big Data Analytics for Critical Infrastructure Monitoring
The parts composing this infrastructure are separable into two categories:
• A LB_Daemon for each system node;
• A set of LogBus services, useful to analyze system’s failures. These services
are related to the event flows collection, permanent event storage and ping
mechanisms.
This list can be enriched with any other analysis tool thanks to a mechanism of
event subscription: for example, the on-agent tool impements a timeout-based er-
ror detection approach.
The fundamental role assigned to LogBus is to act between the log function call
and the physical writing of the logs: records are not directly saved on the log file
but they are processed in real time by LogBus, so that they can be catalogued
according to predefined rules. LogBus also adds the Process ID, the timestamp
and the name of the node which called the log function.
Logs are therefore much more compact and easy to analyze: for example, to com-
pute the execution time of a certain service, it’s sufficient to subtract its SDW
(shutdown) timestamp from its SUP (startup) timestamp. LogBus is particularly
suitable to distributed systems due to its architecture and the fact that the function
it provides, called rb_log(), adds the calling node identifier and the Process ID to
the log record.
43
Chapter 3
Big Data Analytics
In this chapter we define Big Data Analytics and present some Big Data Analytics
Frameworks. Businesses are obviously very interested in this field, since being able
to discern unforeseen patterns in Big Data can constitute a marketing advantage
over the competition. These frameworks can be also used to develop software
tools aimed at analyzing the data produced by the system monitors, in order to
detect and thwart system violations, attacks and cyber terrorism.
3.1 Introduction
The word Analytics alone does not refer to Big Data, but simply to data analysis
techniques such as OLAP (On-Line Analytical Processing) and OLTP (On-Line
Transaction Processing).
44
Big Data Analytics for Critical Infrastructure Monitoring
Figure 3.1: A representation of OnLine Analytical Processing, not to be confusedwith Big Data Analytics
Big Data Analytics is the process of examining large amounts of data of a variety
of types at a high arrival rate (Big Data) to uncover hidden patterns, unknown
correlations and other useful information.
This discipline was probably born for monetary reasons: through the discovery of
hidden patterns in customers’ behavior, analysts could give their organizations a
marketing advantage over the competitors. The same technologies can however
been applied to different scopes.
Big Data Analytics can be performed with the software tools commonly used as
part of advanced analytics disciplines such as predictive analytics and data mining.
But the unstructured data sources used for big data analytics may not fit in tradi-
tional data warehouses. Furthermore, traditional data warehouses may not be able
to handle the processing demands posed by big data. As a result, a new class of
45
Big Data Analytics for Critical Infrastructure Monitoring
technologies has emerged and is being used in many big data analytics environ-
ments.
Big Data technologies can be divided into two groups:
• batch processing, which are analytics on huge sets of data: for example
MapReduce and Hadoop;
• stream processing, which are analytics on data in motion: for example Apache
Storm and Apache S4.
In the modern world, the output produced by the Monitoring tools and sensors
in a system can be overwhelming for the classic Analytics tools; therefore it is
necessary to step up and consider the Big Data Analytics frameworks.
3.2 MapReduce
MapReduce is a programming model designed by Google to process large data sets
with a parallel and distributed algorithm on a single node or a cluster of nodes.
MapReduce software is based on two main procedures:
• The Map() procedure performs filtering and sorting of the input data;
• The Reduce() procedure performs a summary operation on the filtered, sorted
data.
46
Big Data Analytics for Critical Infrastructure Monitoring
Figure 3.2: A representation of the MapReduce paradigm.
There is also the MapReduce System or Framework or Infrastructure that man-
ages the distributed servers, runs the various tasks in parallel, manages all the com-
munications and data transfer and provides redundancy and fault tolerance.
An example of a MapReduce could be the WordCount program, a simple applica-
tion that counts the occurrences of the words in a text. The Map() procedure:
1. reads the data (for example, from a large file),
2. divides it in <key, value> couples (for example, <dog, 1>),
3. sends these couples to the Reduce() procedure.
47
Big Data Analytics for Critical Infrastructure Monitoring
The Reduce() function:
1. receives all the keys with their respective values,
2. summarizes them with an operation (for example, summing all the received
ones for each key),
3. outputs the total number of occurrences for each word, for example <dog,
5>.
3.2.1 Apache Hadoop
Figure 3.3: Apache Hadoop logo
Apache Hadoop is an open-source software implementation of the MapReduce
model, for the storage and the large-scale batch processing of data-sets (Big Data
Analytics) on clusters built with commodity hardware. Hadoop is an Apache top-
level project being built and used by a global community of contributors and users
[7].
Failures are detected within the application level: this allows the delivery of a high
availability service to a computer cluster where each node can fail at any time,
being on commodity hardware.
48
Big Data Analytics for Critical Infrastructure Monitoring
3.2.1.1 Hadoop Architecture
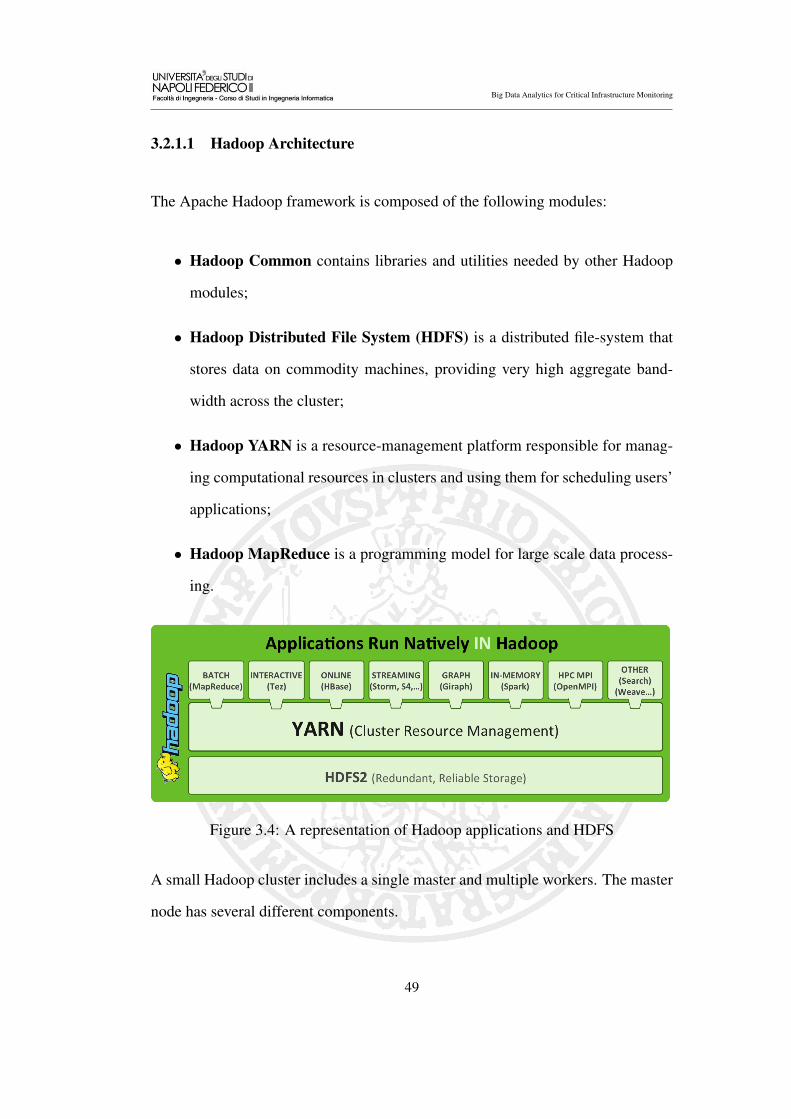
The Apache Hadoop framework is composed of the following modules:
• Hadoop Common contains libraries and utilities needed by other Hadoop
modules;
• Hadoop Distributed File System (HDFS) is a distributed file-system that
stores data on commodity machines, providing very high aggregate band-
width across the cluster;
• Hadoop YARN is a resource-management platform responsible for manag-
ing computational resources in clusters and using them for scheduling users’
applications;
• Hadoop MapReduce is a programming model for large scale data process-
ing.
Figure 3.4: A representation of Hadoop applications and HDFS
A small Hadoop cluster includes a single master and multiple workers. The master
node has several different components.
49
Big Data Analytics for Critical Infrastructure Monitoring
• A JobTracker, the service within Hadoop that farms out MapReduce tasks
to specific nodes in the cluster, ideally the nodes that have the data, or at
least are in the same rack. In the latest versions (2.x) the JobTracker has
been renamed to ResourceManager.
• A TaskTracker, a node in the cluster that accepts tasks - Map, Reduce and
Shuffle operations - from a JobTracker. In the latest version, the TaskTracker
has been renamed to NodeManager.
• A NameNode, the centerpiece of an HDFS file system. It keeps the directory
tree of all files in the file system, and tracks where, across the cluster, the file
data is kept. It does not store the data of these files itself.
• A DataNode, which stores data in the Hadoop File System. A functional file
system has more than one DataNode, with data replicated across them.
A slave or worker node acts as both a DataNode and TaskTracker\NodeManager,
though it is possible to have data-only worker nodes and compute-only worker
nodes.
In a larger cluster, the HDFS is managed through a dedicated NameNode server
which hosts the file system index, and a secondary NameNode that can generate
snapshots of the namenode’s memory structures, thus preventing file system cor-
ruption and decreasing data loss. Similarly, a standalone JobTracker\ResourceManager
server can manage job scheduling.
50
Big Data Analytics for Critical Infrastructure Monitoring
3.2.1.2 Hadoop Distributed File System (HDFS)
The Hadoop distributed file system (HDFS) is a distributed, scalable and portable
file-system written in Java for the Hadoop framework. Every Hadoop node has a
single NameNode; a cluster of DataNodes form the HDFS cluster.
Every DataNode sends the data blocks via TCP\IP connection, using a block pro-
tocol which is specific for HDFS; the clients use RPC to communicate. HDFS
stores big files (even terabytes) on multiple nodes. For reliability reasons, HDFS
replicates the files on multiple hosts (the default number is 3). Data nodes can then
interact with one another to rebalance the files, move the copies and keep the data
replication to an optimal level.
HDFS does not comply with the POSIX standards to pursue the goal of a better
performance and to support non-POSIX operations like Append.
HDFS has a property named Data Awareness: the operations are executed directly
from the hosts which store the data. The nodes know the positioning of the data on
the cluster, so they can automatically balance the load by sending the jobs using
certain files to the nodes which physically store such files, therefore reducing the
necessary network bandwidth.
3.2.1.3 The MapReduce engine
The MapReduce engine is composed of a JobTracker\ResourceManager, to which
client applications submit MapReduce jobs. The JobTracker\ResourceManager
51
Big Data Analytics for Critical Infrastructure Monitoring
then pushes the jobs to the available TaskTracker\NodeManager nodes in the clus-
ter. As previously said, the work must be kept as close as possible to the data
to reduce bandwidth usage: this is implemented with a rack-aware system. The
JobTracker\ResourceManager knows which node hosts the data and the system
topology, so it can send the jobs to the nearby machines.
A possible issue created by this architecture is that the allocation of the jobs to the
various TaskTrackers\NodeManagers is very simple: they have a defined number of
slots (for example, 4) and every map or reduce task takes one slot. There is no con-
sideration of the weight or the length of the jobs, so if a TaskTracker\NodeManager
is very slow, it could delay the whole MapReduce job.
3.2.1.4 Example
Algorithms 3.1 and 3.2 show a basic Word Count program implemented for Hadoop.
The mapper receives the input line and splits it into words. Such words are then
sent to the Reducer, which in turn counts them and outputs the number of occur-
rences for each input word.
52
Big Data Analytics for Critical Infrastructure Monitoring
Algorithm 3.1 Java code for the Hadoop WordCount Mapper
p u b l i c vo id map ( LongWr i t ab l e key , Text va lue ,C o n t e x t c o n t e x t )
t h ro ws IOExcep t ion , I n t e r r u p t e d E x c e p t i o n {S t r i n g l i n e = v a l u e . t o S t r i n g ( ) ;S t r i n g T o k e n i z e r t o k e n i z e r = new
S t r i n g T o k e n i z e r ( l i n e ) ;w h i l e ( t o k e n i z e r . hasMoreTokens ( ) ) {
word . s e t ( t o k e n i z e r . nex tToken ( ) ) ;c o n t e x t . w r i t e ( word , one ) ;
}}
Algorithm 3.2 Java code for the Hadoop WordCount Reducer
p u b l i c vo id r e d u c e ( Text key , I t e r a b l e < I n t W r i t a b l e >v a l u e s , C o n t e x t c o n t e x t )
t h ro ws IOExcep t ion , I n t e r r u p t e d E x c e p t i o n {i n t sum = 0 ;f o r ( I n t W r i t a b l e v a l : v a l u e s ) {
sum += v a l . g e t ( ) ;}c o n t e x t . w r i t e ( key , new I n t W r i t a b l e ( sum ) ) ;
}
3.3 Apache Storm
Figure 3.5: Apache Storm logo
Storm is another Apache project, originally written by Nathan Marz for BackType
53

Big Data Analytics for Critical Infrastructure Monitoring
and then open sourced after being acquired by Twitter in 2013, which in turn sub-
mitted it to Apache Incubator.
Storm is a free and open source distributed real time computation system, written
predominantly in the Clojure programming language. It makes it easy to reliably
process unbounded streams of data, doing for realtime processing what Hadoop did
for batch processing: Storm provides a set of general primitives for doing realtime
computation.
Apache Storm exposes to the programmer a set of primitives for doing realtime
computation of data streams.
The key properties of Storm are:
• Extremely broad set of use cases: Storm can be used for processing mes-
sages and updating databases (stream processing), doing a continuous query
on data streams and streaming the results into clients (continuous computa-
tion), parallelizing an intense query like a search query on the fly (distributed
RPC), and more.
• Scalable: Storm scales to huge numbers of messages per second. To scale
a topology, it’s only necessary to add machines and increase the parallelism
settings of the topology. As an example of Storm’s scale, one of Storm’s
initial applications processed 1,000,000 messages per second on a 10 node
cluster, including hundreds of database calls per second as part of the topol-
ogy. Storm’s usage of Zookeeper for cluster coordination makes it scale to
much larger cluster sizes.
54

Big Data Analytics for Critical Infrastructure Monitoring
• Guarantees no data loss: a realtime system must have strong guarantees
about data being successfully processed. A system that drops data has a
very limited set of use cases. Storm guarantees that every message will be
processed, and this is in direct contrast with other systems like S4.
• Extremely robust: it is an explicit goal of the Storm project to make the
user experience of managing Storm clusters as painless as possible.
• Fault-tolerant: if there are faults during the computation, Storm will reas-
sign tasks as necessary. It also makes sure that a computation can run forever
(or until it’s killed).
• Programming language agnostic: robust and scalable realtime processing
should not be limited to a single platform. Storm topologies and processing
components can be defined in any language, making Storm accessible to
nearly anyone.
3.3.1 Components of a Storm cluster
A Storm cluster is superficially similar to a Hadoop cluster, but works in a funda-
mentally different way: a Storm cluster is designed to process unbounded streams
and stay alive until the administrator kills it.
To do realtime computation on Storm, Topologies are created. A topology is a
graph of computation: each node in a topology contains processing logic, and links
between nodes indicate how data should be passed between nodes. Topologies are
55

Big Data Analytics for Critical Infrastructure Monitoring
defined through XML files or directly by the programmer in Java or any other
language.
A topology can be run in local mode or in cluster mode. Local mode is usually
used by developers to test their projects, and is usually defined with the help of
the LocalCluster Java class. Cluster mode is used for the actual deployment of the
application, and is usually defined and submitted through the StormSubmitter and
TopologyBuilder classes.
Storm’s data model is a set of tuples. A tuple is a named list of values: a field in
a tuple can be an object of any simple tipe (e.g. in Java, Strings Byte Arrays or
Integers but not Arrays of other types).
The core abstraction in Storm is the stream. A stream is an unbounded sequence
of tuples. Storm provides the primitives for transforming an input stream into an
output stream in a distributed and reliable way.
There are two kinds of nodes on a Storm cluster: the master node and the worker
nodes.
• The master node runs a daemon called Nimbus which is similar to Hadoop’s
JobTracker. Nimbus is responsible for distributing code throughout the clus-
ter, assigning tasks to machines, and monitoring for failures.
• Each worker node runs a daemon called the Supervisor. The supervisor
listens for work assigned to its machine and starts and stops worker processes
as necessary, based on what Nimbus has assigned to it. Each worker process
56

Big Data Analytics for Critical Infrastructure Monitoring
executes a subset of a topology; a running topology consists of many worker
processes spread across many hosts in a cluster.
• All coordination between Nimbus and the Supervisors is done through a
Zookeeper cluster. Zookeeper is an Apache project for maintaining con-
figuration information, naming, providing distributed synchronization, and
providing group services to clusters. Additionally, the Nimbus daemon and
Supervisor daemons are fail-fast and stateless; all state is kept in Zookeeper
or on local disk. This increases Storms’ robustness and stability: if Nimbus
or Supervisor processes crash, they’ll start back without causing issues.
• Storm can also execute a User Interface daemon, which replies to http
requests from web browsers and lets administrator control the cluster and
check its state.
3.3.1.1 Spouts and Bolts
The basic primitives Storm provides for doing stream transformations are spouts
and bolts. Spouts and bolts have interfaces that can be implemented, e.g. in Java,
to run the application-specific logic.
A spout is a source of streams; for example, a spout may read lines from of a file
or as input in a Socket and emit them as a tuple stream.
A bolt consumes any number of input streams, does its processing work, and is
able to emit new output streams. Complex stream transformations, like computing
a stream of trending topics from a stream of tweets from Twitter, require multiple
57
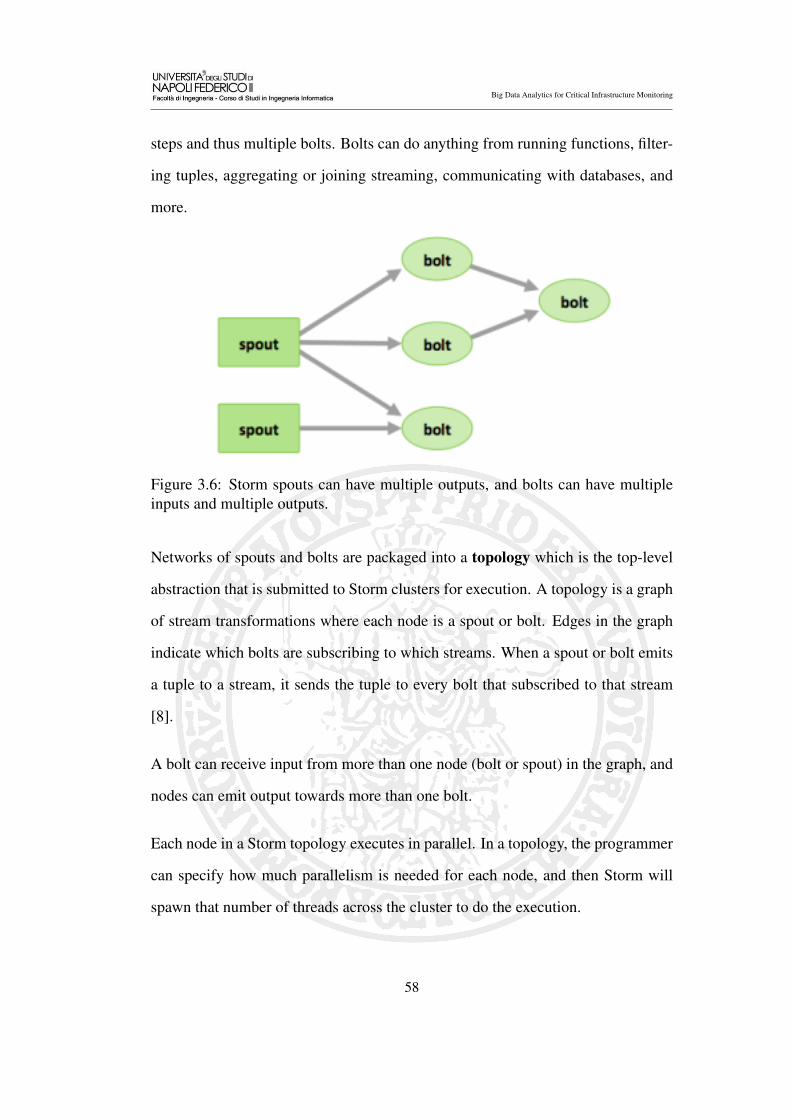
Big Data Analytics for Critical Infrastructure Monitoring
steps and thus multiple bolts. Bolts can do anything from running functions, filter-
ing tuples, aggregating or joining streaming, communicating with databases, and
more.
Figure 3.6: Storm spouts can have multiple outputs, and bolts can have multipleinputs and multiple outputs.
Networks of spouts and bolts are packaged into a topology which is the top-level
abstraction that is submitted to Storm clusters for execution. A topology is a graph
of stream transformations where each node is a spout or bolt. Edges in the graph
indicate which bolts are subscribing to which streams. When a spout or bolt emits
a tuple to a stream, it sends the tuple to every bolt that subscribed to that stream
[8].
A bolt can receive input from more than one node (bolt or spout) in the graph, and
nodes can emit output towards more than one bolt.
Each node in a Storm topology executes in parallel. In a topology, the programmer
can specify how much parallelism is needed for each node, and then Storm will
spawn that number of threads across the cluster to do the execution.
58

Big Data Analytics for Critical Infrastructure Monitoring
3.3.2 Parallelism in Storm
A machine in a Storm cluster may run one or more worker processes for one or
more topologies; each worker process runs executors for a specific topology. Ex-
ecutors are threads spawned by the worker process: one or more executors may
run within a single worker process. These threads can run one or more tasks of the
same component (spout or bolt).
There are several configuration options in Storm, and each can be set through dif-
ferent procedures: editing a particular storm.yaml file, topology-specific configu-
ration or component-specific configuration:
• Number of worker processes: how many worker processes to create for a
single topology across machines in the cluster.
• Number of executors (threads): how many threads to spawn per compo-
nent (spout or bolt).
• Number of tasks: how many tasks to create per component. A task performs
the actual data processing and is run within its parent executor’s thread of
execution.
For example, in Java, the following line could be written:
Algorithm 3.3 Code snippet to show parallelism in Storm
t o p o l o g y B u i l d e r . s e t B o l t ( " green−b o l t " , new GreenBo l t ( ) , 2 ). setNumTasks ( 4 ). s h u f f l e G r o u p i n g ( " b lue−s p o u t " ) ;
59
Big Data Analytics for Critical Infrastructure Monitoring
After executing this code, the TopologyBuilder would configure Storm to run the
GreenBolt bolt with an initial number of two executors (threads) and four associ-
ated tasks. Storm will run therefore two tasks per thread, because there are two
threads and four tasks. The default number of tasks per thread is one.
3.3.3 Example
Algorithm 3.4 shows the execute() Java function of a Storm Bolt for the execution
of the Word Count algorithm. The HashMap counts holds the information on the
past words and the number of their occurrences. The execute() function checks if
the input word has already been listed and increments its counter. This function
assumes that the Spout is splitting the sentences into single words, similarly to the
Hadoop WordCount Mapper.
Algorithm 3.4 Java code for the Storm WordCount Example
p u b l i c vo id e x e c u t e ( Tuple t u p l e ,B a s i c O u t p u t C o l l e c t o r c o l l e c t o r ) {
S t r i n g word = t u p l e . g e t S t r i n g ( 0 ) ;I n t e g e r c o u n t = c o u n t s . g e t ( word ) ;i f ( c o u n t == n u l l )
c o u n t = 0 ;c o u n t ++;c o u n t s . p u t ( word , c o u n t ) ;c o l l e c t o r . emi t ( new Values ( word , c o u n t ) ) ;
}
60
Big Data Analytics for Critical Infrastructure Monitoring
Figure 3.7: Apache S4 logo
3.4 Apache S4
S4 is a general-purpose, distributed, scalable, fault-tolerant, pluggable platform
that allows programmers to easily develop applications for processing continuous
unbounded streams of data. S4 was initially released by Yahoo! Inc. in October
2010, but is now in the Apache Incubator project like Storm [9].
The key features of S4 are:
• Flexible deployment: application packages are standard jar files (suffixed
.s4r), while platform modules for customizing the platform are standard jar
files. Keys are homogeneously sparsed over the cluster to help balancing the
load.
• Modular design: both the platform and the applications are configured
through independent modules. This makes it easy to customize the system
according to specific requirements.
• Dynamic and loose coupling: S4 uses a publisher-subscriber mechanism
which makes it easy to assemble subsystems into larger systems, reuse ap-
plications, separate preprocessing and update the subsystems independently.
61

Big Data Analytics for Critical Infrastructure Monitoring
Work is evenly distributed among processing nodes, and any node can do
any work.
• Fault tolerance: fail-over, checkpointing and recovery mechanisms are present
for high availability and minimizing state loss.
• Use of Java Objects: it does not need to specify tuples or other special
types.
• Configuration through an XML-like file.
S4 is based on Zookeeper to provide distributed synchronization and manage the
cluster.
3.4.1 Components of a S4 cluster
Programmers can develop Java S4 applications and deploy them on S4 clusters.
Applications are represented by graphs of:
• Processing Elements, which are the basic nodes of the graph. They can
receive an input, process it and produce an output: they are the core of S4
applications. One Processing Element can have more than one input and
more than one output.
• Streams that interconnect the Processing Elements, representing inputs and
outputs. External streams are special kinds of streams that send events out-
side of the application or receive events from external sources, for interoper-
ability.
62

Big Data Analytics for Critical Infrastructure Monitoring
S4 provides a runtime distributed platform that handles communication, scheduling
and distribution across containers which are called S4 nodes. These nodes are
deployed on S4 clusters, which define named sets of nodes.
In other words, S4 applications are composed of Processing Elements linked by
streams, and a S4 application is deployed on a set of nodes called cluster.
3.4.2 Parallelism in S4
Parallelism can be defined in Apache S4 by specifying the number of tasks. Be-
fore starting S4 nodes, a logical cluster must be defined by specifying a name, the
number of partitions (tasks) and an initial port number for listener sockets. For
example, the cluster cluster1 with 2 tasks and initial port 12000 can be defined by
giving the following command:
Algorithm 3.5 Example of a command to create a new logical cluster in S4
. / s4 n e w C l u s t e r −c= c l u s t e r 1 −nbTasks =2 − f l p =12000
Load balancing is automatically performed among tasks.
63

Chapter 4
Design and Development of Security
Monitoring Tools
In this chapter we present possible solutions to the issues described in the previous
chapters, i.e. the online analysis of the data generated by monitors and sensors in
order to detect attacks and cyber crimes while they are happening. The design and
implementation of two different tools is presented: an online security tool based
on Bayesian inference, implemented on Hadoop, Storm and S4, and an online
monitoring tool based on statistical analysis, implemented on Storm.
4.1 Security Monitoring and Control
As stated in the previous chapters, online (or even real-time) identification of com-
promised users logged in a data center is the natural evolution of the same offline
64

Big Data Analytics for Critical Infrastructure Monitoring
system and can be extremely useful to help reducing the damage caused by mali-
cious access to a critical infrastructure.
Some examples of software tools which are currently used to protect the cyber se-
curity of infrastructures are Intrusion Detection Systems (IDS), file integrity mon-
itors, Security Information and Event Management (SIEM). These tools generate
high numbers of security alerts which often represent false positives [20]. Other
kinds of collected data are represented by normal usage patterns and network be-
havior profiling.
Correlating data collected from different sources, e.g. using statistical analysis
techniques, can be a much more effective way to detect anomalies, intrusions and
attacks. This is even truer for critical infrastructures, which must be closely moni-
tored and can generate even bigger amounts of alerts and usage data: for this reason
it’s helpful to think of the generated data as Big Data. We can now apply the same
Big Data Analytics frameworks and techniques to address this issue.
An example of the application of Big Data Analytics is the NAPOLI FUTURA
project, which aims to improve the security of Critical Infrastructures by:
1. Evaluate the vulnerabilities in such infrastructures, which are used for daily
operations, social activities and national services to define their level of se-
curity and identify what could be done to improve it;
2. Design a monitoring and control system (SMC) based on off-the-shelf com-
ponents which aims to detect cyber attacks and start the correct protection
action;
65
Big Data Analytics for Critical Infrastructure Monitoring
3. Guarantee the security of the critical system through virtual resource migra-
tion mechanisms.
4.2 Requirements
In the following, we focus on the design and implementation of online security
tools, based on Big Data Analytics frameworks, to perform the correlation analysis
of different streams of input data.
These tools must be able to receive input data streams, real or simulated, and apply
analytics algorithms to determine whether the monitored system is in danger. The
designed tools must be built on Big Data Analytics frameworks to ensure the ca-
pability to analyze massive quantities of data in a short time. The tools must also
be able to:
• Receive data streams continuously;
• Perform the analysis in real time (i.e. the analysis rate must be faster than
the data arrival rate);
• Apply correlation techniques to analyze the different input data streams;
• Present human readable outputs which highlight possible threats to the criti-
cal infrastructure;
• Reduce the false positive alerts (i.e. alerts which do not correspond to actual
threats) to a minimum.
66

Big Data Analytics for Critical Infrastructure Monitoring
4.3 Design
The capability of analyzing logs in real time is a step towards the design of the
Monitoring and Control System. Its general architecture is depicted in Figure4.1.
Raw data is collected from the critical infrastructure: system and network moni-
tors, Intrusion Detection Systems alerts, Application System logs, Environmental
measurements and other types of data are collected and sent to the Big Data An-
alytics tools developed on Frameworks like Apache Storm or Apache Hadoop.
These tools analyze the data and can execute a distributed consensus algorithm to
detect attacks or abnormal user behavior with remarkable precision by applying
several analysis techniques at the same time. A Knowledge Base can be useful
to store configuration parameters or thresholds needed for the Big Data Analytics
tools. After the analysis is completed and unusual patterns are discovered, alerts
can be automatically sent to human operators or automated countermeasures (e.g.
migration of the virtual resources) can be taken. The two specific blocks in the Big
Data Analytic Frameworks section of the architecture, Correlation Analysis and
Bayesian Inference, are the two algorithms discussed in this thesis.
67
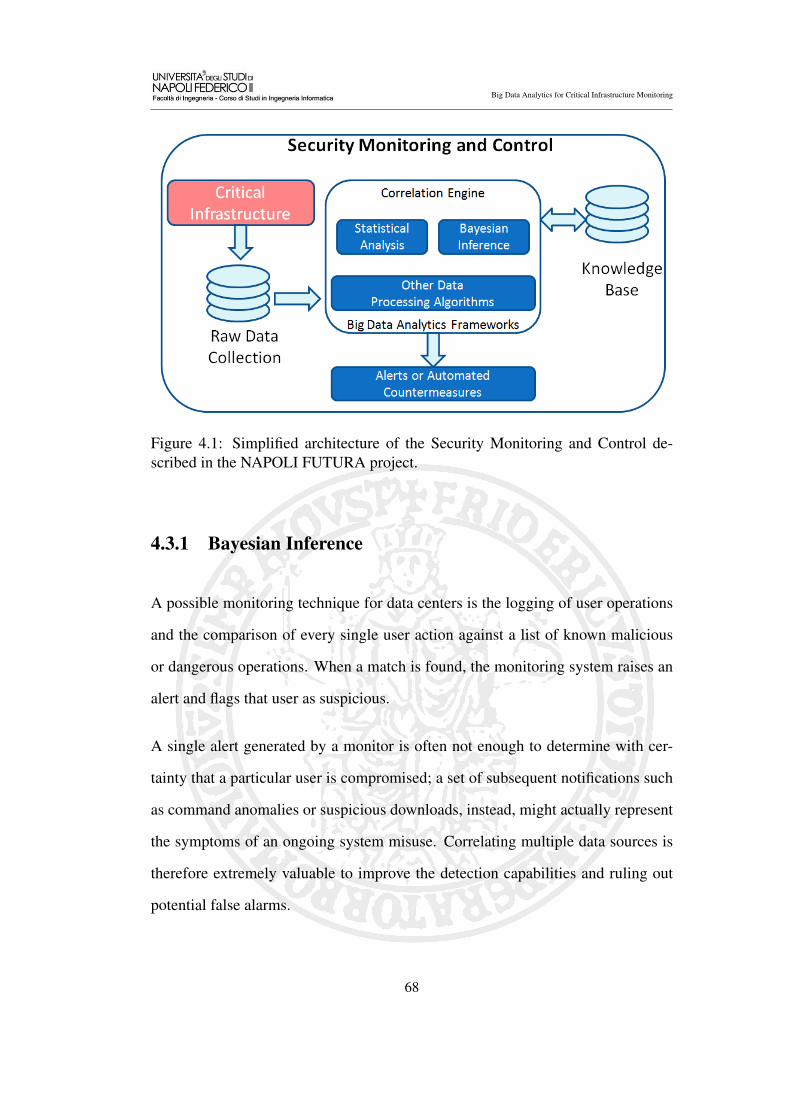
Big Data Analytics for Critical Infrastructure Monitoring
Figure 4.1: Simplified architecture of the Security Monitoring and Control de-scribed in the NAPOLI FUTURA project.
4.3.1 Bayesian Inference
A possible monitoring technique for data centers is the logging of user operations
and the comparison of every single user action against a list of known malicious
or dangerous operations. When a match is found, the monitoring system raises an
alert and flags that user as suspicious.
A single alert generated by a monitor is often not enough to determine with cer-
tainty that a particular user is compromised; a set of subsequent notifications such
as command anomalies or suspicious downloads, instead, might actually represent
the symptoms of an ongoing system misuse. Correlating multiple data sources is
therefore extremely valuable to improve the detection capabilities and ruling out
potential false alarms.
68

Big Data Analytics for Critical Infrastructure Monitoring
The next necessary step for the automation of the log analysis in the context of
alerts is the definition of a data structure called user\alerts table, which provides,
for each user that has logged into the system during the observation period, an N-
bit vector representing the alerts raised by that user. For example, if there are 14
possible alerts and User1 has generated the alerts 1 and 4, its corresponding row in
the table will be [10010000000000].
It is possible to use a naïve Bayesian network to compute the probability that a
certain user is compromised, given its user\alerts table row. A Bayesian network
is a direct acyclic graph where each node represents a variable of interest in the
reference domain. The network allows estimating the probability of one or more
hypothesis variables, given the evidence provided by a set of information variables.
In this context, the hypothesis variable is “the user is compromised”, while the
information variables are the alerts related to the user.
In our case, it is sufficient to build a naïve Bayesian network, i.e. a Bayesian
network where information variables do not influence each other.
By means of such Bayesian network, given a user and the related vector of alerts,
it is possible to answer to the following question: “What is the probability P(C) for
a certain user to be compromised, given that the user is responsible for 0 or more
alerts?”. An example of the formula used to compute this probability, reduced to
four alerts for compactness reasons, is the following:
P(C|A1A2A3A4)=P(A1|C)P(A2|C)P(A3|C)P(A4|C)
P(A1|C)P(A2|C)P(A3|C)P(A4|C)+P(A1|C)P(A2|C)P(A3|C)P(A4|C)
In this formula, the mark over a letter implies its negation and P(A|C) represents
69
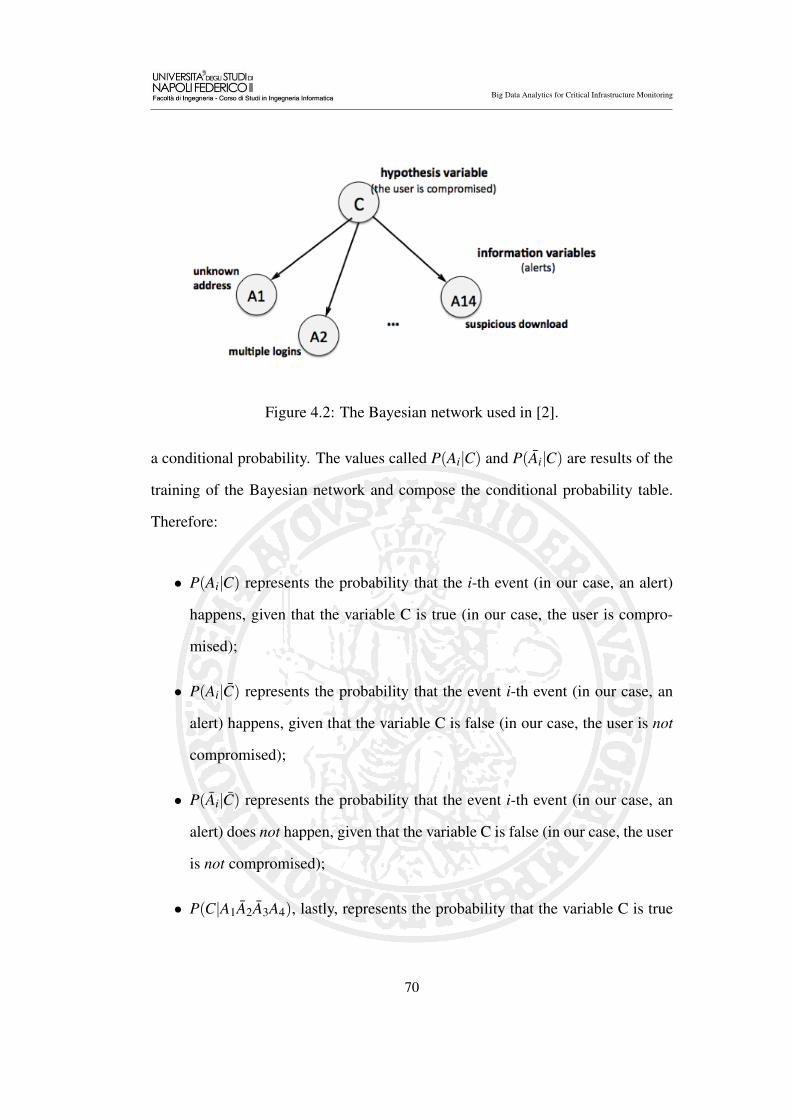
Big Data Analytics for Critical Infrastructure Monitoring
Figure 4.2: The Bayesian network used in [2].
a conditional probability. The values called P(Ai|C) and P(Ai|C) are results of the
training of the Bayesian network and compose the conditional probability table.
Therefore:
• P(Ai|C) represents the probability that the i-th event (in our case, an alert)
happens, given that the variable C is true (in our case, the user is compro-
mised);
• P(Ai|C) represents the probability that the event i-th event (in our case, an
alert) happens, given that the variable C is false (in our case, the user is not
compromised);
• P(Ai|C) represents the probability that the event i-th event (in our case, an
alert) does not happen, given that the variable C is false (in our case, the user
is not compromised);
• P(C|A1A2A3A4), lastly, represents the probability that the variable C is true
70

Big Data Analytics for Critical Infrastructure Monitoring
(in our case, the user is compromised) given that A1 and A4 happened while
A2 and A3 did not.
This algorithm was already implemented offline in [2], but the goal of this work
is to scale the input up and find a way to process it in a stream, which means
that the alerts are analyzed when they are generated, and not several days later.
Real time detection of intrusions and malicious users is thus possible, thanks to an
online analysis algorithm based on a Bayesian network which was implemented
on Hadoop, Storm and S4.
A comparison among the implementations of this algorithm on the three described
frameworks and some remarks from various perspectives is presented in the next
sections.
4.3.2 Statistical Correlation Analysis
Another kind of design can be used to build a tool based on statistical correlation. A
more generic case is represented by the monitoring of internal and environmental
parameters in a critical system; for example, monitors could keep track of the
number of open file descriptors, the memory occupied by a certain application,
the CPU percentage load, the network traffic (i.e. packets sent and received), the
temperature of the data center, etc. While these parameters could not mean much
when observed individually, the study of their statistical correlation can be much
more useful to detect attacks to the system and malicious use in general.
It is therefore possible to build a tool which is capable of analyzing the correlation
among these input data streams, in terms of variance, correlation, auto-correlation
71
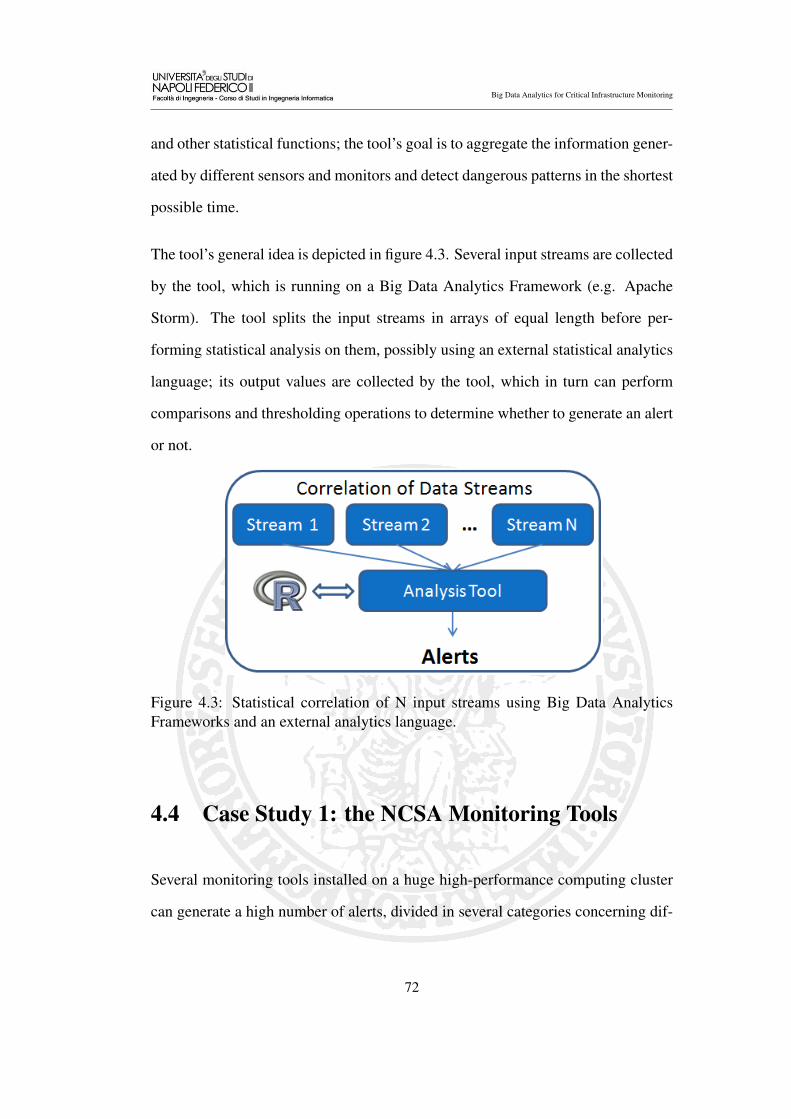
Big Data Analytics for Critical Infrastructure Monitoring
and other statistical functions; the tool’s goal is to aggregate the information gener-
ated by different sensors and monitors and detect dangerous patterns in the shortest
possible time.
The tool’s general idea is depicted in figure 4.3. Several input streams are collected
by the tool, which is running on a Big Data Analytics Framework (e.g. Apache
Storm). The tool splits the input streams in arrays of equal length before per-
forming statistical analysis on them, possibly using an external statistical analytics
language; its output values are collected by the tool, which in turn can perform
comparisons and thresholding operations to determine whether to generate an alert
or not.
Figure 4.3: Statistical correlation of N input streams using Big Data AnalyticsFrameworks and an external analytics language.
4.4 Case Study 1: the NCSA Monitoring Tools
Several monitoring tools installed on a huge high-performance computing cluster
can generate a high number of alerts, divided in several categories concerning dif-
72

Big Data Analytics for Critical Infrastructure Monitoring
ferent users. In the case study presented in [2] fourteen different alert categories
generated by monitoring tools used by the NCSA (National Center for Supercom-
puting Applications, University of Illinois) are introduced. They are shown in table
4.1.
73
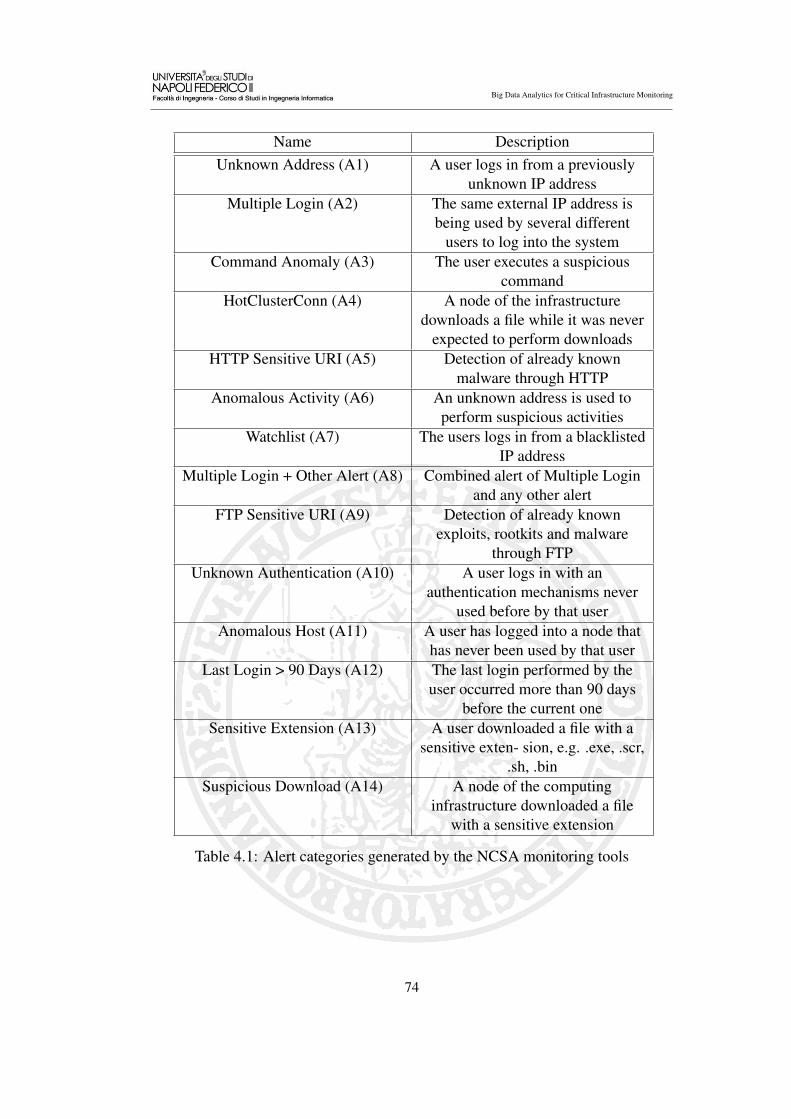
Big Data Analytics for Critical Infrastructure Monitoring
Name DescriptionUnknown Address (A1) A user logs in from a previously
unknown IP addressMultiple Login (A2) The same external IP address is
being used by several differentusers to log into the system
Command Anomaly (A3) The user executes a suspiciouscommand
HotClusterConn (A4) A node of the infrastructuredownloads a file while it was never
expected to perform downloadsHTTP Sensitive URI (A5) Detection of already known
malware through HTTPAnomalous Activity (A6) An unknown address is used to
perform suspicious activitiesWatchlist (A7) The users logs in from a blacklisted
IP addressMultiple Login + Other Alert (A8) Combined alert of Multiple Login
and any other alertFTP Sensitive URI (A9) Detection of already known
exploits, rootkits and malwarethrough FTP
Unknown Authentication (A10) A user logs in with anauthentication mechanisms never
used before by that userAnomalous Host (A11) A user has logged into a node that
has never been used by that userLast Login > 90 Days (A12) The last login performed by the
user occurred more than 90 daysbefore the current one
Sensitive Extension (A13) A user downloaded a file with asensitive exten- sion, e.g. .exe, .scr,
.sh, .binSuspicious Download (A14) A node of the computing
infrastructure downloaded a filewith a sensitive extension
Table 4.1: Alert categories generated by the NCSA monitoring tools
74

Big Data Analytics for Critical Infrastructure Monitoring
These alerts are stored in timestamped logs generated by the monitoring tools. In
order to test the implemented tools on very large amounts of data, and because the
original data is not available, the frequency distribution of alerts described in [2] is
used to build an Alert Generator tool. This tool generates a configurable amount of
alerts, pertaining a configurable number of users, in the span of one day: a simple
uniform pseudo-random number generator (i.e. the Random class in Java) is used
to generate the alerts in order to respect the NCSA frequency distribution.
The following is an example of the tool’s output:
mag 05 2 0 : 0 0 : 0 7 A l e r t 1 from u s e r 2189755
mag 05 2 0 : 0 0 : 0 8 A l e r t 1 from u s e r 1904547
mag 05 2 0 : 0 0 : 0 8 A l e r t 6 from u s e r 1951219
mag 05 2 0 : 0 0 : 0 8 A l e r t 1 from u s e r 1076514
mag 05 2 0 : 0 0 : 0 8 A l e r t 9 from u s e r 242299
mag 05 2 0 : 0 0 : 0 9 A l e r t 1 from u s e r 2044108
mag 05 2 0 : 0 0 : 0 9 A l e r t 2 from u s e r 487991
mag 05 2 0 : 0 0 : 0 9 A l e r t 1 from u s e r 473321
mag 05 2 0 : 0 0 : 1 0 A l e r t 2 from u s e r 2355882
mag 05 2 0 : 0 0 : 1 0 A l e r t 2 from u s e r 654925
Bayesian networks have to be trained, therefore a ground truth is necessary. In this
case, the ground truth used for training is represented by a subset of the known
incidents reported by the NCSA during the observation period (5 out of 16). The
training set adopted in [2] consists of 717 users and corresponding bit vectors, 6
of which are compromised. The training stage allows tuning of necessary net-
work parameters: the a-priori probability of the hypothesis variable, called P(C) or
75
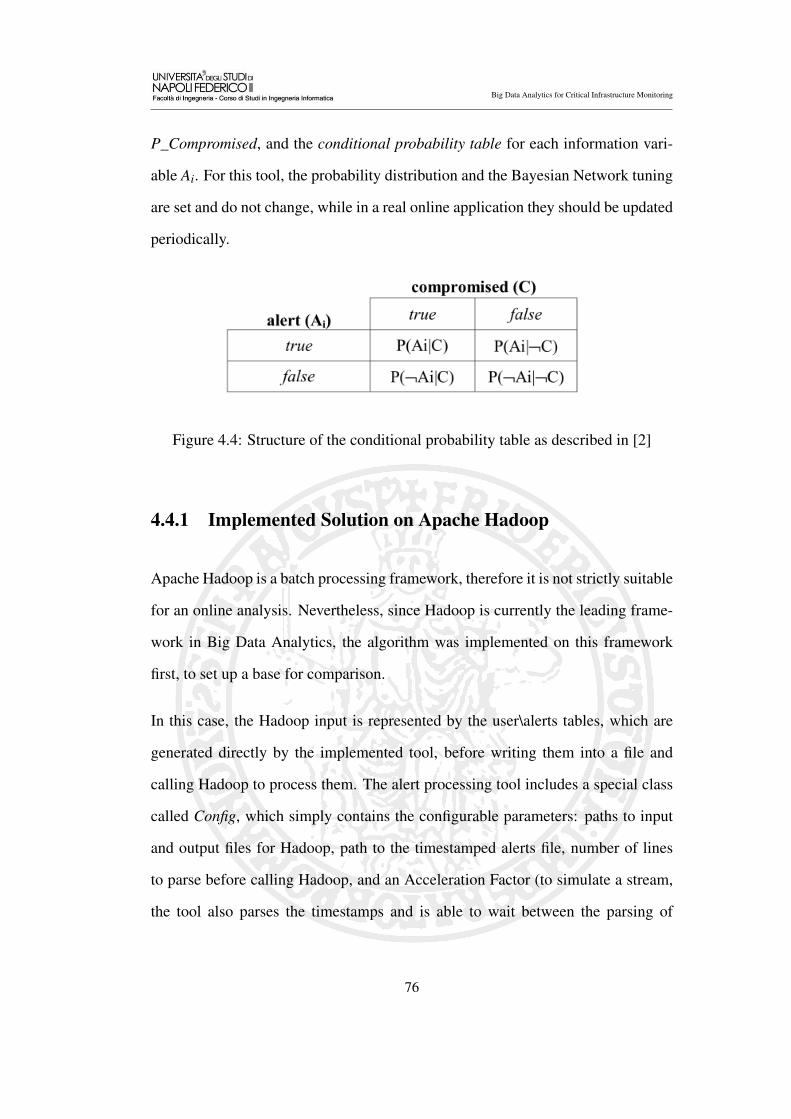
Big Data Analytics for Critical Infrastructure Monitoring
P_Compromised, and the conditional probability table for each information vari-
able Ai. For this tool, the probability distribution and the Bayesian Network tuning
are set and do not change, while in a real online application they should be updated
periodically.
Figure 4.4: Structure of the conditional probability table as described in [2]
4.4.1 Implemented Solution on Apache Hadoop
Apache Hadoop is a batch processing framework, therefore it is not strictly suitable
for an online analysis. Nevertheless, since Hadoop is currently the leading frame-
work in Big Data Analytics, the algorithm was implemented on this framework
first, to set up a base for comparison.
In this case, the Hadoop input is represented by the user\alerts tables, which are
generated directly by the implemented tool, before writing them into a file and
calling Hadoop to process them. The alert processing tool includes a special class
called Config, which simply contains the configurable parameters: paths to input
and output files for Hadoop, path to the timestamped alerts file, number of lines
to parse before calling Hadoop, and an Acceleration Factor (to simulate a stream,
the tool also parses the timestamps and is able to wait between the parsing of
76

Big Data Analytics for Critical Infrastructure Monitoring
two different lines with different timestamps according to the difference of said
timestamps).
The implemented Hadoop tool follows these steps:
1. It instantiates an object of the HDFSClient Class (written ad hoc), which is
used to control the HDFS; it offers file creation, removal and copy\pasting to
and from the user’s regular File System.
2. It instantiates and runs a LogStreamer thread, which constitutes the core
point of the program.
3. The LogStreamer thread parses the log lines in the input file and updates a
data structure (in this case, a HashTable in Java) with the new alert. The
HashTable is a list of <key,value> couples: in this tool, the key is the user
name and the value is its alert array. For example, if user 100’s alert array
was {1,0,0,0,0,0,0,0,0,0,0,0,0,0} and the alert 7 for user 100 is contained in
the newest parsed line, the updated array will be {1,0,0,0,0,0,1,0,0,0,0,0,0,0}.
4. After a certain number of parsed lines (for example 10.000 or 50.000.000)
the thread pauses the parsing and writes the entire updated HashTable to a
file. The file is then copied, using the HDFSClient, to a DFS folder. Setting
this number in the Config class allows users to simulate a stream of input
logs for the online analysis.
5. Hadoop is finally called: the Mapper function reads each line and passes
the couple <username, alert> to the Reducer function for each alert. The
77
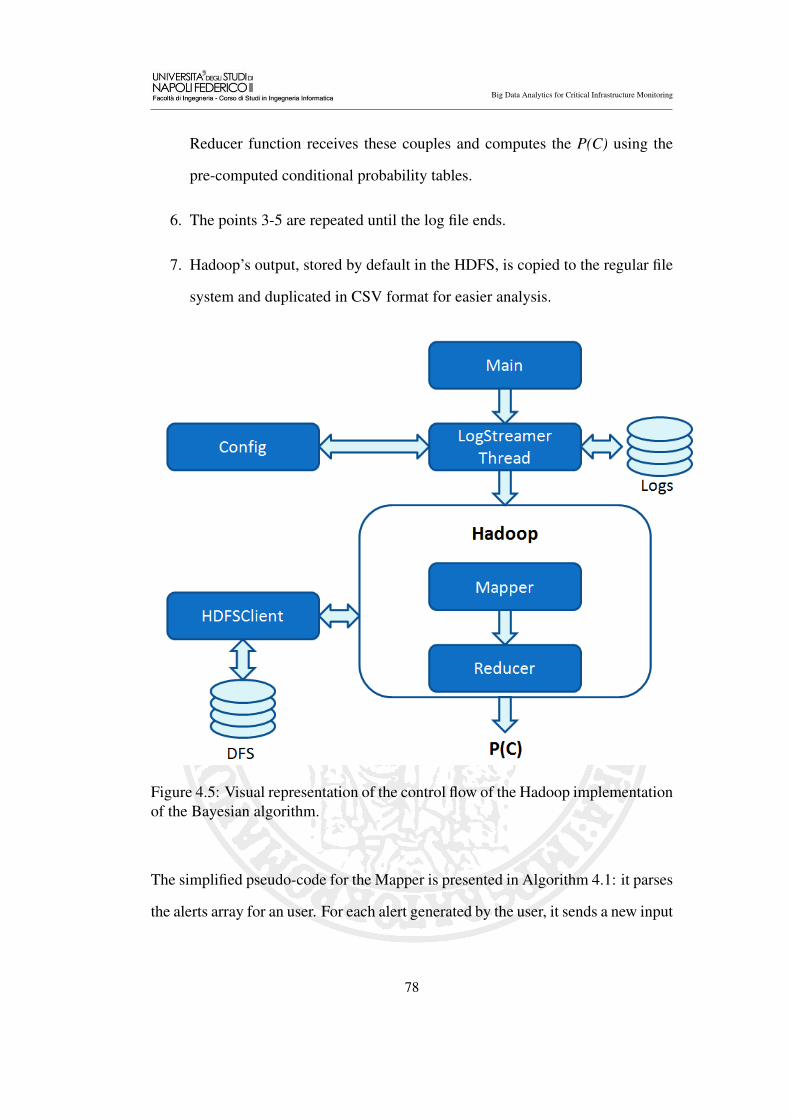
Big Data Analytics for Critical Infrastructure Monitoring
Reducer function receives these couples and computes the P(C) using the
pre-computed conditional probability tables.
6. The points 3-5 are repeated until the log file ends.
7. Hadoop’s output, stored by default in the HDFS, is copied to the regular file
system and duplicated in CSV format for easier analysis.
Figure 4.5: Visual representation of the control flow of the Hadoop implementationof the Bayesian algorithm.
The simplified pseudo-code for the Mapper is presented in Algorithm 4.1: it parses
the alerts array for an user. For each alert generated by the user, it sends a new input
78
Big Data Analytics for Critical Infrastructure Monitoring
to the Reducer.
The simplified pseudo-code for the Reducer is presented in Algorithm 4.2: it pre-
pares the two factors needed for the computation of every user’s P(C) and computes
it. It then raises an alert if the P(C) is higher than a certain threshold.
Algorithm 4.1 Pseudo-code for the Mapper
f o r ( i n t i = 0 ; i < a l e r t s . l e n g t h ; i ++) {i f ( a l e r t s [ i ] == 1) {
sendToReducer ( use r , i ) ;}
}
Algorithm 4.2 Pseudo-code for the Reducer
p r e p a r e N u m e r a t o r ( CPT , a l e r t s ) ; / / r e a d s CPTsp r e p a r e D e n o m i n a t o r ( CPT , a l e r t s ) ; / / r e a d s CPTsP_Compromised = n u m e r a t o r / d e n o m i n a t o r ;i f ( P_Compromised > t h r e s h o l d ) {
w r i t e A l e r t ( u se r , P_Compromised ) ;}
4.4.2 Implemented Solution on Apache Storm
Storm is much more suitable for an online analysis, since it’s designed for stream
processing. In this case, the stream input to Storm will be represented by the
User/Alerts table: every line will be sent to Storm for analyzing immediately after
being updated. Unlike Hadoop, Storm does not need input text files or the explicit
management of a DFS.
79

Big Data Analytics for Critical Infrastructure Monitoring
It is necessary to define a Storm Topology to apply the Bayesian Network algo-
rithm to this problem. The topology defined to implement this approach is called
BayesianStorm, and is composed of two Bolts and a Spout. The LogStreamerSpout
reads an input file containing the lines of an User/Alerts table and sends them to
the following Bolts. There is no batch processing; only one line at the time is sent
to the Topology for processing. For this reason, Storm is naturally more suitable
than Hadoop for an online analysis.
It is worth noting that there is no concept of “job” in Storm, so when a topology is
up, it waits indefinitely for new lines to process.
The implemented Storm tool follows these steps:
1. It instantiates the BayesianStorm topology, which waits indefinitely for input
since the moment it starts up until it is explicitly killed.
2. The LogStreamerSpout reads the input file, line by line, and then sends the
updated <username, alerts> couple to the next bolt, called FactorCompute-
Bolt.
3. The FactorComputeBolt computes the necessary factors for the Bayesian
Algorithm, called simply numerator and denominator, and sends them to
the next bolt, called AlertProcessorBolt.
4. The AlertProcessorBolt computes the P(C) based on the data received from
the FactorComputeBolt and outputs it to a file if the P(C) is higher than a
certain threshold.
80
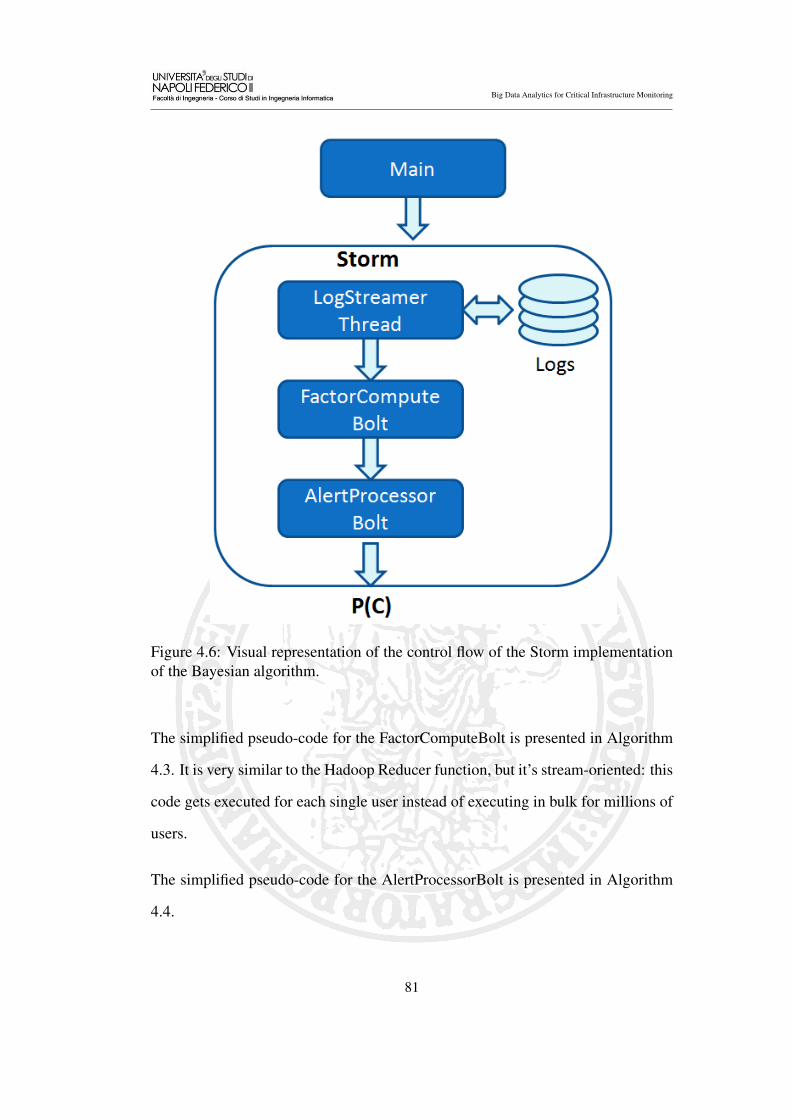
Big Data Analytics for Critical Infrastructure Monitoring
Figure 4.6: Visual representation of the control flow of the Storm implementationof the Bayesian algorithm.
The simplified pseudo-code for the FactorComputeBolt is presented in Algorithm
4.3. It is very similar to the Hadoop Reducer function, but it’s stream-oriented: this
code gets executed for each single user instead of executing in bulk for millions of
users.
The simplified pseudo-code for the AlertProcessorBolt is presented in Algorithm
4.4.
81

Big Data Analytics for Critical Infrastructure Monitoring
Algorithm 4.3 Pseudo-code for the FactorComputeBolt
p r e p a r e N u m e r a t o r ( CPT , a l e r t s ) ; / / r e a d s CPTsp r e p a r e D e n o m i n a t o r ( CPT , a l e r t s ) ; / / r e a d s CPTss e n d T o A l e r t P r o c e s s o r B o l t ( u se r , numera to r , d e n o m i n a t o r ) ;
Algorithm 4.4 Pseudo-code for the AlertProcessorBolt
P_Compromised = n u m e r a t o r / d e n o m i n a t o r ;i f ( P_Compromised > t h r e s h o l d ) {
w r i t e A l e r t ( u se r , P_Compromised ) ;}
Since there is no concept of “job” in Storm, to measure the elapsed processing time
for a given number of parsed lines (e.g. to compare it to Hadoop’s performance
with the same number of lines) it is necessary to add a unique line at the end of the
file: the start time is the timestamp of the moment the first line is read, and the end
time is the timestamp of the moment the unique line is received by the last Bolt.
4.4.3 Implemented Solution on Apache S4
S4 is another stream analysis tool, therefore it’s more suitable than Hadoop for
online processing. The general underlying idea is very similar to Storm: the stream
input to S4 is represented by the User/Alerts table, and every line is sent to S4 for
processing just after being updated in the HashTable.
In Apache S4, it’s necessary to define Processing Elements to analyze the input
forwarded by an Input Adapter. The system works in a way similar to Storm:
82
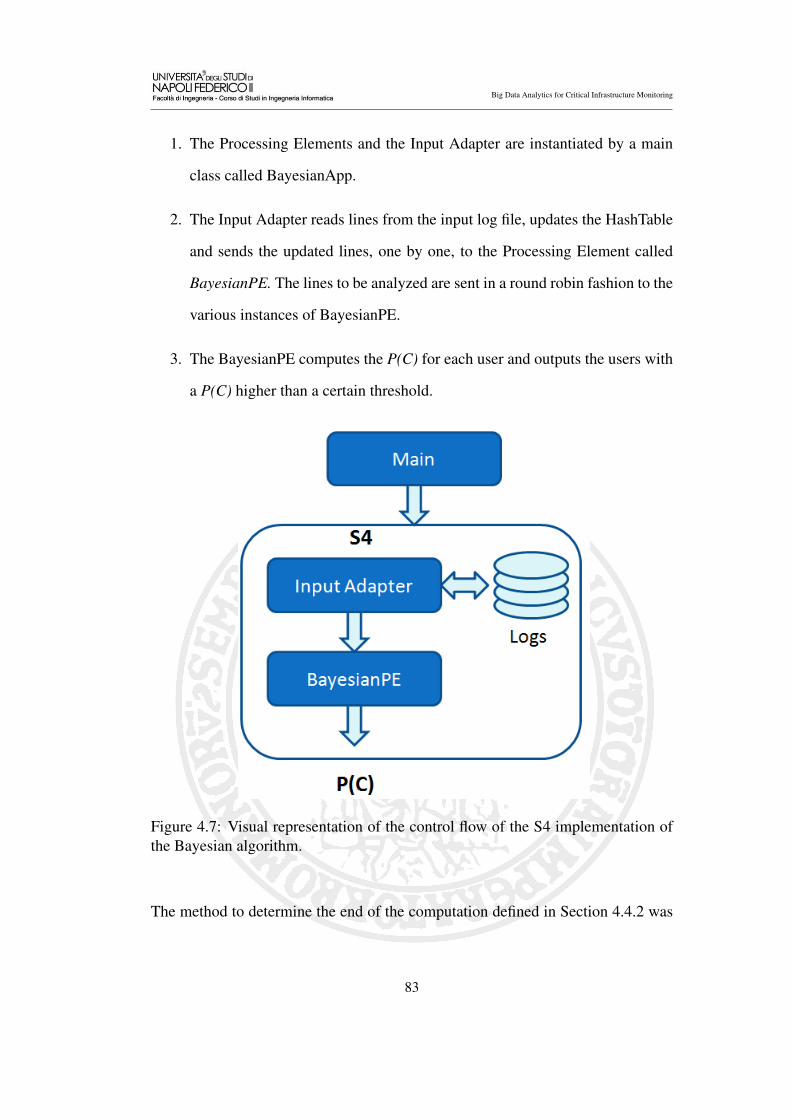
Big Data Analytics for Critical Infrastructure Monitoring
1. The Processing Elements and the Input Adapter are instantiated by a main
class called BayesianApp.
2. The Input Adapter reads lines from the input log file, updates the HashTable
and sends the updated lines, one by one, to the Processing Element called
BayesianPE. The lines to be analyzed are sent in a round robin fashion to the
various instances of BayesianPE.
3. The BayesianPE computes the P(C) for each user and outputs the users with
a P(C) higher than a certain threshold.
Figure 4.7: Visual representation of the control flow of the S4 implementation ofthe Bayesian algorithm.
The method to determine the end of the computation defined in Section 4.4.2 was
83

Big Data Analytics for Critical Infrastructure Monitoring
also used in S4.
4.4.4 Comparison and remarks
Hadoop was the first framework to be tested because it is currently the leading
framework for Big Data analytics. Nevertheless, during the design and develop-
ment phases of the application it clearly emerged that this framework is not suitable
for an online, streaming analysis: Hadoop works better with single, very large files,
and has a non-trivial initialization overhead. Hadoop is based on jobs: the DFS and
Yarn services start on the Operating System, and then any job involving large files
can be submitted. This is clearly not appropriate for an online computation which
requires the quick analysis of single lines of the User/Alerts table every time they
are updated after parsing new information from the log files. In fact, a trade off is
necessary: since the line limit is configurable (through the Config Java class), set-
ting it to a high number (ideally, the total number of log lines to parse) would defeat
the purpose of this analysis, since it would be batch processing instead of online
processing. On the other hand, setting it to the minimum possible number (e.g. 1)
would bring down the performance, creating a huge overhead. Since it has already
been estabilished that Hadoop is a batch processing tool and the initialization over-
head is high, the first option was chosen to allow Hadoop a fairer comparison to
the other frameworks: forcing Hadoop to simulate a stream by decreasing the line
limit would artificially increase its measured execution times.
Storm and S4 are clearly more suitable candidates for the implementation of this
online analysis tool. An interesting difference between the architecture of the
84

Big Data Analytics for Critical Infrastructure Monitoring
Hadoop-based tool and the architecture of the Storm-based tool is that, in Hadoop,
the computational complexity of the tool scales with the total number of lines to
read, while in Storm and S4 the complexity scales with the number of users. This
number can be less than or equal to the number of log lines parsed, since two
different lines can refer to two different alerts generated from the same user.
There are several differences between these two frameworks [19]:
• S4 is based on Events, Storm is based on Tuples.
• S4 uses Processing Elements while Storm uses Spouts and Bolts.
• Storm allows the explicit configuration of a topology, while S4 automatically
performs load balancing, allowing less configuration.
• Configuring S4 is much harder, requiring a XML-like language, while con-
figuring Storm directly through the Main class of the Java application is easy.
• Debugging and testing phases on S4 are tedious and complicated, while
Storm allows the execution directly from the IDE. Storm and Hadoop are
also compatible with Windows as a development environment, while S4 is
not.
• Storm has an active online community, while there are few examples of S4
software online: moreover, importing or creating a S4 project is not an easy
task, while there are no such problems for Storm.
• S4 does not guarantee data delivery, while Storm does.
85

Big Data Analytics for Critical Infrastructure Monitoring
• S4 developers have declared, without a benchmark to prove it, that the pro-
cessing speed of S4 is about 200.000 tuples per second, while Storm has
benchmarked it to about one million tuples per second.
• S4 has a partial documentation, while tutorials, manuals and examples are
available for Storm.
S4 is therefore an immature system, without any hints of ongoing development or
efforts to improve the framework. Therefore Apache Storm is definitely the best
option for the implementation of the online analysis tool.
4.5 Case Study 2: Statistical Analysis of the MEF
Data
Since the Bayesian approach was tested on a synthetic data set, a different analysis
on a real data set was also performed. The input data which was studied to build
this tool was obtained by the Italian Ministry of Economy and Finances.
The MEF is the executive body responsible for economic, financial and budget pol-
icy, planning of public investment, co-ordinating public expenditure and verifying
its trends, revenue policies and tax system in Italy. The entire MEF infrastructure is
designed to have a high resiliency degree, to prevent the complete interruption of a
service in case of failure. The MEF IT ecosystem is always under the control of an
advanced and complex monitoring system, which continuously checks the health
state of hardware and software, of the network and of the end-user experience [21].
86

Big Data Analytics for Critical Infrastructure Monitoring
The studied dataset is the output of the monitoring tools installed in the MEF in-
frastructure, and is composed of two text files:
1. A file containing the Active Power measurements of a PDU (Power Distri-
bution Unit), taken every ten seconds;
2. An extremely large file (23GB) containing the headers of the network pack-
ets, inbound and outbound, transmitted in a normal work week. It is divided
into the following fields:
(a) timestamp of the packet transmission;
(b) protocol used;
(c) flags;
(d) source IP;
(e) destination IP;
(f) source port;
(g) destination port;
(h) total payload bytes;
(i) state of the connection;
The data was already studied offline in [21], and a correlation between mean active
power and mean packet rate was found in different points (the first and the last
highlighted interval in Figure 4.8). In other cases, like the second interval, a very
low correlation was found. Starting from these results, we developed an online
87

Big Data Analytics for Critical Infrastructure Monitoring
Figure 4.8: Correlation found in [21] between the network traffic and the measuredactive power in the PDU.
tool based on Storm and RCaller, which could process the output from the system
monitors and automatically detect suspicious patterns.
This tool analyzes the packet rate in the network and correlates it with the average
power consumption in N seconds windows; it eventually generates an alert when
an unusual behavior is detected. The goal of this work is to show that this kind
of analysis can be done online in a Storm Topology. The requirement that the
analysis must be done online is very important to add, because an offline analysis
has already been performed in [21].
A preliminary statistical analysis of the MEF data yielded the following results:
• In several points, there is correlation between the active power and the net-
work packet rate;
• There are occasionally extremely high spikes in the network packet rate: a
spike of tens of millions of packets trasmitted in ten seconds was observed,
while the normal packet rate is about 20.000-30.000 packets per ten seconds.
This could be caused by unusual behaviors which should raise an alert.
88
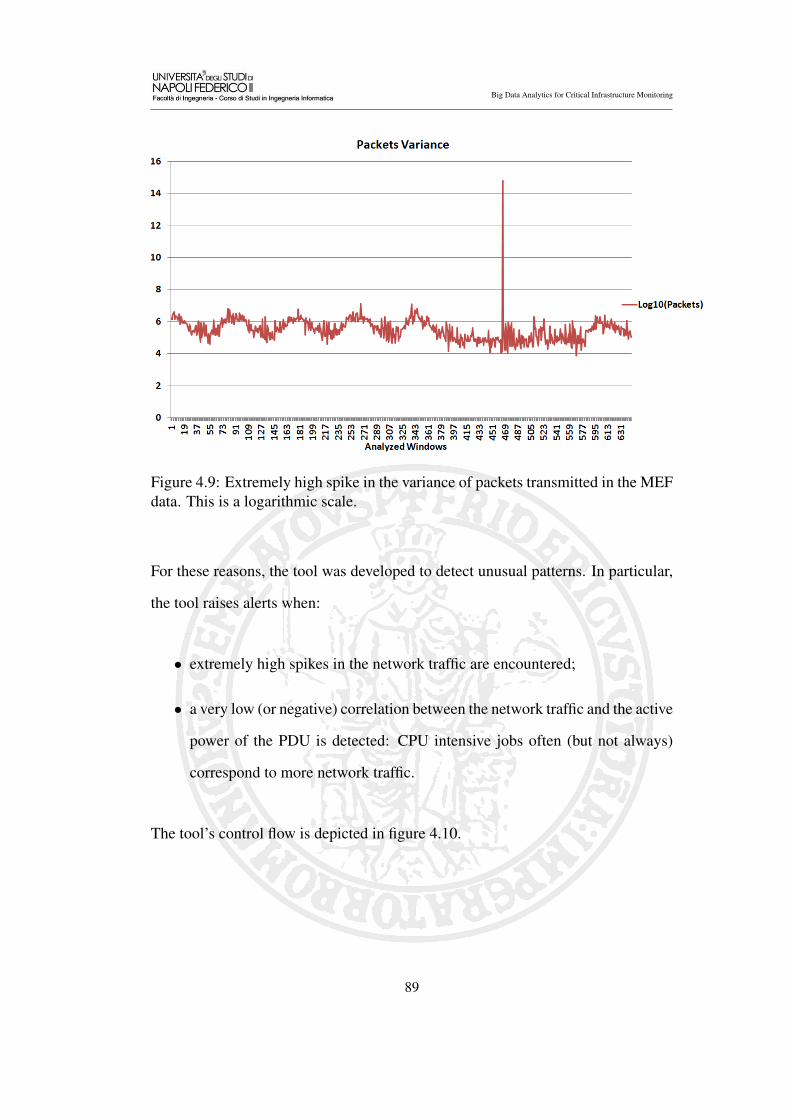
Big Data Analytics for Critical Infrastructure Monitoring
Figure 4.9: Extremely high spike in the variance of packets transmitted in the MEFdata. This is a logarithmic scale.
For these reasons, the tool was developed to detect unusual patterns. In particular,
the tool raises alerts when:
• extremely high spikes in the network traffic are encountered;
• a very low (or negative) correlation between the network traffic and the active
power of the PDU is detected: CPU intensive jobs often (but not always)
correspond to more network traffic.
The tool’s control flow is depicted in figure 4.10.
89
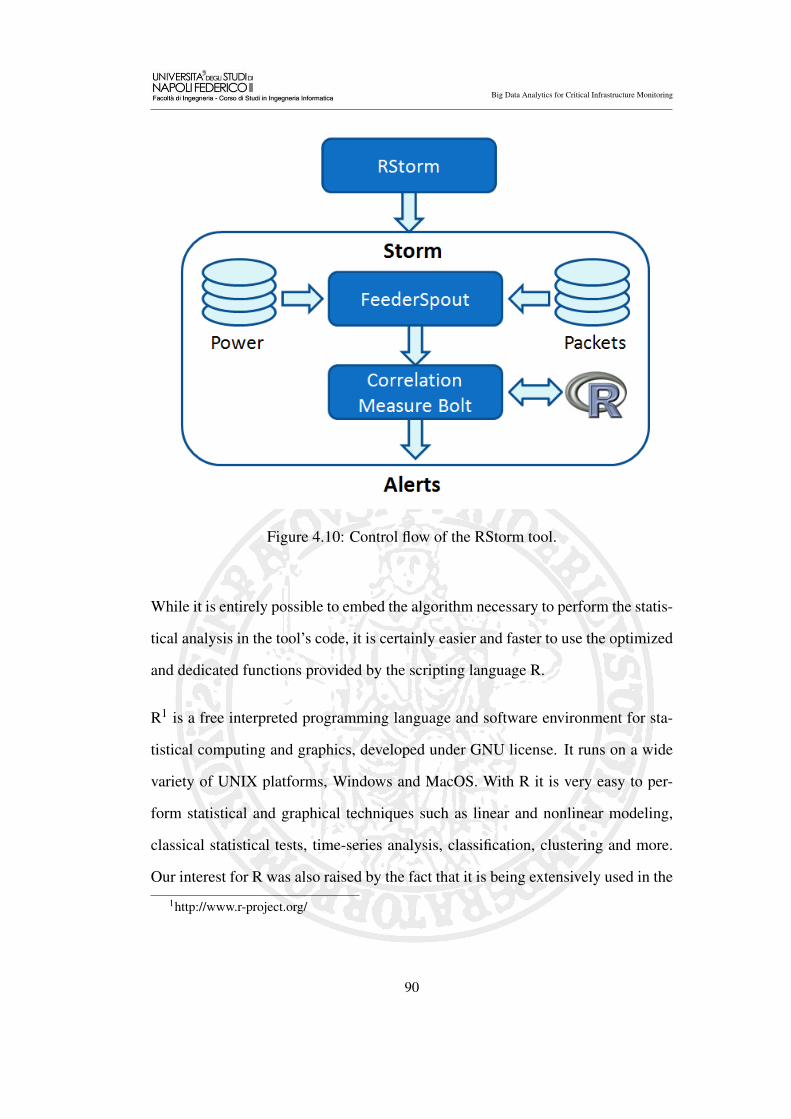
Big Data Analytics for Critical Infrastructure Monitoring
Figure 4.10: Control flow of the RStorm tool.
While it is entirely possible to embed the algorithm necessary to perform the statis-
tical analysis in the tool’s code, it is certainly easier and faster to use the optimized
and dedicated functions provided by the scripting language R.
R1 is a free interpreted programming language and software environment for sta-
tistical computing and graphics, developed under GNU license. It runs on a wide
variety of UNIX platforms, Windows and MacOS. With R it is very easy to per-
form statistical and graphical techniques such as linear and nonlinear modeling,
classical statistical tests, time-series analysis, classification, clustering and more.
Our interest for R was also raised by the fact that it is being extensively used in the
1http://www.r-project.org/
90

Big Data Analytics for Critical Infrastructure Monitoring
data analysis field [22].
Figure 4.11: The R Logo and the RCaller website header.
RCaller is a software library developed by Mehmet Hakan Satman2 for using the
power of R within Java. Until June 17th, 2014, RCaller version 2.3 was not suitable
for this kind of analysis because of a very serious bug.
RCaller supplies a method called runAndReturnResultOnline() which calls R from
a Java program and returns, as a result, the value of a particular R variable. It was
written to call R multiple times from a single Java program, but until the version
2.3 it spawned a different RCaller process each time the method was called and
failed to kill them. After discovering this bug we contacted professor Satman, who
was already working on a fix and subsequently released the version 2.4 a few days
later: the method stopRCallerOnline() was added to kill the R processes still in
memory after the computation.
RCaller 2.4 is therefore the perfect choice for an online statistical analysis tool,
since it can be used in a Storm Bolt to calculate the variance and the correlation of
the input data.
Its architecture is the following: a Main function initializes the Storm Topology
2Associate Professor at Istanbul University
91

Big Data Analytics for Critical Infrastructure Monitoring
and launches it on a Storm Cluster, setting the number of workers, the window size
(how many N-second windows must be collected before analyzing them with R)
and N, the width of a sample measured in seconds;
1. A FeederSpout3 reads the configuration parameters and opens the two input
streams, called Power and Packets. In this case, we used two files because
we already had the data, but this is not a requirement: data can come from
every other source, e.g. a socket, an HTTP connection, a database, or any
other data stream. The Spout counts the packets trasmitted and received in
N seconds and stores the number in an array called packets; it also reads
the power measurements and stores it in another array, called powers. Every
time the array reaches a fixed length, for example 10, the data is sent to the
CorrelationMeasure Bolt.
2. The CorrelationMeasure Bolt reads the input data from the Feeder Spout and
initializes R using RCaller. It then uses R to
• compute the variance in the packet array to detect possible peaks.
• compute the correlation between the packet numbers in N second win-
dows and the active power measured within the same timestamps.
If the variance is extremely high, or the variance is high and the correlation is very
low, an alert is generated. In particular:
• a very high variance in the number of packets sent or received in a fixed time
3Its code can be found on Nathan Marz’s github page.
92

Big Data Analytics for Critical Infrastructure Monitoring
frame can be caused by a DDoS attack or the network being used as a botnet
to launch an attack;
• a high variance in the network traffic, when linked to a very low or negative
correlation between the number of packets and the active power of the PDU,
can raise suspicions because of the consistent correlation between these two
measurements: this is therefore the way to detect an unusual utilization pat-
tern.
This behavior was achieved through the implementation of the following Java
classes:
• RStorm, which is the class containing the main() method. It also initializes
the FeederSpout: this Spout was supplied with Storm and we did not need to
implement it, just make use of its functions.
• CorrelationMeasureBolt, which contains the calls to RCaller, and the logic
to analyze the results, yielding alerts when an unusual behavior is detected.
The Java code for the core of the CorrelationMeasureBolt is presented in Algorithm
4.5
93
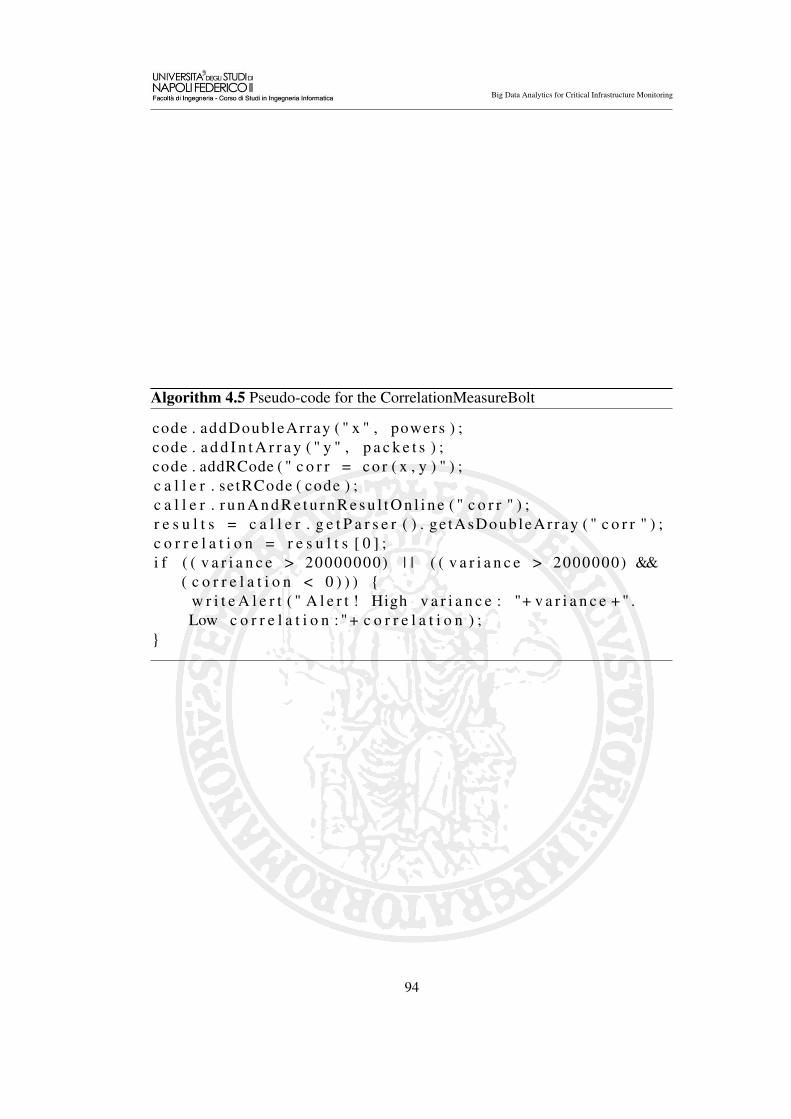
Big Data Analytics for Critical Infrastructure Monitoring
Algorithm 4.5 Pseudo-code for the CorrelationMeasureBolt
code . addDoubleArray ( " x " , powers ) ;code . a d d I n t A r r a y ( " y " , p a c k e t s ) ;code . addRCode ( " c o r r = c o r ( x , y ) " ) ;c a l l e r . se tRCode ( code ) ;c a l l e r . r u n A n d R e t u r n R e s u l t O n l i n e ( " c o r r " ) ;r e s u l t s = c a l l e r . g e t P a r s e r ( ) . ge tAsDoubleArray ( " c o r r " ) ;c o r r e l a t i o n = r e s u l t s [ 0 ] ;i f ( ( v a r i a n c e > 20000000) | | ( ( v a r i a n c e > 2000000) &&
( c o r r e l a t i o n < 0 ) ) ) {w r i t e A l e r t ( " A l e r t ! High v a r i a n c e : "+ v a r i a n c e + " .Low c o r r e l a t i o n : " + c o r r e l a t i o n ) ;
}
94

Chapter 5
Experimental Results
In this chapter we present the design of experiments which was used to evaluate
the performance of the described tools. Even if the Hadoop and Storm platforms
are architecturally different and can not be compared to each other in absolute
terms, their horizontal scaling while executing the Bayesian algorithm onto the
same amount of data can be evaluated. The chosen metrics and the selected pa-
rameters are listed and the cluster setup is then shown. At the end of the chapter
the experimental results are presented and the obtained metrics relative to the two
platforms are compared.
95

Big Data Analytics for Critical Infrastructure Monitoring
5.1 Bayesian Inference Tool
5.1.1 Experiments Design
Hadoop is a batch processing framework, so all the input must be gathered and
copied into the HDFS before processing. Storm is a very agile stream processing
platform, therefore it conforms better to the online monitoring model. It would not
be fair to compare the absolute execution times of the same tool. Hadoop can not
be directly used for stream processing because executing a new Hadoop MapRe-
duce job for each new line of data arriving from the monitors would generate a
huge amount of overhead; for this reason, the whole input generated by the Alert
Generator tool will be fed to Hadoop for processing. The number of log lines
analyzed by this tool will be 108, corresponding to about 5∗107 different users.
For Storm a different approach was used: the input was generated directly inside
the LogStreamerThread, following the same probability distribution used by the
Alert Generator tool.
The goal was the comparison of the horizontal scaling of the two platforms while
executing the same kind of algorithm with the same total input. Hadoop and Storm
are designed to work on a distributed system and scale horizontally, therefore we
decided to compare their performances on i nodes against the performance on a
single node for both frameworks, where i varies in {1,4,8,12,16,20,24}. Since the
total input lines to be analyzed is estabilished, the only variable factor is the number
of nodes used for parallel processing.
It’s also worth noting that the computational complexity of the presented Bayesian
96

Big Data Analytics for Critical Infrastructure Monitoring
Network algorithm is completely independent from the number of alerts a particu-
lar user has generated. In other words, if user1 has generated 10 alerts and user2
has generated only 1 alert, the number of CPU operations necessary to compute
their P(C) is exactly the same.
The metrics used to compare the performances of the tool on the two platforms are
the Speed Up and the Efficiency, both derived from the Execution Time and the
number of nodes. The Execution Time was measured from the beginning of the
analysis of the first log line to the end of the last line.
• The Speed Up Si is computed by dividing the Execution Time Ti measured
for i nodes by the execution time measured for a single node T1. This is a
HB (Higher is Better) metric: in other words, we want the Speed Up to be
as high as possible. In practice, though, the Speed Up can not be higher than
the number of nodes used for the computation.
Si =Ti
T1
• The Efficiency E i is computed by dividing the Speed Up Si by the num-
ber i of nodes. This is a NB (Nominal is Better) metric, because we want
Efficiency to be as close as possible to 1. In the hypothetical case where
Efficiency was 1, it would mean that the platform has no overhead on the
computation and the maximum possible Speed Up.
Ei =Si
i
97
Big Data Analytics for Critical Infrastructure Monitoring
5.1.1.1 Configuration Parameters for Hadoop
For Hadoop, the following configuration parameters were used:
• io.file.buffer.size was set to 131072;
• mapreduce.framework.name was set to yarn;
• yarn.nodemanager.aux-services was set to mapreduce_shuffle;
• yarn.nodemanager.aux-services.mapreduce.shuffle.class was set to Shuffle-
Handler;
• 10GB of RAM were given to the “java -jar” command used by Hadoop.
The other configuration parameters were left to their default values1.
5.1.1.2 Configuration Parameters for Storm
For Storm, the following configuration parameters were used:
• A single worker was allocated on each node (port 6700);
• The total number of executor threads was equal to the number of nodes and
workers;
• 8GB of RAM were given to the Nimbus host;
• 3GB of RAM were given to each worker;
1The default configuration files can be found on the Apache Hadoop website.
98

Big Data Analytics for Critical Infrastructure Monitoring
• TOPOLOGY_EXECUTOR_SEND_BUFFER_SIZE was set to 16384;
• TOPOLOGY_EXECUTOR_RECEIVE_BUFFER_SIZE was set to 16384;
• TOPOLOGY_RECEIVER_BUFFER_SIZE was set to 8;
• TOPOLOGY_TRANSFER_BUFFER_SIZE was set to 32;
• The number of ackers was equal to the number of workers.
The other configuration parameters were left to their default values2.
5.1.2 Cluster Setup
The software used for the experiments was:
• Ubuntu 13.10 LTS
• Apache Hadoop 2.3.0
• Apache Storm 0.9.2
• Apache ZooKeeper 3.4.6 to implicitly coordinate the Storm topology on the
nodes
• Apache Maven 3.2.2 to compile Storm projects
• Oracle Java OpenJDK 7
2The default configuration file can be found on the Apache Incubator Storm website (gitHub)
99

Big Data Analytics for Critical Infrastructure Monitoring
• OpenSSH 6.6, implicitly used by Hadoop nodes to send and receive com-
mands
• ZeroMQ 2.1.7, implicitly used by Storm for intra-cluster messaging
• Nova and Openstack 2013.2, a cloud computing platform to host the virtual
machines.
This software was installed on virtual machines spawned on a Dell rack composed
of 3 different servers, containing 32 processors with 6 cores each. Two categories
of virtual machines were created (called flavors in the Openstack environment):
• Master, with 60GB of disk space, 16GB RAM and 2 virtual CPUs;
• Worker\Slave, with 20GB of disk space, 4GB RAM and 1 virtual CPU.
The Master flavors were created to host the main machine, while the Worker\Slave
flavors were created to host the worker machines: these were the machines that
were cloned multiple times to scale the cluster horizontally.
• For Hadoop, the main machine hosted the ResourceManager and the Na-
meNode. The worker machines hosted several DataNodes and NodeMan-
agers. Since this was a small cluster, only one ResourceManager and Na-
meNode instance was necessary.
• For Storm, the main machine hosted the Storm UI, the ZooKeeper and Storm
Nimbus servers. The worker machines hosted a Storm Supervisor each.
Since this was a small cluster, only one Nimbus and ZooKeeper instance
was necessary.
100

Big Data Analytics for Critical Infrastructure Monitoring
5.1.3 Experimental Results
In this section we present the experimental results obtained after the actual exper-
iments. The tests were repeated multiple times to obtain a higher precision and
avoid outliers.
5.1.3.1 Hadoop
The Hadoop tests were repeated ten times for each cluster, as explained before. Ex-
ecution time averages, standard deviations, Speed Up and Efficiency are summa-
rized in table 5.1. The Confidence is the value required to calculate the Confidence
Interval with the formula:
Con f idenceInterval = [Avg.Time−Con f idence;Avg.Time+Con f idence]
Processors 1 4 8 12 16 20 24Avg. Time 1345,40 996,59 904,38 896,72 885,26 916,37 932,40
Std. Deviation 27,90 160,62 18,72 23,26 29,93 122,67 122,73Confidence 24,45 19,08 16,41 20,39 26,23 107,52 107,58Speed Up 1 1,3500 1,4877 1,5004 1,5198 1,4682 1,4429Efficiency 0,3375 0,1860 0,1250 0,0950 0,0734 0,0601
Table 5.1: Summary of the Hadoop measured metrics.
101
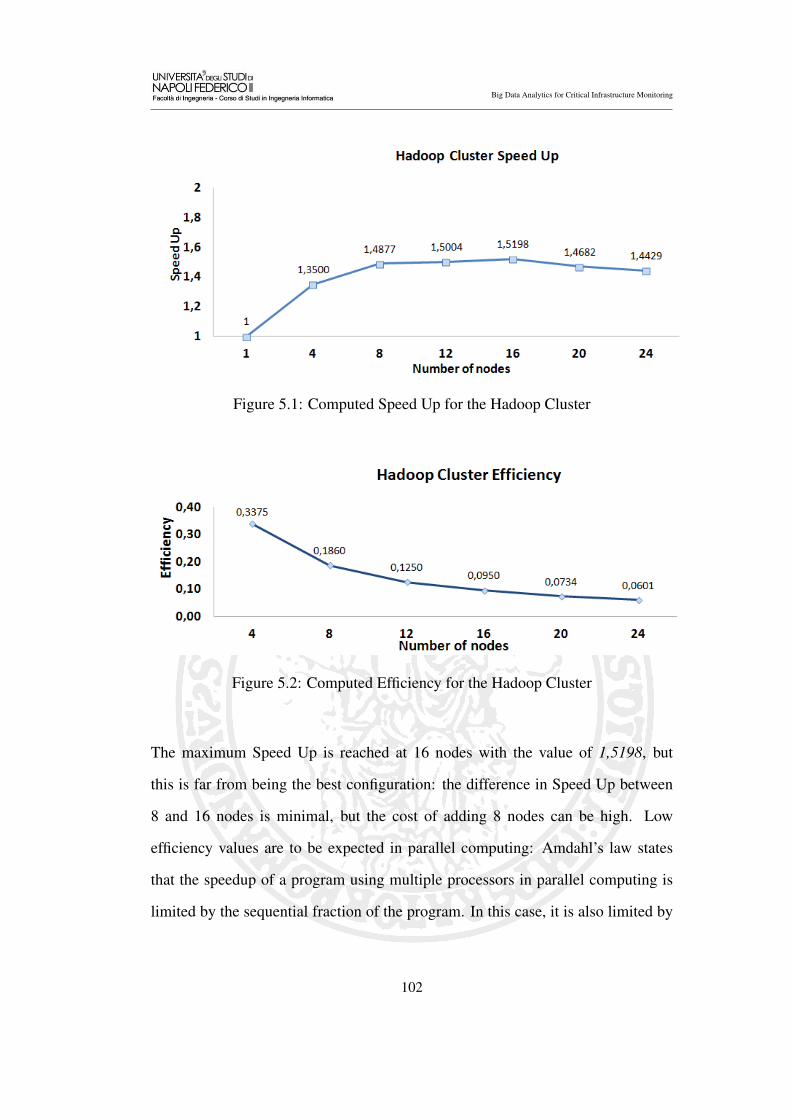
Big Data Analytics for Critical Infrastructure Monitoring
Figure 5.1: Computed Speed Up for the Hadoop Cluster
Figure 5.2: Computed Efficiency for the Hadoop Cluster
The maximum Speed Up is reached at 16 nodes with the value of 1,5198, but
this is far from being the best configuration: the difference in Speed Up between
8 and 16 nodes is minimal, but the cost of adding 8 nodes can be high. Low
efficiency values are to be expected in parallel computing: Amdahl’s law states
that the speedup of a program using multiple processors in parallel computing is
limited by the sequential fraction of the program. In this case, it is also limited by
102
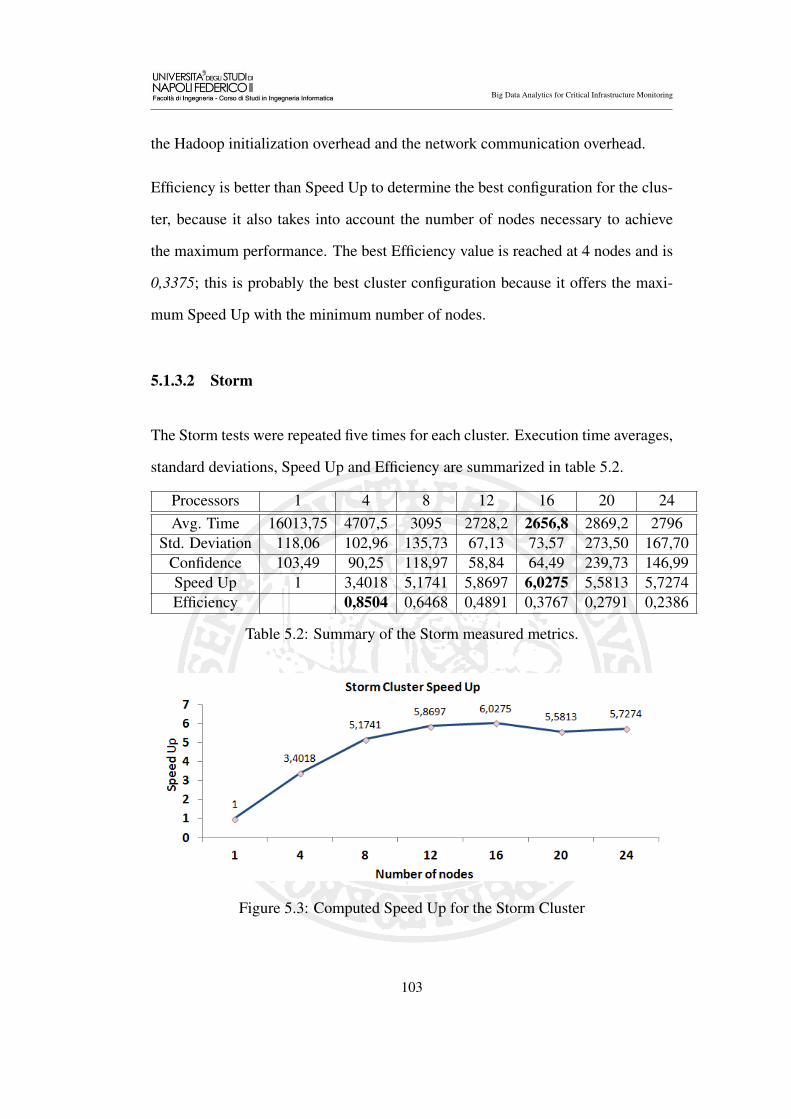
Big Data Analytics for Critical Infrastructure Monitoring
the Hadoop initialization overhead and the network communication overhead.
Efficiency is better than Speed Up to determine the best configuration for the clus-
ter, because it also takes into account the number of nodes necessary to achieve
the maximum performance. The best Efficiency value is reached at 4 nodes and is
0,3375; this is probably the best cluster configuration because it offers the maxi-
mum Speed Up with the minimum number of nodes.
5.1.3.2 Storm
The Storm tests were repeated five times for each cluster. Execution time averages,
standard deviations, Speed Up and Efficiency are summarized in table 5.2.
Processors 1 4 8 12 16 20 24Avg. Time 16013,75 4707,5 3095 2728,2 2656,8 2869,2 2796
Std. Deviation 118,06 102,96 135,73 67,13 73,57 273,50 167,70Confidence 103,49 90,25 118,97 58,84 64,49 239,73 146,99Speed Up 1 3,4018 5,1741 5,8697 6,0275 5,5813 5,7274Efficiency 0,8504 0,6468 0,4891 0,3767 0,2791 0,2386
Table 5.2: Summary of the Storm measured metrics.
Figure 5.3: Computed Speed Up for the Storm Cluster
103

Big Data Analytics for Critical Infrastructure Monitoring
Figure 5.4: Computed efficiency for the Storm Cluster
The maximum Speed Up is reached at 16 nodes with the value of 6,0275, which is
much better than the Hadoop performance. Again, this is far from being the best
configuration: the difference in Speed Up between 12 and 16 nodes is minimal, but
the cost of adding 4 more nodes is high.
The best Efficiency value for Storm is reached at 4 nodes and is 0,8504. In this
case, there is a noteworthy difference in Speed Up between using 8 and 12 or 16
nodes, so in this case the cluster administrator can choose whether to add more
nodes to reduce the computation time or to reduce the costs.
5.1.4 Comparison and Remarks
The absolute measured times are much higher in Storm, because Hadoop is a
batch processing framework and can manage blocks of gigabytes of data with ease.
Storm, on the other hand, needs to process every new alert as a tuple, therefore it
is understandable that the communication overhead and the total execution time
104
Big Data Analytics for Critical Infrastructure Monitoring
will be much higher. Also, as we already stated before, Hadoop can not be di-
rectly compared to Storm because of their fundamental architectural differences,
and was only used to set a comparison base and to implement the offline Bayesian
Approach.
Storm was found to scale horizontally in an excellent way, reaching an Efficiency
of 0.8504 with 4 nodes, while the Efficiency values of Hadoop were much lower,
with a maximum of 0,3375. Storm is also more prone to an online approach be-
cause it can accept different sources of data from different streams: it’s only nec-
essary to add more Spouts.
It can be therefore concluded that Hadoop is the best framework for the offline
Bayesian Approach, while Storm works best with constant (and bulky) streams
of data and scales excellently with the addition of other worker nodes. Therefore
Storm is the best framework for the online Bayesian analysis tool, which is one of
the goals of this work.
5.2 RStorm Statistical Analysis Tool
5.2.1 Cluster Setup
The tool was tested on a Storm Topology consisting of one Nimbus and Zookeeper
node and four worker (Supervisor) nodes. These nodes were deployed on four
virtual machines spawned on the same Dell rack used to compare Hadoop and
Storm, described in section 5.1.1. Each machine had the same software used in the
previous cluster and the following hardware characteristics:
105

Big Data Analytics for Critical Infrastructure Monitoring
• 60GB of disk space;
• 16GB RAM;
• 2 virtual CPUs.
5.2.2 Experiments Design
The execution times were measured, in a way similar to the Hadoop and Storm
tests, with three different clusters formed by {1,2,4} nodes. There are several con-
figuration options in the tool:
• The length (in seconds) of the windows was set to 10;
• The array length was set to 10;
• The variance limit L1 for the spike detection was set to 2∗107;
• The variance limit L2 for the low correlation detection was set to 2∗106 and
the correlation upper limit was set to 0;
The two listed variance limits were decided after a phase of preliminary analysis:
it was often observed that the variance reached values of 1∗106, therefore L1 was
set to the double of that value. L1 was then set to L2 ∗ 10, because the only point
in the data where the variance exceeded the normal values was the spike described
in figure 4.9. In different applications these thresholds may vary; lowering the
thresholds could generate a high number of false positive alerts, therefore a tuning
phase is necessary.
106

Big Data Analytics for Critical Infrastructure Monitoring
The input data is described in Section 4.5: an extremely large file (23GB) contain-
ing the real headers of the network packets, inbound and outbound, transmitted in
a normal work week in a MEF network.
5.2.3 Experimental Results
The tool analyzed the MEF dataset, producing alerts when detecting a very large
value of variance or a large value of variance and a very low correlation. With these
configuration parameters, it produced 14 alerts. Of these alerts, only one contained
an extremely high variance value (5,937∗1014) and the others were generated by
a low correlation value. Different results can be obtained by differently tuning the
configuration parameters. The following is an example of the output produced by
the tool:
19 Jun 1 5 : 3 3 : 3 0 A l e r t ! High v a r i a n c e : 5322621 .15555556 .
Low c o r r e l a t i o n : −0.051412874591503
No particular differences in the average execution times were found: this means
that the performance bottleneck is not in the Storm Topology. This happened for
two reasons:
• The most likely bottleneck is in the file read from the hard disk, which is
considerably slower than the random access memory;
• The number of tuples effectively sent to the Storm Bolt for computation is
much lower than the one resulted in the Bayesian case study. This is due
107

Big Data Analytics for Critical Infrastructure Monitoring
to the fact that the data is sent to Storm in an aggregated form: not every
single line is sent, but instead they are counted to form an array of N second
windows.
Even if there is no observed Speed Up, the average execution times to analyze the
data produced in a week were extremely low: about four minutes to analyze 23GB
of data in a Storm Topology using RCaller. This means that our second goal was
met: an online statistical analysis of the correlation between the packet rate and
active power measured in a rack is possible and can be used to alert the system
administrators of unusual and possibly malicious behavior.
108
Chapter 6
Conclusions and Future Work
In this work, we have discussed about the state of the art of critical infrastructure
monitoring and Big Data analytics, describing the main monitoring tools and the
most used Big Data analytics frameworks; we also showed that it’s possible to
perform online Big Data analytics using Apache Storm to monitor critical infras-
tructures and detect malicious access, credential theft or just unusual user behav-
ioral patterns. To this end, we have compared three of the main Big Data analytics
frameworks: Hadoop for batch processing, Storm and S4 for the online stream
processing.
The comparison was made using similar implementations of the same basic idea:
a Bayesian Network can be used to compute the probability that a given user in a
shared cluster is compromised (e.g. that user’s password was stolen).
Storm was preferred to S4 for its better support for developers, computing speed
and ease of cluster setup, and its performance was compared to Hadoop through
109

Big Data Analytics for Critical Infrastructure Monitoring
the Speed Up and Efficiency metrics, which are derived from the measured total
execution time of the developed tools.
After the tests, Hadoop was shown to be the best option for an offline processing,
i.e. when the whole dataset is already available; Storm was, instead, the best frame-
work for the online processing, i.e. when the data is streamed or in real time. Storm
also scaled extremely well horizontally, when adding new nodes to the computing
cluster.
The development and deployment of an online monitoring tool based on Storm was
also presented. This tool analyzes the network packet rate and the measured active
power in a PDU of the same system and uses R within a Storm Topology to detect
packet rate peaks and the negative correlation between the two input data streams.
We provide two examples of possible uses of this system:
• using multiple different algorithms to rule out false positives, a user of a
high performance computing infrastructure can be flagged as malicious (i.e.
his credentials were stolen) and his access to the system can be blocked to
prevent further damage;
• using a Storm Topology to analyze in real time the logs produced by the
sensors and monitors of a critical infrastructure (e.g. a refinery or a nuclear
power plant), terrorist attacks can be detected and thwarted before causing
any damage.
We have proven that Storm can be used, together with RCaller, to build a monitor-
ing tool which detects unusual network traffic patterns using statistical analysis.
110

Big Data Analytics for Critical Infrastructure Monitoring
In the future, approaches different from the Bayesian Network based algorithm can
be developed, implemented on Storm and used side by side to form a multi-agent
expert system to further reduce the false positive rate in the fields of credential
theft detection and critical infrastructure monitoring. In particular, it’s possible
to build a complex system for the online monitoring and protection of any criti-
cal infrastructure. This can be done using several different metrics and sensors,
which could feed their outputs into a multi-agent expert distributed system based
on a Storm Topology. This Topology could use a consensus algorithm to detect
malicious behavior.
The MEF data can also be analyzed more thoroughly in the future; our analysis
was simply limited to counting the number of transmitted packets, but a deeper
analysis can be performed. For example:
• the type of protocol can be taken into account for the analysis. A more in-
depth analysis on security-related protocols (such as SSL or HTTPS) can be
performed;
• the type of software which is running on the nodes can be taken into account.
For example, when executing CPU intensive jobs with no input\output it’s
normal to expect a low correlation between active power and network traffic,
and therefore the alert thresholds can be more precisely tuned;
• certain IP addresses can be flagged as known malicious and blacklisted, and
any interaction with such addresses could cause an alert;
• the network QoS can be improved by detecting the most active couples, i.e.
111

the couples of IP addresses which exchange the largest percentage of packets
in a given time unit, and improve the network connection between them;
• with additional information, more in-depth studies can be performed on the
inbound and outbound traffic, or on the single workstations, to single out
malware, keyloggers and spyware infecting a single machine.
112

Bibliography
[1] Stephen J. Collier and Andrew Lakoff , “The Vulnerability of Vital Systems:
How “Critical Infrastructure” Became a Security Problem”, The New School,
New York and University of California, San Diego, 2008
[2] Antonio Pecchia, Aashish Sharma, Zbigniew Kalbarczyk, Domenico Cotro-
neo, Ravishankar K. Iyer, “Identifying Compromised Users in Shared Com-
puting Infrastructures: a Data-Driven Bayesian Network Approach”, IEEE
International Symposium on Reliable Distributed Systems, 2011
[3] Reichman, O.J.; Jones, M.B.; Schildhauer, M.P. "Challenges and Opportuni-
ties of Open Data in Ecology". 2011
[4] IBM, “What is big data? — Bringing big data to the enterprise".
www.ibm.com. 2013
[5] Alwyn Goodloe and Lee Pike, “Monitoring Distributed Real-Time Systems:
A Survey and Future Directions”, National Institute of Aerospace, Hampton,
Virginia and Galois, Inc., Portland, Oregon, 2010
[6] Marcello Cinque, Domenico Cotroneo, Antonio Pecchia, “Event Logs for the
Analysis of Software Failures: a Rule-Based Approach”, IEEE
113
[7] "Applications and organizations using Hadoop". Wiki.apache.org. 2013
[8] The Apache Software Foundation, “Storm Tutorial”, 2013
[9] The Apache Software Foundation, “S4 Overview”, 2013
[10] Diego Fernandez, “Operator Security Plan Guidelines”, 2013
[11] Symantec, MessageLabs Intelligence: 2010 Annual Security Report, 2000
[12] Lisa Vaas, “Malware poisoning results for innocent searches”, 2007
[13] The Council of the European Union, “Council Directive” 2008/114/EC
[14] Sam Curry, Engin Kirda, Eddie Schwartz, William H. Stewart and Amit
Yoran, “Big Data Fuels Intelligence-Driven Security”, RSA Security Brief,
January, 2013
[15] Tariq Mahmood, Uzma Azfal, “Security Analytics: Big Data Analytics for
Cybersecurity”, 2nd National Conference on Information Assurance (NCIA),
2013
[16] Nelly Delgado, Ann Quiroz Gates, Steve Roach, “A Taxonomy and Catalog
of Runtime Software-Fault Monitoring Tools”, IEEE Transactions on Soft-
ware Engineering, 2004
[17] Alvaro A. Cárdenas, Pratyusa K. Manadhata, Sreeranga P. Rajan, “Big Data
Analytics for Security”, 2013
[18] Ericka Chickowski, “A Case Study in Security Big Data Analysis,” Dark
Reading, 2012
114
[19] Richard McCreadie, “S4 vs Storm”, University of Glasgow, 2012,
http://demeter.inf.ed.ac.uk/cross/docs/s4vStorm.pdf
[20] David Wagner and Drew Dean, “Intrusion detection via static analysis”, IEEE
Symposium on Security & Privacy, 2001
[21] Roberto Baldoni, Mario Caruso, Adriano Cerocchi, Claudio Ciccotelli, Luca
Montanari, “Correlating power consumption and network traffic for improv-
ing data centers resiliency”, 2014
[22] Ashlee Vance, “Data Analysts Captivated by R’s Power”, New York Times,
2009
[23] Bogdan Razvan, "Win32.Worm.Stuxnet.A", http://www.bitdefender.com/
[24] Cloud Security Alliance, “Big Data Analytics for Security Intelligence”, 2013
[25] Mark Beyer, Douglas Gartner, “The Importance of ’Big Data’: A Definition”,
2012
[26] Beth A. Schroeder, “On-Line Monitoring: A Tutorial”, IEEE, 1995
[27] USA Department of Defense, “DOD Guide For Achieving Reliability, Avail-
ability, And Mantainability”, Systems Engineering for Mission Success, 2005
115

Ringraziamenti
Nonostante scrivere la tesi in inglese sia stata un’impresa piuttosto ardua, scrivere
i ringraziamenti rimane sempre la parte più difficile. È davvero complicato guar-
darmi alle spalle e rendermi conto di quante persone sono state nella mia vita e
hanno contribuito, in qualsiasi maniera, a farmi diventare ciò che sono, alla stesura
di questa tesi e al lavoro che c’è dietro. Per questo motivo i ringraziamenti sono,
come sempre, in ordine completamente sparso.
Un grande ringraziamento va al professor Marcello Cinque e al mio correlatore,
Agostino Savignano, grazie ai quali sono riuscito a portare a termine questo dif-
ficile percorso di tirocinio e tesi senza intoppi. Un altro ringraziamento vorrei
farlo all’intero staff del laboratorio CINI\ITeM di Monte Sant’Angelo, con cui ho
condiviso innumerevoli pranzi e chiacchiere durante il mio tirocinio, e che si so-
no sempre mostrati disponibili per aiutarmi appena si presentava un problema: in
particolare Antonio Nappi e Antonio Pecchia che mi hanno aiutato anche nel lato
tecnico, per la gestione di OpenStack e per l’algoritmo Bayesiano.
Durante questi anni mi sono impegnato sempre al massimo per avere successo
all’università e riuscire a proseguire senza intoppi, e senza il sostegno morale ed

economico della mia famiglia non ce l’avrei mai fatta. Perciò vi ringrazio: senza
di voi tutto questo non sarebbe stato possibile! La dedica all’inizio di questa tesi,
“A chi ha sempre creduto in me”, vale prima di tutto per voi.
Dato che stiamo parlando di sostegno morale, la campionessa in assoluto è decisa-
mente Miriam, il cui amore mi ha sostenuto per la fine della laurea triennale e per
l’intero corso di studi della magistrale. Spero che tu continui a starmi sempre vici-
no come in questi anni. Diciamo scherzosamente che la nostra relazione è basata
sul sushi, ma in realtà è basata sul supportarci moralmente a vicenda! Per cui, dal
profondo del cuore, per tutto ciò che hai fatto e fai per me.... Grazie. Mi considero
incredibilmente fortunato ad averti.
Non potrei mai parlare del mio percorso universitario senza parlare di Francesco Di
Iorio, senza il quale starei ancora studiando Geometria e Algebra (altro che Fisica
I). Da quel Dicembre 2007 ne abbiamo passate davvero tante insieme, e siamo
cresciuti insieme come ingegneri. Evidentemente la mia vita è piena di fortuna,
perché penso di essere stato incredibilmente fortunato a trovare una persona con
cui mi trovo così bene a studiare! Un giorno “UniNa Chi?” diventerà un famoso
gioco per Android e ci frutterà miliardi di euro, ne sono convinto.
Un enorme grazie va anche ad Alessio, Pierpaolo, Salvatore, Giovanni, Umberto,
Domenico e Rossella, amici veri, che mi hanno aiutato in vari modi durante tutto
questo percorso e mi hanno alleggerito il peso del percorso universitario tra pizze,
kebab, vacanze, risate e uscite in compagnia. Grazie a tutti voi, siete di quanto
meglio potessi sperare come amici!
Infine vorrei ringraziare i colleghi dell’università, che durante i corsi e durante

le sessioni d’esame mi hanno aiutato sia praticamente sia moralmente: Domenico
D’Ambrosio, Emanuele Matino e Walter Iachetti solo per citarne alcuni. Vi auguro
di avere una eccellente vita professionale!
Sicuramente avrò dimenticato qualcuno, quindi perdonatemi... Mi impegno a rin-
graziarvi di persona su richiesta!
A special thanks to Istanbul University’s professor Mehmet Hakan Satman, who
quickly replied to my emails and released RCaller version 2.4 after my bug fixing
request. Without him, the RStorm tool would not have been feasible.
Daniele