
Bank of Communications ( Hong Kong ) Limited...2019/06/30 · Bank of Communications (Hong Kong)...
42
BANK OF COMMUNICATIONS (HONG KONG) LIMITED (Incorporated in Hong Kong with limited liability) Interim Report 20 19 Bank of Communications ( ) Limited
Transcript of Bank of Communications ( Hong Kong ) Limited...2019/06/30 · Bank of Communications (Hong Kong)...
BANK OF COMMUNICATIONS (HONG KONG) LIMITED(Incorporated in Hong Kong with limited liability)
交通銀行(香港)有限公司 ( 於香港註冊成立之有限公司 )
Interim Report2019中期報告2019
Bank of Comm
unications (Hong K
ong ) Limited
交通銀行(香港)有限公司
Interim
Rep
ort 2019 中
期報告

Unit B B/F & G/F, Unit C G/F, 1-3/F, 16/F Rm01 & 18/F Wheelock House, 20 Pedder Street, Central, Hong Kongwww.hk.bankcomm.com
Bank of Communications (Hong Kong) Limited
香港中環畢打街20號會德豐大廈地下B號舖及地庫、地下C號舖、1樓至3樓、16樓01室及18樓www.hk.bankcomm.com
交通銀行(香港)有限公司
Report on Review of Interim Report 2
Unaudited Condensed Statement of Profit or Loss and Other Comprehensive Income 3
Unaudited Condensed Statement of Financial Position 4
Unaudited Condensed Statement of Changes in Equity 5
Unaudited Condensed Statement of Cash Flows 6
Notes to the Unaudited Condensed Financial Statements 7
Contents BANK OF COMMUNICATIONS (HONG KONG) LIMITEDINTERIM REPORT 2019
2 BANK OF COMMUNICATIONS (HONG KONG) LIMITED
Report on Review of Interim Report
TO THE BOARD OF DIRECTORS OF BANK OF COMMUNICATIONS (HONG KONG) LIMITED(incorporated in Hong Kong with limited liability)
IntroductionWe have reviewed the interim report set out on pages 3 to 40, which comprises the interim condensed statement of financial position of Bank of Communications (Hong Kong) Limited (the “Company”) as at 30 June 2019 and the interim condensed statement of profit or loss and other comprehensive income, the interim condensed statement of changes in equity and the interim condensed statement of cash flows for the six-month period then ended, and a summary of significant accounting policies and other explanatory notes. The directors of the Company are responsible for the preparation and presentation of this interim report in accordance with Hong Kong Accounting Standard 34 “Interim Financial Reporting” issued by the Hong Kong Institute of Certified Public Accountants. Our responsibility is to express a conclusion on this interim report based on our review and to report our conclusion solely to you, as a body, in accordance with our agreed terms of engagement and for no other purpose. We do not assume responsibility towards or accept liability to any other person for the contents of this report.
Scope of ReviewWe conducted our review in accordance with Hong Kong Standard on Review Engagements 2410, “Review of Interim Financial Information Performed by the Independent Auditor of the Entity” issued by the Hong Kong Institute of Certified Public Accountants. A review of interim financial information consists of making inquiries, primarily of persons responsible for financial and accounting matters, and applying analytical and other review procedures. A review is substantially less in scope than an audit conducted in accordance with Hong Kong Standards on Auditing and consequently does not enable us to obtain assurance that we would become aware of all significant matters that might be identified in an audit. Accordingly, we do not express an audit opinion.
ConclusionBased on our review, nothing has come to our attention that causes us to believe that the interim report of the Company is not prepared, in all material respects, in accordance with Hong Kong Accounting Standard 34 “Interim Financial Reporting”.
PricewaterhouseCoopersCertified Public Accountants
Hong Kong, 3 September 2019
3INTERIM REPORT 2019
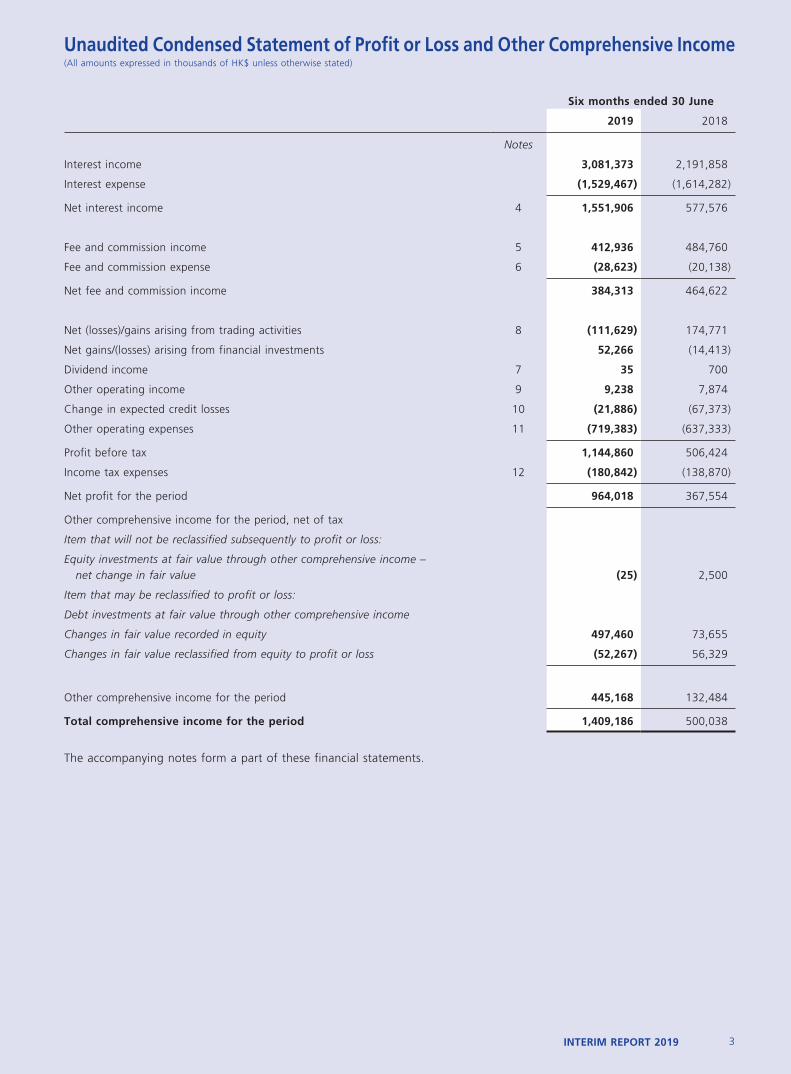
Unaudited Condensed Statement of Profit or Loss and Other Comprehensive Income(All amounts expressed in thousands of HK$ unless otherwise stated)
Six months ended 30 June
2019 2018
Notes
Interest income 3,081,373 2,191,858
Interest expense (1,529,467) (1,614,282)
Net interest income 4 1,551,906 577,576
Fee and commission income 5 412,936 484,760
Fee and commission expense 6 (28,623) (20,138)
Net fee and commission income 384,313 464,622
Net (losses)/gains arising from trading activities 8 (111,629) 174,771
Net gains/(losses) arising from financial investments 52,266 (14,413)
Dividend income 7 35 700
Other operating income 9 9,238 7,874
Change in expected credit losses 10 (21,886) (67,373)
Other operating expenses 11 (719,383) (637,333)
Profit before tax 1,144,860 506,424
Income tax expenses 12 (180,842) (138,870)
Net profit for the period 964,018 367,554
Other comprehensive income for the period, net of tax
Item that will not be reclassified subsequently to profit or loss:
Equity investments at fair value through other comprehensive income – net change in fair value (25) 2,500
Item that may be reclassified to profit or loss:
Debt investments at fair value through other comprehensive income
Changes in fair value recorded in equity 497,460 73,655
Changes in fair value reclassified from equity to profit or loss (52,267) 56,329
Other comprehensive income for the period 445,168 132,484
Total comprehensive income for the period 1,409,186 500,038
The accompanying notes form a part of these financial statements.
4 BANK OF COMMUNICATIONS (HONG KONG) LIMITED
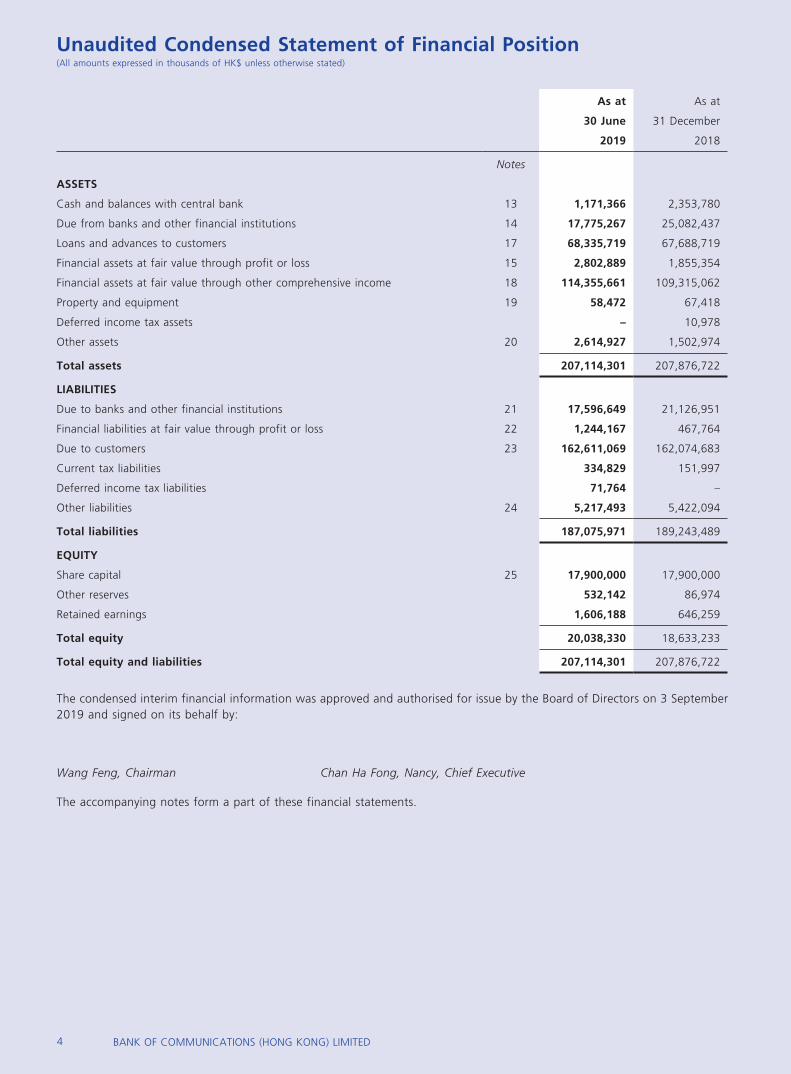
Unaudited Condensed Statement of Financial Position(All amounts expressed in thousands of HK$ unless otherwise stated)
As at As at
30 June 31 December
2019 2018
Notes
ASSETS
Cash and balances with central bank 13 1,171,366 2,353,780
Due from banks and other financial institutions 14 17,775,267 25,082,437
Loans and advances to customers 17 68,335,719 67,688,719
Financial assets at fair value through profit or loss 15 2,802,889 1,855,354
Financial assets at fair value through other comprehensive income 18 114,355,661 109,315,062
Property and equipment 19 58,472 67,418
Deferred income tax assets – 10,978
Other assets 20 2,614,927 1,502,974
Total assets 207,114,301 207,876,722
LIABILITIES
Due to banks and other financial institutions 21 17,596,649 21,126,951
Financial liabilities at fair value through profit or loss 22 1,244,167 467,764
Due to customers 23 162,611,069 162,074,683
Current tax liabilities 334,829 151,997
Deferred income tax liabilities 71,764 –
Other liabilities 24 5,217,493 5,422,094
Total liabilities 187,075,971 189,243,489
EQUITY
Share capital 25 17,900,000 17,900,000
Other reserves 532,142 86,974
Retained earnings 1,606,188 646,259
Total equity 20,038,330 18,633,233
Total equity and liabilities 207,114,301 207,876,722
The condensed interim financial information was approved and authorised for issue by the Board of Directors on 3 September 2019 and signed on its behalf by:
Wang Feng, Chairman Chan Ha Fong, Nancy, Chief Executive
The accompanying notes form a part of these financial statements.
5INTERIM REPORT 2019
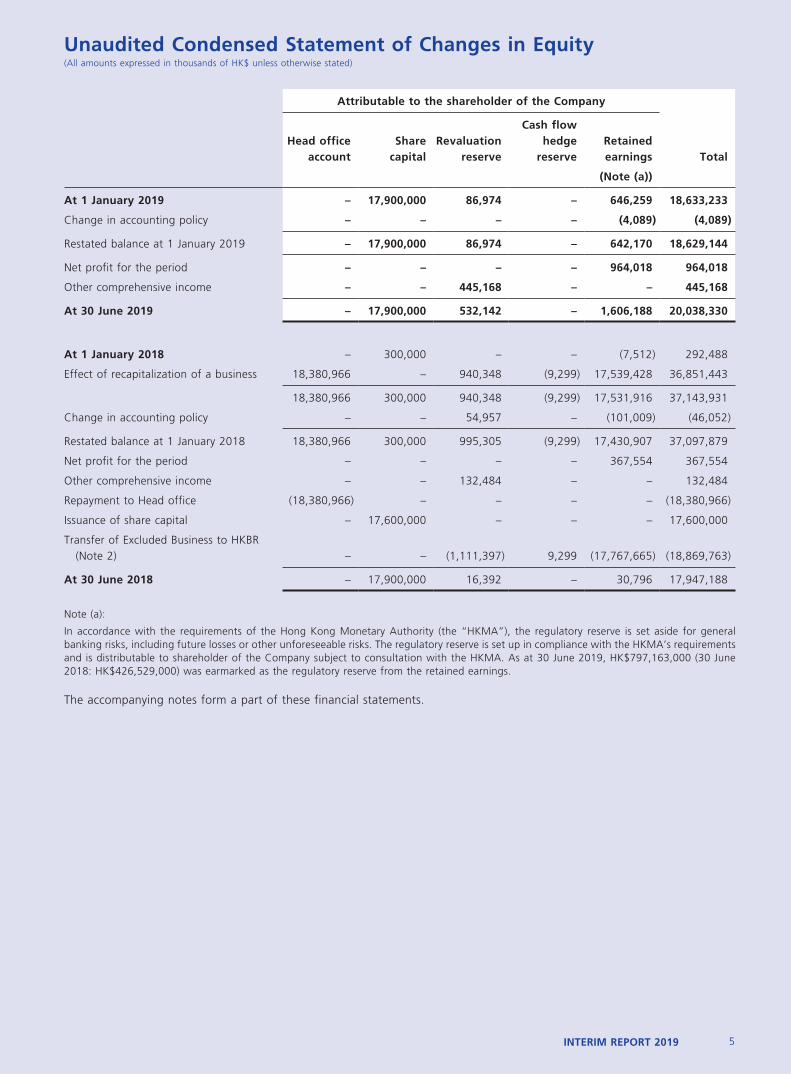
Unaudited Condensed Statement of Changes in Equity(All amounts expressed in thousands of HK$ unless otherwise stated)
Attributable to the shareholder of the Company
Head office account
Share capital
Revaluation reserve
Cash flow hedge
reserveRetained earnings Total
(Note (a))
At 1 January 2019 – 17,900,000 86,974 – 646,259 18,633,233
Change in accounting policy – – – – (4,089) (4,089)
Restated balance at 1 January 2019 – 17,900,000 86,974 – 642,170 18,629,144
Net profit for the period – – – – 964,018 964,018
Other comprehensive income – – 445,168 – – 445,168
At 30 June 2019 – 17,900,000 532,142 – 1,606,188 20,038,330
At 1 January 2018 – 300,000 – – (7,512) 292,488
Effect of recapitalization of a business 18,380,966 – 940,348 (9,299) 17,539,428 36,851,443
18,380,966 300,000 940,348 (9,299) 17,531,916 37,143,931
Change in accounting policy – – 54,957 – (101,009) (46,052)
Restated balance at 1 January 2018 18,380,966 300,000 995,305 (9,299) 17,430,907 37,097,879
Net profit for the period – – – – 367,554 367,554
Other comprehensive income – – 132,484 – – 132,484
Repayment to Head office (18,380,966) – – – – (18,380,966)
Issuance of share capital – 17,600,000 – – – 17,600,000
Transfer of Excluded Business to HKBR (Note 2) – – (1,111,397) 9,299 (17,767,665) (18,869,763)
At 30 June 2018 – 17,900,000 16,392 – 30,796 17,947,188
Note (a):
In accordance with the requirements of the Hong Kong Monetary Authority (the “HKMA”), the regulatory reserve is set aside for general banking risks, including future losses or other unforeseeable risks. The regulatory reserve is set up in compliance with the HKMA’s requirements and is distributable to shareholder of the Company subject to consultation with the HKMA. As at 30 June 2019, HK$797,163,000 (30 June 2018: HK$426,529,000) was earmarked as the regulatory reserve from the retained earnings.
The accompanying notes form a part of these financial statements.
6 BANK OF COMMUNICATIONS (HONG KONG) LIMITED
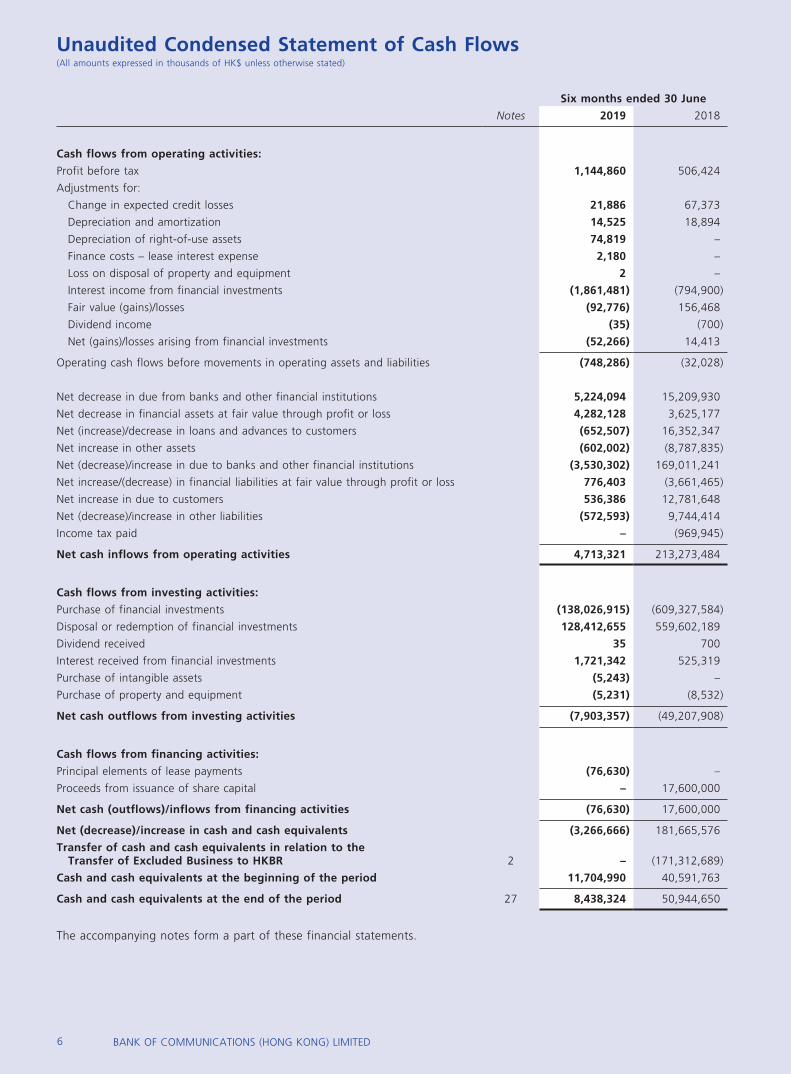
Unaudited Condensed Statement of Cash Flows(All amounts expressed in thousands of HK$ unless otherwise stated)
Six months ended 30 June
Notes 2019 2018
Cash flows from operating activities:
Profit before tax 1,144,860 506,424
Adjustments for:
Change in expected credit losses 21,886 67,373
Depreciation and amortization 14,525 18,894
Depreciation of right-of-use assets 74,819 –
Finance costs – lease interest expense 2,180 –
Loss on disposal of property and equipment 2 –
Interest income from financial investments (1,861,481) (794,900)
Fair value (gains)/losses (92,776) 156,468
Dividend income (35) (700)
Net (gains)/losses arising from financial investments (52,266) 14,413
Operating cash flows before movements in operating assets and liabilities (748,286) (32,028)
Net decrease in due from banks and other financial institutions 5,224,094 15,209,930
Net decrease in financial assets at fair value through profit or loss 4,282,128 3,625,177
Net (increase)/decrease in loans and advances to customers (652,507) 16,352,347
Net increase in other assets (602,002) (8,787,835)
Net (decrease)/increase in due to banks and other financial institutions (3,530,302) 169,011,241
Net increase/(decrease) in financial liabilities at fair value through profit or loss 776,403 (3,661,465)
Net increase in due to customers 536,386 12,781,648
Net (decrease)/increase in other liabilities (572,593) 9,744,414
Income tax paid – (969,945)
Net cash inflows from operating activities 4,713,321 213,273,484
Cash flows from investing activities:
Purchase of financial investments (138,026,915) (609,327,584)
Disposal or redemption of financial investments 128,412,655 559,602,189
Dividend received 35 700
Interest received from financial investments 1,721,342 525,319
Purchase of intangible assets (5,243) –
Purchase of property and equipment (5,231) (8,532)
Net cash outflows from investing activities (7,903,357) (49,207,908)
Cash flows from financing activities:
Principal elements of lease payments (76,630) –
Proceeds from issuance of share capital – 17,600,000
Net cash (outflows)/inflows from financing activities (76,630) 17,600,000
Net (decrease)/increase in cash and cash equivalents (3,266,666) 181,665,576
Transfer of cash and cash equivalents in relation to the Transfer of Excluded Business to HKBR 2 – (171,312,689)
Cash and cash equivalents at the beginning of the period 11,704,990 40,591,763
Cash and cash equivalents at the end of the period 27 8,438,324 50,944,650
The accompanying notes form a part of these financial statements.
7INTERIM REPORT 2019
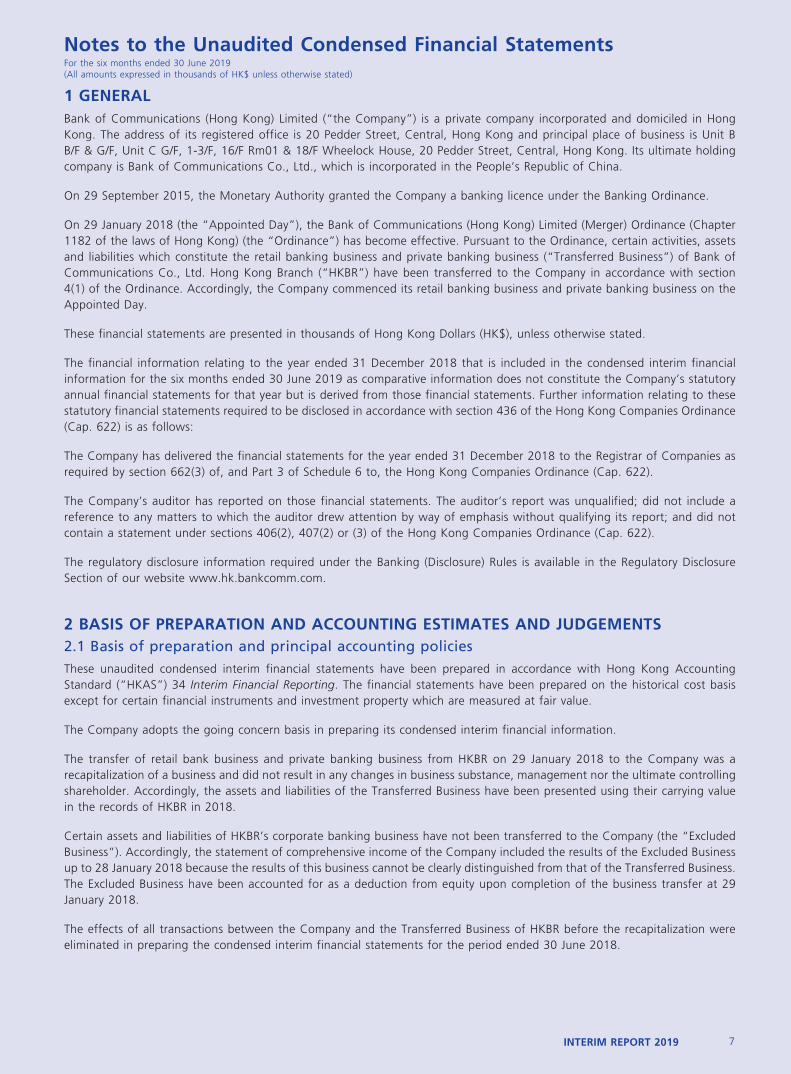
Notes to the Unaudited Condensed Financial StatementsFor the six months ended 30 June 2019(All amounts expressed in thousands of HK$ unless otherwise stated)
1 GENERALBank of Communications (Hong Kong) Limited (“the Company”) is a private company incorporated and domiciled in Hong Kong. The address of its registered office is 20 Pedder Street, Central, Hong Kong and principal place of business is Unit B B/F & G/F, Unit C G/F, 1-3/F, 16/F Rm01 & 18/F Wheelock House, 20 Pedder Street, Central, Hong Kong. Its ultimate holding company is Bank of Communications Co., Ltd., which is incorporated in the People’s Republic of China.
On 29 September 2015, the Monetary Authority granted the Company a banking licence under the Banking Ordinance.
On 29 January 2018 (the “Appointed Day”), the Bank of Communications (Hong Kong) Limited (Merger) Ordinance (Chapter 1182 of the laws of Hong Kong) (the “Ordinance”) has become effective. Pursuant to the Ordinance, certain activities, assets and liabilities which constitute the retail banking business and private banking business (“Transferred Business”) of Bank of Communications Co., Ltd. Hong Kong Branch (“HKBR”) have been transferred to the Company in accordance with section 4(1) of the Ordinance. Accordingly, the Company commenced its retail banking business and private banking business on the Appointed Day.
These financial statements are presented in thousands of Hong Kong Dollars (HK$), unless otherwise stated.
The financial information relating to the year ended 31 December 2018 that is included in the condensed interim financial information for the six months ended 30 June 2019 as comparative information does not constitute the Company’s statutory annual financial statements for that year but is derived from those financial statements. Further information relating to these statutory financial statements required to be disclosed in accordance with section 436 of the Hong Kong Companies Ordinance (Cap. 622) is as follows:
The Company has delivered the financial statements for the year ended 31 December 2018 to the Registrar of Companies as required by section 662(3) of, and Part 3 of Schedule 6 to, the Hong Kong Companies Ordinance (Cap. 622).
The Company’s auditor has reported on those financial statements. The auditor’s report was unqualified; did not include a reference to any matters to which the auditor drew attention by way of emphasis without qualifying its report; and did not contain a statement under sections 406(2), 407(2) or (3) of the Hong Kong Companies Ordinance (Cap. 622).
The regulatory disclosure information required under the Banking (Disclosure) Rules is available in the Regulatory Disclosure Section of our website www.hk.bankcomm.com.
2 BASIS OF PREPARATION AND ACCOUNTING ESTIMATES AND JUDGEMENTS2.1 Basis of preparation and principal accounting policiesThese unaudited condensed interim financial statements have been prepared in accordance with Hong Kong Accounting Standard (“HKAS”) 34 Interim Financial Reporting. The financial statements have been prepared on the historical cost basis except for certain financial instruments and investment property which are measured at fair value.
The Company adopts the going concern basis in preparing its condensed interim financial information.
The transfer of retail bank business and private banking business from HKBR on 29 January 2018 to the Company was a recapitalization of a business and did not result in any changes in business substance, management nor the ultimate controlling shareholder. Accordingly, the assets and liabilities of the Transferred Business have been presented using their carrying value in the records of HKBR in 2018.
Certain assets and liabilities of HKBR’s corporate banking business have not been transferred to the Company (the “Excluded Business”). Accordingly, the statement of comprehensive income of the Company included the results of the Excluded Business up to 28 January 2018 because the results of this business cannot be clearly distinguished from that of the Transferred Business. The Excluded Business have been accounted for as a deduction from equity upon completion of the business transfer at 29 January 2018.
The effects of all transactions between the Company and the Transferred Business of HKBR before the recapitalization were eliminated in preparing the condensed interim financial statements for the period ended 30 June 2018.
8 BANK OF COMMUNICATIONS (HONG KONG) LIMITED
Notes to the Unaudited Condensed Financial StatementsFor the six months ended 30 June 2019(All amounts expressed in thousands of HK$ unless otherwise stated)
2 BASIS OF PREPARATION AND ACCOUNTING ESTIMATES AND JUDGEMENTS (continued)
2.1 Basis of preparation and principal accounting policies (continued)
These unaudited condensed financial statements of the Company do not include all the notes of the types normally included in annual financial statement. Accordingly, these unaudited condensed financial statements should be read in conjunction with the annual financial statements for the year ended 31 December 2018.
Except as described below, the Company’s accounting policies applied in preparing these unaudited condensed financial statements are consistent with those policies applied in preparing the financial statements for the year ended 31 December 2018.
2.1.1 New and revised HKFRSs effective by 1 January 2019 applied by the Company
HKFRIC 23 Uncertainty over income tax
HKFRS 16 Leases
Amendments to HKFRS 9 Prepayment Features with Negative Compensation and Modifications of Financial Liabilities
The impact of the adoption of Hong Kong Financial Reporting Standard (“HKFRS”) 16 and the new accounting policies are disclosed in note 2.2 below. The other standards did not have any impact on the Company’s accounting policies and did not require retrospective adjustments.
2.2 Changes in accounting policiesThis note explains the impact of the adoption of HKFRS 16 Leases on the Company’s financial statements and discloses the new accounting policies that have been applied from 1 January 2019 in note 2.2(b) below.
The Company has adopted HKFRS 16 retrospectively from 1 January 2019, but has not restated comparatives for the 2018 reporting period, as permitted under the specific transitional provisions in the standard. The reclassifications and the adjustments arising from the new leasing rules are therefore recognized in the opening statement of financial position on 1 January 2019.
(a) Adjustments recognized on adoption of HKFRS 16
On adoption of HKFRS 16, the Company recognized lease liabilities in relation to leases which had previously been classified as ‘operating leases’ under the principles of HKAS 17 Leases. These liabilities were measured at the present value of the remaining lease payments, discounted using the lessee’s incremental borrowing rate as of 1 January 2019. The weighted average lessee’s incremental borrowing rate applied to the lease liabilities on 1 January 2019 was 1.3%.
2019
Operating lease commitments disclosed as at 31 December 2018 (Note (a)) –
Add: New lease liability recognized as at 1 January 2019 207,291
Lease liability recognized as at 1 January 2019 207,291
Note(a): As at 31 December 2018, certain lease agreements have been signed by HKBR which the lease are used by the Company. The Company does not have any commitment with respect to these operating lease commitment.
9INTERIM REPORT 2019
Notes to the Unaudited Condensed Financial StatementsFor the six months ended 30 June 2019(All amounts expressed in thousands of HK$ unless otherwise stated)
2 BASIS OF PREPARATION AND ACCOUNTING ESTIMATES AND JUDGEMENTS (continued)
2.2 Changes in accounting policies (continued)
(a) Adjustments recognized on adoption of HKFRS 16 (continued)
The right-of-use assets were measured at the amount equal to the lease liability, adjusted by the amount of any prepaid or accrued lease payments relating to that lease recognized in the statement of financial position as at 31 December 2018. There were no onerous lease contracts that would have required an adjustment to the right-of-use assets at the date of initial application.
The recognized right-of-use assets relate to the following types of assets:
30 June 2019 1 January 2019
Properties 354,172 188,374
Equipment 11,763 15,198
Advertising 45 70
Total right-of-use assets 365,980 203,642
The change in accounting policy affected the following items in the statement of financial position on 1 January 2019:
• right-of-use assets – increase by HK$203,642,000
• prepayments – decrease by HK$440,000
• lease liabilities – increase by HK$207,291,000
The net impact on retained earnings on 1 January 2019 was a decrease of HK$4,089,000.
(i) Practical expedients applied
In applying HKFRS 16 for the first time, the Company has used the following practical expedients permitted by the standard:
• the use of a single discount rate to a portfolio of leases with reasonably similar characteristics,
• reliance on previous assessments on whether leases are onerous,
• the accounting for operating leases with a remaining lease term of less than 12 months as at 1 January 2019 as short-term leases,
• the exclusion of initial direct costs for the measurement of the right-of-use asset at the date of initial application, and
• the use of hindsight in determining the lease term where the contract contains options to extend or terminate the lease.
The Company has also elected not to reassess whether a contract is, or contains a lease at the date of initial application. Instead, for contracts entered into before the transition date the Company relied on its assessment made applying HKAS 17 and HKFRIC 4 Determining whether an Arrangement contains a Lease.
10 BANK OF COMMUNICATIONS (HONG KONG) LIMITED
Notes to the Unaudited Condensed Financial StatementsFor the six months ended 30 June 2019(All amounts expressed in thousands of HK$ unless otherwise stated)
2 BASIS OF PREPARATION AND ACCOUNTING ESTIMATES AND JUDGEMENTS (continued)
2.2 Changes in accounting policies (continued)
(b) The Company’s leasing activities and how these are accounted for
The Company leases various retail stores, equipment and advertising spaces. Rental contracts are typically made for fixed periods of 1 to 8 years but may have extension options as described in (i) below. Lease terms are negotiated on an individual basis and contain a wide range of different terms and conditions. The lease agreements do not impose any covenants, but leased assets may not be used as security for borrowing purposes.
Until the 2018 financial year, leases of property, plant and equipment were classified as either finance or operating leases. Payments made under operating leases (net of any incentives received from the lessor) were charged to profit or loss on a straight-line basis over the period of the lease.
From 1 January 2019, leases are recognized as a right-of-use asset and a corresponding liability at the date at which the leased asset is available for use by the Company. Each lease payment is allocated between the liability and finance cost. The finance cost is charged to profit or loss over the lease period so as to produce a constant periodic rate of interest on the remaining balance of the liability for each period. The right-of-use asset is depreciated over the shorter of the asset’s useful life and the lease term on a straight-line basis.
The lease payments are discounted using the interest rate implicit in the lease. If that rate cannot be determined, the lessee’s incremental borrowing rate is used, being the rate that the lessee would have to pay to borrow the funds necessary to obtain an asset of similar value in a similar economic environment with similar terms and conditions.
Right-of-use assets are measured at cost comprising the following:
• the amount of the initial measurement of lease liability,
• any lease payments made at or before the commencement date less any lease incentives received,
• any initial direct costs, and
• restoration costs.
Payments associated with short-term leases is recognized on a straight-line basis as an expense in profit or loss. Short-term leases are leases with a lease term of 12 months or less.
(i) Extension and termination options
Extension and termination options are included in a number of retail stores across the Company. These terms are used to maximise operational flexibility in terms of managing contracts. The majority of extension and termination options held are exercisable only by the Company and not by the respective lessor.
2.3 Critical accounting estimates and judgments in applying accounting policiesThe preparation of unaudited condensed interim financial information requires management to make judgements, estimates and assumptions that affect the application of accounting policies and the reported amounts of assets and liabilities, income and expense. Actual results may differ from these estimates.
In preparing this unaudited condensed interim financial information, the significant judgements made by management in applying the Company’s accounting policies and the key sources of estimation uncertainty were the same as those that applied to the financial statements for the year ended 31 December 2018.
11INTERIM REPORT 2019
Notes to the Unaudited Condensed Financial StatementsFor the six months ended 30 June 2019(All amounts expressed in thousands of HK$ unless otherwise stated)
3 FINANCIAL RISK MANAGEMENT3.1 Credit risk3.1.1 Expected credit loss measurement
3.1.1.1 Measuring ECL – Explanation of inputs, assumptions and estimation techniques
The ECL is measured on either a 12-month or lifetime basis depending on whether a significant increase in credit risk has occurred since initial recognition or whether an asset is considered to be credit-impaired. Expected credit losses are the discounted product of the Probability of Default (PD), Exposure at Default (EAD), and Loss Given Default (LGD), defined as follows:
• The PD represents the likelihood of a borrower defaulting on its financial obligation, either over the next 12 months (12M PD), or over the remaining lifetime (Lifetime PD) of the obligation.
• EAD is based on the amounts the Company expects to be owed at the time of default. For example, for a revolving commitment, the Company includes the current drawn balance plus any further amount that is expected to be drawn up to the current contractual limit by the time of default, should it occur.
• LGD represents the Company’s expectation of the extent of loss on a defaulted exposure. LGD varies by type of counterparty, type and seniority of claim and availability of collateral or other credit support. LGD is expressed as a percentage loss per unit of exposure at the time of default (EAD).
The ECL is determined by projecting the PD, LGD and EAD for each future year and for each individual exposure. These three components are multiplied together and adjusted for the likelihood of survival (i.e. the exposure has not prepaid or defaulted in an earlier year). This effectively calculates an ECL for each future year, which is then discounted back to the reporting date and summed. The discount rate used in the ECL calculation is the original effective interest rate or an approximation thereof.
The Lifetime PD is developed by using forecasted macroeconomic factor to calculate a forecasted 12M PD for the 2nd to 5th year. For the years after the fifth year, it is assumed that the PD will remain the same.
EAD represents the total amount of on-balance sheet and off-balance sheet exposure at the time of default by debtor, reflecting the total amount of possible losses to be incurred. In general, this includes the utilized credit limit, interest receivable, the anticipated usage of unused credit facilities as well as the related expenses to be incurred.
LGDs are determined based on the factors which impact the recoveries made post default. These vary by product type.
• For secured products, this is primarily based on collateral type and projected collateral values, historical discounts to market/book values due to forced sales, time to repossession and recovery costs observed.
• For unsecured products, LGD’s are typically set at product level due to the limited differentiation in recoveries achieved across different borrowers. These LGD’s are influenced by collection strategies, including contracted debt sales and price.
3.1.1.2 Forward-looking information incorporated in the ECL models
The assessment of SICR and the calculation of ECL both incorporate forward-looking information. The Company has performed historical analysis and identified the key economic variables impacting credit risk and expected credit losses for each portfolio.
These economic variables and their associated impact on the PD, EAD and LGD vary by financial instrument. Expert judgment has also been applied in this process. Forecasts of these economic variables (the “base economic scenario”) over the next five years are gathered from economics team of the Bank of Communications Co. Ltd., HKBR’s Development Strategy Team and the International Monetary Fund (IMF). After five years, economic variables are assumed to remain stable and the last available forecast is used. The impact of these economic variables on the PD, EAD and LGD has been determined by performing statistical regression analysis to understand the impact changes in these variables have had historically on default rates and on the components of LGD and EAD.
12 BANK OF COMMUNICATIONS (HONG KONG) LIMITED
Notes to the Unaudited Condensed Financial StatementsFor the six months ended 30 June 2019(All amounts expressed in thousands of HK$ unless otherwise stated)
3 FINANCIAL RISK MANAGEMENT (continued)
3.1 Credit risk (continued)
3.1.1 Expected credit loss measurement (continued)
3.1.1.2 Forward-looking information incorporated in the ECL models (continued)
In addition to the base economic scenario, the Company’s Risk Management Department and Development Strategy Team have also considered other economic scenarios which are calculated using historical data, along with weightings for each of the scenarios. The number of other scenarios used is set based on the analysis of each major product type to ensure non-linearities are captured. The number of scenarios and their attributes are reassessed at each reporting date. At 1 January 2019 and 30 June 2019, the Company concluded that three scenarios appropriately captured non-linearities. The scenario weightings are determined by a combination of statistical analysis and expert credit judgement, taking account of the range of possible outcomes each chosen scenario is representative of.
Following this assessment, the Company then measures ECL as either a probability weighted 12 month ECL (Stage 1), or a probability weighted lifetime ECL (Stages 2 and 3). These probability-weighted ECLs are determined by running each scenario through the relevant ECL model and multiplying it by the appropriate scenario weighting (as opposed to weighting the inputs).
As with any economic forecasts, the projections and likelihoods of occurrence are subject to a high degree of inherent uncertainty and therefore the actual outcomes may be significantly different to those projected. The Company considers these forecasts to represent its best estimate of the possible outcomes and has analyzed the non-linearities and asymmetries within the Company’s different portfolios to establish that the chosen scenarios are appropriately representative of the range of possible scenarios. The proposed macroeconomic forecasts and probability weightings are subject to management review.
Economic variable assumptions
The Company has adopted the use of three economic scenarios for all portfolios. They represent a “most likely outcome”, (the Base scenario) and two, less likely, “outer” scenarios on either side of the Base, referred to as an “Upside” and a “Downside” scenario respectively.
13INTERIM REPORT 2019
Notes to the Unaudited Condensed Financial StatementsFor the six months ended 30 June 2019(All amounts expressed in thousands of HK$ unless otherwise stated)
3 FINANCIAL RISK MANAGEMENT (continued)
3.1 Credit risk (continued)
3.1.1 Expected credit loss measurement (continued)
3.1.1.2 Forward-looking information incorporated in the ECL models (continued)
Economic variable assumptions (continued)
There were no material changes to economic scenarios in the first half of 2019 except for the update of key economic assumptions.
Other forward-looking considerations not otherwise incorporated within the above scenarios, such as the impact of any regulatory, legislative or political changes, have also been considered, but are not deemed to have a material impact and therefore no adjustment has been made to the ECL for such factors. This is reviewed and monitored for appropriateness on a quarterly basis.
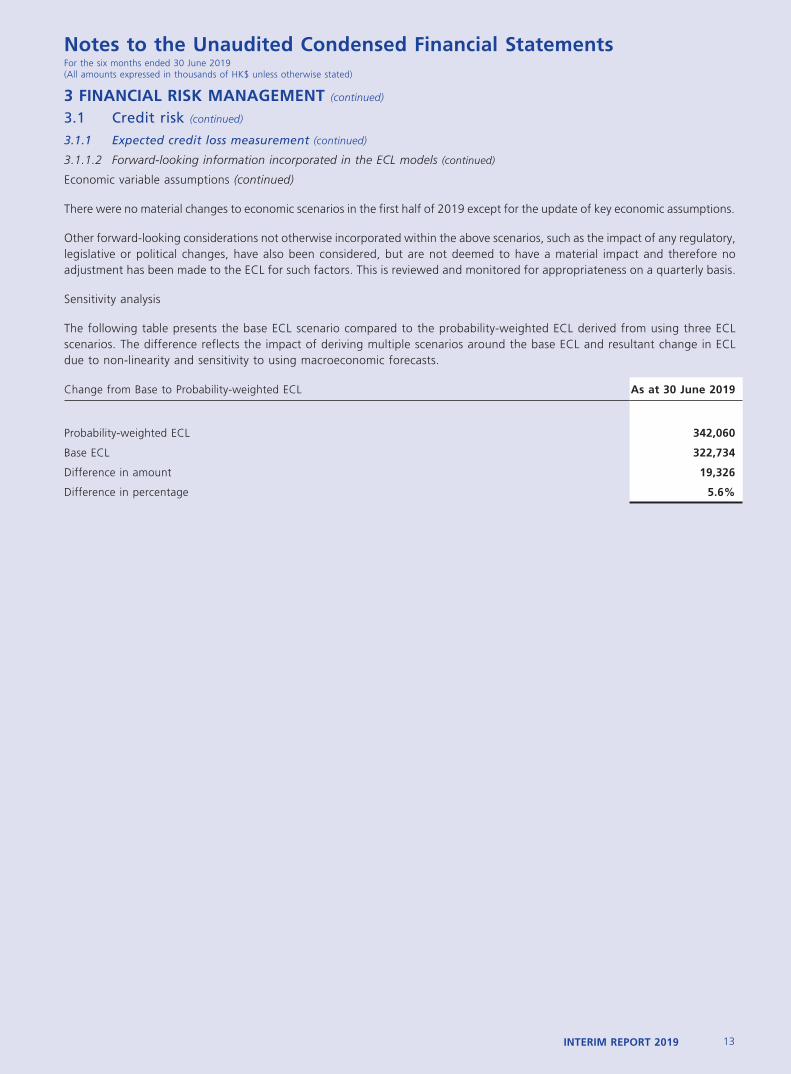
Sensitivity analysis
The following table presents the base ECL scenario compared to the probability-weighted ECL derived from using three ECL scenarios. The difference reflects the impact of deriving multiple scenarios around the base ECL and resultant change in ECL due to non-linearity and sensitivity to using macroeconomic forecasts.
Change from Base to Probability-weighted ECL As at 30 June 2019
Probability-weighted ECL 342,060
Base ECL 322,734
Difference in amount 19,326
Difference in percentage 5.6%
14 BANK OF COMMUNICATIONS (HONG KONG) LIMITED
Notes to the Unaudited Condensed Financial StatementsFor the six months ended 30 June 2019(All amounts expressed in thousands of HK$ unless otherwise stated)
3 FINANCIAL RISK MANAGEMENT (continued)
3.1 Credit risk (continued)
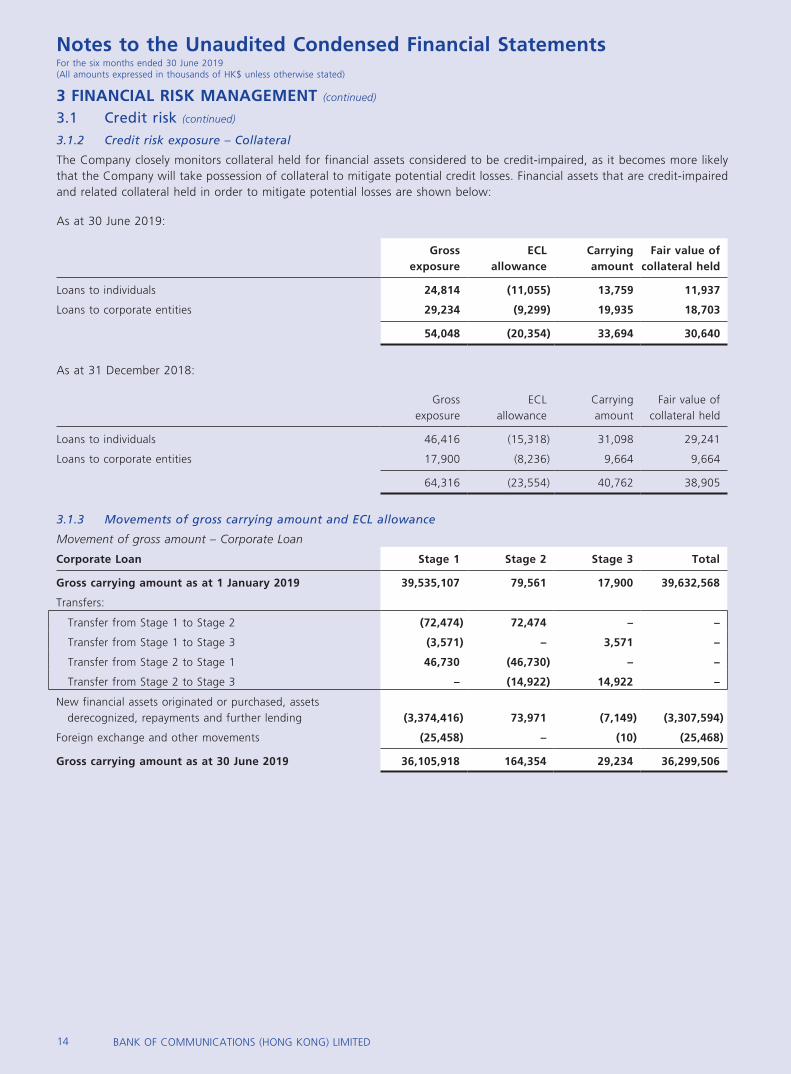
3.1.2 Credit risk exposure – Collateral
The Company closely monitors collateral held for financial assets considered to be credit-impaired, as it becomes more likely that the Company will take possession of collateral to mitigate potential credit losses. Financial assets that are credit-impaired and related collateral held in order to mitigate potential losses are shown below:
As at 30 June 2019:
Gross exposure
ECL allowance
Carrying amount
Fair value of collateral held
Loans to individuals 24,814 (11,055) 13,759 11,937
Loans to corporate entities 29,234 (9,299) 19,935 18,703
54,048 (20,354) 33,694 30,640
As at 31 December 2018:
Gross exposure
ECL allowance
Carrying amount
Fair value of collateral held
Loans to individuals 46,416 (15,318) 31,098 29,241
Loans to corporate entities 17,900 (8,236) 9,664 9,664
64,316 (23,554) 40,762 38,905
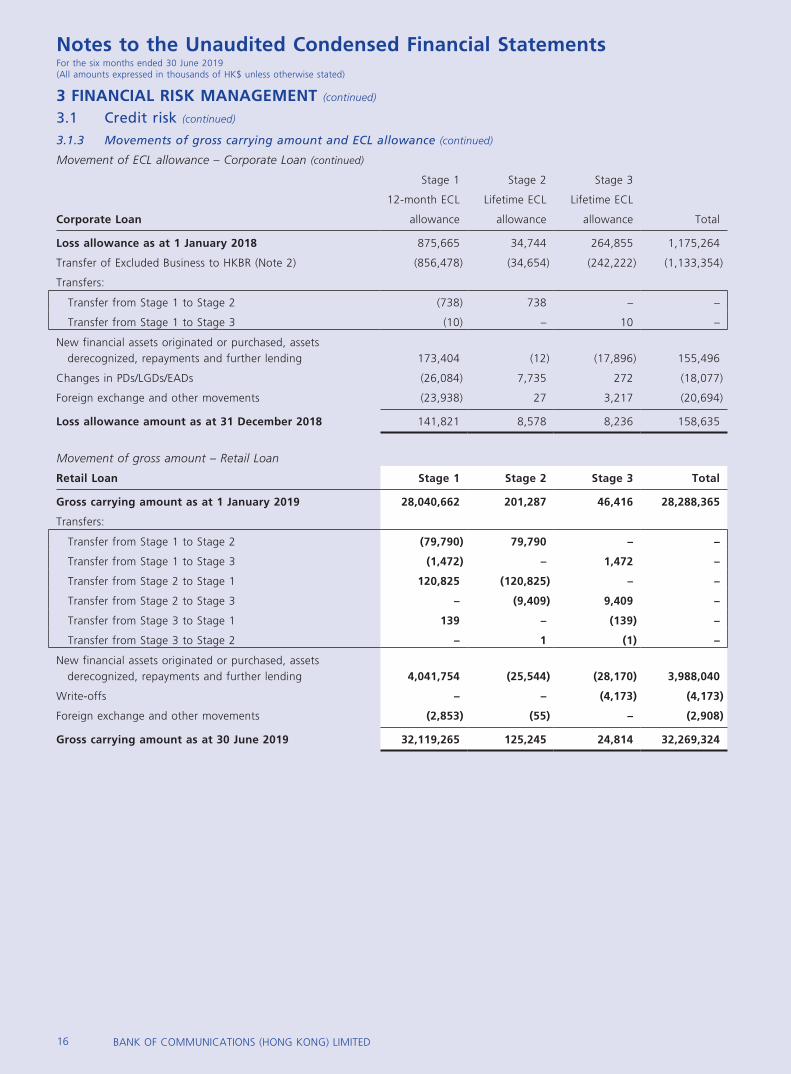
3.1.3 Movements of gross carrying amount and ECL allowance
Movement of gross amount – Corporate Loan
Corporate Loan Stage 1 Stage 2 Stage 3 Total
Gross carrying amount as at 1 January 2019 39,535,107 79,561 17,900 39,632,568
Transfers:
Transfer from Stage 1 to Stage 2 (72,474) 72,474 – –
Transfer from Stage 1 to Stage 3 (3,571) – 3,571 –
Transfer from Stage 2 to Stage 1 46,730 (46,730) – –
Transfer from Stage 2 to Stage 3 – (14,922) 14,922 –
New financial assets originated or purchased, assets derecognized, repayments and further lending (3,374,416) 73,971 (7,149) (3,307,594)
Foreign exchange and other movements (25,458) – (10) (25,468)
Gross carrying amount as at 30 June 2019 36,105,918 164,354 29,234 36,299,506
15INTERIM REPORT 2019
Notes to the Unaudited Condensed Financial StatementsFor the six months ended 30 June 2019(All amounts expressed in thousands of HK$ unless otherwise stated)
3 FINANCIAL RISK MANAGEMENT (continued)
3.1 Credit risk (continued)
3.1.3 Movements of gross carrying amount and ECL allowance (continued)
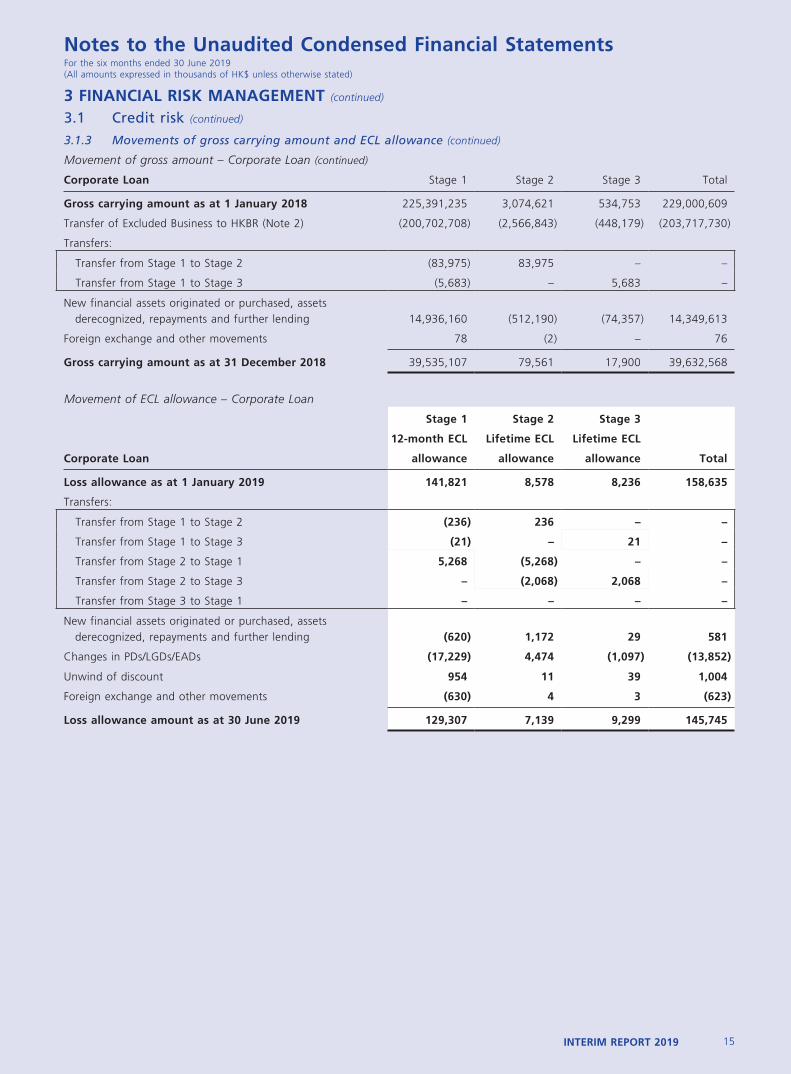
Movement of gross amount – Corporate Loan (continued)
Corporate Loan Stage 1 Stage 2 Stage 3 Total
Gross carrying amount as at 1 January 2018 225,391,235 3,074,621 534,753 229,000,609
Transfer of Excluded Business to HKBR (Note 2) (200,702,708) (2,566,843) (448,179) (203,717,730)
Transfers:
Transfer from Stage 1 to Stage 2 (83,975) 83,975 – –
Transfer from Stage 1 to Stage 3 (5,683) – 5,683 –
New financial assets originated or purchased, assets derecognized, repayments and further lending 14,936,160 (512,190) (74,357) 14,349,613
Foreign exchange and other movements 78 (2) – 76
Gross carrying amount as at 31 December 2018 39,535,107 79,561 17,900 39,632,568
Movement of ECL allowance – Corporate Loan
Stage 1 Stage 2 Stage 3
12-month ECL Lifetime ECL Lifetime ECL
Corporate Loan allowance allowance allowance Total
Loss allowance as at 1 January 2019 141,821 8,578 8,236 158,635
Transfers:
Transfer from Stage 1 to Stage 2 (236) 236 – –
Transfer from Stage 1 to Stage 3 (21) – 21 –
Transfer from Stage 2 to Stage 1 5,268 (5,268) – –
Transfer from Stage 2 to Stage 3 – (2,068) 2,068 –
Transfer from Stage 3 to Stage 1 – – – –
New financial assets originated or purchased, assets derecognized, repayments and further lending (620) 1,172 29 581
Changes in PDs/LGDs/EADs (17,229) 4,474 (1,097) (13,852)
Unwind of discount 954 11 39 1,004
Foreign exchange and other movements (630) 4 3 (623)
Loss allowance amount as at 30 June 2019 129,307 7,139 9,299 145,745
16 BANK OF COMMUNICATIONS (HONG KONG) LIMITED
Notes to the Unaudited Condensed Financial StatementsFor the six months ended 30 June 2019(All amounts expressed in thousands of HK$ unless otherwise stated)
3 FINANCIAL RISK MANAGEMENT (continued)
3.1 Credit risk (continued)
3.1.3 Movements of gross carrying amount and ECL allowance (continued)
Movement of ECL allowance – Corporate Loan (continued)
Stage 1 Stage 2 Stage 3
12-month ECL Lifetime ECL Lifetime ECL
Corporate Loan allowance allowance allowance Total
Loss allowance as at 1 January 2018 875,665 34,744 264,855 1,175,264
Transfer of Excluded Business to HKBR (Note 2) (856,478) (34,654) (242,222) (1,133,354)
Transfers:
Transfer from Stage 1 to Stage 2 (738) 738 – –
Transfer from Stage 1 to Stage 3 (10) – 10 –
New financial assets originated or purchased, assets derecognized, repayments and further lending 173,404 (12) (17,896) 155,496
Changes in PDs/LGDs/EADs (26,084) 7,735 272 (18,077)
Foreign exchange and other movements (23,938) 27 3,217 (20,694)
Loss allowance amount as at 31 December 2018 141,821 8,578 8,236 158,635
Movement of gross amount – Retail Loan
Retail Loan Stage 1 Stage 2 Stage 3 Total
Gross carrying amount as at 1 January 2019 28,040,662 201,287 46,416 28,288,365
Transfers:
Transfer from Stage 1 to Stage 2 (79,790) 79,790 – –
Transfer from Stage 1 to Stage 3 (1,472) – 1,472 –
Transfer from Stage 2 to Stage 1 120,825 (120,825) – –
Transfer from Stage 2 to Stage 3 – (9,409) 9,409 –
Transfer from Stage 3 to Stage 1 139 – (139) –
Transfer from Stage 3 to Stage 2 – 1 (1) –
New financial assets originated or purchased, assets derecognized, repayments and further lending 4,041,754 (25,544) (28,170) 3,988,040
Write-offs – – (4,173) (4,173)
Foreign exchange and other movements (2,853) (55) – (2,908)32,186,979 125,245 24,814 32,337,038
Gross carrying amount as at 30 June 2019 32,119,265 125,245 24,814 32,269,324
17INTERIM REPORT 2019
Notes to the Unaudited Condensed Financial StatementsFor the six months ended 30 June 2019(All amounts expressed in thousands of HK$ unless otherwise stated)
3 FINANCIAL RISK MANAGEMENT (continued)
3.1 Credit risk (continued)
3.1.3 Movements of gross carrying amount and ECL allowance (continued)
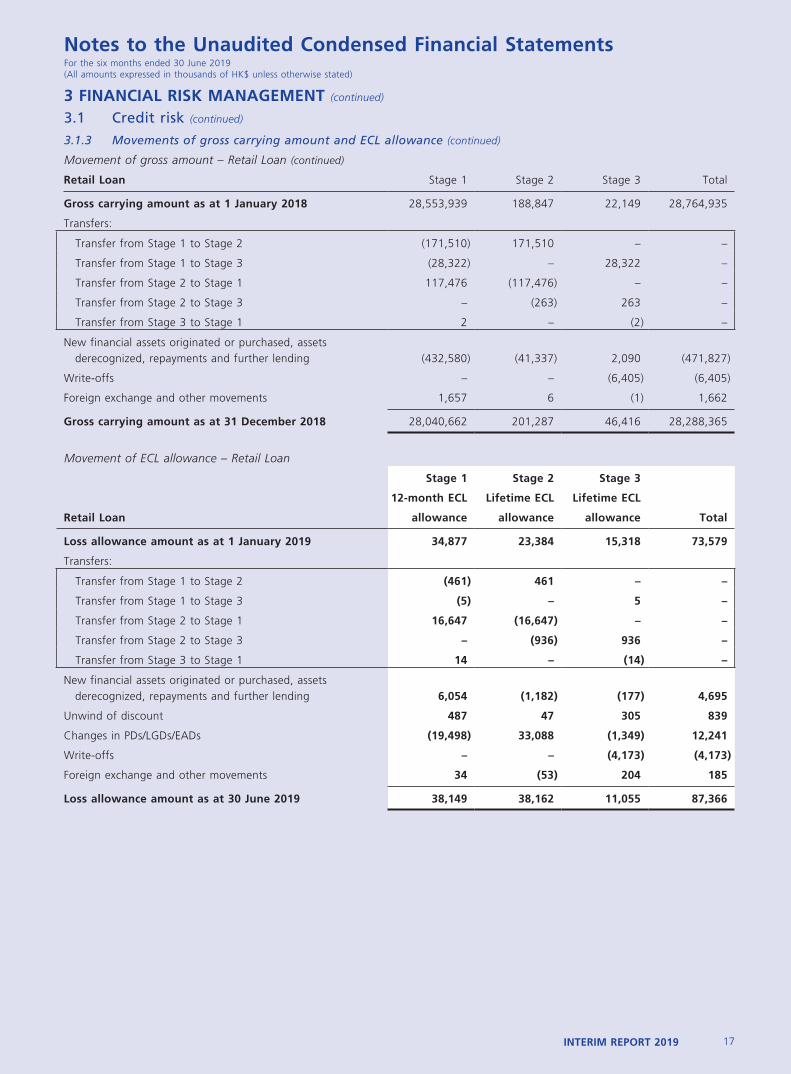
Movement of gross amount – Retail Loan (continued)
Retail Loan Stage 1 Stage 2 Stage 3 Total
Gross carrying amount as at 1 January 2018 28,553,939 188,847 22,149 28,764,935
Transfers:
Transfer from Stage 1 to Stage 2 (171,510) 171,510 – –
Transfer from Stage 1 to Stage 3 (28,322) – 28,322 –
Transfer from Stage 2 to Stage 1 117,476 (117,476) – –
Transfer from Stage 2 to Stage 3 – (263) 263 –
Transfer from Stage 3 to Stage 1 2 – (2) –
New financial assets originated or purchased, assets derecognized, repayments and further lending (432,580) (41,337) 2,090 (471,827)
Write-offs – – (6,405) (6,405)
Foreign exchange and other movements 1,657 6 (1) 1,662
Gross carrying amount as at 31 December 2018 28,040,662 201,287 46,416 28,288,365
Movement of ECL allowance – Retail Loan
Stage 1 Stage 2 Stage 3
12-month ECL Lifetime ECL Lifetime ECL
Retail Loan allowance allowance allowance Total
Loss allowance amount as at 1 January 2019 34,877 23,384 15,318 73,579
Transfers:
Transfer from Stage 1 to Stage 2 (461) 461 – –
Transfer from Stage 1 to Stage 3 (5) – 5 –
Transfer from Stage 2 to Stage 1 16,647 (16,647) – –
Transfer from Stage 2 to Stage 3 – (936) 936 –
Transfer from Stage 3 to Stage 1 14 – (14) –
New financial assets originated or purchased, assets derecognized, repayments and further lending 6,054 (1,182) (177) 4,695
Unwind of discount 487 47 305 839
Changes in PDs/LGDs/EADs (19,498) 33,088 (1,349) 12,241
Write-offs – – (4,173) (4,173)
Foreign exchange and other movements 34 (53) 204 185
Loss allowance amount as at 30 June 2019 38,149 38,162 11,055 87,366
18 BANK OF COMMUNICATIONS (HONG KONG) LIMITED
Notes to the Unaudited Condensed Financial StatementsFor the six months ended 30 June 2019(All amounts expressed in thousands of HK$ unless otherwise stated)
3 FINANCIAL RISK MANAGEMENT (continued)
3.1 Credit risk (continued)
3.1.3 Movements of gross carrying amount and ECL allowance (continued)
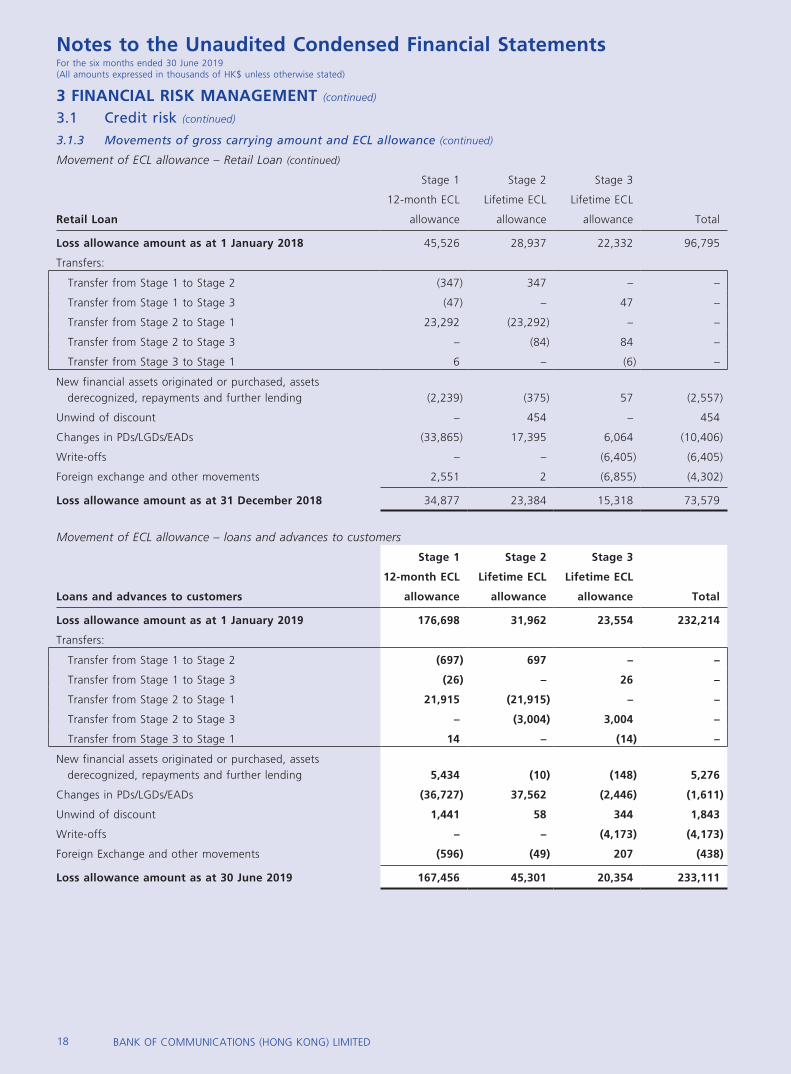
Movement of ECL allowance – Retail Loan (continued)
Stage 1 Stage 2 Stage 3
12-month ECL Lifetime ECL Lifetime ECL
Retail Loan allowance allowance allowance Total
Loss allowance amount as at 1 January 2018 45,526 28,937 22,332 96,795
Transfers:
Transfer from Stage 1 to Stage 2 (347) 347 – –
Transfer from Stage 1 to Stage 3 (47) – 47 –
Transfer from Stage 2 to Stage 1 23,292 (23,292) – –
Transfer from Stage 2 to Stage 3 – (84) 84 –
Transfer from Stage 3 to Stage 1 6 – (6) –
New financial assets originated or purchased, assets derecognized, repayments and further lending (2,239) (375) 57 (2,557)
Unwind of discount – 454 – 454
Changes in PDs/LGDs/EADs (33,865) 17,395 6,064 (10,406)
Write-offs – – (6,405) (6,405)
Foreign exchange and other movements 2,551 2 (6,855) (4,302)
Loss allowance amount as at 31 December 2018 34,877 23,384 15,318 73,579
Movement of ECL allowance – loans and advances to customers
Stage 1 Stage 2 Stage 3
12-month ECL Lifetime ECL Lifetime ECL
Loans and advances to customers allowance allowance allowance Total
Loss allowance amount as at 1 January 2019 176,698 31,962 23,554 232,214
Transfers:
Transfer from Stage 1 to Stage 2 (697) 697 – –
Transfer from Stage 1 to Stage 3 (26) – 26 –
Transfer from Stage 2 to Stage 1 21,915 (21,915) – –
Transfer from Stage 2 to Stage 3 – (3,004) 3,004 –
Transfer from Stage 3 to Stage 1 14 – (14) –
New financial assets originated or purchased, assets derecognized, repayments and further lending 5,434 (10) (148) 5,276
Changes in PDs/LGDs/EADs (36,727) 37,562 (2,446) (1,611)
Unwind of discount 1,441 58 344 1,843
Write-offs – – (4,173) (4,173)
Foreign Exchange and other movements (596) (49) 207 (438)
Loss allowance amount as at 30 June 2019 167,456 45,301 20,354 233,111
19INTERIM REPORT 2019
Notes to the Unaudited Condensed Financial StatementsFor the six months ended 30 June 2019(All amounts expressed in thousands of HK$ unless otherwise stated)
3 FINANCIAL RISK MANAGEMENT (continued)
3.1 Credit risk (continued)
3.1.3 Movements of gross carrying amount and ECL allowance (continued)
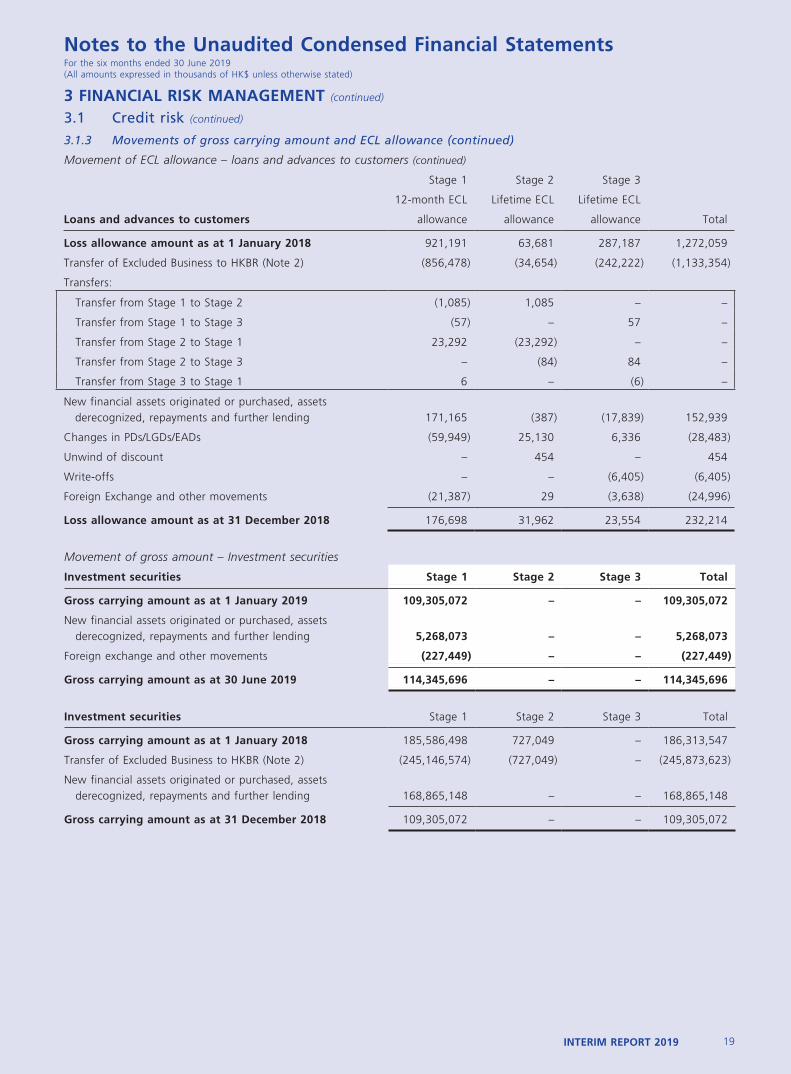
Movement of ECL allowance – loans and advances to customers (continued)
Stage 1 Stage 2 Stage 3
12-month ECL Lifetime ECL Lifetime ECL
Loans and advances to customers allowance allowance allowance Total
Loss allowance amount as at 1 January 2018 921,191 63,681 287,187 1,272,059
Transfer of Excluded Business to HKBR (Note 2) (856,478) (34,654) (242,222) (1,133,354)
Transfers:
Transfer from Stage 1 to Stage 2 (1,085) 1,085 – –
Transfer from Stage 1 to Stage 3 (57) – 57 –
Transfer from Stage 2 to Stage 1 23,292 (23,292) – –
Transfer from Stage 2 to Stage 3 – (84) 84 –
Transfer from Stage 3 to Stage 1 6 – (6) –
New financial assets originated or purchased, assets derecognized, repayments and further lending 171,165 (387) (17,839) 152,939
Changes in PDs/LGDs/EADs (59,949) 25,130 6,336 (28,483)
Unwind of discount – 454 – 454
Write-offs – – (6,405) (6,405)
Foreign Exchange and other movements (21,387) 29 (3,638) (24,996)
Loss allowance amount as at 31 December 2018 176,698 31,962 23,554 232,214
Movement of gross amount – Investment securities
Investment securities Stage 1 Stage 2 Stage 3 Total
Gross carrying amount as at 1 January 2019 109,305,072 – – 109,305,072
New financial assets originated or purchased, assets derecognized, repayments and further lending 5,268,073 – – 5,268,073
Foreign exchange and other movements (227,449) – – (227,449)
Gross carrying amount as at 30 June 2019 114,345,696 – – 114,345,696
Investment securities Stage 1 Stage 2 Stage 3 Total
Gross carrying amount as at 1 January 2018 185,586,498 727,049 – 186,313,547
Transfer of Excluded Business to HKBR (Note 2) (245,146,574) (727,049) – (245,873,623)
New financial assets originated or purchased, assets derecognized, repayments and further lending 168,865,148 – – 168,865,148
Gross carrying amount as at 31 December 2018 109,305,072 – – 109,305,072
20 BANK OF COMMUNICATIONS (HONG KONG) LIMITED
Notes to the Unaudited Condensed Financial StatementsFor the six months ended 30 June 2019(All amounts expressed in thousands of HK$ unless otherwise stated)
3 FINANCIAL RISK MANAGEMENT (continued)
3.1 Credit risk (continued)
3.1.3 Movements of gross carrying amount and ECL allowance (continued)
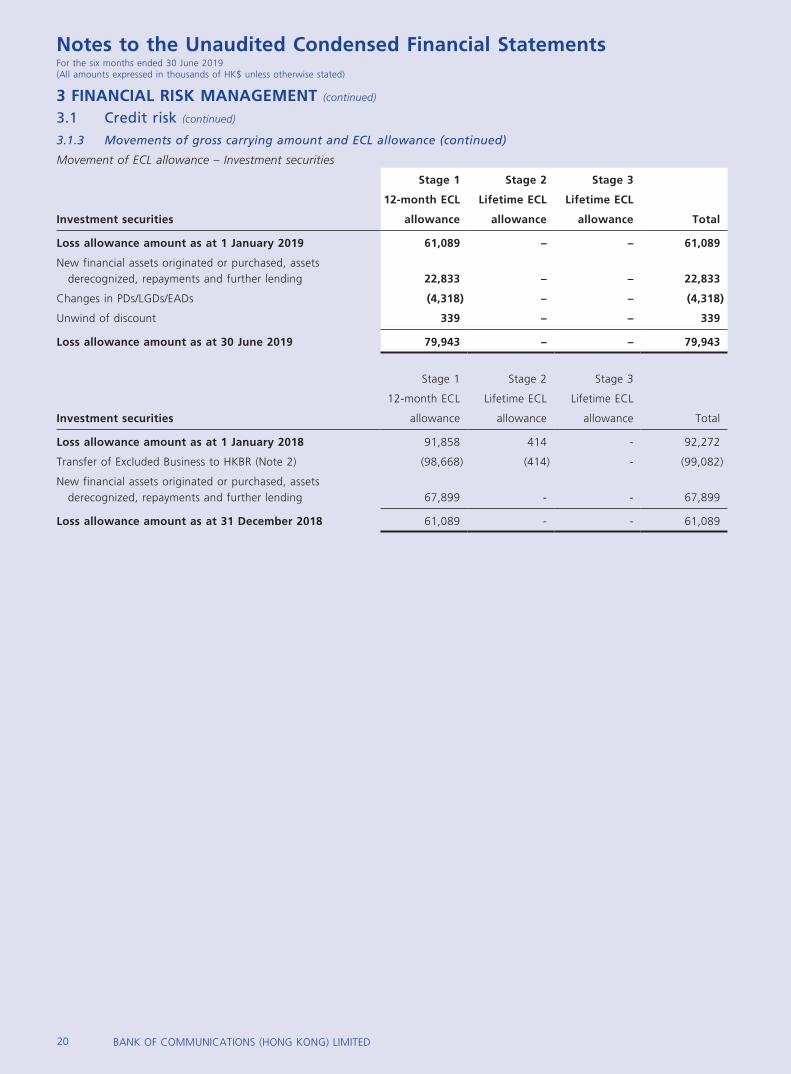
Movement of ECL allowance – Investment securities
Stage 1 Stage 2 Stage 3
12-month ECL Lifetime ECL Lifetime ECL
Investment securities allowance allowance allowance Total
Loss allowance amount as at 1 January 2019 61,089 – – 61,089
New financial assets originated or purchased, assets derecognized, repayments and further lending 22,833 – – 22,833
Changes in PDs/LGDs/EADs (4,318) – – (4,318)
Unwind of discount 339 – – 339
Loss allowance amount as at 30 June 2019 79,943 – – 79,943
Stage 1 Stage 2 Stage 3
12-month ECL Lifetime ECL Lifetime ECL
Investment securities allowance allowance allowance Total
Loss allowance amount as at 1 January 2018 91,858 414 - 92,272
Transfer of Excluded Business to HKBR (Note 2) (98,668) (414) - (99,082)
New financial assets originated or purchased, assets derecognized, repayments and further lending 67,899 - - 67,899
Loss allowance amount as at 31 December 2018 61,089 - - 61,089
21INTERIM REPORT 2019
Notes to the Unaudited Condensed Financial StatementsFor the six months ended 30 June 2019(All amounts expressed in thousands of HK$ unless otherwise stated)
3 FINANCIAL RISK MANAGEMENT (continued)
3.2 Fair value of financial assets and liabilities(a) Determination of fair value and valuation techniques
Certain financial assets and liabilities of the Company are measured at fair value or with fair value disclosed for financial reporting purposes. The fair value has been determined using appropriate valuation techniques and inputs for fair value measurements. The appropriateness of the valuation techniques and the inputs to the fair value measurements are reviewed periodically.
Fair value measurements are categorised into Level 1, 2 or 3 based on the degree to which the inputs to the fair value measurements are observable and the significance of the inputs to the fair value measurement in its entirety, which are described as follows:
Level 1: The fair value of financial instruments traded in active markets is based on quoted (unadjusted) market prices at the end of the reporting period. The quoted market price used for financial assets held by the Company is the current bid price. These instruments are included in level 1.
Level 2: The fair value of financial instruments that are not traded in an active market is determined using valuation techniques. These valuation techniques maximise the use of observable market data where it is available and rely as little as possible on entity specific estimates. If all significant inputs required to fair value an instrument are observable, the instrument is included in level 2.
Level 3: If one or more of the significant inputs is not based on observable market data, the instrument is included in level 3.
Specific valuation techniques used to value for level 2 financial instruments include:
• The use of quoted market prices or dealer quotes for similar instruments.
• Calculation of the present value of the estimated future cash flows based on observable yield curves for interest rate swaps.
• The fair value of foreign currency forwards is determined using forward exchange rates at the balance sheet date.
• The fair value of the remaining financial instruments is determined using discounted cash flow analysis.
(b) Financial instruments not measured at fair value
Financial instruments not carried at fair value are typically short-term in nature or repriced to current market rates frequently. Accordingly, their carrying amounts are reasonable approximations of their fair values.
22 BANK OF COMMUNICATIONS (HONG KONG) LIMITED
Notes to the Unaudited Condensed Financial StatementsFor the six months ended 30 June 2019(All amounts expressed in thousands of HK$ unless otherwise stated)
3 FINANCIAL RISK MANAGEMENT (continued)
3.2 Fair value of financial assets and liabilities (continued)
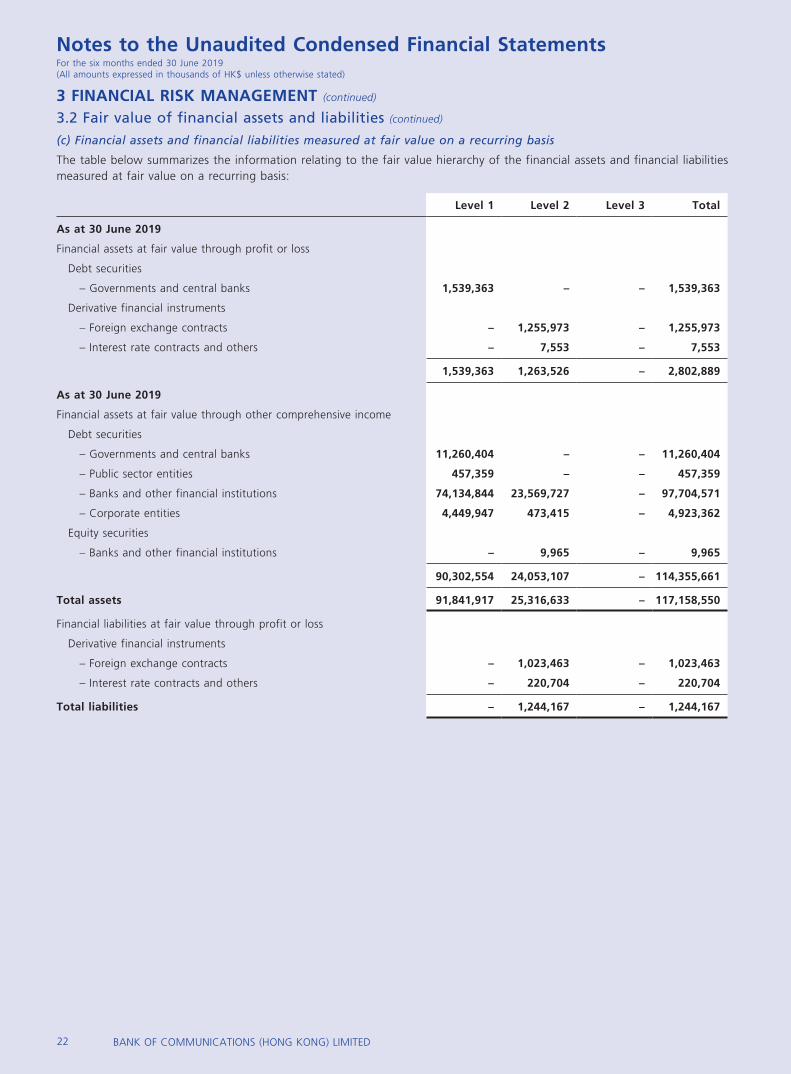
(c) Financial assets and financial liabilities measured at fair value on a recurring basis
The table below summarizes the information relating to the fair value hierarchy of the financial assets and financial liabilities measured at fair value on a recurring basis:
Level 1 Level 2 Level 3 Total
As at 30 June 2019
Financial assets at fair value through profit or loss
Debt securities
– Governments and central banks 1,539,363 – – 1,539,363
Derivative financial instruments
– Foreign exchange contracts – 1,255,973 – 1,255,973
– Interest rate contracts and others – 7,553 – 7,553
1,539,363 1,263,526 – 2,802,889
As at 30 June 2019
Financial assets at fair value through other comprehensive income
Debt securities
– Governments and central banks 11,260,404 – – 11,260,404
– Public sector entities 457,359 – – 457,359
– Banks and other financial institutions 74,134,844 23,569,727 – 97,704,571
– Corporate entities 4,449,947 473,415 – 4,923,362
Equity securities
– Banks and other financial institutions – 9,965 – 9,965
90,302,554 24,053,107 – 114,355,661
Total assets 91,841,917 25,316,633 – 117,158,550
Financial liabilities at fair value through profit or loss
Derivative financial instruments
– Foreign exchange contracts – 1,023,463 – 1,023,463
– Interest rate contracts and others – 220,704 – 220,704
Total liabilities – 1,244,167 – 1,244,167
23INTERIM REPORT 2019
Notes to the Unaudited Condensed Financial StatementsFor the six months ended 30 June 2019(All amounts expressed in thousands of HK$ unless otherwise stated)
3 FINANCIAL RISK MANAGEMENT (continued)
3.2 Fair value of financial assets and liabilities (continued)
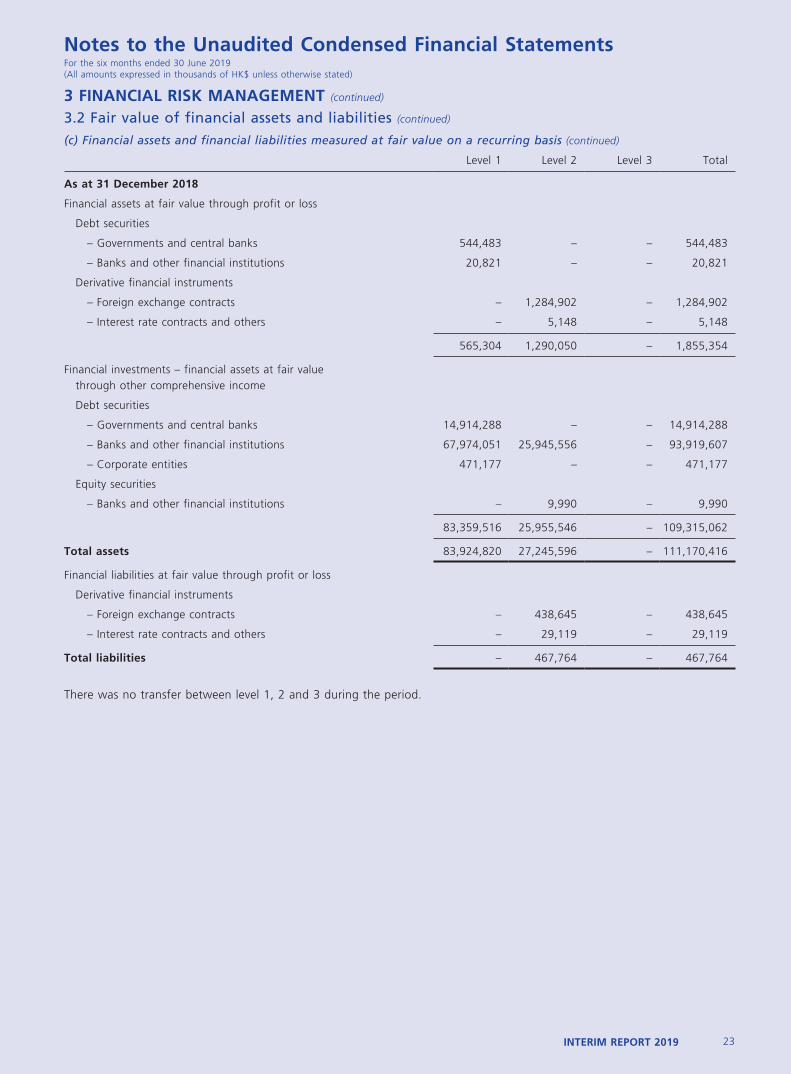
(c) Financial assets and financial liabilities measured at fair value on a recurring basis (continued)
Level 1 Level 2 Level 3 Total
As at 31 December 2018
Financial assets at fair value through profit or loss
Debt securities
– Governments and central banks 544,483 – – 544,483
– Banks and other financial institutions 20,821 – – 20,821
Derivative financial instruments
– Foreign exchange contracts – 1,284,902 – 1,284,902
– Interest rate contracts and others – 5,148 – 5,148
565,304 1,290,050 – 1,855,354
Financial investments – financial assets at fair value through other comprehensive income
Debt securities
– Governments and central banks 14,914,288 – – 14,914,288
– Banks and other financial institutions 67,974,051 25,945,556 – 93,919,607
– Corporate entities 471,177 – – 471,177
Equity securities
– Banks and other financial institutions – 9,990 – 9,990
83,359,516 25,955,546 – 109,315,062
Total assets 83,924,820 27,245,596 – 111,170,416
Financial liabilities at fair value through profit or loss
Derivative financial instruments
– Foreign exchange contracts – 438,645 – 438,645
– Interest rate contracts and others – 29,119 – 29,119
Total liabilities – 467,764 – 467,764
There was no transfer between level 1, 2 and 3 during the period.
24 BANK OF COMMUNICATIONS (HONG KONG) LIMITED
Notes to the Unaudited Condensed Financial StatementsFor the six months ended 30 June 2019(All amounts expressed in thousands of HK$ unless otherwise stated)
3 FINANCIAL RISK MANAGEMENT (continued)
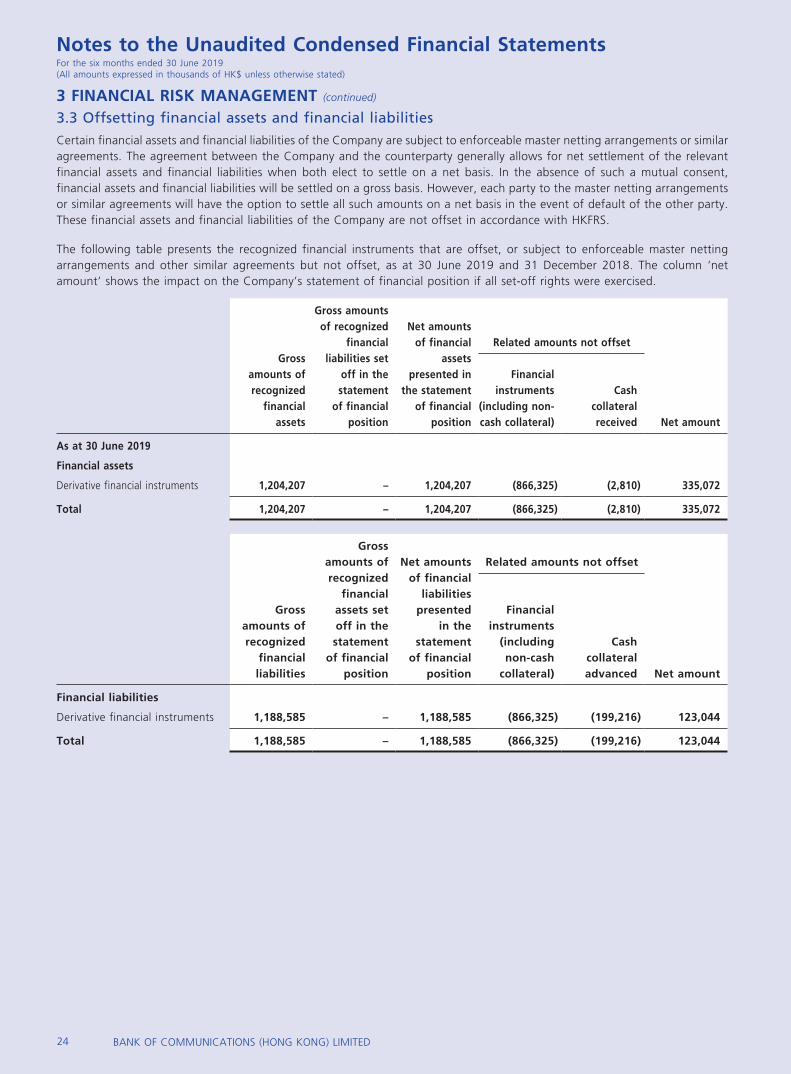
3.3 Offsetting financial assets and financial liabilitiesCertain financial assets and financial liabilities of the Company are subject to enforceable master netting arrangements or similar agreements. The agreement between the Company and the counterparty generally allows for net settlement of the relevant financial assets and financial liabilities when both elect to settle on a net basis. In the absence of such a mutual consent, financial assets and financial liabilities will be settled on a gross basis. However, each party to the master netting arrangements or similar agreements will have the option to settle all such amounts on a net basis in the event of default of the other party. These financial assets and financial liabilities of the Company are not offset in accordance with HKFRS.
The following table presents the recognized financial instruments that are offset, or subject to enforceable master netting arrangements and other similar agreements but not offset, as at 30 June 2019 and 31 December 2018. The column ‘net amount’ shows the impact on the Company’s statement of financial position if all set-off rights were exercised.
Gross amounts of recognized
financial assets
Gross amounts of recognized
financial liabilities set
off in the statement
of financial position
Net amounts of financial
assets presented in
the statement of financial
position
Related amounts not offset
Net amount
Financial instruments
(including non-cash collateral)
Cash collateral received
As at 30 June 2019
Financial assets
Derivative financial instruments 1,204,207 – 1,204,207 (866,325) (2,810) 335,072
Total 1,204,207 – 1,204,207 (866,325) (2,810) 335,072
Gross amounts of recognized
financial liabilities
Gross amounts of recognized
financial assets set off in the statement
of financial position
Net amounts of financial
liabilities presented
in the statement
of financial position
Related amounts not offset
Net amount
Financial instruments
(including non-cash
collateral)
Cash collateral advanced
Financial liabilities
Derivative financial instruments 1,188,585 – 1,188,585 (866,325) (199,216) 123,044
Total 1,188,585 – 1,188,585 (866,325) (199,216) 123,044
25INTERIM REPORT 2019
Notes to the Unaudited Condensed Financial StatementsFor the six months ended 30 June 2019(All amounts expressed in thousands of HK$ unless otherwise stated)
3 FINANCIAL RISK MANAGEMENT (continued)
3.3 Offsetting financial assets and financial liabilities (continued)
Gross amounts of recognized
financial assets
Gross amounts of recognized
financial liabilities set
off in the statement
of financial position
Net amounts of financial
assets presented in
the statement of financial
position
Related amounts not offset
Net amount
Financial instruments
(including non-cash collateral)
Cash collateral received
As at 31 December 2018
Financial assets
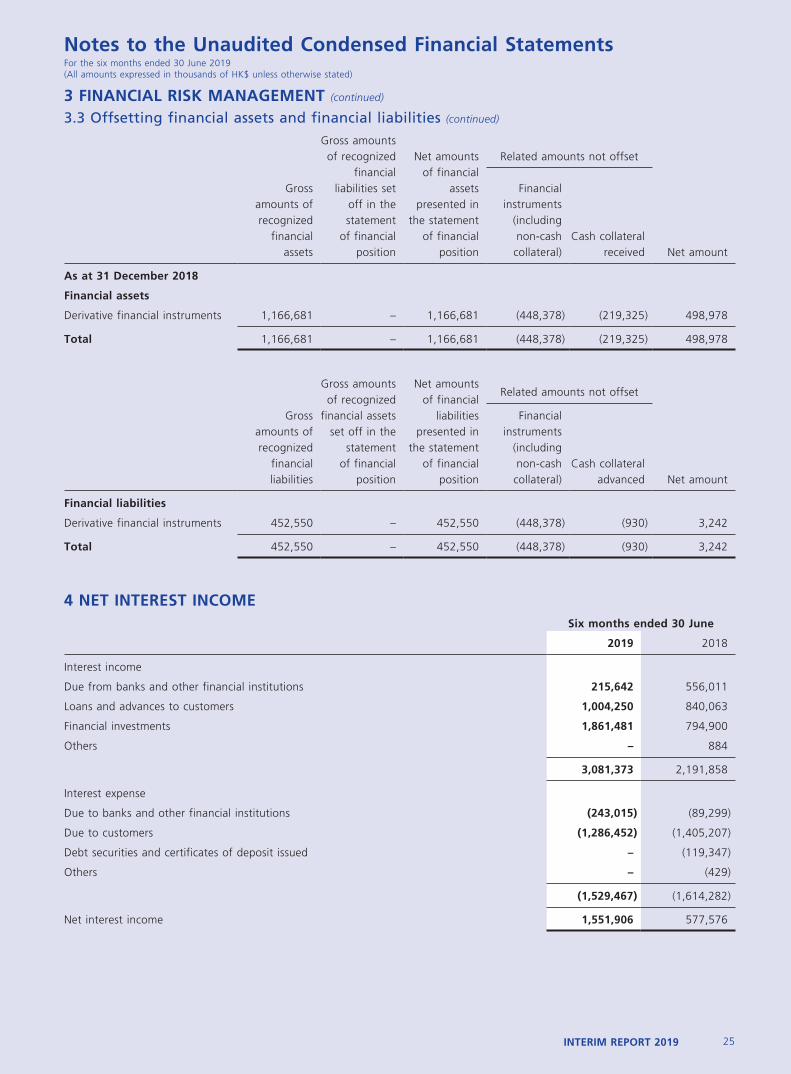
Derivative financial instruments 1,166,681 – 1,166,681 (448,378) (219,325) 498,978
Total 1,166,681 – 1,166,681 (448,378) (219,325) 498,978
Gross amounts of recognized
financial liabilities
Gross amounts of recognized
financial assets set off in the
statement of financial
position
Net amounts of financial
liabilities presented in
the statement of financial
position
Related amounts not offset
Net amount
Financial instruments
(including non-cash collateral)
Cash collateral advanced
Financial liabilities
Derivative financial instruments 452,550 – 452,550 (448,378) (930) 3,242
Total 452,550 – 452,550 (448,378) (930) 3,242
4 NET INTEREST INCOMESix months ended 30 June
2019 2018
Interest income
Due from banks and other financial institutions 215,642 556,011
Loans and advances to customers 1,004,250 840,063
Financial investments 1,861,481 794,900
Others – 884
3,081,373 2,191,858
Interest expense
Due to banks and other financial institutions (243,015) (89,299)
Due to customers (1,286,452) (1,405,207)
Debt securities and certificates of deposit issued – (119,347)
Others – (429)
(1,529,467) (1,614,282)
Net interest income 1,551,906 577,576
26 BANK OF COMMUNICATIONS (HONG KONG) LIMITED
Notes to the Unaudited Condensed Financial StatementsFor the six months ended 30 June 2019(All amounts expressed in thousands of HK$ unless otherwise stated)
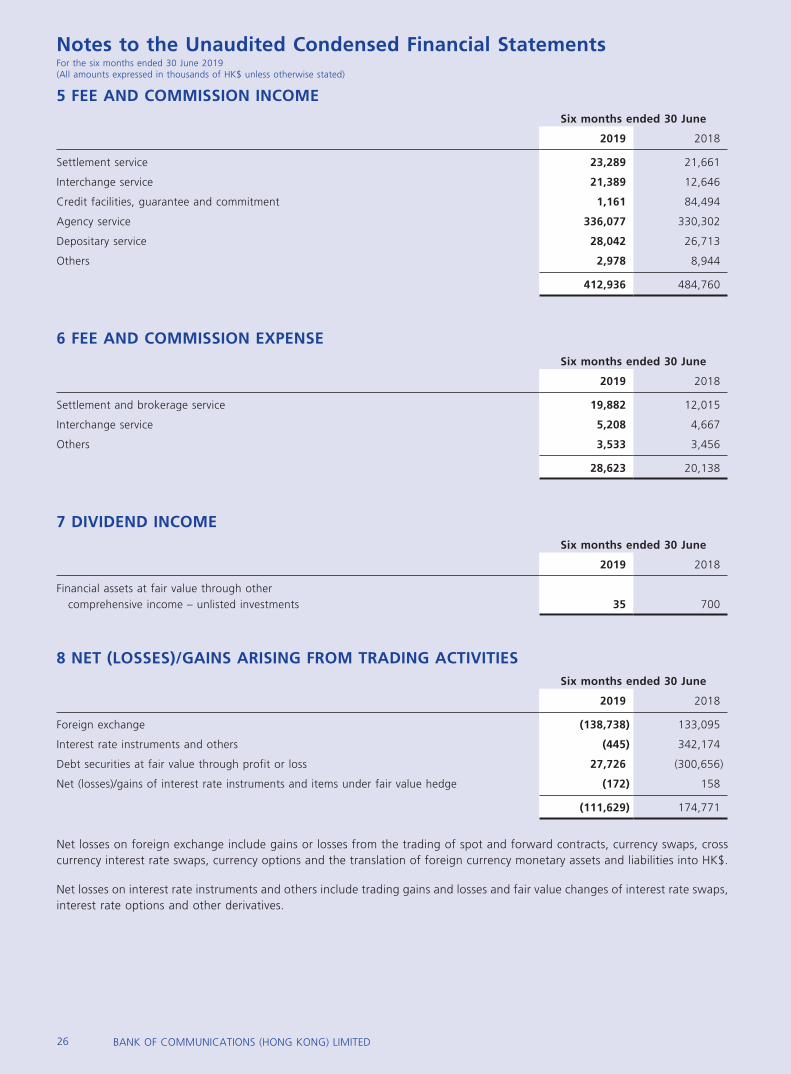
5 FEE AND COMMISSION INCOMESix months ended 30 June
2019 2018
Settlement service 23,289 21,661
Interchange service 21,389 12,646
Credit facilities, guarantee and commitment 1,161 84,494
Agency service 336,077 330,302
Depositary service 28,042 26,713
Others 2,978 8,944
412,936 484,760
6 FEE AND COMMISSION EXPENSESix months ended 30 June
2019 2018
Settlement and brokerage service 19,882 12,015
Interchange service 5,208 4,667
Others 3,533 3,456
28,623 20,138
7 DIVIDEND INCOMESix months ended 30 June
2019 2018
Financial assets at fair value through other comprehensive income – unlisted investments 35 700
8 NET (LOSSES)/GAINS ARISING FROM TRADING ACTIVITIESSix months ended 30 June
2019 2018
Foreign exchange (138,738) 133,095
Interest rate instruments and others (445) 342,174
Debt securities at fair value through profit or loss 27,726 (300,656)
Net (losses)/gains of interest rate instruments and items under fair value hedge (172) 158
(111,629) 174,771
Net losses on foreign exchange include gains or losses from the trading of spot and forward contracts, currency swaps, cross currency interest rate swaps, currency options and the translation of foreign currency monetary assets and liabilities into HK$.
Net losses on interest rate instruments and others include trading gains and losses and fair value changes of interest rate swaps, interest rate options and other derivatives.
27INTERIM REPORT 2019
Notes to the Unaudited Condensed Financial StatementsFor the six months ended 30 June 2019(All amounts expressed in thousands of HK$ unless otherwise stated)
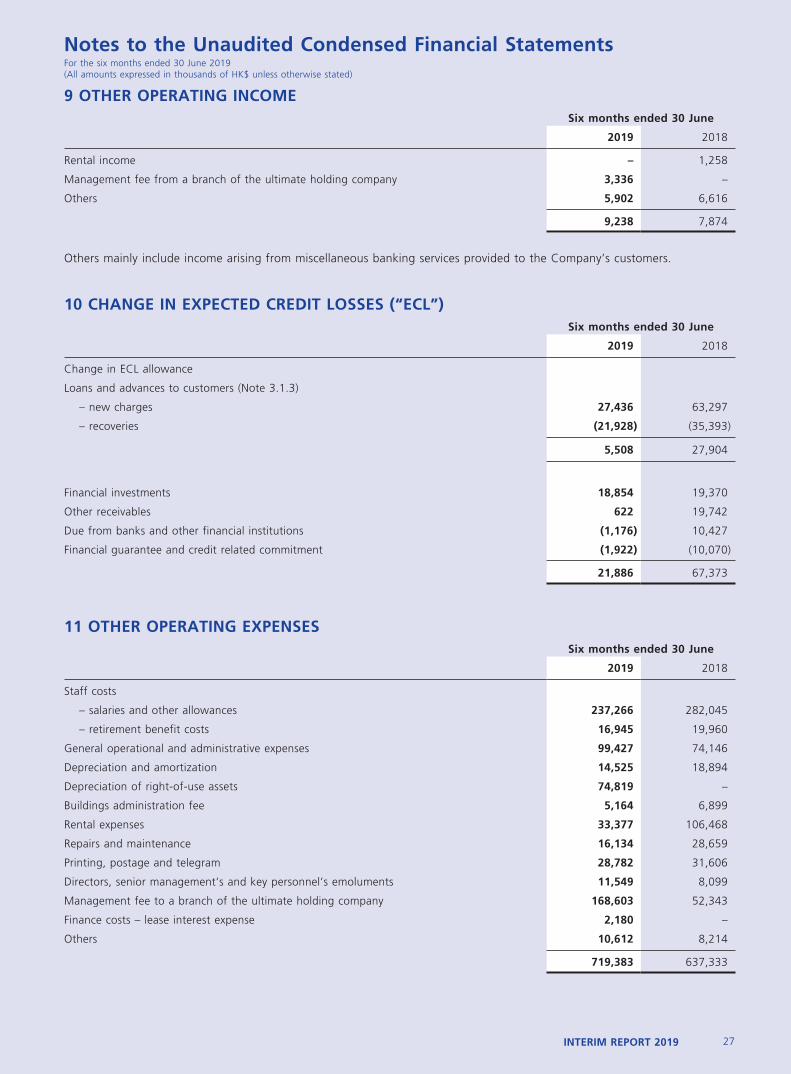
9 OTHER OPERATING INCOMESix months ended 30 June
2019 2018
Rental income – 1,258
Management fee from a branch of the ultimate holding company 3,336 –
Others 5,902 6,616
9,238 7,874
Others mainly include income arising from miscellaneous banking services provided to the Company’s customers.
10 CHANGE IN EXPECTED CREDIT LOSSES (“ECL”)Six months ended 30 June
2019 2018
Change in ECL allowance
Loans and advances to customers (Note 3.1.3)
– new charges 27,436 63,297
– recoveries (21,928) (35,393)
5,508 27,904
Financial investments 18,854 19,370
Other receivables 622 19,742
Due from banks and other financial institutions (1,176) 10,427
Financial guarantee and credit related commitment (1,922) (10,070)
21,886 67,373
11 OTHER OPERATING EXPENSESSix months ended 30 June
2019 2018
Staff costs
– salaries and other allowances 237,266 282,045
– retirement benefit costs 16,945 19,960
General operational and administrative expenses 99,427 74,146
Depreciation and amortization 14,525 18,894
Depreciation of right-of-use assets 74,819 –
Buildings administration fee 5,164 6,899
Rental expenses 33,377 106,468
Repairs and maintenance 16,134 28,659
Printing, postage and telegram 28,782 31,606
Directors, senior management’s and key personnel’s emoluments 11,549 8,099
Management fee to a branch of the ultimate holding company 168,603 52,343
Finance costs – lease interest expense 2,180 –
Others 10,612 8,214
719,383 637,333
28 BANK OF COMMUNICATIONS (HONG KONG) LIMITED
Notes to the Unaudited Condensed Financial StatementsFor the six months ended 30 June 2019(All amounts expressed in thousands of HK$ unless otherwise stated)
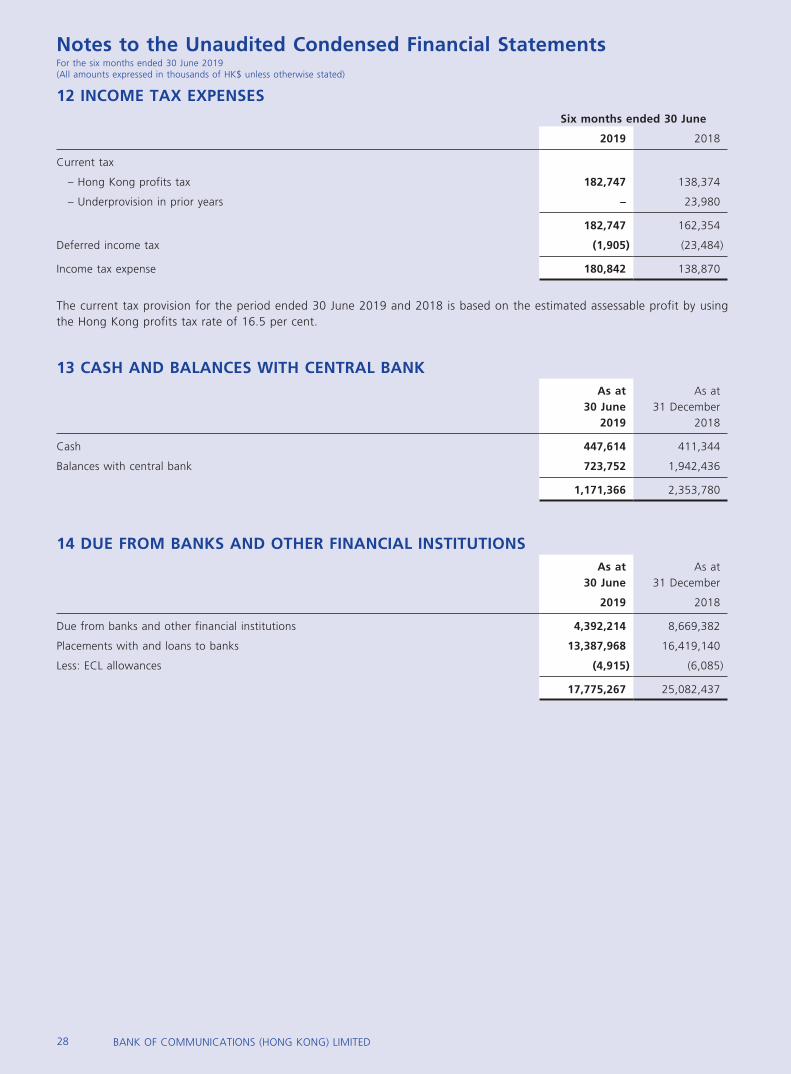
12 INCOME TAX EXPENSESSix months ended 30 June
2019 2018
Current tax
– Hong Kong profits tax 182,747 138,374
– Underprovision in prior years – 23,980
182,747 162,354
Deferred income tax (1,905) (23,484)
Income tax expense 180,842 138,870
The current tax provision for the period ended 30 June 2019 and 2018 is based on the estimated assessable profit by using the Hong Kong profits tax rate of 16.5 per cent.
13 CASH AND BALANCES WITH CENTRAL BANKAs at
30 June2019
As at31 December
2018
Cash 447,614 411,344
Balances with central bank 723,752 1,942,436
1,171,366 2,353,780
14 DUE FROM BANKS AND OTHER FINANCIAL INSTITUTIONSAs at
30 JuneAs at
31 December
2019 2018
Due from banks and other financial institutions 4,392,214 8,669,382
Placements with and loans to banks 13,387,968 16,419,140
Less: ECL allowances (4,915) (6,085)
17,775,267 25,082,437
29INTERIM REPORT 2019
Notes to the Unaudited Condensed Financial StatementsFor the six months ended 30 June 2019(All amounts expressed in thousands of HK$ unless otherwise stated)
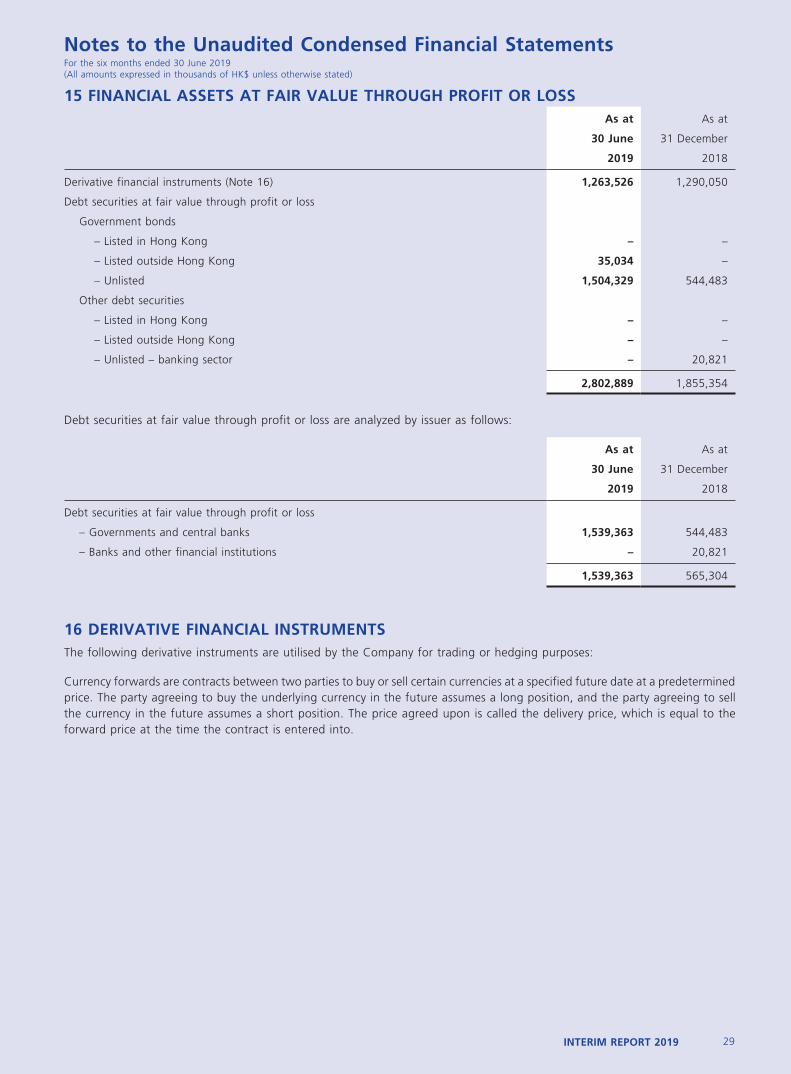
15 FINANCIAL ASSETS AT FAIR VALUE THROUGH PROFIT OR LOSSAs at As at
30 June 31 December
2019 2018
Derivative financial instruments (Note 16) 1,263,526 1,290,050
Debt securities at fair value through profit or loss
Government bonds
– Listed in Hong Kong – –
– Listed outside Hong Kong 35,034 –
– Unlisted 1,504,329 544,483
Other debt securities
– Listed in Hong Kong – –
– Listed outside Hong Kong – –
– Unlisted – banking sector – 20,821
2,802,889 1,855,354
Debt securities at fair value through profit or loss are analyzed by issuer as follows:
As at As at
30 June 31 December
2019 2018
Debt securities at fair value through profit or loss
– Governments and central banks 1,539,363 544,483
– Banks and other financial institutions – 20,821
1,539,363 565,304
16 DERIVATIVE FINANCIAL INSTRUMENTSThe following derivative instruments are utilised by the Company for trading or hedging purposes:
Currency forwards are contracts between two parties to buy or sell certain currencies at a specified future date at a predetermined price. The party agreeing to buy the underlying currency in the future assumes a long position, and the party agreeing to sell the currency in the future assumes a short position. The price agreed upon is called the delivery price, which is equal to the forward price at the time the contract is entered into.
30 BANK OF COMMUNICATIONS (HONG KONG) LIMITED
Notes to the Unaudited Condensed Financial StatementsFor the six months ended 30 June 2019(All amounts expressed in thousands of HK$ unless otherwise stated)
16 DERIVATIVE FINANCIAL INSTRUMENTS (continued)
Currency and interest rate swaps are commitments to exchange one set of cash flows for another. Swaps result in an economic exchange of currencies or interest rates (for example, fixed rate for floating rate) or a combination of all these (i.e. cross-currency interest rate swaps). The Company’s credit risk represents the potential cost to replace the swap contracts if counterparties fail to perform their obligation. This risk is monitored on an ongoing basis with reference to the current fair value, the notional amount of the contracts and the liquidity of the market. To control the level of credit risk taken, the Company assesses counterparties using the same techniques as for its lending activities.
Currency and interest rate options are contractual agreements under which the seller (writer) grants the purchaser (holder) the right, but not the obligation, either to buy (a call option) or sell (a put option), on or before a set date or during a set period, a specific amount of a foreign currency at a predetermined price or to receive an interest payment based on a variable interest rate and pay a fixed interest rate or vice versa. The seller receives a premium from the purchaser in consideration for assuming foreign exchange or interest rate risk. Options may be either exchange-traded or negotiated between the Company and a customer (over-the-counter market).
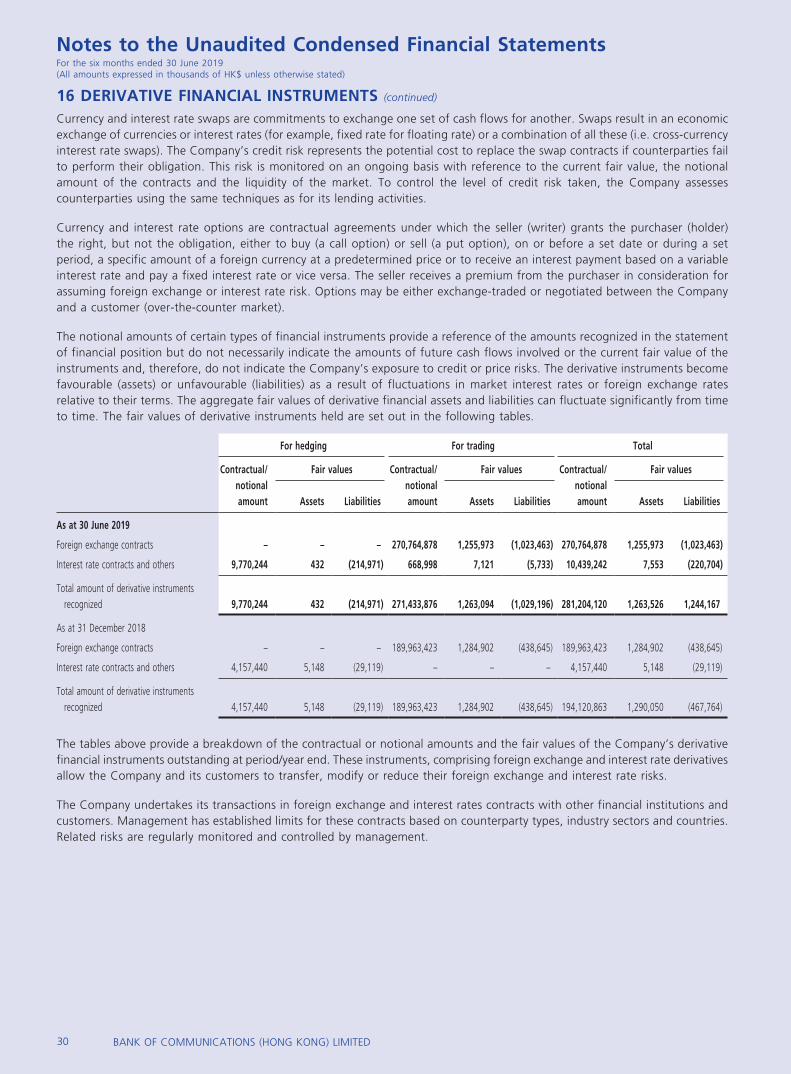
The notional amounts of certain types of financial instruments provide a reference of the amounts recognized in the statement of financial position but do not necessarily indicate the amounts of future cash flows involved or the current fair value of the instruments and, therefore, do not indicate the Company’s exposure to credit or price risks. The derivative instruments become favourable (assets) or unfavourable (liabilities) as a result of fluctuations in market interest rates or foreign exchange rates relative to their terms. The aggregate fair values of derivative financial assets and liabilities can fluctuate significantly from time to time. The fair values of derivative instruments held are set out in the following tables.
For hedging For trading Total
Contractual/notional amount
Fair values Contractual/notional amount
Fair values Contractual/notional amount
Fair values
Assets Liabilities Assets Liabilities Assets Liabilities
As at 30 June 2019
Foreign exchange contracts – – – 270,764,878 1,255,973 (1,023,463) 270,764,878 1,255,973 (1,023,463)
Interest rate contracts and others 9,770,244 432 (214,971) 668,998 7,121 (5,733) 10,439,242 7,553 (220,704)
Total amount of derivative instruments recognized 9,770,244 432 (214,971) 271,433,876 1,263,094 (1,029,196) 281,204,120 1,263,526 1,244,167
As at 31 December 2018
Foreign exchange contracts – – – 189,963,423 1,284,902 (438,645) 189,963,423 1,284,902 (438,645)
Interest rate contracts and others 4,157,440 5,148 (29,119) – – – 4,157,440 5,148 (29,119)
Total amount of derivative instruments recognized 4,157,440 5,148 (29,119) 189,963,423 1,284,902 (438,645) 194,120,863 1,290,050 (467,764)
The tables above provide a breakdown of the contractual or notional amounts and the fair values of the Company’s derivative financial instruments outstanding at period/year end. These instruments, comprising foreign exchange and interest rate derivatives allow the Company and its customers to transfer, modify or reduce their foreign exchange and interest rate risks.
The Company undertakes its transactions in foreign exchange and interest rates contracts with other financial institutions and customers. Management has established limits for these contracts based on counterparty types, industry sectors and countries. Related risks are regularly monitored and controlled by management.
31INTERIM REPORT 2019
Notes to the Unaudited Condensed Financial StatementsFor the six months ended 30 June 2019(All amounts expressed in thousands of HK$ unless otherwise stated)
16 DERIVATIVE FINANCIAL INSTRUMENTS (continued)
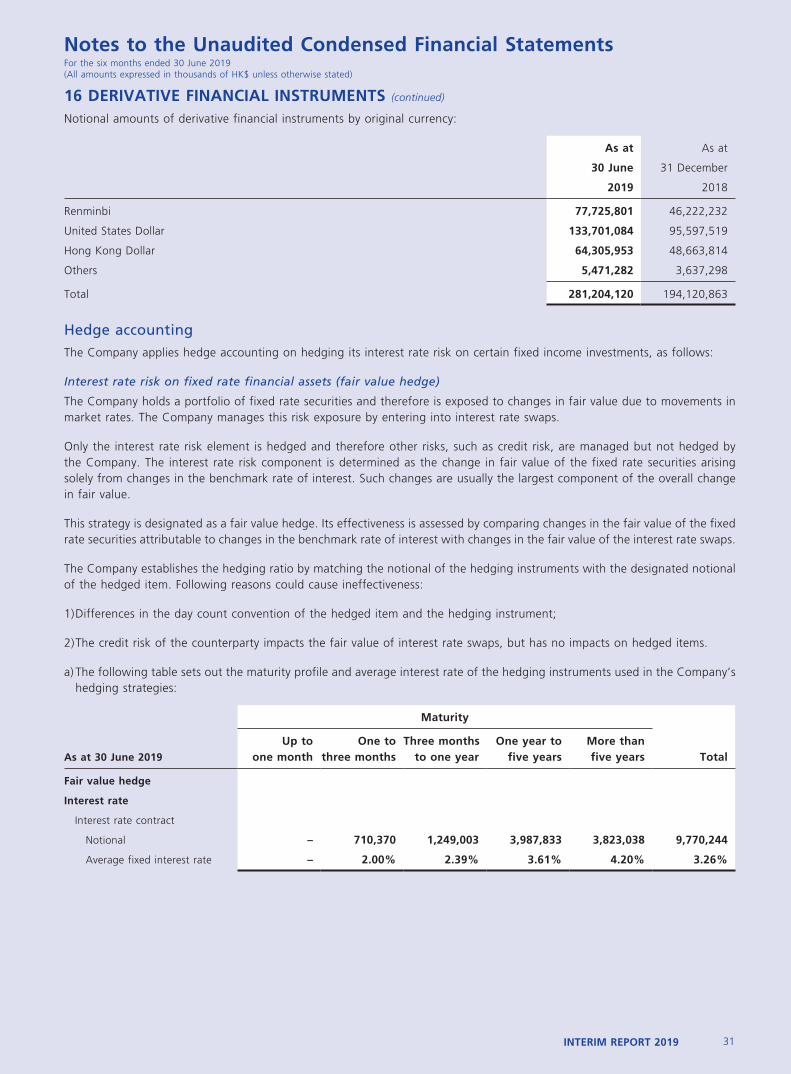
Notional amounts of derivative financial instruments by original currency:
As at As at
30 June 31 December
2019 2018
Renminbi 77,725,801 46,222,232
United States Dollar 133,701,084 95,597,519
Hong Kong Dollar 64,305,953 48,663,814
Others 5,471,282 3,637,298
Total 281,204,120 194,120,863
Hedge accountingThe Company applies hedge accounting on hedging its interest rate risk on certain fixed income investments, as follows:
Interest rate risk on fixed rate financial assets (fair value hedge)
The Company holds a portfolio of fixed rate securities and therefore is exposed to changes in fair value due to movements in market rates. The Company manages this risk exposure by entering into interest rate swaps.
Only the interest rate risk element is hedged and therefore other risks, such as credit risk, are managed but not hedged by the Company. The interest rate risk component is determined as the change in fair value of the fixed rate securities arising solely from changes in the benchmark rate of interest. Such changes are usually the largest component of the overall change in fair value.
This strategy is designated as a fair value hedge. Its effectiveness is assessed by comparing changes in the fair value of the fixed rate securities attributable to changes in the benchmark rate of interest with changes in the fair value of the interest rate swaps.
The Company establishes the hedging ratio by matching the notional of the hedging instruments with the designated notional of the hedged item. Following reasons could cause ineffectiveness:
1) Differences in the day count convention of the hedged item and the hedging instrument;
2) The credit risk of the counterparty impacts the fair value of interest rate swaps, but has no impacts on hedged items.
a) The following table sets out the maturity profile and average interest rate of the hedging instruments used in the Company’s hedging strategies:
Maturity
As at 30 June 2019
Up to one month
One to three months
Three months to one year
One year to five years
More than five years Total
Fair value hedge
Interest rate
Interest rate contract
Notional – 710,370 1,249,003 3,987,833 3,823,038 9,770,244
Average fixed interest rate – 2.00% 2.39% 3.61% 4.20% 3.26%
32 BANK OF COMMUNICATIONS (HONG KONG) LIMITED
Notes to the Unaudited Condensed Financial StatementsFor the six months ended 30 June 2019(All amounts expressed in thousands of HK$ unless otherwise stated)
16 DERIVATIVE FINANCIAL INSTRUMENTS (continued)
Hedge accounting (continued)
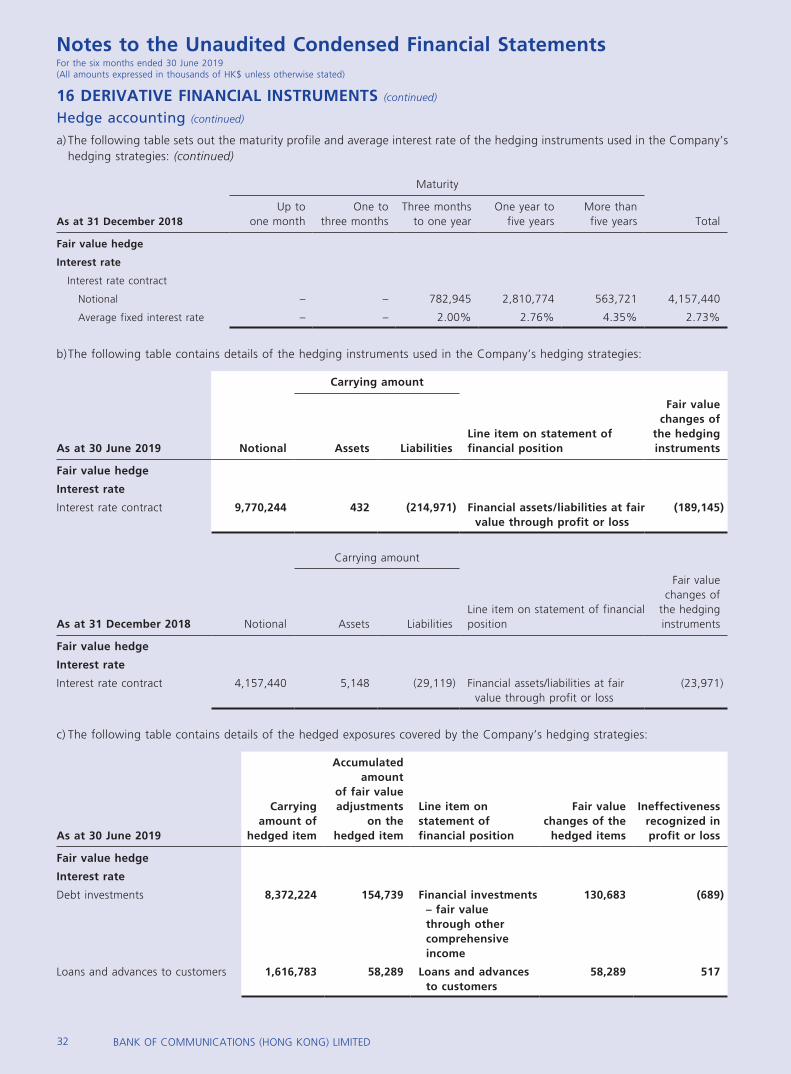
a) The following table sets out the maturity profile and average interest rate of the hedging instruments used in the Company’s hedging strategies: (continued)
Maturity
As at 31 December 2018Up to
one monthOne to
three monthsThree months
to one yearOne year to
five yearsMore than five years Total
Fair value hedge
Interest rate
Interest rate contract
Notional – – 782,945 2,810,774 563,721 4,157,440
Average fixed interest rate – – 2.00% 2.76% 4.35% 2.73%
b) The following table contains details of the hedging instruments used in the Company’s hedging strategies:
Carrying amount
As at 30 June 2019 Notional Assets LiabilitiesLine item on statement of financial position
Fair value changes of
the hedging instruments
Fair value hedge
Interest rate
Interest rate contract 9,770,244 432 (214,971) Financial assets/liabilities at fair value through profit or loss
(189,145)
Carrying amount
As at 31 December 2018 Notional Assets LiabilitiesLine item on statement of financial position
Fair value changes of
the hedging instruments
Fair value hedge
Interest rate
Interest rate contract 4,157,440 5,148 (29,119) Financial assets/liabilities at fair value through profit or loss
(23,971)
c) The following table contains details of the hedged exposures covered by the Company’s hedging strategies:
As at 30 June 2019
Carrying amount of
hedged item
Accumulated amount
of fair value adjustments
on the hedged item
Line item on statement of financial position
Fair value changes of the
hedged items
Ineffectiveness recognized in profit or loss
Fair value hedge
Interest rate
Debt investments 8,372,224 154,739 Financial investments – fair value through other comprehensive income
130,683 (689)
Loans and advances to customers 1,616,783 58,289 Loans and advances to customers
58,289 517
33INTERIM REPORT 2019
Notes to the Unaudited Condensed Financial StatementsFor the six months ended 30 June 2019(All amounts expressed in thousands of HK$ unless otherwise stated)
16 DERIVATIVE FINANCIAL INSTRUMENTS (continued)
Hedge accounting (continued)
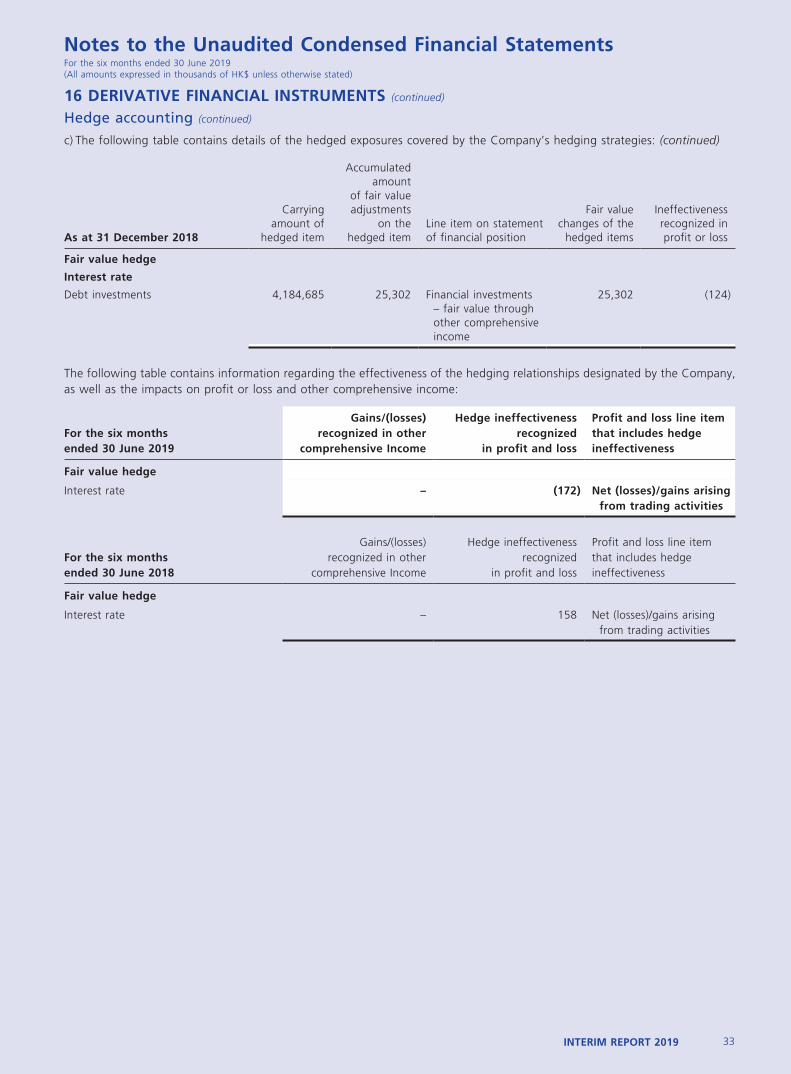
c) The following table contains details of the hedged exposures covered by the Company’s hedging strategies: (continued)
As at 31 December 2018
Carrying amount of
hedged item
Accumulated amount
of fair value adjustments
on the hedged item
Line item on statement of financial position
Fair value changes of the
hedged items
Ineffectiveness recognized in profit or loss
Fair value hedge
Interest rate
Debt investments 4,184,685 25,302 Financial investments – fair value through other comprehensive income
25,302 (124)
The following table contains information regarding the effectiveness of the hedging relationships designated by the Company, as well as the impacts on profit or loss and other comprehensive income:
For the six months ended 30 June 2019
Gains/(losses) recognized in other
comprehensive Income
Hedge ineffectiveness recognized
in profit and loss
Profit and loss line item that includes hedge ineffectiveness
Fair value hedge
Interest rate – (172) Net (losses)/gains arising from trading activities
For the six months ended 30 June 2018
Gains/(losses) recognized in other
comprehensive Income
Hedge ineffectiveness recognized
in profit and loss
Profit and loss line item that includes hedge ineffectiveness
Fair value hedge
Interest rate – 158 Net (losses)/gains arising from trading activities
34 BANK OF COMMUNICATIONS (HONG KONG) LIMITED
Notes to the Unaudited Condensed Financial StatementsFor the six months ended 30 June 2019(All amounts expressed in thousands of HK$ unless otherwise stated)
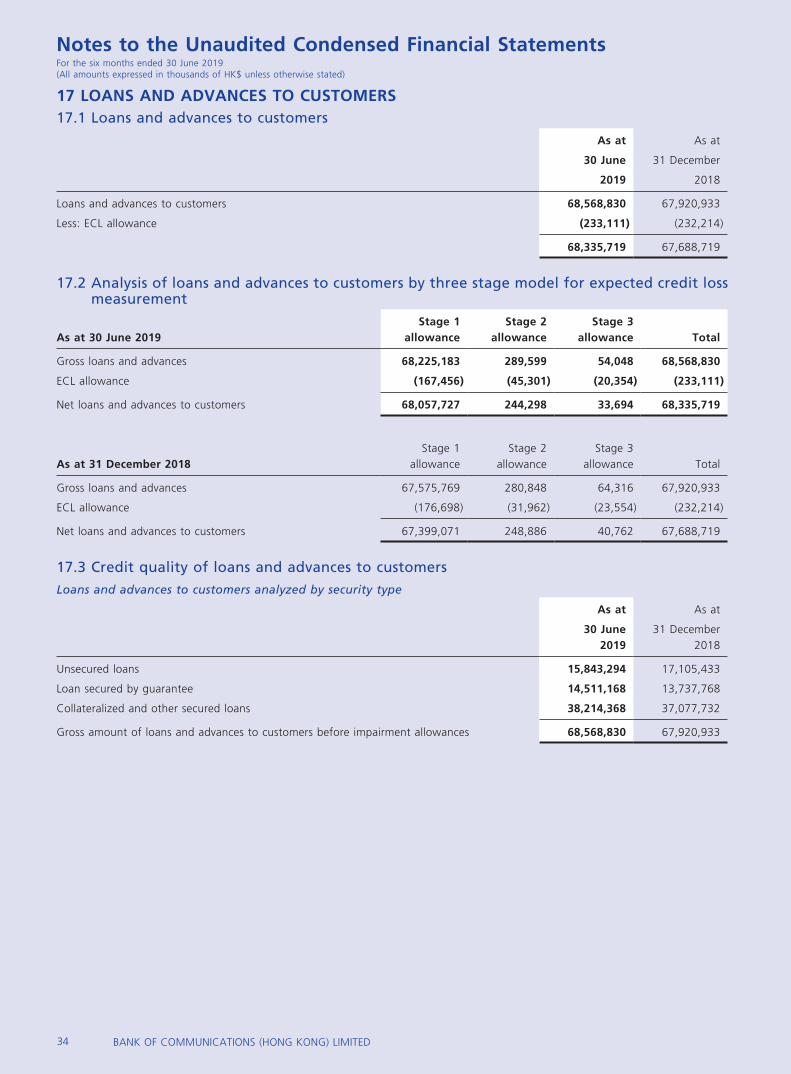
17 LOANS AND ADVANCES TO CUSTOMERS17.1 Loans and advances to customers
As at As at
30 June 31 December
2019 2018
Loans and advances to customers 68,568,830 67,920,933
Less: ECL allowance (233,111) (232,214)
68,335,719 67,688,719
17.2 Analysis of loans and advances to customers by three stage model for expected credit loss measurement
As at 30 June 2019Stage 1
allowanceStage 2
allowanceStage 3
allowance Total
Gross loans and advances 68,225,183 289,599 54,048 68,568,830
ECL allowance (167,456) (45,301) (20,354) (233,111)
Net loans and advances to customers 68,057,727 244,298 33,694 68,335,719
As at 31 December 2018Stage 1
allowanceStage 2
allowanceStage 3
allowance Total
Gross loans and advances 67,575,769 280,848 64,316 67,920,933
ECL allowance (176,698) (31,962) (23,554) (232,214)
Net loans and advances to customers 67,399,071 248,886 40,762 67,688,719
17.3 Credit quality of loans and advances to customersLoans and advances to customers analyzed by security type
As at As at
30 June2019
31 December2018
Unsecured loans 15,843,294 17,105,433
Loan secured by guarantee 14,511,168 13,737,768
Collateralized and other secured loans 38,214,368 37,077,732
Gross amount of loans and advances to customers before impairment allowances 68,568,830 67,920,933
35INTERIM REPORT 2019
Notes to the Unaudited Condensed Financial StatementsFor the six months ended 30 June 2019(All amounts expressed in thousands of HK$ unless otherwise stated)
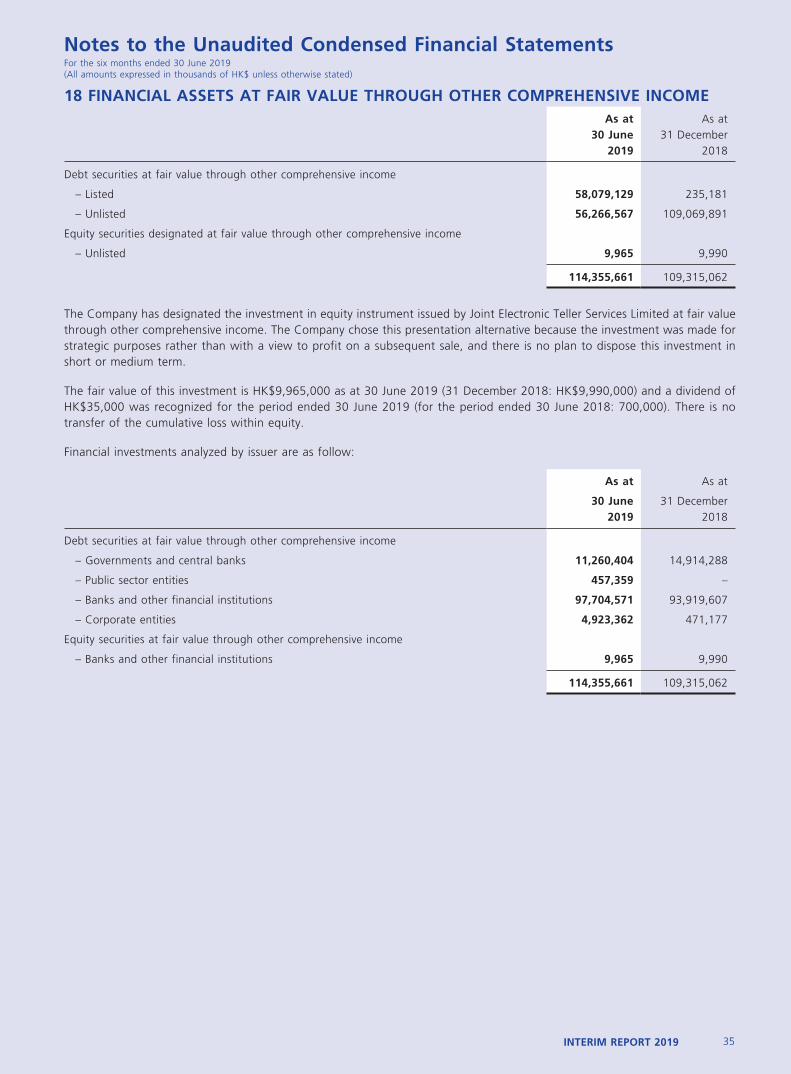
18 FINANCIAL ASSETS AT FAIR VALUE THROUGH OTHER COMPREHENSIVE INCOMEAs at
30 June2019
As at31 December
2018
Debt securities at fair value through other comprehensive income
– Listed 58,079,129 235,181
– Unlisted 56,266,567 109,069,891
Equity securities designated at fair value through other comprehensive income
– Unlisted 9,965 9,990
114,355,661 109,315,062
The Company has designated the investment in equity instrument issued by Joint Electronic Teller Services Limited at fair value through other comprehensive income. The Company chose this presentation alternative because the investment was made for strategic purposes rather than with a view to profit on a subsequent sale, and there is no plan to dispose this investment in short or medium term.
The fair value of this investment is HK$9,965,000 as at 30 June 2019 (31 December 2018: HK$9,990,000) and a dividend of HK$35,000 was recognized for the period ended 30 June 2019 (for the period ended 30 June 2018: 700,000). There is no transfer of the cumulative loss within equity.
Financial investments analyzed by issuer are as follow:
As at As at
30 June2019
31 December2018
Debt securities at fair value through other comprehensive income
– Governments and central banks 11,260,404 14,914,288
– Public sector entities 457,359 –
– Banks and other financial institutions 97,704,571 93,919,607
– Corporate entities 4,923,362 471,177
Equity securities at fair value through other comprehensive income
– Banks and other financial institutions 9,965 9,990
114,355,661 109,315,062
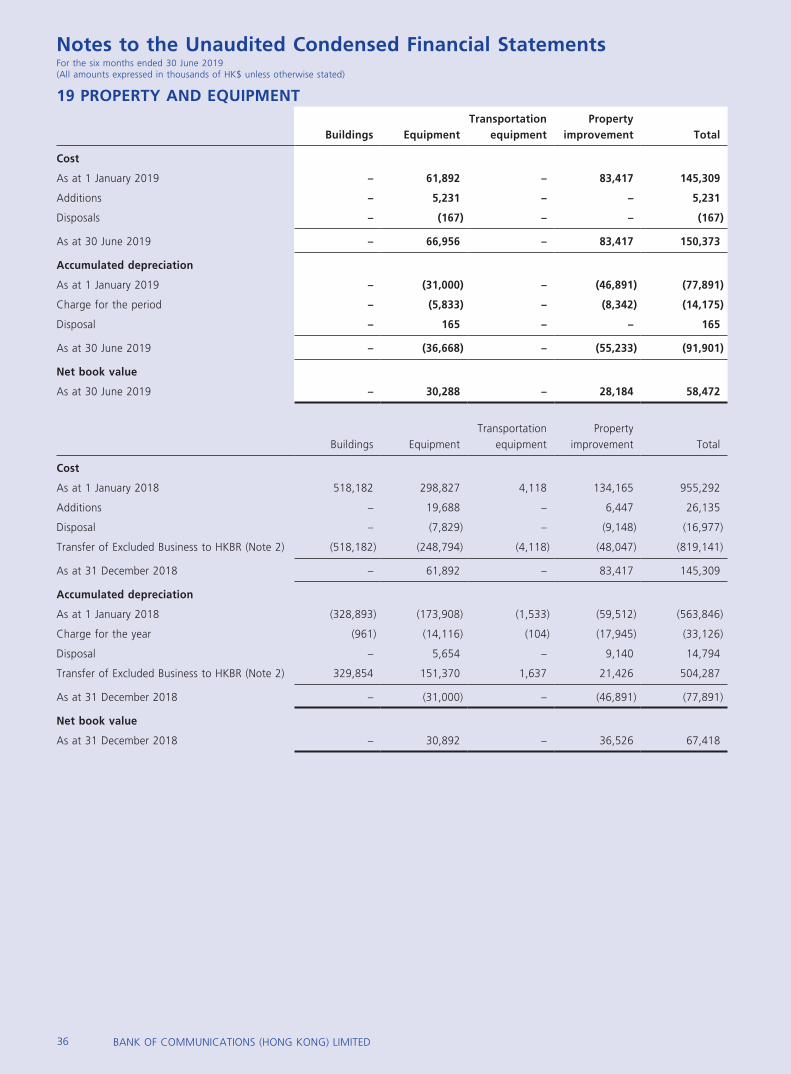
36 BANK OF COMMUNICATIONS (HONG KONG) LIMITED
Notes to the Unaudited Condensed Financial StatementsFor the six months ended 30 June 2019(All amounts expressed in thousands of HK$ unless otherwise stated)
19 PROPERTY AND EQUIPMENT
Buildings EquipmentTransportation
equipmentProperty
improvement Total
Cost
As at 1 January 2019 – 61,892 – 83,417 145,309
Additions – 5,231 – – 5,231
Disposals – (167) – – (167)
As at 30 June 2019 – 66,956 – 83,417 150,373
Accumulated depreciation
As at 1 January 2019 – (31,000) – (46,891) (77,891)
Charge for the period – (5,833) – (8,342) (14,175)
Disposal – 165 – – 165
As at 30 June 2019 – (36,668) – (55,233) (91,901)
Net book value
As at 30 June 2019 – 30,288 – 28,184 58,472
Buildings EquipmentTransportation
equipmentProperty
improvement Total
Cost
As at 1 January 2018 518,182 298,827 4,118 134,165 955,292
Additions – 19,688 – 6,447 26,135
Disposal – (7,829) – (9,148) (16,977)
Transfer of Excluded Business to HKBR (Note 2) (518,182) (248,794) (4,118) (48,047) (819,141)
As at 31 December 2018 – 61,892 – 83,417 145,309
Accumulated depreciation
As at 1 January 2018 (328,893) (173,908) (1,533) (59,512) (563,846)
Charge for the year (961) (14,116) (104) (17,945) (33,126)
Disposal – 5,654 – 9,140 14,794
Transfer of Excluded Business to HKBR (Note 2) 329,854 151,370 1,637 21,426 504,287
As at 31 December 2018 – (31,000) – (46,891) (77,891)
Net book value
As at 31 December 2018 – 30,892 – 36,526 67,418
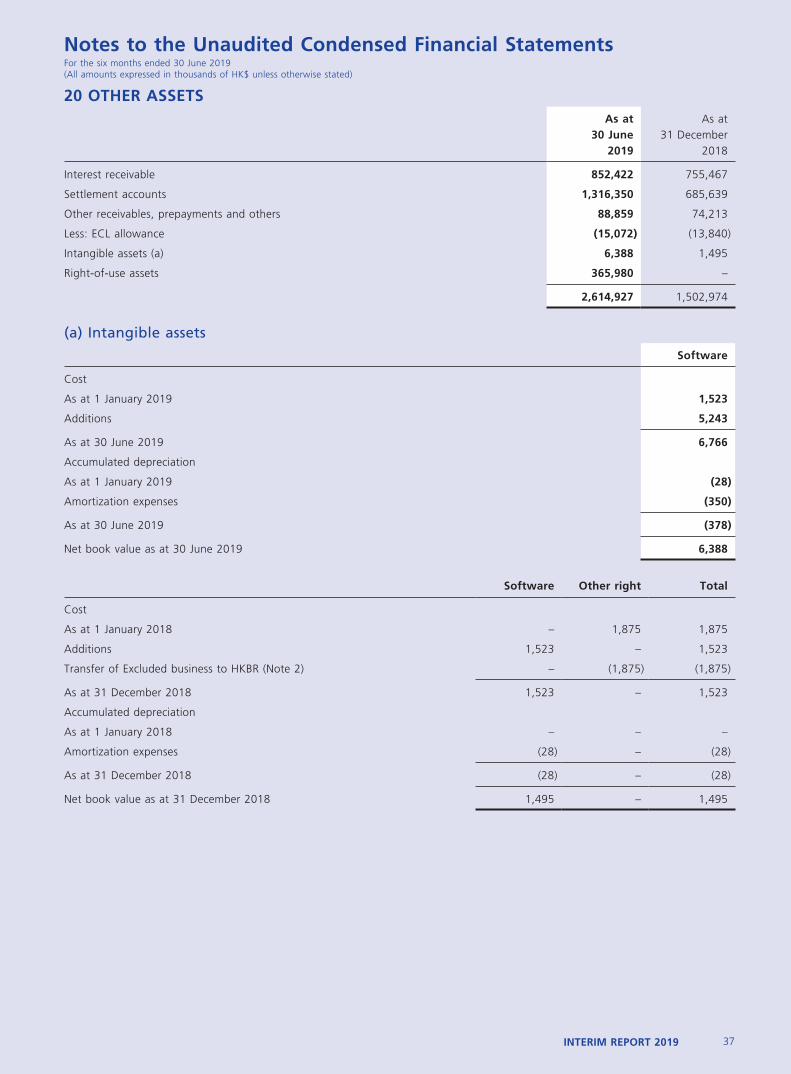
37INTERIM REPORT 2019
Notes to the Unaudited Condensed Financial StatementsFor the six months ended 30 June 2019(All amounts expressed in thousands of HK$ unless otherwise stated)
20 OTHER ASSETSAs at
30 June 2019
As at31 December
2018
Interest receivable 852,422 755,467
Settlement accounts 1,316,350 685,639
Other receivables, prepayments and others 88,859 74,213
Less: ECL allowance (15,072) (13,840)
Intangible assets (a) 6,388 1,495
Right-of-use assets 365,980 –
2,614,927 1,502,974
(a) Intangible assetsSoftware
Cost
As at 1 January 2019 1,523
Additions 5,243
As at 30 June 2019 6,766
Accumulated depreciation
As at 1 January 2019 (28)
Amortization expenses (350)
As at 30 June 2019 (378)
Net book value as at 30 June 2019 6,388
Software Other right Total
Cost
As at 1 January 2018 – 1,875 1,875
Additions 1,523 – 1,523
Transfer of Excluded business to HKBR (Note 2) – (1,875) (1,875)
As at 31 December 2018 1,523 – 1,523
Accumulated depreciation
As at 1 January 2018 – – –
Amortization expenses (28) – (28)
As at 31 December 2018 (28) – (28)
Net book value as at 31 December 2018 1,495 – 1,495
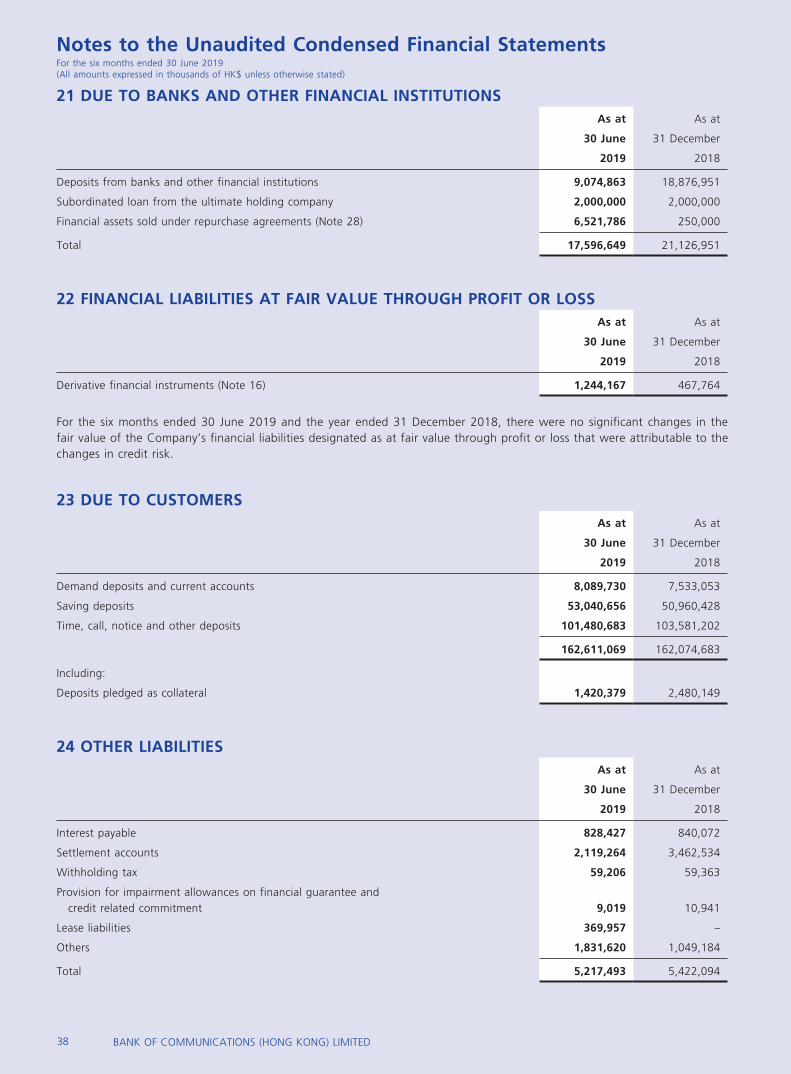
38 BANK OF COMMUNICATIONS (HONG KONG) LIMITED
Notes to the Unaudited Condensed Financial StatementsFor the six months ended 30 June 2019(All amounts expressed in thousands of HK$ unless otherwise stated)
21 DUE TO BANKS AND OTHER FINANCIAL INSTITUTIONSAs at As at
30 June 31 December
2019 2018
Deposits from banks and other financial institutions 9,074,863 18,876,951
Subordinated loan from the ultimate holding company 2,000,000 2,000,000
Financial assets sold under repurchase agreements (Note 28) 6,521,786 250,000
Total 17,596,649 21,126,951
22 FINANCIAL LIABILITIES AT FAIR VALUE THROUGH PROFIT OR LOSSAs at As at
30 June 31 December
2019 2018
Derivative financial instruments (Note 16) 1,244,167 467,764
For the six months ended 30 June 2019 and the year ended 31 December 2018, there were no significant changes in the fair value of the Company’s financial liabilities designated as at fair value through profit or loss that were attributable to the changes in credit risk.
23 DUE TO CUSTOMERSAs at As at
30 June 31 December
2019 2018
Demand deposits and current accounts 8,089,730 7,533,053
Saving deposits 53,040,656 50,960,428
Time, call, notice and other deposits 101,480,683 103,581,202
162,611,069 162,074,683
Including:
Deposits pledged as collateral 1,420,379 2,480,149
24 OTHER LIABILITIESAs at As at
30 June 31 December
2019 2018
Interest payable 828,427 840,072
Settlement accounts 2,119,264 3,462,534
Withholding tax 59,206 59,363
Provision for impairment allowances on financial guarantee and credit related commitment 9,019 10,941
Lease liabilities 369,957 –
Others 1,831,620 1,049,184
Total 5,217,493 5,422,094
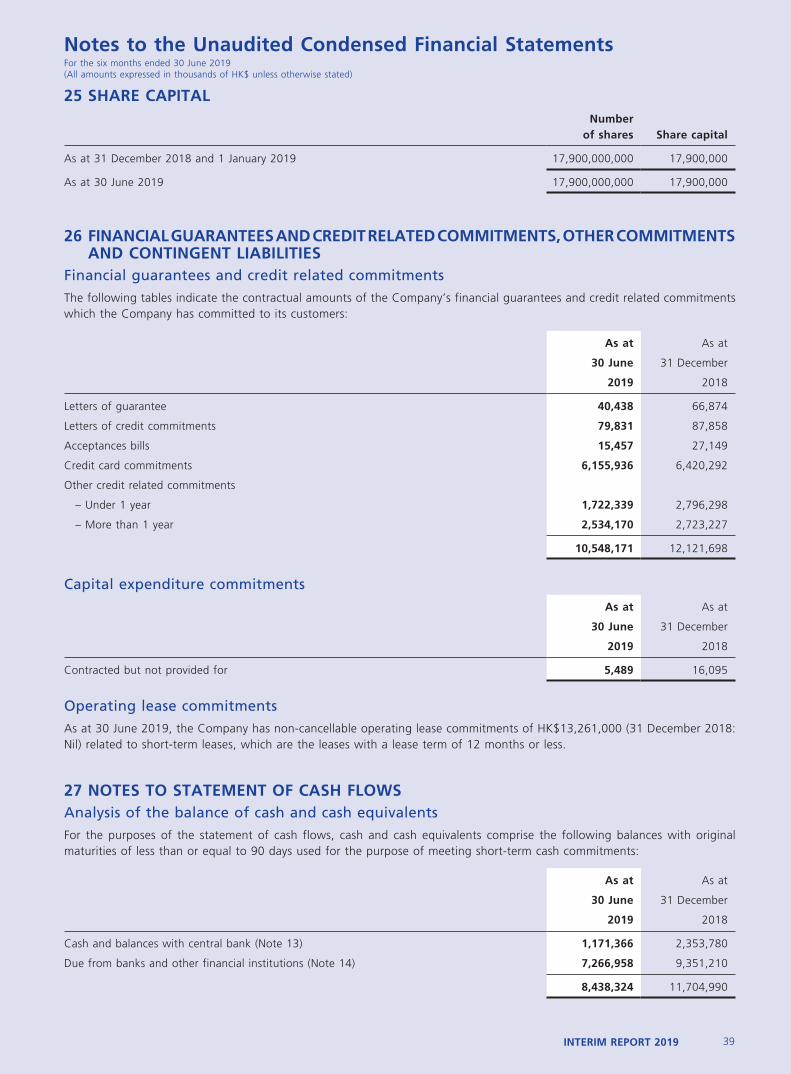
39INTERIM REPORT 2019
Notes to the Unaudited Condensed Financial StatementsFor the six months ended 30 June 2019(All amounts expressed in thousands of HK$ unless otherwise stated)
25 SHARE CAPITALNumber
of shares Share capital
As at 31 December 2018 and 1 January 2019 17,900,000,000 17,900,000
As at 30 June 2019 17,900,000,000 17,900,000
26 FINANCIAL GUARANTEES AND CREDIT RELATED COMMITMENTS, OTHER COMMITMENTS AND CONTINGENT LIABILITIES
Financial guarantees and credit related commitmentsThe following tables indicate the contractual amounts of the Company’s financial guarantees and credit related commitments which the Company has committed to its customers:
As at As at
30 June 31 December
2019 2018
Letters of guarantee 40,438 66,874
Letters of credit commitments 79,831 87,858
Acceptances bills 15,457 27,149
Credit card commitments 6,155,936 6,420,292
Other credit related commitments
– Under 1 year 1,722,339 2,796,298
– More than 1 year 2,534,170 2,723,227
10,548,171 12,121,698
Capital expenditure commitmentsAs at As at
30 June 31 December
2019 2018
Contracted but not provided for 5,489 16,095
Operating lease commitmentsAs at 30 June 2019, the Company has non-cancellable operating lease commitments of HK$13,261,000 (31 December 2018: Nil) related to short-term leases, which are the leases with a lease term of 12 months or less.
27 NOTES TO STATEMENT OF CASH FLOWSAnalysis of the balance of cash and cash equivalentsFor the purposes of the statement of cash flows, cash and cash equivalents comprise the following balances with original maturities of less than or equal to 90 days used for the purpose of meeting short-term cash commitments:
As at As at
30 June 31 December
2019 2018
Cash and balances with central bank (Note 13) 1,171,366 2,353,780
Due from banks and other financial institutions (Note 14) 7,266,958 9,351,210
8,438,324 11,704,990
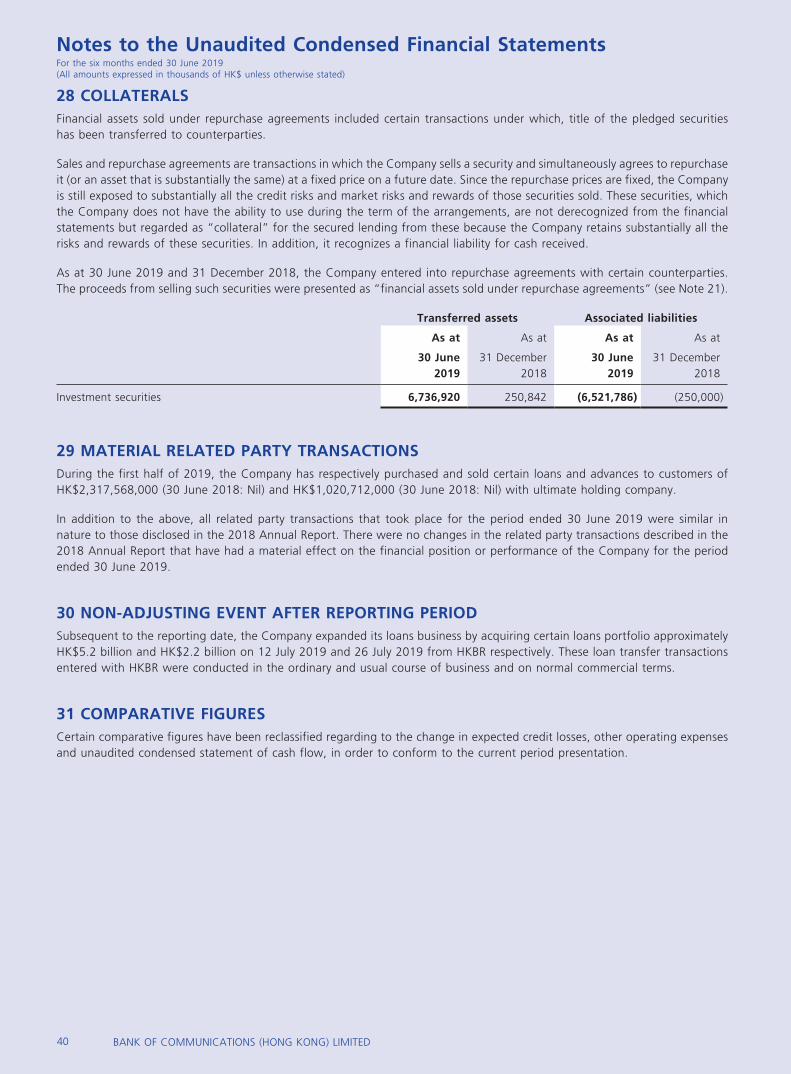
40 BANK OF COMMUNICATIONS (HONG KONG) LIMITED
Notes to the Unaudited Condensed Financial StatementsFor the six months ended 30 June 2019(All amounts expressed in thousands of HK$ unless otherwise stated)
28 COLLATERALSFinancial assets sold under repurchase agreements included certain transactions under which, title of the pledged securities has been transferred to counterparties.
Sales and repurchase agreements are transactions in which the Company sells a security and simultaneously agrees to repurchase it (or an asset that is substantially the same) at a fixed price on a future date. Since the repurchase prices are fixed, the Company is still exposed to substantially all the credit risks and market risks and rewards of those securities sold. These securities, which the Company does not have the ability to use during the term of the arrangements, are not derecognized from the financial statements but regarded as “collateral” for the secured lending from these because the Company retains substantially all the risks and rewards of these securities. In addition, it recognizes a financial liability for cash received.
As at 30 June 2019 and 31 December 2018, the Company entered into repurchase agreements with certain counterparties. The proceeds from selling such securities were presented as “financial assets sold under repurchase agreements” (see Note 21).
Transferred assets Associated liabilities
As at As at As at As at
30 June 2019
31 December 2018
30 June 2019
31 December 2018
Investment securities 6,736,920 250,842 (6,521,786) (250,000)
29 MATERIAL RELATED PARTY TRANSACTIONSDuring the first half of 2019, the Company has respectively purchased and sold certain loans and advances to customers of HK$2,317,568,000 (30 June 2018: Nil) and HK$1,020,712,000 (30 June 2018: Nil) with ultimate holding company.
In addition to the above, all related party transactions that took place for the period ended 30 June 2019 were similar in nature to those disclosed in the 2018 Annual Report. There were no changes in the related party transactions described in the 2018 Annual Report that have had a material effect on the financial position or performance of the Company for the period ended 30 June 2019.
30 NON-ADJUSTING EVENT AFTER REPORTING PERIODSubsequent to the reporting date, the Company expanded its loans business by acquiring certain loans portfolio approximately HK$5.2 billion and HK$2.2 billion on 12 July 2019 and 26 July 2019 from HKBR respectively. These loan transfer transactions entered with HKBR were conducted in the ordinary and usual course of business and on normal commercial terms.
31 COMPARATIVE FIGURESCertain comparative figures have been reclassified regarding to the change in expected credit losses, other operating expenses and unaudited condensed statement of cash flow, in order to conform to the current period presentation.