
Bakgrundsfakta: Basic principles for Labour Force Surveys ...
42
Labour and Education Statistics Ba kgr und a t c o F cs 201 : 11 Basic principles for Labour Force Surveys (LFS) and abour arket tatistics m s l
Transcript of Bakgrundsfakta: Basic principles for Labour Force Surveys ...
www.scb.se Labour and Education Statistics
ISSN 1103-7458
Ba kgr und a tc o F c s
Statistikpublikationer kan beställas från SCB, Publikationstjänsten, 701 89 ÖREBRO, e-post: [email protected],telefon: 019-17 68 00, fax: 019-17 64 44. De kan också köpas genom bokhandeln eller direkt hos SCB, Karlavägen 100 i Stockholm. Aktuell publicering redovisas på vår webbplats (www.scb.se). Ytterligare hjälp ges av Information och bibliotek, e-post: [email protected], telefon: 08-506 948 01, fax: 08-506 948 99.
Statistical publications can be ordered from Statistics Sweden, Publication Services, SE-701 89 ÖREBRO, Sweden (phone: +46 19 17 68 00, fax: +46 19 17 64 44, e-mail: [email protected]). If you do not find the data you need in the publications, please contact Statistics Sweden, Information and Library, Box 24300, SE-104 51 STOCKHOLM, Sweden (e-mail: [email protected], phone: +46 8 506 948 01, fax: +46 8 506 948 99).
201 : 1 1
Basic principles for Labour Force Surveys (LFS)
and abour arket tatistics m sl

The series Background facts presents background material for statistics produced by the Department of Labour and Education Statistics at Statistics Sweden. Product descriptions, methodology reports and various statistic compilations are examples of background material that give an overview and facilitate the use of statistics.
Publications in the series Background facts on Labour and Education Statistics
2000:1 Övergång till yrkeskodning på fyrsiffernivå (SSYK) och införande av jobbstatus- kod i SCB:s lönestatistik
2000:2 The Information System for Occupational Injuries and the Work-related Health Problems Survey – A comparative study
2000:3 Konferens om utbildningsstatistik den 23 mars 2000
2001:1 Avvikelser i lönesummestatistiken – en jämförelse mellan LAPS och LSUM
2001:2 En longitudinell databas kring utbildning, inkomst och sysselsättning 1990–1998 2001:3 Staff training costs 1994–1999
2001:4 Studieresultat i högskolan i form av avklarade poäng
2001:5 Urvals- och estimationsförfarandet i de svenska arbetskraftsundersökningarna (AKU)
2001:6 Svar, bortfall och representativitet i Arbetsmiljöundersökningen 1999
2001:7 Individ- och företagsbaserad sysselsättningsstatistik – en jämförelse mellan AKU och KS
2002:1 Tidsseriebrott i utbildningsregistret 2001-01-01
2002:2 En longitudinell databas kring utbildning, inkomst och sysselsättning (LOUISE) 1990–1999
2003:1 Exempel på hur EU:s ”Quality Reports” kan skrivas – avser Labour Cost Survey (LSC) 2000 2003:2 Förändrad redovisning av högskolans personal
2003:3 Individ- och företagsbaserad sysselsättningsstatistik – en fortsatt jämförelse mellan AKU och KS
2003:4 Sjukfrånvarande enligt SCB och sjukskrivna enligt RFV
2003:5 Informationssystemet om arbetsskador och undersökningen om arbetsorsakade besvär. En jämförande studie 2004:1 Samlad statistik från SCB avseende ohälsa
2004:2 Översyn av forskarutbildningsstatistiken. Bedömning av kvaliteten
2004.3 Sjukfrånvaro och ohälsa i Sverige – en belysning utifrån SCB:s statistik
2005:1 En longitudinell databas kring utbildning, inkomst och sysselsättning (LOUISE) 1990–2002
2005:2 Nordisk pendlingskarta. Huvudrapport 2005:3 Nordisk pendlingskarta. Delrapport 1–4.
2005:4 Flödesstatistik från AKU
2005:5 Flow statistics from the Swedish Labour Force Survey
2006:1 Sysselsättningsavgränsning i RAMS – Metodöversyn 2005
Continued on inside of the back cover!
Background Facts
Basic principles for Labour Force Surveys (LFS) and labour market statistics
Labour and Education Statistics 2011:1
Statistics Sweden 2011
Background Facts Labour and Education Statistics 2011:1
Basic principles for Labour Force Surveys (LFS) and labour market statistics Statistics Sweden 2011 Producer Statistics Sweden, Population and Welfare Department BOX 24300 SE-104 51 STOCKHOLM Inquiries Hassan Mirza, +46 8 506 946 72 [email protected] Berndt Öhman [email protected] It is permitted to copy and reproduce the contents in this publication. When quoting, please state the source as follows: Source: Statistics Sweden, Background Facts, Labour and Education Statistics 2011:1 Basic principles for Labour Force Surveys (LFS) and labour market statistics ISSN 1654-465X (online) URN:NBN:SE:SCB-2011-AM76BR1101_pdf (pdf) This publication is only available in electronic form on www.scb.se.

Background Facts for Labour and Education Statistics 2011:1 Foreword
Foreword The design of the Labour Force Surveys is based on ILO conventions and recommendations. These have been developed in cooperation between governments, employee and employer organisations, labour market economists and statisticians from all four corners of the globe. Since their inception, the Swedish Labour Force Surveys have basically followed the ILO's recommendations and conventions, but with one exception. Full-time students actively looking for work and who, according to ILO rules, shall be classified as unemployed in LFS, were excluded from LFS unemployment reports between 1987 and October 2007. They were instead included in the "Not in the labour force" group during this period. During the high unemployment of the 1990s, the unemployment figures were widely debated, the reason being that certain categories of participants in labour market policy measures, who were full-time students, but who were actively looking for work, were not reported as unemployed. Further confusion prevailed when ILO, OECD and Eurostat included these in their reports for Sweden. Youth unemployment and how it should be calculated has been the subject of much discussion in recent years.
This report is an attempt to bring clarity to this issue and clarify the concepts in LFS in particular and labour market statistics in general. There are several reports describing how LFS is designed. This report discusses why LFS is designed the way it is.
The report has been written by Berndt Öhman, who was responsible for labour market statistics at Statistics Sweden for 15 years. The author alone is responsible for the content of the report. Statistics Sweden does, however, share the views expressed by the author and hopes that the report will bring clarity to LFS definitions, etc. and how they are interrelated and hence provide a better basis for interpreting the statistics.
This report was originally published in Swedish in May 2010. We would like to thank our colleagues at Eurostat who in connection with the English version contributed with many valuable comments.
Sofia Anveden at the Labour Force Surveys has also made valuable contributions.
Statistics Sweden, June 2011
Mats Wadman
Hassan Mirza


Background Facts for Labour and Education Statistics 2011:1 Contents
Statistics Sweden 5
Contents
Foreword ..................................................................................................... 3
1 Introduction ............................................................................................ 7
2 An international perspective ................................................................. 9
3 Sweden ................................................................................................. 11
4 Labour Force Surveys (LFS) ............................................................... 134.1 A theoretical starting-point .................................................................. 144.2 Concepts and definitions ..................................................................... 15
4.2.1 The population .......................................................................................... 164.2.2 Labour supply – employed persons ...................................................... 174.2.3 Labour supply – hours worked and working hours ........................... 184.2.4 Labour supply – unemployed persons .................................................. 194.2.5 Full-time students (seeking work) ......................................................... 214.2.6 Share of the population or the labour force .......................................... 234.2.7 Youth unemployment .............................................................................. 254.2.8 Groups with a weak attachment to the labour market ....................... 254.2.9 Conclusions on the LFS concepts and definitions ............................... 27
4.3 Flow statistics ...................................................................................... 28
5 Labour demand .................................................................................... 315.1 Labour demand – filled vacancies ....................................................... 31
5.2 Labour demand – vacancies ....................................................................... 315.3 Working conditions .............................................................................. 325.4 Business cycle and structure ............................................................... 32
APPENDIX ................................................................................................ 35

6 Statistics Sweden
Background Facts for Labour and Education Statistics 2011:1 Introduction
Statistics Sweden 7
1 Introduction The aim of labour statistics is to provide information about the state of and trends in the labour market. This requires extensive and comprehensive statistics. There is no single indicator that can provide the necessary information on its own.
Labour statistics can be seen as both economic and social statistics. These are, if you like, two different aspects of the labour market. There is nothing to stop us adding other aspects of it as well. Labour statistics should be designed so that they provide a basis for different users and for different types of assessments of the labour market.
We can say that labour statistics concern the labour force. Ideally, they should provide a comprehensive and up-to-date picture that highlights key aspects of the labour market and presents the situation for different groups. Therefore, a rich content of variables are required.
In Sweden, we compile extensive statistics on the labour force in the form of three comprehensive surveys, based on registers, businesses and individuals. There is no real equivalent in other statistical sectors to these three comprehensive statistical products.
• The register statistics are based on people’s tax details and are “total population” statistics with relatively limited information about each individual. The register statistics have a considerable time-delay between the actual time of measure and the publication of the statistics but they can be used for describing the population down to very small groups. They also provide panels that can be tracked over time and can be easily linked to other register statistics. The Swedish Government has appointed a commission and tasked it to examine the scope for collecting the necessary data once a month instead of on an annual basis. Such a change would dramatically improve the topicality of the statistics. Register statistics are also used as auxiliary data in the Labour Force Surveys (LFS). This function would also be improved and thereby enhance the quality of LFS.
• Business statistics provide a business perspective with information about the number of employees in companies (rather than about the jobs of individuals) and about departures and recruitments. They can also provide information about employment vacancies at companies.
• LFS is a sample survey of individuals with comprehensive information, published quickly and frequently. It can be viewed as a quarterly survey in which a third (of the sample) is published for each month. Since each person recurs in eight consecutive quarters, LFS also enables us to track the individuals over time in what are known as “flow statistics”.
Together, these three surveys provide full, multifaceted information on employment, unemployment and vacancies. They produce both rapid statistics and statistics that go down to the total population individual level. The aim is for them to meet the statistical needs of many different users. Among these three surveys, it is LFS that both provide a
Introduction Background Facts for Labour and Education Statistics 2011:1
8 Statistics Sweden
fundamental holistic perspective of the labour force and the official measure of unemployment.
Labour statistics also include statistics on individuals’ working conditions in terms of work environment and salaries. The Labour Force Surveys (LFS) provide some information about the working circumstances. There are special register statistics on work injuries. And we now also have comprehensive wage statistics: both short-term statistics to assess economic trends and (partially total population) annual statistics for the structural analysis of pay trends. Very valuable statistics are also produced outside Statistics Sweden, a case in point being the Swedish Public Employment Service’s statistics on the number of job-seekers enrolling at Swedish employment agencies.1
Hereafter, we will mainly concentrate on LFS.
1 Statistics Sweden has made several comparisons between its own unemployment figures and job-seeker figures from the Swedish Public Employment Service.

Background Facts for Labour and Education Statistics 2011:1 International perspective
Statistics Sweden 9
2 An international perspective Official statistics in Sweden have become increasingly internationalised over the years. Extensive cooperation takes place between (almost) all the countries of the world within the framework of international organisations such as the UN, OECD and EU – the reason being the importance of international comparisons. The value of national statistics increases considerably if the same statistics are compiled in other countries. Specifically national needs are therefore sometimes subordinate to the importance of international comparability. One solution can be to complement national statistics with additional variables and new classifications. International cooperation can also help to improve the quality of statistics in general.
It is easy to understand that international comparisons are made easier if all countries compile similar statistics. It is important to understand however that there are still many difficulties attached to making these comparisons. I will mention two problems – Even if we have the same definitions in all countries we have some
differences in data collection methods (questionnaire, collection methods, sampling, etc)
– Even if we would have both similar definitions and collection methods we have another problem: the labour markets are (often very) different in different countries. This is an important problem because we are then comparing partly different phenomena.
It is nevertheless important to have similar statistics, but we should bear in mind all the potential problems involved in such comparisons. An example in the field of labour statistics is when we compare youth unemployment in different countries.
International cooperation on labour statistics began at an early juncture. The International Labour Organization (ILO), based in Geneva, was established as early as 1919 under the then League of Nations and later became a UN body. The OECD has also shown considerable interest in labour statistics. Through the Luxembourg-based Eurostat, the European Commission's Directorate General for statistics, the EU has driven forward the development of statistics over a wide area within the entire EU and labour statistics have been a key element of this development. All the time, the EU has kept consistent with ILO’s guidelines on labour statistics while adding further detail, e.g. regarding working age. Even for a large union such as the EU, the requirement for international comparability, not just between EU Member States but also over the whole world, is an important issue.
The ILO standards must therefore be considered to be the international reference as regards labour statistics. They have laid the foundation for broad labour statistics covering the labour force, work injuries and wages alike. The importance of being able to present real wages – where wage trends take inflation into account – has meant that the statistics based on ILO concepts have also incorporated consumer price indices. This is not

International perspective Background Facts for Labour and Education Statistics 2011:1
10 Statistics Sweden
normally part of labour statistics. The ILO usually convenes its members to a large-scale statistics conference once every five years or so and also has a number of meetings on various components of labour statistics.
The ILO has adopted Convention 160 that forms the basis for the content of labour statistics: C160 Labour Statistics Convention (1985). The Convention also states that the statistics shall be designed in cooperation with the representative organisations of employers and workers. This laid the formal foundation for the Expert Group on Labour Statistics in Sweden, which is still affiliated to the Statistics Sweden Labour Statistics Unit.
The ILO has presented its view on the design of the statistics in more detail in a special recommendation on labour statistics: R170 Labour Statistics Recommendation (1985). The organisation – or rather the ILO-organised conference of labour statisticians (ICLS) – has also adopted a number of resolutions on different components of labour statistics. These include definitions of concepts such as economically active population, employment, unemployment, underemployment, hours of work, labour costs, an integrated system of wage statistics, work injuries, etc.
An important example is the ILO’s long-term work on classifying occupations and the organisation adopted a new classification at the 1987 statistics conference in Geneva: International Standard Classification of Occupations, referred to as ISCO 88 (replacing ISCO 68). Eurostat builds on this classification by making a slight adjustment in its ISCO (COM). The Swedish Standard Classification of Occupations is also based on ISCO 88. The ILO-organisation has now adopted a new classification on occupations: ISCO-08.
Another classification of considerable interest to labour statisticians is education, but this falls within the remit of another UN body, the Paris-based UNESCO. This is the International Standard Classification of Education (ISCED). The Swedish version is called the Swedish Standard Classification of Education (SUN 2000).
Many individual countries have also put considerable effort into developing labour statistics, a case in point being the United States and its Bureau of Labour Statistics, which, for the same reasons as the ILO, also manages consumer price index statistics.

Background Facts for Labour and Education Statistics 2011:1 Sweden
Statistics Sweden 11
3 Sweden Sweden can be considered to have invested a great deal in labour statistics.2
Nowadays, most of Sweden’s international cooperation in this area takes place within the ESS and together with Eurostat in Luxembourg, which in turn cooperates with other international bodies and conforms very much to the UN system. This is not least true of LFS. The EU has encouraged all Member States to introduce LFS with a high level of ambition and uniformity. There is every reason to support this ambition.
The country has a long historical tradition of compiling such statistics and a special labour statistics unit was established within Statistics Sweden in 1985.
The EU LFS constitutes a common core as regards content and design of the national labour force surveys in the EU Member States. It has legally binding character through a set of regulations, and further specifications are given in the EU LFS explanatory notes, maintained by Eurostat and the national statistical institutes. EU Regulation 577/998 established the framework for the EU LFS, and Regulation 377/2008 provides the currently applicable set of common EU LFS variables.
2 I regard official statistics as an investment into the infrastructure of society. Read B. Öhman, The role of official statistics in a democratic society: statistics as an investment – free for users.( Background facts – population and welfare statistics 2001:1).

12 Statistics Sweden

Background Facts for Labour and Education Statistics 2011:1 Labour Force Surveys
Statistics Sweden 13
4 Labour Force Surveys (LFS) LFS can be seen as the most important survey of a country’s labour force. Its purpose is to give an all-round, comprehensive picture of the workforce and constitutes a natural basis for labour market policy. It also constitutes a source for the national accounts system and is hence a component of economic statistics. In every respect, it forms a basis not just of employment policy but of a country’s entire economic policy. It includes the most important production factor: labour input, an economic indicator of its importance being the wage share of GDP. LFS is required for an assessment of social development as a whole, not just from an economic and social point of view but also from other perspectives. It is very important for the debate on equality between women and men.
The statistics must be designed with these requirements borne in mind. They often resemble instrumental requirements: the statistics shall provide quantitative information – figures – about various conditions and this is used as a direct basis for decision-making. Policy goals are often expressed as quantitative targets with a numerical measure of how employment and unemployment should or must develop.
Economic policy places high demands on the background statistics. All economic statistics must therefore be based on sound economic theory that permeates all sub-areas: production and prices, the finance market, labour market, etc.
As has already been stated, these statistics are also coordinated on an international level. The ILO Labour Statistics Convention reflects above all the high demands put on statistics by economic analysis. LFS (in a country like Sweden) must therefore be adapted to UN and EU requirements for labour force surveys and must be designed so that it can be incorporated into the background data for the national accounts. The ILO-fostered recommendations of the International Conference of Labour Statisticians have focused on these considerations from the outset.
We can say that labour statistics, as a type of economic statistics, focus on analysing labour supply and demand (including unemployment and vacancies) and different aspects of working conditions. The statistics are also of considerable interest from a social point of view, but the social aspects relate to the different situations individuals find themselves in, how they feel and are treated, how work is distributed, etc. The interest is therefore sharply focused on unemployed people and above all on groups with a loose attachment o the labour market, on those who are least integrated into it. Youth unemployment is again an example of the problem. We should also mention that the aim of focusing more on loose attachment groups is to provide a better measure of (potential) labour supply that has insufficient labour market penetration. With this approach, these issues are also of considerable interest when performing an economic analysis of the labour market.
The LFS gives information primarily on individuals. There is also an interest to get some information on households. The supply of labour is e.g.
Labour Force Surveys Background Facts for Labour and Education Statistics 2011:1
14 Statistics Sweden
often regarded as a matter for the whole family. The EU-LFS requires such information – with good reasons – and the Swedish EU-adapted LFS now follows these demands.
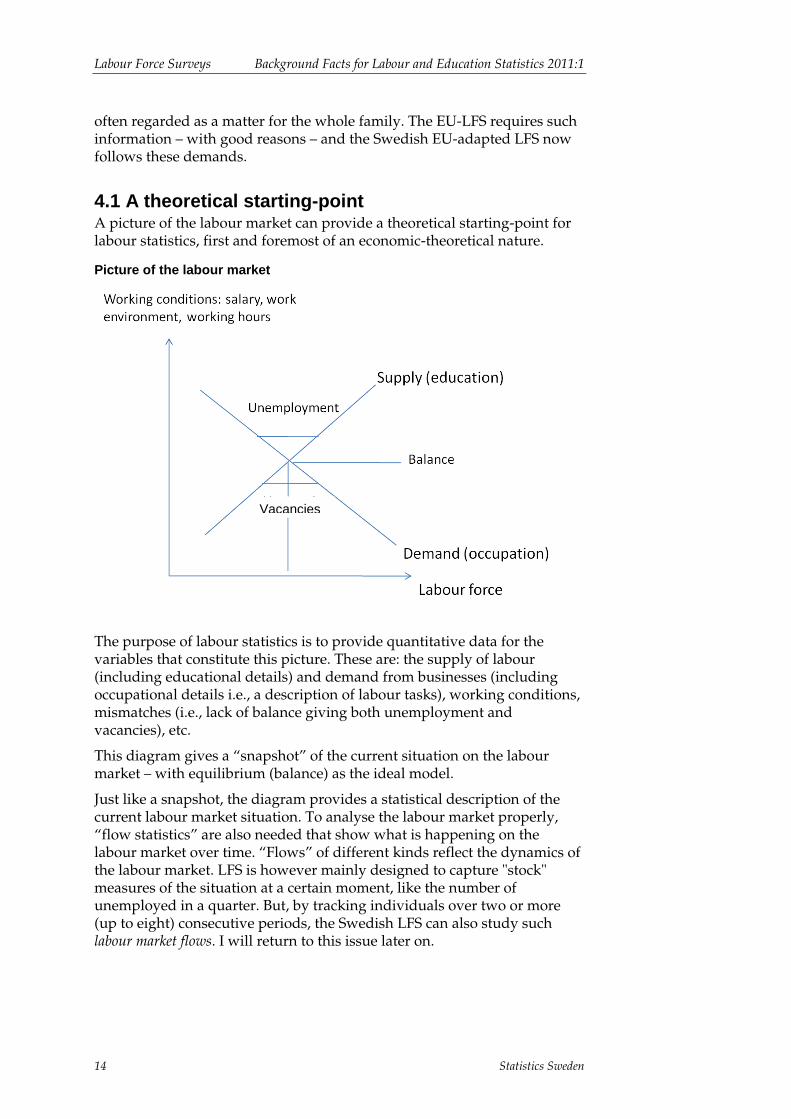
4.1 A theoretical starting-point A picture of the labour market can provide a theoretical starting-point for labour statistics, first and foremost of an economic-theoretical nature.
Picture of the labour market
The purpose of labour statistics is to provide quantitative data for the variables that constitute this picture. These are: the supply of labour (including educational details) and demand from businesses (including occupational details i.e., a description of labour tasks), working conditions, mismatches (i.e., lack of balance giving both unemployment and vacancies), etc.
This diagram gives a “snapshot” of the current situation on the labour market – with equilibrium (balance) as the ideal model.
Just like a snapshot, the diagram provides a statistical description of the current labour market situation. To analyse the labour market properly, “flow statistics” are also needed that show what is happening on the labour market over time. “Flows” of different kinds reflect the dynamics of the labour market. LFS is however mainly designed to capture "stock" measures of the situation at a certain moment, like the number of unemployed in a quarter. But, by tracking individuals over two or more (up to eight) consecutive periods, the Swedish LFS can also study such labour market flows. I will return to this issue later on.
Vacancies
Background Facts for Labour and Education Statistics 2011:1 Labour Force Surveys
Statistics Sweden 15
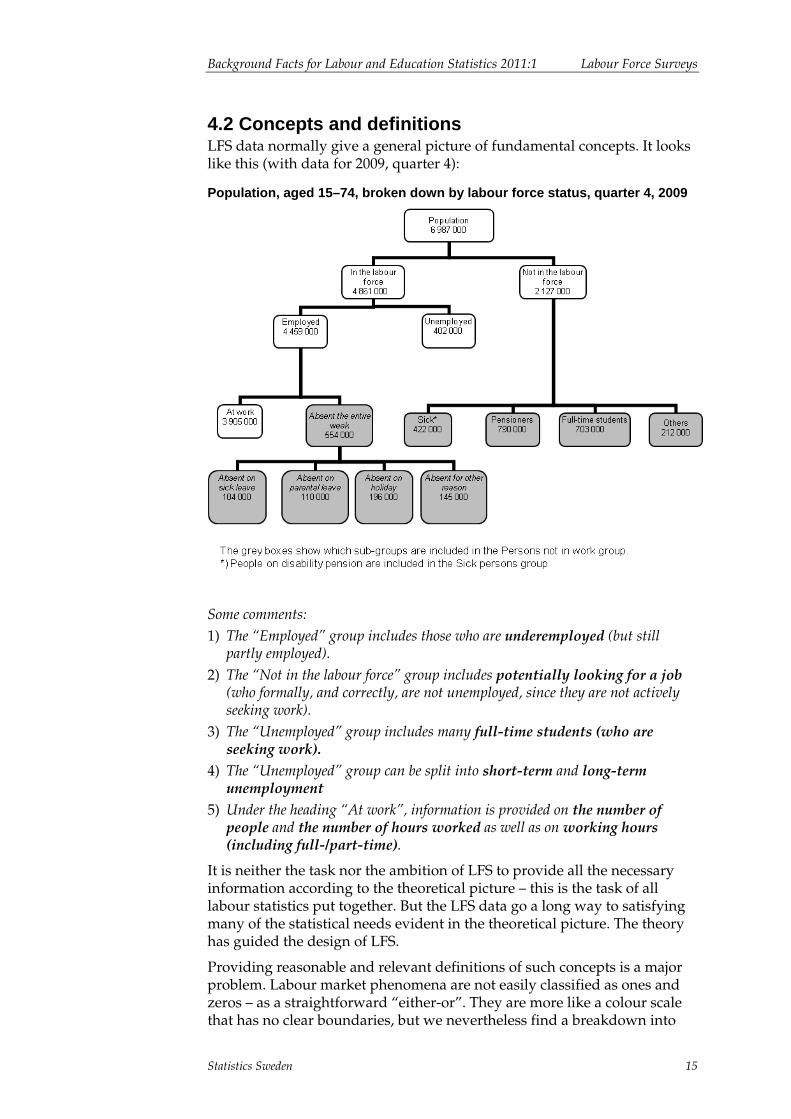
4.2 Concepts and definitions LFS data normally give a general picture of fundamental concepts. It looks like this (with data for 2009, quarter 4):
Population, aged 15–74, broken down by labour force status, quarter 4, 2009
Some comments: 1) The “Employed” group includes those who are underemployed (but still
partly employed). 2) The “Not in the labour force” group includes potentially looking for a job
(who formally, and correctly, are not unemployed, since they are not actively seeking work).
3) The “Unemployed” group includes many full-time students (who are seeking work).
4) The “Unemployed” group can be split into short-term and long-term unemployment
5) Under the heading “At work”, information is provided on the number of people and the number of hours worked as well as on working hours (including full-/part-time).
It is neither the task nor the ambition of LFS to provide all the necessary information according to the theoretical picture – this is the task of all labour statistics put together. But the LFS data go a long way to satisfying many of the statistical needs evident in the theoretical picture. The theory has guided the design of LFS.
Providing reasonable and relevant definitions of such concepts is a major problem. Labour market phenomena are not easily classified as ones and zeros – as a straightforward “either-or”. They are more like a colour scale that has no clear boundaries, but we nevertheless find a breakdown into

Labour Force Surveys Background Facts for Labour and Education Statistics 2011:1
16 Statistics Sweden
different colours meaningful. This leads to difficulties for all classification on the labour market since the very essence of classification is some form of delimitation or differentiation. Statistics must draw clear boundaries even when reality has none.
International organisations – and in the case of LFS especially Eurostat in its EU LFS explanatory notes and user guide – put considerable effort into developing reasonable, practical definitions of concepts and classifications in labour statistics. In principle, all groups in a table should be clearly defined – and no development work on statistics is fully finished until a tabulation plan has been produced. This applies to definitions of fundamental concepts such as labour force, employment, unemployment, being at work or absent, number of hours worked, working time arrangements, etc. – and the same thing applies to other sub-areas of labour statistics such as wages and labour costs.
LFS presents figures for all these concepts and variables with supplementary information on individuals such as age, sex, education, occupation, sector, branch of industry, region of work or residency, etc., and standards have been developed for each of them.
4.2.1 The population In Sweden, LFS uses population statistics (TPR – Total Population Register) as a sample frame and for reports. This is a comparatively simple presentation and applies also to the classification into age classes, although certain rules apply to how the classifications are to be done. But there are also problems associated with the TPR, particularly when identifying all migrants in Sweden, known as “overcoverage” – tens of thousands of people are probably on the TPR despite having moved out of the country, we just don’t know who they are. Another key question is how we want to report Swedish people who work abroad (still living in Sweden). As all other countries face the same question about their nationals living abroad, a harmonised solution is necessary. The solution adopted is that they are all captured only in the country where they live. For instance, the figures of Swedish people in all the other EU countries are available from Eurostat.
Another problem is the statistics on households. The TPR does not give a good picture of households. Until the population census of 1990, the tradition was to have regular censuses that provided information on households, but these have since been discontinued. With a civil registration system based on cadastral registers (where we know who are cohabiting even in rented accommodation), we can report the population in terms of both individuals and households, without having to collect census information. This would dramatically increase the value of all individual-based statistics (which could also then be reported on the household level). As far as I am aware, this will be introduced starting with a register-based census in 2011. In accordance with the EU requirements, LFS now collects information on households and includes information on the household level in the tabulation plans.

Background Facts for Labour and Education Statistics 2011:1 Labour Force Surveys
Statistics Sweden 17
4.2.2 Labour supply – employed persons LFS describes labour supply in detail. The most obvious supply is of course actual employment (measured in number of persons or hours). Unemployed persons are also part of the supply.
Employed persons are those who have a job or work in their own business/farm as an entrepreneur or assistant. One question – which it is common sense to ask – is whether those who work for just a few hours a week should be classed as employed. They are not employed for more than a small part of what we can term a normal full-time job (around 40 hours a week). Here, LFS is unbendingly consistent in its reporting (following ILO’s lead): everyone who does at least some work shall be classified as employed. For practical reasons, the basic minimum is one hour’s work a week. If someone wants to work more than part-time – and can therefore be said to represent a labour supply that has not led to actual work – this is a form of underemployment. The number of underemployed persons is, however, included in the employed persons group (but could also be called “part-time unemployed”). If someone wants to work without actually having worked a single hour, he or she is included in the Unemployed persons group.
A classification that requires a higher minimum number of hours worked – e.g. 10 hours/week – would exclude a number of people with a limited connection to the labour market. This can appear reasonable. But any classification boundaries would be arbitrary in a way that would seriously impair the consistency of the statistics. Note that 1 hour/week does not constitute a “boundary” but is a minimum concept (for what is worth reporting).3
There are other difficult boundaries in the concept of employed persons, e.g. in the Self-employed persons and assistants group. It can be difficult from a practical point of view to give an accurate picture of what constitutes a job, how many hours are worked, etc., but the basic principles are the same.
“Absent” persons who are still classified as employed (but not at work) constitute another problem. Why should they be classified as employed at all? The problem mainly arises regarding longer absence, temporary absence is understandable. In Sweden, people having a job can be absent, e.g. on parental leave, for long periods of time. This is consistent and correct since LFS also reports the number of absentees. Similarly, persons on long-term sick leave can remain as employed and are excluded only when they, for example, are put on disability pension or leave the job for some other reason. LFS’s reporting is therefore consistent and transparent since all the information is provided (i.e. that these people who are reported as employed are also reported as absent including the reason for absence – the user receives this relevant information).
3 A similar minimum concept is applied in the register statistics for gainfully employed persons, which is not to be looked on as a "boundary" either, in the form of a lowest work income as the criterion for when someone shall be included among gainfully employed persons (note that this statistic is based on the income register) The intention is that it should correspond approximately to the LFS definition of "employed persons".

Labour Force Surveys Background Facts for Labour and Education Statistics 2011:1
18 Statistics Sweden
Reporting of the Employed persons group is made easier by the fact that the group is characterised by a few definitive properties, e.g. they have a job, have attended a workplace, run a business, etc. The reporting is made more difficult by the fact that in some cases it is hard to specify clear, uniform criteria. The core is clear but the boundaries are difficult.
Statistics describe the individuals, providing data on age, sex, education, where they work (region), in which branch of industry and in which occupation they work, etc. In Sweden, some of those data are not collected by the LFS but by other sources, and later integrated: individual data on age and sex are taken from the population statistics, education data from the Education Register and coded according to ISCED, Swedish version SUN 2000. Occupation data are not taken from the Occupations Register (YREG), but are collected separately and coded according to ISCO 88COM, Swedish version: Swedish Standard Classification of Occupations (SSYK). Sub-sector is coded according to the Swedish Standard Industrial Classification (SNI 2007). All these data adhere to international standards. [The register statistics provide data on both where the individuals live (“night population”) and where they work (“day population”) and can also therefore produce commuting statistics].
All these descriptions of the labour supply reflect the fact that persons are not similar or homogeneous. The work performed must also be described in more detail – what work is performed? We should here note, however, that the classification of occupations is basically a description of jobs, not of individuals. In practice, it is reported in relation to individuals but an individual can, in principle, have several types of jobs/working tasks – i.e. several occupations – just as it is possible to have work in different branches of industry. The classification reflects different types of labour input – classified as occupations.
The ILO and EU attach great importance to occupation data in both LFS and censuses (which require a more comprehensive occupations register). The next EU census will take place in 2011. Prior to this, the ILO has introduced a new occupations standard (ISCO-08). The EU does not intend to develop its own version of this standard. LFS (and a few other statistical products) shall report in accordance with the new standard as from 2011, according to plan. The Swedish Standard Classification of Occupations may need to be updated with ISCO-08 as a basis prior to this.
4.2.3 Labour supply – hours worked and working hours LFS describes employment in such detail that it captures all performed working hours. We can see how the total number of working hours varies per week, month, quarter and year. Because LFS is a continuous survey, we can also see seasonal patterns and measure the total number of working hours during a calendar month, quarter and year.
Weekly and yearly working hours vary considerably from individual to individual. The total number of hours worked is hence a better measure than the number of employed persons when labour statistics are used as economic statistics – i.e. as a measure of actual labour input. It is a good indicator of how the labour market develops over time. The number of employed persons may be equally important from a social perspective but
Background Facts for Labour and Education Statistics 2011:1 Labour Force Surveys
Statistics Sweden 19
there is reason to highlight the statistics on hours worked more than tradition admits.
LFS describes the labour supply in terms of persons and hours worked. We could therefore link the classification of occupations also to the number of hours worked to report performed work (of various kinds) – i.e. not connected to individuals but to the number of all hours worked.
Different types of jobs/occupations are often associated with different rates of pay; they are valued differently by the market. Work performance can also vary within a given occupation. Piecework is one way of trying to relate remuneration to this input but (hourly) pay can also vary within the same occupation. Pay can hence be seen as an indication of the value of labour input, as regards both different types of work and different performance levels within the same occupation. Setting the “right” pay level is obviously a difficult task and explains, apart from just conflicts of interest, the problems associated with salary setting in businesses.
According to Ralph Turvey – former Chief Statistician at the ILO – a labour accounts system should link a salary statement to every hour worked in order to obtain a system that is consistent with economic theory. This salary statement would then be the economic measure of the labour input.
There is often a strong link between an individual’s education and the kind of working tasks in his/her job. The classic example of this is occupations that require authorisation in the form of a certain educational qualification: doctors, dentists, lawyers, etc. The Statistics Sweden Forecast Institute has estimated that there is a strong link between education and occupation for about half the labour force. For the rest, a certain choice of education does not give a clear indication of the type of job a person will have in the future. The choice of education is therefore partly – but only partly – a choice of occupation.4
LFS also describes how working hours are distributed over time. It tells us how many hours each individual works during the day and week, whether they work full- or part-time, and when they work. This in turn tells us about an individual’s work schedule during the day/night and during the week – what we term “working time distribution”. It also tells us how much overtime that is performed.
Another way of saying this is that the choice of occupation depends – but only partly – on the educational level.
Working hour statistics also show holiday leave (as a reason for absence). We can measure the total amount of holiday leave and we can see how it is distributed over the year, i.e. whether more of us in Sweden, as for most of the other countries in Europe, are taking out holidays later in the summer, in August rather than in July.
4.2.4 Labour supply – unemployed persons Those in the Unemployed persons group don’t have a job but are available to work and are actively seeking work (searched for work in the last 4 weeks). They constitute a labour supply that has not led to actual employment. This is measured in LFS from detailed questions about how individuals 4 Several studies from the Forecast Institute, most recently Theme: Education 2009:5. The labour market for the highly educated.

Labour Force Surveys Background Facts for Labour and Education Statistics 2011:1
20 Statistics Sweden
behave: if they can work and are actively seeking a job. Employment agencies measure a “subset” of unemployed persons in LFS in terms of the number of job-seekers enrolled with them (not all unemployed in LFS are registered at the Employment agency).
This labour supply is not always clearly defined. There is no simple division between those who fulfil and those who don’t fulfil the conditions for unemployment. The core of unemployed persons – e.g. those recently dismissed/made redundant – is as clear as the core of employed persons. Some of those who work part-time would like to work more hours. Such a person is partly employed, partly unemployed (in the sense that they want more work) but are included in the Employed persons group. The division is then clear and can be accepted since this group is also reported as (employed though) underemployed.
The transition from unemployed to persons outside the labour force/market is, however, gradual and hence ambiguous. Many who are not classified as unemployed (in LFS) could and would like to work under certain circumstances. But (in the prevailing circumstances) they are not seeking work. They are therefore potentially looking for a job and are outside the labour force. We hence have interesting forms of both underemployment and latent job-seekers. LFS also tries to measure such phenomena and report them in the statistics.
The basic criterion is that the person without work is actively seeking work. In LFS we try to clarify activities that confirm that the person has been seeking work. This is no easy task and a great deal of effort is put into finding reasonable criteria for the concept of job-seeking activity as a basis for this division: in the labour force (but unemployed) or outside the labour force (and not seeking work). Here it is true that – similar to absence due to illness – long periods of unemployment take a person further away from the labour market. The transition happens gradually but we try to find criteria that define more exactly when it occurs.
There is a fundamental relation here in the definitions of employment and unemployment. A wide definition of “employed person” is applied. One hour’s work a week is sufficient for a person to be included in the “Employed persons” group. This has provoked criticism, which is unfounded since LFS provides detailed information on how much part-time work is done and whether there is a desire to work more. In other words, we are given all the information we need to know. A similarly wide definition is applied to “unemployed person”, not at the boundary with employed person (where being employed is the overriding concept) but at the boundary with the “Not in the labour force” group. This has also met with some criticism. There is a belief that too many people are classified as unemployed. But here too, LFS is consistent – and provides all the information required.
It seems as though unemployment is a more unclear concept than employment: to be employed it's enough to have a job; for being unemployed it is not enough not to have a job – several further conditions are required. In this respect the employment definition looks more straightforward. There is also more discussion on the concept of unemployment. Some current examples include full-time students and young people – we have already dealt with underemployed persons and

Background Facts for Labour and Education Statistics 2011:1 Labour Force Surveys
Statistics Sweden 21
latent job-seekers. One explanation is that unemployment is of particular interest from a social point of view. And it is indeed also a reason why, in labour statistics, labour supply is described in more detail than labour demand.
4.2.5 Full-time students (seeking work) Some students study full-time but would like to work and can therefore – if they are available to work and are seeking it – be seen as job-seekers/unemployed persons. This issue is more important in Sweden than in other countries, because there are more students in this situation. According to ILO standards, they should be classified as unemployed persons in LFS. They fulfil all the conditions for unemployment. In 1987, the Swedish Government (against Statistics Sweden’s advice) took the decision to exclude full-time students from LFS reporting on unemployment (but in ILO and OECD statistics, they continued to be reported in accordance with ILO rules). Since October 2007 and being an EU Member State, Sweden has adapted to the ILO rules but there is still a discussion on what is appropriate.
We can here discuss two different issues: – whether the ILO standards are adequate – informative, accurate,
measurable, etc. – whether we should follow international standards even if we do not
wholly agree with them (or do not find them adequate for the labour market situation in Sweden)
This report mainly argues in support of the ILO rules. Statistics should consistently follow the guidelines laid down for various concepts, without exception. This provides the best information on the labour market. It is worth emphasising, however, that one single value – whatever measure it refers to – can never give a complete picture of the labour market. LFS is consequently designed to give comprehensive, multi-dimensional information about multi-dimensional concepts such as employment and unemployment. LFS provides both – an official measure of employment and unemployment, well founded
on economic theory – an exhaustive additional information on both these concepts allowing
us to gain a more modular picture than the one a single value would give; using LFS, we can create other estimates for special needs.
It is not possible to claim that the LFS official measures of unemployment are misleading because job-seeking full-time students are included in the unemployed persons statistics. LFS provides information on what the figures stand for and the figures (although still burdened with some uncertainty) show what unemployment is in accordance with a well-defined concept. The problem is then not that the LFS statistics are misleading but rather that some users misunderstand them.
However, there is a point in the criticism. It should be made quite clear that a large share of the full-time students who state in LFS that they would like to work are nevertheless reasonably satisfied with their situation as students. Many of them see themselves primarily as students and have a

Labour Force Surveys Background Facts for Labour and Education Statistics 2011:1
22 Statistics Sweden
better situation than many other unemployed persons. This illustrates that the Unemployed persons group is not socially homogeneous, either.
We may of course want the ILO rules to be changed – a discussion relating primarily to the example given – but this would detract from the value of the statistics, in my opinion. We would no longer consistently report labour supply as it is defined by the general rules of being able to work and actively seeking it.
The difficulty in clearly reporting and defining different groups is therefore very much a reflection of reality – i.e. it is not possible to divide people up into clearly distinct groups. This means that it is important to have a theory as a basis for the divisions and to follow it consistently – at the same time informing about the problems and making other divisions possible that may be relevant for special purposes.
Another issue is whether we should follow – or deviate from – ILO standards in our (internal) reporting in Sweden. Such deviation may be justified based on some people’s dissatisfaction with the definition itself. But the requirement for international comparability clearly suggests that we should adhere to the rules. The ILO, EU and OECD will, in any case, still report figures for Sweden in accordance with ILO standards. In June 2007, the Swedish Government decided to repeal a previous government decision from 1987. Under this previous decision, full-time students, including persons participating in employment measures who had looked for work, were not defined as unemployed despite this being recommended by international conventions and recommendations. Statistics Sweden decided that LFS was to comply fully with international standards as from October 2007.
There is a more general question here. International comparability requires statistics based on the same standards in all the countries, but it is not enough, as the conditions – in this case on the labour market – can be different from one country to the next. This makes comparisons between countries difficult and perhaps even misleading. The solution to this problem must be to provide information about the labour market in different countries in such a form that facilitates the interpretation of the statistics and the international comparisons.
To sum up:
• Full-time students give labour statistics some problems. Most of them are primarily students but they may work a few hours per week – then they are included as employed. They may seek a few hours work per week without getting jobs – then they are included as unemployed. I find this correct – they are treated as all other individuals – but in both cases they are a bit “different”. Users must know this and producers of statistics must give very good information on it – better than now.
• My answer to the two issues above is thus very clear: yes, yes.

Background Facts for Labour and Education Statistics 2011:1 Labour Force Surveys
Statistics Sweden 23
4.2.6 Share of the population or the labour force Above, we presented how LFS divides up the population from a labour market perspective. It can be briefly described as follows:
One usually relates the labour force to the entire population to obtain a measure of the extent to which the population participates in the labour force. This measure obviously varies a great deal between different age groups and we can sometimes speak of “working ages” – which LFS focuses in particular on (15–64 years). Some interest is, however, also devoted to pensioners or the 65–74 age group.
Labour force participation varies considerably over time due to several factors such as:
• changed scope of work outside the labour market (unreported, unpaid work)
• changes in education and training
• changed age of retirement
• changed morbidity
• changes in age composition (and in other groups)
In a modern society, LFS will basically capture all gainful employment. This does not include leisure work (which is not seen as a problem here). Housework is not included either as, for national accounts, it is not an economic activity like farming or some other business. It therefore relates in particular to women’s labour force participation and to how unpaid work is treated. This must be considered in historical and international comparisons since the differences in the amount of gainful employment will be substantial in different cultures without it reflecting an accurate, complete picture of the work done by the whole population. Low-productive activities in developing countries will be easily transferred into the “Outside the labour force” group – the boundary is vague.
Another important factor is increased education especially in younger groups – please see the next section for more about this. Lifelong learning (for all ages) has also increased but to a far less extent. Increased participation in education has greatly reduced participation in the labour force of young adults. This is not a failure, however, but rather an intended

Labour Force Surveys Background Facts for Labour and Education Statistics 2011:1
24 Statistics Sweden
effect. There are also considerable international differences in the extent to which populations participate in education. This should be considered in historical and international comparisons.
There are many other factors influencing the share of the population in the labour force. The retirement age, morbidity and health, cultural factors, etc., all play a part. LFS reports as strictly as possible, in accordance with the ILO standards, who is included in the labour force. It is an accurate presentation for those who are acquainted with these rules. But there is reason to emphasise how easily accurate statistics can be misinterpreted if the causes of changes in labour force participation are not considered.
There are indeed substantial variations in labour force participation: between countries, over time, between different ages, between various other groups, between different regions, etc. This is obvious from the labour force participation statistics. Changes in the age composition over time also play an important role when reporting on the whole population since labour force participation varies between different ages (even within the 15–64 age group) – and more or less the same applies to a number of other groups.
The question is how to report the sub-components of labour force participation: employed persons and unemployed persons. Which denominators should be used? Indicators in LFS show the share of unemployed persons in relation to the labour force (and therefore also the share of employed persons). This is to show what share of those available and willing to work (the labour supply) does not find a job. This is very central information that is very much associated with the theoretical approach behind the indicators in LFS as well as with what is an obviously relevant question: how difficult is it to find a job, and how many fail? We can also put the number of unemployed persons in relation to the entire population – LFS also gives us this option. But this figure will be easily misleading when we make historical, regional and group comparisons for reasons described above. The same unemployment (in absolute terms) will be assigned different numerical data as labour force participation varies. When women started to join the labour market, from very low numbers in the labour force, their unemployment, measured in relation to the entire population, could have easily appeared to be very small even when it was comparatively high (when compared to the female labour force). Conversely, youth employment according to LFS can nowadays appear to be unreasonably high, measured in relation to the share of the labour force within this group – please see next section. LFS always follows a consistent line and also enables alternative descriptions for an in-depth analysis.
LFS does not report the number of employed persons in relation to the labour force. This is not so interesting when the unemployment figures are reported. Together they will add up to 100 percent. As an economic statistic, however, it is important, if not indeed crucial, to follow the trend in work performed in the economy. This is best measured as the number of hours worked and that statistic is reported in detail in LFS. It is also measured as the number of employed persons and it is, not least for historical analyses and forecasts, of considerable interest to see what proportion of the population actually work. This statistic always occupies (in one form or another) a central place in analyses of the maintenance burden –

Background Facts for Labour and Education Statistics 2011:1 Labour Force Surveys
Statistics Sweden 25
i.e. how many other persons on average does the employed person have to provide for? LFS also provides a basis for such studies and regularly reports these figures on employment intensity.
4.2.7 Youth unemployment5
It is quite natural that young people (and migrants), who have to get access to the labour market, have more problems than other more established groups on the labour market. During the autumn of 2009, unemployment in the 15–24 age group has been over 20 percent (Sept: 24.3 percent). This is obviously a very high figure and hints at a serious problem. But it is exactly this kind of indicator (without being misleading in itself) that needs to be supplemented with further information. What we should point out in this case is that about half of this age group are students and about half are in the labour force (including some students). The unemployment rate refers to the percentage of unemployed among those young people who are in the labour force. In relation to the entire population (in this age group), the figure should therefore be approximately halved. Furthermore, a very high share of the unemployment is made up of full-time students (who are looking for work) – if we exclude this group, the figure would be about 15 percent of the labour force and about 7 percent of the age group. Information can be provided on this without having to change LFS. If we limit ourselves to the 15–19 age group (upper secondary school age), the statistics will be even more difficult to interpret since an even smaller percentage of the group are in the labour force.
It may be the case that comparisons of youth employment and unemployment require extra information in order to be interpreted correctly. It is easy to think that the unemployment rate is in relation to the entire age group, which is a misinterpretation. Comparisons over time (and possibly internationally) can also be affected by changed behaviour among young people and them having more technical opportunities to enrol as job-seekers at the employment agency – I do not have any quantitative data as a basis for this, however. It is also interesting to note that long-term unemployment in Sweden is relatively low in international comparisons and especially low among young people. An assessment of young people’s situation in the labour market must also take such information into account, not least from a social perspective. It is constantly stressed how heterogeneous the various groups on the labour market are even “internally”.
4.2.8 Groups with a weak attachment to the labour market6
The classic vision of employment policy is full employment. This affirms strong ambition but it is not always a clear goal – the concepts, as already stated, are not always simple to apply to the labour market. We can also discuss therefore how to reach new groups on the labour market – groups more weakly attached to the labour market and who are not always included in the statistical concept of “the labour force”.
5 See e.g. LFS quarterly report 2009, no 2, Welfare 2009, no 3 and The Labour Market 2009, no 5. 6 LFS quarterly tables "tables concerning the population not in work, 15-74 years, quarter", published for the first time during the fourth quarter of 2008, describe these groups

Labour Force Surveys Background Facts for Labour and Education Statistics 2011:1
26 Statistics Sweden
Based on “LFS concepts”, we can discuss three different groups of persons not at work:
• persons completely outside the labour force (but in the 15–74 age group)
• unemployed persons, who are outside the Employed persons group(but still in the labour force
• absentees outside the at-work group (but in the Employed persons group)
It is obviously the first group that we are mostly concerned with here. Some unemployed groups can also in practice be quite a long way from the labour market. The group we can distinguish here is particularly long-term unemployed persons and perhaps even some unemployed persons in higher age groups. The third group is probably less interesting but long-term absence from work can or might be a problem even here (and obviously from other points of view).
We are here interested in anyone with some, at least potential, attachment to the labour market, provided it is a tangible and measurable attachment, and in finding what obstacles there are for them to find a good job. The discussion can furthermore be said to apply to the age group examined by LFS: 15–74 age group (with slight emphasis on upper secondary school age) – “the entire working-age population”.
The objective in all three cases is a job for everyone (who wants to and can work, even if some haven’t actively sought it). The “work-first” principle applies.
The aim of this discussion on groups with a weak attachment to the labour market is to put strong emphasis on increasing the opportunities for those who traditionally are outside the labour force or long-term unemployed or long-term absent, but which might, eventually, be able to find work. There may be both economic and social incentives for this:
• to increase labour supply
• to get more people engaged into working life, into employment and into work
• and therefore more people earning money.
The focus will then primarily be on studying people outside the labour force (in relevant age groups). In the figure above (“the LFS tree”), we have included three groups: sick persons, pensioners and full-time students – the “potentially looking for a job” group is also outside the labour force. The number of people in education has been constantly (although not at the same rate) rising for a very long time. This concerns post-upper secondary students in particular ever since upper secondary school was extended to include almost all 16–19 year-olds. The rise after this extension refers especially to people in the 20–24 age group. The employment rate in these age groups has therefore fallen (employed persons/population) and is now down to approximately 35 percent. This cannot just be seen as a failure – rather more as a success for the education policy. Similarly, absence on holiday or parental leave is also outside the discussion. The initiative must therefore focus on other areas and groups.
The aims of increasing employment rate among pensioners, reducing the incapacity rate and reducing both short and long-term sickness absence

Background Facts for Labour and Education Statistics 2011:1 Labour Force Surveys
Statistics Sweden 27
and reducing the number of people on disability pension have been openly declared. This is a question of increasing the proportion of those belonging to the labour force in the (adult) population, increasing the share of employed persons in the labour force and increasing the proportion of those at work among employed persons.
There is also an “Others” group which LFS has not studied in any great detail. It is a question of different groups of a partially marginalised nature. Some information can be taken from the total population register statistics but more “LFS-type” information is also required. It is then necessary to increase the sample to provide reliable information on some smaller groups as well. It may also be a question of asking further questions to obtain new types of information.
An analysis of groups with a weak attachment to the labour market requires more in-depth use of LFS and its panels and improvement in the statistics: broader content, more reports on small groups (which demands a larger sample) and on the flows over time in the form of “flow statistics”. “The Government has also given Statistics Sweden resources to increase the sample in LFS by 24 000 individuals per quarter as from the second quarter of 2009. By increasing the sample, it will be possible to track how people change labour market status in much more detail than previously. From April 2010, LFS is based on the increased sample size which includes 29 500 individuals each month7
4.2.9 Conclusions on the LFS concepts and definitions
.
Problems
• The labour force status categories are designed to be applicable world-wide for international comparisons, but they might not be perfectly adapted to the national circumstances in each country.
• The labour force status categories are not internally homogeneous
• The core of many concepts is clear but it is often very difficult to make clear classifications of the boundaries between them.
• Simple information, based on a few head categories, is not enough
Thus it is necessary to have
• Detailed and relevant information about the labour market
• With possibilities to create alternative concepts and definitions (built on the data available from the Labour Force Survey).
Categories and definitions must
• Be based on a sound theoretical background
• Consequently follow international rules
The LFS is based on recognition of the existence of these problems and requirements.
7 The 2010 Spring Fiscal Bill, Government Bill 2009/10:100. Page 136
Labour Force Surveys Background Facts for Labour and Education Statistics 2011:1
28 Statistics Sweden
4.3 Flow statistics During the Keynesian era, labour research was very much focused on macro-economic research on supply and demand, and on business cycle variations. Keynes’ ideas still live on, but the focus has increasingly since the 1970s been on the behaviour of individuals on the labour market. Even in times of high labour demand, there is still significant unemployment. As a result, research focused more on labour supply than previously and employment policy was more about labour market policy focusing on improving how the labour market worked. The Rehn-Meidner Model is just such a development of Keynesian employment policy. This placed fresh demands on all labour statistics and a move towards flow statistics based on the LFS.
As early as the 1980s, LFS-group started looking at the possibility of supplementing LFS with flow statistics in a project on gross flows8. This was a project very much motivated by the wishes of labour market researchers and was presented to the EFA delegation, which supported the proposal. Development efforts continued during the 1990s, now with the cooperation of Ante Farm9. These efforts resulted in a draft tabulation plan, based on existing statistical compilations. There were also proposals for some new questions. After some minor revisions, such tables from LFS are now presented on a regular basis.10
The following forms of labour market status are included in the proposal:
• Employed persons (EP) broken down into Permanently employed (PE), Temporarily employed (TE) and Self-employed or family worker (SE)
• Unemployed persons (UP)
• Not in the labour force (NL)
Here, we can study different types of concept:
• flows: outflows and inflows
• remaining ratios: such as the chance of keeping a permanent job or the risk of staying in unemployment
• transfer percentages: such as the chance of getting a permanent job or the risk of becoming unemployed
We can also study these flows and ratios for different groups such as
• sex,
• age
• education
• Swedish/foreign-born
• region
8 The project was initiated by Karl-Erik Kristiansson. During the 1990s, Ante Farm, Jonny Zetterberg and Hassan Mirza participated in different ways later on in the project. 9 See Unemployment, new recruitments and vacancies in the flow statistics, Background facts - labour market and education statistics 1997, no 3. A later version is Flow statistics from LFS, Background facts - labour market and education statistics 2005, no 4. 10 Tables from LFS are available for 1997-2004 and with new EU-adapted statistics for the years after that starting with the flows between quarters 2 and 3, 2005.

Background Facts for Labour and Education Statistics 2011:1 Labour Force Surveys
Statistics Sweden 29
The main labour market categories are Employment, Unemployment and Not in the labour force. Employment has been divided into three parts: permanently employed, temporarily employed and self-employed or family workers. Many more categories can be distinguished but the size of samples in LFS provides certain limitations, especially if we want to present these groups broken down by sex, age and other variables. Conversely, the desire for more reporting puts greater demand on increased samples in LFS.
The flow tables presented here during the first period have been:
• The flows between different categories – numbers
• The flows between different categories – percentages
• Remaining ratios
• Risks of unemployment
• Chances of employment
The point of flow statistics based on LFS is, as can be seen, that we can report how individuals move between different (or remain in the same) labour market categories from one period to another. The flow statistics can show both the ways from different labour market categories and the ways to different categories and hence show both good and bad ways from and to different categories.
There are requests for more reporting. One proposal is to report recruitment distinguishing permanent and temporary jobs11. We can also see whether a temporary job leads primarily to unemployment or if it often leads on to more permanent employment12
This study of individuals’ behaviour is particularly relevant when analysing marginalised groups and groups with a weak attachment to the labour market. We can better explain these phenomena and we can better follow the ways between different status groups – e.g. the ways to permanent employment. We therefore divide people who are in work but absent the whole week into the following groups (according to the reason for absence): on sick leave, on parental leave, on holiday and other. It is interesting that the discussion on exclusion has led to greater interest being shown in the third main group: Not in the labour force. As a result, LFS reporting already divides the Not in the labour force group into four sub-groups: sick, pensioners, full-time students and other.
– a question that has often been the subject of much debate. Similarly and with relevant divisions, we could also study the effects of part-time work – whether it leads to unemployment or to full-time work, etc. We could also divide unemployment into two sub-categories used by LFS: short-term and long-term (more than 6 months) unemployment (or 12 months if you follow the EU).
We can also see how these flows and ratios change over time/the business cycle giving us a quick indication of how the labour market is changing.
11 A report by Ante Farm on Recruitment statistics in LFS is planned for publication in the Statistics Sweden series Background facts 2010. 12 The first time such statistics were used in official government reports was in the report Active labour market policy, SOU 1996:34, page 53 ff.
Labour Force Surveys Background Facts for Labour and Education Statistics 2011:1
30 Statistics Sweden
The task given to Statistics Sweden by the Government therefore consists of developing and regularly reporting flow statistics in LFS. The requirements are to report:
• How the working-age population is distributed between different labour market categories
• How long people are in a particular category
• The flows and remaining ratios between the various labour market categories
with separate reporting for sex, age, level of education, Swedish/foreign-born and region with, whenever possible, cross tabulations.
In addition, the Government proposes reporting:
• For the first two dimensions: more demographic and competence groups
• The flows between the labour market categories In work, Absent the whole week and Not in the labour force.
• New questions on how long people are employed, how many and how long people are on part-time sick leave and how many are on part-time disability pension
• Flows to and from Not in the labour force are divided according to main activity
• The flow statistics are broken down into further demographic and competence groups

Background Facts for Labour and Education Statistics 2011:1 Labour demand
Statistics Sweden 31
5 Labour demand
5.1 Labour demand – filled vacancies Labour demand can be said to be a ”derived demand” from the demand for goods and services in the business sector. Assessing labour demand trends on the labour market is therefore very much a question of assessing general economic trends – with a slight time delay in labour demand. This is true in times of both economic growth and recession. The latter has been particularly evident during the current economic crisis which, in Sweden, has not by any means had the same negative impact on the labour market as the crisis in 1991–94. A certain amount of “labour hoarding” may have had a contributory effect.
Employers' labour demand mainly concerns different working tasks to produce goods and services. These working tasks are amalgamated into jobs to correspond to the supply of labour input from individuals. 13
Labour demand can also be broken down by branches of industry. Branches of industry have a tendency to develop differently with different working tasks /jobs – for production on a constantly changing market. How the industrial branch develops therefore has an impact on the demand for professional knowledge. On the supply side, we have found a link between education and jobs. On the demand side, there is a similar link between branch of industry and jobs.
A job materialises in the “meeting” between the labour demand of businesses (looking for someone to do the work) and the labour supply of individuals. The phenomenon can also be described the other way round: that individuals demand working tasks (for payment) while businesses offer such tasks (with payment). This match becomes gainful employment, i.e. a job. For self-employed persons, it is a question of working directly with a market for goods and services.
There is no special measurement of the business sector’s total labour demand. Realised employment – or filled vacancies – can however be said to reflect part of labour demand.
5.2 Labour demand – vacancies14
It is clear from the theoretical picture given above that we also need data on unmet demand, i.e. the occurrence of job vacancies. These data are used to assess labour market trends and are probably just as important as unemployment data. The statistics have been falling short in this respect for a long time. Some data have been obtained from the employment agencies who report the number of vacancies enrolled to them, but nowadays we also have a measure of vacancies in the business statistics.
13 ILO defines a job as "a set of tasks and duties executed, or meant to be executed, by one person", Please see previously mentioned ILO publication on ISCO 88, page 2. 14 See Background facts - Education and labour statistics 2:2."

Labour demand Background Facts for Labour and Education Statistics 2011:1
32 Statistics Sweden
The picture described above was one of the sources of inspiration for the proposal for such statistics.
The more “administrative” concept of vacancies – in the meaning of advertised jobs – may seem to be clear but does not always tally with the economic concept of vacancies as an unmet demand. Businesses can advertise jobs “in advance” and the formal decision to fill a post may be taken a long time before the person actually assumes his/her duties. Businesses may also decide not to advertise if they don’t feel it is worth it – comparable to latent unemployment.
There is no European legislation and definition on job vacancy statistics. In Swedish business statistics, a job vacancy is defined as “an employer having begun the external recruitment of a co-worker but has yet to employ anyone (as yet unfilled vacancy)”. The idea is to measure “jobs without jobholder” just as we measure “people without jobs”. But jobs are not as clearly defined as people. It is difficult to define more precisely when a shortage of labour takes on the form of jobs that have yet to be filled. We should remember, however, that even if people are “clearly definable”, they are not always, as we have stressed already, “clearly” unemployed. The boundaries are difficult to define and this is also true of the concepts of both vacancies and unemployment.
These statistics also include data on job departures (people who have left their jobs) and recruitments, which in different ways provide an indication of the trend in labour demand.
5.3 Working conditions Working conditions refer both to remuneration (salary, etc.) and work environment. The former is dealt with in wage statistics and is not addressed further here. The latter can be studied within the LFS framework and is also an element of Eurostat’s EU LFS. A special supplement of work environment questions has been part of the Swedish LFS since 1989. This is ultimately a question of the total employment conditions (for an employee) and the total working conditions for a self-employed person.
5.4 Business cycle and structure In the labour market there is a supply of labour (individuals, with different capacities) and a demand for (performed) labour. Labour supply must be focused on performing different types of working tasks and the demand from enterprises must in some way or other be transformed into a demand for individuals (performing working tasks). It will then be a “meeting” or match between individuals (performers of jobs) and enterprises (wanting to have jobs performed). This match will take the form of job creation and that is the key point in the labour market. There are (at least) two problems to achieve perfect balance:
• Supply and demand (with given working conditions) are not always of equal size
This is a question both of total labour supply measured in terms of human resources and working hours and of macroeconomic trends and the economic cycle and what specific impact they have on the demand for

Background Facts for Labour and Education Statistics 2011:1 Labour demand
Statistics Sweden 33
labour on the labour market. The basic problem is: is the effective labour demand sufficient to satisfy all the supply? Previously, high unemployment was seen as an expression for “permanent mass unemployment” but now we refer high unemployment primarily to (top periods in) cyclical short term fluctuations in unemployment (in Keynesian terms).
• Supply and demand in different areas (even if they are approximately the same size) do not always meet effectively in the form of filled vacancies and employed persons.
It is a question of how the labour market works. Here, we can talk about functional or frictional unemployment. This varies over time and depends on how well the labour market works. But the labour market never works perfectly. In this sense, this type of unemployment is a permanent unemployment – though for private individuals only lasting a short time if the labour market works well.
It is not obvious from the statistics to which of these types of problems (insufficient demand or mismatch in the labour market) current unemployment refers. Cyclical fluctuations in unemployment can obviously vary considerably, from (theoretically) zero and with a clear overall shortage of labour – that can be measured in vacancies – to widespread general unemployment similar to what happened in the 1930s, the early 1990s and during the current crisis although to a less extent.
Even in healthy economic conditions, there will be a certain level of unemployment – what economists normally call NAIRU (Non-Accelerating Inflation-Rate Unemployment). This is an unemployment in a well-balanced economy and thus corresponds to frictional unemployment. It has no uniform value. The functionality of the labour market and hence frictional unemployment can vary over time and space.
Even in times of recession there can be a shortage of labour in the form of vacancies in some areas and even in good times there may be substantial unemployment in some areas. Such unemployment is normally referred to as structural unemployment. It differs from general cyclical unemployment precisely because it is not general. It differs from frictional unemployment in that it reflects a lack of labour demand in one particular area.
The simultaneous occurrence of both unemployment and vacancies indicates (the shortcomings in) how the labour market works – its (in)capacity to enable the supply and demand for labour to meet. In the description of the heterogeneous labour supply and the similarly heterogeneous labour demand, we find some of the explanation for the difficulties involved in matching these components on the labour market.
Both of the following can therefore occur: – continual imbalances between the quantitative size of supply and
demand (surplus or shortage of labour), which we interpret as a cyclical trend
– and continual imbalances between the qualitative requirements for supply and demand, which we interpret as them quite simply being partly incompatible. We also have a constant deficit of information (from employers and employees alike) that hampers and delays possible meetings in the form of filled vacancies.
Labour demand Background Facts for Labour and Education Statistics 2011:1
34 Statistics Sweden
The difficulties of differentiating between frictional, structural and cyclical unemployment are associated with the difficulties involved in reporting unemployment and vacancies in an unambiguous way. The measurement problems are associated with the heterogeneous characteristics of these variables. This means in turn that the labour market consists of a host of different, more or less coherent, sub-markets: for different geographical regions, different educational backgrounds/occupations, branches of industry, etc.
The structural and cyclical components can also vary for each separate sub-market. This means it is very difficult to describe the labour market situation for the “whole” labour market in simple terms. What is it? A limited location, a region, a country or the EU or the global labour market? One way of describing this is to use the expression “the business cycle is always split”. The business conditions are different in different areas. It is therefore difficult to state what applies for larger areas (that include many sub-markets). It is difficult to claim that we don’t have any cyclical unemployment in large areas – cyclical unemployment may exist on a particular sub-market despite a generally healthy economic climate, unless we wish to describe all these problems – except perhaps a general imbalance between total supply and demand in the economy – as a lack of functionality on the labour market (where everything would be frictional unemployment),
It is, however, reasonable to both make macroeconomic assessments of a general cyclical situation and study the occurrence of sub-markets and hence to analyse all these types of unemployment. There is both a general economic component and a component that relates to the functionality of the labour market.
Statistics alone do not provide the answer to such questions. This requires analysis of both the labour market and the statistics and hence also places demands on the statistics. One such demand is that the statistics provide an insight into how the labour market works. One way is to focus on the behaviour of individuals on the labour market based on hypotheses generated by labour research.15 There has long been a general requirement from research for more individual-based data in the form of flow statistics.16
Total population registers can for obvious reasons easily meet such requirements. As a result of the comprehensive information it has on each individual, LFS is a very interesting option and because of its (comparatively large) sample size it can also produce such statistics.
15 See e.g. Flow statistics in labour research, Background facts - labour and education statistics 1997, no 2. 16 See e.g. Conference on labour statistics, 18 March 1999. Background facts 1999:3.

Background Facts for Labour and Education Statistics 2011:1 Appendix
Statistics Sweden 35
APPENDIX Basic definitions in LFS
Labour status Figure 1 shows different labour force status categories that are defined in more detail below.
Figure 1. Basic classification of labour force status. The labour force
The labour force consists of people who are either employed or unemployed in accordance with the definitions below. Others are classified as either not in the labour force or outside the labour force. They are also called economically inactive population.
Activity rate: Percentage of 15–74 year-olds in the labour force.
Employed persons include the following groups: – persons who during a specified week (the reference week) performed
some work (at least one hour) either as a gainful employee, a self-employed person (including independent professional operators) or unpaid assistants in businesses owned by their spouse or other member of the same household (=employed, in work).
– persons who did not perform any work as above, but who had employment, work as an assisting household member or self-employed person (including independent business operators) and were temporarily absent during the entire reference week. Absence is counted regardless of whether it was paid or not (=employed, absent from work). The reason for absence can be illness, holiday, leave of absence (e.g. in order to care for children or to study), national service, labour dispute or leave for some other reason.
The population
In the labour force Not in the labour force
Employed Unemployed
At work Absent the entire week
Appendix Background Facts for Labour and Education Statistics 2011:1
36 Statistics Sweden
People participating in employment measures are classified as employed persons. This might be officially protected work, working at Samhall17
Employed persons therefore consist of employees, permanently and temporarily employed, as well as self-employed persons and assisting household members.
, starting a company or employment financed by income or employee support.
Permanently employed persons cover those who have an open-ended employment contract.
Temporarily employed persons cover people deputising for someone else, those employed using employee support, seasonal workers, trial employment or project employment as well as other forms of temporary employment.
Underemployed persons cover people who are employed but who work less than they would like to and are available to work additional hours during the reference week or within a fortnight of the end of the reference week.
Unemployed persons cover the following groups: – persons who were without work during the reference week but who
had looked for work at some point over the last four weeks (the reference week and the three previous weeks) and are available to start work in the reference week or start within a fortnight of it ending. Unemployed persons also cover people who have obtained a job that starts within three months, provided that they would have been able to work during the reference week or start within a fortnight of it ending.
Relative unemployment rate: Percentage of unemployed persons out of the total number of people in the labour force.
Measure of unemployment Up to and including LFS September 2007, full-time students in Sweden without work during the reference week were not classified as unemployed, even if they fulfilled all the criteria for being counted as such. In LFS, full-time students are people who attend regular educational programmes in compulsory school, upper secondary school and higher education, as well as certain employment measures that are considered as education. They have instead been assigned to the “Not in the labour force” group. This deviates from ILO recommendations and EU guidelines. As from LFS October 2007, this was changed in line with accepted international standards18
17 Samhall is a state-owned Swedish company assigned to provide meaningful work that furthers the personal development of people with disabilities
so that full-time students who are actively seeking work and are prepared to take a job were henceforward classified as unemployed persons.
18 For these standards, the fact of being a full-time student has no direct implication in fixing the labour force status.

Background Facts for Labour and Education Statistics 2011:1 Appendix
Statistics Sweden 37
“Not in the labour force” covers: – people who are neither employed nor unemployed. This group includes
students (who are neither employed nor unemployed), pensioners, conscripts or those on long-term sick leave.
Persons potentially looking for a job A sub-group of “Not in the labour force” consists of latent job-seekers. These are people who would have wanted to and could have taken work during the reference week but who have not looked for work. Up until LFS September 2007, full-time students looking for work were also assigned to this group, see above.
Level of connection to the labour market Classifies the population into the following categories:
Permanent connection; people with permanent employment, self-employed persons and their assisting family members.
Loose connection; people with temporary employment and non-employed persons who have worked at some time during the last 12 months.
No connection; non-employed persons who have not worked during the last 12 months. This group includes persons unfit for work and persons working/domiciled abroad.
Education Questions are asked whether the person has studied during the reference week and if so whether this was full- or part-time study. They are also asked how many hours they have studied during the reference week.
The European requirements for LFS were extended for 2007. As from January 2007, a question was also asked about studies at any time during the reference week or the three weeks immediately preceding it and a question about whether the studies were full- or part-time.
Up until December 2006, LFS only asked about the conditions for a certain given week, the “reference” week.


2007:1 Några väsentliga sysselsättningsbegrepp i den officiella statistiken
2007:2 Registerbaserad aktivitetsstatistik
2008:1 Ungdomar utan fullföljd gymnasieutbildning – en undersökning med många utmaningar
2009:1 Longitudinell Integrationsdatabas för Sjukförsäkrings- och Arbetsmarknads- studier (LISA) 1990–2007
2010:1 Principiella grunder för Arbetskraftsundersökningarna (AKU) och arbets- marknadsstatistiken
2010:2 Rekryteringsstatistik från AKU

www.scb.se Arbetsmarknads- och utbildningsstatistik
Bakgrundsfakta
2005:2
Svenska hälsoräkenskaper+ enrad
+ännu en radoch den 4:e
All official statistics can be found at: www.scb.seCustomer service, phone +46 8 506 948 01
ISSN 1654-465X (online)


![Surveys [modo de compatibilidade]](https://static.fdocument.pub/doc/165x107/55ac9f141a28abeb448b4667/surveys-modo-de-compatibilidade.jpg)