Rv 1000s VERSION FRANÇAISE - REDUISEZ VOS PRIMES D'ASSURANCE

APPENDIX I APPENDIX I
NAME NOTES
(1) (2) (3) (4) (5) (6) (7) (8) (9)
CAT. CTRL
AVG. SALARY ($1000s) AVG. COMPENSATION ($1000s) BEN. as %
of SAL.
PCT. TENURED PCT. INCR. (CONT. FAC.) F-T FAC. MEN F-T FAC. WOMEN AVG. SAL. MEN AVG. SAL. WOMEN
PR AO AI IN LE NR AR PR AO AI IN LE NR AR PR AO AI IN PR AO AI IN PR AO AI IN PR AO AI IN PR AO AI IN PR AO AI IN
AlabamaAuburn U 8 I PU 132.6 95.3 81.7 44.6 58.1 95.8 170.3 122.0 105.4 57.1 75.5 123.2 28.5 97.3 83.4 0.3 0.0 4.4 4.7 4.7 5.1 306 222 189 43 101 163 169 46 135.9 98.9 85.7 44.1 122.5 90.3 77.3 45.0
Auburn U Montgomery IIA PU 99.9 74.5 64.8 48.0 73.6 123.7 93.4 81.9 61.5 92.3 25.5 98.0 85.7 36.5 10.7 13.5 6.7 37 39 25 0 14 24 38 0 102.7 74.7 71.9 92.5 74.0 60.1
Birmingham Southern Coll IIB PR 81.0 74.7 61.1 45.1 — 69.8 100.0 90.1 75.1 55.4 — 85.6 22.7 100.0 95.2 0.0 0.0 0.0 0.8 1.0 17.8 27 13 8 4 12 8 16 8 82.8 71.2 59.1 42.8 76.9 80.4 62.1 46.3
Samford U 7 IIA PR 105.2 76.2 70.6 50.9 82.9 133.3 99.4 92.3 67.8 106.9 28.9 87.7 72.3 1.6 0.0 3.2 3.1 2.8 4.7 79 44 47 5 51 39 75 21 111.0 74.1 71.5 49.4 96.3 78.5 70.0 51.2
U Alabama 7 I PU 151.6 99.0 81.1 55.6 95.6 205.1 139.0 112.4 77.3 131.9 37.9 92.0 91.0 0.7 0.0 2.0 2.8 3.4 2.9 220 182 237 112 80 139 204 173 157.6 104.3 86.1 56.7 135.0 92.0 75.2 54.8
U Alabama Birmingham 7 I PU 139.1 96.9 81.9 67.7 98.0 164.8 116.4 98.8 81.0 117.2 19.6 94.2 72.6 0.4 0.0 2.8 2.5 2.0 1.2 116 115 106 45 75 82 138 78 145.8 97.4 85.9 67.9 128.9 96.2 78.8 67.5
U Alabama Huntsville 1 I PU 126.4 92.5 76.2 65.6 52.4 85.1 169.2 124.5 103.1 88.3 72.7 114.9 35.1 100.0 86.9 2.3 0.0 2.0 2.2 2.9 3.4 53 72 38 1 11 35 51 13 127.3 97.1 78.9 — 121.7 83.1 74.3 65.3
U Montevallo IIA PU 80.7 68.1 61.0 59.3 69.4 106.1 90.8 81.7 81.1 92.3 33.0 100.0 95.6 8.7 0.0 2.1 3.1 3.4 10.0 27 26 19 2 20 19 27 7 82.7 72.4 65.1 — 78.1 62.3 58.1 61.4
U North Alabama 7 IIA PU 88.7 76.6 63.9 52.3 71.4 113.7 96.2 73.8 64.6 87.9 23.2 98.5 78.5 18.8 0.0 8.9 7.7 3.3 0.9 44 37 39 15 23 28 46 31 91.1 80.0 64.6 52.4 84.3 72.2 63.3 52.2
U South Alabama 6 I PU 89.5 70.5 66.4 50.5 67.7 115.6 91.8 85.3 66.2 87.6 29.5 92.0 79.8 3.0 0.0 0.7 0.4 1.2 0.5 71 64 111 39 29 60 126 90 91.4 72.6 67.9 49.0 84.8 68.2 65.0 51.1
U West Alabama 1 IIA PU 75.1 65.4 51.8 43.1 33.3 57.8 98.5 85.6 72.2 55.0 43.3 77.0 33.2 85.7 68.8 43.6 0.0 2.0 1.9 1.2 5.2 12 15 12 9 9 17 27 11 75.6 69.2 53.6 43.1 74.4 62.0 51.0 43.2
AlaskaU Alaska Anchorage 33 IIA PU 105.6 87.5 70.9 53.8 82.0 137.2 119.0 102.4 85.3 113.5 38.5 97.6 96.6 54.2 0.0 0.1 0.6 1.6 3.5 70 76 88 21 56 72 128 28 111.1 88.8 73.3 53.1 98.8 86.0 69.1 54.3
U Alaska Fairbanks I PU 106.5 86.6 74.0 62.0 85.7 138.1 118.2 105.6 93.5 117.3 36.8 91.6 81.7 50.7 2.2 0.4 0.9 2.7 1.1 89 85 79 24 42 68 75 21 110.6 88.8 75.5 62.9 97.8 83.9 72.5 61.0
U Alaska Southeast IIA PU 92.3 77.7 67.5 — 75.1 123.8 109.2 99.0 — 106.6 42.0 94.7 96.9 36.0 0.0 1.4 5.2 1.9 14 16 24 0 5 16 26 1 92.5 76.4 65.0 91.9 78.9 69.7 —
ArizonaArizona St U-Downtown Phoenix 7 I PU 131.1 92.2 72.6 47.4 57.3 — 83.6 163.6 120.1 98.2 68.9 79.0 — 109.9 31.5 61.6 65.2 0.0 0.0 2.3 2.7 3.5 2.5 66 37 33 29 59 78 77 55 144.6 101.3 76.7 46.4 116.0 87.9 70.8 47.9
Arizona St U-Polytechnic 7 IIA PU 134.6 94.2 81.8 46.0 63.4 — 78.5 171.0 123.7 107.5 67.1 86.0 — 104.6 33.2 81.8 83.7 0.0 0.0 3.8 2.2 3.6 2.8 21 28 24 11 1 21 14 24 135.3 96.3 86.1 46.0 — 91.3 74.4 46.1
Arizona St U-Tempe 7 I PU 149.1 106.4 89.0 47.4 66.3 84.2 103.9 184.6 136.3 115.7 68.1 90.1 107.7 133.0 28.0 90.7 85.3 0.0 0.0 2.9 3.5 4.3 2.1 456 312 263 81 176 190 216 115 153.2 110.1 93.8 47.7 138.6 100.3 83.1 47.3
Arizona St U-West 7 IIA PU 159.9 100.0 74.9 46.8 57.2 91.3 196.5 128.1 100.1 67.6 81.1 118.7 30.0 98.2 85.5 0.0 0.0 1.3 2.6 3.3 1.9 37 42 21 10 19 41 51 30 169.7 102.4 88.9 45.9 140.7 97.5 69.2 47.1
Embry-Riddle Aeronautical U-Prescott 1 IIB PI 112.2 90.7 74.8 57.9 85.0 85.0 145.9 117.8 97.2 75.3 97.7 15.0 95.2 61.1 4.8 0.0 2.1 2.5 3.6 2.7 17 30 45 4 4 6 18 1 113.9 89.0 77.2 55.6 105.3 98.8 68.9 —
Northern Arizona U I PU 107.1 77.0 65.2 48.7 74.1 136.9 102.9 86.7 65.0 97.3 31.3 94.2 69.6 0.0 0.0 0.7 1.6 1.3 3.2 182 101 162 118 110 113 224 151 111.1 79.8 68.0 50.1 100.5 74.6 63.1 47.7
U Arizona 41 I PU 141.0 98.0 84.3 43.0 64.2 114.2 103.6 172.1 124.8 107.8 58.7 85.6 143.2 130.0 25.5 95.2 84.3 0.0 0.0 4.1 3.7 3.4 4.3 452 238 253 38 188 170 251 43 144.7 99.8 88.6 43.9 132.0 95.3 79.9 42.2
ArkansasHarding U 7 IIA PR 81.2 70.7 63.2 52.3 35.1 68.1 103.0 93.6 82.0 63.8 48.3 88.1 29.5 0.0 0.0 0.0 0.0 0.0 0.4 0.7 0.6 61 57 65 6 8 33 62 13 81.8 70.5 65.0 59.3 76.2 71.2 61.4 49.1
Henderson St U 7 IIA PU 70.6 65.8 56.1 49.9 61.3 88.4 83.6 71.4 64.6 77.8 26.8 96.0 51.4 7.6 0.0 1.5 4.0 4.1 5.1 38 17 26 9 12 18 40 15 70.8 70.8 56.4 49.1 69.8 61.0 56.0 50.5
Hendrix Coll IIB PR 84.1 67.9 62.5 47.8 71.8 107.4 92.3 77.7 59.7 92.7 29.2 100.0 96.8 0.0 0.0 3.1 3.0 3.1 2.3 24 19 11 3 17 12 15 3 84.5 67.5 61.8 47.9 83.5 68.6 63.0 47.7
John Brown U 7 IIA PI 70.4 64.0 57.0 — 63.0 102.4 84.9 75.5 — 85.7 36.1 0.0 0.0 0.0 0.0 3.4 4.8 5.1 23 27 10 2 0 8 20 0 70.4 64.3 57.6 — 63.1 56.7
Lyon Coll IIB PR 75.6 61.9 53.4 59.8 92.3 76.7 66.6 74.1 24.0 100.0 78.6 11.1 2.0 2.0 2.2 8 10 14 0 1 4 13 0 76.8 62.1 53.7 — 61.4 53.0
Ouachita Baptist U IIB PR 64.9 58.4 49.7 41.5 40.2 57.3 85.2 80.0 65.6 64.0 51.9 76.6 33.8 100.0 84.6 18.2 0.0 2.0 2.1 2.5 7.9 30 14 7 3 7 12 15 2 65.8 62.0 49.8 41.7 61.0 54.4 49.6 —
Southern Arkansas U Main Campus 1 IIA PU 81.1 69.1 59.7 46.3 61.2 109.3 78.5 80.6 65.9 79.6 30.0 100.0 88.6 5.3 0.0 3.0 3.4 2.2 1.2 13 26 26 21 7 18 31 23 83.6 72.1 61.4 47.7 76.4 64.8 58.4 45.0
U Arkansas 7 I PU 132.3 96.2 84.3 56.6 53.7 91.2 162.5 121.2 106.6 73.7 67.2 114.4 25.5 98.2 95.8 0.0 0.0 2.9 3.8 3.7 3.3 259 151 154 126 69 89 98 196 135.4 97.7 89.6 55.3 120.6 93.7 76.0 57.5
U Central Arkansas 6 IIA PU 82.8 69.1 64.5 53.1 50.2 44.2 64.0 104.4 88.8 83.5 69.0 65.4 56.6 82.3 28.6 99.0 98.6 9.8 0.0 1.7 2.1 2.1 2.4 62 85 62 11 35 56 71 56 86.0 69.1 68.3 53.9 77.1 69.0 61.2 52.9
CaliforniaAzusa Pacific U 7 I PR 102.8 88.6 83.0 80.3 — 81.4 89.8 111.2 95.9 89.7 86.7 — 88.0 97.1 8.1 0.0 0.0 0.0 0.0 0.3 0.9 1.1 0.9 86 59 68 4 54 59 134 20 102.9 85.0 81.5 87.2 102.8 92.2 83.8 78.9
Biola U I PR 107.7 87.3 73.2 60.6 88.7 125.9 101.4 85.4 65.1 103.0 16.1 88.2 38.4 0.0 0.0 2.0 2.0 2.0 2.0 61 81 21 7 7 65 24 7 108.0 87.9 73.8 60.6 105.9 86.5 72.8 60.6
Cal St Polytechnic U-Pomona 7 IIA PU 113.9 97.1 86.1 66.1 95.4 150.3 132.6 117.1 92.1 128.3 34.5 100.0 98.7 1.7 3.8 7.1 4.9 158 43 96 0 100 33 77 0 115.1 97.4 86.6 112.1 96.8 85.4
Cal St U Maritime Academy 7 IIB PU 111.9 95.9 82.4 66.0 88.6 150.3 131.1 112.5 93.1 121.2 36.7 100.0 93.3 0.0 1.4 5.7 4.7 12 13 12 0 5 2 7 0 112.2 96.4 85.9 111.3 — 76.2
Cal St U-Bakersfield 7 IIA PU 110.9 97.0 81.5 64.2 86.3 146.1 131.6 110.2 89.7 116.5 35.0 100.0 92.3 0.0 4.1 6.0 4.2 49 26 56 0 34 13 42 0 112.7 96.7 82.2 108.3 97.8 80.6
Cal St U-Channel Islands 7 IIA PU 117.7 99.8 86.8 68.2 87.4 154.1 136.3 118.4 91.0 117.0 33.8 100.0 57.9 0.0 3.4 5.6 4.3 28 8 25 0 24 11 47 0 118.5 101.8 89.5 116.8 98.3 85.3
Cal St U-Chico 7 IIA PU 106.3 89.7 79.1 63.9 88.1 141.2 122.1 108.3 89.6 119.3 35.4 100.0 90.2 0.6 4.6 5.2 4.5 126 46 68 0 76 46 89 0 109.2 91.0 81.0 101.4 88.4 77.7
Cal St U-Dominguez Hills 7 IIA PU 113.0 102.3 83.6 64.9 88.7 149.2 136.7 113.4 88.2 118.9 34.1 96.3 85.2 0.0 3.7 6.5 5.2 61 21 35 0 46 33 59 0 115.6 105.7 85.4 109.6 100.2 82.5
Cal St U-East Bay 7 IIA PU 109.9 97.1 82.2 64.0 92.2 146.4 131.3 111.1 87.9 124.0 34.6 98.4 91.8 1.6 3.6 5.1 4.8 67 36 62 0 58 37 64 0 111.5 98.9 84.3 108.2 95.2 80.2
Cal St U-Fresno 7 IIA PU 107.7 90.6 79.4 62.4 127.7 84.9 142.0 124.0 108.7 87.4 168.6 115.2 35.7 99.6 94.1 0.8 3.7 6.0 4.5 151 58 121 0 77 60 127 0 108.1 90.3 80.7 106.9 90.9 78.2
Cal St U-Fullerton 7 IIA PU 108.7 97.0 89.9 66.1 92.4 144.4 131.5 120.8 92.1 124.6 34.8 100.0 90.7 0.0 3.6 5.3 4.7 194 112 102 0 143 103 117 0 110.2 98.1 93.9 106.8 95.8 86.5
Cal St U-Long Beach 7 IIA PU 109.8 96.4 86.1 69.6 — 92.2 144.6 129.8 115.9 95.0 — 123.3 33.7 97.7 94.3 0.9 3.8 5.6 4.8 220 81 101 0 167 94 134 0 110.9 96.6 87.3 108.3 96.3 85.2
Cal St U-Los Angeles 7 IIA PU 109.5 94.5 87.1 59.6 88.8 143.2 128.0 117.5 80.8 118.2 33.2 99.3 96.0 0.0 3.6 6.3 3.9 151 33 71 0 119 41 97 0 111.1 96.1 86.4 107.5 93.1 87.6
Cal St U-Monterey Bay 7 IIA PU 108.9 94.2 84.1 58.5 86.0 145.7 126.2 113.5 80.8 116.0 35.0 100.0 84.9 0.0 3.3 4.8 4.2 32 16 28 0 29 17 39 0 109.6 98.6 85.4 108.0 90.1 83.1
Cal St U-Northridge 7 IIA PU 105.7 90.9 83.1 64.5 136.0 91.5 139.4 123.6 113.0 89.4 177.0 122.9 34.2 99.5 92.1 0.5 3.6 5.0 5.2 209 81 97 0 180 96 113 0 106.6 93.7 83.6 104.7 88.6 82.7
Cal St U-Sacramento 7 IIA PU 103.0 91.2 79.1 64.5 126.4 88.7 137.4 123.6 108.1 89.8 168.1 119.9 35.2 98.5 97.9 0.9 4.5 5.5 4.5 189 50 107 0 145 47 128 0 104.1 94.0 80.9 101.7 88.1 77.6
Cal St U-San Bernardino 7 IIA PU 108.8 89.3 78.4 61.5 88.6 144.8 121.9 108.0 84.4 119.7 35.2 97.9 85.3 2.6 3.5 6.3 4.9 117 29 58 0 77 32 59 0 111.3 88.3 79.2 104.9 90.2 77.6
Cal St U-San Marcos 7 IIA PU 111.7 94.6 85.1 63.6 141.6 88.5 146.5 127.3 115.0 88.7 187.3 119.1 34.5 100.0 96.5 1.1 3.5 4.4 4.6 49 47 41 0 56 38 49 0 114.0 98.3 86.1 109.7 90.0 84.2
Cal St U-Stanislaus 7 IIA PU 104.4 91.9 79.2 58.6 85.7 140.4 124.7 108.5 82.2 116.6 36.2 100.0 93.3 0.0 3.5 6.3 4.5 76 24 43 0 53 21 44 0 104.4 92.0 80.7 104.4 91.7 77.7
California Institute Technology 7 I PI 209.8 159.1 132.5 53.3 94.3 62.5 183.0 262.1 214.0 168.3 65.6 119.0 75.3 229.1 25.2 100.0 0.0 0.0 0.0 3.5 10.4 7.3 2.9 202 3 34 11 48 1 13 5 212.1 165.5 134.5 54.7 200.2 — 127.4 50.2
© 2019 American Association of University Professors
APPENDIX I APPENDIX I
NAME NOTES
(1) (2) (3) (4) (5) (6) (7) (8) (9)
CAT. CTRL
AVG. SALARY ($1000s) AVG. COMPENSATION ($1000s) BEN. as %
of SAL.
PCT. TENURED PCT. INCR. (CONT. FAC.) F-T FAC. MEN F-T FAC. WOMEN AVG. SAL. MEN AVG. SAL. WOMEN
PR AO AI IN LE NR AR PR AO AI IN LE NR AR PR AO AI IN PR AO AI IN PR AO AI IN PR AO AI IN PR AO AI IN PR AO AI IN
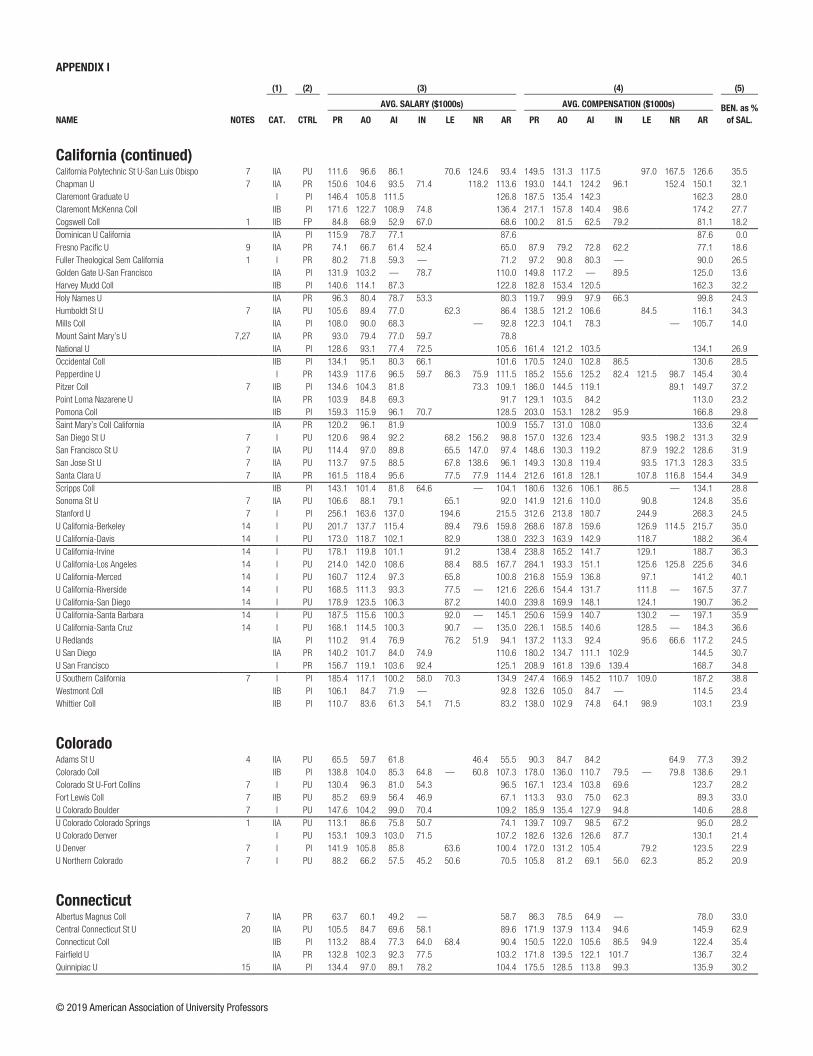
California (continued)California Polytechnic St U-San Luis Obispo 7 IIA PU 111.6 96.6 86.1 70.6 124.6 93.4 149.5 131.3 117.5 97.0 167.5 126.6 35.5 98.7 84.1 0.0 4.2 5.9 5.4 225 95 107 0 92 50 99 0 113.1 98.4 89.1 107.8 93.4 82.9
Chapman U 7 IIA PR 150.6 104.6 93.5 71.4 118.2 113.6 193.0 144.1 124.2 96.1 152.4 150.1 32.1 84.6 73.9 0.0 0.0 1.7 2.7 3.1 3.2 112 83 85 15 50 59 93 13 160.8 110.3 93.3 72.5 127.8 96.5 93.7 70.3
Claremont Graduate U I PI 146.4 105.8 111.5 126.8 187.5 135.4 142.3 162.3 28.0 84.1 80.0 0.0 0.4 3.0 4.1 30 12 9 0 14 18 6 0 150.8 110.6 108.8 137.0 102.6 115.5
Claremont McKenna Coll IIB PI 171.6 122.7 108.9 74.8 136.4 217.1 157.8 140.4 98.6 174.2 27.7 100.0 95.7 0.0 0.0 4.5 5.7 5.5 46 30 13 8 21 17 9 10 173.8 128.5 116.7 80.5 166.9 112.5 97.6 70.2
Cogswell Coll 1 IIB FP 84.8 68.9 52.9 67.0 68.6 100.2 81.5 62.5 79.2 81.1 18.2 0.0 0.0 0.0 0.0 0.0 0.0 0.0 0.0 2 3 4 3 2 5 0 0 — 75.0 52.9 67.0 — 65.3
Dominican U California IIA PI 115.9 78.7 77.1 87.6 87.6 0.0 100.0 94.1 9.8 11.4 5.7 4.8 12 7 28 0 16 10 33 0 113.6 85.2 79.5 117.7 74.2 75.0
Fresno Pacific U 9 IIA PR 74.1 66.7 61.4 52.4 65.0 87.9 79.2 72.8 62.2 77.1 18.6 88.2 85.4 2.4 0.0 0.7 2.1 2.0 1.0 13 27 12 2 4 14 30 4 75.1 67.0 59.5 — 70.8 66.1 62.2 51.0
Fuller Theological Sem California 1 I PR 80.2 71.8 59.3 — 71.2 97.2 90.8 80.3 — 90.0 26.5 96.3 57.1 4.8 0.0 22 19 12 0 5 9 9 1 81.4 67.6 57.5 75.3 80.7 61.6 —
Golden Gate U-San Francisco IIA PI 131.9 103.2 — 78.7 110.0 149.8 117.2 — 89.5 125.0 13.6 80.8 39.1 0.0 0.0 6.0 6.7 7.0 15 10 0 6 11 13 1 6 129.6 90.5 85.2 135.0 112.9 — 72.3
Harvey Mudd Coll IIB PI 140.6 114.1 87.3 122.8 182.8 153.4 120.5 162.3 32.2 98.2 66.7 0.0 40 8 15 0 16 13 8 0 150.7 115.7 90.0 115.2 113.1 82.1
Holy Names U IIA PR 96.3 80.4 78.7 53.3 80.3 119.7 99.9 97.9 66.3 99.8 24.3 85.7 73.3 0.0 33.3 2.0 2.0 2.0 2.0 4 6 5 1 3 9 16 2 98.3 76.2 66.6 — 93.6 83.1 82.5 —
Humboldt St U 7 IIA PU 105.6 89.4 77.0 62.3 86.4 138.5 121.2 106.6 84.5 116.1 34.3 100.0 89.1 1.4 3.5 5.2 4.6 64 26 29 0 39 29 43 0 106.1 90.0 80.1 104.6 88.8 75.0
Mills Coll IIA PI 108.0 90.0 68.3 — 92.8 122.3 104.1 78.3 — 105.7 14.0 72.5 85.7 0.0 0.4 3.1 2.6 10 3 6 0 30 11 16 0 105.7 94.0 81.4 108.8 88.9 63.4
Mount Saint Mary’s U 7,27 IIA PR 93.0 79.4 77.0 59.7 78.8 93.1 58.6 17.9 0.0 2.0 0.9 2.8 3.7 10 7 16 6 19 22 40 11 95.3 76.6 75.4 59.8 91.9 80.3 77.7 59.6
National U IIA PI 128.6 93.1 77.4 72.5 105.6 161.4 121.2 103.5 134.1 26.9 0.0 0.0 0.0 0.0 0.4 0.6 0.0 8.2 65 27 19 6 45 42 26 6 130.2 92.8 77.1 72.2 126.4 93.3 77.6 72.8
Occidental Coll IIB PI 134.1 95.1 80.3 66.1 101.6 170.5 124.0 102.8 86.5 130.6 28.5 100.0 93.8 0.0 0.0 2.2 4.3 4.1 3.9 37 23 13 22 37 25 15 20 137.6 96.8 80.9 68.6 130.7 93.5 79.8 63.3
Pepperdine U I PR 143.9 117.6 96.5 59.7 86.3 75.9 111.5 185.2 155.6 125.2 82.4 121.5 98.7 145.4 30.4 94.7 79.8 2.4 0.0 0.8 4.2 4.8 4.0 92 42 45 10 41 42 37 13 147.6 129.8 101.1 57.3 135.5 105.3 91.0 61.6
Pitzer Coll 7 IIB PI 134.6 104.3 81.8 73.3 109.1 186.0 144.5 119.1 89.1 149.7 37.2 100.0 100.0 0.0 4.2 7.1 6.3 18 9 1 0 18 9 11 0 137.1 105.4 — 132.0 103.1 82.3
Point Loma Nazarene U IIA PR 103.9 84.8 69.3 91.7 129.1 103.5 84.2 113.0 23.2 82.4 6.1 0.0 2.8 4.2 4.0 50 21 8 0 24 28 17 0 105.0 82.8 69.0 101.7 86.2 69.4
Pomona Coll IIB PI 159.3 115.9 96.1 70.7 128.5 203.0 153.1 128.2 95.9 166.8 29.8 97.7 100.0 0.0 0.0 2.8 4.4 6.5 5.7 50 32 16 9 35 25 18 5 164.5 116.9 94.3 65.3 151.9 114.7 97.7 80.6
Saint Mary’s Coll California IIA PR 120.2 96.1 81.9 100.9 155.7 131.0 108.0 133.6 32.4 100.0 66.3 0.0 2.9 2.4 4.4 44 31 19 0 34 49 40 0 121.8 95.9 90.1 118.2 96.2 78.0
San Diego St U 7 I PU 120.6 98.4 92.2 68.2 156.2 98.8 157.0 132.6 123.4 93.5 198.2 131.3 32.9 99.7 95.2 0.5 4.8 3.9 4.6 205 119 109 0 119 90 100 0 123.6 99.4 95.0 115.3 97.1 89.1
San Francisco St U 7 IIA PU 114.4 97.0 89.8 65.5 147.0 97.4 148.6 130.3 119.2 87.9 192.2 128.6 31.9 97.6 94.5 3.7 3.5 6.0 4.8 185 80 64 0 154 101 126 0 116.7 98.9 90.6 111.6 95.5 89.4
San Jose St U 7 IIA PU 113.7 97.5 88.5 67.8 138.6 96.1 149.3 130.8 119.4 93.5 171.3 128.3 33.5 100.0 97.7 2.1 3.5 5.2 5.0 173 53 108 0 125 76 130 0 115.0 97.0 90.2 111.9 97.8 87.0
Santa Clara U 7 IIA PR 161.5 118.4 95.6 77.5 77.9 114.4 212.6 161.8 128.1 107.8 116.8 154.4 34.9 100.0 99.4 0.0 3.3 4.2 4.9 99 94 43 0 55 60 45 0 168.1 117.9 102.7 149.5 119.3 88.8
Scripps Coll IIB PI 143.1 101.4 81.8 64.6 — 104.1 180.6 132.6 106.1 86.5 — 134.1 28.8 100.0 100.0 0.0 0.0 3.4 4.0 5.0 2.6 12 13 10 6 18 15 14 7 147.6 101.5 81.7 62.2 140.2 101.4 82.0 66.6
Sonoma St U 7 IIA PU 106.6 88.1 79.1 65.1 92.0 141.9 121.6 110.0 90.8 124.8 35.6 99.3 91.4 0.0 4.2 9.8 6.1 73 19 26 0 61 16 44 0 107.4 90.3 78.9 105.6 85.4 79.3
Stanford U 7 I PI 256.1 163.6 137.0 194.6 215.5 312.6 213.8 180.7 244.9 268.3 24.5 98.8 88.7 0.0 4.7 5.3 6.2 526 125 133 0 141 60 82 0 259.0 167.7 139.3 245.3 155.0 133.3
U California-Berkeley 14 I PU 201.7 137.7 115.4 89.4 79.6 159.8 268.6 187.8 159.6 126.9 114.5 215.7 35.0 95.4 96.1 0.0 601 173 154 0 227 136 93 0 204.9 142.5 119.7 193.3 131.5 108.2
U California-Davis 14 I PU 173.0 118.7 102.1 82.9 138.0 232.3 163.9 142.9 118.7 188.2 36.4 94.6 93.9 0.0 534 150 178 0 242 129 139 0 177.5 121.8 103.1 163.0 115.2 100.9
U California-Irvine 14 I PU 178.1 119.8 101.1 91.2 138.4 238.8 165.2 141.7 129.1 188.7 36.3 97.8 99.6 0.0 415 135 104 0 171 113 103 0 181.7 119.5 100.4 169.4 120.1 101.8
U California-Los Angeles 14 I PU 214.0 142.0 108.6 88.4 88.5 167.7 284.1 193.3 151.1 125.6 125.8 225.6 34.6 95.0 94.6 0.0 651 137 185 0 300 105 136 0 220.3 146.2 110.5 200.5 136.6 106.0
U California-Merced 14 I PU 160.7 112.4 97.3 65.8 100.8 216.8 155.9 136.8 97.1 141.2 40.1 100.0 95.1 0.0 45 34 63 0 22 27 52 0 169.8 112.6 98.7 142.0 112.2 95.5
U California-Riverside 14 I PU 168.5 111.3 93.3 77.5 — 121.6 226.6 154.4 131.7 111.8 — 167.5 37.7 99.7 99.5 0.0 245 110 164 0 78 81 104 0 170.1 112.1 97.0 163.4 110.1 87.5
U California-San Diego 14 I PU 178.9 123.5 106.3 87.2 140.0 239.8 169.9 148.1 124.1 190.7 36.2 98.3 97.5 0.0 463 126 127 0 120 72 97 0 183.6 126.5 109.5 160.7 118.3 102.0
U California-Santa Barbara 14 I PU 187.5 115.6 100.3 92.0 — 145.1 250.6 159.9 140.7 130.2 — 197.1 35.9 99.8 100.0 0.0 348 79 99 0 157 71 81 0 193.6 119.1 104.6 174.0 111.7 95.2
U California-Santa Cruz 14 I PU 168.1 114.5 100.3 90.7 — 135.0 226.1 158.5 140.6 128.5 — 184.3 36.6 98.6 99.2 0.0 195 69 73 0 99 59 60 0 171.9 114.7 102.5 160.4 114.2 97.7
U Redlands IIA PI 110.2 91.4 76.9 76.2 51.9 94.1 137.2 113.3 92.4 95.6 66.6 117.2 24.5 98.3 84.2 0.0 1.6 3.4 3.6 60 20 9 0 59 18 8 0 114.0 92.0 78.2 106.2 90.8 75.3
U San Diego IIA PR 140.2 101.7 84.0 74.9 110.6 180.2 134.7 111.1 102.9 144.5 30.7 91.0 87.0 0.0 0.0 2.8 2.9 3.4 2.5 120 57 62 19 79 74 66 18 148.7 107.7 83.2 81.0 127.3 97.1 84.8 68.4
U San Francisco I PR 156.7 119.1 103.6 92.4 125.1 208.9 161.8 139.6 139.4 168.7 34.8 87.7 76.5 1.8 0.0 1.9 5.6 4.3 1.9 97 58 60 8 58 91 107 4 160.3 119.9 106.4 92.3 150.7 118.6 102.1 92.6
U Southern California 7 I PI 185.4 117.1 100.2 58.0 70.3 134.9 247.4 166.9 145.2 110.7 109.0 187.2 38.8 77.8 48.5 0.0 0.0 4.3 4.9 5.3 594 329 247 0 249 267 220 3 194.8 121.0 105.0 163.0 112.3 94.9 58.0
Westmont Coll IIB PI 106.1 84.7 71.9 — 92.8 132.6 105.0 84.7 — 114.5 23.4 96.1 55.0 0.0 0.0 1.9 3.3 3.9 3.7 37 7 10 1 14 13 12 1 107.5 87.2 72.6 — 102.3 83.4 71.4 —
Whittier Coll IIB PI 110.7 83.6 61.3 54.1 71.5 83.2 138.0 102.9 74.8 64.1 98.9 103.1 23.9 100.0 88.9 0.0 0.0 3.0 3.0 3.2 17 23 16 0 13 22 16 3 115.5 85.3 60.2 104.5 81.8 62.4 54.1
ColoradoAdams St U 4 IIA PU 65.5 59.7 61.8 46.4 55.5 90.3 84.7 84.2 64.9 77.3 39.2 100.0 93.8 30.8 14 7 7 0 11 9 6 0 65.8 56.6 63.2 65.0 62.1 60.1
Colorado Coll IIB PI 138.8 104.0 85.3 64.8 — 60.8 107.3 178.0 136.0 110.7 79.5 — 79.8 138.6 29.1 100.0 96.6 0.0 0.0 3.7 4.6 4.7 1.9 43 32 18 9 27 27 34 5 142.8 106.1 85.3 65.8 132.4 101.4 85.3 63.1
Colorado St U-Fort Collins 7 I PU 130.4 96.3 81.0 54.3 96.5 167.1 123.4 103.8 69.6 123.7 28.2 97.8 87.7 0.0 0.0 3.1 4.5 4.5 4.6 326 180 190 87 134 154 201 137 135.1 99.0 84.8 61.2 118.9 93.1 77.4 49.9
Fort Lewis Coll 7 IIB PU 85.2 69.9 56.4 46.9 67.1 113.3 93.0 75.0 62.3 89.3 33.0 97.9 90.7 0.0 0.0 0.0 0.2 0.4 0.7 27 20 22 11 21 23 25 13 88.9 71.0 57.0 46.7 80.4 69.0 55.9 47.0
U Colorado Boulder 7 I PU 147.6 104.2 99.0 70.4 109.2 185.9 135.4 127.9 94.8 140.6 28.8 99.4 95.2 0.0 0.0 3.9 4.0 3.8 4.5 361 216 182 180 131 159 129 179 149.9 107.8 104.6 74.0 141.2 99.4 91.1 66.8
U Colorado Colorado Springs 1 IIA PU 113.1 86.6 75.8 50.7 74.1 139.7 109.7 98.5 67.2 95.0 28.2 100.0 100.0 0.0 0.0 4.1 4.7 4.4 4.8 56 42 49 69 23 41 52 115 118.1 87.3 78.3 51.2 100.9 85.9 73.6 50.4
U Colorado Denver I PU 153.1 109.3 103.0 71.5 107.2 182.6 132.6 126.6 87.7 130.1 21.4 91.6 75.4 0.0 0.0 2.3 3.1 3.8 3.8 108 165 113 98 71 128 132 121 156.5 106.3 102.6 68.8 147.9 113.1 103.4 73.8
U Denver 7 I PI 141.9 105.8 85.8 63.6 100.4 172.0 131.2 105.4 79.2 123.5 22.9 85.3 90.1 0.0 5.4 5.2 3.2 121 114 66 0 56 109 79 0 144.4 106.8 90.8 136.5 104.7 81.7
U Northern Colorado 7 I PU 88.2 66.2 57.5 45.2 50.6 70.5 105.8 81.2 69.1 56.0 62.3 85.2 20.9 99.0 86.8 0.0 0.0 0.1 3.7 1.6 4.0 117 57 54 3 80 64 84 6 90.8 69.4 58.9 45.3 84.3 63.3 56.5 45.2
ConnecticutAlbertus Magnus Coll 7 IIA PR 63.7 60.1 49.2 — 58.7 86.3 78.5 64.9 — 78.0 33.0 31.8 8.3 0.0 0.0 1.1 2.0 0.0 13 4 7 0 9 8 3 2 65.3 60.2 59.2 61.5 60.1 25.8 —
Central Connecticut St U 20 IIA PU 105.5 84.7 69.6 58.1 89.6 171.9 137.9 113.4 94.6 145.9 62.9 99.5 82.0 9.1 0.0 0.2 0.6 1.3 121 72 55 0 75 61 55 9 106.0 84.5 69.0 104.8 84.8 70.3 58.1
Connecticut Coll IIB PI 113.2 88.4 77.3 64.0 68.4 90.4 150.5 122.0 105.6 86.5 94.9 122.4 35.4 100.0 100.0 0.0 0.0 35 23 12 11 29 26 23 9 113.1 91.3 79.2 65.3 113.2 85.8 76.3 62.5
Fairfield U IIA PR 132.8 102.3 92.3 77.5 103.2 171.8 139.5 122.1 101.7 136.7 32.4 100.0 96.8 9.4 0.0 4.8 5.8 4.6 4.4 37 42 22 25 38 52 31 35 136.1 105.0 100.2 77.3 129.6 100.1 86.6 77.6
Quinnipiac U 15 IIA PI 134.4 97.0 89.1 78.2 104.4 175.5 128.5 113.8 99.3 135.9 30.2 90.4 67.2 0.0 0.0 1.3 2.6 3.2 3.3 63 52 51 7 51 76 85 8 142.1 103.3 92.3 75.8 124.9 92.7 87.1 80.2
© 2019 American Association of University Professors

APPENDIX I APPENDIX I
NAME NOTES
(1) (2) (3) (4) (5) (6) (7) (8) (9)
CAT. CTRL
AVG. SALARY ($1000s) AVG. COMPENSATION ($1000s) BEN. as %
of SAL.
PCT. TENURED PCT. INCR. (CONT. FAC.) F-T FAC. MEN F-T FAC. WOMEN AVG. SAL. MEN AVG. SAL. WOMEN
PR AO AI IN LE NR AR PR AO AI IN LE NR AR PR AO AI IN PR AO AI IN PR AO AI IN PR AO AI IN PR AO AI IN PR AO AI IN
California (continued)California Polytechnic St U-San Luis Obispo 7 IIA PU 111.6 96.6 86.1 70.6 124.6 93.4 149.5 131.3 117.5 97.0 167.5 126.6 35.5 98.7 84.1 0.0 4.2 5.9 5.4 225 95 107 0 92 50 99 0 113.1 98.4 89.1 107.8 93.4 82.9
Chapman U 7 IIA PR 150.6 104.6 93.5 71.4 118.2 113.6 193.0 144.1 124.2 96.1 152.4 150.1 32.1 84.6 73.9 0.0 0.0 1.7 2.7 3.1 3.2 112 83 85 15 50 59 93 13 160.8 110.3 93.3 72.5 127.8 96.5 93.7 70.3
Claremont Graduate U I PI 146.4 105.8 111.5 126.8 187.5 135.4 142.3 162.3 28.0 84.1 80.0 0.0 0.4 3.0 4.1 30 12 9 0 14 18 6 0 150.8 110.6 108.8 137.0 102.6 115.5
Claremont McKenna Coll IIB PI 171.6 122.7 108.9 74.8 136.4 217.1 157.8 140.4 98.6 174.2 27.7 100.0 95.7 0.0 0.0 4.5 5.7 5.5 46 30 13 8 21 17 9 10 173.8 128.5 116.7 80.5 166.9 112.5 97.6 70.2
Cogswell Coll 1 IIB FP 84.8 68.9 52.9 67.0 68.6 100.2 81.5 62.5 79.2 81.1 18.2 0.0 0.0 0.0 0.0 0.0 0.0 0.0 0.0 2 3 4 3 2 5 0 0 — 75.0 52.9 67.0 — 65.3
Dominican U California IIA PI 115.9 78.7 77.1 87.6 87.6 0.0 100.0 94.1 9.8 11.4 5.7 4.8 12 7 28 0 16 10 33 0 113.6 85.2 79.5 117.7 74.2 75.0
Fresno Pacific U 9 IIA PR 74.1 66.7 61.4 52.4 65.0 87.9 79.2 72.8 62.2 77.1 18.6 88.2 85.4 2.4 0.0 0.7 2.1 2.0 1.0 13 27 12 2 4 14 30 4 75.1 67.0 59.5 — 70.8 66.1 62.2 51.0
Fuller Theological Sem California 1 I PR 80.2 71.8 59.3 — 71.2 97.2 90.8 80.3 — 90.0 26.5 96.3 57.1 4.8 0.0 22 19 12 0 5 9 9 1 81.4 67.6 57.5 75.3 80.7 61.6 —
Golden Gate U-San Francisco IIA PI 131.9 103.2 — 78.7 110.0 149.8 117.2 — 89.5 125.0 13.6 80.8 39.1 0.0 0.0 6.0 6.7 7.0 15 10 0 6 11 13 1 6 129.6 90.5 85.2 135.0 112.9 — 72.3
Harvey Mudd Coll IIB PI 140.6 114.1 87.3 122.8 182.8 153.4 120.5 162.3 32.2 98.2 66.7 0.0 40 8 15 0 16 13 8 0 150.7 115.7 90.0 115.2 113.1 82.1
Holy Names U IIA PR 96.3 80.4 78.7 53.3 80.3 119.7 99.9 97.9 66.3 99.8 24.3 85.7 73.3 0.0 33.3 2.0 2.0 2.0 2.0 4 6 5 1 3 9 16 2 98.3 76.2 66.6 — 93.6 83.1 82.5 —
Humboldt St U 7 IIA PU 105.6 89.4 77.0 62.3 86.4 138.5 121.2 106.6 84.5 116.1 34.3 100.0 89.1 1.4 3.5 5.2 4.6 64 26 29 0 39 29 43 0 106.1 90.0 80.1 104.6 88.8 75.0
Mills Coll IIA PI 108.0 90.0 68.3 — 92.8 122.3 104.1 78.3 — 105.7 14.0 72.5 85.7 0.0 0.4 3.1 2.6 10 3 6 0 30 11 16 0 105.7 94.0 81.4 108.8 88.9 63.4
Mount Saint Mary’s U 7,27 IIA PR 93.0 79.4 77.0 59.7 78.8 93.1 58.6 17.9 0.0 2.0 0.9 2.8 3.7 10 7 16 6 19 22 40 11 95.3 76.6 75.4 59.8 91.9 80.3 77.7 59.6
National U IIA PI 128.6 93.1 77.4 72.5 105.6 161.4 121.2 103.5 134.1 26.9 0.0 0.0 0.0 0.0 0.4 0.6 0.0 8.2 65 27 19 6 45 42 26 6 130.2 92.8 77.1 72.2 126.4 93.3 77.6 72.8
Occidental Coll IIB PI 134.1 95.1 80.3 66.1 101.6 170.5 124.0 102.8 86.5 130.6 28.5 100.0 93.8 0.0 0.0 2.2 4.3 4.1 3.9 37 23 13 22 37 25 15 20 137.6 96.8 80.9 68.6 130.7 93.5 79.8 63.3
Pepperdine U I PR 143.9 117.6 96.5 59.7 86.3 75.9 111.5 185.2 155.6 125.2 82.4 121.5 98.7 145.4 30.4 94.7 79.8 2.4 0.0 0.8 4.2 4.8 4.0 92 42 45 10 41 42 37 13 147.6 129.8 101.1 57.3 135.5 105.3 91.0 61.6
Pitzer Coll 7 IIB PI 134.6 104.3 81.8 73.3 109.1 186.0 144.5 119.1 89.1 149.7 37.2 100.0 100.0 0.0 4.2 7.1 6.3 18 9 1 0 18 9 11 0 137.1 105.4 — 132.0 103.1 82.3
Point Loma Nazarene U IIA PR 103.9 84.8 69.3 91.7 129.1 103.5 84.2 113.0 23.2 82.4 6.1 0.0 2.8 4.2 4.0 50 21 8 0 24 28 17 0 105.0 82.8 69.0 101.7 86.2 69.4
Pomona Coll IIB PI 159.3 115.9 96.1 70.7 128.5 203.0 153.1 128.2 95.9 166.8 29.8 97.7 100.0 0.0 0.0 2.8 4.4 6.5 5.7 50 32 16 9 35 25 18 5 164.5 116.9 94.3 65.3 151.9 114.7 97.7 80.6
Saint Mary’s Coll California IIA PR 120.2 96.1 81.9 100.9 155.7 131.0 108.0 133.6 32.4 100.0 66.3 0.0 2.9 2.4 4.4 44 31 19 0 34 49 40 0 121.8 95.9 90.1 118.2 96.2 78.0
San Diego St U 7 I PU 120.6 98.4 92.2 68.2 156.2 98.8 157.0 132.6 123.4 93.5 198.2 131.3 32.9 99.7 95.2 0.5 4.8 3.9 4.6 205 119 109 0 119 90 100 0 123.6 99.4 95.0 115.3 97.1 89.1
San Francisco St U 7 IIA PU 114.4 97.0 89.8 65.5 147.0 97.4 148.6 130.3 119.2 87.9 192.2 128.6 31.9 97.6 94.5 3.7 3.5 6.0 4.8 185 80 64 0 154 101 126 0 116.7 98.9 90.6 111.6 95.5 89.4
San Jose St U 7 IIA PU 113.7 97.5 88.5 67.8 138.6 96.1 149.3 130.8 119.4 93.5 171.3 128.3 33.5 100.0 97.7 2.1 3.5 5.2 5.0 173 53 108 0 125 76 130 0 115.0 97.0 90.2 111.9 97.8 87.0
Santa Clara U 7 IIA PR 161.5 118.4 95.6 77.5 77.9 114.4 212.6 161.8 128.1 107.8 116.8 154.4 34.9 100.0 99.4 0.0 3.3 4.2 4.9 99 94 43 0 55 60 45 0 168.1 117.9 102.7 149.5 119.3 88.8
Scripps Coll IIB PI 143.1 101.4 81.8 64.6 — 104.1 180.6 132.6 106.1 86.5 — 134.1 28.8 100.0 100.0 0.0 0.0 3.4 4.0 5.0 2.6 12 13 10 6 18 15 14 7 147.6 101.5 81.7 62.2 140.2 101.4 82.0 66.6
Sonoma St U 7 IIA PU 106.6 88.1 79.1 65.1 92.0 141.9 121.6 110.0 90.8 124.8 35.6 99.3 91.4 0.0 4.2 9.8 6.1 73 19 26 0 61 16 44 0 107.4 90.3 78.9 105.6 85.4 79.3
Stanford U 7 I PI 256.1 163.6 137.0 194.6 215.5 312.6 213.8 180.7 244.9 268.3 24.5 98.8 88.7 0.0 4.7 5.3 6.2 526 125 133 0 141 60 82 0 259.0 167.7 139.3 245.3 155.0 133.3
U California-Berkeley 14 I PU 201.7 137.7 115.4 89.4 79.6 159.8 268.6 187.8 159.6 126.9 114.5 215.7 35.0 95.4 96.1 0.0 601 173 154 0 227 136 93 0 204.9 142.5 119.7 193.3 131.5 108.2
U California-Davis 14 I PU 173.0 118.7 102.1 82.9 138.0 232.3 163.9 142.9 118.7 188.2 36.4 94.6 93.9 0.0 534 150 178 0 242 129 139 0 177.5 121.8 103.1 163.0 115.2 100.9
U California-Irvine 14 I PU 178.1 119.8 101.1 91.2 138.4 238.8 165.2 141.7 129.1 188.7 36.3 97.8 99.6 0.0 415 135 104 0 171 113 103 0 181.7 119.5 100.4 169.4 120.1 101.8
U California-Los Angeles 14 I PU 214.0 142.0 108.6 88.4 88.5 167.7 284.1 193.3 151.1 125.6 125.8 225.6 34.6 95.0 94.6 0.0 651 137 185 0 300 105 136 0 220.3 146.2 110.5 200.5 136.6 106.0
U California-Merced 14 I PU 160.7 112.4 97.3 65.8 100.8 216.8 155.9 136.8 97.1 141.2 40.1 100.0 95.1 0.0 45 34 63 0 22 27 52 0 169.8 112.6 98.7 142.0 112.2 95.5
U California-Riverside 14 I PU 168.5 111.3 93.3 77.5 — 121.6 226.6 154.4 131.7 111.8 — 167.5 37.7 99.7 99.5 0.0 245 110 164 0 78 81 104 0 170.1 112.1 97.0 163.4 110.1 87.5
U California-San Diego 14 I PU 178.9 123.5 106.3 87.2 140.0 239.8 169.9 148.1 124.1 190.7 36.2 98.3 97.5 0.0 463 126 127 0 120 72 97 0 183.6 126.5 109.5 160.7 118.3 102.0
U California-Santa Barbara 14 I PU 187.5 115.6 100.3 92.0 — 145.1 250.6 159.9 140.7 130.2 — 197.1 35.9 99.8 100.0 0.0 348 79 99 0 157 71 81 0 193.6 119.1 104.6 174.0 111.7 95.2
U California-Santa Cruz 14 I PU 168.1 114.5 100.3 90.7 — 135.0 226.1 158.5 140.6 128.5 — 184.3 36.6 98.6 99.2 0.0 195 69 73 0 99 59 60 0 171.9 114.7 102.5 160.4 114.2 97.7
U Redlands IIA PI 110.2 91.4 76.9 76.2 51.9 94.1 137.2 113.3 92.4 95.6 66.6 117.2 24.5 98.3 84.2 0.0 1.6 3.4 3.6 60 20 9 0 59 18 8 0 114.0 92.0 78.2 106.2 90.8 75.3
U San Diego IIA PR 140.2 101.7 84.0 74.9 110.6 180.2 134.7 111.1 102.9 144.5 30.7 91.0 87.0 0.0 0.0 2.8 2.9 3.4 2.5 120 57 62 19 79 74 66 18 148.7 107.7 83.2 81.0 127.3 97.1 84.8 68.4
U San Francisco I PR 156.7 119.1 103.6 92.4 125.1 208.9 161.8 139.6 139.4 168.7 34.8 87.7 76.5 1.8 0.0 1.9 5.6 4.3 1.9 97 58 60 8 58 91 107 4 160.3 119.9 106.4 92.3 150.7 118.6 102.1 92.6
U Southern California 7 I PI 185.4 117.1 100.2 58.0 70.3 134.9 247.4 166.9 145.2 110.7 109.0 187.2 38.8 77.8 48.5 0.0 0.0 4.3 4.9 5.3 594 329 247 0 249 267 220 3 194.8 121.0 105.0 163.0 112.3 94.9 58.0
Westmont Coll IIB PI 106.1 84.7 71.9 — 92.8 132.6 105.0 84.7 — 114.5 23.4 96.1 55.0 0.0 0.0 1.9 3.3 3.9 3.7 37 7 10 1 14 13 12 1 107.5 87.2 72.6 — 102.3 83.4 71.4 —
Whittier Coll IIB PI 110.7 83.6 61.3 54.1 71.5 83.2 138.0 102.9 74.8 64.1 98.9 103.1 23.9 100.0 88.9 0.0 0.0 3.0 3.0 3.2 17 23 16 0 13 22 16 3 115.5 85.3 60.2 104.5 81.8 62.4 54.1
ColoradoAdams St U 4 IIA PU 65.5 59.7 61.8 46.4 55.5 90.3 84.7 84.2 64.9 77.3 39.2 100.0 93.8 30.8 14 7 7 0 11 9 6 0 65.8 56.6 63.2 65.0 62.1 60.1
Colorado Coll IIB PI 138.8 104.0 85.3 64.8 — 60.8 107.3 178.0 136.0 110.7 79.5 — 79.8 138.6 29.1 100.0 96.6 0.0 0.0 3.7 4.6 4.7 1.9 43 32 18 9 27 27 34 5 142.8 106.1 85.3 65.8 132.4 101.4 85.3 63.1
Colorado St U-Fort Collins 7 I PU 130.4 96.3 81.0 54.3 96.5 167.1 123.4 103.8 69.6 123.7 28.2 97.8 87.7 0.0 0.0 3.1 4.5 4.5 4.6 326 180 190 87 134 154 201 137 135.1 99.0 84.8 61.2 118.9 93.1 77.4 49.9
Fort Lewis Coll 7 IIB PU 85.2 69.9 56.4 46.9 67.1 113.3 93.0 75.0 62.3 89.3 33.0 97.9 90.7 0.0 0.0 0.0 0.2 0.4 0.7 27 20 22 11 21 23 25 13 88.9 71.0 57.0 46.7 80.4 69.0 55.9 47.0
U Colorado Boulder 7 I PU 147.6 104.2 99.0 70.4 109.2 185.9 135.4 127.9 94.8 140.6 28.8 99.4 95.2 0.0 0.0 3.9 4.0 3.8 4.5 361 216 182 180 131 159 129 179 149.9 107.8 104.6 74.0 141.2 99.4 91.1 66.8
U Colorado Colorado Springs 1 IIA PU 113.1 86.6 75.8 50.7 74.1 139.7 109.7 98.5 67.2 95.0 28.2 100.0 100.0 0.0 0.0 4.1 4.7 4.4 4.8 56 42 49 69 23 41 52 115 118.1 87.3 78.3 51.2 100.9 85.9 73.6 50.4
U Colorado Denver I PU 153.1 109.3 103.0 71.5 107.2 182.6 132.6 126.6 87.7 130.1 21.4 91.6 75.4 0.0 0.0 2.3 3.1 3.8 3.8 108 165 113 98 71 128 132 121 156.5 106.3 102.6 68.8 147.9 113.1 103.4 73.8
U Denver 7 I PI 141.9 105.8 85.8 63.6 100.4 172.0 131.2 105.4 79.2 123.5 22.9 85.3 90.1 0.0 5.4 5.2 3.2 121 114 66 0 56 109 79 0 144.4 106.8 90.8 136.5 104.7 81.7
U Northern Colorado 7 I PU 88.2 66.2 57.5 45.2 50.6 70.5 105.8 81.2 69.1 56.0 62.3 85.2 20.9 99.0 86.8 0.0 0.0 0.1 3.7 1.6 4.0 117 57 54 3 80 64 84 6 90.8 69.4 58.9 45.3 84.3 63.3 56.5 45.2
ConnecticutAlbertus Magnus Coll 7 IIA PR 63.7 60.1 49.2 — 58.7 86.3 78.5 64.9 — 78.0 33.0 31.8 8.3 0.0 0.0 1.1 2.0 0.0 13 4 7 0 9 8 3 2 65.3 60.2 59.2 61.5 60.1 25.8 —
Central Connecticut St U 20 IIA PU 105.5 84.7 69.6 58.1 89.6 171.9 137.9 113.4 94.6 145.9 62.9 99.5 82.0 9.1 0.0 0.2 0.6 1.3 121 72 55 0 75 61 55 9 106.0 84.5 69.0 104.8 84.8 70.3 58.1
Connecticut Coll IIB PI 113.2 88.4 77.3 64.0 68.4 90.4 150.5 122.0 105.6 86.5 94.9 122.4 35.4 100.0 100.0 0.0 0.0 35 23 12 11 29 26 23 9 113.1 91.3 79.2 65.3 113.2 85.8 76.3 62.5
Fairfield U IIA PR 132.8 102.3 92.3 77.5 103.2 171.8 139.5 122.1 101.7 136.7 32.4 100.0 96.8 9.4 0.0 4.8 5.8 4.6 4.4 37 42 22 25 38 52 31 35 136.1 105.0 100.2 77.3 129.6 100.1 86.6 77.6
Quinnipiac U 15 IIA PI 134.4 97.0 89.1 78.2 104.4 175.5 128.5 113.8 99.3 135.9 30.2 90.4 67.2 0.0 0.0 1.3 2.6 3.2 3.3 63 52 51 7 51 76 85 8 142.1 103.3 92.3 75.8 124.9 92.7 87.1 80.2
© 2019 American Association of University Professors
APPENDIX I APPENDIX I
NAME NOTES
(1) (2) (3) (4) (5) (6) (7) (8) (9)
CAT. CTRL
AVG. SALARY ($1000s) AVG. COMPENSATION ($1000s) BEN. as %
of SAL.
PCT. TENURED PCT. INCR. (CONT. FAC.) F-T FAC. MEN F-T FAC. WOMEN AVG. SAL. MEN AVG. SAL. WOMEN
PR AO AI IN LE NR AR PR AO AI IN LE NR AR PR AO AI IN PR AO AI IN PR AO AI IN PR AO AI IN PR AO AI IN PR AO AI IN
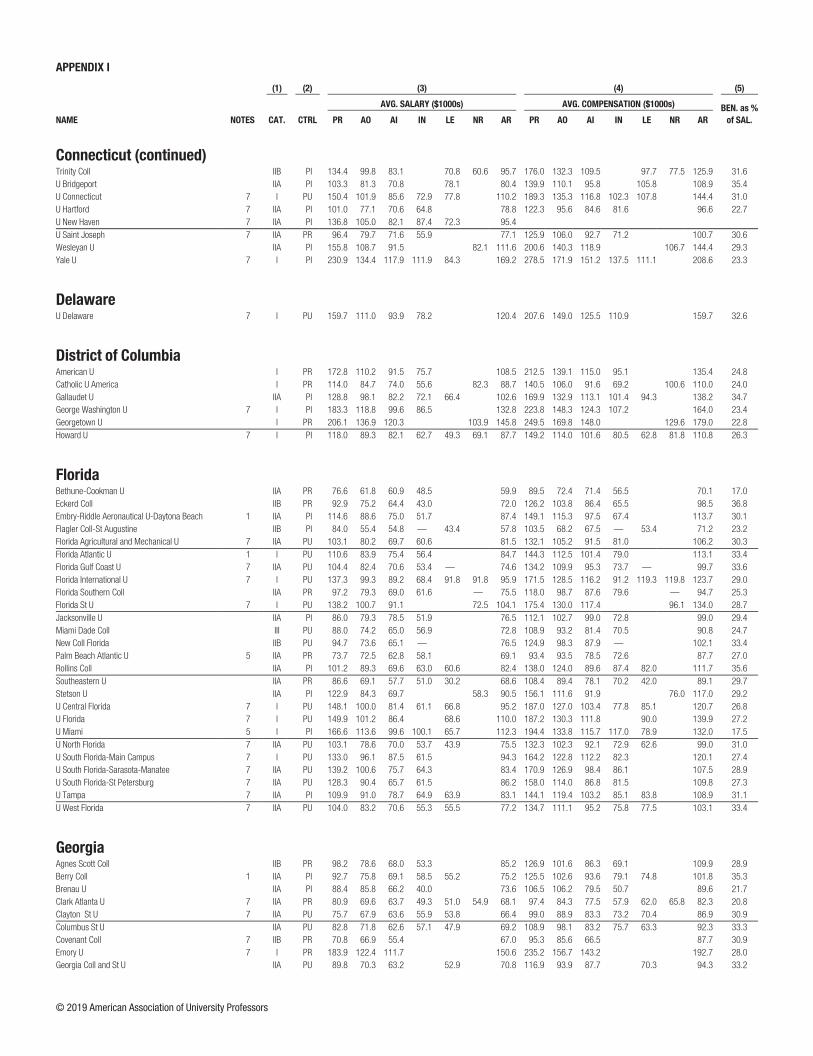
Connecticut (continued)Trinity Coll IIB PI 134.4 99.8 83.1 70.8 60.6 95.7 176.0 132.3 109.5 97.7 77.5 125.9 31.6 93.4 94.9 0.0 2.0 2.2 7.7 46 27 17 0 15 32 16 0 135.3 98.0 83.5 131.4 101.3 82.6
U Bridgeport IIA PI 103.3 81.3 70.8 78.1 80.4 139.9 110.1 95.8 105.8 108.9 35.4 100.0 77.6 8.7 0.6 0.5 1.5 14 34 21 0 6 24 25 0 103.3 85.8 71.6 103.3 74.8 70.0
U Connecticut 7 I PU 150.4 101.9 85.6 72.9 77.8 110.2 189.3 135.3 116.8 102.3 107.8 144.4 31.0 97.5 81.2 1.1 0.0 0.6 1.0 1.0 1.6 324 256 234 33 149 202 208 29 155.5 106.1 90.1 75.9 139.2 96.5 80.6 69.4
U Hartford 7 IIA PI 101.0 77.1 70.6 64.8 78.8 122.3 95.6 84.6 81.6 96.6 22.7 100.0 91.7 4.5 0.0 0.6 0.6 0.5 2.4 55 60 29 42 26 48 38 35 100.8 77.2 74.2 67.3 101.3 77.0 67.9 61.8
U New Haven 7 IIA PI 136.8 105.0 82.1 87.4 72.3 95.4 100.0 84.1 4.4 0.0 3.1 4.5 3.4 3.4 38 44 41 7 10 19 27 1 141.7 107.6 82.7 89.3 117.9 98.9 81.2 —
U Saint Joseph 7 IIA PR 96.4 79.7 71.6 55.9 77.1 125.9 106.0 92.7 71.2 100.7 30.6 100.0 86.8 0.0 0.0 2.1 2.3 2.2 2.1 11 14 14 0 10 24 55 6 96.3 81.3 74.0 96.6 78.7 71.0 55.9
Wesleyan U IIA PI 155.8 108.7 91.5 82.1 111.6 200.6 140.3 118.9 106.7 144.4 29.3 100.0 100.0 0.0 4.0 4.4 5.2 79 32 36 0 32 42 38 0 159.0 109.2 92.5 147.7 108.2 90.6
Yale U 7 I PI 230.9 134.4 117.9 111.9 84.3 169.2 278.5 171.9 151.2 137.5 111.1 208.6 23.3 88.3 43.7 0.0 0.0 4.9 6.5 5.5 5.6 448 76 91 9 166 66 93 9 234.2 135.6 125.9 116.2 221.9 133.1 110.1 107.6
DelawareU Delaware 7 I PU 159.7 111.0 93.9 78.2 120.4 207.6 149.0 125.5 110.9 159.7 32.6 96.0 77.3 0.0 0.0 3.5 4.6 4.3 4.3 319 203 177 26 135 172 200 74 163.2 114.0 95.6 86.2 151.2 107.4 92.3 75.4
District of ColumbiaAmerican U I PR 172.8 110.2 91.5 75.7 108.5 212.5 139.1 115.0 95.1 135.4 24.8 97.3 93.8 3.9 0.0 3.3 3.1 3.3 3.3 124 91 75 125 61 86 79 168 175.8 108.4 94.4 82.6 166.8 112.2 88.7 70.5
Catholic U America I PR 114.0 84.7 74.0 55.6 82.3 88.7 140.5 106.0 91.6 69.2 100.6 110.0 24.0 96.0 76.1 0.0 0.0 5.5 0.6 1.4 3.1 71 84 60 2 29 58 44 7 111.4 86.6 79.2 — 120.3 82.1 66.9 56.9
Gallaudet U IIA PI 128.8 98.1 82.2 72.1 66.4 102.6 169.9 132.9 113.1 101.4 94.3 138.2 34.7 94.7 58.1 10.8 0.0 2.5 5.7 3.7 3.0 31 13 13 5 44 30 24 7 130.9 93.9 84.0 75.5 127.3 99.9 81.1 69.7
George Washington U 7 I PI 183.3 118.8 99.6 86.5 132.8 223.8 148.3 124.3 107.2 164.0 23.4 90.8 73.2 0.0 0.0 3.2 4.2 3.6 2.5 267 178 114 50 113 180 135 77 185.5 120.2 105.1 95.9 177.9 117.5 94.9 80.4
Georgetown U I PR 206.1 136.9 120.3 103.9 145.8 249.5 169.8 148.0 129.6 179.0 22.8 89.0 89.2 2.2 3.1 4.2 3.3 235 129 52 0 128 120 40 0 210.3 139.6 121.3 198.3 133.9 118.9
Howard U 7 I PI 118.0 89.3 82.1 62.7 49.3 69.1 87.7 149.2 114.0 101.6 80.5 62.8 81.8 110.8 26.3 100.0 95.4 1.3 0.0 4.3 3.7 3.0 6.3 106 104 75 16 50 90 83 18 119.5 89.7 82.7 61.8 114.7 88.7 81.6 63.5
FloridaBethune-Cookman U IIA PR 76.6 61.8 60.9 48.5 59.9 89.5 72.4 71.4 56.5 70.1 17.0 58.8 28.6 2.4 0.0 0.0 -1.6 0.4 -1.8 13 15 50 16 4 20 34 22 75.0 60.9 60.5 48.0 81.6 62.5 61.6 48.9
Eckerd Coll IIB PR 92.9 75.2 64.4 43.0 72.0 126.2 103.8 86.4 65.5 98.5 36.8 100.0 100.0 15.9 0.0 3.4 4.0 3.0 3.4 29 16 27 8 15 10 36 10 94.5 76.9 64.9 45.4 89.8 72.5 64.0 41.0
Embry-Riddle Aeronautical U-Daytona Beach 1 IIA PI 114.6 88.6 75.0 51.7 87.4 149.1 115.3 97.5 67.4 113.7 30.1 91.8 59.8 1.0 0.0 2.6 3.3 3.9 2.9 72 74 68 15 13 23 33 18 116.1 88.0 76.7 55.6 106.4 90.8 71.4 48.5
Flagler Coll-St Augustine IIB PI 84.0 55.4 54.8 — 43.4 57.8 103.5 68.2 67.5 — 53.4 71.2 23.2 0.0 0.0 0.0 0.0 2.0 2.0 2.0 8 17 26 1 6 22 36 1 86.4 59.4 55.9 — 80.9 52.2 54.0 —
Florida Agricultural and Mechanical U 7 IIA PU 103.1 80.2 69.7 60.6 81.5 132.1 105.2 91.5 81.0 106.2 30.3 91.4 91.6 11.6 0.0 0.1 2.4 1.1 0.4 113 79 73 24 50 75 73 52 102.6 80.8 70.3 57.8 104.4 79.7 69.0 61.9
Florida Atlantic U 1 I PU 110.6 83.9 75.4 56.4 84.7 144.3 112.5 101.4 79.0 113.1 33.4 99.1 92.4 0.0 0.0 0.1 1.3 0.8 0.6 152 105 89 50 65 91 91 84 114.1 86.3 82.2 61.4 102.4 81.2 68.7 53.5
Florida Gulf Coast U 7 IIA PU 104.4 82.4 70.6 53.4 — 74.6 134.2 109.9 95.3 73.7 — 99.7 33.6 2.5 0.8 0.0 0.0 1.7 4.2 2.9 6.6 55 85 67 49 26 39 73 82 109.5 82.9 66.0 53.6 93.4 81.4 74.7 53.3
Florida International U 7 I PU 137.3 99.3 89.2 68.4 91.8 91.8 95.9 171.5 128.5 116.2 91.2 119.3 119.8 123.7 29.0 92.9 84.6 0.0 0.0 4.4 4.7 3.3 5.9 202 183 134 183 65 122 144 182 139.0 101.1 92.1 70.6 132.1 96.7 86.6 66.1
Florida Southern Coll IIA PR 97.2 79.3 69.0 61.6 — 75.5 118.0 98.7 87.6 79.6 — 94.7 25.3 66.7 51.1 0.0 0.0 2.9 4.3 6.2 8.2 15 23 31 5 6 24 33 11 95.2 85.4 68.6 62.0 102.1 73.4 69.5 61.4
Florida St U 7 I PU 138.2 100.7 91.1 72.5 104.1 175.4 130.0 117.4 96.1 134.0 28.7 97.8 94.3 0.0 2.2 3.9 3.7 371 185 198 0 129 129 163 0 142.8 103.9 94.5 125.1 96.0 86.8
Jacksonville U IIA PI 86.0 79.3 78.5 51.9 76.5 112.1 102.7 99.0 72.8 99.0 29.4 100.0 87.5 5.4 0.0 3.2 3.3 3.1 3.3 31 32 32 19 23 24 61 16 89.6 82.9 78.8 50.3 81.1 74.5 78.3 53.7
Miami Dade Coll III PU 88.0 74.2 65.0 56.9 72.8 108.9 93.2 81.4 70.5 90.8 24.7 100.0 100.0 65.8 10.2 2.1 2.7 3.1 3.3 82 124 78 54 88 138 83 54 89.1 74.8 64.6 57.2 87.1 73.7 65.3 56.7
New Coll Florida IIB PU 94.7 73.6 65.1 — 76.5 124.9 98.3 87.9 — 102.1 33.4 96.6 100.0 0.0 0.0 4.8 3.8 3.3 16 6 18 0 13 15 18 2 101.7 73.1 66.8 86.1 73.8 63.5 —
Palm Beach Atlantic U 5 IIA PR 73.7 72.5 62.8 58.1 69.1 93.4 93.5 78.5 72.6 87.7 27.0 0.0 0.0 0.0 0.0 40 31 27 1 15 28 30 8 74.2 72.7 64.2 — 72.2 72.3 61.5 59.0
Rollins Coll IIA PI 101.2 89.3 69.6 63.0 60.6 82.4 138.0 124.0 89.6 87.4 82.0 111.7 35.6 98.5 81.3 0.0 0.0 4.4 2.3 4.1 5.3 38 30 23 5 28 34 31 6 107.2 97.3 72.9 63.5 93.2 82.1 67.2 62.6
Southeastern U IIA PR 86.6 69.1 57.7 51.0 30.2 68.6 108.4 89.4 78.1 70.2 42.0 89.1 29.7 4.0 0.0 0.0 0.0 1.7 3.3 8.3 2.0 34 28 25 1 16 20 25 7 86.5 69.6 56.4 — 86.6 68.4 59.1 51.7
Stetson U IIA PI 122.9 84.3 69.7 58.3 90.5 156.1 111.6 91.9 76.0 117.0 29.2 100.0 92.3 0.0 2.1 2.0 3.0 58 31 25 0 43 21 32 0 119.3 84.2 71.4 127.8 84.6 68.3
U Central Florida 7 I PU 148.1 100.0 81.4 61.1 66.8 95.2 187.0 127.0 103.4 77.8 85.1 120.7 26.8 98.1 94.4 0.9 0.0 240 232 195 87 81 143 142 119 153.7 102.7 83.3 63.3 131.5 95.7 78.8 59.4
U Florida 7 I PU 149.9 101.2 86.4 68.6 110.0 187.2 130.3 111.8 90.0 139.9 27.2 95.5 83.8 0.6 0.3 0.8 0.9 586 315 249 0 192 221 233 0 152.5 103.5 91.0 141.8 97.8 81.5
U Miami 5 I PI 166.6 113.6 99.6 100.1 65.7 112.3 194.4 133.8 115.7 117.0 78.9 132.0 17.5 98.8 96.1 0.0 0.0 2.4 2.8 2.6 2.6 245 138 78 63 75 94 58 66 168.3 116.6 104.6 104.5 161.0 109.1 92.8 95.9
U North Florida 7 IIA PU 103.1 78.6 70.0 53.7 43.9 75.5 132.3 102.3 92.1 72.9 62.6 99.0 31.0 100.0 98.8 0.0 0.0 3.6 4.4 5.2 6.7 72 90 52 44 39 79 57 57 105.2 81.4 73.2 52.6 99.2 75.4 67.1 54.5
U South Florida-Main Campus 7 I PU 133.0 96.1 87.5 61.5 94.3 164.2 122.8 112.2 82.3 120.1 27.4 95.6 91.5 0.0 0.3 2.8 4.3 4.2 4.5 253 189 115 148 90 151 102 232 137.3 99.5 92.2 64.6 120.9 91.9 82.3 59.4
U South Florida-Sarasota-Manatee 7 IIA PU 139.2 100.6 75.7 64.3 83.4 170.9 126.9 98.4 86.1 107.5 28.9 100.0 100.0 0.0 0.0 5.2 4.1 5.2 4.2 8 7 8 23 3 12 8 20 152.5 112.6 73.6 64.1 103.9 93.6 77.9 64.6
U South Florida-St Petersburg 7 IIA PU 128.3 90.4 65.7 61.5 86.2 158.0 114.0 86.8 81.5 109.8 27.3 100.0 87.5 0.0 0.0 3.3 3.3 7.9 6.0 25 19 13 17 8 21 17 21 132.4 94.1 60.7 61.7 115.5 87.0 69.6 61.2
U Tampa 7 IIA PI 109.9 91.0 78.7 64.9 63.9 83.1 144.1 119.4 103.2 85.1 83.8 108.9 31.1 100.0 84.4 4.2 0.0 4.2 3.7 3.1 3.4 29 79 50 30 12 49 45 53 111.7 90.2 81.1 66.4 105.6 92.3 76.2 64.0
U West Florida 7 IIA PU 104.0 83.2 70.6 55.3 55.5 77.2 134.7 111.1 95.2 75.8 77.5 103.1 33.4 97.6 97.0 4.6 0.0 3.6 4.7 3.3 4.0 59 37 59 21 24 30 50 31 102.9 85.5 72.6 58.6 106.7 80.3 68.3 53.0
GeorgiaAgnes Scott Coll IIB PR 98.2 78.6 68.0 53.3 85.2 126.9 101.6 86.3 69.1 109.9 28.9 100.0 86.4 0.0 0.0 2.0 1.1 2.8 18 7 1 0 22 15 15 3 97.4 80.9 — 98.8 77.5 68.0 53.3
Berry Coll 1 IIA PI 92.7 75.8 69.1 58.5 55.2 75.2 125.5 102.6 93.6 79.1 74.8 101.8 35.3 100.0 93.6 1.7 0.0 2.1 2.0 2.0 2.0 29 24 29 3 10 23 29 4 93.9 78.8 70.0 65.1 89.4 72.7 68.3 53.5
Brenau U IIA PI 88.4 85.8 66.2 40.0 73.6 106.5 106.2 79.5 50.7 89.6 21.7 0.0 0.0 0.0 0.0 1.5 4.5 3.0 8.2 10 12 20 2 20 28 42 12 77.5 80.8 67.0 — 93.9 87.9 65.9 41.3
Clark Atlanta U 7 IIA PR 80.9 69.6 63.7 49.3 51.0 54.9 68.1 97.4 84.3 77.5 57.9 62.0 65.8 82.3 20.8 100.0 85.5 10.0 0.0 1.9 2.3 3.5 7.4 39 37 12 3 9 25 28 7 82.3 68.1 63.0 56.8 75.3 71.8 64.1 46.2
Clayton St U 7 IIA PU 75.7 67.9 63.6 55.9 53.8 66.4 99.0 88.9 83.3 73.2 70.4 86.9 30.9 98.4 87.0 0.0 0.0 -0.3 1.0 1.2 3.3 34 41 16 0 29 28 23 8 77.4 69.9 65.1 73.6 65.0 62.6 55.9
Columbus St U IIA PU 82.8 71.8 62.6 57.1 47.9 69.2 108.9 98.1 83.2 75.7 63.3 92.3 33.3 94.6 89.2 3.3 0.0 1.1 0.4 -0.2 0.9 61 45 47 1 32 29 43 11 84.8 75.6 65.0 — 78.9 65.9 60.0 58.1
Covenant Coll 7 IIB PR 70.8 66.9 55.4 67.0 95.3 85.6 66.5 87.7 30.9 89.2 38.5 0.0 -2.2 2.4 2.1 33 9 5 0 4 4 7 0 71.0 66.1 53.7 68.8 68.7 56.6
Emory U 7 I PR 183.9 122.4 111.7 150.6 235.2 156.7 143.2 192.7 28.0 88.1 88.5 0.0 5.8 4.3 5.3 237 113 83 0 124 96 75 0 189.3 127.0 115.9 173.5 117.1 107.1
Georgia Coll and St U IIA PU 89.8 70.3 63.2 52.9 70.8 116.9 93.9 87.7 70.3 94.3 33.2 100.0 98.5 1.3 -0.6 2.9 1.0 59 23 38 0 43 44 39 0 90.3 72.1 64.5 89.1 69.4 62.0
© 2019 American Association of University Professors

APPENDIX I APPENDIX I
NAME NOTES
(1) (2) (3) (4) (5) (6) (7) (8) (9)
CAT. CTRL
AVG. SALARY ($1000s) AVG. COMPENSATION ($1000s) BEN. as %
of SAL.
PCT. TENURED PCT. INCR. (CONT. FAC.) F-T FAC. MEN F-T FAC. WOMEN AVG. SAL. MEN AVG. SAL. WOMEN
PR AO AI IN LE NR AR PR AO AI IN LE NR AR PR AO AI IN PR AO AI IN PR AO AI IN PR AO AI IN PR AO AI IN PR AO AI IN
Georgia (continued)Georgia Institute Technology-Main Campus 7 I PU 169.3 114.1 104.0 54.5 60.4 93.8 130.7 219.4 147.5 134.3 76.5 79.0 168.0 28.5 99.6 95.3 0.0 0.0 1.2 2.1 2.8 17.7 432 221 131 2 90 75 65 7 171.4 115.8 104.5 — 159.0 109.2 103.1 49.7
Georgia Southern U 7 I PU 82.5 73.2 70.2 53.0 50.5 69.7 107.3 96.9 93.1 71.7 68.1 92.2 32.3 100.0 97.7 4.1 0.0 0.1 0.5 0.6 0.4 128 152 153 4 75 113 165 33 84.2 76.2 72.9 45.3 79.8 69.1 67.8 54.0
Kennesaw St U 5 I PU 90.5 74.5 66.2 48.0 52.7 71.1 120.7 99.3 88.3 64.0 70.2 94.9 33.3 99.3 96.3 7.2 0.0 0.9 1.7 1.5 2.2 184 153 154 18 121 140 150 29 94.1 76.7 67.6 49.8 85.0 72.1 64.9 46.9
Mercer U 7 I PI 97.4 76.5 70.0 58.9 65.9 79.0 128.0 104.0 95.0 81.3 88.9 106.1 34.4 96.4 76.7 1.7 0.0 1.4 2.4 2.6 2.5 72 59 45 7 39 57 76 19 98.0 76.7 70.6 65.4 96.3 76.2 69.6 56.5
Oglethorpe U IIB PI 77.4 62.6 56.0 — 50.9 62.4 100.6 81.3 72.8 — 66.1 81.1 29.9 100.0 92.3 0.0 0.0 0.2 7.9 3.7 14 8 6 1 6 5 10 1 80.0 62.7 59.3 — 71.4 62.3 54.1 —
Spelman Coll IIB PI 111.4 81.0 66.4 60.9 61.0 74.9 140.0 101.8 83.5 76.6 76.7 94.2 25.7 100.0 98.4 0.0 0.0 2.2 2.3 4.7 3.3 7 17 11 3 12 47 31 13 98.7 79.5 68.3 65.0 118.8 81.6 65.8 59.9
Toccoa Falls Coll 7 IIB PR 60.3 50.6 46.6 51.2 82.4 74.6 66.6 72.5 41.7 30.8 33.3 0.0 2.1 2.0 2.5 11 6 13 0 2 3 12 0 59.4 50.4 45.2 — 51.1 48.1
U Georgia 6 I PU 130.0 96.1 90.1 52.9 72.8 102.9 164.8 125.3 117.4 71.2 97.5 132.8 29.0 97.2 90.3 0.2 0.0 0.3 0.9 0.9 0.6 547 320 250 35 208 245 222 38 132.3 98.2 93.8 52.1 124.1 93.3 86.0 53.6
U North Georgia 7 IIA PU 79.8 67.6 60.1 43.6 40.7 59.3 100.0 89.6 6.7 0.9 1.6 1.1 74 70 119 0 39 65 121 0 80.4 67.2 59.1 78.6 68.0 61.1
U West Georgia 1 I PU 83.4 65.8 58.9 42.9 48.3 61.9 112.3 90.1 80.0 59.2 67.2 84.3 36.3 99.1 91.7 1.7 0.0 0.6 1.4 0.7 0.4 77 55 40 26 36 66 81 56 85.8 64.7 56.5 41.5 78.5 66.6 60.1 43.6
Wesleyan Coll 1 IIB PR 66.6 57.9 50.5 65.0 59.2 83.1 72.3 63.1 81.2 73.9 24.9 100.0 40.0 4.8 0.0 10 7 6 0 14 8 15 4 67.0 56.4 50.5 66.2 59.2 50.5 65.0
Young Harris Coll IIB PR 71.2 58.0 52.6 40.8 55.3 93.4 76.1 69.0 53.5 72.4 31.1 100.0 100.0 0.0 0.0 0.8 3.5 3.4 2.0 7 16 12 4 4 8 14 8 69.8 58.4 53.9 44.2 73.8 57.3 51.6 39.1
HawaiiChaminade U Honolulu IIA PR 88.9 75.8 67.5 54.6 73.8 110.6 94.2 83.9 67.9 91.8 24.3 100.0 47.8 3.9 2.5 2.5 3.3 14 13 8 0 4 10 18 0 90.6 72.7 65.2 83.2 79.7 68.5
Hawaii CC 13 III PU 99.0 86.3 74.3 61.0 74.6 141.1 124.8 109.5 92.6 109.9 47.3 100.0 93.3 85.7 0.0 3.6 4.4 4.8 5.0 5 6 11 13 8 9 10 23 96.8 86.4 75.4 59.1 100.4 86.2 73.2 62.1
Honolulu CC 13 III PU 96.5 82.7 73.7 60.5 75.2 137.9 120.2 108.9 92.2 110.9 47.4 96.4 100.0 65.6 0.0 3.3 4.0 4.2 5.3 14 10 26 28 14 6 6 17 97.3 83.4 73.7 61.3 95.7 81.4 73.8 59.0
Kapiolani CC 13 III PU 96.8 85.3 74.6 65.7 80.2 138.4 123.6 109.9 98.6 117.1 46.0 96.3 100.0 86.4 0.0 3.4 4.8 4.8 5.8 31 12 23 27 23 21 21 30 96.7 82.9 74.2 64.9 97.0 86.7 75.2 66.5
Kauai CC 13 III PU 95.8 87.6 78.1 62.4 75.1 136.9 126.5 114.4 94.3 110.6 47.2 100.0 100.0 100.0 0.0 4.8 6.6 4.0 4.4 5 2 9 13 2 5 11 10 94.1 — 78.0 62.2 — 89.7 78.3 62.7
Leeward CC 13 III PU 95.8 82.3 72.0 61.9 76.2 136.9 119.7 106.6 93.7 111.9 46.9 100.0 100.0 100.0 0.0 3.7 4.9 3.7 5.1 18 13 21 19 18 12 27 27 97.0 82.8 73.8 64.8 94.5 81.7 70.6 59.9
U Hawaii Hilo 13 IIA PU 104.9 93.0 82.6 62.7 90.6 148.4 133.3 120.1 94.7 130.3 43.7 100.0 94.0 2.4 0.0 3.8 4.8 4.3 5.3 36 43 21 7 33 24 20 22 106.5 90.3 85.0 62.2 103.1 97.9 79.9 62.8
U Hawaii Manoa 13 I PU 142.0 101.2 88.6 66.5 110.4 194.4 143.8 127.7 99.7 155.0 40.4 99.0 94.5 0.4 0.0 5.0 4.7 5.4 3.8 281 159 119 40 136 150 130 72 147.5 103.3 92.0 64.8 130.6 98.9 85.5 67.5
U Hawaii Maui Coll 13 III PU 99.8 86.7 74.7 62.9 76.3 142.0 125.3 110.1 94.9 112.1 46.9 100.0 95.5 95.5 0.0 3.6 4.4 9.6 4.8 3 7 15 11 7 15 7 21 92.8 83.1 75.3 61.0 102.8 88.3 73.6 63.9
U Hawaii-West Oahu 13 IIB PU 105.0 91.7 77.7 67.9 86.7 148.6 131.7 113.9 101.6 125.3 44.6 100.0 78.6 0.0 0.0 3.9 5.1 4.3 4.0 15 11 14 5 11 3 22 7 102.8 93.0 81.2 69.8 108.0 86.7 75.5 66.6
Windward CC 13 III PU 99.7 79.2 72.8 61.4 77.1 141.9 116.4 107.7 93.3 113.3 47.0 100.0 100.0 88.9 0.0 3.8 6.0 5.5 5.0 11 5 4 10 4 2 5 10 100.5 79.6 75.7 62.2 97.3 — 70.4 60.6
IdahoBoise St U 7 IIA PU 95.8 79.9 73.5 55.0 47.5 75.2 128.1 109.1 101.3 79.1 70.2 103.4 37.5 98.8 88.7 0.9 0.0 4.3 8.4 4.7 105 106 110 3 61 97 115 2 97.8 82.6 80.1 52.6 92.2 77.0 67.1 —
Coll Idaho IIB PI 80.2 66.3 56.7 49.8 65.3 99.9 84.5 70.0 64.5 82.1 25.8 100.0 100.0 0.0 0.0 1.8 1.9 3.3 2.3 15 11 8 8 8 9 11 5 81.5 64.9 57.5 50.0 77.6 68.0 56.1 49.6
Idaho St U 7 I PU 88.2 72.7 67.5 47.4 43.2 68.2 119.2 100.8 94.8 72.1 65.6 95.7 40.2 98.5 93.8 0.0 0.0 2.7 4.2 4.3 2.9 95 44 55 35 34 52 56 20 90.9 74.1 71.8 49.3 80.5 71.5 63.2 44.2
Lewis-Clark St Coll 7 IIB PU 67.8 59.4 49.8 46.4 55.8 93.6 83.5 71.9 67.7 79.1 41.8 78.1 81.0 4.4 0.0 4.6 5.4 3.3 3.0 26 15 30 11 15 27 38 14 67.1 58.7 49.3 45.6 69.0 59.8 50.2 47.0
IllinoisAugustana Coll 1 IIB PR 90.3 70.1 63.6 47.4 50.7 69.3 118.0 89.2 81.3 58.7 72.0 89.2 28.6 100.0 100.0 2.7 0.0 2.1 2.3 4.1 1.3 34 27 13 18 27 19 24 26 90.3 70.1 65.5 47.7 90.3 70.0 62.6 47.1
Aurora U 1 I PI 94.6 72.1 64.6 72.0 119.2 90.9 80.5 90.2 25.4 83.3 80.0 0.0 1.8 3.4 2.9 13 18 34 0 11 22 40 0 95.4 73.7 64.7 93.6 70.8 64.4
Bradley U 5 IIA PI 110.5 82.0 71.3 58.7 50.6 — 81.4 135.2 101.0 88.1 73.0 66.5 — 100.4 23.3 98.8 99.0 10.8 0.0 5.7 4.7 3.8 4.2 69 55 53 19 14 45 58 19 112.0 85.3 73.1 62.1 103.0 78.1 69.6 55.3
DePaul U 7 I PR 133.8 97.9 84.9 73.2 98.3 170.7 127.6 106.8 92.6 126.1 28.2 99.5 98.9 1.4 0.0 2.5 3.2 4.2 2.7 125 189 64 107 78 168 77 99 141.0 101.1 93.3 78.8 122.1 94.3 77.9 67.2
Dominican U IIA PR 88.2 70.2 65.6 — 67.1 74.1 114.8 95.8 85.4 — 88.7 98.1 32.4 100.0 83.0 23.3 0.0 1.1 0.3 0.8 22 18 12 1 26 29 18 0 92.5 72.4 66.2 — 84.6 68.7 65.2
Elmhurst Coll IIA PR 84.9 70.9 65.7 — 54.1 — 73.6 109.2 93.8 85.8 — 67.1 — 95.6 29.8 100.0 80.5 2.6 0.0 1.3 3.8 2.2 25 16 9 0 29 25 30 1 87.7 72.7 62.9 82.6 69.8 66.5 —
Governors St U IIA PU 104.9 85.2 71.3 — 68.0 59.7 78.5 100.0 85.5 0.0 0.0 1.0 0.9 1.1 14 32 16 0 14 37 42 1 96.8 89.0 77.6 113.0 81.9 68.9 —
Illinois Coll IIB PR 78.8 67.0 55.4 44.1 63.8 102.5 81.1 68.8 53.4 79.8 25.2 100.0 100.0 0.0 0.0 1.9 1.8 3.4 2.6 11 9 12 4 8 8 10 4 79.9 68.8 56.9 49.5 77.3 65.0 53.6 38.7
Illinois Institute Technology 7 I PI 148.2 109.4 88.7 63.9 83.6 117.1 179.0 137.0 108.9 81.2 103.0 143.4 22.4 81.9 75.9 1.3 0.0 2.8 3.2 3.1 1.6 134 81 52 4 32 31 26 5 151.0 107.9 91.5 76.4 136.6 113.2 83.1 53.9
Illinois St U 7 I PU 99.0 80.1 76.6 45.8 77.3 131.3 109.3 102.4 66.6 104.9 35.6 100.0 96.1 59.7 4.9 5.6 2.6 154 131 80 0 88 126 116 0 103.1 81.4 80.7 91.9 78.6 73.7
Illinois Wesleyan U IIB PI 89.6 70.3 61.5 — 74.7 127.6 99.0 83.0 — 104.8 40.2 97.9 97.7 2.7 0.0 2.5 3.1 0.6 33 20 18 1 15 24 19 0 90.2 71.4 58.0 — 88.4 69.3 64.8
Knox Coll 7 IIB PI 85.7 64.3 53.1 51.4 67.3 107.4 86.3 66.4 61.6 86.2 28.2 97.1 100.0 3.3 0.0 1.3 1.7 3.5 0.8 22 24 16 5 13 17 14 1 85.5 64.6 53.5 50.8 86.0 64.0 52.7 —
Lake Forest Coll IIB PI 102.4 76.8 65.6 59.7 75.5 — 77.9 135.1 99.6 86.2 71.1 94.6 — 101.2 29.9 100.0 100.0 0.0 0.0 2.4 2.8 3.9 18 15 13 2 6 16 20 4 103.4 74.1 67.9 — 99.6 79.3 64.2 62.6
Lewis U IIA PR 106.6 88.1 72.0 62.2 83.8 140.5 117.7 96.5 89.5 112.1 33.7 94.6 46.8 0.0 0.0 1.8 3.5 4.4 8.3 35 30 47 6 21 32 56 9 108.6 89.1 71.7 62.4 103.4 87.1 72.2 62.1
Lincoln Christian U 7 IIA PR 54.6 52.2 45.9 53.2 68.0 65.9 59.0 66.7 25.4 0.0 0.0 0.0 0.6 2.1 3.0 17 5 2 0 4 3 1 0 54.9 53.1 — 53.2 50.7 —
Loyola U Chicago I PR 153.0 103.2 90.5 76.7 101.7 198.9 135.9 117.7 101.4 133.3 31.1 98.4 97.9 4.9 0.0 2.8 3.3 3.2 4.8 123 102 61 136 60 91 61 196 156.9 105.0 95.5 74.9 144.9 101.1 85.5 78.0
MacMurray Coll 7 IIB PR 63.5 54.0 51.8 50.3 54.2 77.7 68.3 65.1 62.5 67.8 25.0 100.0 100.0 0.0 0.0 0.0 0.0 2.5 3 3 7 2 4 3 14 1 62.7 52.0 51.0 — 64.1 56.0 52.2 —
Millikin U IIB PR 76.9 63.4 56.7 55.3 39.9 62.1 95.3 81.1 73.1 75.3 53.8 79.8 28.7 100.0 90.9 0.0 0.0 2.9 2.7 3.6 2.6 22 22 20 10 11 22 26 18 78.1 63.7 56.0 58.6 74.4 63.0 57.2 53.5
Monmouth Coll IIB PR 73.9 62.3 53.5 45.5 61.1 97.7 90.5 71.7 57.8 82.6 35.1 100.0 77.8 0.0 1.0 1.8 2.9 14 13 15 0 15 5 18 0 78.1 61.2 51.6 70.0 65.0 55.0
North Central Coll IIA PR 96.4 76.7 65.5 — 77.5 124.1 98.7 84.1 — 99.5 28.5 84.1 73.9 0.0 0.0 0.5 3.3 2.2 30 22 24 2 14 24 39 0 97.5 76.8 67.4 — 94.1 76.7 64.3
Northern Illinois U 7 I PU 99.4 78.6 76.2 45.5 57.9 76.7 131.1 107.3 104.5 69.5 83.7 105.1 37.1 97.6 97.0 2.5 0.0 0.7 3.0 1.8 15.4 141 133 69 63 67 130 93 101 101.7 76.9 79.3 48.9 94.6 80.5 73.8 43.5
Northwestern U I PI 215.2 138.4 117.2 176.1 271.2 180.9 154.9 225.0 27.8 90.0 77.8 0.0 2.1 3.2 5.3 475 200 120 0 172 120 105 0 221.2 143.8 123.1 198.6 129.3 110.5
Roosevelt U 7 IIA PI 100.9 75.8 72.6 50.9 — 78.0 125.2 98.3 92.4 67.7 99.5 27.6 100.0 95.2 10.2 29 42 29 0 15 42 20 0 110.5 80.1 73.9 82.5 71.5 70.7
Saint Anthony Coll Nursing 7 IIB PR — — 72.1 57.3 70.6 0.0 0.0 0.0 0.0 4.3 3.4 1 0 1 0 0 1 15 4 — — — 73.0 57.3
Saint Francis Medical Center Coll Nursing 7 IIB PR 93.0 66.3 68.0 61.9 69.3 119.8 87.9 86.4 81.9 89.6 29.2 0.0 0.0 0.0 0.0 2.5 3.4 4.3 3.4 0 0 2 1 4 6 16 6 — — 93.0 66.3 66.9 62.2
Saint Xavier U IIA PR 79.4 66.8 68.5 — 55.3 53.8 65.6 102.4 89.2 88.5 — 70.5 72.3 85.8 30.7 100.0 97.8 0.0 0.0 0.0 2.4 4.3 11 20 9 0 12 26 19 1 77.6 65.3 77.1 81.0 67.9 64.3 —
© 2019 American Association of University Professors

APPENDIX I APPENDIX I
NAME NOTES
(1) (2) (3) (4) (5) (6) (7) (8) (9)
CAT. CTRL
AVG. SALARY ($1000s) AVG. COMPENSATION ($1000s) BEN. as %
of SAL.
PCT. TENURED PCT. INCR. (CONT. FAC.) F-T FAC. MEN F-T FAC. WOMEN AVG. SAL. MEN AVG. SAL. WOMEN
PR AO AI IN LE NR AR PR AO AI IN LE NR AR PR AO AI IN PR AO AI IN PR AO AI IN PR AO AI IN PR AO AI IN PR AO AI IN
Illinois (continued)Southern Illinois U-Edwardsville 5 IIA PU 90.3 78.5 66.3 45.3 — 71.6 121.4 107.6 93.8 70.6 — 100.1 39.8 98.7 91.7 0.8 0.0 3.6 4.0 4.3 2.1 97 93 56 44 59 87 70 86 93.5 79.7 68.6 45.4 85.0 77.1 64.4 45.2
Trinity Christian Coll 7 IIB PR 72.7 68.4 48.0 60.5 92.4 85.2 59.7 75.9 25.5 91.3 40.0 0.0 2.9 6.7 3.5 17 7 7 0 6 8 25 0 72.8 63.4 56.1 72.3 72.9 45.7
U Chicago 7 I PI 241.9 132.3 128.5 66.4 71.0 167.2 288.9 168.6 163.7 92.9 98.0 206.1 23.2 95.9 84.3 0.0 0.0 479 138 160 45 135 85 85 34 249.7 138.1 136.2 67.3 214.1 122.9 113.9 65.3
U Illinois Chicago 7 I PU 153.0 107.9 92.2 60.0 53.7 110.2 193.4 141.5 123.5 86.4 79.0 144.2 30.8 94.6 80.6 0.3 0.0 1.1 1.5 1.4 2.7 231 199 193 2 123 203 194 11 155.7 111.8 95.6 — 148.0 104.0 88.9 61.4
U Illinois Springfield 7 IIA PU 108.0 73.4 69.9 50.2 — 71.9 141.7 101.8 97.7 75.0 — 100.0 39.2 100.0 96.0 0.0 0.0 8.7 9.2 8.8 4.9 13 53 23 16 3 47 28 12 104.4 78.5 75.8 48.9 123.6 67.6 65.1 51.8
U Illinois Urbana-Champaign 7 I PU 156.1 106.6 97.9 59.3 68.6 119.3 196.8 140.0 130.0 85.5 96.3 154.6 29.6 97.5 95.7 0.2 0.0 3.6 5.1 4.4 4.0 632 289 288 35 211 198 235 37 159.8 110.8 102.3 61.5 144.8 100.4 92.4 57.2
U St Francis IIA PR 92.3 73.3 67.6 56.6 72.7 120.5 96.7 88.0 74.5 95.2 30.9 0.0 4.8 74.2 0.0 2.6 2.9 2.8 2.1 14 9 6 6 10 12 25 14 93.9 73.7 62.5 60.8 90.0 73.1 68.8 54.9
Western Illinois U 7 IIA PU 102.0 81.9 63.7 49.1 — 79.6 134.9 110.3 88.7 70.9 — 107.7 35.4 100.0 99.3 2.0 1.2 5.2 6.1 2.6 3.0 121 79 45 25 53 58 53 60 102.8 83.2 65.1 45.8 100.4 80.3 62.5 50.5
Wheaton Coll 7 IIA PR 100.4 84.2 69.5 64.2 84.1 136.3 117.3 91.6 82.3 114.4 36.0 95.5 81.8 0.0 0.0 3.2 3.6 3.9 4.3 48 58 29 8 18 30 22 9 102.2 85.9 71.0 67.2 95.7 80.8 67.5 61.7
IndianaBall St U 7 I PU 95.5 76.8 62.1 38.2 52.1 42.9 70.1 128.4 104.0 81.4 52.6 71.3 55.9 93.9 33.9 96.9 90.2 4.8 0.0 1.7 2.3 2.4 2.0 149 119 197 6 75 106 196 12 100.5 79.8 62.7 42.7 85.6 73.4 61.4 35.9
Bethel Coll-Indiana IIA PR 63.2 54.9 46.5 51.4 80.6 74.5 68.1 71.8 39.7 100.0 100.0 3.0 0.4 0.7 1.7 4 16 15 0 2 10 18 0 64.4 54.9 47.2 — 54.8 45.9
Butler U 7 IIA PI 102.2 88.2 82.1 56.0 84.2 136.5 118.7 101.4 74.1 110.8 31.7 99.0 85.8 1.3 0.0 6.5 6.7 6.5 6.1 62 53 37 31 37 60 39 43 106.1 88.4 90.8 57.9 95.7 88.0 73.9 54.5
Calumet Coll Saint Joseph IIA PR 60.0 59.6 57.9 48.4 56.2 72.4 73.1 70.5 58.1 68.3 21.5 100.0 100.0 10.0 0.0 0.0 1.1 -0.4 0.0 4 3 6 3 0 4 4 4 60.0 63.0 57.2 51.6 57.0 58.9 46.0
DePauw U IIB PI 101.3 80.3 68.9 88.9 138.6 106.0 92.5 120.2 35.3 99.1 92.3 4.4 0.8 2.3 1.2 66 24 22 0 42 28 23 0 102.4 80.0 69.9 99.5 80.6 67.9
Earlham Coll IIB PR 87.3 74.6 58.3 — 42.3 69.4 117.5 97.5 76.5 — 45.8 91.3 31.5 100.0 96.7 25.0 0.0 7.9 8.1 3.5 16 15 22 0 10 15 22 1 87.4 79.0 59.1 87.2 70.2 57.5 —
Franklin Coll IIB PR 77.3 62.4 58.9 42.6 36.5 60.5 99.3 83.0 74.4 52.7 50.0 78.0 28.9 100.0 100.0 0.0 0.0 1.4 1.9 2.3 1.0 12 10 16 2 3 10 12 5 77.2 62.2 59.8 — 77.5 62.7 57.8 41.9
Goshen Coll IIB PR 69.0 54.4 46.9 — 60.9 96.2 71.4 60.5 — 82.8 35.9 84.4 5.3 0.0 0.0 2.0 4.5 7.1 17 7 3 1 15 12 5 0 68.9 55.6 48.2 — 69.0 53.7 46.2
Hanover Coll IIB PR 78.8 65.2 60.6 48.9 70.2 108.2 95.1 78.4 53.5 95.4 36.0 100.0 87.5 0.0 0.0 2.4 0.3 15.5 27 12 9 4 16 4 8 2 79.2 65.7 65.5 52.0 78.0 63.9 55.0 —
Huntington U IIB PR 66.7 57.9 54.5 48.7 — 58.6 90.8 80.8 78.2 69.0 — 81.8 39.7 89.5 57.9 0.0 0.0 2.6 3.2 2.6 7.0 13 10 11 3 6 9 9 2 63.7 57.2 53.4 48.5 73.0 58.8 55.8 —
Indiana Institute Technology 1 IIA PI 79.6 71.1 62.3 — 45.6 66.8 105.0 93.4 82.8 — 64.9 88.4 32.3 100.0 84.4 0.0 0.0 4.5 5.2 5.4 5 15 11 0 1 17 14 1 82.4 71.1 67.5 — 71.2 58.2 —
Indiana St U 7 I PU 100.7 78.8 66.9 50.9 43.4 74.2 131.4 103.8 87.0 68.6 50.9 97.3 31.1 100.0 96.3 8.1 0.0 2.4 2.8 3.3 1.5 83 53 56 56 40 56 55 51 103.8 82.3 66.5 49.9 94.3 75.5 67.3 52.0
Indiana U-Bloomington 7 I PU 142.1 98.3 104.6 65.5 108.5 173.4 121.3 127.4 83.3 133.4 22.9 90.6 77.8 0.0 1.8 3.3 3.6 502 284 199 0 187 226 138 0 147.3 102.4 112.2 128.3 93.0 93.6
Indiana U-East 7 IIB PU 93.6 75.9 66.4 55.8 69.6 120.5 96.9 84.4 71.0 88.7 27.5 100.0 51.9 0.0 3.1 5.0 5.0 5 12 13 0 3 15 28 0 100.4 72.8 62.0 82.4 78.3 68.5
Indiana U-Kokomo 7 IIA PU 93.5 70.8 61.2 52.6 63.8 122.0 90.5 78.2 69.0 82.3 29.0 100.0 50.0 0.0 2.8 3.7 3.9 8 12 16 0 3 12 29 0 97.5 69.5 60.7 82.9 72.2 61.5
Indiana U-Northwest 7 IIA PU 93.9 70.6 63.3 53.4 71.1 117.4 90.3 79.5 68.6 89.9 26.3 100.0 65.3 0.0 2.1 2.6 2.6 20 26 18 0 12 23 38 0 101.0 70.8 64.4 82.1 70.3 62.8
Indiana U-Purdue U-Fort Wayne 7 IIA PU 87.3 73.0 64.6 53.2 52.0 70.5 115.7 99.3 87.9 74.2 73.7 95.8 35.8 98.6 98.4 3.0 22.2 0.3 0.6 1.2 2.4 54 69 37 4 19 52 30 5 90.1 72.3 66.3 57.5 79.1 73.9 62.3 49.7
Indiana U-Purdue U-Indianapolis 7 I PU 123.4 88.9 78.7 57.1 86.9 151.7 110.7 98.0 73.5 108.4 24.7 87.7 72.0 0.3 2.8 3.0 3.7 162 183 114 0 81 163 178 0 128.1 92.1 85.9 114.0 85.2 74.0
Indiana U-South Bend 7 IIA PU 75.4 66.2 67.7 47.3 64.2 96.4 85.0 86.9 63.0 82.9 29.0 98.0 84.0 0.0 1.1 2.0 3.4 29 51 19 0 20 30 26 0 78.3 67.1 73.6 71.2 64.6 63.4
Indiana U-Southeast 7 IIA PU 87.1 74.6 64.9 — 53.4 70.3 111.7 94.1 82.0 69.3 89.4 27.2 95.4 82.5 0.0 0.0 1.5 2.0 2.6 24 30 14 0 19 27 25 2 88.9 75.5 70.8 84.9 73.6 61.7 —
Ivy Tech CC III PU 68.2 56.0 51.2 46.5 38.2 52.8 89.5 74.6 67.1 56.2 47.9 68.6 30.0 0.0 0.0 0.0 0.0 41 107 287 82 59 224 364 146 66.6 56.1 51.0 46.3 69.4 55.9 51.4 46.6
Manchester U IIB PR 73.7 71.0 77.7 53.8 73.1 98.8 94.7 96.9 58.8 94.3 29.1 90.5 84.2 0.0 0.0 1.2 0.3 4.5 11 23 17 3 10 15 22 3 73.0 73.1 72.6 57.9 74.5 67.8 81.6 49.6
Purdue U-Main Campus 7 I PU 146.1 104.3 91.9 56.5 61.2 113.8 181.3 135.5 120.4 74.4 82.8 144.9 27.4 95.1 86.6 0.2 0.0 2.9 3.8 3.8 3.3 702 336 345 9 195 192 290 8 148.0 106.5 96.2 67.0 139.0 100.4 86.8 44.8
Purdue U-Northwest 7 IIA PU 101.5 79.3 71.6 49.8 53.1 76.9 132.7 106.7 96.9 67.5 73.7 103.1 34.0 100.0 96.4 1.0 0.0 2.2 3.0 2.7 4.0 56 58 44 12 27 52 54 21 104.1 79.0 75.8 54.9 96.1 79.8 68.1 47.0
Rose-Hulman Institute Technology 7 IIB PI 119.9 96.5 80.5 101.7 168.2 135.3 112.9 142.6 40.3 98.6 93.1 0.0 2.0 2.3 2.8 60 45 28 0 10 13 18 0 120.4 96.8 80.9 116.6 95.5 79.9
Saint Mary’s Coll IIB PR 85.9 70.4 60.7 49.8 50.8 66.2 113.5 93.6 81.5 66.0 66.4 88.0 32.9 93.3 95.6 5.6 0.0 0.1 1.1 0.4 4.0 9 14 11 8 21 31 25 23 87.0 71.0 61.0 48.6 85.5 70.1 60.6 50.2
Taylor U 1 IIB PR 68.4 58.6 52.1 37.3 58.7 98.3 86.5 74.8 58.8 85.1 45.1 95.8 61.8 6.7 0.0 1.3 2.2 1.7 3.3 37 24 25 3 11 10 20 5 68.5 58.5 52.7 39.3 68.2 58.9 51.4 36.1
U Evansville IIB PR 84.0 76.7 65.5 44.9 — 73.5 109.4 100.3 83.0 56.9 — 94.9 29.1 100.0 94.8 6.2 0.0 0.1 2.5 0.8 5.0 35 31 26 2 10 27 39 2 87.0 81.1 63.5 — 73.3 71.8 66.8 —
U Indianapolis 7 IIA PR 89.3 76.0 64.8 39.9 68.2 114.6 97.9 85.1 60.1 89.6 31.4 95.1 85.7 0.0 0.0 2.2 3.0 3.0 1.9 20 36 47 18 21 41 93 17 90.7 76.7 68.7 36.1 88.0 75.5 62.7 43.9
U Notre Dame I PR 185.7 124.4 110.0 72.1 129.2 236.9 164.7 142.7 96.6 167.8 29.9 100.0 95.7 0.0 3.2 4.1 4.0 347 179 128 0 71 97 70 0 189.6 124.8 113.3 166.7 123.7 103.9
Valparaiso U IIA PR 92.9 74.4 60.3 69.0 49.6 69.6 121.0 96.9 78.5 89.9 64.6 90.7 30.2 95.0 93.3 1.1 37.5 1.9 2.3 3.3 44 53 48 3 16 51 40 5 94.4 80.9 62.5 64.5 88.8 67.7 57.6 71.8
Wabash Coll IIB PI 102.0 82.1 69.4 53.2 83.2 137.2 109.7 92.9 74.0 111.7 34.2 100.0 97.2 0.0 0.0 3.6 4.5 6.0 17 22 7 3 5 14 9 2 102.5 83.4 68.1 54.7 100.4 80.0 70.4 —
IowaAllen Coll 2 IIB PI 82.3 66.8 58.6 — 66.6 102.6 83.5 75.1 — 84.2 26.4 0.0 0.0 0.0 0.0 2.2 2.3 3.3 0 0 2 0 11 9 17 2 — 82.3 66.8 58.6 —
Buena Vista U IIA PR 74.6 61.8 59.9 49.1 62.6 81.8 85.0 14.3 0.0 8 9 12 6 14 11 16 7 74.1 62.2 58.2 47.7 74.9 61.5 61.2 50.3
Central Coll IIB PR 78.2 64.5 56.6 56.4 66.2 96.7 81.3 67.8 68.3 81.8 23.5 97.0 100.0 0.0 1.9 4.2 3.6 21 15 10 0 12 16 8 0 78.2 66.0 56.8 78.3 63.0 56.2
Clarke U IIB PR 62.0 57.3 51.8 52.7 55.8 95.5 89.5 2.9 0.0 7 8 9 1 15 11 26 7 63.3 58.5 53.4 — 61.5 56.4 51.3 52.7
Cornell Coll IIB PR 78.1 60.6 56.1 50.2 68.8 113.0 86.2 75.9 69.3 98.2 42.6 100.0 100.0 0.0 0.0 2.4 4.9 2.5 22 4 5 5 21 10 7 2 81.6 63.3 58.2 53.9 74.4 59.6 54.7 —
Drake U IIA PI 108.0 81.5 69.0 — 87.3 124.3 95.3 81.1 — 101.5 16.2 93.5 75.0 0.0 0.0 2.6 1.4 0.6 64 65 35 1 44 71 41 1 111.3 82.2 69.7 — 103.2 80.8 68.5 —
Faith Baptist Bible Coll Theol Sem IIB PR 47.6 46.6 42.6 45.8 62.5 60.5 57.6 60.5 32.2 0.0 0.0 0.0 2.0 2.0 2.0 9 2 3 0 0 1 3 0 47.6 — 42.3 — 43.0
Graceland U-Lamoni IIA PR 72.8 62.9 52.1 40.2 63.1 59.5 100.0 100.0 0.0 0.0 2.6 3.8 5.2 2.6 10 9 16 1 9 7 18 3 71.7 60.0 49.4 — 74.2 66.7 54.5 40.4
Grinnell Coll IIB PI 141.3 105.9 87.3 67.6 — 109.6 186.4 142.9 114.6 84.4 — 145.1 32.4 100.0 98.3 0.0 0.0 4.7 4.8 7.2 2.7 26 36 19 5 25 23 17 10 147.8 106.1 88.2 65.2 134.5 105.7 86.3 68.8
Iowa St U 7 I PU 132.8 99.9 87.1 63.5 102.3 170.3 131.8 116.7 88.7 134.5 31.5 98.6 93.7 0.2 2.6 2.7 2.7 399 254 232 0 111 158 181 0 135.3 104.3 88.8 123.8 92.6 84.8
Kirkwood CC 17 III PU 76.4 66.4 61.0 56.6 67.6 103.2 91.5 85.1 80.0 92.9 37.4 0.0 0.0 0.0 0.0 3.7 3.9 4.1 4.0 60 23 27 30 47 19 29 17 76.4 65.8 60.0 56.9 76.5 67.2 61.8 56.2
Loras Coll IIB PR 67.7 57.1 54.9 37.5 58.5 76.8 66.9 61.4 43.5 67.2 14.8 91.7 92.7 0.0 0.0 1.7 2.5 2.5 16.0 22 20 13 1 2 21 9 3 67.9 58.1 53.8 — — 56.2 56.4 30.0
Luther Coll IIB PR 80.1 67.3 58.0 53.4 68.3 106.6 90.1 76.0 70.7 90.8 33.0 100.0 95.1 0.0 0.0 0.0 0.3 0.6 0.0 33 30 10 7 18 31 18 10 80.0 68.2 58.2 55.4 80.4 66.5 57.9 52.0
Morningside Coll IIA PR 75.8 62.5 56.4 55.7 63.0 100.9 81.8 74.7 75.6 83.2 32.2 82.4 82.1 0.0 0.0 3.6 3.8 3.8 11 14 13 2 6 14 15 1 73.9 62.6 60.6 — 79.2 62.4 52.7 —
Northwestern Coll IIB PR 70.7 59.7 52.5 48.3 — 60.6 88.1 75.7 67.8 59.8 — 76.3 25.8 100.0 81.8 5.9 0.0 3.7 4.8 4.5 1.5 22 12 7 5 8 10 10 6 71.1 59.0 50.9 49.7 69.5 60.6 53.6 47.2
© 2019 American Association of University Professors
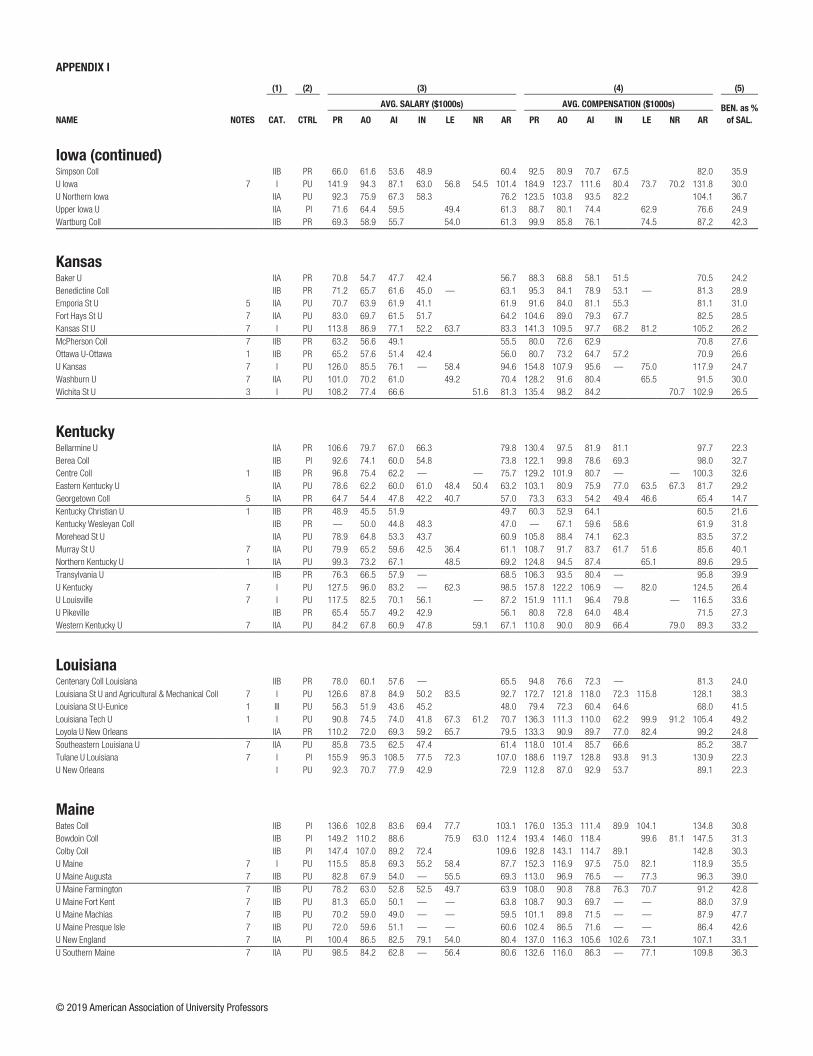
APPENDIX I APPENDIX I
NAME NOTES
(1) (2) (3) (4) (5) (6) (7) (8) (9)
CAT. CTRL
AVG. SALARY ($1000s) AVG. COMPENSATION ($1000s) BEN. as %
of SAL.
PCT. TENURED PCT. INCR. (CONT. FAC.) F-T FAC. MEN F-T FAC. WOMEN AVG. SAL. MEN AVG. SAL. WOMEN
PR AO AI IN LE NR AR PR AO AI IN LE NR AR PR AO AI IN PR AO AI IN PR AO AI IN PR AO AI IN PR AO AI IN PR AO AI IN
Iowa (continued)Simpson Coll IIB PR 66.0 61.6 53.6 48.9 60.4 92.5 80.9 70.7 67.5 82.0 35.9 100.0 89.5 0.0 0.0 1.7 3.4 4.0 24 10 14 2 16 9 16 2 65.8 59.5 53.1 — 66.3 64.0 53.9 —
U Iowa 7 I PU 141.9 94.3 87.1 63.0 56.8 54.5 101.4 184.9 123.7 111.6 80.4 73.7 70.2 131.8 30.0 92.4 78.3 0.0 0.0 0.5 0.9 1.6 4.5 338 234 136 37 136 199 142 32 147.7 98.7 93.2 69.9 127.5 89.2 81.3 55.0
U Northern Iowa IIA PU 92.3 75.9 67.3 58.3 76.2 123.5 103.8 93.5 82.2 104.1 36.7 100.0 95.2 5.7 22.5 1.0 1.9 2.1 1.3 99 90 49 27 52 77 56 53 94.3 78.1 69.7 58.4 88.4 73.2 65.1 58.3
Upper Iowa U IIA PI 71.6 64.4 59.5 49.4 61.3 88.7 80.1 74.4 62.9 76.6 24.9 100.0 100.0 0.0 1.8 2.6 7.0 9 8 8 0 2 15 22 0 74.0 68.5 58.3 — 62.3 59.9
Wartburg Coll IIB PR 69.3 58.9 55.7 54.0 61.3 99.9 85.8 76.1 74.5 87.2 42.3 96.9 95.7 5.9 1.3 1.7 2.2 19 10 10 0 13 13 7 0 71.3 59.4 54.2 66.5 58.6 57.8
KansasBaker U IIA PR 70.8 54.7 47.7 42.4 56.7 88.3 68.8 58.1 51.5 70.5 24.2 90.5 79.2 38.1 0.0 0.0 1.1 1.6 0.0 11 11 10 1 10 13 11 3 74.2 55.1 49.2 — 67.0 54.4 46.3 43.2
Benedictine Coll IIB PR 71.2 65.7 61.6 45.0 — 63.1 95.3 84.1 78.9 53.1 — 81.3 28.9 100.0 62.5 21.6 0.0 0.0 0.8 0.8 0.7 19 23 33 4 4 9 18 5 71.0 65.7 63.0 52.1 72.3 65.8 58.9 39.3
Emporia St U 5 IIA PU 70.7 63.9 61.9 41.1 61.9 91.6 84.0 81.1 55.3 81.1 31.0 100.0 93.4 2.6 0.0 0.5 1.4 0.7 0.7 44 30 36 12 27 31 40 24 73.0 65.3 66.1 37.9 67.1 62.4 58.1 42.7
Fort Hays St U 7 IIA PU 83.0 69.7 61.5 51.7 64.2 104.6 89.0 79.3 67.7 82.5 28.5 98.2 94.9 9.3 0.0 2.7 3.6 4.4 4.0 38 45 63 31 17 33 45 63 84.9 70.6 62.3 52.6 78.9 68.5 60.4 51.2
Kansas St U 7 I PU 113.8 86.9 77.1 52.2 63.7 83.3 141.3 109.5 97.7 68.2 81.2 105.2 26.2 98.8 92.7 0.4 0.0 0.5 1.5 2.4 0.5 195 159 146 76 62 115 106 126 116.5 90.2 82.3 56.9 105.4 82.5 69.8 49.3
McPherson Coll 7 IIB PR 63.2 56.6 49.1 55.5 80.0 72.6 62.9 70.8 27.6 100.0 66.7 0.0 2.1 19.4 15.9 9 10 8 0 5 2 11 0 62.6 56.3 50.6 64.3 — 48.1
Ottawa U-Ottawa 1 IIB PR 65.2 57.6 51.4 42.4 56.0 80.7 73.2 64.7 57.2 70.9 26.6 87.5 28.6 0.0 0.0 0.0 0.0 0.0 0.0 4 8 4 1 4 6 5 3 66.5 57.3 47.5 — 64.0 58.0 54.6 43.5
U Kansas 7 I PU 126.0 85.5 76.1 — 58.4 94.6 154.8 107.9 95.6 — 75.0 117.9 24.7 95.0 91.6 0.0 0.0 0.9 2.1 2.4 317 207 158 0 122 162 104 1 129.6 90.1 79.4 116.5 79.6 71.2 —
Washburn U 7 IIA PU 101.0 70.2 61.0 49.2 70.4 128.2 91.6 80.4 65.5 91.5 30.0 98.6 90.6 13.4 -0.4 1.2 3.8 37 27 25 0 36 26 42 0 105.1 69.9 58.8 96.8 70.5 62.3
Wichita St U 3 I PU 108.2 77.4 66.6 51.6 81.3 135.4 98.2 84.2 70.7 102.9 26.5 100.0 98.5 0.9 3.6 3.7 0.7 88 81 63 0 27 54 55 0 111.7 82.4 70.6 96.8 69.8 62.0
KentuckyBellarmine U IIA PR 106.6 79.7 67.0 66.3 79.8 130.4 97.5 81.9 81.1 97.7 22.3 92.3 75.9 1.8 0.0 26 25 19 7 13 33 38 15 108.5 77.6 65.6 68.5 102.7 81.3 67.6 65.2
Berea Coll IIB PI 92.6 74.1 60.0 54.8 73.8 122.1 99.8 78.6 69.3 98.0 32.7 91.2 75.9 0.0 0.0 2.0 2.2 3.2 2.0 16 34 17 2 18 24 22 4 93.3 74.3 59.6 — 92.0 73.7 60.4 53.9
Centre Coll 1 IIB PR 96.8 75.4 62.2 — — 75.7 129.2 101.9 80.7 — — 100.3 32.6 100.0 100.0 0.0 0.0 0.3 1.5 2.9 2.8 24 19 23 2 10 17 29 0 97.7 78.2 62.9 — 94.8 72.3 61.6
Eastern Kentucky U IIA PU 78.6 62.2 60.0 61.0 48.4 50.4 63.2 103.1 80.9 75.9 77.0 63.5 67.3 81.7 29.2 99.2 84.2 12.9 0.0 -0.1 0.3 0.1 0.6 80 93 92 8 48 91 109 15 79.9 63.4 60.9 72.3 76.4 60.9 59.2 54.9
Georgetown Coll 5 IIA PR 64.7 54.4 47.8 42.2 40.7 57.0 73.3 63.3 54.2 49.4 46.6 65.4 14.7 100.0 96.3 25.0 0.0 1.5 7.4 1.5 3.3 21 14 1 3 15 13 3 5 63.7 54.0 — 46.8 66.0 54.9 48.6 39.4
Kentucky Christian U 1 IIB PR 48.9 45.5 51.9 49.7 60.3 52.9 64.1 60.5 21.6 0.0 0.0 0.0 0.0 0.1 0.0 2 6 5 0 2 2 12 0 — 45.8 41.7 — — 56.2
Kentucky Wesleyan Coll IIB PR — 50.0 44.8 48.3 47.0 — 67.1 59.6 58.6 61.9 31.8 100.0 90.9 0.0 0.0 0.9 1.9 1 6 11 2 1 5 13 3 — 50.0 46.8 — — 50.0 43.1 52.2
Morehead St U IIA PU 78.9 64.8 53.3 43.7 60.9 105.8 88.4 74.1 62.3 83.5 37.2 100.0 97.1 1.8 3.7 2.0 0.4 0.7 0.7 43 55 31 37 34 50 24 44 81.2 68.6 53.4 42.5 76.1 60.7 53.1 44.6
Murray St U 7 IIA PU 79.9 65.2 59.6 42.5 36.4 61.1 108.7 91.7 83.7 61.7 51.6 85.6 40.1 98.8 96.3 4.5 0.0 0.7 0.3 0.9 0.5 58 67 70 42 27 41 85 50 84.1 67.3 60.8 45.0 71.0 61.7 58.6 40.4
Northern Kentucky U 1 IIA PU 99.3 73.2 67.1 48.5 69.2 124.8 94.5 87.4 65.1 89.6 29.5 100.0 100.0 0.0 -0.6 2.0 2.7 75 68 33 0 44 77 49 0 102.3 74.5 71.4 94.1 72.1 64.2
Transylvania U IIB PR 76.3 66.5 57.9 — 68.5 106.3 93.5 80.4 — 95.8 39.9 100.0 96.4 0.0 0.0 2.1 3.1 2.6 23 12 7 1 12 16 11 1 76.8 68.3 57.3 — 75.4 65.1 58.4 —
U Kentucky 7 I PU 127.5 96.0 83.2 — 62.3 98.5 157.8 122.2 106.9 — 82.0 124.5 26.4 100.0 95.9 0.0 0.0 1.2 3.2 2.8 2.2 343 243 160 0 116 171 169 2 130.1 98.4 88.8 119.6 92.6 77.9 —
U Louisville 7 I PU 117.5 82.5 70.1 56.1 — 87.2 151.9 111.1 96.4 79.8 — 116.5 33.6 96.3 85.4 1.9 1.3 -0.6 1.1 1.3 2.6 208 150 157 27 88 131 157 49 121.1 85.9 70.6 57.5 109.1 78.6 69.5 55.3
U Pikeville IIB PR 65.4 55.7 49.2 42.9 56.1 80.8 72.8 64.0 48.4 71.5 27.3 0.0 0.0 0.0 0.0 -3.9 -0.4 6.7 21.5 13 6 6 2 5 15 11 1 64.4 57.5 47.6 — 67.8 54.9 50.1 —
Western Kentucky U 7 IIA PU 84.2 67.8 60.9 47.8 59.1 67.1 110.8 90.0 80.9 66.4 79.0 89.3 33.2 98.9 94.8 5.3 0.0 0.0 0.9 1.7 1.4 123 108 69 38 65 121 81 78 86.7 69.9 64.7 47.4 79.5 65.9 57.6 48.0
LouisianaCentenary Coll Louisiana IIB PR 78.0 60.1 57.6 — 65.5 94.8 76.6 72.3 — 81.3 24.0 95.7 100.0 4.8 0.0 2.3 3.7 4.0 15 5 13 1 8 5 8 1 76.3 61.5 58.2 — 81.3 58.7 56.6 —
Louisiana St U and Agricultural & Mechanical Coll 7 I PU 126.6 87.8 84.9 50.2 83.5 92.7 172.7 121.8 118.0 72.3 115.8 128.1 38.3 97.7 93.6 0.0 0.0 3.8 4.5 4.3 3.8 342 176 181 103 96 105 144 149 130.8 89.5 87.2 53.0 111.8 84.9 82.0 48.3
Louisiana St U-Eunice 1 III PU 56.3 51.9 43.6 45.2 48.0 79.4 72.3 60.4 64.6 68.0 41.5 100.0 90.0 12.5 0.0 2.7 2.6 2.9 3.6 8 5 4 8 4 5 4 28 58.4 53.2 41.8 39.2 52.0 50.5 45.4 46.9
Louisiana Tech U 1 I PU 90.8 74.5 74.0 41.8 67.3 61.2 70.7 136.3 111.3 110.0 62.2 99.9 91.2 105.4 49.2 90.9 96.3 7.7 0.0 4.1 5.3 4.6 4.2 43 73 57 26 23 35 47 39 97.9 77.6 78.0 43.2 77.5 67.9 69.2 40.9
Loyola U New Orleans IIA PR 110.2 72.0 69.3 59.2 65.7 79.5 133.3 90.9 89.7 77.0 82.4 99.2 24.8 100.0 81.4 5.7 0.0 0.4 -0.2 0.8 43 38 17 13 22 21 18 12 113.7 73.0 75.8 52.6 103.4 70.3 63.2 66.4
Southeastern Louisiana U 7 IIA PU 85.8 73.5 62.5 47.4 61.4 118.0 101.4 85.7 66.6 85.2 38.7 100.0 97.8 8.8 0.0 3.9 4.2 3.3 3.9 65 44 28 75 26 46 40 165 88.6 77.6 62.0 45.2 78.6 69.6 62.9 48.4
Tulane U Louisiana 7 I PI 155.9 95.3 108.5 77.5 72.3 107.0 188.6 119.7 128.8 93.8 91.3 130.9 22.3 97.0 89.1 0.0 0.0 1.5 3.3 5.7 4.5 144 95 80 34 57 80 80 19 159.6 96.5 122.9 77.7 146.4 93.9 94.1 77.2
U New Orleans I PU 92.3 70.7 77.9 42.9 72.9 112.8 87.0 92.9 53.7 89.1 22.3 95.5 97.6 0.0 0.0 4.0 4.3 6.5 7.4 70 53 36 26 19 30 15 34 93.2 70.5 80.5 35.7 89.0 71.0 71.7 48.3
MaineBates Coll IIB PI 136.6 102.8 83.6 69.4 77.7 103.1 176.0 135.3 111.4 89.9 104.1 134.8 30.8 100.0 98.0 0.0 0.0 3.4 3.6 5.1 1.3 29 21 18 12 27 30 12 7 141.7 105.3 85.0 68.8 131.1 101.1 81.4 70.4
Bowdoin Coll IIB PI 149.2 110.2 88.6 75.9 63.0 112.4 193.4 146.0 118.4 99.6 81.1 147.5 31.3 100.0 100.0 0.0 3.4 4.0 5.6 36 24 14 0 29 36 30 0 147.2 110.8 90.8 151.6 109.8 87.7
Colby Coll IIB PI 147.4 107.0 89.2 72.4 109.6 192.8 143.1 114.7 89.1 142.8 30.3 96.8 94.2 0.0 0.0 3.0 5.1 3.8 1.8 38 29 23 14 25 23 36 14 151.2 105.3 90.8 73.1 141.6 109.1 88.2 71.7
U Maine 7 I PU 115.5 85.8 69.3 55.2 58.4 87.7 152.3 116.9 97.5 75.0 82.1 118.9 35.5 99.4 95.0 0.0 0.0 3.0 2.3 1.4 1.5 121 73 59 1 44 47 58 6 118.0 89.6 70.8 — 108.6 80.1 67.8 53.2
U Maine Augusta 7 IIB PU 82.8 67.9 54.0 — 55.5 69.3 113.0 96.9 76.5 — 77.3 96.3 39.0 100.0 100.0 0.0 0.0 4.3 1.4 1.8 17 8 6 0 13 13 10 2 82.3 66.1 55.6 83.6 69.0 53.0 —
U Maine Farmington 7 IIB PU 78.2 63.0 52.8 52.5 49.7 63.9 108.0 90.8 78.8 76.3 70.7 91.2 42.8 100.0 97.3 0.0 0.0 2.4 1.7 1.0 0.8 18 15 8 1 14 22 15 5 78.6 65.6 53.4 — 77.7 61.2 52.5 52.7
U Maine Fort Kent 7 IIB PU 81.3 65.0 50.1 — — 63.8 108.7 90.3 69.7 — — 88.0 37.9 100.0 100.0 0.0 0.0 1.4 2.1 0.9 3 7 3 0 4 2 2 2 72.6 67.0 49.3 87.9 — — —
U Maine Machias 7 IIB PU 70.2 59.0 49.0 — — 59.5 101.1 89.8 71.5 — — 87.9 47.7 100.0 100.0 20.0 0.0 1.5 2.8 1.2 5 6 3 1 4 4 2 0 69.3 60.6 49.1 — 71.3 56.5 —
U Maine Presque Isle 7 IIB PU 72.0 59.6 51.1 — — 60.6 102.4 86.5 71.6 — — 86.4 42.6 100.0 92.3 0.0 0.0 1.5 2.7 1.5 7 6 2 1 3 7 6 0 71.9 58.4 — — 72.2 60.6 51.7
U New England 7 IIA PI 100.4 86.5 82.5 79.1 54.0 80.4 137.0 116.3 105.6 102.6 73.1 107.1 33.1 78.6 66.7 0.0 0.0 1.6 1.8 2.6 23 37 17 1 19 38 52 3 103.7 89.8 90.9 — 96.5 83.3 79.7 72.3
U Southern Maine 7 IIA PU 98.5 84.2 62.8 — 56.4 80.6 132.6 116.0 86.3 — 77.1 109.8 36.3 93.7 94.1 2.5 0.0 3.4 2.4 2.8 50 35 13 0 29 33 27 2 101.1 88.0 63.2 93.9 80.2 62.6 —
© 2019 American Association of University Professors

APPENDIX I APPENDIX I
NAME NOTES
(1) (2) (3) (4) (5) (6) (7) (8) (9)
CAT. CTRL
AVG. SALARY ($1000s) AVG. COMPENSATION ($1000s) BEN. as %
of SAL.
PCT. TENURED PCT. INCR. (CONT. FAC.) F-T FAC. MEN F-T FAC. WOMEN AVG. SAL. MEN AVG. SAL. WOMEN
PR AO AI IN LE NR AR PR AO AI IN LE NR AR PR AO AI IN PR AO AI IN PR AO AI IN PR AO AI IN PR AO AI IN PR AO AI IN
MarylandBowie St U IIA PU 96.8 79.3 71.7 63.1 64.3 77.7 126.5 102.8 91.7 80.1 81.7 100.2 29.0 93.0 39.6 35.1 88.2 30 24 32 1 13 29 45 16 97.5 79.8 72.9 — 95.1 79.0 70.8 63.7
CC Baltimore County 12 III PU 96.4 81.8 69.6 56.9 75.8 127.3 110.7 95.7 76.7 102.8 35.6 32.8 9.9 1.1 0.0 2.2 3.1 3.3 3.6 22 50 69 25 39 81 113 22 99.8 82.1 70.0 56.5 94.5 81.5 69.3 57.4
Cecil Coll 7 III PU 81.1 64.2 56.9 — 66.5 105.7 83.5 78.3 — 88.3 32.7 5.9 0.0 0.0 0.0 2.8 2.6 4.1 3 7 10 1 14 6 10 0 84.7 60.0 58.5 — 80.3 69.0 55.2
Coppin St U 1 IIA PU 88.9 75.6 72.6 — 63.0 75.7 114.4 99.6 94.2 — 66.2 97.5 28.9 100.0 92.5 54.9 0.0 1.4 0.8 -0.4 11 20 19 1 10 20 32 0 89.5 77.7 74.0 — 88.2 73.4 71.8
Frostburg St U 7 IIA PU 92.9 73.1 71.6 33.4 71.4 127.3 101.8 102.9 43.3 99.1 38.8 100.0 87.3 12.5 -0.4 1.0 28.7 48 43 27 0 16 36 29 0 94.4 72.2 73.8 88.6 74.3 69.5
Hood Coll IIA PI 82.8 65.2 61.7 — 68.7 97.4 77.3 73.6 — 81.3 18.3 100.0 88.2 0.0 0.0 3.2 1.4 3.3 12 13 15 1 17 21 25 1 82.5 70.7 61.3 — 83.1 61.9 62.0 —
Howard CC III PU 91.7 76.5 67.6 62.9 77.9 120.5 101.1 92.7 87.4 104.1 33.6 0.0 0.0 0.0 0.0 6.1 2.9 2.7 2.7 25 23 21 5 41 39 32 13 91.0 77.6 66.4 61.2 92.0 75.8 68.4 63.5
Johns Hopkins U 7 I PI 191.1 135.6 112.2 75.7 77.6 109.9 132.1 239.7 172.4 141.3 97.1 100.4 139.7 167.0 26.4 98.4 46.1 0.0 0.0 3.6 6.0 5.5 6.1 317 109 144 14 123 71 137 13 195.2 139.2 120.6 82.8 180.5 130.1 103.3 68.0
Loyola U Maryland IIA PR 127.3 95.3 81.7 57.6 57.9 89.7 164.2 124.2 107.0 78.3 75.1 116.6 30.1 100.0 100.0 4.9 0.0 1.9 2.8 1.9 0.0 54 52 24 5 27 61 37 15 128.2 102.9 79.6 50.2 125.6 88.9 83.1 60.0
McDaniel Coll IIA PI 82.1 67.5 57.6 53.7 68.7 111.7 90.7 75.4 70.0 92.0 34.1 97.3 100.0 0.0 2.0 2.0 2.0 21 18 10 0 16 20 16 0 82.6 67.3 58.3 81.3 67.7 57.2
Montgomery Coll III PU 97.1 80.7 74.6 72.6 89.8 119.2 99.2 93.1 85.1 110.4 23.0 0.6 0.0 0.0 0.0 2.4 3.1 2.7 3.0 142 49 12 0 174 89 51 5 97.4 81.2 75.9 96.9 80.4 74.4 72.6
Mount St Mary’s U IIA PR 94.7 74.8 65.4 — 56.5 72.7 116.3 93.7 84.1 — 68.3 91.2 25.4 88.5 82.9 0.0 0.0 13 28 30 1 13 13 15 1 97.3 74.7 66.0 — 92.2 75.1 64.2 —
Notre Dame Maryland U IIA PR 83.4 74.7 69.6 — 73.6 100.3 85.4 78.4 — 84.4 14.6 82.4 36.4 0.0 0.0 0.0 0.0 0.9 8 8 15 0 9 25 42 1 86.1 88.5 65.6 80.9 70.3 71.1 —
Salisbury U IIA PU 95.7 79.2 72.3 71.5 52.7 75.2 127.7 108.8 101.3 103.0 62.2 100.8 34.0 99.0 99.2 8.9 0.0 0.2 0.7 0.8 0.4 65 67 60 1 35 59 52 7 96.3 81.1 74.6 — 94.6 77.0 69.8 73.8
St Mary’s Coll Maryland 7 IIB PU 92.9 74.0 62.2 — 77.7 121.7 98.6 85.0 — 103.4 33.1 100.0 100.0 0.0 25 22 13 0 23 15 23 0 98.3 74.6 63.2 87.0 73.1 61.7
Towson U IIA PU 95.5 82.1 70.2 65.1 45.9 73.5 129.5 111.3 95.1 88.0 62.0 99.6 35.5 98.2 90.6 1.8 0.0 0.0 1.0 1.5 0.9 120 104 81 3 104 120 145 10 98.4 84.9 69.2 67.9 92.1 79.6 70.8 64.3
U Maryland Eastern Shore 7 IIA PU 92.5 80.2 74.4 — 55.9 76.3 112.8 98.4 91.5 — 69.9 93.8 22.9 95.1 88.4 13.5 0.0 0.1 -0.7 0.2 25 48 27 1 16 21 25 1 97.6 81.0 72.3 — 84.6 78.1 76.7 —
U Maryland, Baltimore 7 I PU 162.3 111.4 93.7 74.9 88.8 — 112.0 196.5 141.2 121.8 102.1 114.3 — 141.8 26.7 82.2 50.0 1.4 0.0 1.6 0.6 0.9 0.8 66 36 32 13 41 66 113 55 166.4 121.2 102.8 77.7 155.7 106.1 91.1 74.2
U Maryland-Baltimore County 7 I PU 122.8 89.8 78.3 60.8 59.2 90.0 152.7 115.2 102.5 82.2 80.3 115.4 28.3 93.5 92.3 0.9 0.0 -0.9 0.2 1.7 0.0 109 73 52 2 44 82 56 11 127.3 94.0 81.1 — 111.6 86.0 75.7 62.8
U Maryland-Coll Park 7 I PU 161.6 108.8 96.4 68.2 64.4 118.6 196.1 137.2 123.3 92.3 86.3 147.9 24.7 96.1 91.7 0.3 0.0 1.2 3.2 3.1 0.0 546 256 152 4 178 178 169 4 165.2 112.3 102.7 71.9 150.6 103.7 90.7 64.4
Washington Coll IIB PI 94.2 78.9 66.7 50.8 71.9 118.0 100.9 85.8 63.9 91.8 27.6 100.0 100.0 0.0 0.0 0.0 0.0 0.3 1.1 5 24 18 7 8 20 23 11 101.8 80.8 67.8 43.7 89.4 76.5 65.8 55.3
MassachusettsAmherst Coll 1 IIB PI 153.2 109.1 92.0 87.0 78.2 114.5 195.5 140.8 114.1 113.6 97.8 145.5 27.1 100.0 93.6 0.0 3.4 4.7 4.3 49 18 24 0 37 13 30 0 156.8 107.9 91.8 148.5 110.8 92.1
Assumption Coll 1 IIA PR 97.7 79.7 66.2 58.1 76.6 137.2 107.1 86.0 74.9 102.8 34.1 100.0 98.4 20.9 0.0 2.0 0.3 1.7 3.3 15 34 22 5 7 29 21 6 96.4 81.2 66.4 60.2 100.5 77.9 66.0 56.3
Babson Coll IIA PI 199.7 149.1 133.0 112.6 152.7 241.2 184.9 158.9 136.7 185.6 21.6 98.3 96.4 0.0 3.4 3.2 2.6 38 35 16 0 20 20 21 0 206.4 155.5 127.2 186.9 137.8 137.5
Bentley U IIA PI 175.6 130.2 119.7 85.3 126.6 191.7 142.2 130.7 93.2 138.3 9.2 97.6 97.0 0.0 3.2 2.6 2.1 53 34 26 0 29 33 22 0 180.4 131.6 122.0 166.8 128.7 117.0
Boston Coll I PR 188.5 120.0 114.6 77.9 113.6 137.9 237.3 158.5 143.1 97.1 144.1 175.9 27.5 91.1 73.8 0.0 0.0 2.8 3.4 4.0 5.4 192 156 109 32 90 138 83 32 193.3 124.5 120.6 73.5 178.2 115.0 106.6 82.4
Boston U 7 I PI 190.5 131.3 108.7 111.5 77.3 129.3 240.6 172.1 139.2 143.9 100.7 166.0 28.4 83.2 74.0 0.0 0.0 3.4 4.1 5.4 3.9 393 195 165 138 114 162 147 183 191.8 133.3 111.8 124.7 185.9 128.9 105.3 101.5
Brandeis U 7 I PI 158.3 112.7 93.1 — 73.5 122.2 195.7 142.9 114.0 — 94.6 152.2 24.6 82.8 79.1 0.0 0.0 4.8 5.3 5.2 98 54 26 2 53 37 47 0 161.5 113.7 95.6 — 152.4 111.2 91.7
Clark U I PI 122.8 92.0 81.6 67.9 76.9 95.9 98.5 93.7 0.0 0.0 0.1 1.4 2.5 4.1 41 34 16 7 24 29 20 14 124.1 91.6 83.6 68.1 120.7 92.5 80.1 67.8
Coll Our Lady of the Elms 1 IIA PR 71.8 63.0 58.7 — 44.2 60.3 86.4 80.3 73.3 — 58.6 75.9 25.8 100.0 75.0 5.0 0.0 1.5 1.7 2.8 4 9 6 0 5 15 14 2 75.9 65.5 53.9 68.5 61.5 60.7 —
Coll of the Holy Cross IIB PR 135.8 100.7 86.1 62.1 104.6 181.7 136.0 112.0 79.9 139.4 33.3 100.0 100.0 0.0 0.0 3.4 3.6 4.6 5.6 57 46 26 15 38 47 14 29 138.9 100.6 85.7 65.2 131.1 100.8 86.9 60.4
Curry Coll IIA PI 104.7 88.5 72.3 65.2 90.5 137.7 120.3 90.0 81.0 118.2 30.7 0.0 0.0 0.0 0.0 18 7 10 0 37 21 26 3 106.2 89.7 72.7 104.0 88.1 72.2 65.2
Emerson Coll IIA PI 121.8 100.1 77.8 — 78.3 91.8 155.5 129.4 97.3 — 101.3 117.4 27.8 100.0 100.0 1.8 0.0 3.9 5.9 8.1 24 33 26 1 15 19 30 0 121.8 101.8 78.7 — 121.6 97.2 77.1
Emmanuel Coll IIA PR 115.5 84.5 76.9 — 60.9 81.4 150.3 110.7 100.3 — 77.6 105.8 29.9 92.9 93.6 0.0 0.0 2.5 4.2 7.9 2 17 9 1 12 14 17 1 — 84.0 76.6 — 112.8 85.1 77.1 —
Endicott Coll IIA PI 102.9 87.5 78.5 — 88.5 129.9 110.9 99.3 — 112.0 26.5 0.0 0.0 0.0 0.0 3.9 4.5 3.5 19 10 13 1 17 19 30 1 104.0 87.3 80.7 — 101.7 87.6 77.6 —
Gordon Coll IIA PR 83.3 68.5 58.1 49.4 72.9 113.0 91.6 76.6 66.0 98.0 34.5 90.7 52.6 0.0 0.0 0.8 0.7 0.0 34 9 8 0 9 10 12 3 83.1 67.7 60.1 84.0 69.2 56.7 49.4
Hampshire Coll IIB PI 108.1 79.3 65.4 59.6 68.1 83.4 138.1 100.0 84.0 73.5 92.3 106.3 27.5 0.0 0.0 0.0 0.0 0.7 4.5 2.6 2.8 22 11 7 3 12 14 9 11 110.4 81.8 65.1 63.3 103.9 77.3 65.7 58.6
Harvard U I PI 244.3 144.6 134.6 68.4 120.3 191.8 305.5 178.5 163.4 84.3 149.9 238.8 24.5 89.1 0.0 0.0 0.0 3.4 4.0 3.7 3.5 734 89 121 61 285 55 96 88 249.6 147.1 136.7 66.9 230.8 140.4 132.0 69.4
Holyoke CC III PU 71.4 57.2 54.6 52.9 65.1 92.7 74.3 71.0 68.9 84.5 29.9 100.0 56.3 0.0 0.0 0.8 1.3 1.6 0.4 31 3 6 4 45 13 11 11 72.4 58.4 52.4 48.7 70.8 56.9 55.8 54.5
Lasell Coll IIA PI 94.5 79.3 65.9 55.5 74.6 104.0 87.2 72.5 61.1 82.0 10.0 0.0 0.0 0.0 0.0 1.7 1.7 2.3 1 17 10 2 8 22 23 2 — 79.5 65.7 — 93.9 79.0 65.9 —
Lesley U 1 IIA PI 100.8 79.2 66.9 59.9 79.6 129.0 101.3 85.6 76.7 101.8 27.9 0.0 0.0 0.0 0.0 2.8 5.3 3.9 3.5 15 22 10 2 21 36 33 8 103.8 81.8 69.0 — 98.7 77.6 66.3 61.7
Massachusetts Coll Art and Design IIB PU 102.3 80.5 65.7 86.6 139.5 109.8 89.6 118.2 36.4 100.0 72.2 0.0 0.0 0.9 0.9 33 5 16 0 25 13 22 0 102.4 80.8 65.6 102.0 80.4 65.7
Massachusetts Institute Technology 7 I PI 232.2 156.9 132.1 71.6 106.9 181.4 287.6 197.9 168.8 96.8 139.4 227.3 25.3 100.0 60.5 0.0 0.0 4.4 8.2 7.3 3.2 517 152 108 43 120 63 56 13 231.3 158.5 132.4 74.2 236.0 152.9 131.6 62.9
Merrimack Coll IIA PR 117.3 91.0 78.6 67.6 88.2 149.3 119.1 98.4 81.9 112.5 27.5 96.8 68.5 0.0 3.1 4.1 4.4 18 36 28 0 13 37 46 0 114.8 93.7 86.0 120.7 88.3 74.1
Mount Holyoke Coll IIB PI 130.7 96.7 79.8 62.4 73.9 97.8 167.0 123.5 99.2 77.2 98.2 124.6 27.3 100.0 100.0 0.0 0.0 4.8 3.5 4.9 4.5 36 17 18 16 38 25 22 14 136.2 98.6 79.9 65.0 125.5 95.4 79.7 59.4
Northeastern U I PI 184.9 124.8 114.2 83.3 79.0 60.8 117.7 229.5 159.2 143.3 109.1 106.0 86.0 150.1 27.5 96.8 90.0 0.6 0.0 2.3 2.8 3.8 4.2 247 154 105 223 95 105 74 260 188.4 126.0 117.5 89.2 176.1 123.1 109.6 78.2
Smith Coll IIA PI 141.3 101.8 86.6 63.6 78.3 112.7 183.6 138.3 114.9 85.7 104.5 148.4 31.7 100.0 98.0 0.0 0.0 2.6 5.6 4.3 2.4 68 21 18 4 68 29 32 8 145.1 102.1 86.5 71.6 137.5 101.6 86.6 59.6
Springfield Coll 1 IIA PI 88.0 76.7 60.5 52.2 71.9 112.1 97.1 78.3 64.8 91.8 27.7 91.4 69.6 2.4 0.0 2.2 2.9 4.0 5.9 30 23 29 6 28 33 53 7 86.4 81.2 61.1 51.7 89.8 73.6 60.1 52.6
Stonehill Coll IIB PR 108.9 84.4 68.8 55.3 42.2 85.8 141.0 110.1 88.8 67.8 54.4 111.2 29.6 98.2 77.1 2.3 0.0 3.5 4.2 4.8 13.3 39 31 18 1 15 30 26 4 112.8 87.1 75.0 — 98.8 81.7 64.5 55.1
Suffolk U IIA PI 130.9 97.1 106.5 73.7 104.6 167.5 127.7 131.1 92.3 133.7 27.8 89.8 87.4 1.4 0.0 1.7 2.4 1.8 0.0 60 66 29 32 48 61 43 33 137.8 97.1 110.7 78.3 122.3 97.1 103.7 69.2
Tufts U 7,23 I PI 155.2 111.1 94.0 76.5 115.7 209.3 148.6 124.9 101.9 155.0 34.0 80.6 65.4 0.0 1.2 4.0 4.2 7.6 170 100 100 0 83 79 116 0 157.0 113.2 96.3 151.6 108.5 92.1
U Massachusetts-Amherst 7,40 I PU 152.3 106.6 91.4 80.0 73.4 110.8 208.8 146.5 125.8 110.0 101.6 152.3 37.5 98.9 97.0 0.3 0.0 0.2 1.3 2.0 3.9 325 169 147 1 134 169 162 4 155.0 109.9 94.9 — 145.5 103.2 88.3 86.1
U Massachusetts-Boston I PU 141.4 109.7 86.8 68.8 97.6 198.2 151.7 119.8 94.1 135.0 38.3 100.0 98.7 0.7 1.0 0.8 0.1 73 122 60 0 43 112 86 0 142.8 112.2 90.7 139.2 107.1 84.1
U Massachusetts-Dartmouth IIA PU 125.8 99.9 84.2 67.7 96.6 170.3 135.2 114.1 91.7 130.8 35.4 99.2 97.0 1.2 0.1 1.5 1.9 73 61 36 0 48 39 46 0 129.7 101.7 89.3 119.8 97.0 80.3
U Massachusetts-Lowell 7 I PU 147.5 111.8 92.3 — 81.4 64.8 104.6 197.6 149.7 123.6 — 108.9 86.8 140.1 33.9 98.0 90.8 0.0 0.0 1.1 1.5 0.9 106 74 88 0 43 78 64 2 148.6 114.7 92.4 144.9 109.0 92.2 —
Wellesley Coll 1 IIB PI 160.4 107.6 90.3 58.2 81.8 113.9 207.7 144.8 115.4 70.9 109.7 149.3 31.0 100.0 100.0 0.0 0.0 3.9 4.6 5.4 7.6 48 28 16 3 48 42 32 9 165.5 106.9 90.2 56.7 155.4 108.1 90.3 58.7
Westfield St U IIA PU 103.2 79.1 68.8 62.6 85.0 141.8 108.9 94.8 85.9 117.0 37.6 98.9 94.1 6.5 0.0 0.1 0.8 1.4 7.1 50 33 26 5 41 35 36 6 106.5 76.4 68.4 64.1 99.1 81.6 69.1 61.4
Wheaton Coll IIB PI 104.8 86.0 72.5 52.5 86.4 137.8 112.7 94.7 67.4 113.1 30.9 96.0 100.0 0.0 0.0 2.2 2.5 2.1 5.3 26 19 10 5 24 20 16 11 107.5 86.7 70.9 51.0 101.9 85.3 73.5 53.2
Williams Coll IIB PI 147.9 106.3 89.0 — 114.3 71.7 118.4 196.5 142.6 116.8 — 145.1 94.5 156.8 32.4 100.0 100.0 0.0 0.0 4.1 5.3 5.1 88 17 36 0 62 14 40 1 154.2 108.1 90.5 139.0 104.2 87.6 —
Worcester St U IIA PU 99.3 80.4 61.8 61.9 78.9 134.5 109.6 83.0 83.8 106.8 35.4 100.0 92.5 10.1 0.0 0.0 0.0 0.0 0.0 26 25 35 3 41 28 34 13 97.5 82.3 60.9 55.9 100.5 78.6 62.8 63.3
© 2019 American Association of University Professors
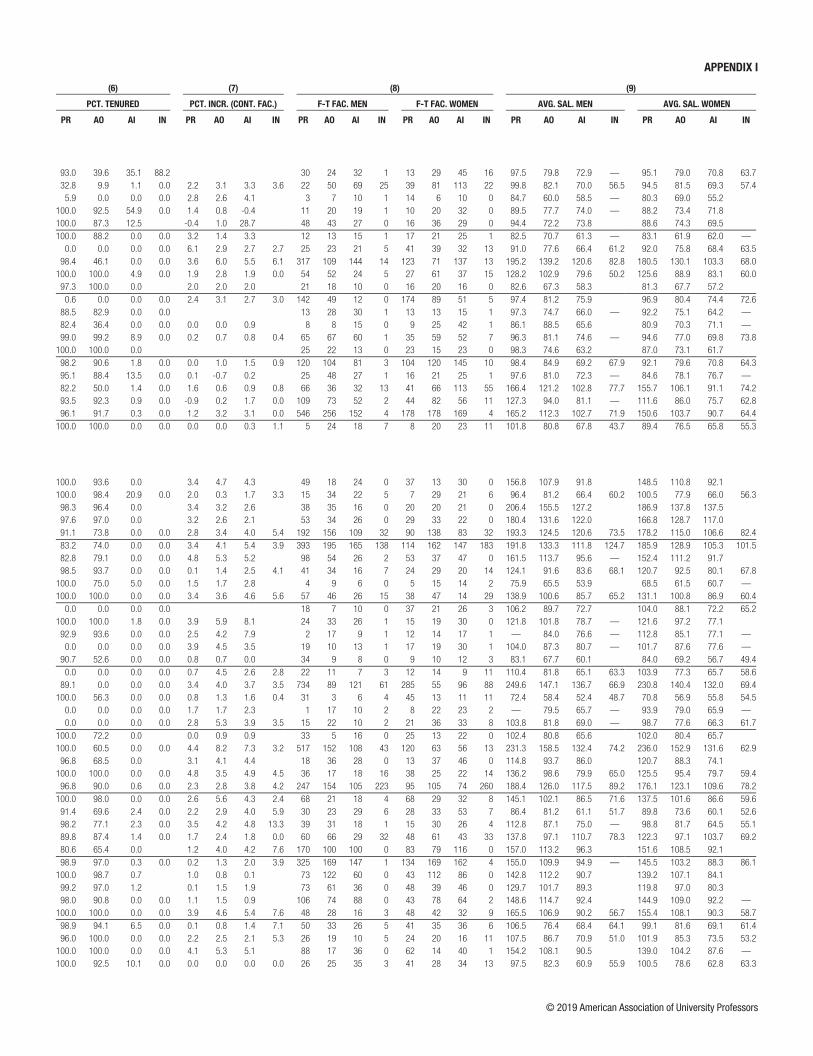
APPENDIX I APPENDIX I
NAME NOTES
(1) (2) (3) (4) (5) (6) (7) (8) (9)
CAT. CTRL
AVG. SALARY ($1000s) AVG. COMPENSATION ($1000s) BEN. as %
of SAL.
PCT. TENURED PCT. INCR. (CONT. FAC.) F-T FAC. MEN F-T FAC. WOMEN AVG. SAL. MEN AVG. SAL. WOMEN
PR AO AI IN LE NR AR PR AO AI IN LE NR AR PR AO AI IN PR AO AI IN PR AO AI IN PR AO AI IN PR AO AI IN PR AO AI IN
MarylandBowie St U IIA PU 96.8 79.3 71.7 63.1 64.3 77.7 126.5 102.8 91.7 80.1 81.7 100.2 29.0 93.0 39.6 35.1 88.2 30 24 32 1 13 29 45 16 97.5 79.8 72.9 — 95.1 79.0 70.8 63.7
CC Baltimore County 12 III PU 96.4 81.8 69.6 56.9 75.8 127.3 110.7 95.7 76.7 102.8 35.6 32.8 9.9 1.1 0.0 2.2 3.1 3.3 3.6 22 50 69 25 39 81 113 22 99.8 82.1 70.0 56.5 94.5 81.5 69.3 57.4
Cecil Coll 7 III PU 81.1 64.2 56.9 — 66.5 105.7 83.5 78.3 — 88.3 32.7 5.9 0.0 0.0 0.0 2.8 2.6 4.1 3 7 10 1 14 6 10 0 84.7 60.0 58.5 — 80.3 69.0 55.2
Coppin St U 1 IIA PU 88.9 75.6 72.6 — 63.0 75.7 114.4 99.6 94.2 — 66.2 97.5 28.9 100.0 92.5 54.9 0.0 1.4 0.8 -0.4 11 20 19 1 10 20 32 0 89.5 77.7 74.0 — 88.2 73.4 71.8
Frostburg St U 7 IIA PU 92.9 73.1 71.6 33.4 71.4 127.3 101.8 102.9 43.3 99.1 38.8 100.0 87.3 12.5 -0.4 1.0 28.7 48 43 27 0 16 36 29 0 94.4 72.2 73.8 88.6 74.3 69.5
Hood Coll IIA PI 82.8 65.2 61.7 — 68.7 97.4 77.3 73.6 — 81.3 18.3 100.0 88.2 0.0 0.0 3.2 1.4 3.3 12 13 15 1 17 21 25 1 82.5 70.7 61.3 — 83.1 61.9 62.0 —
Howard CC III PU 91.7 76.5 67.6 62.9 77.9 120.5 101.1 92.7 87.4 104.1 33.6 0.0 0.0 0.0 0.0 6.1 2.9 2.7 2.7 25 23 21 5 41 39 32 13 91.0 77.6 66.4 61.2 92.0 75.8 68.4 63.5
Johns Hopkins U 7 I PI 191.1 135.6 112.2 75.7 77.6 109.9 132.1 239.7 172.4 141.3 97.1 100.4 139.7 167.0 26.4 98.4 46.1 0.0 0.0 3.6 6.0 5.5 6.1 317 109 144 14 123 71 137 13 195.2 139.2 120.6 82.8 180.5 130.1 103.3 68.0
Loyola U Maryland IIA PR 127.3 95.3 81.7 57.6 57.9 89.7 164.2 124.2 107.0 78.3 75.1 116.6 30.1 100.0 100.0 4.9 0.0 1.9 2.8 1.9 0.0 54 52 24 5 27 61 37 15 128.2 102.9 79.6 50.2 125.6 88.9 83.1 60.0
McDaniel Coll IIA PI 82.1 67.5 57.6 53.7 68.7 111.7 90.7 75.4 70.0 92.0 34.1 97.3 100.0 0.0 2.0 2.0 2.0 21 18 10 0 16 20 16 0 82.6 67.3 58.3 81.3 67.7 57.2
Montgomery Coll III PU 97.1 80.7 74.6 72.6 89.8 119.2 99.2 93.1 85.1 110.4 23.0 0.6 0.0 0.0 0.0 2.4 3.1 2.7 3.0 142 49 12 0 174 89 51 5 97.4 81.2 75.9 96.9 80.4 74.4 72.6
Mount St Mary’s U IIA PR 94.7 74.8 65.4 — 56.5 72.7 116.3 93.7 84.1 — 68.3 91.2 25.4 88.5 82.9 0.0 0.0 13 28 30 1 13 13 15 1 97.3 74.7 66.0 — 92.2 75.1 64.2 —
Notre Dame Maryland U IIA PR 83.4 74.7 69.6 — 73.6 100.3 85.4 78.4 — 84.4 14.6 82.4 36.4 0.0 0.0 0.0 0.0 0.9 8 8 15 0 9 25 42 1 86.1 88.5 65.6 80.9 70.3 71.1 —
Salisbury U IIA PU 95.7 79.2 72.3 71.5 52.7 75.2 127.7 108.8 101.3 103.0 62.2 100.8 34.0 99.0 99.2 8.9 0.0 0.2 0.7 0.8 0.4 65 67 60 1 35 59 52 7 96.3 81.1 74.6 — 94.6 77.0 69.8 73.8
St Mary’s Coll Maryland 7 IIB PU 92.9 74.0 62.2 — 77.7 121.7 98.6 85.0 — 103.4 33.1 100.0 100.0 0.0 25 22 13 0 23 15 23 0 98.3 74.6 63.2 87.0 73.1 61.7
Towson U IIA PU 95.5 82.1 70.2 65.1 45.9 73.5 129.5 111.3 95.1 88.0 62.0 99.6 35.5 98.2 90.6 1.8 0.0 0.0 1.0 1.5 0.9 120 104 81 3 104 120 145 10 98.4 84.9 69.2 67.9 92.1 79.6 70.8 64.3
U Maryland Eastern Shore 7 IIA PU 92.5 80.2 74.4 — 55.9 76.3 112.8 98.4 91.5 — 69.9 93.8 22.9 95.1 88.4 13.5 0.0 0.1 -0.7 0.2 25 48 27 1 16 21 25 1 97.6 81.0 72.3 — 84.6 78.1 76.7 —
U Maryland, Baltimore 7 I PU 162.3 111.4 93.7 74.9 88.8 — 112.0 196.5 141.2 121.8 102.1 114.3 — 141.8 26.7 82.2 50.0 1.4 0.0 1.6 0.6 0.9 0.8 66 36 32 13 41 66 113 55 166.4 121.2 102.8 77.7 155.7 106.1 91.1 74.2
U Maryland-Baltimore County 7 I PU 122.8 89.8 78.3 60.8 59.2 90.0 152.7 115.2 102.5 82.2 80.3 115.4 28.3 93.5 92.3 0.9 0.0 -0.9 0.2 1.7 0.0 109 73 52 2 44 82 56 11 127.3 94.0 81.1 — 111.6 86.0 75.7 62.8
U Maryland-Coll Park 7 I PU 161.6 108.8 96.4 68.2 64.4 118.6 196.1 137.2 123.3 92.3 86.3 147.9 24.7 96.1 91.7 0.3 0.0 1.2 3.2 3.1 0.0 546 256 152 4 178 178 169 4 165.2 112.3 102.7 71.9 150.6 103.7 90.7 64.4
Washington Coll IIB PI 94.2 78.9 66.7 50.8 71.9 118.0 100.9 85.8 63.9 91.8 27.6 100.0 100.0 0.0 0.0 0.0 0.0 0.3 1.1 5 24 18 7 8 20 23 11 101.8 80.8 67.8 43.7 89.4 76.5 65.8 55.3
MassachusettsAmherst Coll 1 IIB PI 153.2 109.1 92.0 87.0 78.2 114.5 195.5 140.8 114.1 113.6 97.8 145.5 27.1 100.0 93.6 0.0 3.4 4.7 4.3 49 18 24 0 37 13 30 0 156.8 107.9 91.8 148.5 110.8 92.1
Assumption Coll 1 IIA PR 97.7 79.7 66.2 58.1 76.6 137.2 107.1 86.0 74.9 102.8 34.1 100.0 98.4 20.9 0.0 2.0 0.3 1.7 3.3 15 34 22 5 7 29 21 6 96.4 81.2 66.4 60.2 100.5 77.9 66.0 56.3
Babson Coll IIA PI 199.7 149.1 133.0 112.6 152.7 241.2 184.9 158.9 136.7 185.6 21.6 98.3 96.4 0.0 3.4 3.2 2.6 38 35 16 0 20 20 21 0 206.4 155.5 127.2 186.9 137.8 137.5
Bentley U IIA PI 175.6 130.2 119.7 85.3 126.6 191.7 142.2 130.7 93.2 138.3 9.2 97.6 97.0 0.0 3.2 2.6 2.1 53 34 26 0 29 33 22 0 180.4 131.6 122.0 166.8 128.7 117.0
Boston Coll I PR 188.5 120.0 114.6 77.9 113.6 137.9 237.3 158.5 143.1 97.1 144.1 175.9 27.5 91.1 73.8 0.0 0.0 2.8 3.4 4.0 5.4 192 156 109 32 90 138 83 32 193.3 124.5 120.6 73.5 178.2 115.0 106.6 82.4
Boston U 7 I PI 190.5 131.3 108.7 111.5 77.3 129.3 240.6 172.1 139.2 143.9 100.7 166.0 28.4 83.2 74.0 0.0 0.0 3.4 4.1 5.4 3.9 393 195 165 138 114 162 147 183 191.8 133.3 111.8 124.7 185.9 128.9 105.3 101.5
Brandeis U 7 I PI 158.3 112.7 93.1 — 73.5 122.2 195.7 142.9 114.0 — 94.6 152.2 24.6 82.8 79.1 0.0 0.0 4.8 5.3 5.2 98 54 26 2 53 37 47 0 161.5 113.7 95.6 — 152.4 111.2 91.7
Clark U I PI 122.8 92.0 81.6 67.9 76.9 95.9 98.5 93.7 0.0 0.0 0.1 1.4 2.5 4.1 41 34 16 7 24 29 20 14 124.1 91.6 83.6 68.1 120.7 92.5 80.1 67.8
Coll Our Lady of the Elms 1 IIA PR 71.8 63.0 58.7 — 44.2 60.3 86.4 80.3 73.3 — 58.6 75.9 25.8 100.0 75.0 5.0 0.0 1.5 1.7 2.8 4 9 6 0 5 15 14 2 75.9 65.5 53.9 68.5 61.5 60.7 —
Coll of the Holy Cross IIB PR 135.8 100.7 86.1 62.1 104.6 181.7 136.0 112.0 79.9 139.4 33.3 100.0 100.0 0.0 0.0 3.4 3.6 4.6 5.6 57 46 26 15 38 47 14 29 138.9 100.6 85.7 65.2 131.1 100.8 86.9 60.4
Curry Coll IIA PI 104.7 88.5 72.3 65.2 90.5 137.7 120.3 90.0 81.0 118.2 30.7 0.0 0.0 0.0 0.0 18 7 10 0 37 21 26 3 106.2 89.7 72.7 104.0 88.1 72.2 65.2
Emerson Coll IIA PI 121.8 100.1 77.8 — 78.3 91.8 155.5 129.4 97.3 — 101.3 117.4 27.8 100.0 100.0 1.8 0.0 3.9 5.9 8.1 24 33 26 1 15 19 30 0 121.8 101.8 78.7 — 121.6 97.2 77.1
Emmanuel Coll IIA PR 115.5 84.5 76.9 — 60.9 81.4 150.3 110.7 100.3 — 77.6 105.8 29.9 92.9 93.6 0.0 0.0 2.5 4.2 7.9 2 17 9 1 12 14 17 1 — 84.0 76.6 — 112.8 85.1 77.1 —
Endicott Coll IIA PI 102.9 87.5 78.5 — 88.5 129.9 110.9 99.3 — 112.0 26.5 0.0 0.0 0.0 0.0 3.9 4.5 3.5 19 10 13 1 17 19 30 1 104.0 87.3 80.7 — 101.7 87.6 77.6 —
Gordon Coll IIA PR 83.3 68.5 58.1 49.4 72.9 113.0 91.6 76.6 66.0 98.0 34.5 90.7 52.6 0.0 0.0 0.8 0.7 0.0 34 9 8 0 9 10 12 3 83.1 67.7 60.1 84.0 69.2 56.7 49.4
Hampshire Coll IIB PI 108.1 79.3 65.4 59.6 68.1 83.4 138.1 100.0 84.0 73.5 92.3 106.3 27.5 0.0 0.0 0.0 0.0 0.7 4.5 2.6 2.8 22 11 7 3 12 14 9 11 110.4 81.8 65.1 63.3 103.9 77.3 65.7 58.6
Harvard U I PI 244.3 144.6 134.6 68.4 120.3 191.8 305.5 178.5 163.4 84.3 149.9 238.8 24.5 89.1 0.0 0.0 0.0 3.4 4.0 3.7 3.5 734 89 121 61 285 55 96 88 249.6 147.1 136.7 66.9 230.8 140.4 132.0 69.4
Holyoke CC III PU 71.4 57.2 54.6 52.9 65.1 92.7 74.3 71.0 68.9 84.5 29.9 100.0 56.3 0.0 0.0 0.8 1.3 1.6 0.4 31 3 6 4 45 13 11 11 72.4 58.4 52.4 48.7 70.8 56.9 55.8 54.5
Lasell Coll IIA PI 94.5 79.3 65.9 55.5 74.6 104.0 87.2 72.5 61.1 82.0 10.0 0.0 0.0 0.0 0.0 1.7 1.7 2.3 1 17 10 2 8 22 23 2 — 79.5 65.7 — 93.9 79.0 65.9 —
Lesley U 1 IIA PI 100.8 79.2 66.9 59.9 79.6 129.0 101.3 85.6 76.7 101.8 27.9 0.0 0.0 0.0 0.0 2.8 5.3 3.9 3.5 15 22 10 2 21 36 33 8 103.8 81.8 69.0 — 98.7 77.6 66.3 61.7
Massachusetts Coll Art and Design IIB PU 102.3 80.5 65.7 86.6 139.5 109.8 89.6 118.2 36.4 100.0 72.2 0.0 0.0 0.9 0.9 33 5 16 0 25 13 22 0 102.4 80.8 65.6 102.0 80.4 65.7
Massachusetts Institute Technology 7 I PI 232.2 156.9 132.1 71.6 106.9 181.4 287.6 197.9 168.8 96.8 139.4 227.3 25.3 100.0 60.5 0.0 0.0 4.4 8.2 7.3 3.2 517 152 108 43 120 63 56 13 231.3 158.5 132.4 74.2 236.0 152.9 131.6 62.9
Merrimack Coll IIA PR 117.3 91.0 78.6 67.6 88.2 149.3 119.1 98.4 81.9 112.5 27.5 96.8 68.5 0.0 3.1 4.1 4.4 18 36 28 0 13 37 46 0 114.8 93.7 86.0 120.7 88.3 74.1
Mount Holyoke Coll IIB PI 130.7 96.7 79.8 62.4 73.9 97.8 167.0 123.5 99.2 77.2 98.2 124.6 27.3 100.0 100.0 0.0 0.0 4.8 3.5 4.9 4.5 36 17 18 16 38 25 22 14 136.2 98.6 79.9 65.0 125.5 95.4 79.7 59.4
Northeastern U I PI 184.9 124.8 114.2 83.3 79.0 60.8 117.7 229.5 159.2 143.3 109.1 106.0 86.0 150.1 27.5 96.8 90.0 0.6 0.0 2.3 2.8 3.8 4.2 247 154 105 223 95 105 74 260 188.4 126.0 117.5 89.2 176.1 123.1 109.6 78.2
Smith Coll IIA PI 141.3 101.8 86.6 63.6 78.3 112.7 183.6 138.3 114.9 85.7 104.5 148.4 31.7 100.0 98.0 0.0 0.0 2.6 5.6 4.3 2.4 68 21 18 4 68 29 32 8 145.1 102.1 86.5 71.6 137.5 101.6 86.6 59.6
Springfield Coll 1 IIA PI 88.0 76.7 60.5 52.2 71.9 112.1 97.1 78.3 64.8 91.8 27.7 91.4 69.6 2.4 0.0 2.2 2.9 4.0 5.9 30 23 29 6 28 33 53 7 86.4 81.2 61.1 51.7 89.8 73.6 60.1 52.6
Stonehill Coll IIB PR 108.9 84.4 68.8 55.3 42.2 85.8 141.0 110.1 88.8 67.8 54.4 111.2 29.6 98.2 77.1 2.3 0.0 3.5 4.2 4.8 13.3 39 31 18 1 15 30 26 4 112.8 87.1 75.0 — 98.8 81.7 64.5 55.1
Suffolk U IIA PI 130.9 97.1 106.5 73.7 104.6 167.5 127.7 131.1 92.3 133.7 27.8 89.8 87.4 1.4 0.0 1.7 2.4 1.8 0.0 60 66 29 32 48 61 43 33 137.8 97.1 110.7 78.3 122.3 97.1 103.7 69.2
Tufts U 7,23 I PI 155.2 111.1 94.0 76.5 115.7 209.3 148.6 124.9 101.9 155.0 34.0 80.6 65.4 0.0 1.2 4.0 4.2 7.6 170 100 100 0 83 79 116 0 157.0 113.2 96.3 151.6 108.5 92.1
U Massachusetts-Amherst 7,40 I PU 152.3 106.6 91.4 80.0 73.4 110.8 208.8 146.5 125.8 110.0 101.6 152.3 37.5 98.9 97.0 0.3 0.0 0.2 1.3 2.0 3.9 325 169 147 1 134 169 162 4 155.0 109.9 94.9 — 145.5 103.2 88.3 86.1
U Massachusetts-Boston I PU 141.4 109.7 86.8 68.8 97.6 198.2 151.7 119.8 94.1 135.0 38.3 100.0 98.7 0.7 1.0 0.8 0.1 73 122 60 0 43 112 86 0 142.8 112.2 90.7 139.2 107.1 84.1
U Massachusetts-Dartmouth IIA PU 125.8 99.9 84.2 67.7 96.6 170.3 135.2 114.1 91.7 130.8 35.4 99.2 97.0 1.2 0.1 1.5 1.9 73 61 36 0 48 39 46 0 129.7 101.7 89.3 119.8 97.0 80.3
U Massachusetts-Lowell 7 I PU 147.5 111.8 92.3 — 81.4 64.8 104.6 197.6 149.7 123.6 — 108.9 86.8 140.1 33.9 98.0 90.8 0.0 0.0 1.1 1.5 0.9 106 74 88 0 43 78 64 2 148.6 114.7 92.4 144.9 109.0 92.2 —
Wellesley Coll 1 IIB PI 160.4 107.6 90.3 58.2 81.8 113.9 207.7 144.8 115.4 70.9 109.7 149.3 31.0 100.0 100.0 0.0 0.0 3.9 4.6 5.4 7.6 48 28 16 3 48 42 32 9 165.5 106.9 90.2 56.7 155.4 108.1 90.3 58.7
Westfield St U IIA PU 103.2 79.1 68.8 62.6 85.0 141.8 108.9 94.8 85.9 117.0 37.6 98.9 94.1 6.5 0.0 0.1 0.8 1.4 7.1 50 33 26 5 41 35 36 6 106.5 76.4 68.4 64.1 99.1 81.6 69.1 61.4
Wheaton Coll IIB PI 104.8 86.0 72.5 52.5 86.4 137.8 112.7 94.7 67.4 113.1 30.9 96.0 100.0 0.0 0.0 2.2 2.5 2.1 5.3 26 19 10 5 24 20 16 11 107.5 86.7 70.9 51.0 101.9 85.3 73.5 53.2
Williams Coll IIB PI 147.9 106.3 89.0 — 114.3 71.7 118.4 196.5 142.6 116.8 — 145.1 94.5 156.8 32.4 100.0 100.0 0.0 0.0 4.1 5.3 5.1 88 17 36 0 62 14 40 1 154.2 108.1 90.5 139.0 104.2 87.6 —
Worcester St U IIA PU 99.3 80.4 61.8 61.9 78.9 134.5 109.6 83.0 83.8 106.8 35.4 100.0 92.5 10.1 0.0 0.0 0.0 0.0 0.0 26 25 35 3 41 28 34 13 97.5 82.3 60.9 55.9 100.5 78.6 62.8 63.3
© 2019 American Association of University Professors
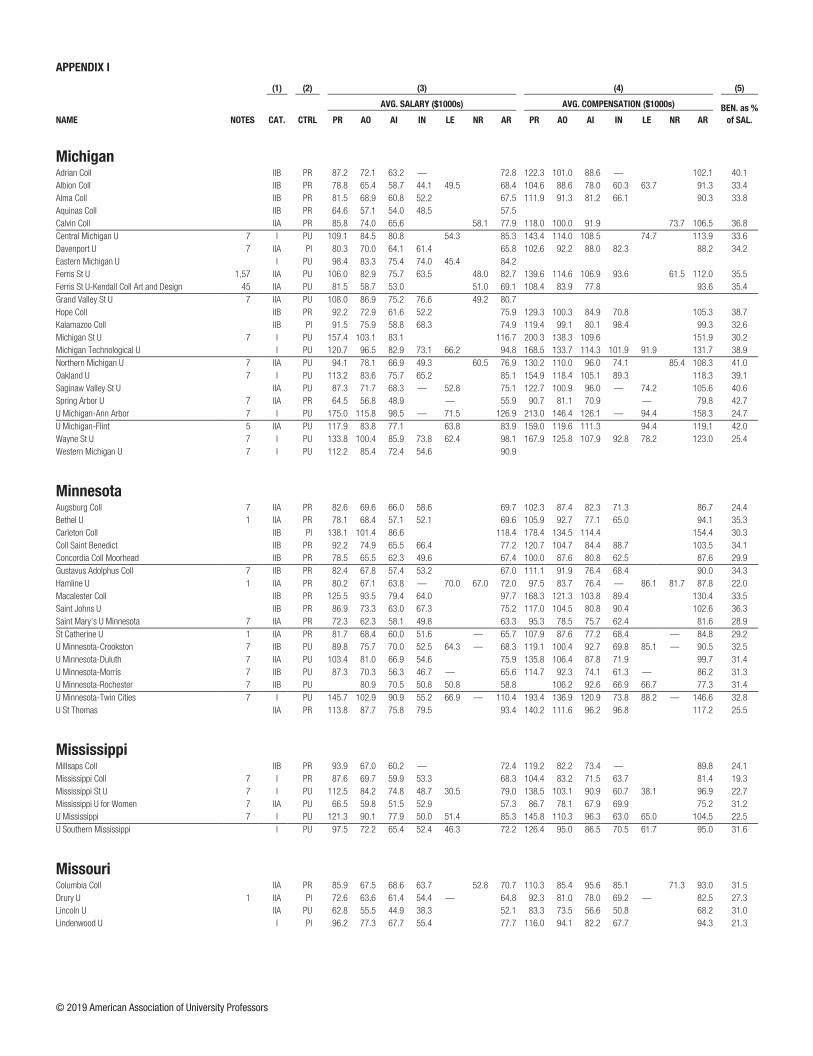
APPENDIX I APPENDIX I
NAME NOTES
(1) (2) (3) (4) (5) (6) (7) (8) (9)
CAT. CTRL
AVG. SALARY ($1000s) AVG. COMPENSATION ($1000s) BEN. as %
of SAL.
PCT. TENURED PCT. INCR. (CONT. FAC.) F-T FAC. MEN F-T FAC. WOMEN AVG. SAL. MEN AVG. SAL. WOMEN
PR AO AI IN LE NR AR PR AO AI IN LE NR AR PR AO AI IN PR AO AI IN PR AO AI IN PR AO AI IN PR AO AI IN PR AO AI IN
MichiganAdrian Coll IIB PR 87.2 72.1 63.2 — 72.8 122.3 101.0 88.6 — 102.1 40.1 100.0 93.1 2.7 0.0 18 14 15 1 11 15 22 1 88.0 72.6 62.1 — 86.1 71.6 63.9 —
Albion Coll IIB PR 78.8 65.4 58.7 44.1 49.5 68.4 104.6 88.6 78.0 60.3 63.7 91.3 33.4 100.0 95.5 0.0 0.0 0.2 1.0 1.2 0.4 35 12 8 5 23 10 16 5 77.3 67.3 63.1 42.7 81.0 63.2 56.5 45.4
Alma Coll IIB PR 81.5 68.9 60.8 52.2 67.5 111.9 91.3 81.2 66.1 90.3 33.8 100.0 59.1 7.1 0.0 19 12 12 10 12 10 16 8 85.0 70.6 60.5 49.6 75.9 66.9 61.0 55.3
Aquinas Coll IIB PR 64.6 57.1 54.0 48.5 57.5 100.0 90.6 38.1 0.0 2.4 2.8 3.6 2.0 16 17 12 4 9 15 9 6 64.1 57.8 56.2 53.2 65.6 56.3 51.1 45.4
Calvin Coll IIA PR 85.8 74.0 65.6 58.1 77.9 118.0 100.0 91.9 73.7 106.5 36.8 93.2 82.1 0.0 6.0 4.1 3.7 94 31 23 0 39 25 20 0 86.4 75.0 67.7 84.3 72.7 63.2
Central Michigan U 7 I PU 109.1 84.5 80.8 54.3 85.3 143.4 114.0 108.5 74.7 113.9 33.6 100.0 88.9 9.6 3.6 4.2 3.9 178 81 49 0 106 72 55 0 113.0 87.6 84.4 102.4 81.1 77.6
Davenport U 7 IIA PI 80.3 70.0 64.1 61.4 65.8 102.6 92.2 88.0 82.3 88.2 34.2 0.0 0.0 0.0 0.0 0.0 0.0 0.0 -0.9 4 11 13 9 1 7 17 14 76.4 70.9 65.3 62.3 — 68.5 63.3 60.8
Eastern Michigan U I PU 98.4 83.3 75.4 74.0 45.4 84.2 90.6 78.7 4.4 33.3 2.7 2.4 2.6 2.5 182 68 61 1 157 82 77 2 100.6 83.8 80.5 — 95.8 82.9 71.4 —
Ferris St U 1,57 IIA PU 106.0 82.9 75.7 63.5 48.0 82.7 139.6 114.6 106.9 93.6 61.5 112.0 35.5 98.6 84.0 38.7 50.0 2.8 3.8 2.8 3.5 186 148 138 2 104 102 110 2 214.1 166.8 152.4 — 208.4 164.3 150.0 —
Ferris St U-Kendall Coll Art and Design 45 IIA PU 81.5 58.7 53.0 51.0 69.1 108.4 83.9 77.8 93.6 35.4 63.0 80.0 7.1 6.0 10.1 6.3 13 2 3 0 14 3 11 0 83.6 — 52.5 79.5 62.9 53.1
Grand Valley St U 7 IIA PU 108.0 86.9 75.2 76.6 49.2 80.7 100.0 97.5 14.0 44.4 184 170 91 4 98 152 137 5 110.2 87.6 77.9 91.3 104.0 86.1 73.4 64.9
Hope Coll IIB PR 92.2 72.9 61.6 52.2 75.9 129.3 100.3 84.9 70.8 105.3 38.7 97.7 84.7 0.0 0.0 2.3 6.1 4.6 2.9 55 40 25 0 30 32 44 8 93.8 73.9 63.8 89.4 71.7 60.3 52.2
Kalamazoo Coll IIB PI 91.5 75.9 58.8 68.3 74.9 119.4 99.1 80.1 98.4 99.3 32.6 100.0 100.0 0.0 0.0 3.0 4.0 3.8 3.8 21 9 21 1 15 15 16 3 94.8 77.2 58.2 — 86.8 75.1 59.7 65.4
Michigan St U 7 I PU 157.4 103.1 83.1 116.7 200.3 138.3 109.6 151.9 30.2 94.6 88.5 0.0 1.9 2.8 3.1 597 356 355 0 205 270 362 0 158.9 105.9 87.2 152.8 99.4 79.0
Michigan Technological U I PU 120.7 96.5 82.9 73.1 66.2 94.8 168.5 133.7 114.3 101.9 91.9 131.7 38.9 99.2 95.8 0.0 0.0 2.1 2.9 3.3 5.8 96 85 52 18 26 33 32 7 123.2 99.0 84.2 72.1 111.7 89.8 80.9 75.6
Northern Michigan U 7 IIA PU 94.1 78.1 66.9 49.3 60.5 76.9 130.2 110.0 96.0 74.1 85.4 108.3 41.0 98.0 81.5 1.5 0.0 2.1 4.8 4.0 2.4 59 38 33 13 40 27 35 16 95.4 79.9 71.0 52.2 92.2 75.5 62.9 47.0
Oakland U 7 I PU 113.2 83.6 75.7 65.2 85.1 154.9 118.4 105.1 89.3 118.3 39.1 100.0 97.8 0.0 21.3 3.7 3.1 3.3 3.3 89 119 65 34 37 112 78 60 118.6 85.8 78.1 66.2 100.2 81.3 73.6 64.7
Saginaw Valley St U IIA PU 87.3 71.7 68.3 — 52.8 75.1 122.7 100.9 96.0 — 74.2 105.6 40.6 88.0 63.0 4.6 0.0 2.0 2.4 2.4 67 46 30 1 33 54 36 0 89.9 73.4 72.5 — 82.0 70.3 64.8
Spring Arbor U 7 IIA PR 64.5 56.8 48.9 — 55.9 90.7 81.1 70.9 — 79.8 42.7 96.4 40.7 2.9 2.9 2.7 3.3 22 15 12 0 6 12 22 0 65.3 56.1 49.6 61.3 57.8 48.5
U Michigan-Ann Arbor 7 I PU 175.0 115.8 98.5 — 71.5 126.9 213.0 146.4 126.1 — 94.4 158.3 24.7 95.4 88.5 0.0 0.0 3.1 3.6 3.3 807 324 299 1 337 249 307 0 179.1 117.6 100.9 — 165.1 113.5 96.2
U Michigan-Flint 5 IIA PU 117.9 83.8 77.1 63.8 83.9 159.0 119.6 111.3 94.4 119.1 42.0 100.0 98.8 0.0 1.4 3.7 3.3 32 36 33 0 15 47 38 0 118.5 86.2 80.5 116.6 82.0 74.2
Wayne St U 7 I PU 133.8 100.4 85.9 73.8 62.4 98.1 167.9 125.8 107.9 92.8 78.2 123.0 25.4 97.0 88.9 1.7 0.0 2.5 3.5 3.7 3.2 200 162 104 5 67 145 134 26 136.4 104.7 87.6 72.3 126.0 95.7 84.6 74.1
Western Michigan U 7 I PU 112.2 85.4 72.4 54.6 90.9 99.2 94.8 7.7 0.0 3.2 3.9 4.2 4.3 242 130 76 32 117 121 106 48 115.9 89.9 75.5 56.8 104.4 80.5 70.1 53.0
MinnesotaAugsburg Coll 7 IIA PR 82.6 69.6 66.0 58.6 69.7 102.3 87.4 82.3 71.3 86.7 24.4 100.0 94.7 1.8 0.0 2.1 4.9 3.0 2.2 17 33 23 6 21 24 32 19 84.2 69.4 68.1 60.3 81.4 69.9 64.4 58.0
Bethel U 1 IIA PR 78.1 68.4 57.1 52.1 69.6 105.9 92.7 77.1 65.0 94.1 35.3 97.4 52.9 11.4 0.0 0.2 1.1 1.4 0.0 50 34 12 1 28 51 23 6 79.0 68.4 56.5 — 76.6 68.3 57.4 52.1
Carleton Coll IIB PI 138.1 101.4 86.6 118.4 178.4 134.5 114.4 154.4 30.3 90.7 92.2 0.0 3.6 3.6 5.7 57 29 19 0 50 22 20 0 138.5 102.3 87.6 137.8 100.2 85.7
Coll Saint Benedict IIB PR 92.2 74.9 65.5 66.4 77.2 120.7 104.7 84.4 88.7 103.5 34.1 100.0 95.6 0.0 0.0 27 21 5 17 18 24 12 17 92.3 76.5 69.6 67.0 92.0 73.4 63.7 65.7
Concordia Coll Moorhead IIB PR 78.5 65.5 62.3 49.6 67.4 100.0 87.6 80.8 62.5 87.6 29.9 100.0 92.0 8.5 0.0 3.1 3.0 2.9 3.9 32 27 21 5 18 23 26 7 81.2 65.4 67.0 47.8 73.8 65.5 58.6 50.9
Gustavus Adolphus Coll 7 IIB PR 82.4 67.8 57.4 53.2 67.0 111.1 91.9 76.4 68.4 90.0 34.3 100.0 98.5 0.0 0.0 3.7 4.3 3.8 3.5 24 31 29 5 20 36 28 8 86.1 69.8 56.4 52.5 78.0 66.1 58.5 53.6
Hamline U 1 IIA PR 80.2 67.1 63.8 — 70.0 67.0 72.0 97.5 83.7 76.4 — 86.1 81.7 87.8 22.0 100.0 70.6 0.0 0.0 3.9 4.3 4.7 22 16 11 1 32 18 20 1 81.8 67.2 68.5 — 79.1 67.0 61.2 —
Macalester Coll IIB PR 125.5 93.5 79.4 64.0 97.7 168.3 121.3 103.8 89.4 130.4 33.5 100.0 100.0 0.0 0.0 2.4 4.6 3.8 3.7 39 20 16 13 37 21 18 26 127.8 94.0 81.9 63.6 123.0 93.1 77.2 64.3
Saint Johns U IIB PR 86.9 73.3 63.0 67.3 75.2 117.0 104.5 80.8 90.4 102.6 36.3 100.0 97.6 6.3 0.0 26 19 5 13 17 22 11 16 87.1 76.1 61.6 70.0 86.7 70.9 63.7 65.1
Saint Mary’s U Minnesota 7 IIA PR 72.3 62.3 58.1 49.8 63.3 95.3 78.5 75.7 62.4 81.6 28.9 76.9 73.8 24.1 0.0 1.9 1.9 3.5 2.0 14 27 20 1 12 15 9 2 75.0 63.3 61.0 — 69.1 60.5 51.8 —
St Catherine U 1 IIA PR 81.7 68.4 60.0 51.6 — 65.7 107.9 87.6 77.2 68.4 — 84.8 29.2 87.2 59.2 0.8 0.0 1.0 0.7 1.4 0.0 10 15 22 2 29 56 111 1 83.2 68.0 58.2 — 81.1 68.6 60.4 —
U Minnesota-Crookston 7 IIB PU 89.8 75.7 70.0 52.5 64.3 — 68.3 119.1 100.4 92.7 69.8 85.1 — 90.5 32.5 100.0 85.7 5.9 0.0 3.1 2.4 2.3 -1.0 5 11 8 4 3 3 9 10 90.3 76.1 70.6 59.0 88.9 74.1 69.5 49.9
U Minnesota-Duluth 7 IIA PU 103.4 81.0 66.9 54.6 75.9 135.8 106.4 87.8 71.9 99.7 31.4 100.0 98.7 0.6 0.0 1.9 2.3 3.4 2.3 68 89 80 38 23 61 85 46 105.6 83.0 70.2 57.9 96.7 78.1 63.8 51.9
U Minnesota-Morris 7 IIB PU 87.3 70.3 56.3 46.7 — 65.6 114.7 92.3 74.1 61.3 — 86.2 31.3 100.0 97.1 0.0 0.0 1.5 1.9 2.6 3.0 18 17 18 17 11 18 12 10 88.7 68.1 57.1 46.6 85.1 72.4 55.1 46.8
U Minnesota-Rochester 7 IIB PU 80.9 70.5 50.8 50.8 58.8 106.2 92.6 66.9 66.7 77.3 31.4 100.0 0.0 0.0 3.4 -1.8 0 3 4 7 0 2 3 4 82.6 70.5 49.2 — 70.5 53.8
U Minnesota-Twin Cities 7 I PU 145.7 102.9 90.9 55.2 66.9 — 110.4 193.4 136.9 120.9 73.8 88.2 — 146.6 32.8 96.2 78.2 0.0 0.6 2.4 3.5 3.7 2.9 669 337 291 47 270 268 284 116 149.7 106.0 95.0 59.7 135.8 99.0 86.7 53.4
U St Thomas IIA PR 113.8 87.7 75.8 79.5 93.4 140.2 111.6 96.2 96.8 117.2 25.5 98.4 98.4 1.2 0.0 2.1 2.1 2.9 89 97 46 3 37 90 38 1 118.3 92.3 76.8 78.3 103.1 82.8 74.6 —
MississippiMillsaps Coll IIB PR 93.9 67.0 60.2 — 72.4 119.2 82.2 73.4 — 89.8 24.1 100.0 100.0 3.7 0.0 -2.1 2.2 2.4 17 14 10 0 7 15 17 2 94.5 70.3 61.7 92.2 63.9 59.4 —
Mississippi Coll 7 I PR 87.6 69.7 59.9 53.3 68.3 104.4 83.2 71.5 63.7 81.4 19.3 93.2 71.7 1.5 0.0 -1.7 0.5 0.9 -0.1 46 25 31 13 13 28 34 32 86.0 72.0 61.4 54.1 93.3 67.7 58.5 53.0
Mississippi St U 7 I PU 112.5 84.2 74.8 48.7 30.5 79.0 138.5 103.1 90.9 60.7 38.1 96.9 22.7 97.8 80.0 0.0 0.0 2.9 4.1 4.4 3.6 179 169 151 52 51 76 128 100 115.3 87.6 80.9 53.7 102.7 76.6 67.6 46.1
Mississippi U for Women 7 IIA PU 66.5 59.8 51.5 52.9 57.3 86.7 78.1 67.9 69.9 75.2 31.2 100.0 66.7 0.0 0.0 0.0 2.5 2.1 0.5 15 10 9 9 21 17 27 33 64.8 54.8 50.6 48.8 67.7 62.7 51.8 54.0
U Mississippi 7 I PU 121.3 90.1 77.9 50.0 51.4 85.3 145.8 110.3 96.3 63.0 65.0 104.5 22.5 86.6 80.3 1.0 0.0 3.2 3.8 3.5 4.2 162 173 151 65 84 126 158 124 126.1 94.1 82.8 52.4 111.9 84.6 73.2 48.8
U Southern Mississippi I PU 97.5 72.2 65.4 52.4 46.3 72.2 126.4 95.0 86.5 70.5 61.7 95.0 31.6 94.6 92.0 1.9 0.0 0.0 2.7 2.0 2.2 100 104 93 31 48 84 121 65 99.9 70.5 66.2 54.3 92.4 74.3 64.7 51.5
MissouriColumbia Coll IIA PR 85.9 67.5 68.6 63.7 52.8 70.7 110.3 85.4 95.6 85.1 71.3 93.0 31.5 88.2 75.0 10.5 0.0 2.0 2.4 2.4 3.0 8 17 8 1 9 7 11 9 92.3 70.4 70.3 — 80.2 60.2 67.3 63.9
Drury U 1 IIA PI 72.6 63.6 61.4 54.4 — 64.8 92.3 81.0 78.0 69.2 — 82.5 27.3 100.0 100.0 0.0 0.0 2.0 2.4 2.3 3.0 21 22 9 10 17 14 8 8 73.8 61.5 63.4 58.9 71.0 66.9 59.1 48.7
Lincoln U IIA PU 62.8 55.5 44.9 38.3 52.1 83.3 73.5 56.6 50.8 68.2 31.0 96.9 61.9 40.7 0.0 -1.8 3.2 -1.3 2.4 22 10 12 7 10 11 15 9 64.5 55.1 45.9 37.8 59.0 55.8 44.2 38.7
Lindenwood U I PI 96.2 77.3 67.7 55.4 77.7 116.0 94.1 82.2 67.7 94.3 21.3 0.0 0.0 0.0 0.0 0.6 0.5 1.5 1.0 38 43 50 8 38 48 46 10 101.0 78.7 69.0 56.8 91.5 76.0 66.2 54.3
© 2019 American Association of University Professors
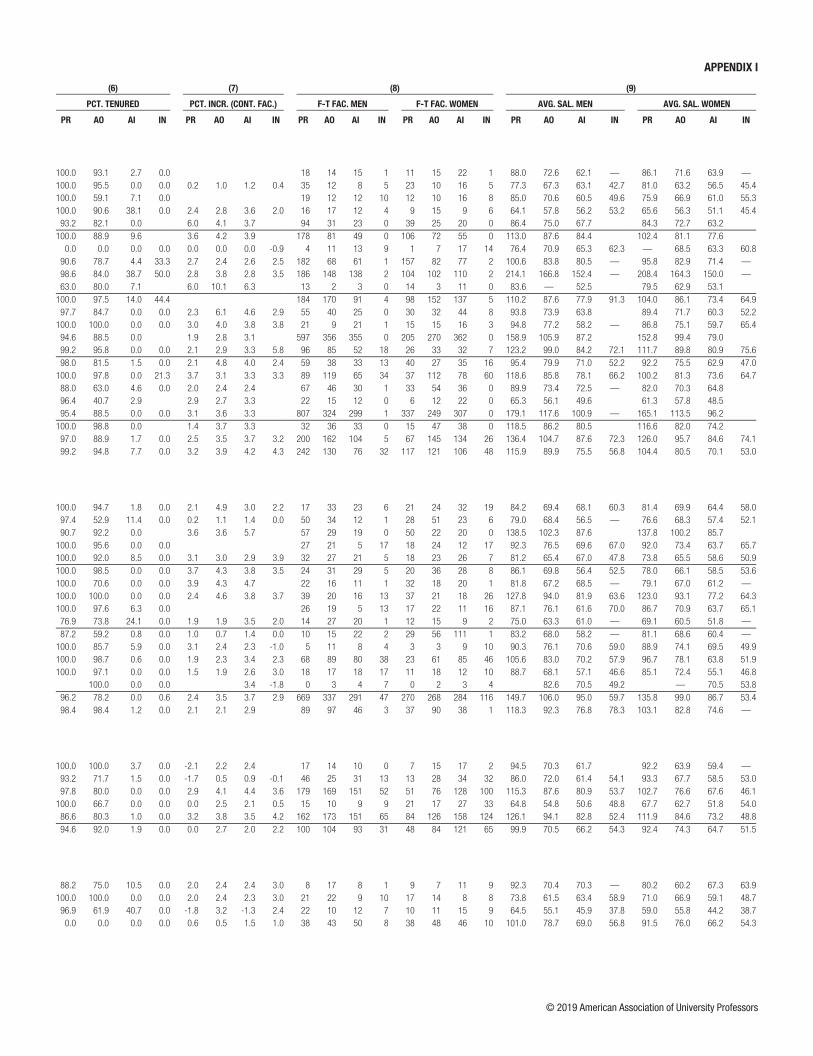
APPENDIX I APPENDIX I
NAME NOTES
(1) (2) (3) (4) (5) (6) (7) (8) (9)
CAT. CTRL
AVG. SALARY ($1000s) AVG. COMPENSATION ($1000s) BEN. as %
of SAL.
PCT. TENURED PCT. INCR. (CONT. FAC.) F-T FAC. MEN F-T FAC. WOMEN AVG. SAL. MEN AVG. SAL. WOMEN
PR AO AI IN LE NR AR PR AO AI IN LE NR AR PR AO AI IN PR AO AI IN PR AO AI IN PR AO AI IN PR AO AI IN PR AO AI IN
MichiganAdrian Coll IIB PR 87.2 72.1 63.2 — 72.8 122.3 101.0 88.6 — 102.1 40.1 100.0 93.1 2.7 0.0 18 14 15 1 11 15 22 1 88.0 72.6 62.1 — 86.1 71.6 63.9 —
Albion Coll IIB PR 78.8 65.4 58.7 44.1 49.5 68.4 104.6 88.6 78.0 60.3 63.7 91.3 33.4 100.0 95.5 0.0 0.0 0.2 1.0 1.2 0.4 35 12 8 5 23 10 16 5 77.3 67.3 63.1 42.7 81.0 63.2 56.5 45.4
Alma Coll IIB PR 81.5 68.9 60.8 52.2 67.5 111.9 91.3 81.2 66.1 90.3 33.8 100.0 59.1 7.1 0.0 19 12 12 10 12 10 16 8 85.0 70.6 60.5 49.6 75.9 66.9 61.0 55.3
Aquinas Coll IIB PR 64.6 57.1 54.0 48.5 57.5 100.0 90.6 38.1 0.0 2.4 2.8 3.6 2.0 16 17 12 4 9 15 9 6 64.1 57.8 56.2 53.2 65.6 56.3 51.1 45.4
Calvin Coll IIA PR 85.8 74.0 65.6 58.1 77.9 118.0 100.0 91.9 73.7 106.5 36.8 93.2 82.1 0.0 6.0 4.1 3.7 94 31 23 0 39 25 20 0 86.4 75.0 67.7 84.3 72.7 63.2
Central Michigan U 7 I PU 109.1 84.5 80.8 54.3 85.3 143.4 114.0 108.5 74.7 113.9 33.6 100.0 88.9 9.6 3.6 4.2 3.9 178 81 49 0 106 72 55 0 113.0 87.6 84.4 102.4 81.1 77.6
Davenport U 7 IIA PI 80.3 70.0 64.1 61.4 65.8 102.6 92.2 88.0 82.3 88.2 34.2 0.0 0.0 0.0 0.0 0.0 0.0 0.0 -0.9 4 11 13 9 1 7 17 14 76.4 70.9 65.3 62.3 — 68.5 63.3 60.8
Eastern Michigan U I PU 98.4 83.3 75.4 74.0 45.4 84.2 90.6 78.7 4.4 33.3 2.7 2.4 2.6 2.5 182 68 61 1 157 82 77 2 100.6 83.8 80.5 — 95.8 82.9 71.4 —
Ferris St U 1,57 IIA PU 106.0 82.9 75.7 63.5 48.0 82.7 139.6 114.6 106.9 93.6 61.5 112.0 35.5 98.6 84.0 38.7 50.0 2.8 3.8 2.8 3.5 186 148 138 2 104 102 110 2 214.1 166.8 152.4 — 208.4 164.3 150.0 —
Ferris St U-Kendall Coll Art and Design 45 IIA PU 81.5 58.7 53.0 51.0 69.1 108.4 83.9 77.8 93.6 35.4 63.0 80.0 7.1 6.0 10.1 6.3 13 2 3 0 14 3 11 0 83.6 — 52.5 79.5 62.9 53.1
Grand Valley St U 7 IIA PU 108.0 86.9 75.2 76.6 49.2 80.7 100.0 97.5 14.0 44.4 184 170 91 4 98 152 137 5 110.2 87.6 77.9 91.3 104.0 86.1 73.4 64.9
Hope Coll IIB PR 92.2 72.9 61.6 52.2 75.9 129.3 100.3 84.9 70.8 105.3 38.7 97.7 84.7 0.0 0.0 2.3 6.1 4.6 2.9 55 40 25 0 30 32 44 8 93.8 73.9 63.8 89.4 71.7 60.3 52.2
Kalamazoo Coll IIB PI 91.5 75.9 58.8 68.3 74.9 119.4 99.1 80.1 98.4 99.3 32.6 100.0 100.0 0.0 0.0 3.0 4.0 3.8 3.8 21 9 21 1 15 15 16 3 94.8 77.2 58.2 — 86.8 75.1 59.7 65.4
Michigan St U 7 I PU 157.4 103.1 83.1 116.7 200.3 138.3 109.6 151.9 30.2 94.6 88.5 0.0 1.9 2.8 3.1 597 356 355 0 205 270 362 0 158.9 105.9 87.2 152.8 99.4 79.0
Michigan Technological U I PU 120.7 96.5 82.9 73.1 66.2 94.8 168.5 133.7 114.3 101.9 91.9 131.7 38.9 99.2 95.8 0.0 0.0 2.1 2.9 3.3 5.8 96 85 52 18 26 33 32 7 123.2 99.0 84.2 72.1 111.7 89.8 80.9 75.6
Northern Michigan U 7 IIA PU 94.1 78.1 66.9 49.3 60.5 76.9 130.2 110.0 96.0 74.1 85.4 108.3 41.0 98.0 81.5 1.5 0.0 2.1 4.8 4.0 2.4 59 38 33 13 40 27 35 16 95.4 79.9 71.0 52.2 92.2 75.5 62.9 47.0
Oakland U 7 I PU 113.2 83.6 75.7 65.2 85.1 154.9 118.4 105.1 89.3 118.3 39.1 100.0 97.8 0.0 21.3 3.7 3.1 3.3 3.3 89 119 65 34 37 112 78 60 118.6 85.8 78.1 66.2 100.2 81.3 73.6 64.7
Saginaw Valley St U IIA PU 87.3 71.7 68.3 — 52.8 75.1 122.7 100.9 96.0 — 74.2 105.6 40.6 88.0 63.0 4.6 0.0 2.0 2.4 2.4 67 46 30 1 33 54 36 0 89.9 73.4 72.5 — 82.0 70.3 64.8
Spring Arbor U 7 IIA PR 64.5 56.8 48.9 — 55.9 90.7 81.1 70.9 — 79.8 42.7 96.4 40.7 2.9 2.9 2.7 3.3 22 15 12 0 6 12 22 0 65.3 56.1 49.6 61.3 57.8 48.5
U Michigan-Ann Arbor 7 I PU 175.0 115.8 98.5 — 71.5 126.9 213.0 146.4 126.1 — 94.4 158.3 24.7 95.4 88.5 0.0 0.0 3.1 3.6 3.3 807 324 299 1 337 249 307 0 179.1 117.6 100.9 — 165.1 113.5 96.2
U Michigan-Flint 5 IIA PU 117.9 83.8 77.1 63.8 83.9 159.0 119.6 111.3 94.4 119.1 42.0 100.0 98.8 0.0 1.4 3.7 3.3 32 36 33 0 15 47 38 0 118.5 86.2 80.5 116.6 82.0 74.2
Wayne St U 7 I PU 133.8 100.4 85.9 73.8 62.4 98.1 167.9 125.8 107.9 92.8 78.2 123.0 25.4 97.0 88.9 1.7 0.0 2.5 3.5 3.7 3.2 200 162 104 5 67 145 134 26 136.4 104.7 87.6 72.3 126.0 95.7 84.6 74.1
Western Michigan U 7 I PU 112.2 85.4 72.4 54.6 90.9 99.2 94.8 7.7 0.0 3.2 3.9 4.2 4.3 242 130 76 32 117 121 106 48 115.9 89.9 75.5 56.8 104.4 80.5 70.1 53.0
MinnesotaAugsburg Coll 7 IIA PR 82.6 69.6 66.0 58.6 69.7 102.3 87.4 82.3 71.3 86.7 24.4 100.0 94.7 1.8 0.0 2.1 4.9 3.0 2.2 17 33 23 6 21 24 32 19 84.2 69.4 68.1 60.3 81.4 69.9 64.4 58.0
Bethel U 1 IIA PR 78.1 68.4 57.1 52.1 69.6 105.9 92.7 77.1 65.0 94.1 35.3 97.4 52.9 11.4 0.0 0.2 1.1 1.4 0.0 50 34 12 1 28 51 23 6 79.0 68.4 56.5 — 76.6 68.3 57.4 52.1
Carleton Coll IIB PI 138.1 101.4 86.6 118.4 178.4 134.5 114.4 154.4 30.3 90.7 92.2 0.0 3.6 3.6 5.7 57 29 19 0 50 22 20 0 138.5 102.3 87.6 137.8 100.2 85.7
Coll Saint Benedict IIB PR 92.2 74.9 65.5 66.4 77.2 120.7 104.7 84.4 88.7 103.5 34.1 100.0 95.6 0.0 0.0 27 21 5 17 18 24 12 17 92.3 76.5 69.6 67.0 92.0 73.4 63.7 65.7
Concordia Coll Moorhead IIB PR 78.5 65.5 62.3 49.6 67.4 100.0 87.6 80.8 62.5 87.6 29.9 100.0 92.0 8.5 0.0 3.1 3.0 2.9 3.9 32 27 21 5 18 23 26 7 81.2 65.4 67.0 47.8 73.8 65.5 58.6 50.9
Gustavus Adolphus Coll 7 IIB PR 82.4 67.8 57.4 53.2 67.0 111.1 91.9 76.4 68.4 90.0 34.3 100.0 98.5 0.0 0.0 3.7 4.3 3.8 3.5 24 31 29 5 20 36 28 8 86.1 69.8 56.4 52.5 78.0 66.1 58.5 53.6
Hamline U 1 IIA PR 80.2 67.1 63.8 — 70.0 67.0 72.0 97.5 83.7 76.4 — 86.1 81.7 87.8 22.0 100.0 70.6 0.0 0.0 3.9 4.3 4.7 22 16 11 1 32 18 20 1 81.8 67.2 68.5 — 79.1 67.0 61.2 —
Macalester Coll IIB PR 125.5 93.5 79.4 64.0 97.7 168.3 121.3 103.8 89.4 130.4 33.5 100.0 100.0 0.0 0.0 2.4 4.6 3.8 3.7 39 20 16 13 37 21 18 26 127.8 94.0 81.9 63.6 123.0 93.1 77.2 64.3
Saint Johns U IIB PR 86.9 73.3 63.0 67.3 75.2 117.0 104.5 80.8 90.4 102.6 36.3 100.0 97.6 6.3 0.0 26 19 5 13 17 22 11 16 87.1 76.1 61.6 70.0 86.7 70.9 63.7 65.1
Saint Mary’s U Minnesota 7 IIA PR 72.3 62.3 58.1 49.8 63.3 95.3 78.5 75.7 62.4 81.6 28.9 76.9 73.8 24.1 0.0 1.9 1.9 3.5 2.0 14 27 20 1 12 15 9 2 75.0 63.3 61.0 — 69.1 60.5 51.8 —
St Catherine U 1 IIA PR 81.7 68.4 60.0 51.6 — 65.7 107.9 87.6 77.2 68.4 — 84.8 29.2 87.2 59.2 0.8 0.0 1.0 0.7 1.4 0.0 10 15 22 2 29 56 111 1 83.2 68.0 58.2 — 81.1 68.6 60.4 —
U Minnesota-Crookston 7 IIB PU 89.8 75.7 70.0 52.5 64.3 — 68.3 119.1 100.4 92.7 69.8 85.1 — 90.5 32.5 100.0 85.7 5.9 0.0 3.1 2.4 2.3 -1.0 5 11 8 4 3 3 9 10 90.3 76.1 70.6 59.0 88.9 74.1 69.5 49.9
U Minnesota-Duluth 7 IIA PU 103.4 81.0 66.9 54.6 75.9 135.8 106.4 87.8 71.9 99.7 31.4 100.0 98.7 0.6 0.0 1.9 2.3 3.4 2.3 68 89 80 38 23 61 85 46 105.6 83.0 70.2 57.9 96.7 78.1 63.8 51.9
U Minnesota-Morris 7 IIB PU 87.3 70.3 56.3 46.7 — 65.6 114.7 92.3 74.1 61.3 — 86.2 31.3 100.0 97.1 0.0 0.0 1.5 1.9 2.6 3.0 18 17 18 17 11 18 12 10 88.7 68.1 57.1 46.6 85.1 72.4 55.1 46.8
U Minnesota-Rochester 7 IIB PU 80.9 70.5 50.8 50.8 58.8 106.2 92.6 66.9 66.7 77.3 31.4 100.0 0.0 0.0 3.4 -1.8 0 3 4 7 0 2 3 4 82.6 70.5 49.2 — 70.5 53.8
U Minnesota-Twin Cities 7 I PU 145.7 102.9 90.9 55.2 66.9 — 110.4 193.4 136.9 120.9 73.8 88.2 — 146.6 32.8 96.2 78.2 0.0 0.6 2.4 3.5 3.7 2.9 669 337 291 47 270 268 284 116 149.7 106.0 95.0 59.7 135.8 99.0 86.7 53.4
U St Thomas IIA PR 113.8 87.7 75.8 79.5 93.4 140.2 111.6 96.2 96.8 117.2 25.5 98.4 98.4 1.2 0.0 2.1 2.1 2.9 89 97 46 3 37 90 38 1 118.3 92.3 76.8 78.3 103.1 82.8 74.6 —
MississippiMillsaps Coll IIB PR 93.9 67.0 60.2 — 72.4 119.2 82.2 73.4 — 89.8 24.1 100.0 100.0 3.7 0.0 -2.1 2.2 2.4 17 14 10 0 7 15 17 2 94.5 70.3 61.7 92.2 63.9 59.4 —
Mississippi Coll 7 I PR 87.6 69.7 59.9 53.3 68.3 104.4 83.2 71.5 63.7 81.4 19.3 93.2 71.7 1.5 0.0 -1.7 0.5 0.9 -0.1 46 25 31 13 13 28 34 32 86.0 72.0 61.4 54.1 93.3 67.7 58.5 53.0
Mississippi St U 7 I PU 112.5 84.2 74.8 48.7 30.5 79.0 138.5 103.1 90.9 60.7 38.1 96.9 22.7 97.8 80.0 0.0 0.0 2.9 4.1 4.4 3.6 179 169 151 52 51 76 128 100 115.3 87.6 80.9 53.7 102.7 76.6 67.6 46.1
Mississippi U for Women 7 IIA PU 66.5 59.8 51.5 52.9 57.3 86.7 78.1 67.9 69.9 75.2 31.2 100.0 66.7 0.0 0.0 0.0 2.5 2.1 0.5 15 10 9 9 21 17 27 33 64.8 54.8 50.6 48.8 67.7 62.7 51.8 54.0
U Mississippi 7 I PU 121.3 90.1 77.9 50.0 51.4 85.3 145.8 110.3 96.3 63.0 65.0 104.5 22.5 86.6 80.3 1.0 0.0 3.2 3.8 3.5 4.2 162 173 151 65 84 126 158 124 126.1 94.1 82.8 52.4 111.9 84.6 73.2 48.8
U Southern Mississippi I PU 97.5 72.2 65.4 52.4 46.3 72.2 126.4 95.0 86.5 70.5 61.7 95.0 31.6 94.6 92.0 1.9 0.0 0.0 2.7 2.0 2.2 100 104 93 31 48 84 121 65 99.9 70.5 66.2 54.3 92.4 74.3 64.7 51.5
MissouriColumbia Coll IIA PR 85.9 67.5 68.6 63.7 52.8 70.7 110.3 85.4 95.6 85.1 71.3 93.0 31.5 88.2 75.0 10.5 0.0 2.0 2.4 2.4 3.0 8 17 8 1 9 7 11 9 92.3 70.4 70.3 — 80.2 60.2 67.3 63.9
Drury U 1 IIA PI 72.6 63.6 61.4 54.4 — 64.8 92.3 81.0 78.0 69.2 — 82.5 27.3 100.0 100.0 0.0 0.0 2.0 2.4 2.3 3.0 21 22 9 10 17 14 8 8 73.8 61.5 63.4 58.9 71.0 66.9 59.1 48.7
Lincoln U IIA PU 62.8 55.5 44.9 38.3 52.1 83.3 73.5 56.6 50.8 68.2 31.0 96.9 61.9 40.7 0.0 -1.8 3.2 -1.3 2.4 22 10 12 7 10 11 15 9 64.5 55.1 45.9 37.8 59.0 55.8 44.2 38.7
Lindenwood U I PI 96.2 77.3 67.7 55.4 77.7 116.0 94.1 82.2 67.7 94.3 21.3 0.0 0.0 0.0 0.0 0.6 0.5 1.5 1.0 38 43 50 8 38 48 46 10 101.0 78.7 69.0 56.8 91.5 76.0 66.2 54.3
© 2019 American Association of University Professors

APPENDIX I APPENDIX I
NAME NOTES
(1) (2) (3) (4) (5) (6) (7) (8) (9)
CAT. CTRL
AVG. SALARY ($1000s) AVG. COMPENSATION ($1000s) BEN. as %
of SAL.
PCT. TENURED PCT. INCR. (CONT. FAC.) F-T FAC. MEN F-T FAC. WOMEN AVG. SAL. MEN AVG. SAL. WOMEN
PR AO AI IN LE NR AR PR AO AI IN LE NR AR PR AO AI IN PR AO AI IN PR AO AI IN PR AO AI IN PR AO AI IN PR AO AI IN
Missouri (continued)Maryville U Saint Louis 7 I PI 90.2 78.5 69.6 61.1 74.9 117.4 101.9 89.1 76.8 96.6 28.9 95.8 86.4 0.0 0.0 2.9 3.6 4.1 2.0 13 20 24 2 11 24 56 5 88.1 80.8 68.6 — 92.7 76.5 70.1 59.0
Mineral Area Coll III PU 58.2 56.5 53.2 49.7 52.8 76.7 74.2 71.2 66.8 70.5 33.4 0.0 0.0 0.0 0.0 0.0 0.0 0.0 0.0 5 4 5 15 9 2 6 17 56.9 58.2 56.6 50.1 58.8 — 50.3 49.3
Missouri Baptist U IIA PR 62.5 59.2 53.8 42.5 55.4 88.5 84.6 76.9 59.8 79.0 42.5 0.0 0.0 0.0 0.0 1.0 1.6 1.9 7.8 10 5 19 3 5 4 20 3 64.6 62.0 52.8 43.6 58.4 55.6 54.7 41.4
Missouri St U-Springfield 7 IIA PU 84.6 70.8 66.4 44.1 43.5 68.2 111.1 91.4 80.4 57.1 53.4 87.1 27.7 99.6 99.2 4.3 1.3 0.6 0.7 1.1 1.1 154 70 101 50 75 55 108 99 85.7 74.7 69.1 45.3 82.2 65.9 63.9 43.5
Missouri St U-West Plains 1 III PU 61.6 52.5 46.9 45.6 43.5 49.9 77.2 65.9 58.8 57.2 54.5 62.6 25.3 100.0 100.0 76.5 25.0 0.0 0.0 0.0 0.0 4 4 7 1 2 3 10 3 59.6 53.0 44.1 — — 51.9 48.8 48.2
Missouri U Science and Technology 7 I PU 127.7 83.7 76.4 97.8 166.7 111.8 97.6 127.8 30.7 94.9 80.3 0.0 2.5 1.7 3.2 112 81 77 0 24 36 36 0 130.3 84.2 80.2 115.4 82.7 68.2
Missouri Western St U IIA PU 76.7 64.5 56.7 44.7 61.8 100.0 95.7 6.8 0.0 2.0 3.9 3.2 3.0 30 29 44 9 15 18 44 12 78.1 64.9 58.7 43.7 73.8 63.8 54.8 45.4
Southeast Missouri St U 1 IIA PU 85.3 67.6 59.4 46.6 63.7 108.9 83.7 72.0 58.2 79.6 24.9 100.0 100.0 4.3 0.0 0.5 1.1 2.1 1.3 69 31 40 46 40 34 53 83 87.5 67.1 61.8 47.0 81.5 68.0 57.5 46.3
Truman St U 7 IIA PU 76.7 66.7 55.6 45.6 65.9 106.7 87.8 72.2 64.6 89.6 35.9 100.0 93.8 1.0 0.0 3.1 5.8 3.4 3.0 96 18 52 11 47 14 46 17 78.1 59.5 58.7 44.5 74.1 76.0 52.1 46.4
U Central Missouri 7 IIA PU 85.5 68.4 63.1 42.7 66.5 105.2 85.8 80.1 56.9 83.8 26.0 98.5 96.0 4.3 0.0 0.0 2.2 1.7 2.8 82 48 83 32 52 27 81 58 86.2 68.9 66.0 43.2 84.3 67.6 60.2 42.5
U Missouri-Columbia 7 I PU 125.1 83.4 77.9 95.2 159.9 110.3 98.6 122.8 28.9 89.3 70.9 0.0 3.2 4.7 6.5 261 225 172 0 113 174 198 0 132.5 86.3 83.4 107.9 79.5 73.1
U Missouri-Kansas City 7 I PU 110.5 83.2 75.5 88.2 143.8 109.4 96.3 114.6 29.9 86.9 63.7 0.0 1.6 2.5 3.0 92 135 88 0 68 99 102 0 120.2 85.5 77.5 97.3 80.0 73.8
U Missouri-St Louis 7 I PU 104.1 74.2 65.0 79.5 135.8 98.2 83.1 103.5 30.2 79.7 63.2 0.0 1.9 2.6 3.1 75 59 48 0 43 74 105 0 110.8 75.9 66.6 92.3 72.8 64.3
Washington U in St Louis 7 I PI 201.7 123.8 114.4 101.0 67.1 45.2 137.0 251.8 156.9 136.5 126.4 86.3 61.6 171.0 24.8 100.0 93.3 0.0 0.0 272 111 91 42 87 67 77 33 205.4 128.5 117.9 112.5 189.8 115.9 110.2 86.2
Webster U 7 IIA PI 91.6 75.3 61.3 79.0 113.9 94.0 72.2 97.5 23.5 100.0 97.3 2.6 0.3 1.0 44 38 23 0 31 36 15 0 95.0 76.0 64.3 86.8 74.5 56.8
Westminster Coll IIB PR 66.5 56.5 53.5 46.5 58.8 77.2 66.0 63.6 49.9 68.0 15.7 100.0 94.4 0.0 0.0 0.4 3.7 0.8 13 9 4 4 6 9 2 2 68.8 55.9 56.1 47.1 61.5 57.2 — —
MontanaMontana St U I PU 105.5 77.2 73.1 86.2 132.7 100.7 96.1 110.8 28.6 97.4 100.0 1.5 2.2 3.2 0.7 116 69 58 0 36 60 79 0 105.9 76.6 74.0 104.5 77.8 72.4
Montana St U-Billings IIA PU 79.2 63.5 54.8 43.2 46.5 51.3 59.7 107.0 88.2 77.9 64.1 68.1 73.7 83.8 40.3 96.7 100.0 5.9 0.0 0.4 1.9 0.6 19 14 23 1 11 9 28 2 73.6 67.7 57.1 — 88.9 56.9 52.9 —
Rocky Mountain Coll IIA PR 68.1 52.7 56.8 37.6 59.1 82.4 64.8 70.7 45.8 72.3 22.3 100.0 87.5 6.7 0.0 3.0 2.8 6.0 6.6 18 6 5 2 7 10 10 2 67.5 58.1 59.0 — 69.7 49.4 55.7 —
U Montana 7 I PU 91.8 73.5 62.7 49.3 50.9 76.6 116.4 95.8 83.2 68.4 70.2 99.3 29.5 99.5 86.1 0.0 25.0 1.8 3.4 3.4 5.6 130 73 27 28 70 42 31 28 94.0 72.5 62.3 47.8 87.7 75.2 63.0 50.8
U Montana-Western 7 IIB PU 70.7 57.0 50.0 45.2 58.6 99.5 80.2 70.4 63.6 82.5 40.7 100.0 50.0 0.0 0.0 0.0 0.0 0.6 2.7 20 7 4 8 8 5 8 8 71.8 57.4 49.3 45.8 67.9 56.4 50.4 44.5
NebraskaConcordia U-Nebraska IIA PR 68.4 61.5 52.8 — 59.5 91.7 81.2 72.0 — 80.2 34.7 0.0 0.0 0.0 0.0 1.0 1.0 1.0 17 6 16 0 3 6 10 1 68.3 61.5 53.4 69.0 61.5 51.7 —
Creighton U 7 IIA PR 120.7 94.8 74.3 61.6 91.2 150.7 120.5 94.9 80.3 115.6 26.7 98.7 78.0 11.1 0.0 2.9 3.5 4.0 3.9 102 94 97 14 47 79 128 26 122.8 95.4 75.2 60.4 115.9 94.0 73.7 62.3
Hastings Coll IIB PR 66.0 54.0 53.1 35.6 57.9 85.1 69.7 68.5 46.0 74.8 29.1 100.0 100.0 0.0 0.0 1.0 3.1 6.0 11.6 20 6 6 4 11 4 14 1 67.1 54.7 54.9 34.0 63.8 52.9 52.3 —
Nebraska Wesleyan U IIA PR 68.9 60.6 55.0 53.3 61.8 91.6 84.8 74.9 68.2 83.5 35.1 100.0 88.5 0.0 0.0 0.0 1.3 0.2 0.0 20 13 8 3 22 13 20 6 72.1 60.2 56.0 63.0 66.0 61.0 54.6 48.4
U Nebraska Kearney 1 IIA PU 86.0 71.3 59.3 48.3 68.1 100.0 74.7 3.4 1.8 3.3 4.4 58 39 49 0 40 36 39 0 87.5 70.0 61.4 83.8 72.8 56.7
Wayne St Coll IIA PU 80.9 61.7 53.5 48.7 — 66.5 106.9 84.7 73.8 64.1 — 89.4 34.4 100.0 50.0 5.6 0.0 1.5 4.6 5.1 1.5 33 11 16 3 17 11 20 4 80.5 62.7 53.9 50.9 81.7 60.8 53.3 47.1
NevadaU Nevada-Las Vegas 7 I PU 132.0 96.7 73.2 57.4 96.7 162.2 121.3 93.9 75.6 121.2 25.4 98.4 76.0 1.3 5.7 7.3 10.3 228 143 162 0 81 111 147 0 133.1 98.0 74.1 128.9 95.1 72.1
U Nevada-Reno 7 I PU 131.1 95.4 77.9 86.8 54.7 92.4 161.7 120.0 99.7 110.2 73.0 116.6 26.2 94.2 84.8 0.3 0.0 3.2 4.1 3.8 124 105 188 1 47 79 169 2 136.1 97.4 82.4 — 118.1 92.7 72.9 —
New HampshireColby-Sawyer Coll IIB PI 81.5 63.1 52.4 64.7 103.7 80.3 66.6 82.4 27.3 100.0 77.8 0.0 0.0 3.1 0.6 10 7 7 0 8 11 15 0 78.9 59.3 52.5 84.7 65.5 52.3
Dartmouth Coll I PI 207.8 135.8 104.7 161.2 262.2 174.9 131.5 204.4 26.8 97.3 88.2 1.8 5.3 4.8 6.6 161 94 69 0 61 67 42 0 218.3 140.7 105.6 180.1 128.8 103.2
Franklin Pierce U IIA PI 78.5 68.2 68.3 58.5 70.3 108.0 94.5 91.0 76.1 95.4 35.8 0.0 0.0 0.0 0.0 1.5 0.3 1.5 16 18 9 1 7 10 28 4 80.2 65.6 65.5 — 74.8 72.8 69.2 62.6
Keene St Coll 1 IIB PU 100.3 81.6 68.8 65.5 49.8 — 84.5 128.5 107.2 89.1 82.8 59.1 — 109.2 29.2 100.0 89.2 3.5 0.0 1.2 2.2 4.4 37 34 11 2 32 31 18 2 101.4 82.6 68.9 — 98.9 80.5 68.8 —
Plymouth St U 1 IIA PU 93.8 77.5 66.2 60.9 60.5 78.5 120.7 102.5 85.7 81.7 76.1 101.6 29.4 100.0 81.6 0.0 0.0 1.5 2.4 5.1 38 25 15 1 33 24 18 2 94.5 78.9 67.9 — 92.9 76.0 64.7 —
Saint Anselm Coll IIB PR 97.5 80.5 67.8 51.7 — 60.0 80.1 133.9 112.3 85.4 62.3 — 107.2 33.9 100.0 88.7 2.7 0.0 3.0 1.9 3.6 17.4 31 23 15 0 17 30 22 5 99.4 80.9 72.2 94.1 80.2 64.9 51.7
U New Hampshire-Main Campus 1 I PU 134.4 108.1 91.1 80.3 110.6 166.2 137.4 112.8 102.6 138.4 25.1 98.4 93.6 0.0 3.0 3.9 3.9 129 105 64 0 58 97 80 0 139.3 111.8 92.6 123.5 104.1 90.0
New JerseyBloomfield Coll IIB PR 99.6 80.3 67.1 86.1 133.2 106.9 88.6 114.7 33.3 100.0 76.2 0.0 2.6 2.7 2.7 11 10 4 0 19 11 11 0 100.0 80.0 66.6 99.4 80.5 67.2
Caldwell U IIA PR 83.9 69.8 61.7 22.3 — 69.8 99.1 88.4 77.2 30.5 — 84.9 21.7 100.0 55.6 6.1 0.0 2.0 4.6 1.9 2.0 16 4 6 0 16 5 27 3 84.3 72.1 56.3 83.5 68.0 62.9 22.3
Centenary U 10 IIA PR 94.8 72.6 58.4 — 67.8 114.6 87.8 70.6 — 81.9 20.9 63.6 41.4 0.0 0.0 0.2 1.1 1.9 4 14 20 1 7 15 23 1 94.6 70.5 57.7 — 94.9 74.6 58.9 —
Coll New Jersey 7 IIA PU 123.1 101.6 83.0 72.7 103.6 181.7 150.0 122.5 107.2 152.9 47.6 99.2 83.2 16.4 0.0 2.8 4.1 4.2 7.3 63 57 45 2 68 68 59 3 123.8 102.5 83.8 — 122.5 100.8 82.4 71.8
Drew U IIA PR 100.0 77.9 64.7 — 81.8 129.3 101.2 81.7 — 105.3 28.8 100.0 98.1 0.0 0.0 -0.2 1.3 0.7 30 29 22 0 23 24 21 1 99.3 78.5 66.1 101.0 77.0 63.3 —
Fairleigh Dickinson U-Metropolitan Campus 7 I PI 104.2 87.1 77.3 — 62.5 84.0 143.5 118.0 105.5 — 86.8 115.0 37.0 97.6 81.3 7.8 0.0 0.4 1.6 1.3 55 38 46 2 28 37 44 0 106.1 86.6 77.5 — 100.5 87.6 77.2
Georgian Court U IIA PR 93.8 73.4 65.7 58.3 76.2 115.6 93.0 84.7 79.1 96.2 26.3 100.0 89.7 3.2 0.0 4.5 2.6 3.9 11 10 10 0 15 19 21 3 96.2 69.4 64.8 92.0 75.6 66.2 58.3
Kean U 7 IIA PU 127.4 102.6 85.1 62.2 — 87.2 98.3 97.1 63.0 2.2 2.5 3.0 29 32 44 0 31 38 48 0 128.3 102.4 85.5 126.5 102.8 84.8
Monmouth U IIA PI 131.7 105.0 77.1 67.9 71.1 90.9 178.3 143.4 104.8 88.6 101.3 124.8 37.3 100.0 100.0 0.0 0.0 1.1 23.5 2.3 10.4 26 42 34 9 18 50 39 6 142.4 108.8 80.1 70.1 116.3 101.8 74.5 64.5
New Jersey Institute Technology 7 I PU 186.7 131.3 103.7 72.1 70.7 125.0 267.9 190.5 150.8 105.8 106.9 181.0 44.8 99.3 91.4 0.0 1.7 1.7 2.0 119 74 47 0 17 19 26 0 188.2 132.2 105.3 176.2 127.9 100.7
© 2019 American Association of University Professors
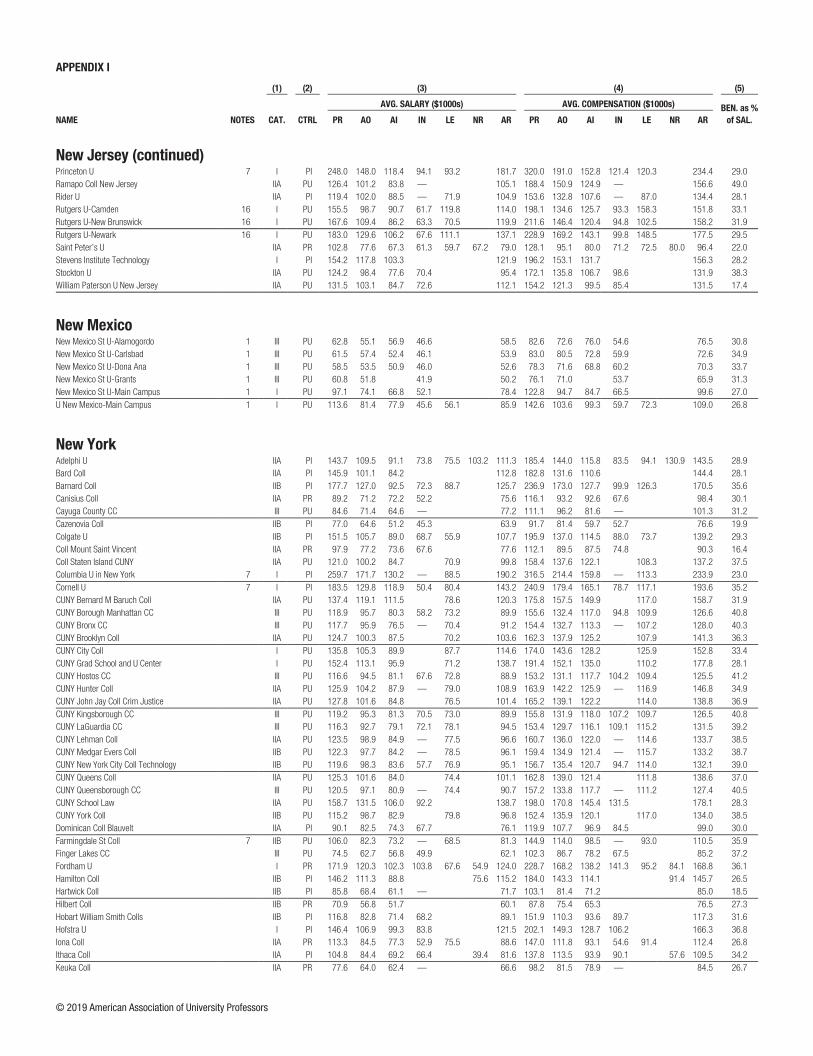
APPENDIX I APPENDIX I
NAME NOTES
(1) (2) (3) (4) (5) (6) (7) (8) (9)
CAT. CTRL
AVG. SALARY ($1000s) AVG. COMPENSATION ($1000s) BEN. as %
of SAL.
PCT. TENURED PCT. INCR. (CONT. FAC.) F-T FAC. MEN F-T FAC. WOMEN AVG. SAL. MEN AVG. SAL. WOMEN
PR AO AI IN LE NR AR PR AO AI IN LE NR AR PR AO AI IN PR AO AI IN PR AO AI IN PR AO AI IN PR AO AI IN PR AO AI IN
New Jersey (continued)Princeton U 7 I PI 248.0 148.0 118.4 94.1 93.2 181.7 320.0 191.0 152.8 121.4 120.3 234.4 29.0 100.0 100.0 0.0 0.0 4.1 4.6 7.0 6.2 368 64 118 16 122 47 77 2 252.4 148.6 125.3 94.7 234.6 147.3 107.8 —
Ramapo Coll New Jersey IIA PU 126.4 101.2 83.8 — 105.1 188.4 150.9 124.9 — 156.6 49.0 100.0 96.7 28.9 50.0 2.0 3.4 4.4 40 40 23 0 31 51 29 2 126.6 101.6 83.6 126.2 100.9 84.0 —
Rider U IIA PI 119.4 102.0 88.5 — 71.9 104.9 153.6 132.8 107.6 — 87.0 134.4 28.1 100.0 90.1 0.0 0.0 1.0 1.0 1.3 45 45 14 1 25 46 23 0 119.4 102.8 87.5 — 119.3 101.1 89.1
Rutgers U-Camden 16 I PU 155.5 98.7 90.7 61.7 119.8 114.0 198.1 134.6 125.7 93.3 158.3 151.8 33.1 88.0 85.4 0.0 0.0 65 46 44 11 43 36 61 4 164.6 99.4 98.6 59.7 141.7 97.7 85.0 67.4
Rutgers U-New Brunswick 16 I PU 167.6 109.4 86.2 63.3 70.5 119.9 211.6 146.4 120.4 94.8 102.5 158.2 31.9 91.5 70.7 0.0 0.0 568 247 220 83 241 289 305 133 170.6 111.0 89.7 66.0 160.6 108.0 83.6 61.6
Rutgers U-Newark 16 I PU 183.0 129.6 106.2 67.6 111.1 137.1 228.9 169.2 143.1 99.8 148.5 177.5 29.5 89.3 76.4 0.0 0.0 134 88 106 15 62 60 70 18 188.3 131.7 110.7 75.2 171.7 126.6 99.4 61.1
Saint Peter’s U IIA PR 102.8 77.6 67.3 61.3 59.7 67.2 79.0 128.1 95.1 80.0 71.2 72.5 80.0 96.4 22.0 96.7 87.1 13.9 0.0 1.0 1.5 2.2 3.6 18 15 19 2 12 16 17 1 105.2 78.1 65.6 — 99.2 77.2 69.2 —
Stevens Institute Technology I PI 154.2 117.8 103.3 121.9 196.2 153.1 131.7 156.3 28.2 65.3 43.7 0.0 2.1 4.3 4.3 61 60 74 0 11 27 31 0 158.9 118.6 109.3 127.9 116.1 89.0
Stockton U IIA PU 124.2 98.4 77.6 70.4 95.4 172.1 135.8 106.7 98.6 131.9 38.3 100.0 98.5 10.2 3.0 2.4 3.5 5.5 5.6 38 61 40 13 38 68 58 20 124.1 99.2 79.3 70.3 124.2 97.6 76.4 70.5
William Paterson U New Jersey IIA PU 131.5 103.1 84.7 72.6 112.1 154.2 121.3 99.5 85.4 131.5 17.4 99.5 95.6 10.1 0.0 3.3 3.9 2.4 3.9 116 43 39 3 77 70 50 5 133.2 103.1 87.0 71.8 129.1 103.1 83.0 73.1
New MexicoNew Mexico St U-Alamogordo 1 III PU 62.8 55.1 56.9 46.6 58.5 82.6 72.6 76.0 54.6 76.5 30.8 76.5 66.7 50.0 0.0 2.0 2.0 2.0 8 3 1 1 9 6 3 2 63.4 54.1 — — 62.2 55.7 56.6 —
New Mexico St U-Carlsbad 1 III PU 61.5 57.4 52.4 46.1 53.9 83.0 80.5 72.8 59.9 72.6 34.9 83.3 20.0 16.7 0.0 2.0 4.6 3.1 2.6 6 4 4 6 6 1 2 7 60.8 57.9 52.1 46.3 62.1 — — 46.0
New Mexico St U-Dona Ana 1 III PU 58.5 53.5 50.9 46.0 52.6 78.3 71.6 68.8 60.2 70.3 33.7 100.0 94.1 37.5 0.0 1.9 3.5 2.4 2.4 21 6 21 15 22 11 19 15 59.2 52.5 50.9 45.7 57.7 54.0 50.8 46.3
New Mexico St U-Grants 1 III PU 60.8 51.8 41.9 50.2 76.1 71.0 53.7 65.9 31.3 100.0 83.3 0.0 2.8 2.8 1 3 0 2 2 3 0 3 — 52.5 — — 51.0 44.5
New Mexico St U-Main Campus 1 I PU 97.1 74.1 66.8 52.1 78.4 122.8 94.7 84.7 66.5 99.6 27.0 91.1 88.0 4.1 0.0 2.2 2.9 3.9 5.7 142 101 91 12 61 90 103 15 100.5 77.7 70.1 51.2 89.2 70.1 63.8 52.7
U New Mexico-Main Campus 1 I PU 113.6 81.4 77.9 45.6 56.1 85.9 142.6 103.6 99.3 59.7 72.3 109.0 26.8 97.3 93.1 0.4 0.0 2.8 3.2 2.7 3.1 185 150 100 18 110 153 133 16 116.4 82.0 78.6 46.0 108.8 80.7 77.3 45.2
New YorkAdelphi U IIA PI 143.7 109.5 91.1 73.8 75.5 103.2 111.3 185.4 144.0 115.8 83.5 94.1 130.9 143.5 28.9 100.0 97.6 3.0 0.0 2.6 3.0 3.2 4.4 53 55 29 4 36 69 37 8 147.8 113.4 91.0 72.9 137.8 106.4 91.1 74.2
Bard Coll IIA PI 145.9 101.1 84.2 112.8 182.8 131.6 110.6 144.4 28.1 70.7 90.4 0.0 3.7 4.9 4.7 35 25 31 0 23 27 15 0 146.9 102.8 84.2 144.5 99.5 84.1
Barnard Coll IIB PI 177.7 127.0 92.5 72.3 88.7 125.7 236.9 173.0 127.7 99.9 126.3 170.5 35.6 94.5 85.3 0.0 0.0 4.4 7.4 7.7 4.3 43 12 15 16 48 22 27 27 178.4 122.3 90.7 68.8 177.0 129.6 93.5 74.3
Canisius Coll IIA PR 89.2 71.2 72.2 52.2 75.6 116.1 93.2 92.6 67.6 98.4 30.1 100.0 100.0 0.0 0.0 1.6 0.4 1.7 0.0 31 34 15 3 15 27 13 8 93.4 72.9 68.0 62.1 80.5 69.1 77.1 48.4
Cayuga County CC III PU 84.6 71.4 64.6 — 77.2 111.1 96.2 81.6 — 101.3 31.2 100.0 100.0 12.5 0.0 1.9 4.6 4.6 13 4 2 1 12 4 6 1 84.6 71.4 — — 84.6 71.4 64.6 —
Cazenovia Coll IIB PI 77.0 64.6 51.2 45.3 63.9 91.7 81.4 59.7 52.7 76.6 19.9 100.0 100.0 16.7 0.0 0.0 1.7 0.0 3.0 9 3 3 3 12 8 9 4 77.8 62.2 51.5 46.6 76.4 65.5 51.1 44.3
Colgate U IIB PI 151.5 105.7 89.0 68.7 55.9 107.7 195.9 137.0 114.5 88.0 73.7 139.2 29.3 100.0 98.8 0.0 0.0 4.3 5.4 5.1 6.5 67 46 36 20 39 38 35 21 153.3 107.8 89.8 69.8 148.5 103.3 88.2 67.6
Coll Mount Saint Vincent IIA PR 97.9 77.2 73.6 67.6 77.6 112.1 89.5 87.5 74.8 90.3 16.4 88.9 54.1 3.9 0.0 1.4 0.6 0.3 0.0 6 18 11 1 3 19 15 5 98.7 77.0 72.0 — 96.4 77.3 74.7 67.8
Coll Staten Island CUNY IIA PU 121.0 100.2 84.7 70.9 99.8 158.4 137.6 122.1 108.3 137.2 37.5 95.4 96.3 16.3 0.8 1.7 1.0 80 56 42 0 50 52 44 0 122.7 100.2 85.4 118.2 100.2 84.1
Columbia U in New York 7 I PI 259.7 171.7 130.2 — 88.5 190.2 316.5 214.4 159.8 — 113.3 233.9 23.0 88.5 52.0 0.0 0.0 3.5 3.5 4.3 561 142 127 2 205 79 87 0 268.1 173.2 133.7 — 237.0 169.1 125.1
Cornell U 7 I PI 183.5 129.8 118.9 50.4 80.4 143.2 240.9 179.4 165.1 78.7 117.1 193.6 35.2 94.8 92.6 0.0 0.0 3.2 4.1 5.2 23.1 507 213 185 1 182 154 114 4 187.2 130.5 121.6 — 173.3 128.7 114.6 52.7
CUNY Bernard M Baruch Coll IIA PU 137.4 119.1 111.5 78.6 120.3 175.8 157.5 149.9 117.0 158.7 31.9 91.2 96.8 5.4 0.7 1.0 1.1 131 74 75 0 62 51 54 0 138.1 121.8 113.9 136.0 115.2 108.0
CUNY Borough Manhattan CC III PU 118.9 95.7 80.3 58.2 73.2 89.9 155.6 132.4 117.0 94.8 109.9 126.6 40.8 100.0 66.2 18.9 0.0 1.4 2.4 2.4 3.8 60 64 85 18 50 87 116 10 120.3 96.9 79.2 59.3 117.1 94.9 81.1 56.0
CUNY Bronx CC III PU 117.7 95.9 76.5 — 70.4 91.2 154.4 132.7 113.3 — 107.2 128.0 40.3 100.0 80.6 14.4 0.0 1.6 2.5 3.4 51 33 49 0 34 34 55 2 118.6 96.7 76.3 116.3 95.2 76.7 —
CUNY Brooklyn Coll IIA PU 124.7 100.3 87.5 70.2 103.6 162.3 137.9 125.2 107.9 141.3 36.3 95.5 94.2 16.1 0.8 1.5 0.9 126 78 50 0 76 76 62 0 126.9 102.0 87.6 121.0 98.5 87.5
CUNY City Coll I PU 135.8 105.3 89.9 87.7 114.6 174.0 143.6 128.2 125.9 152.8 33.4 92.0 92.3 10.7 0.9 1.3 1.4 182 89 55 0 79 66 48 0 138.0 105.9 91.2 130.8 104.6 88.5
CUNY Grad School and U Center I PU 152.4 113.1 95.9 71.2 138.7 191.4 152.1 135.0 110.2 177.8 28.1 76.3 64.3 8.3 1.2 1.8 2.1 102 19 12 0 67 23 12 0 158.4 111.1 102.9 143.2 114.7 89.0
CUNY Hostos CC III PU 116.6 94.5 81.1 67.6 72.8 88.9 153.2 131.1 117.7 104.2 109.4 125.5 41.2 100.0 96.8 22.4 0.0 1.6 2.3 2.0 19 13 34 2 17 18 42 1 116.2 95.8 81.5 — 116.9 93.5 80.8 —
CUNY Hunter Coll IIA PU 125.9 104.2 87.9 — 79.0 108.9 163.9 142.2 125.9 — 116.9 146.8 34.9 82.6 94.2 13.2 0.0 0.8 1.1 1.3 144 102 32 0 143 103 59 1 129.6 102.4 87.4 122.1 106.0 88.2 —
CUNY John Jay Coll Crim Justice IIA PU 127.8 101.6 84.8 76.5 101.4 165.2 139.1 122.2 114.0 138.8 36.9 96.1 93.0 22.0 0.7 1.0 1.1 65 84 32 0 38 74 59 0 129.0 101.8 87.3 125.5 101.4 83.4
CUNY Kingsborough CC III PU 119.2 95.3 81.3 70.5 73.0 89.9 155.8 131.9 118.0 107.2 109.7 126.5 40.8 100.0 88.6 30.2 0.0 1.9 2.1 2.5 6.4 40 24 44 1 30 46 52 2 118.1 96.8 81.0 — 120.6 94.5 81.6 —
CUNY LaGuardia CC III PU 116.3 92.7 79.1 72.1 78.1 94.5 153.4 129.7 116.1 109.1 115.2 131.5 39.2 100.0 41.4 5.0 0.0 1.9 2.6 4.0 1.6 51 55 27 0 51 78 53 4 116.9 93.0 79.0 115.8 92.5 79.1 72.1
CUNY Lehman Coll IIA PU 123.5 98.9 84.9 — 77.5 96.6 160.7 136.0 122.0 — 114.6 133.7 38.5 96.5 94.0 9.7 0.0 0.7 1.5 1.3 52 48 48 1 33 69 55 1 126.3 99.1 84.6 — 119.1 98.7 85.1 —
CUNY Medgar Evers Coll IIB PU 122.3 97.7 84.2 — 78.5 96.1 159.4 134.9 121.4 — 115.7 133.2 38.7 88.6 55.6 20.0 0.0 0.7 1.8 2.2 29 14 22 1 15 22 28 1 123.7 97.7 84.2 — 119.5 97.8 84.2 —
CUNY New York City Coll Technology IIB PU 119.6 98.3 83.6 57.7 76.9 95.1 156.7 135.4 120.7 94.7 114.0 132.1 39.0 98.8 87.7 38.0 0.0 1.3 2.3 1.9 43 70 81 1 39 60 82 2 121.4 99.0 84.0 — 117.6 97.6 83.2 —
CUNY Queens Coll IIA PU 125.3 101.6 84.0 74.4 101.1 162.8 139.0 121.4 111.8 138.6 37.0 94.5 95.4 11.7 0.6 1.8 1.5 134 77 54 0 66 95 49 0 126.9 101.6 84.7 122.1 101.5 83.1
CUNY Queensborough CC III PU 120.5 97.1 80.9 — 74.4 90.7 157.2 133.8 117.7 — 111.2 127.4 40.5 100.0 100.0 4.9 0.0 1.3 1.9 2.4 31 52 72 2 37 60 72 0 122.4 97.6 81.0 — 118.9 96.6 80.9
CUNY School Law IIA PU 158.7 131.5 106.0 92.2 138.7 198.0 170.8 145.4 131.5 178.1 28.3 85.7 8.3 0.0 0.0 0.5 2.3 15.2 12 2 1 2 16 10 2 6 155.2 — — — 161.3 131.1 — 91.1
CUNY York Coll IIB PU 115.2 98.7 82.9 79.8 96.8 152.4 135.9 120.1 117.0 134.0 38.5 89.6 90.1 20.0 1.0 1.7 1.4 26 36 23 0 22 35 27 0 117.8 98.6 83.3 112.1 98.7 82.5
Dominican Coll Blauvelt IIA PI 90.1 82.5 74.3 67.7 76.1 119.9 107.7 96.9 84.5 99.0 30.0 100.0 87.5 30.4 0.0 2.7 2.5 1.2 1.0 0 8 17 2 4 8 29 7 85.4 76.0 — 90.1 79.6 73.3 66.3
Farmingdale St Coll 7 IIB PU 106.0 82.3 73.2 — 68.5 81.3 144.9 114.0 98.5 — 93.0 110.5 35.9 96.2 83.0 5.6 0.0 6.3 5.7 4.4 5.5 30 24 75 1 23 23 69 0 110.6 82.0 71.0 — 99.9 82.6 75.5
Finger Lakes CC III PU 74.5 62.7 56.8 49.9 62.1 102.3 86.7 78.2 67.5 85.2 37.2 97.2 92.0 66.7 0.0 0.0 0.7 1.8 1.2 20 14 15 11 16 11 12 15 76.6 63.2 57.2 50.5 71.8 62.1 56.3 49.5
Fordham U I PR 171.9 120.3 102.3 103.8 67.6 54.9 124.0 228.7 168.2 138.2 141.3 95.2 84.1 168.8 36.1 100.0 95.6 21.0 0.0 2.7 3.4 3.6 3.1 156 112 56 46 72 92 68 42 176.1 120.0 103.2 99.7 162.8 120.6 101.5 108.4
Hamilton Coll IIB PI 146.2 111.3 88.8 75.6 115.2 184.0 143.3 114.1 91.4 145.7 26.5 100.0 100.0 0.0 4.2 4.2 4.9 48 24 13 0 30 16 32 0 150.4 110.2 88.7 139.6 112.9 88.8
Hartwick Coll IIB PI 85.8 68.4 61.1 — 71.7 103.1 81.4 71.2 85.0 18.5 97.3 76.0 0.0 0.0 3.9 7.1 13.7 22 12 16 0 15 13 25 1 84.2 65.5 58.8 88.3 71.1 62.6 —
Hilbert Coll IIB PR 70.9 56.8 51.7 60.1 87.8 75.4 65.3 76.5 27.3 46.2 0.0 0.0 0.0 2.1 0.0 9 4 7 0 4 8 5 0 71.0 53.3 56.2 70.6 58.5 45.5
Hobart William Smith Colls IIB PI 116.8 82.8 71.4 68.2 89.1 151.9 110.3 93.6 89.7 117.3 31.6 100.0 100.0 0.0 0.0 1.0 1.7 2.4 1.7 36 39 16 6 16 47 25 2 119.8 83.6 72.7 67.7 110.2 82.1 70.6 —
Hofstra U I PI 146.4 106.9 99.3 83.8 121.5 202.1 149.3 128.7 106.2 166.3 36.8 93.6 89.5 0.0 0.0 1.1 2.7 3.4 2.7 120 87 56 1 83 75 58 3 152.1 111.8 96.9 — 138.0 101.3 101.7 85.7
Iona Coll IIA PR 113.3 84.5 77.3 52.9 75.5 88.6 147.0 111.8 93.1 54.6 91.4 112.4 26.8 97.8 94.1 4.9 0.0 2.2 4.2 2.2 31 27 23 2 15 24 38 1 117.6 82.2 82.4 — 104.4 87.2 74.2 —
Ithaca Coll IIA PI 104.8 84.4 69.2 66.4 39.4 81.6 137.8 113.5 93.9 90.1 57.6 109.5 34.2 97.3 88.8 0.0 0.0 2.4 2.9 4.0 2.1 63 95 89 10 49 84 107 15 105.8 86.0 69.3 73.4 103.4 82.6 69.1 61.8
Keuka Coll IIA PR 77.6 64.0 62.4 — 66.6 98.2 81.5 78.9 — 84.5 26.7 100.0 83.3 2.9 0.0 0.0 0.0 0.0 10 8 12 1 11 16 23 0 77.4 66.2 61.8 — 77.9 62.9 62.7
© 2019 American Association of University Professors

APPENDIX I APPENDIX I
NAME NOTES
(1) (2) (3) (4) (5) (6) (7) (8) (9)
CAT. CTRL
AVG. SALARY ($1000s) AVG. COMPENSATION ($1000s) BEN. as %
of SAL.
PCT. TENURED PCT. INCR. (CONT. FAC.) F-T FAC. MEN F-T FAC. WOMEN AVG. SAL. MEN AVG. SAL. WOMEN
PR AO AI IN LE NR AR PR AO AI IN LE NR AR PR AO AI IN PR AO AI IN PR AO AI IN PR AO AI IN PR AO AI IN PR AO AI IN
New York (continued)Le Moyne Coll 7 IIA PR 105.0 78.6 70.9 64.5 82.2 132.6 101.5 94.4 81.7 105.6 28.4 100.0 96.6 3.2 0.0 0.7 3.1 3.5 1.6 32 30 17 15 16 28 14 15 104.7 79.2 73.9 61.4 105.6 78.0 67.4 67.5
Long Island U 7,26 I PI 121.6 101.4 91.5 72.7 104.9 163.5 142.1 122.7 180.4 144.4 37.6 94.3 78.3 0.0 0.0 2.1 2.1 2.2 1.8 103 94 52 2 71 113 92 6 126.0 101.1 92.7 — 115.3 101.7 90.9 70.3
Marist Coll 10 IIA PI 122.8 98.5 82.9 — 74.6 58.0 88.1 169.2 142.8 118.1 — 109.8 85.0 126.6 43.7 90.0 87.7 23.4 0.0 4.3 6.6 4.5 3.4 16 35 28 2 14 30 36 0 122.8 99.2 90.6 — 122.7 97.7 76.8
Marymount Manhattan Coll IIB PI 99.9 76.9 70.3 81.6 136.0 107.6 95.7 112.2 37.5 100.0 100.0 0.0 5.6 4.8 6.0 11 12 7 0 17 21 24 0 98.2 76.1 73.7 100.9 77.3 69.2
Medaille Coll 5 IIA PI 77.9 63.4 47.6 — 57.1 96.2 77.8 60.3 — 71.5 25.3 100.0 60.9 0.0 0.0 2.4 3.3 5.8 10 8 14 0 3 15 26 2 80.4 59.5 48.6 69.6 65.4 47.1 —
Mercy Coll IIA PI 102.2 91.4 83.9 86.3 88.9 135.4 123.8 112.9 117.9 119.8 34.7 84.6 45.5 9.7 0.0 14 26 34 7 12 40 59 5 100.8 87.5 71.3 79.4 103.8 93.8 91.1 95.9
Molloy Coll IIA PR 118.1 98.4 86.8 74.0 83.6 98.6 160.7 135.0 120.6 105.6 110.7 135.6 37.5 100.0 89.1 46.5 0.0 2.2 3.8 3.7 3.9 14 16 16 4 41 39 55 3 124.2 100.7 87.4 73.0 116.0 97.4 86.6 75.2
Monroe CC 11 III PU 84.6 62.0 56.9 51.3 56.6 65.4 119.7 91.0 82.4 74.3 81.9 94.5 44.4 100.0 94.3 72.6 8.3 2.8 1.8 1.7 0.0 28 48 31 17 50 57 31 19 87.7 63.2 57.3 51.3 82.8 61.0 56.4 51.3
Morrisville St Coll 7 III PU 77.7 65.0 56.5 45.5 62.9 107.5 91.8 80.3 71.2 89.0 41.4 100.0 100.0 10.9 0.0 6.6 6.0 5.1 3.2 15 31 29 2 6 26 26 2 75.8 65.0 57.5 — 82.3 64.9 55.4 —
Mount Saint Mary Coll IIA PR 97.4 74.7 71.1 63.8 — 78.8 124.6 99.4 95.3 84.7 — 103.3 31.2 100.0 100.0 0.0 0.0 2.0 2.5 4.0 2.0 11 14 8 1 10 15 12 6 102.0 73.9 71.7 — 92.3 75.5 70.7 63.2
Nazareth Coll IIA PI 91.4 76.3 65.3 — 76.6 117.8 103.4 81.3 — 98.7 28.8 98.4 83.7 6.7 0.0 4.0 5.4 4.8 32 15 18 0 30 28 57 2 94.4 74.7 63.8 88.3 77.2 65.7 —
New School I PI 147.9 108.9 84.9 55.9 — 106.0 191.3 147.3 116.6 70.6 — 142.1 34.0 70.4 44.1 0.0 0.0 3.7 2.6 3.7 3.7 46 71 70 4 35 72 84 6 150.5 110.0 85.0 60.4 144.4 107.8 84.9 52.8
New York Institute Technology IIA PI 135.3 101.6 92.2 — 107.2 168.7 132.4 116.3 — 136.6 27.4 98.3 87.2 11.6 0.0 3.2 2.2 2.3 45 51 38 1 12 43 31 0 139.0 107.4 93.9 — 121.4 94.8 90.0
New York U I PI 218.3 128.0 113.4 88.6 64.7 108.5 140.3 290.7 170.4 151.0 117.9 86.1 144.4 186.7 33.1 91.8 69.3 0.3 0.0 2.5 4.7 4.2 0.5 620 291 150 109 262 221 170 94 225.2 129.6 119.8 97.2 202.0 126.0 107.8 78.6
Niagara County CC III PU 91.3 72.5 62.4 49.4 77.7 134.4 109.5 94.6 69.4 114.7 47.5 100.0 100.0 92.3 0.0 0.7 1.6 1.8 4.8 23 7 6 6 31 8 7 10 94.8 74.1 64.3 49.3 88.7 71.1 60.8 49.4
Pace U-New York I PI 144.2 109.1 85.0 64.2 112.2 185.3 142.4 110.2 84.9 145.3 29.4 90.5 73.9 6.7 1.9 3.8 4.4 103 57 52 0 86 77 82 0 147.5 109.4 84.0 140.2 109.0 85.7
Rensselaer Polytechnic Institute 1 I PI 157.7 111.1 104.8 43.3 66.7 114.6 206.6 145.3 135.4 58.5 86.5 149.6 30.6 92.3 97.3 0.0 0.0 3.2 2.4 2.4 5.3 164 51 46 6 30 23 21 9 158.5 112.5 106.9 42.0 153.2 108.1 100.0 44.2
Rochester Institute Technology 1 I PI 128.9 97.2 86.1 62.8 68.8 93.9 166.0 127.7 111.1 81.1 92.3 122.7 30.6 100.0 98.6 6.9 0.0 2.5 2.9 2.8 2.7 188 169 111 29 61 107 63 24 130.7 99.2 88.0 64.8 123.5 94.0 82.9 60.4
Saint John Fisher Coll 7 IIA PR 108.8 86.8 77.1 56.1 54.6 85.5 136.8 112.6 96.9 76.1 66.2 109.2 27.8 100.0 89.4 4.1 0.0 2.3 2.7 2.8 27 43 28 5 11 61 45 5 113.3 85.9 83.8 57.0 97.9 87.4 72.9 55.2
Sarah Lawrence Coll IIA PI 110.4 85.6 77.3 55.2 93.2 144.8 117.0 105.2 67.5 123.3 32.3 100.0 100.0 0.0 0.0 2.2 2.7 3.0 0.7 33 13 9 6 27 11 11 8 109.5 85.5 76.9 57.7 111.4 85.7 77.5 53.4
Siena Coll IIB PR 105.0 86.0 75.8 57.1 86.4 139.5 117.3 100.9 81.3 116.3 34.6 100.0 94.9 4.8 0.0 0.0 0.9 4.6 0.0 34 47 30 7 26 31 33 7 107.3 86.9 76.9 54.5 102.1 84.7 74.9 59.7
Skidmore Coll IIB PI 126.3 98.3 79.9 61.5 60.1 97.9 165.1 132.6 104.8 89.6 74.4 129.7 32.5 97.0 89.2 0.0 0.0 3.0 3.5 3.6 5.1 39 31 30 0 28 43 44 10 128.2 99.6 81.2 123.6 97.3 79.0 61.5
St Francis Coll IIB PI 109.6 87.9 68.4 58.1 83.3 146.4 122.9 90.0 77.2 112.3 34.9 100.0 84.6 0.0 1.4 3.2 3.3 15 10 7 0 9 16 20 0 114.7 95.4 67.8 101.2 83.3 68.6
St John’s U-New York 7 I PR 160.0 117.8 92.0 — 125.6 208.1 156.0 107.2 — 161.7 28.8 93.3 96.3 0.0 0.0 3.0 2.6 4.3 3.0 128 154 73 1 80 144 70 1 166.6 124.5 93.2 — 149.5 110.6 90.7 —
St Lawrence U IIB PI 120.9 94.7 74.4 62.9 91.7 156.9 124.2 96.8 80.4 119.5 30.4 100.0 98.7 10.2 0.0 3.9 3.5 4.2 2.4 22 32 26 5 14 43 23 10 122.9 94.6 75.1 63.3 117.8 94.8 73.5 62.6
St. Joseph’s Coll-New York IIA PI 107.8 82.1 70.3 63.1 81.1 135.8 105.1 91.4 79.8 103.8 28.0 100.0 70.0 0.0 0.0 2.8 4.6 2.2 2.7 14 18 24 5 19 32 35 11 109.8 81.4 70.6 59.1 106.3 82.4 70.1 64.9
Stella and Charles Guttman CC III PU 113.7 103.7 79.5 68.5 69.9 84.7 150.0 140.0 115.8 104.7 106.2 121.0 42.8 85.7 66.7 0.0 0.0 1.1 1.2 2.1 3.3 3 2 11 4 4 4 20 1 118.2 — 80.4 67.6 110.3 99.9 79.0 —
Stony Brook U 7 I PU 163.7 109.5 92.9 79.6 67.7 118.5 210.9 145.8 124.0 108.5 91.4 155.6 31.3 94.0 78.7 0.4 0.0 6.7 6.0 5.1 3.0 264 161 151 3 85 120 121 5 166.3 111.2 96.0 73.1 155.6 107.2 89.1 83.5
Sullivan County CC III PU 62.2 56.0 38.0 55.0 92.5 86.3 56.4 82.5 50.0 100.0 100.0 33.3 7.6 3.0 2.3 10 4 3 0 10 5 6 0 64.8 56.6 33.8 59.5 55.5 40.2
SUNY Albany 7 I PU 131.3 99.8 82.3 61.8 98.6 172.4 134.9 111.5 84.4 132.2 34.0 98.2 97.2 0.0 6.4 6.7 4.4 121 127 110 0 46 90 99 0 132.7 102.1 84.1 127.7 96.5 80.2
SUNY Binghamton 7 I PU 136.8 98.9 82.5 63.1 57.8 97.2 179.2 133.3 110.3 89.7 81.3 129.9 33.7 98.4 93.5 0.4 14.3 6.8 6.2 5.4 8.0 132 115 145 6 53 86 115 15 141.1 102.3 84.8 53.3 126.1 94.4 79.5 67.0
SUNY Buffalo St 7 IIA PU 96.5 80.5 67.3 53.1 78.8 129.9 108.9 92.1 74.3 106.9 35.7 98.9 92.4 3.3 6.0 5.6 3.7 62 76 26 0 31 81 34 0 98.3 83.8 68.3 92.9 77.4 66.6
SUNY Coll Agriculture and Technology Cobleskill 7 IIB PU 82.4 67.6 56.8 47.4 66.9 113.0 95.7 76.2 64.9 92.3 38.1 100.0 70.3 0.0 0.0 6.1 6.2 3.2 6.0 21 21 14 6 10 16 13 6 82.4 68.7 57.9 47.7 82.3 66.1 55.6 47.1
SUNY Coll Brockport 7 IIA PU 98.6 79.4 66.6 59.7 54.0 75.8 133.3 109.5 90.8 80.4 73.3 103.6 36.7 100.0 88.8 2.2 0.0 6.1 5.7 4.5 4.9 37 70 39 1 21 73 54 10 102.4 82.7 67.2 — 91.9 76.1 66.2 59.4
SUNY Coll Environmental Science and Forestry 7 IIA PU 107.5 84.8 66.0 62.3 — 86.5 146.1 117.5 89.7 87.8 — 118.4 36.9 100.0 100.0 6.5 45.5 6.4 6.1 5.1 5.0 41 21 16 5 7 15 15 6 107.8 86.3 67.0 64.0 105.6 82.8 64.9 60.9
SUNY Coll Geneseo 7 IIA PU 97.1 77.9 61.1 — 54.6 75.6 129.2 105.9 84.3 — 76.8 102.7 35.8 97.3 94.7 8.7 0.0 6.3 5.9 4.4 49 43 32 1 26 33 37 0 97.8 79.5 60.9 — 95.6 75.8 61.3
SUNY Coll Old Westbury 7 IIA PU 107.5 92.3 82.3 — 59.8 87.1 143.2 124.6 106.5 — 77.7 115.4 32.5 100.0 93.6 0.0 50.0 8.0 6.1 5.1 3.2 10 30 30 2 13 32 37 0 118.0 95.0 87.7 — 99.4 89.7 77.9
SUNY Coll Oswego 7 IIA PU 93.7 77.5 59.6 43.9 58.8 71.1 126.7 105.6 82.2 61.6 84.4 97.2 36.8 98.7 80.6 5.1 0.0 6.8 6.1 5.6 14.1 52 51 86 7 26 47 89 4 94.6 79.9 59.6 41.0 91.9 75.0 59.5 48.8
SUNY Coll Plattsburgh 7 IIA PU 92.2 72.3 63.2 52.9 71.2 125.9 100.2 87.7 75.4 98.6 38.6 100.0 89.5 6.7 6.0 5.8 4.6 43 48 25 0 22 38 35 0 95.9 74.8 65.2 84.8 69.2 61.9
SUNY Coll Potsdam 7 IIA PU 83.4 66.5 54.0 40.8 50.1 64.5 114.6 93.1 75.5 57.8 72.4 89.9 39.4 100.0 100.0 1.5 21.7 5.4 5.4 3.7 7.0 48 41 29 6 24 31 36 17 85.0 64.6 54.0 45.5 80.3 69.0 54.0 39.2
SUNY Coll Technology Alfred 7 III PU 78.4 67.6 59.0 44.8 33.8 58.2 109.0 94.4 84.0 67.3 48.9 82.8 42.3 92.0 90.9 22.2 3.6 6.1 6.1 5.2 3.7 15 25 37 27 10 8 26 1 77.2 68.4 57.7 44.9 80.0 65.3 60.7 —
SUNY Coll Technology Canton 7 III PU 86.4 73.7 64.9 39.3 50.2 63.3 118.0 102.9 92.6 53.5 71.6 88.3 39.5 100.0 77.8 21.4 4.2 6.1 5.7 5.6 0.0 12 16 14 10 13 11 14 14 83.8 73.2 69.0 43.2 88.8 74.4 60.8 36.6
SUNY Coll Technology Delhi 7 III PU 77.1 64.6 55.4 50.5 — 60.5 106.8 90.8 79.1 72.1 85.2 41.0 96.2 58.3 12.5 14.3 6.1 5.3 3.6 4.4 15 12 28 21 11 24 28 7 77.2 64.7 55.3 50.0 77.0 64.6 55.6 52.0
SUNY Cortland 7 IIA PU 88.2 72.4 59.5 53.5 48.2 67.9 119.8 100.3 82.3 77.6 68.8 93.9 38.3 100.0 88.3 4.2 25.0 6.7 5.8 4.9 7.2 43 37 50 5 34 57 46 7 89.9 74.5 59.2 52.1 86.1 71.1 59.9 54.6
SUNY Empire St Coll 7 IIA PU 85.7 69.7 63.1 — 59.8 71.6 117.3 98.4 88.3 — 79.5 100.0 39.6 94.7 95.6 35.5 0.0 5.9 5.8 4.9 17 32 8 0 21 59 23 1 90.0 73.5 62.1 82.3 67.6 63.5 —
SUNY Fredonia 7 IIA PU 93.6 71.3 62.1 45.8 70.5 129.2 99.9 86.0 66.5 98.4 39.7 100.0 95.7 3.9 6.1 6.0 4.4 40 48 30 0 22 44 21 0 96.3 69.8 62.6 88.7 73.0 61.4
SUNY Maritime Coll 7 IIB PU 96.7 80.7 72.0 — 61.9 76.1 131.2 110.7 97.9 — 85.6 104.2 36.9 95.5 85.0 11.8 0.0 6.1 5.9 4.8 17 15 9 1 5 5 8 0 97.9 82.0 75.9 — 92.5 76.8 67.6
SUNY New Paltz 7 IIA PU 101.2 75.3 66.6 60.3 54.6 72.9 136.9 104.6 92.6 86.7 76.9 101.0 38.6 100.0 93.7 5.8 50.0 6.1 5.9 4.7 6.3 32 73 38 1 19 70 48 7 108.2 77.8 68.7 — 89.4 72.6 64.9 60.9
SUNY Oneonta 7 IIA PU 87.6 72.0 63.3 49.9 69.0 120.6 100.5 87.9 68.7 95.7 38.7 98.3 91.6 11.1 6.1 5.6 4.4 39 50 42 0 20 45 48 0 88.6 72.3 65.2 85.7 71.6 61.6
SUNY Polytechnic Institute 7 IIA PU 132.4 100.6 81.6 71.2 58.2 95.7 177.2 134.8 110.4 94.9 81.8 129.0 34.9 93.8 88.0 5.4 0.0 6.0 5.8 6.6 6.7 26 34 20 1 6 16 17 2 139.2 104.8 83.1 — 102.7 91.8 79.8 —
SUNY Purchase Coll 7 IIB PU 100.7 79.3 61.4 — 75.4 134.5 109.0 81.7 — 101.9 35.1 100.0 83.3 0.0 6.2 6.5 4.5 15 34 30 0 15 38 42 0 103.8 79.3 61.6 97.6 79.2 61.2
SUNY Westchester CC III PU 127.6 114.2 96.4 70.5 104.0 200.0 183.3 162.4 131.3 171.5 64.9 100.0 100.0 91.5 29.4 7.0 9.2 11.6 15.4 21 19 21 13 29 12 26 21 127.2 114.3 92.9 70.6 127.8 114.0 99.2 70.4
Syracuse U 5 I PI 133.4 102.0 80.6 57.2 53.7 106.4 177.8 142.4 114.5 82.7 84.3 146.1 37.4 81.8 91.7 2.4 0.0 3.2 5.3 5.0 4.5 282 177 164 2 131 160 172 7 137.9 102.3 83.8 — 123.6 101.5 77.6 54.3
Tompkins Cortland CC III PU 81.1 65.1 60.0 52.9 76.0 107.9 80.4 86.4 79.9 101.6 33.7 100.0 66.7 33.3 0.0 3.0 14.3 4.0 2.8 19 1 0 3 26 5 3 2 83.0 — 51.8 79.8 65.5 60.0 —
U Buffalo 7 I PU 143.9 98.1 83.7 58.2 70.9 105.7 187.6 131.5 111.3 77.8 96.3 139.8 32.3 94.4 79.8 0.0 0.0 6.5 6.0 5.2 4.4 281 207 210 4 95 154 183 10 149.1 101.7 88.8 52.3 128.4 93.3 77.8 60.5
U Rochester 7 I PI 168.3 115.0 108.2 53.1 68.2 79.9 121.6 206.7 141.5 131.8 63.1 83.7 98.2 149.1 22.7 99.2 93.0 0.0 0.0 2.5 3.8 3.7 2.6 195 92 91 14 50 51 42 9 171.0 117.2 115.4 55.2 157.8 111.0 92.4 49.9
Union Coll IIB PI 133.6 98.9 77.0 66.6 74.5 — 105.4 182.5 134.1 104.4 82.9 106.7 — 143.5 36.1 100.0 100.0 0.0 0.0 55 30 16 8 31 30 14 6 137.3 100.2 78.0 66.6 127.2 97.6 75.9 66.5
Utica Coll IIA PI 96.0 85.5 73.9 76.0 82.4 134.7 120.3 104.2 100.8 114.5 39.0 100.0 86.7 12.5 4.1 4.3 5.0 22 24 22 0 8 21 18 0 98.0 88.4 73.8 90.2 82.3 74.1
© 2019 American Association of University Professors
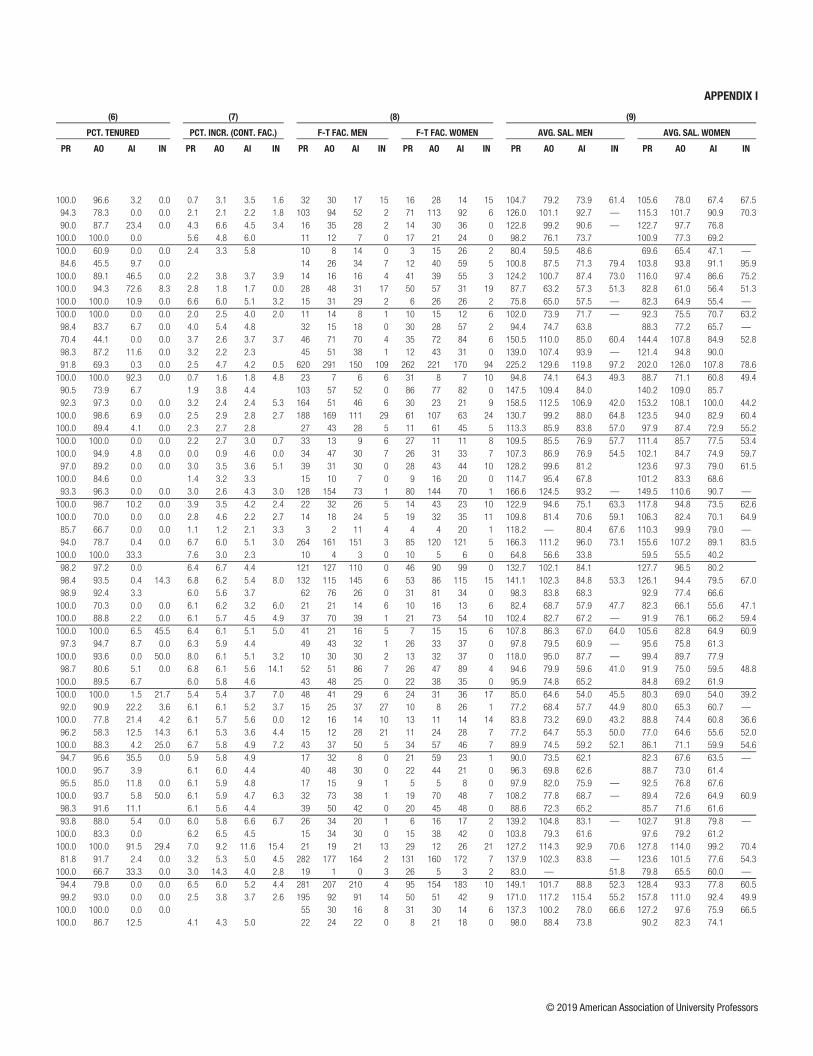
APPENDIX I APPENDIX I
NAME NOTES
(1) (2) (3) (4) (5) (6) (7) (8) (9)
CAT. CTRL
AVG. SALARY ($1000s) AVG. COMPENSATION ($1000s) BEN. as %
of SAL.
PCT. TENURED PCT. INCR. (CONT. FAC.) F-T FAC. MEN F-T FAC. WOMEN AVG. SAL. MEN AVG. SAL. WOMEN
PR AO AI IN LE NR AR PR AO AI IN LE NR AR PR AO AI IN PR AO AI IN PR AO AI IN PR AO AI IN PR AO AI IN PR AO AI IN
New York (continued)Le Moyne Coll 7 IIA PR 105.0 78.6 70.9 64.5 82.2 132.6 101.5 94.4 81.7 105.6 28.4 100.0 96.6 3.2 0.0 0.7 3.1 3.5 1.6 32 30 17 15 16 28 14 15 104.7 79.2 73.9 61.4 105.6 78.0 67.4 67.5
Long Island U 7,26 I PI 121.6 101.4 91.5 72.7 104.9 163.5 142.1 122.7 180.4 144.4 37.6 94.3 78.3 0.0 0.0 2.1 2.1 2.2 1.8 103 94 52 2 71 113 92 6 126.0 101.1 92.7 — 115.3 101.7 90.9 70.3
Marist Coll 10 IIA PI 122.8 98.5 82.9 — 74.6 58.0 88.1 169.2 142.8 118.1 — 109.8 85.0 126.6 43.7 90.0 87.7 23.4 0.0 4.3 6.6 4.5 3.4 16 35 28 2 14 30 36 0 122.8 99.2 90.6 — 122.7 97.7 76.8
Marymount Manhattan Coll IIB PI 99.9 76.9 70.3 81.6 136.0 107.6 95.7 112.2 37.5 100.0 100.0 0.0 5.6 4.8 6.0 11 12 7 0 17 21 24 0 98.2 76.1 73.7 100.9 77.3 69.2
Medaille Coll 5 IIA PI 77.9 63.4 47.6 — 57.1 96.2 77.8 60.3 — 71.5 25.3 100.0 60.9 0.0 0.0 2.4 3.3 5.8 10 8 14 0 3 15 26 2 80.4 59.5 48.6 69.6 65.4 47.1 —
Mercy Coll IIA PI 102.2 91.4 83.9 86.3 88.9 135.4 123.8 112.9 117.9 119.8 34.7 84.6 45.5 9.7 0.0 14 26 34 7 12 40 59 5 100.8 87.5 71.3 79.4 103.8 93.8 91.1 95.9
Molloy Coll IIA PR 118.1 98.4 86.8 74.0 83.6 98.6 160.7 135.0 120.6 105.6 110.7 135.6 37.5 100.0 89.1 46.5 0.0 2.2 3.8 3.7 3.9 14 16 16 4 41 39 55 3 124.2 100.7 87.4 73.0 116.0 97.4 86.6 75.2
Monroe CC 11 III PU 84.6 62.0 56.9 51.3 56.6 65.4 119.7 91.0 82.4 74.3 81.9 94.5 44.4 100.0 94.3 72.6 8.3 2.8 1.8 1.7 0.0 28 48 31 17 50 57 31 19 87.7 63.2 57.3 51.3 82.8 61.0 56.4 51.3
Morrisville St Coll 7 III PU 77.7 65.0 56.5 45.5 62.9 107.5 91.8 80.3 71.2 89.0 41.4 100.0 100.0 10.9 0.0 6.6 6.0 5.1 3.2 15 31 29 2 6 26 26 2 75.8 65.0 57.5 — 82.3 64.9 55.4 —
Mount Saint Mary Coll IIA PR 97.4 74.7 71.1 63.8 — 78.8 124.6 99.4 95.3 84.7 — 103.3 31.2 100.0 100.0 0.0 0.0 2.0 2.5 4.0 2.0 11 14 8 1 10 15 12 6 102.0 73.9 71.7 — 92.3 75.5 70.7 63.2
Nazareth Coll IIA PI 91.4 76.3 65.3 — 76.6 117.8 103.4 81.3 — 98.7 28.8 98.4 83.7 6.7 0.0 4.0 5.4 4.8 32 15 18 0 30 28 57 2 94.4 74.7 63.8 88.3 77.2 65.7 —
New School I PI 147.9 108.9 84.9 55.9 — 106.0 191.3 147.3 116.6 70.6 — 142.1 34.0 70.4 44.1 0.0 0.0 3.7 2.6 3.7 3.7 46 71 70 4 35 72 84 6 150.5 110.0 85.0 60.4 144.4 107.8 84.9 52.8
New York Institute Technology IIA PI 135.3 101.6 92.2 — 107.2 168.7 132.4 116.3 — 136.6 27.4 98.3 87.2 11.6 0.0 3.2 2.2 2.3 45 51 38 1 12 43 31 0 139.0 107.4 93.9 — 121.4 94.8 90.0
New York U I PI 218.3 128.0 113.4 88.6 64.7 108.5 140.3 290.7 170.4 151.0 117.9 86.1 144.4 186.7 33.1 91.8 69.3 0.3 0.0 2.5 4.7 4.2 0.5 620 291 150 109 262 221 170 94 225.2 129.6 119.8 97.2 202.0 126.0 107.8 78.6
Niagara County CC III PU 91.3 72.5 62.4 49.4 77.7 134.4 109.5 94.6 69.4 114.7 47.5 100.0 100.0 92.3 0.0 0.7 1.6 1.8 4.8 23 7 6 6 31 8 7 10 94.8 74.1 64.3 49.3 88.7 71.1 60.8 49.4
Pace U-New York I PI 144.2 109.1 85.0 64.2 112.2 185.3 142.4 110.2 84.9 145.3 29.4 90.5 73.9 6.7 1.9 3.8 4.4 103 57 52 0 86 77 82 0 147.5 109.4 84.0 140.2 109.0 85.7
Rensselaer Polytechnic Institute 1 I PI 157.7 111.1 104.8 43.3 66.7 114.6 206.6 145.3 135.4 58.5 86.5 149.6 30.6 92.3 97.3 0.0 0.0 3.2 2.4 2.4 5.3 164 51 46 6 30 23 21 9 158.5 112.5 106.9 42.0 153.2 108.1 100.0 44.2
Rochester Institute Technology 1 I PI 128.9 97.2 86.1 62.8 68.8 93.9 166.0 127.7 111.1 81.1 92.3 122.7 30.6 100.0 98.6 6.9 0.0 2.5 2.9 2.8 2.7 188 169 111 29 61 107 63 24 130.7 99.2 88.0 64.8 123.5 94.0 82.9 60.4
Saint John Fisher Coll 7 IIA PR 108.8 86.8 77.1 56.1 54.6 85.5 136.8 112.6 96.9 76.1 66.2 109.2 27.8 100.0 89.4 4.1 0.0 2.3 2.7 2.8 27 43 28 5 11 61 45 5 113.3 85.9 83.8 57.0 97.9 87.4 72.9 55.2
Sarah Lawrence Coll IIA PI 110.4 85.6 77.3 55.2 93.2 144.8 117.0 105.2 67.5 123.3 32.3 100.0 100.0 0.0 0.0 2.2 2.7 3.0 0.7 33 13 9 6 27 11 11 8 109.5 85.5 76.9 57.7 111.4 85.7 77.5 53.4
Siena Coll IIB PR 105.0 86.0 75.8 57.1 86.4 139.5 117.3 100.9 81.3 116.3 34.6 100.0 94.9 4.8 0.0 0.0 0.9 4.6 0.0 34 47 30 7 26 31 33 7 107.3 86.9 76.9 54.5 102.1 84.7 74.9 59.7
Skidmore Coll IIB PI 126.3 98.3 79.9 61.5 60.1 97.9 165.1 132.6 104.8 89.6 74.4 129.7 32.5 97.0 89.2 0.0 0.0 3.0 3.5 3.6 5.1 39 31 30 0 28 43 44 10 128.2 99.6 81.2 123.6 97.3 79.0 61.5
St Francis Coll IIB PI 109.6 87.9 68.4 58.1 83.3 146.4 122.9 90.0 77.2 112.3 34.9 100.0 84.6 0.0 1.4 3.2 3.3 15 10 7 0 9 16 20 0 114.7 95.4 67.8 101.2 83.3 68.6
St John’s U-New York 7 I PR 160.0 117.8 92.0 — 125.6 208.1 156.0 107.2 — 161.7 28.8 93.3 96.3 0.0 0.0 3.0 2.6 4.3 3.0 128 154 73 1 80 144 70 1 166.6 124.5 93.2 — 149.5 110.6 90.7 —
St Lawrence U IIB PI 120.9 94.7 74.4 62.9 91.7 156.9 124.2 96.8 80.4 119.5 30.4 100.0 98.7 10.2 0.0 3.9 3.5 4.2 2.4 22 32 26 5 14 43 23 10 122.9 94.6 75.1 63.3 117.8 94.8 73.5 62.6
St. Joseph’s Coll-New York IIA PI 107.8 82.1 70.3 63.1 81.1 135.8 105.1 91.4 79.8 103.8 28.0 100.0 70.0 0.0 0.0 2.8 4.6 2.2 2.7 14 18 24 5 19 32 35 11 109.8 81.4 70.6 59.1 106.3 82.4 70.1 64.9
Stella and Charles Guttman CC III PU 113.7 103.7 79.5 68.5 69.9 84.7 150.0 140.0 115.8 104.7 106.2 121.0 42.8 85.7 66.7 0.0 0.0 1.1 1.2 2.1 3.3 3 2 11 4 4 4 20 1 118.2 — 80.4 67.6 110.3 99.9 79.0 —
Stony Brook U 7 I PU 163.7 109.5 92.9 79.6 67.7 118.5 210.9 145.8 124.0 108.5 91.4 155.6 31.3 94.0 78.7 0.4 0.0 6.7 6.0 5.1 3.0 264 161 151 3 85 120 121 5 166.3 111.2 96.0 73.1 155.6 107.2 89.1 83.5
Sullivan County CC III PU 62.2 56.0 38.0 55.0 92.5 86.3 56.4 82.5 50.0 100.0 100.0 33.3 7.6 3.0 2.3 10 4 3 0 10 5 6 0 64.8 56.6 33.8 59.5 55.5 40.2
SUNY Albany 7 I PU 131.3 99.8 82.3 61.8 98.6 172.4 134.9 111.5 84.4 132.2 34.0 98.2 97.2 0.0 6.4 6.7 4.4 121 127 110 0 46 90 99 0 132.7 102.1 84.1 127.7 96.5 80.2
SUNY Binghamton 7 I PU 136.8 98.9 82.5 63.1 57.8 97.2 179.2 133.3 110.3 89.7 81.3 129.9 33.7 98.4 93.5 0.4 14.3 6.8 6.2 5.4 8.0 132 115 145 6 53 86 115 15 141.1 102.3 84.8 53.3 126.1 94.4 79.5 67.0
SUNY Buffalo St 7 IIA PU 96.5 80.5 67.3 53.1 78.8 129.9 108.9 92.1 74.3 106.9 35.7 98.9 92.4 3.3 6.0 5.6 3.7 62 76 26 0 31 81 34 0 98.3 83.8 68.3 92.9 77.4 66.6
SUNY Coll Agriculture and Technology Cobleskill 7 IIB PU 82.4 67.6 56.8 47.4 66.9 113.0 95.7 76.2 64.9 92.3 38.1 100.0 70.3 0.0 0.0 6.1 6.2 3.2 6.0 21 21 14 6 10 16 13 6 82.4 68.7 57.9 47.7 82.3 66.1 55.6 47.1
SUNY Coll Brockport 7 IIA PU 98.6 79.4 66.6 59.7 54.0 75.8 133.3 109.5 90.8 80.4 73.3 103.6 36.7 100.0 88.8 2.2 0.0 6.1 5.7 4.5 4.9 37 70 39 1 21 73 54 10 102.4 82.7 67.2 — 91.9 76.1 66.2 59.4
SUNY Coll Environmental Science and Forestry 7 IIA PU 107.5 84.8 66.0 62.3 — 86.5 146.1 117.5 89.7 87.8 — 118.4 36.9 100.0 100.0 6.5 45.5 6.4 6.1 5.1 5.0 41 21 16 5 7 15 15 6 107.8 86.3 67.0 64.0 105.6 82.8 64.9 60.9
SUNY Coll Geneseo 7 IIA PU 97.1 77.9 61.1 — 54.6 75.6 129.2 105.9 84.3 — 76.8 102.7 35.8 97.3 94.7 8.7 0.0 6.3 5.9 4.4 49 43 32 1 26 33 37 0 97.8 79.5 60.9 — 95.6 75.8 61.3
SUNY Coll Old Westbury 7 IIA PU 107.5 92.3 82.3 — 59.8 87.1 143.2 124.6 106.5 — 77.7 115.4 32.5 100.0 93.6 0.0 50.0 8.0 6.1 5.1 3.2 10 30 30 2 13 32 37 0 118.0 95.0 87.7 — 99.4 89.7 77.9
SUNY Coll Oswego 7 IIA PU 93.7 77.5 59.6 43.9 58.8 71.1 126.7 105.6 82.2 61.6 84.4 97.2 36.8 98.7 80.6 5.1 0.0 6.8 6.1 5.6 14.1 52 51 86 7 26 47 89 4 94.6 79.9 59.6 41.0 91.9 75.0 59.5 48.8
SUNY Coll Plattsburgh 7 IIA PU 92.2 72.3 63.2 52.9 71.2 125.9 100.2 87.7 75.4 98.6 38.6 100.0 89.5 6.7 6.0 5.8 4.6 43 48 25 0 22 38 35 0 95.9 74.8 65.2 84.8 69.2 61.9
SUNY Coll Potsdam 7 IIA PU 83.4 66.5 54.0 40.8 50.1 64.5 114.6 93.1 75.5 57.8 72.4 89.9 39.4 100.0 100.0 1.5 21.7 5.4 5.4 3.7 7.0 48 41 29 6 24 31 36 17 85.0 64.6 54.0 45.5 80.3 69.0 54.0 39.2
SUNY Coll Technology Alfred 7 III PU 78.4 67.6 59.0 44.8 33.8 58.2 109.0 94.4 84.0 67.3 48.9 82.8 42.3 92.0 90.9 22.2 3.6 6.1 6.1 5.2 3.7 15 25 37 27 10 8 26 1 77.2 68.4 57.7 44.9 80.0 65.3 60.7 —
SUNY Coll Technology Canton 7 III PU 86.4 73.7 64.9 39.3 50.2 63.3 118.0 102.9 92.6 53.5 71.6 88.3 39.5 100.0 77.8 21.4 4.2 6.1 5.7 5.6 0.0 12 16 14 10 13 11 14 14 83.8 73.2 69.0 43.2 88.8 74.4 60.8 36.6
SUNY Coll Technology Delhi 7 III PU 77.1 64.6 55.4 50.5 — 60.5 106.8 90.8 79.1 72.1 85.2 41.0 96.2 58.3 12.5 14.3 6.1 5.3 3.6 4.4 15 12 28 21 11 24 28 7 77.2 64.7 55.3 50.0 77.0 64.6 55.6 52.0
SUNY Cortland 7 IIA PU 88.2 72.4 59.5 53.5 48.2 67.9 119.8 100.3 82.3 77.6 68.8 93.9 38.3 100.0 88.3 4.2 25.0 6.7 5.8 4.9 7.2 43 37 50 5 34 57 46 7 89.9 74.5 59.2 52.1 86.1 71.1 59.9 54.6
SUNY Empire St Coll 7 IIA PU 85.7 69.7 63.1 — 59.8 71.6 117.3 98.4 88.3 — 79.5 100.0 39.6 94.7 95.6 35.5 0.0 5.9 5.8 4.9 17 32 8 0 21 59 23 1 90.0 73.5 62.1 82.3 67.6 63.5 —
SUNY Fredonia 7 IIA PU 93.6 71.3 62.1 45.8 70.5 129.2 99.9 86.0 66.5 98.4 39.7 100.0 95.7 3.9 6.1 6.0 4.4 40 48 30 0 22 44 21 0 96.3 69.8 62.6 88.7 73.0 61.4
SUNY Maritime Coll 7 IIB PU 96.7 80.7 72.0 — 61.9 76.1 131.2 110.7 97.9 — 85.6 104.2 36.9 95.5 85.0 11.8 0.0 6.1 5.9 4.8 17 15 9 1 5 5 8 0 97.9 82.0 75.9 — 92.5 76.8 67.6
SUNY New Paltz 7 IIA PU 101.2 75.3 66.6 60.3 54.6 72.9 136.9 104.6 92.6 86.7 76.9 101.0 38.6 100.0 93.7 5.8 50.0 6.1 5.9 4.7 6.3 32 73 38 1 19 70 48 7 108.2 77.8 68.7 — 89.4 72.6 64.9 60.9
SUNY Oneonta 7 IIA PU 87.6 72.0 63.3 49.9 69.0 120.6 100.5 87.9 68.7 95.7 38.7 98.3 91.6 11.1 6.1 5.6 4.4 39 50 42 0 20 45 48 0 88.6 72.3 65.2 85.7 71.6 61.6
SUNY Polytechnic Institute 7 IIA PU 132.4 100.6 81.6 71.2 58.2 95.7 177.2 134.8 110.4 94.9 81.8 129.0 34.9 93.8 88.0 5.4 0.0 6.0 5.8 6.6 6.7 26 34 20 1 6 16 17 2 139.2 104.8 83.1 — 102.7 91.8 79.8 —
SUNY Purchase Coll 7 IIB PU 100.7 79.3 61.4 — 75.4 134.5 109.0 81.7 — 101.9 35.1 100.0 83.3 0.0 6.2 6.5 4.5 15 34 30 0 15 38 42 0 103.8 79.3 61.6 97.6 79.2 61.2
SUNY Westchester CC III PU 127.6 114.2 96.4 70.5 104.0 200.0 183.3 162.4 131.3 171.5 64.9 100.0 100.0 91.5 29.4 7.0 9.2 11.6 15.4 21 19 21 13 29 12 26 21 127.2 114.3 92.9 70.6 127.8 114.0 99.2 70.4
Syracuse U 5 I PI 133.4 102.0 80.6 57.2 53.7 106.4 177.8 142.4 114.5 82.7 84.3 146.1 37.4 81.8 91.7 2.4 0.0 3.2 5.3 5.0 4.5 282 177 164 2 131 160 172 7 137.9 102.3 83.8 — 123.6 101.5 77.6 54.3
Tompkins Cortland CC III PU 81.1 65.1 60.0 52.9 76.0 107.9 80.4 86.4 79.9 101.6 33.7 100.0 66.7 33.3 0.0 3.0 14.3 4.0 2.8 19 1 0 3 26 5 3 2 83.0 — 51.8 79.8 65.5 60.0 —
U Buffalo 7 I PU 143.9 98.1 83.7 58.2 70.9 105.7 187.6 131.5 111.3 77.8 96.3 139.8 32.3 94.4 79.8 0.0 0.0 6.5 6.0 5.2 4.4 281 207 210 4 95 154 183 10 149.1 101.7 88.8 52.3 128.4 93.3 77.8 60.5
U Rochester 7 I PI 168.3 115.0 108.2 53.1 68.2 79.9 121.6 206.7 141.5 131.8 63.1 83.7 98.2 149.1 22.7 99.2 93.0 0.0 0.0 2.5 3.8 3.7 2.6 195 92 91 14 50 51 42 9 171.0 117.2 115.4 55.2 157.8 111.0 92.4 49.9
Union Coll IIB PI 133.6 98.9 77.0 66.6 74.5 — 105.4 182.5 134.1 104.4 82.9 106.7 — 143.5 36.1 100.0 100.0 0.0 0.0 55 30 16 8 31 30 14 6 137.3 100.2 78.0 66.6 127.2 97.6 75.9 66.5
Utica Coll IIA PI 96.0 85.5 73.9 76.0 82.4 134.7 120.3 104.2 100.8 114.5 39.0 100.0 86.7 12.5 4.1 4.3 5.0 22 24 22 0 8 21 18 0 98.0 88.4 73.8 90.2 82.3 74.1
© 2019 American Association of University Professors
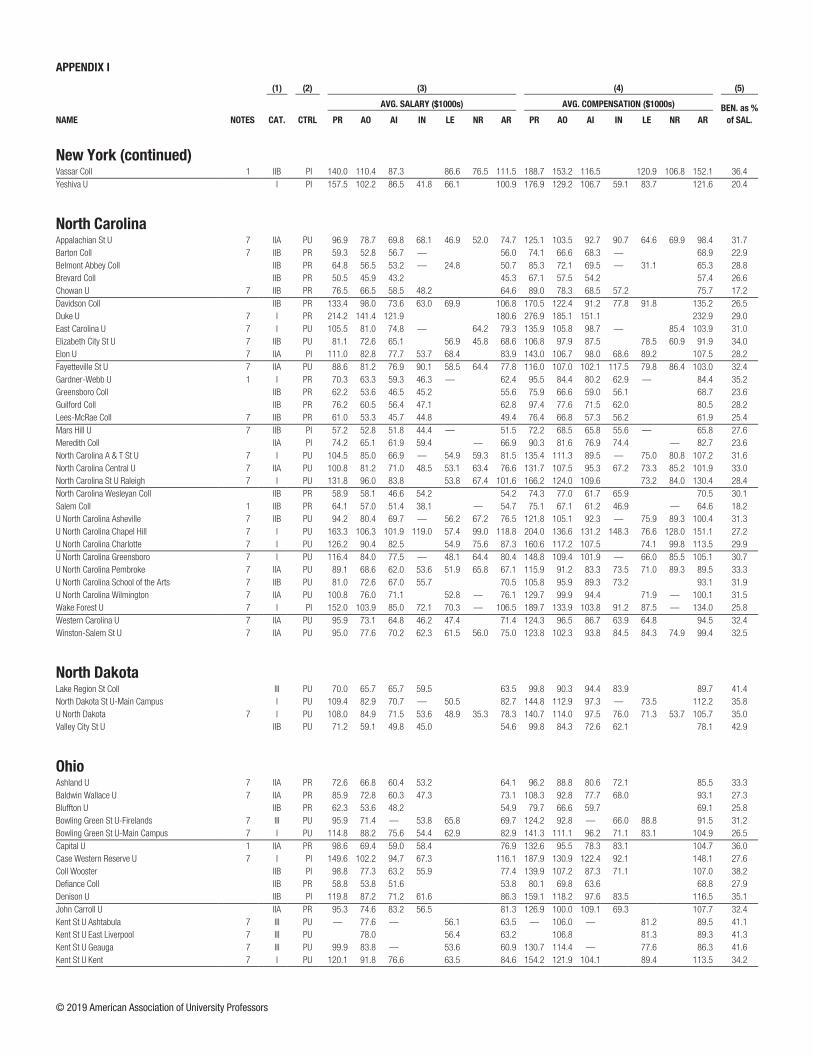
APPENDIX I APPENDIX I
NAME NOTES
(1) (2) (3) (4) (5) (6) (7) (8) (9)
CAT. CTRL
AVG. SALARY ($1000s) AVG. COMPENSATION ($1000s) BEN. as %
of SAL.
PCT. TENURED PCT. INCR. (CONT. FAC.) F-T FAC. MEN F-T FAC. WOMEN AVG. SAL. MEN AVG. SAL. WOMEN
PR AO AI IN LE NR AR PR AO AI IN LE NR AR PR AO AI IN PR AO AI IN PR AO AI IN PR AO AI IN PR AO AI IN PR AO AI IN
New York (continued)Vassar Coll 1 IIB PI 140.0 110.4 87.3 86.6 76.5 111.5 188.7 153.2 116.5 120.9 106.8 152.1 36.4 100.0 100.0 0.0 3.9 4.6 4.5 53 41 22 0 46 39 22 0 145.5 113.2 87.7 133.7 107.4 86.9
Yeshiva U I PI 157.5 102.2 86.5 41.8 66.1 100.9 176.9 129.2 106.7 59.1 83.7 121.6 20.4 78.6 75.3 3.9 1.1 2.1 1.8 -0.6 10.8 83 45 34 53 34 32 43 37 168.1 106.4 99.3 49.7 131.5 96.2 76.5 30.3
North CarolinaAppalachian St U 7 IIA PU 96.9 78.7 69.8 68.1 46.9 52.0 74.7 125.1 103.5 92.7 90.7 64.6 69.9 98.4 31.7 99.1 96.0 0.0 0.0 0.5 2.0 0.9 6.1 187 116 97 4 131 110 103 3 99.5 80.9 70.7 78.1 93.2 76.4 68.9 54.8
Barton Coll 7 IIB PR 59.3 52.8 56.7 — 56.0 74.1 66.6 68.3 — 68.9 22.9 100.0 88.2 5.6 0.0 3.2 4.1 2.4 9 9 18 1 9 8 18 1 59.4 50.8 56.5 — 59.2 55.1 56.8 —
Belmont Abbey Coll IIB PR 64.8 56.5 53.2 — 24.8 50.7 85.3 72.1 69.5 — 31.1 65.3 28.8 100.0 71.9 0.0 0.0 1.0 0.9 0.7 5 16 8 1 3 16 8 1 64.1 57.9 56.6 — 65.9 55.2 49.8 —
Brevard Coll IIB PR 50.5 45.9 43.2 45.3 67.1 57.5 54.2 57.4 26.6 87.5 85.0 0.0 2.7 2.0 1.0 3 13 13 0 5 7 11 0 46.9 45.2 43.2 52.6 47.1 43.2
Chowan U 7 IIB PR 76.5 66.5 58.5 48.2 64.6 89.0 78.3 68.5 57.2 75.7 17.2 92.9 72.7 0.0 0.0 2.3 1.1 1.1 2.0 7 12 13 1 7 10 13 2 72.1 66.8 60.7 — 80.9 66.1 56.4 —
Davidson Coll IIB PR 133.4 98.0 73.6 63.0 69.9 106.8 170.5 122.4 91.2 77.8 91.8 135.2 26.5 98.0 93.9 0.0 0.0 3.2 3.7 4.0 61 19 25 2 38 14 38 1 136.7 98.9 73.6 — 128.1 96.8 73.6 —
Duke U 7 I PR 214.2 141.4 121.9 180.6 276.9 185.1 151.1 232.9 29.0 100.0 89.9 0.0 2.4 4.8 6.4 383 125 84 0 117 92 58 0 217.4 148.2 127.6 203.9 132.3 113.7
East Carolina U 7 I PU 105.5 81.0 74.8 — 64.2 79.3 135.9 105.8 98.7 — 85.4 103.9 31.0 98.8 98.4 1.8 0.0 0.6 0.8 1.2 177 194 95 2 72 191 123 0 106.0 82.5 77.7 — 104.2 79.4 72.6
Elizabeth City St U 7 IIB PU 81.1 72.6 65.1 56.9 45.8 68.6 106.8 97.9 87.5 78.5 60.9 91.9 34.0 84.6 88.9 4.8 -3.5 1.9 0.3 20 16 13 0 6 11 8 0 82.8 72.3 66.3 75.1 73.1 63.1
Elon U 7 IIA PI 111.0 82.8 77.7 53.7 68.4 83.9 143.0 106.7 98.0 68.6 89.2 107.5 28.2 92.5 86.8 0.0 0.0 2.1 2.3 2.5 42 77 72 2 38 75 73 9 115.3 83.8 81.1 — 106.3 81.7 74.3 55.2
Fayetteville St U 7 IIA PU 88.6 81.2 76.9 90.1 58.5 64.4 77.8 116.0 107.0 102.1 117.5 79.8 86.4 103.0 32.4 92.9 88.5 11.9 0.0 1.5 0.4 2.0 11.2 48 43 22 0 22 35 37 3 86.9 83.7 74.7 92.2 78.0 78.2 90.1
Gardner-Webb U 1 I PR 70.3 63.3 59.3 46.3 — 62.4 95.5 84.4 80.2 62.9 — 84.4 35.2 85.5 54.1 2.2 0.0 0.6 0.8 -0.2 1.5 40 17 14 7 22 20 31 15 72.5 61.7 58.7 42.4 66.2 64.8 59.6 48.2
Greensboro Coll IIB PR 62.2 53.6 46.5 45.2 55.6 75.9 66.6 59.0 56.1 68.7 23.6 47.8 9.1 0.0 0.0 1.0 1.0 1.1 15 5 5 2 8 6 6 1 62.6 56.2 48.4 — 61.5 51.4 45.0 —
Guilford Coll IIB PR 76.2 60.5 56.4 47.1 62.8 97.4 77.6 71.5 62.0 80.5 28.2 100.0 87.5 28.6 0.0 1.8 2.5 1.7 0.9 19 13 4 7 14 11 17 9 77.0 60.5 61.7 46.6 75.1 60.4 55.2 47.5
Lees-McRae Coll 7 IIB PR 61.0 53.3 45.7 44.8 49.4 76.4 66.8 57.3 56.2 61.9 25.4 0.0 0.0 0.0 0.0 6 3 8 6 5 5 13 12 61.1 50.0 42.4 42.2 60.8 55.2 47.8 46.1
Mars Hill U 7 IIB PI 57.2 52.8 51.8 44.4 — 51.5 72.2 68.5 65.8 55.6 — 65.8 27.6 100.0 84.6 5.9 0.0 0.8 1.5 0.8 6.0 9 10 17 3 6 16 17 9 58.6 54.6 53.1 49.6 55.0 51.7 50.4 42.7
Meredith Coll IIA PI 74.2 65.1 61.9 59.4 — 66.9 90.3 81.6 76.9 74.4 — 82.7 23.6 92.0 90.6 0.0 0.0 0.8 3.0 2.0 4.8 14 14 11 3 36 18 33 6 76.2 68.5 64.6 72.2 73.5 62.4 61.0 53.0
North Carolina A & T St U 7 I PU 104.5 85.0 66.9 — 54.9 59.3 81.5 135.4 111.3 89.5 — 75.0 80.8 107.2 31.6 94.2 86.1 1.1 0.0 3.3 3.7 5.4 80 100 43 2 24 80 48 0 104.5 86.8 66.3 — 104.3 82.7 67.3
North Carolina Central U 7 IIA PU 100.8 81.2 71.0 48.5 53.1 63.4 76.6 131.7 107.5 95.3 67.2 73.3 85.2 101.9 33.0 97.5 89.7 7.6 0.0 2.2 2.3 3.2 1.5 49 61 34 5 30 56 45 2 101.6 82.0 70.7 49.8 99.5 80.4 71.3 —
North Carolina St U Raleigh 7 I PU 131.8 96.0 83.8 53.8 67.4 101.6 166.2 124.0 109.6 73.2 84.0 130.4 28.4 97.4 82.9 0.0 4.1 4.9 4.4 494 291 216 0 157 177 216 0 133.2 98.6 87.0 127.3 91.7 80.6
North Carolina Wesleyan Coll IIB PR 58.9 58.1 46.6 54.2 54.2 74.3 77.0 61.7 65.9 70.5 30.1 100.0 95.5 10.5 0.0 0.3 0.8 0.9 0.0 7 12 10 2 6 10 9 3 57.9 56.9 47.6 — 60.1 59.5 45.4 50.3
Salem Coll 1 IIB PR 64.1 57.0 51.4 38.1 — 54.7 75.1 67.1 61.2 46.9 — 64.6 18.2 100.0 72.7 5.9 0.0 0.0 -0.3 0.7 0.0 1 6 4 1 8 16 13 4 — 56.4 51.8 — 64.5 57.2 51.3 38.1
U North Carolina Asheville 7 IIB PU 94.2 80.4 69.7 — 56.2 67.2 76.5 121.8 105.1 92.3 — 75.9 89.3 100.4 31.3 98.5 94.0 1.9 0.0 0.7 0.9 2.2 46 18 29 0 20 32 25 1 95.6 82.1 71.0 90.9 79.4 68.2 —
U North Carolina Chapel Hill 7 I PU 163.3 106.3 101.9 119.0 57.4 99.0 118.8 204.0 136.6 131.2 148.3 76.6 128.0 151.1 27.2 99.5 95.3 0.0 0.0 2.7 4.4 3.9 4.3 383 213 132 4 187 169 113 2 170.5 107.2 106.1 116.0 148.5 105.2 97.1 —
U North Carolina Charlotte 7 I PU 126.2 90.4 82.5 54.9 75.6 87.3 160.6 117.2 107.5 74.1 99.8 113.5 29.9 99.1 98.6 0.5 0.3 1.4 0.7 171 157 104 0 62 132 118 0 132.1 94.0 88.2 110.1 86.2 77.5
U North Carolina Greensboro 7 I PU 116.4 84.0 77.5 — 48.1 64.4 80.4 148.8 109.4 101.9 — 66.0 85.5 105.1 30.7 98.5 92.9 0.6 0.0 1.9 2.9 2.8 2.9 117 106 60 1 81 120 104 1 119.8 88.5 80.4 — 111.6 80.0 75.8 —
U North Carolina Pembroke 7 IIA PU 89.1 68.6 62.0 53.6 51.9 65.8 67.1 115.9 91.2 83.3 73.5 71.0 89.3 89.5 33.3 93.3 95.0 6.1 0.0 1.9 2.3 3.0 5.2 40 40 29 2 20 40 53 3 91.8 69.5 60.5 — 83.6 67.7 62.8 52.3
U North Carolina School of the Arts 7 IIB PU 81.0 72.6 67.0 55.7 70.5 105.8 95.9 89.3 73.2 93.1 31.9 0.0 0.0 0.0 0.0 3.5 1.6 1.5 2.0 27 31 24 10 4 23 15 10 80.8 73.6 67.8 55.2 82.7 71.3 65.7 56.1
U North Carolina Wilmington 7 IIA PU 100.8 76.0 71.1 52.8 — 76.1 129.7 99.9 94.4 71.9 — 100.1 31.5 98.9 96.8 1.2 0.2 0.3 0.8 124 91 69 0 55 95 103 0 101.9 76.4 70.9 98.3 75.5 71.3
Wake Forest U 7 I PI 152.0 103.9 85.0 72.1 70.3 — 106.5 189.7 133.9 103.8 91.2 87.5 — 134.0 25.8 99.5 97.2 0.0 1.7 2.8 3.7 3.9 6.5 125 83 35 95 63 62 48 87 160.2 104.5 89.8 75.9 135.7 103.1 81.5 68.0
Western Carolina U 7 IIA PU 95.9 73.1 64.8 46.2 47.4 71.4 124.3 96.5 86.7 63.9 64.8 94.5 32.4 89.2 92.6 0.5 0.0 1.2 2.3 2.4 3.1 70 68 86 24 32 67 119 25 96.9 76.3 67.0 46.0 93.9 69.9 63.3 46.5
Winston-Salem St U 7 IIA PU 95.0 77.6 70.2 62.3 61.5 56.0 75.0 123.8 102.3 93.8 84.5 84.3 74.9 99.4 32.5 100.0 93.2 4.0 0.0 -0.2 -0.1 0.3 0.0 32 53 21 4 18 50 54 24 93.3 78.4 64.9 57.3 97.9 76.8 72.2 63.1
North DakotaLake Region St Coll III PU 70.0 65.7 65.7 59.5 63.5 99.8 90.3 94.4 83.9 89.7 41.4 100.0 85.7 14.3 0.0 5.5 6.1 9.0 1 3 5 10 2 4 9 7 — 68.3 78.8 58.6 — 63.7 58.4 60.9
North Dakota St U-Main Campus I PU 109.4 82.9 70.7 — 50.5 82.7 144.8 112.9 97.3 — 73.5 112.2 35.8 98.9 86.0 0.0 0.0 0.5 0.9 0.6 142 123 102 2 40 84 107 0 111.2 83.6 72.7 — 102.9 82.0 68.9
U North Dakota 7 I PU 108.0 84.9 71.5 53.6 48.9 35.3 78.3 140.7 114.0 97.5 76.0 71.3 53.7 105.7 35.0 96.8 81.7 3.0 0.0 105 112 86 28 53 74 82 39 109.1 87.4 73.5 54.9 105.8 81.0 69.3 52.7
Valley City St U IIB PU 71.2 59.1 49.8 45.0 54.6 99.8 84.3 72.6 62.1 78.1 42.9 100.0 94.7 25.8 0.0 0.2 0.2 0.6 0.7 7 14 12 5 4 5 19 7 71.0 60.0 50.6 47.3 71.5 56.5 49.2 43.4
OhioAshland U 7 IIA PR 72.6 66.8 60.4 53.2 64.1 96.2 88.8 80.6 72.1 85.5 33.3 100.0 96.0 18.9 0.0 2.6 2.6 2.2 2.5 40 27 17 14 13 23 20 27 72.2 68.8 58.1 52.8 73.9 64.5 62.4 53.4
Baldwin Wallace U 7 IIA PR 85.9 72.8 60.3 47.3 73.1 108.3 92.8 77.7 68.0 93.1 27.3 91.7 58.1 2.6 0.0 2.4 2.7 3.1 2.0 47 34 27 1 37 28 49 2 86.5 73.2 61.4 — 85.2 72.3 59.8 —
Bluffton U IIB PR 62.3 53.6 48.2 54.9 79.7 66.6 59.7 69.1 25.8 100.0 60.0 5.0 1.2 1.0 1.0 13 5 8 0 7 5 12 0 61.7 53.5 50.7 63.5 53.6 46.4
Bowling Green St U-Firelands 7 III PU 95.9 71.4 — 53.8 65.8 69.7 124.2 92.8 — 66.0 88.8 91.5 31.2 100.0 100.0 0.0 0.0 3.3 3.3 4.0 5 6 1 0 1 7 1 6 93.9 67.1 — — 75.2 — 53.8
Bowling Green St U-Main Campus 7 I PU 114.8 88.2 75.6 54.4 62.9 82.9 141.3 111.1 96.2 71.1 83.1 104.9 26.5 100.0 99.5 2.1 0.0 3.6 4.1 4.5 3.9 115 101 50 48 60 103 47 64 115.8 92.7 79.2 55.4 113.0 83.7 71.8 53.6
Capital U 1 IIA PR 98.6 69.4 59.0 58.4 76.9 132.6 95.5 78.3 83.1 104.7 36.0 98.5 87.9 3.1 0.0 1.7 2.8 2.7 2.0 42 15 12 15 26 18 20 20 107.0 70.9 55.2 52.8 85.0 68.2 61.3 62.6
Case Western Reserve U 7 I PI 149.6 102.2 94.7 67.3 116.1 187.9 130.9 122.4 92.1 148.1 27.6 91.3 73.8 0.0 0.0 3.5 4.2 4.3 2.9 209 94 60 28 67 74 82 52 153.5 104.7 97.6 73.4 137.4 99.1 92.6 64.1
Coll Wooster IIB PI 98.8 77.3 63.2 55.9 77.4 139.9 107.2 87.3 71.1 107.0 38.2 100.0 100.0 0.0 0.0 1.6 2.1 2.4 2.5 33 26 12 14 18 34 19 16 99.3 76.0 62.4 56.1 97.9 78.4 63.8 55.6
Defiance Coll IIB PR 58.8 53.8 51.6 53.8 80.1 69.8 63.6 68.8 27.9 100.0 71.4 9.5 2.0 2.6 1.7 5 5 11 0 4 2 10 0 59.5 54.4 54.8 58.0 — 48.1
Denison U IIB PI 119.8 87.2 71.2 61.6 86.3 159.1 118.2 97.6 83.5 116.5 35.1 95.6 95.1 0.0 0.0 5.6 5.3 4.8 4.7 33 50 27 17 12 52 27 15 122.3 88.2 70.7 62.1 113.0 86.2 71.7 61.1
John Carroll U IIA PR 95.3 74.6 83.2 56.5 81.3 126.9 100.0 109.1 69.3 107.7 32.4 100.0 100.0 22.9 0.0 2.0 2.3 2.4 3.3 34 36 16 9 22 31 19 7 99.3 74.1 97.7 55.2 89.0 75.2 71.0 58.2
Kent St U Ashtabula 7 III PU — 77.6 — 56.1 63.5 — 106.0 — 81.2 89.5 41.1 100.0 100.0 50.0 2.9 1 6 0 0 0 5 2 0 — 76.5 79.0 —
Kent St U East Liverpool 7 III PU 78.0 56.4 63.2 106.8 81.3 89.3 41.3 100.0 3.0 0 4 0 0 0 2 0 0 81.2 —
Kent St U Geauga 7 III PU 99.9 83.8 — 53.6 60.9 130.7 114.4 — 77.6 86.3 41.6 100.0 100.0 0.0 4.3 2 1 0 0 1 4 1 0 — — — 82.7 —
Kent St U Kent 7 I PU 120.1 91.8 76.6 63.5 84.6 154.2 121.9 104.1 89.4 113.5 34.2 99.5 97.8 4.1 2.2 3.0 2.8 145 127 80 0 61 140 90 0 123.7 92.2 79.2 111.6 91.4 74.3
© 2019 American Association of University Professors
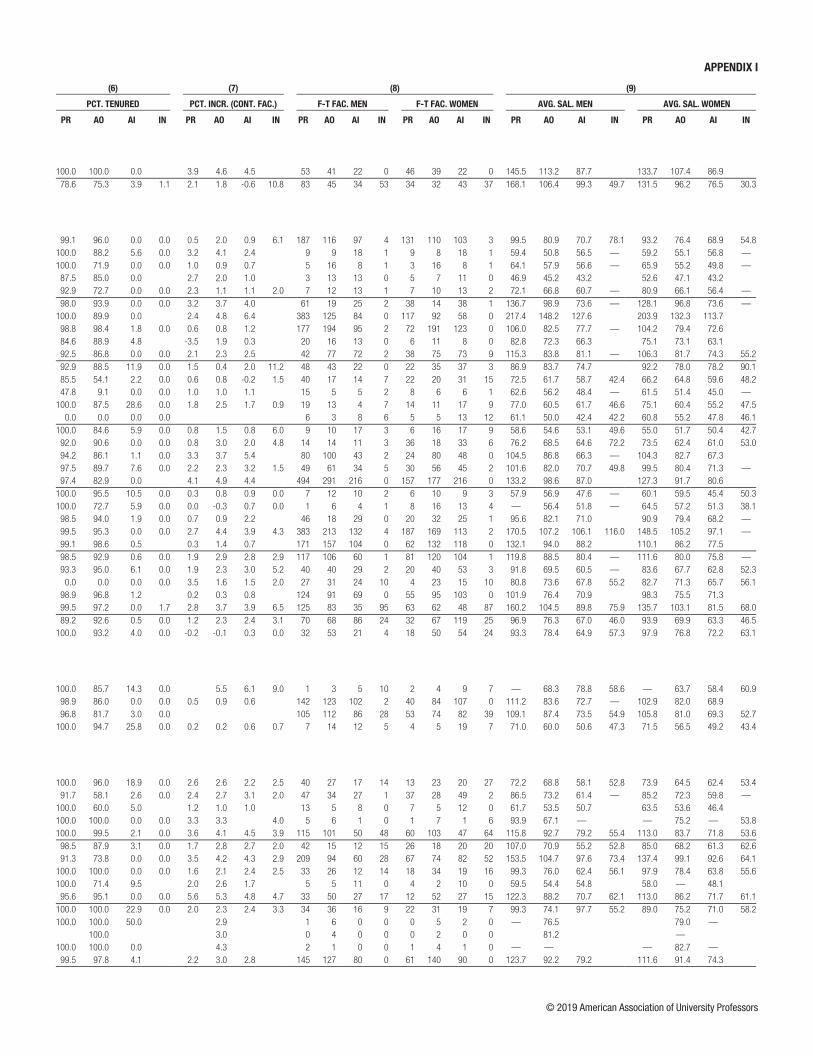
APPENDIX I APPENDIX I
NAME NOTES
(1) (2) (3) (4) (5) (6) (7) (8) (9)
CAT. CTRL
AVG. SALARY ($1000s) AVG. COMPENSATION ($1000s) BEN. as %
of SAL.
PCT. TENURED PCT. INCR. (CONT. FAC.) F-T FAC. MEN F-T FAC. WOMEN AVG. SAL. MEN AVG. SAL. WOMEN
PR AO AI IN LE NR AR PR AO AI IN LE NR AR PR AO AI IN PR AO AI IN PR AO AI IN PR AO AI IN PR AO AI IN PR AO AI IN
New York (continued)Vassar Coll 1 IIB PI 140.0 110.4 87.3 86.6 76.5 111.5 188.7 153.2 116.5 120.9 106.8 152.1 36.4 100.0 100.0 0.0 3.9 4.6 4.5 53 41 22 0 46 39 22 0 145.5 113.2 87.7 133.7 107.4 86.9
Yeshiva U I PI 157.5 102.2 86.5 41.8 66.1 100.9 176.9 129.2 106.7 59.1 83.7 121.6 20.4 78.6 75.3 3.9 1.1 2.1 1.8 -0.6 10.8 83 45 34 53 34 32 43 37 168.1 106.4 99.3 49.7 131.5 96.2 76.5 30.3
North CarolinaAppalachian St U 7 IIA PU 96.9 78.7 69.8 68.1 46.9 52.0 74.7 125.1 103.5 92.7 90.7 64.6 69.9 98.4 31.7 99.1 96.0 0.0 0.0 0.5 2.0 0.9 6.1 187 116 97 4 131 110 103 3 99.5 80.9 70.7 78.1 93.2 76.4 68.9 54.8
Barton Coll 7 IIB PR 59.3 52.8 56.7 — 56.0 74.1 66.6 68.3 — 68.9 22.9 100.0 88.2 5.6 0.0 3.2 4.1 2.4 9 9 18 1 9 8 18 1 59.4 50.8 56.5 — 59.2 55.1 56.8 —
Belmont Abbey Coll IIB PR 64.8 56.5 53.2 — 24.8 50.7 85.3 72.1 69.5 — 31.1 65.3 28.8 100.0 71.9 0.0 0.0 1.0 0.9 0.7 5 16 8 1 3 16 8 1 64.1 57.9 56.6 — 65.9 55.2 49.8 —
Brevard Coll IIB PR 50.5 45.9 43.2 45.3 67.1 57.5 54.2 57.4 26.6 87.5 85.0 0.0 2.7 2.0 1.0 3 13 13 0 5 7 11 0 46.9 45.2 43.2 52.6 47.1 43.2
Chowan U 7 IIB PR 76.5 66.5 58.5 48.2 64.6 89.0 78.3 68.5 57.2 75.7 17.2 92.9 72.7 0.0 0.0 2.3 1.1 1.1 2.0 7 12 13 1 7 10 13 2 72.1 66.8 60.7 — 80.9 66.1 56.4 —
Davidson Coll IIB PR 133.4 98.0 73.6 63.0 69.9 106.8 170.5 122.4 91.2 77.8 91.8 135.2 26.5 98.0 93.9 0.0 0.0 3.2 3.7 4.0 61 19 25 2 38 14 38 1 136.7 98.9 73.6 — 128.1 96.8 73.6 —
Duke U 7 I PR 214.2 141.4 121.9 180.6 276.9 185.1 151.1 232.9 29.0 100.0 89.9 0.0 2.4 4.8 6.4 383 125 84 0 117 92 58 0 217.4 148.2 127.6 203.9 132.3 113.7
East Carolina U 7 I PU 105.5 81.0 74.8 — 64.2 79.3 135.9 105.8 98.7 — 85.4 103.9 31.0 98.8 98.4 1.8 0.0 0.6 0.8 1.2 177 194 95 2 72 191 123 0 106.0 82.5 77.7 — 104.2 79.4 72.6
Elizabeth City St U 7 IIB PU 81.1 72.6 65.1 56.9 45.8 68.6 106.8 97.9 87.5 78.5 60.9 91.9 34.0 84.6 88.9 4.8 -3.5 1.9 0.3 20 16 13 0 6 11 8 0 82.8 72.3 66.3 75.1 73.1 63.1
Elon U 7 IIA PI 111.0 82.8 77.7 53.7 68.4 83.9 143.0 106.7 98.0 68.6 89.2 107.5 28.2 92.5 86.8 0.0 0.0 2.1 2.3 2.5 42 77 72 2 38 75 73 9 115.3 83.8 81.1 — 106.3 81.7 74.3 55.2
Fayetteville St U 7 IIA PU 88.6 81.2 76.9 90.1 58.5 64.4 77.8 116.0 107.0 102.1 117.5 79.8 86.4 103.0 32.4 92.9 88.5 11.9 0.0 1.5 0.4 2.0 11.2 48 43 22 0 22 35 37 3 86.9 83.7 74.7 92.2 78.0 78.2 90.1
Gardner-Webb U 1 I PR 70.3 63.3 59.3 46.3 — 62.4 95.5 84.4 80.2 62.9 — 84.4 35.2 85.5 54.1 2.2 0.0 0.6 0.8 -0.2 1.5 40 17 14 7 22 20 31 15 72.5 61.7 58.7 42.4 66.2 64.8 59.6 48.2
Greensboro Coll IIB PR 62.2 53.6 46.5 45.2 55.6 75.9 66.6 59.0 56.1 68.7 23.6 47.8 9.1 0.0 0.0 1.0 1.0 1.1 15 5 5 2 8 6 6 1 62.6 56.2 48.4 — 61.5 51.4 45.0 —
Guilford Coll IIB PR 76.2 60.5 56.4 47.1 62.8 97.4 77.6 71.5 62.0 80.5 28.2 100.0 87.5 28.6 0.0 1.8 2.5 1.7 0.9 19 13 4 7 14 11 17 9 77.0 60.5 61.7 46.6 75.1 60.4 55.2 47.5
Lees-McRae Coll 7 IIB PR 61.0 53.3 45.7 44.8 49.4 76.4 66.8 57.3 56.2 61.9 25.4 0.0 0.0 0.0 0.0 6 3 8 6 5 5 13 12 61.1 50.0 42.4 42.2 60.8 55.2 47.8 46.1
Mars Hill U 7 IIB PI 57.2 52.8 51.8 44.4 — 51.5 72.2 68.5 65.8 55.6 — 65.8 27.6 100.0 84.6 5.9 0.0 0.8 1.5 0.8 6.0 9 10 17 3 6 16 17 9 58.6 54.6 53.1 49.6 55.0 51.7 50.4 42.7
Meredith Coll IIA PI 74.2 65.1 61.9 59.4 — 66.9 90.3 81.6 76.9 74.4 — 82.7 23.6 92.0 90.6 0.0 0.0 0.8 3.0 2.0 4.8 14 14 11 3 36 18 33 6 76.2 68.5 64.6 72.2 73.5 62.4 61.0 53.0
North Carolina A & T St U 7 I PU 104.5 85.0 66.9 — 54.9 59.3 81.5 135.4 111.3 89.5 — 75.0 80.8 107.2 31.6 94.2 86.1 1.1 0.0 3.3 3.7 5.4 80 100 43 2 24 80 48 0 104.5 86.8 66.3 — 104.3 82.7 67.3
North Carolina Central U 7 IIA PU 100.8 81.2 71.0 48.5 53.1 63.4 76.6 131.7 107.5 95.3 67.2 73.3 85.2 101.9 33.0 97.5 89.7 7.6 0.0 2.2 2.3 3.2 1.5 49 61 34 5 30 56 45 2 101.6 82.0 70.7 49.8 99.5 80.4 71.3 —
North Carolina St U Raleigh 7 I PU 131.8 96.0 83.8 53.8 67.4 101.6 166.2 124.0 109.6 73.2 84.0 130.4 28.4 97.4 82.9 0.0 4.1 4.9 4.4 494 291 216 0 157 177 216 0 133.2 98.6 87.0 127.3 91.7 80.6
North Carolina Wesleyan Coll IIB PR 58.9 58.1 46.6 54.2 54.2 74.3 77.0 61.7 65.9 70.5 30.1 100.0 95.5 10.5 0.0 0.3 0.8 0.9 0.0 7 12 10 2 6 10 9 3 57.9 56.9 47.6 — 60.1 59.5 45.4 50.3
Salem Coll 1 IIB PR 64.1 57.0 51.4 38.1 — 54.7 75.1 67.1 61.2 46.9 — 64.6 18.2 100.0 72.7 5.9 0.0 0.0 -0.3 0.7 0.0 1 6 4 1 8 16 13 4 — 56.4 51.8 — 64.5 57.2 51.3 38.1
U North Carolina Asheville 7 IIB PU 94.2 80.4 69.7 — 56.2 67.2 76.5 121.8 105.1 92.3 — 75.9 89.3 100.4 31.3 98.5 94.0 1.9 0.0 0.7 0.9 2.2 46 18 29 0 20 32 25 1 95.6 82.1 71.0 90.9 79.4 68.2 —
U North Carolina Chapel Hill 7 I PU 163.3 106.3 101.9 119.0 57.4 99.0 118.8 204.0 136.6 131.2 148.3 76.6 128.0 151.1 27.2 99.5 95.3 0.0 0.0 2.7 4.4 3.9 4.3 383 213 132 4 187 169 113 2 170.5 107.2 106.1 116.0 148.5 105.2 97.1 —
U North Carolina Charlotte 7 I PU 126.2 90.4 82.5 54.9 75.6 87.3 160.6 117.2 107.5 74.1 99.8 113.5 29.9 99.1 98.6 0.5 0.3 1.4 0.7 171 157 104 0 62 132 118 0 132.1 94.0 88.2 110.1 86.2 77.5
U North Carolina Greensboro 7 I PU 116.4 84.0 77.5 — 48.1 64.4 80.4 148.8 109.4 101.9 — 66.0 85.5 105.1 30.7 98.5 92.9 0.6 0.0 1.9 2.9 2.8 2.9 117 106 60 1 81 120 104 1 119.8 88.5 80.4 — 111.6 80.0 75.8 —
U North Carolina Pembroke 7 IIA PU 89.1 68.6 62.0 53.6 51.9 65.8 67.1 115.9 91.2 83.3 73.5 71.0 89.3 89.5 33.3 93.3 95.0 6.1 0.0 1.9 2.3 3.0 5.2 40 40 29 2 20 40 53 3 91.8 69.5 60.5 — 83.6 67.7 62.8 52.3
U North Carolina School of the Arts 7 IIB PU 81.0 72.6 67.0 55.7 70.5 105.8 95.9 89.3 73.2 93.1 31.9 0.0 0.0 0.0 0.0 3.5 1.6 1.5 2.0 27 31 24 10 4 23 15 10 80.8 73.6 67.8 55.2 82.7 71.3 65.7 56.1
U North Carolina Wilmington 7 IIA PU 100.8 76.0 71.1 52.8 — 76.1 129.7 99.9 94.4 71.9 — 100.1 31.5 98.9 96.8 1.2 0.2 0.3 0.8 124 91 69 0 55 95 103 0 101.9 76.4 70.9 98.3 75.5 71.3
Wake Forest U 7 I PI 152.0 103.9 85.0 72.1 70.3 — 106.5 189.7 133.9 103.8 91.2 87.5 — 134.0 25.8 99.5 97.2 0.0 1.7 2.8 3.7 3.9 6.5 125 83 35 95 63 62 48 87 160.2 104.5 89.8 75.9 135.7 103.1 81.5 68.0
Western Carolina U 7 IIA PU 95.9 73.1 64.8 46.2 47.4 71.4 124.3 96.5 86.7 63.9 64.8 94.5 32.4 89.2 92.6 0.5 0.0 1.2 2.3 2.4 3.1 70 68 86 24 32 67 119 25 96.9 76.3 67.0 46.0 93.9 69.9 63.3 46.5
Winston-Salem St U 7 IIA PU 95.0 77.6 70.2 62.3 61.5 56.0 75.0 123.8 102.3 93.8 84.5 84.3 74.9 99.4 32.5 100.0 93.2 4.0 0.0 -0.2 -0.1 0.3 0.0 32 53 21 4 18 50 54 24 93.3 78.4 64.9 57.3 97.9 76.8 72.2 63.1
North DakotaLake Region St Coll III PU 70.0 65.7 65.7 59.5 63.5 99.8 90.3 94.4 83.9 89.7 41.4 100.0 85.7 14.3 0.0 5.5 6.1 9.0 1 3 5 10 2 4 9 7 — 68.3 78.8 58.6 — 63.7 58.4 60.9
North Dakota St U-Main Campus I PU 109.4 82.9 70.7 — 50.5 82.7 144.8 112.9 97.3 — 73.5 112.2 35.8 98.9 86.0 0.0 0.0 0.5 0.9 0.6 142 123 102 2 40 84 107 0 111.2 83.6 72.7 — 102.9 82.0 68.9
U North Dakota 7 I PU 108.0 84.9 71.5 53.6 48.9 35.3 78.3 140.7 114.0 97.5 76.0 71.3 53.7 105.7 35.0 96.8 81.7 3.0 0.0 105 112 86 28 53 74 82 39 109.1 87.4 73.5 54.9 105.8 81.0 69.3 52.7
Valley City St U IIB PU 71.2 59.1 49.8 45.0 54.6 99.8 84.3 72.6 62.1 78.1 42.9 100.0 94.7 25.8 0.0 0.2 0.2 0.6 0.7 7 14 12 5 4 5 19 7 71.0 60.0 50.6 47.3 71.5 56.5 49.2 43.4
OhioAshland U 7 IIA PR 72.6 66.8 60.4 53.2 64.1 96.2 88.8 80.6 72.1 85.5 33.3 100.0 96.0 18.9 0.0 2.6 2.6 2.2 2.5 40 27 17 14 13 23 20 27 72.2 68.8 58.1 52.8 73.9 64.5 62.4 53.4
Baldwin Wallace U 7 IIA PR 85.9 72.8 60.3 47.3 73.1 108.3 92.8 77.7 68.0 93.1 27.3 91.7 58.1 2.6 0.0 2.4 2.7 3.1 2.0 47 34 27 1 37 28 49 2 86.5 73.2 61.4 — 85.2 72.3 59.8 —
Bluffton U IIB PR 62.3 53.6 48.2 54.9 79.7 66.6 59.7 69.1 25.8 100.0 60.0 5.0 1.2 1.0 1.0 13 5 8 0 7 5 12 0 61.7 53.5 50.7 63.5 53.6 46.4
Bowling Green St U-Firelands 7 III PU 95.9 71.4 — 53.8 65.8 69.7 124.2 92.8 — 66.0 88.8 91.5 31.2 100.0 100.0 0.0 0.0 3.3 3.3 4.0 5 6 1 0 1 7 1 6 93.9 67.1 — — 75.2 — 53.8
Bowling Green St U-Main Campus 7 I PU 114.8 88.2 75.6 54.4 62.9 82.9 141.3 111.1 96.2 71.1 83.1 104.9 26.5 100.0 99.5 2.1 0.0 3.6 4.1 4.5 3.9 115 101 50 48 60 103 47 64 115.8 92.7 79.2 55.4 113.0 83.7 71.8 53.6
Capital U 1 IIA PR 98.6 69.4 59.0 58.4 76.9 132.6 95.5 78.3 83.1 104.7 36.0 98.5 87.9 3.1 0.0 1.7 2.8 2.7 2.0 42 15 12 15 26 18 20 20 107.0 70.9 55.2 52.8 85.0 68.2 61.3 62.6
Case Western Reserve U 7 I PI 149.6 102.2 94.7 67.3 116.1 187.9 130.9 122.4 92.1 148.1 27.6 91.3 73.8 0.0 0.0 3.5 4.2 4.3 2.9 209 94 60 28 67 74 82 52 153.5 104.7 97.6 73.4 137.4 99.1 92.6 64.1
Coll Wooster IIB PI 98.8 77.3 63.2 55.9 77.4 139.9 107.2 87.3 71.1 107.0 38.2 100.0 100.0 0.0 0.0 1.6 2.1 2.4 2.5 33 26 12 14 18 34 19 16 99.3 76.0 62.4 56.1 97.9 78.4 63.8 55.6
Defiance Coll IIB PR 58.8 53.8 51.6 53.8 80.1 69.8 63.6 68.8 27.9 100.0 71.4 9.5 2.0 2.6 1.7 5 5 11 0 4 2 10 0 59.5 54.4 54.8 58.0 — 48.1
Denison U IIB PI 119.8 87.2 71.2 61.6 86.3 159.1 118.2 97.6 83.5 116.5 35.1 95.6 95.1 0.0 0.0 5.6 5.3 4.8 4.7 33 50 27 17 12 52 27 15 122.3 88.2 70.7 62.1 113.0 86.2 71.7 61.1
John Carroll U IIA PR 95.3 74.6 83.2 56.5 81.3 126.9 100.0 109.1 69.3 107.7 32.4 100.0 100.0 22.9 0.0 2.0 2.3 2.4 3.3 34 36 16 9 22 31 19 7 99.3 74.1 97.7 55.2 89.0 75.2 71.0 58.2
Kent St U Ashtabula 7 III PU — 77.6 — 56.1 63.5 — 106.0 — 81.2 89.5 41.1 100.0 100.0 50.0 2.9 1 6 0 0 0 5 2 0 — 76.5 79.0 —
Kent St U East Liverpool 7 III PU 78.0 56.4 63.2 106.8 81.3 89.3 41.3 100.0 3.0 0 4 0 0 0 2 0 0 81.2 —
Kent St U Geauga 7 III PU 99.9 83.8 — 53.6 60.9 130.7 114.4 — 77.6 86.3 41.6 100.0 100.0 0.0 4.3 2 1 0 0 1 4 1 0 — — — 82.7 —
Kent St U Kent 7 I PU 120.1 91.8 76.6 63.5 84.6 154.2 121.9 104.1 89.4 113.5 34.2 99.5 97.8 4.1 2.2 3.0 2.8 145 127 80 0 61 140 90 0 123.7 92.2 79.2 111.6 91.4 74.3
© 2019 American Association of University Professors
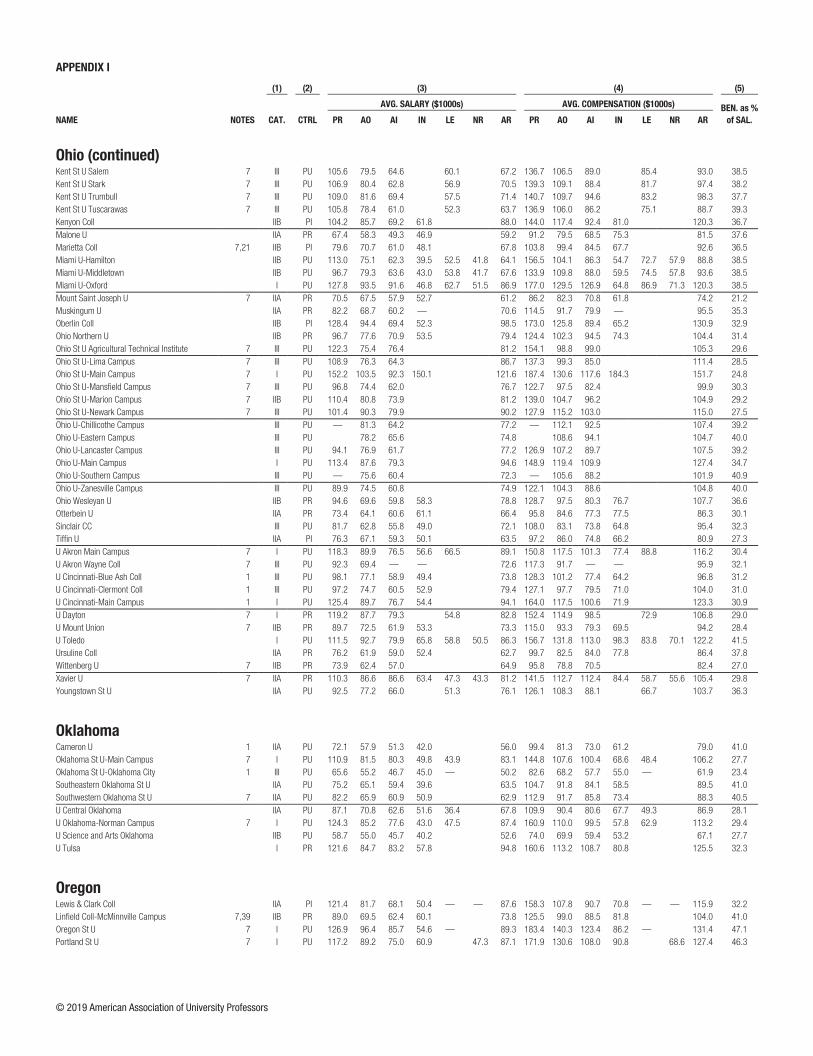
APPENDIX I APPENDIX I
NAME NOTES
(1) (2) (3) (4) (5) (6) (7) (8) (9)
CAT. CTRL
AVG. SALARY ($1000s) AVG. COMPENSATION ($1000s) BEN. as %
of SAL.
PCT. TENURED PCT. INCR. (CONT. FAC.) F-T FAC. MEN F-T FAC. WOMEN AVG. SAL. MEN AVG. SAL. WOMEN
PR AO AI IN LE NR AR PR AO AI IN LE NR AR PR AO AI IN PR AO AI IN PR AO AI IN PR AO AI IN PR AO AI IN PR AO AI IN
Ohio (continued)Kent St U Salem 7 III PU 105.6 79.5 64.6 60.1 67.2 136.7 106.5 89.0 85.4 93.0 38.5 100.0 100.0 40.0 1.1 3.5 5.4 3 3 2 0 0 3 3 0 105.6 83.2 — 75.8 60.2
Kent St U Stark 7 III PU 106.9 80.4 62.8 56.9 70.5 139.3 109.1 88.4 81.7 97.4 38.2 100.0 100.0 38.5 2.7 3.7 3.7 5 22 14 0 3 15 12 0 96.2 79.3 63.2 124.9 82.1 62.3
Kent St U Trumbull 7 III PU 109.0 81.6 69.4 57.5 71.4 140.7 109.7 94.6 83.2 98.3 37.7 100.0 100.0 42.9 3.1 3.2 2.9 3 7 4 0 2 6 3 0 113.0 79.9 67.8 — 83.6 71.5
Kent St U Tuscarawas 7 III PU 105.8 78.4 61.0 52.3 63.7 136.9 106.0 86.2 75.1 88.7 39.3 100.0 100.0 18.2 2.5 2.6 3.4 2 7 6 0 1 5 5 0 — 76.9 58.3 — 80.4 64.3
Kenyon Coll IIB PI 104.2 85.7 69.2 61.8 88.0 144.0 117.4 92.4 81.0 120.3 36.7 98.5 94.2 0.0 0.0 1.9 3.2 3.3 43 25 26 1 25 27 22 2 103.4 87.0 69.6 — 105.4 84.6 68.8 —
Malone U IIA PR 67.4 58.3 49.3 46.9 59.2 91.2 79.5 68.5 75.3 81.5 37.6 100.0 77.3 0.0 0.0 1.0 1.3 3.5 4.3 23 10 7 0 10 12 12 5 67.6 59.0 51.3 66.9 57.7 48.1 46.9
Marietta Coll 7,21 IIB PI 79.6 70.7 61.0 48.1 67.8 103.8 99.4 84.5 67.7 92.6 36.5 100.0 71.4 0.0 0.0 12.9 14.3 9.7 13.2 22 15 24 1 9 13 15 8 80.2 69.6 63.0 — 78.2 72.0 57.7 48.6
Miami U-Hamilton IIB PU 113.0 75.1 62.3 39.5 52.5 41.8 64.1 156.5 104.1 86.3 54.7 72.7 57.9 88.8 38.5 100.0 90.3 0.0 0.0 2.2 3.0 9.2 9.0 6 14 4 5 4 17 8 4 115.1 76.8 65.5 39.6 109.9 73.8 60.7 39.3
Miami U-Middletown IIB PU 96.7 79.3 63.6 43.0 53.8 41.7 67.6 133.9 109.8 88.0 59.5 74.5 57.8 93.6 38.5 100.0 92.3 6.3 0.0 3.2 2.7 7.2 2.2 7 9 5 2 6 4 11 3 97.0 80.6 61.3 — 96.3 76.3 64.6 44.8
Miami U-Oxford I PU 127.8 93.5 91.6 46.8 62.7 51.5 86.9 177.0 129.5 126.9 64.8 86.9 71.3 120.3 38.5 99.6 96.1 1.5 0.0 3.4 3.9 4.0 7.3 144 118 124 47 89 86 73 43 131.9 99.9 96.2 48.9 121.1 84.8 83.8 44.6
Mount Saint Joseph U 7 IIA PR 70.5 67.5 57.9 52.7 61.2 86.2 82.3 70.8 61.8 74.2 21.2 100.0 73.1 0.0 0.0 3.9 8.9 4.9 5.1 9 10 11 6 7 16 23 17 75.5 69.9 57.7 55.6 64.2 65.9 58.0 51.7
Muskingum U IIA PR 82.2 68.7 60.2 — 70.6 114.5 91.7 79.9 — 95.5 35.3 86.7 70.5 4.4 0.0 0.4 3.7 4.2 19 24 8 0 11 20 15 1 82.4 71.1 63.3 81.8 65.8 58.6 —
Oberlin Coll IIB PI 128.4 94.4 69.4 52.3 98.5 173.0 125.8 89.4 65.2 130.9 32.9 98.2 94.3 0.0 0.0 0.0 0.4 0.3 0.0 71 49 40 2 37 38 49 4 132.2 97.5 71.2 — 121.2 90.4 67.9 58.7
Ohio Northern U IIB PR 96.7 77.6 70.9 53.5 79.4 124.4 102.3 94.5 74.3 104.4 31.4 98.3 91.8 4.0 0.0 45 43 41 2 15 30 35 8 95.8 78.7 71.3 — 99.4 75.9 70.4 52.9
Ohio St U Agricultural Technical Institute 7 III PU 122.3 75.4 76.4 81.2 154.1 98.8 99.0 105.3 29.6 100.0 100.0 9.1 3.8 3.3 2.8 1 7 8 0 2 5 3 0 — 73.2 78.4 — 78.5 71.1
Ohio St U-Lima Campus 7 III PU 108.9 76.3 64.3 86.7 137.3 99.3 85.0 111.4 28.5 100.0 100.0 0.0 2.5 3.7 2.3 8 8 3 0 3 9 0 0 119.9 77.3 64.3 79.5 75.4
Ohio St U-Main Campus 7 I PU 152.2 103.5 92.3 150.1 121.6 187.4 130.6 117.6 184.3 151.7 24.8 94.0 86.4 0.2 0.0 3.4 4.2 4.2 6.5 717 377 304 5 298 338 325 4 157.2 107.2 96.0 162.3 140.1 99.4 88.8 134.7
Ohio St U-Mansfield Campus 7 III PU 96.8 74.4 62.0 76.7 122.7 97.5 82.4 99.9 30.3 100.0 100.0 0.0 1.9 2.3 3.9 5 11 3 0 0 14 0 0 96.8 76.2 62.0 73.0
Ohio St U-Marion Campus 7 IIB PU 110.4 80.8 73.9 81.2 139.0 104.7 96.2 104.9 29.2 100.0 100.0 0.0 3.5 2.7 4.8 3 10 6 0 1 9 9 0 108.0 81.2 77.4 — 80.4 71.6
Ohio St U-Newark Campus 7 III PU 101.4 90.3 79.9 90.2 127.9 115.2 103.0 115.0 27.5 100.0 100.0 0.0 2.9 3.8 4.7 4 19 4 0 4 10 5 0 100.4 90.8 85.1 102.3 89.4 75.7
Ohio U-Chillicothe Campus III PU — 81.3 64.2 77.2 — 112.1 92.5 107.4 39.2 100.0 100.0 25.0 1.5 5.2 0 7 2 0 1 4 2 0 79.2 — — 84.8 —
Ohio U-Eastern Campus III PU 78.2 65.6 74.8 108.6 94.1 104.7 40.0 100.0 25.0 1.4 1.8 0 8 1 0 0 3 3 0 76.8 — 81.9 62.6
Ohio U-Lancaster Campus III PU 94.1 76.9 61.7 77.2 126.9 107.2 89.7 107.5 39.2 100.0 94.1 0.0 1.6 1.7 1.8 2 10 0 0 1 7 3 0 — 75.0 — 79.8 61.7
Ohio U-Main Campus I PU 113.4 87.6 79.3 94.6 148.9 119.4 109.9 127.4 34.7 100.0 95.9 1.2 1.7 2.3 2.8 168 169 98 0 69 98 72 0 116.7 89.3 79.6 105.3 84.7 79.0
Ohio U-Southern Campus III PU — 75.6 60.4 72.3 — 105.6 88.2 101.9 40.9 100.0 100.0 0.0 1.5 1.4 0 1 2 0 1 10 3 0 — — — 75.8 61.3
Ohio U-Zanesville Campus III PU 89.9 74.5 60.8 74.9 122.1 104.3 88.6 104.8 40.0 100.0 100.0 0.0 1.2 2.6 1.7 5 6 2 0 2 10 5 0 89.9 74.1 — — 74.7 60.5
Ohio Wesleyan U IIB PR 94.6 69.6 59.8 58.3 78.8 128.7 97.5 80.3 76.7 107.7 36.6 100.0 100.0 5.3 0.0 3.0 3.7 5.9 8.9 44 22 7 6 18 18 12 6 94.6 69.3 60.3 61.3 94.6 70.0 59.5 55.2
Otterbein U IIA PR 73.4 64.1 60.6 61.1 66.4 95.8 84.6 77.3 77.5 86.3 30.1 93.2 86.2 0.0 0.0 1.0 2.5 2.2 2.2 32 22 10 9 27 36 21 11 75.3 65.5 60.3 64.7 71.2 63.3 60.8 58.2
Sinclair CC III PU 81.7 62.8 55.8 49.0 72.1 108.0 83.1 73.8 64.8 95.4 32.3 98.2 40.7 7.0 0.0 3.0 4.3 6.7 7.8 75 25 20 0 92 61 23 4 82.4 64.0 56.0 81.1 62.3 55.6 49.0
Tiffin U IIA PI 76.3 67.1 59.3 50.1 63.5 97.2 86.0 74.8 66.2 80.9 27.3 0.0 0.0 0.0 0.0 2.9 2.8 4.6 9.9 10 6 20 6 4 11 15 1 78.2 61.6 61.8 50.9 71.4 70.2 55.9 —
U Akron Main Campus 7 I PU 118.3 89.9 76.5 56.6 66.5 89.1 150.8 117.5 101.3 77.4 88.8 116.2 30.4 98.6 93.3 0.0 0.0 3.6 4.4 3.1 4.3 156 99 45 46 60 80 40 82 123.5 93.1 76.2 52.7 104.7 86.0 76.9 58.8
U Akron Wayne Coll 7 III PU 92.3 69.4 — — 72.6 117.3 91.7 — — 95.9 32.1 100.0 100.0 0.0 0.0 3.0 5.5 3 5 0 1 2 4 2 1 97.7 70.9 — — 67.5 — —
U Cincinnati-Blue Ash Coll 1 III PU 98.1 77.1 58.9 49.4 73.8 128.3 101.2 77.4 64.2 96.8 31.2 96.3 96.1 1.9 0.0 4.6 5.1 6.8 7.0 7 31 18 2 20 45 35 3 102.4 77.9 58.7 — 96.6 76.5 59.0 48.8
U Cincinnati-Clermont Coll 1 III PU 97.2 74.7 60.5 52.9 79.4 127.1 97.7 79.5 71.0 104.0 31.0 100.0 85.7 0.0 0.0 4.6 3.5 5.5 13.7 15 13 10 1 15 15 7 2 98.9 77.0 59.8 — 95.5 72.7 61.5 —
U Cincinnati-Main Campus 1 I PU 125.4 89.7 76.7 54.4 94.1 164.0 117.5 100.6 71.9 123.3 30.9 88.6 73.2 1.0 0.0 3.1 4.3 5.0 6.7 266 221 194 36 130 212 223 45 131.6 93.9 83.2 56.8 112.8 85.4 71.1 52.5
U Dayton 7 I PR 119.2 87.7 79.3 54.8 82.8 152.4 114.9 98.5 72.9 106.8 29.0 100.0 96.4 2.9 2.3 3.0 3.6 97 101 72 0 31 64 67 0 124.0 89.0 82.8 104.2 85.4 75.6
U Mount Union 7 IIB PR 89.7 72.5 61.9 53.3 73.3 115.0 93.3 79.3 69.5 94.2 28.4 90.2 71.7 2.3 0.0 0.8 0.8 1.1 2.4 23 29 18 3 18 17 25 4 89.7 72.3 62.1 49.3 89.8 72.9 61.8 56.4
U Toledo I PU 111.5 92.7 79.9 65.8 58.8 50.5 86.3 156.7 131.8 113.0 98.3 83.8 70.1 122.2 41.5 96.0 88.8 4.7 5.0 156 116 69 3 69 71 60 17 113.2 95.1 82.7 67.8 107.9 88.7 76.7 65.5
Ursuline Coll IIA PR 76.2 61.9 59.0 52.4 62.7 99.7 82.5 84.0 77.8 86.4 37.8 100.0 85.7 0.0 0.0 2.0 4.1 5.3 6.9 5 3 1 1 10 11 20 10 77.6 59.0 — — 75.5 62.8 59.2 52.6
Wittenberg U 7 IIB PR 73.9 62.4 57.0 64.9 95.8 78.8 70.5 82.4 27.0 97.7 97.6 2.8 28 20 18 0 15 22 18 0 74.3 63.0 57.7 73.1 61.9 56.2
Xavier U 7 IIA PR 110.3 86.6 86.6 63.4 47.3 43.3 81.2 141.5 112.7 112.4 84.4 58.7 55.6 105.4 29.8 100.0 96.2 2.8 0.0 5.1 8.1 7.3 8.0 41 56 30 25 26 50 41 57 109.9 89.2 89.4 61.5 110.9 83.7 84.5 64.3
Youngstown St U IIA PU 92.5 77.2 66.0 51.3 76.1 126.1 108.3 88.1 66.7 103.7 36.3 100.0 100.0 12.4 2.6 3.6 4.6 100 62 43 0 39 54 54 0 93.9 79.6 67.8 89.1 74.4 64.5
OklahomaCameron U 1 IIA PU 72.1 57.9 51.3 42.0 56.0 99.4 81.3 73.0 61.2 79.0 41.0 100.0 100.0 14.3 0.0 2.6 2.7 4.0 6.4 28 17 13 15 8 14 15 21 73.1 57.7 51.6 41.3 68.9 58.0 51.1 42.5
Oklahoma St U-Main Campus 7 I PU 110.9 81.5 80.3 49.8 43.9 83.1 144.8 107.6 100.4 68.6 48.4 106.2 27.7 99.0 95.6 0.7 9.1 0.2 1.1 1.8 230 166 173 3 72 107 121 8 113.6 83.0 82.7 51.7 102.2 79.0 77.0 49.1
Oklahoma St U-Oklahoma City 1 III PU 65.6 55.2 46.7 45.0 — 50.2 82.6 68.2 57.7 55.0 — 61.9 23.4 100.0 100.0 0.0 0.0 4.0 7.5 6.2 5.3 4 6 7 9 3 16 18 13 64.9 53.4 47.8 43.0 66.6 55.9 46.4 46.3
Southeastern Oklahoma St U IIA PU 75.2 65.1 59.4 39.6 63.5 104.7 91.8 84.1 58.5 89.5 41.0 100.0 100.0 3.7 0.0 0.1 0.3 1.7 0.8 34 12 15 6 11 11 12 13 75.2 68.0 57.4 37.7 74.9 62.0 61.9 40.5
Southwestern Oklahoma St U 7 IIA PU 82.2 65.9 60.9 50.9 62.9 112.9 91.7 85.8 73.4 88.3 40.5 100.0 86.4 13.7 4.5 0.2 1.9 1.6 6.5 22 17 30 27 18 27 21 40 83.9 64.0 56.4 50.0 80.1 67.1 67.2 51.5
U Central Oklahoma IIA PU 87.1 70.8 62.6 51.6 36.4 67.8 109.9 90.4 80.6 67.7 49.3 86.9 28.1 100.0 70.4 5.6 0.0 -0.1 6.5 3.1 2.6 121 29 45 18 89 52 62 30 89.9 73.4 64.6 52.8 83.3 69.4 61.1 50.9
U Oklahoma-Norman Campus 7 I PU 124.3 85.2 77.6 43.0 47.5 87.4 160.9 110.0 99.5 57.8 62.9 113.2 29.4 97.0 88.9 0.0 0.0 1.5 1.3 1.1 2.1 274 203 178 46 92 129 128 83 130.1 88.0 79.7 46.3 107.1 80.8 74.7 41.1
U Science and Arts Oklahoma IIB PU 58.7 55.0 45.7 40.2 52.6 74.0 69.9 59.4 53.2 67.1 27.7 100.0 81.3 0.0 0.0 0.0 -1.5 2.2 1.8 6 11 5 2 11 5 5 4 60.2 55.0 45.4 — 57.9 55.0 46.0 40.3
U Tulsa I PR 121.6 84.7 83.2 57.8 94.8 160.6 113.2 108.7 80.8 125.5 32.3 93.2 78.8 0.0 0.0 -0.4 0.8 0.8 0.0 93 69 55 9 25 30 64 12 121.5 88.2 89.0 61.7 122.0 76.6 78.2 54.9
OregonLewis & Clark Coll IIA PI 121.4 81.7 68.1 50.4 — — 87.6 158.3 107.8 90.7 70.8 — — 115.9 32.2 84.1 93.8 0.0 0.0 0.0 0.1 8.4 13.5 40 38 15 5 23 43 35 11 127.5 85.0 66.6 51.9 110.7 78.8 68.7 49.7
Linfield Coll-McMinnville Campus 7,39 IIB PR 89.0 69.5 62.4 60.1 73.8 125.5 99.0 88.5 81.8 104.0 41.0 96.2 92.5 6.3 0.0 1.0 2.5 1.0 0.9 28 15 13 5 24 25 19 14 88.6 69.7 65.5 59.6 89.5 69.4 60.4 60.3
Oregon St U 7 I PU 126.9 96.4 85.7 54.6 — 89.3 183.4 140.3 123.4 86.2 — 131.4 47.1 99.4 88.9 0.4 0.8 3.5 4.1 4.8 4.9 249 170 158 191 86 108 123 197 128.7 98.8 88.1 56.3 121.7 92.6 82.6 52.9
Portland St U 7 I PU 117.2 89.2 75.0 60.9 47.3 87.1 171.9 130.6 108.0 90.8 68.6 127.4 46.3 95.2 91.0 0.5 0.0 6.3 6.4 5.1 7.4 142 103 87 61 66 96 127 91 119.8 90.9 79.8 62.3 111.7 87.5 71.7 60.0
© 2019 American Association of University Professors
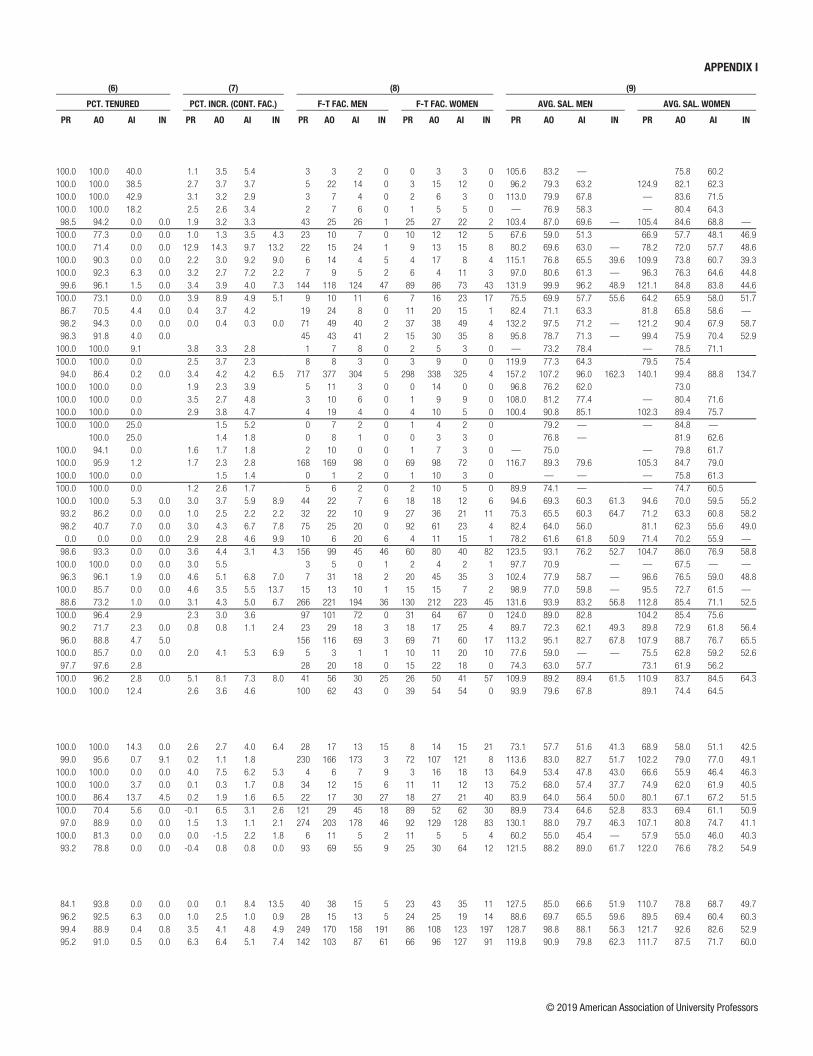
APPENDIX I APPENDIX I
NAME NOTES
(1) (2) (3) (4) (5) (6) (7) (8) (9)
CAT. CTRL
AVG. SALARY ($1000s) AVG. COMPENSATION ($1000s) BEN. as %
of SAL.
PCT. TENURED PCT. INCR. (CONT. FAC.) F-T FAC. MEN F-T FAC. WOMEN AVG. SAL. MEN AVG. SAL. WOMEN
PR AO AI IN LE NR AR PR AO AI IN LE NR AR PR AO AI IN PR AO AI IN PR AO AI IN PR AO AI IN PR AO AI IN PR AO AI IN
Ohio (continued)Kent St U Salem 7 III PU 105.6 79.5 64.6 60.1 67.2 136.7 106.5 89.0 85.4 93.0 38.5 100.0 100.0 40.0 1.1 3.5 5.4 3 3 2 0 0 3 3 0 105.6 83.2 — 75.8 60.2
Kent St U Stark 7 III PU 106.9 80.4 62.8 56.9 70.5 139.3 109.1 88.4 81.7 97.4 38.2 100.0 100.0 38.5 2.7 3.7 3.7 5 22 14 0 3 15 12 0 96.2 79.3 63.2 124.9 82.1 62.3
Kent St U Trumbull 7 III PU 109.0 81.6 69.4 57.5 71.4 140.7 109.7 94.6 83.2 98.3 37.7 100.0 100.0 42.9 3.1 3.2 2.9 3 7 4 0 2 6 3 0 113.0 79.9 67.8 — 83.6 71.5
Kent St U Tuscarawas 7 III PU 105.8 78.4 61.0 52.3 63.7 136.9 106.0 86.2 75.1 88.7 39.3 100.0 100.0 18.2 2.5 2.6 3.4 2 7 6 0 1 5 5 0 — 76.9 58.3 — 80.4 64.3
Kenyon Coll IIB PI 104.2 85.7 69.2 61.8 88.0 144.0 117.4 92.4 81.0 120.3 36.7 98.5 94.2 0.0 0.0 1.9 3.2 3.3 43 25 26 1 25 27 22 2 103.4 87.0 69.6 — 105.4 84.6 68.8 —
Malone U IIA PR 67.4 58.3 49.3 46.9 59.2 91.2 79.5 68.5 75.3 81.5 37.6 100.0 77.3 0.0 0.0 1.0 1.3 3.5 4.3 23 10 7 0 10 12 12 5 67.6 59.0 51.3 66.9 57.7 48.1 46.9
Marietta Coll 7,21 IIB PI 79.6 70.7 61.0 48.1 67.8 103.8 99.4 84.5 67.7 92.6 36.5 100.0 71.4 0.0 0.0 12.9 14.3 9.7 13.2 22 15 24 1 9 13 15 8 80.2 69.6 63.0 — 78.2 72.0 57.7 48.6
Miami U-Hamilton IIB PU 113.0 75.1 62.3 39.5 52.5 41.8 64.1 156.5 104.1 86.3 54.7 72.7 57.9 88.8 38.5 100.0 90.3 0.0 0.0 2.2 3.0 9.2 9.0 6 14 4 5 4 17 8 4 115.1 76.8 65.5 39.6 109.9 73.8 60.7 39.3
Miami U-Middletown IIB PU 96.7 79.3 63.6 43.0 53.8 41.7 67.6 133.9 109.8 88.0 59.5 74.5 57.8 93.6 38.5 100.0 92.3 6.3 0.0 3.2 2.7 7.2 2.2 7 9 5 2 6 4 11 3 97.0 80.6 61.3 — 96.3 76.3 64.6 44.8
Miami U-Oxford I PU 127.8 93.5 91.6 46.8 62.7 51.5 86.9 177.0 129.5 126.9 64.8 86.9 71.3 120.3 38.5 99.6 96.1 1.5 0.0 3.4 3.9 4.0 7.3 144 118 124 47 89 86 73 43 131.9 99.9 96.2 48.9 121.1 84.8 83.8 44.6
Mount Saint Joseph U 7 IIA PR 70.5 67.5 57.9 52.7 61.2 86.2 82.3 70.8 61.8 74.2 21.2 100.0 73.1 0.0 0.0 3.9 8.9 4.9 5.1 9 10 11 6 7 16 23 17 75.5 69.9 57.7 55.6 64.2 65.9 58.0 51.7
Muskingum U IIA PR 82.2 68.7 60.2 — 70.6 114.5 91.7 79.9 — 95.5 35.3 86.7 70.5 4.4 0.0 0.4 3.7 4.2 19 24 8 0 11 20 15 1 82.4 71.1 63.3 81.8 65.8 58.6 —
Oberlin Coll IIB PI 128.4 94.4 69.4 52.3 98.5 173.0 125.8 89.4 65.2 130.9 32.9 98.2 94.3 0.0 0.0 0.0 0.4 0.3 0.0 71 49 40 2 37 38 49 4 132.2 97.5 71.2 — 121.2 90.4 67.9 58.7
Ohio Northern U IIB PR 96.7 77.6 70.9 53.5 79.4 124.4 102.3 94.5 74.3 104.4 31.4 98.3 91.8 4.0 0.0 45 43 41 2 15 30 35 8 95.8 78.7 71.3 — 99.4 75.9 70.4 52.9
Ohio St U Agricultural Technical Institute 7 III PU 122.3 75.4 76.4 81.2 154.1 98.8 99.0 105.3 29.6 100.0 100.0 9.1 3.8 3.3 2.8 1 7 8 0 2 5 3 0 — 73.2 78.4 — 78.5 71.1
Ohio St U-Lima Campus 7 III PU 108.9 76.3 64.3 86.7 137.3 99.3 85.0 111.4 28.5 100.0 100.0 0.0 2.5 3.7 2.3 8 8 3 0 3 9 0 0 119.9 77.3 64.3 79.5 75.4
Ohio St U-Main Campus 7 I PU 152.2 103.5 92.3 150.1 121.6 187.4 130.6 117.6 184.3 151.7 24.8 94.0 86.4 0.2 0.0 3.4 4.2 4.2 6.5 717 377 304 5 298 338 325 4 157.2 107.2 96.0 162.3 140.1 99.4 88.8 134.7
Ohio St U-Mansfield Campus 7 III PU 96.8 74.4 62.0 76.7 122.7 97.5 82.4 99.9 30.3 100.0 100.0 0.0 1.9 2.3 3.9 5 11 3 0 0 14 0 0 96.8 76.2 62.0 73.0
Ohio St U-Marion Campus 7 IIB PU 110.4 80.8 73.9 81.2 139.0 104.7 96.2 104.9 29.2 100.0 100.0 0.0 3.5 2.7 4.8 3 10 6 0 1 9 9 0 108.0 81.2 77.4 — 80.4 71.6
Ohio St U-Newark Campus 7 III PU 101.4 90.3 79.9 90.2 127.9 115.2 103.0 115.0 27.5 100.0 100.0 0.0 2.9 3.8 4.7 4 19 4 0 4 10 5 0 100.4 90.8 85.1 102.3 89.4 75.7
Ohio U-Chillicothe Campus III PU — 81.3 64.2 77.2 — 112.1 92.5 107.4 39.2 100.0 100.0 25.0 1.5 5.2 0 7 2 0 1 4 2 0 79.2 — — 84.8 —
Ohio U-Eastern Campus III PU 78.2 65.6 74.8 108.6 94.1 104.7 40.0 100.0 25.0 1.4 1.8 0 8 1 0 0 3 3 0 76.8 — 81.9 62.6
Ohio U-Lancaster Campus III PU 94.1 76.9 61.7 77.2 126.9 107.2 89.7 107.5 39.2 100.0 94.1 0.0 1.6 1.7 1.8 2 10 0 0 1 7 3 0 — 75.0 — 79.8 61.7
Ohio U-Main Campus I PU 113.4 87.6 79.3 94.6 148.9 119.4 109.9 127.4 34.7 100.0 95.9 1.2 1.7 2.3 2.8 168 169 98 0 69 98 72 0 116.7 89.3 79.6 105.3 84.7 79.0
Ohio U-Southern Campus III PU — 75.6 60.4 72.3 — 105.6 88.2 101.9 40.9 100.0 100.0 0.0 1.5 1.4 0 1 2 0 1 10 3 0 — — — 75.8 61.3
Ohio U-Zanesville Campus III PU 89.9 74.5 60.8 74.9 122.1 104.3 88.6 104.8 40.0 100.0 100.0 0.0 1.2 2.6 1.7 5 6 2 0 2 10 5 0 89.9 74.1 — — 74.7 60.5
Ohio Wesleyan U IIB PR 94.6 69.6 59.8 58.3 78.8 128.7 97.5 80.3 76.7 107.7 36.6 100.0 100.0 5.3 0.0 3.0 3.7 5.9 8.9 44 22 7 6 18 18 12 6 94.6 69.3 60.3 61.3 94.6 70.0 59.5 55.2
Otterbein U IIA PR 73.4 64.1 60.6 61.1 66.4 95.8 84.6 77.3 77.5 86.3 30.1 93.2 86.2 0.0 0.0 1.0 2.5 2.2 2.2 32 22 10 9 27 36 21 11 75.3 65.5 60.3 64.7 71.2 63.3 60.8 58.2
Sinclair CC III PU 81.7 62.8 55.8 49.0 72.1 108.0 83.1 73.8 64.8 95.4 32.3 98.2 40.7 7.0 0.0 3.0 4.3 6.7 7.8 75 25 20 0 92 61 23 4 82.4 64.0 56.0 81.1 62.3 55.6 49.0
Tiffin U IIA PI 76.3 67.1 59.3 50.1 63.5 97.2 86.0 74.8 66.2 80.9 27.3 0.0 0.0 0.0 0.0 2.9 2.8 4.6 9.9 10 6 20 6 4 11 15 1 78.2 61.6 61.8 50.9 71.4 70.2 55.9 —
U Akron Main Campus 7 I PU 118.3 89.9 76.5 56.6 66.5 89.1 150.8 117.5 101.3 77.4 88.8 116.2 30.4 98.6 93.3 0.0 0.0 3.6 4.4 3.1 4.3 156 99 45 46 60 80 40 82 123.5 93.1 76.2 52.7 104.7 86.0 76.9 58.8
U Akron Wayne Coll 7 III PU 92.3 69.4 — — 72.6 117.3 91.7 — — 95.9 32.1 100.0 100.0 0.0 0.0 3.0 5.5 3 5 0 1 2 4 2 1 97.7 70.9 — — 67.5 — —
U Cincinnati-Blue Ash Coll 1 III PU 98.1 77.1 58.9 49.4 73.8 128.3 101.2 77.4 64.2 96.8 31.2 96.3 96.1 1.9 0.0 4.6 5.1 6.8 7.0 7 31 18 2 20 45 35 3 102.4 77.9 58.7 — 96.6 76.5 59.0 48.8
U Cincinnati-Clermont Coll 1 III PU 97.2 74.7 60.5 52.9 79.4 127.1 97.7 79.5 71.0 104.0 31.0 100.0 85.7 0.0 0.0 4.6 3.5 5.5 13.7 15 13 10 1 15 15 7 2 98.9 77.0 59.8 — 95.5 72.7 61.5 —
U Cincinnati-Main Campus 1 I PU 125.4 89.7 76.7 54.4 94.1 164.0 117.5 100.6 71.9 123.3 30.9 88.6 73.2 1.0 0.0 3.1 4.3 5.0 6.7 266 221 194 36 130 212 223 45 131.6 93.9 83.2 56.8 112.8 85.4 71.1 52.5
U Dayton 7 I PR 119.2 87.7 79.3 54.8 82.8 152.4 114.9 98.5 72.9 106.8 29.0 100.0 96.4 2.9 2.3 3.0 3.6 97 101 72 0 31 64 67 0 124.0 89.0 82.8 104.2 85.4 75.6
U Mount Union 7 IIB PR 89.7 72.5 61.9 53.3 73.3 115.0 93.3 79.3 69.5 94.2 28.4 90.2 71.7 2.3 0.0 0.8 0.8 1.1 2.4 23 29 18 3 18 17 25 4 89.7 72.3 62.1 49.3 89.8 72.9 61.8 56.4
U Toledo I PU 111.5 92.7 79.9 65.8 58.8 50.5 86.3 156.7 131.8 113.0 98.3 83.8 70.1 122.2 41.5 96.0 88.8 4.7 5.0 156 116 69 3 69 71 60 17 113.2 95.1 82.7 67.8 107.9 88.7 76.7 65.5
Ursuline Coll IIA PR 76.2 61.9 59.0 52.4 62.7 99.7 82.5 84.0 77.8 86.4 37.8 100.0 85.7 0.0 0.0 2.0 4.1 5.3 6.9 5 3 1 1 10 11 20 10 77.6 59.0 — — 75.5 62.8 59.2 52.6
Wittenberg U 7 IIB PR 73.9 62.4 57.0 64.9 95.8 78.8 70.5 82.4 27.0 97.7 97.6 2.8 28 20 18 0 15 22 18 0 74.3 63.0 57.7 73.1 61.9 56.2
Xavier U 7 IIA PR 110.3 86.6 86.6 63.4 47.3 43.3 81.2 141.5 112.7 112.4 84.4 58.7 55.6 105.4 29.8 100.0 96.2 2.8 0.0 5.1 8.1 7.3 8.0 41 56 30 25 26 50 41 57 109.9 89.2 89.4 61.5 110.9 83.7 84.5 64.3
Youngstown St U IIA PU 92.5 77.2 66.0 51.3 76.1 126.1 108.3 88.1 66.7 103.7 36.3 100.0 100.0 12.4 2.6 3.6 4.6 100 62 43 0 39 54 54 0 93.9 79.6 67.8 89.1 74.4 64.5
OklahomaCameron U 1 IIA PU 72.1 57.9 51.3 42.0 56.0 99.4 81.3 73.0 61.2 79.0 41.0 100.0 100.0 14.3 0.0 2.6 2.7 4.0 6.4 28 17 13 15 8 14 15 21 73.1 57.7 51.6 41.3 68.9 58.0 51.1 42.5
Oklahoma St U-Main Campus 7 I PU 110.9 81.5 80.3 49.8 43.9 83.1 144.8 107.6 100.4 68.6 48.4 106.2 27.7 99.0 95.6 0.7 9.1 0.2 1.1 1.8 230 166 173 3 72 107 121 8 113.6 83.0 82.7 51.7 102.2 79.0 77.0 49.1
Oklahoma St U-Oklahoma City 1 III PU 65.6 55.2 46.7 45.0 — 50.2 82.6 68.2 57.7 55.0 — 61.9 23.4 100.0 100.0 0.0 0.0 4.0 7.5 6.2 5.3 4 6 7 9 3 16 18 13 64.9 53.4 47.8 43.0 66.6 55.9 46.4 46.3
Southeastern Oklahoma St U IIA PU 75.2 65.1 59.4 39.6 63.5 104.7 91.8 84.1 58.5 89.5 41.0 100.0 100.0 3.7 0.0 0.1 0.3 1.7 0.8 34 12 15 6 11 11 12 13 75.2 68.0 57.4 37.7 74.9 62.0 61.9 40.5
Southwestern Oklahoma St U 7 IIA PU 82.2 65.9 60.9 50.9 62.9 112.9 91.7 85.8 73.4 88.3 40.5 100.0 86.4 13.7 4.5 0.2 1.9 1.6 6.5 22 17 30 27 18 27 21 40 83.9 64.0 56.4 50.0 80.1 67.1 67.2 51.5
U Central Oklahoma IIA PU 87.1 70.8 62.6 51.6 36.4 67.8 109.9 90.4 80.6 67.7 49.3 86.9 28.1 100.0 70.4 5.6 0.0 -0.1 6.5 3.1 2.6 121 29 45 18 89 52 62 30 89.9 73.4 64.6 52.8 83.3 69.4 61.1 50.9
U Oklahoma-Norman Campus 7 I PU 124.3 85.2 77.6 43.0 47.5 87.4 160.9 110.0 99.5 57.8 62.9 113.2 29.4 97.0 88.9 0.0 0.0 1.5 1.3 1.1 2.1 274 203 178 46 92 129 128 83 130.1 88.0 79.7 46.3 107.1 80.8 74.7 41.1
U Science and Arts Oklahoma IIB PU 58.7 55.0 45.7 40.2 52.6 74.0 69.9 59.4 53.2 67.1 27.7 100.0 81.3 0.0 0.0 0.0 -1.5 2.2 1.8 6 11 5 2 11 5 5 4 60.2 55.0 45.4 — 57.9 55.0 46.0 40.3
U Tulsa I PR 121.6 84.7 83.2 57.8 94.8 160.6 113.2 108.7 80.8 125.5 32.3 93.2 78.8 0.0 0.0 -0.4 0.8 0.8 0.0 93 69 55 9 25 30 64 12 121.5 88.2 89.0 61.7 122.0 76.6 78.2 54.9
OregonLewis & Clark Coll IIA PI 121.4 81.7 68.1 50.4 — — 87.6 158.3 107.8 90.7 70.8 — — 115.9 32.2 84.1 93.8 0.0 0.0 0.0 0.1 8.4 13.5 40 38 15 5 23 43 35 11 127.5 85.0 66.6 51.9 110.7 78.8 68.7 49.7
Linfield Coll-McMinnville Campus 7,39 IIB PR 89.0 69.5 62.4 60.1 73.8 125.5 99.0 88.5 81.8 104.0 41.0 96.2 92.5 6.3 0.0 1.0 2.5 1.0 0.9 28 15 13 5 24 25 19 14 88.6 69.7 65.5 59.6 89.5 69.4 60.4 60.3
Oregon St U 7 I PU 126.9 96.4 85.7 54.6 — 89.3 183.4 140.3 123.4 86.2 — 131.4 47.1 99.4 88.9 0.4 0.8 3.5 4.1 4.8 4.9 249 170 158 191 86 108 123 197 128.7 98.8 88.1 56.3 121.7 92.6 82.6 52.9
Portland St U 7 I PU 117.2 89.2 75.0 60.9 47.3 87.1 171.9 130.6 108.0 90.8 68.6 127.4 46.3 95.2 91.0 0.5 0.0 6.3 6.4 5.1 7.4 142 103 87 61 66 96 127 91 119.8 90.9 79.8 62.3 111.7 87.5 71.7 60.0
© 2019 American Association of University Professors

APPENDIX I APPENDIX I
NAME NOTES
(1) (2) (3) (4) (5) (6) (7) (8) (9)
CAT. CTRL
AVG. SALARY ($1000s) AVG. COMPENSATION ($1000s) BEN. as %
of SAL.
PCT. TENURED PCT. INCR. (CONT. FAC.) F-T FAC. MEN F-T FAC. WOMEN AVG. SAL. MEN AVG. SAL. WOMEN
PR AO AI IN LE NR AR PR AO AI IN LE NR AR PR AO AI IN PR AO AI IN PR AO AI IN PR AO AI IN PR AO AI IN PR AO AI IN
Oregon (continued)Reed Coll IIB PI 124.9 91.4 78.0 82.4 105.4 161.3 122.5 99.5 107.0 137.0 30.0 98.7 94.4 0.0 0.0 3.5 3.5 4.0 3.8 50 18 11 8 27 18 17 2 126.0 91.8 76.4 84.5 122.9 90.9 79.1 —
U Oregon 7 I PU 137.3 100.9 89.4 58.5 78.3 96.3 191.0 141.6 123.4 87.3 114.3 135.9 41.1 95.8 97.6 0.0 1.6 4.6 4.4 4.3 4.8 217 163 108 156 92 124 97 165 137.0 103.1 93.9 61.1 138.1 98.0 84.4 56.1
Willamette U IIB PI 117.0 92.9 68.8 65.0 97.6 157.4 120.2 92.0 90.8 129.7 33.0 95.1 98.4 0.0 0.0 0.9 4.1 2.5 10.5 53 26 20 3 29 37 15 6 116.8 96.0 72.1 59.3 117.3 90.7 64.3 67.8
PennsylvaniaAlbright Coll IIB PR 82.1 69.9 61.5 52.3 67.2 111.2 94.8 83.3 70.9 91.1 35.5 100.0 89.5 0.0 0.0 1.7 1.3 2.1 1.9 13 22 12 4 7 16 19 11 81.2 69.3 63.3 52.6 83.6 70.8 60.3 52.2
Allegheny Coll 1 IIB PR 88.8 71.7 62.9 50.0 70.9 124.2 95.1 83.1 71.5 95.7 34.9 100.0 93.0 0.0 0.0 2.0 2.0 2.0 2.0 21 17 26 3 13 26 35 4 90.5 72.2 64.1 53.0 86.0 71.4 62.0 47.8
Alvernia U IIA PR 86.4 70.7 64.6 54.6 67.0 114.2 93.6 87.5 73.9 89.6 33.8 100.0 97.6 20.9 0.0 4 20 20 3 6 21 23 17 92.8 69.7 60.2 49.0 82.1 71.6 68.4 55.6
Bloomsburg U Pennsylvania IIA PU 111.7 88.1 71.6 51.0 85.3 135.0 109.6 89.0 62.6 104.8 22.8 99.2 82.0 15.1 1.7 1.2 2.9 4.0 3.1 89 52 48 29 39 48 71 30 112.2 88.5 72.5 50.3 110.6 87.7 71.0 51.7
Bryn Mawr Coll IIA PI 143.7 99.4 80.1 81.5 78.0 — 104.2 182.7 133.2 104.6 105.2 108.5 — 136.3 30.8 100.0 100.0 0.0 0.0 4.7 3.7 3.5 22 17 14 2 27 20 29 1 145.7 100.2 80.6 — 142.1 98.8 79.9 —
Bucknell U IIB PI 126.5 104.5 84.3 77.7 104.7 164.9 137.7 111.1 102.7 137.3 31.2 99.2 97.7 0.0 0.0 2.7 3.7 3.9 86 73 54 10 40 56 58 7 128.5 106.1 83.8 77.5 122.1 102.5 84.9 77.9
Butler County CC III PU 80.4 68.1 60.6 47.5 62.1 121.4 104.7 95.5 70.6 94.5 52.2 100.0 100.0 100.0 34.8 3.3 3.2 3.5 3.4 4 6 6 5 11 7 5 18 88.4 72.9 66.6 50.6 77.5 63.9 53.4 46.6
California U Pennsylvania IIA PU 112.1 91.9 76.7 53.2 90.9 138.7 114.5 97.8 67.5 113.7 25.1 100.0 87.3 33.3 3.7 1.4 2.5 2.4 7.1 52 36 34 8 45 35 44 19 112.6 93.1 77.0 55.3 111.4 90.8 76.5 52.4
Carnegie Mellon U 7 I PI 167.0 115.2 106.9 79.8 132.2 206.5 144.1 133.0 99.1 164.1 24.1 86.2 43.3 0.0 3.3 4.6 5.1 315 174 148 0 90 78 94 0 173.3 119.2 109.2 144.9 106.3 103.4
Cedar Crest Coll 5 IIB PI 87.0 75.8 62.0 57.4 70.0 107.2 97.9 78.7 71.5 88.0 25.7 100.0 71.4 0.0 0.0 2.0 2.0 4.6 2.3 9 5 11 0 13 9 19 17 91.4 69.0 70.0 84.0 79.6 57.4 57.4
Chatham U 7 IIA PI 86.8 69.8 63.5 — 68.3 111.7 93.0 82.4 — 89.3 30.8 35.7 7.1 0.0 0.0 2.0 2.3 2.1 3 15 19 1 11 27 44 0 88.1 66.8 64.0 — 86.5 71.4 63.2
Cheyney U Pennsylvania IIB PU 110.6 92.3 69.8 — 94.1 140.1 114.2 82.2 — 117.4 24.8 100.0 100.0 16.7 0.0 1.3 2.5 2.5 10 4 4 1 5 4 2 1 113.2 92.8 68.6 — 105.3 91.8 — —
Clarion U Pennsylvania IIA PU 113.7 89.1 71.3 50.7 86.8 140.9 113.7 89.8 64.0 108.9 25.5 97.1 88.5 53.7 3.2 1.0 2.4 3.0 3.2 48 21 19 7 20 31 35 24 114.3 89.4 77.2 49.2 112.4 88.9 68.0 51.2
Delaware Valley U IIA PI 89.9 77.7 66.3 61.4 58.9 75.4 118.9 109.2 91.4 86.5 83.8 103.4 37.2 100.0 74.1 13.8 0.0 6.1 8.8 6.4 8.1 15 18 15 2 10 9 14 6 90.1 78.9 67.1 — 89.6 75.4 65.5 61.1
DeSales U 7 IIA PR 96.5 77.8 68.2 56.9 73.6 127.6 102.9 91.6 76.3 98.2 33.3 87.5 62.2 0.0 0.0 4.3 5.2 2.3 2.1 10 20 24 8 6 17 35 4 94.6 79.2 71.6 56.4 99.5 76.1 65.8 58.0
Dickinson Coll IIB PI 110.5 88.2 74.6 64.6 88.0 143.8 114.0 94.3 88.3 113.8 29.3 100.0 91.4 1.5 4.8 -0.1 0.7 3.3 1.9 36 42 25 6 24 39 41 15 112.8 90.6 74.5 64.6 107.2 85.6 74.7 64.6
Drexel U 7 I PI 156.8 114.3 97.6 75.4 103.7 195.8 146.2 124.7 101.3 133.8 29.0 100.0 95.0 1.6 0.0 0.4 1.0 1.3 0.4 182 104 71 234 61 114 57 276 158.5 117.2 102.0 79.4 151.9 111.6 92.1 72.0
Duquesne U 7 I PR 113.9 90.6 74.3 62.3 87.7 143.0 116.1 94.9 80.7 111.8 27.4 99.0 94.6 1.6 0.0 3.0 2.6 2.8 3.9 63 106 61 9 35 78 123 15 118.8 91.4 78.8 55.9 105.1 89.4 72.1 66.1
East Stroudsburg U Pennsylvania IIA PU 112.2 89.3 71.4 51.1 86.3 135.5 108.9 87.4 60.9 104.5 21.2 100.0 83.1 27.5 3.9 1.7 2.5 3.5 1.1 55 38 15 15 29 33 25 36 112.9 89.8 72.7 49.5 110.9 88.6 70.6 51.7
Eastern U 7 IIA PR 71.6 61.7 48.4 — 49.1 37.7 57.4 84.2 70.9 55.8 — 56.6 43.5 66.6 16.0 94.1 82.1 5.3 0.0 20 14 5 1 14 14 14 1 72.0 64.0 50.9 — 70.9 59.4 47.6 —
Edinboro U Pennsylvania IIA PU 112.4 89.8 73.4 52.6 89.2 139.7 112.6 92.2 66.2 111.4 25.0 100.0 96.9 52.5 3.3 1.2 2.6 3.5 5.2 53 37 33 6 34 28 28 24 112.2 92.1 75.3 50.5 112.7 86.7 71.2 53.1
Elizabethtown Coll 1 IIB PR 95.8 78.1 66.4 56.8 70.7 79.7 139.0 110.4 91.8 67.7 98.0 112.8 41.5 100.0 96.5 0.0 0.0 1.8 1.7 3.6 22 33 5 1 11 24 17 2 98.5 78.5 75.0 — 90.5 77.4 63.9 —
Franklin and Marshall Coll IIB PI 121.5 94.2 80.5 68.7 95.2 164.7 130.1 107.8 94.2 129.8 36.3 100.0 100.0 0.0 0.0 5.3 5.3 5.0 2.9 50 38 13 21 27 32 31 28 122.0 94.7 80.8 71.2 120.4 93.6 80.3 66.8
Geneva Coll IIA PR 68.6 59.2 47.8 — 61.4 83.8 72.9 58.5 — 75.5 22.8 86.2 46.4 0.0 0.0 20 18 5 1 9 10 4 0 68.1 62.1 47.0 — 69.5 54.0 48.7
Gettysburg Coll IIB PI 108.9 88.5 74.3 90.5 150.7 121.5 104.5 125.2 38.4 100.0 100.0 0.0 2.3 2.3 3.7 32 50 27 0 23 37 25 0 110.7 89.8 73.7 106.4 86.7 74.8
Gwynedd Mercy U 7 IIA PR 100.4 71.7 62.8 47.5 64.6 120.8 96.6 82.4 60.0 83.8 29.7 75.0 50.0 20.0 0.0 6.1 3.4 1.5 6.7 3 12 4 3 5 8 36 18 86.0 73.4 68.1 38.3 109.0 69.2 62.3 49.0
Haverford Coll IIB PI 130.8 101.0 83.2 74.7 99.5 178.2 145.4 121.2 103.9 139.7 40.4 100.0 100.0 0.0 0.0 2.3 3.0 4.5 2.5 23 18 9 16 16 17 19 17 128.2 98.9 82.4 76.4 134.6 103.2 83.6 73.0
Holy Family U IIA PR 92.2 74.4 69.0 62.7 73.9 113.7 91.7 85.1 77.3 91.1 23.3 0.0 0.0 0.0 0.0 5 5 10 1 9 13 15 12 99.1 75.6 67.6 — 88.4 73.9 70.0 59.9
Indiana U Pennsylvania-Main Campus I PU 111.5 86.3 67.8 54.0 89.0 138.1 108.3 85.9 70.8 111.4 25.2 99.4 91.6 26.9 5.7 1.2 3.1 5.2 2.3 107 81 49 12 69 86 59 23 112.0 86.0 69.3 52.6 110.7 86.7 66.6 54.7
Jefferson (Philadelphia Uþ Thomas Jefferson U) 5,43 IIA PI 112.2 87.0 76.6 71.3 51.0 81.5 147.5 116.5 109.0 99.7 60.0 111.5 36.9 51.6 20.5 0.0 0.0 17 34 38 7 14 54 85 25 103.1 82.3 79.0 66.5 123.2 90.0 75.5 72.6
Juniata Coll IIB PI 87.8 69.4 62.0 54.0 77.2 127.5 98.8 94.0 69.0 112.1 45.1 100.0 96.0 26.3 0.0 0.0 5.3 -0.8 0.0 35 13 5 2 20 12 14 2 88.4 69.8 65.6 — 86.6 68.9 60.8 —
King’s Coll 1 IIA PR 89.8 71.2 65.0 46.9 73.4 115.8 94.3 82.6 55.6 94.9 29.3 79.1 69.8 0.0 0.0 1.2 3.8 3.3 0.2 23 27 14 3 20 26 18 9 91.0 69.9 69.2 45.9 88.4 72.5 61.8 47.3
Kutztown U Pennsylvania IIA PU 108.2 88.5 64.2 50.2 84.6 133.3 108.6 79.1 60.1 104.0 22.9 98.2 96.4 23.5 0.0 1.9 2.4 4.1 3.8 68 81 48 13 44 59 71 9 109.0 89.2 62.7 50.3 107.0 87.4 65.1 50.0
La Roche Coll IIB PR 77.5 63.8 53.4 — 64.7 94.4 79.6 64.7 — 79.2 22.5 0.0 0.0 0.0 0.0 1.9 4.8 3.8 4.7 11 7 9 1 12 9 14 0 77.2 63.5 52.7 — 77.8 64.0 53.9
La Salle U IIA PR 117.0 84.8 73.2 62.5 86.4 137.8 103.2 87.3 87.6 104.1 20.5 95.5 95.4 5.3 0.0 2.0 2.3 3.5 2.0 25 39 24 0 19 48 51 9 118.0 85.8 74.3 115.8 83.9 72.6 62.5
Lafayette Coll IIB PR 147.7 105.4 86.3 76.5 110.9 187.4 139.6 109.9 98.3 142.9 28.9 100.0 97.5 0.0 0.0 3.4 3.5 4.0 2.9 48 55 27 9 26 25 39 10 150.3 106.9 87.4 71.8 142.9 102.0 85.5 80.7
Lebanon Valley Coll 7 IIA PR 81.1 70.3 61.0 — — 68.8 102.1 92.3 79.7 — — 89.0 29.5 100.0 86.4 0.0 0.0 0.0 0.0 0.0 21 25 19 0 8 19 28 1 81.0 70.2 60.9 81.3 70.4 61.1 —
Lehigh U I PI 161.7 109.2 101.0 84.9 65.9 121.6 208.0 142.1 127.8 112.2 71.1 156.5 28.7 100.0 97.5 0.0 3.0 3.8 3.9 142 99 54 0 48 58 53 0 167.5 108.0 107.0 144.8 111.1 94.9
Lincoln U IIA PU 103.6 79.1 68.0 58.4 57.9 79.4 131.2 101.2 87.9 81.2 75.4 102.0 28.5 96.3 92.0 3.2 0.0 5.4 3.7 3.8 -7.1 20 16 14 5 7 9 17 2 105.6 80.6 67.1 56.2 98.1 76.5 68.8 —
Lock Haven U IIA PU 110.3 90.6 72.8 56.3 93.5 138.8 115.2 90.9 70.0 117.7 26.0 100.0 98.2 38.8 0.0 1.7 2.6 2.3 1.5 45 30 23 2 38 26 26 4 110.8 92.6 70.4 — 109.8 88.2 74.9 57.1
Lycoming Coll IIB PR 90.4 72.3 62.5 49.8 70.6 120.6 98.6 84.4 66.3 95.2 35.0 100.0 100.0 36.7 0.0 3.4 2.2 2.8 2.0 12 12 19 5 5 16 11 2 89.8 74.9 62.8 49.6 91.6 70.3 62.1 —
Mansfield U Pennsylvania IIA PU 113.8 90.0 69.7 59.6 90.1 137.6 111.3 85.2 72.5 110.3 22.3 100.0 87.2 23.8 0.0 0.8 2.0 4.6 2.5 15 22 7 0 11 17 14 6 114.8 91.2 71.3 112.4 88.6 68.9 59.6
Marywood U 7 IIA PR 101.0 74.4 62.6 53.1 69.8 126.6 96.2 80.5 72.9 90.3 29.4 100.0 85.7 4.0 0.0 0.7 0.8 1.5 0.8 10 25 19 1 5 31 31 21 101.1 78.1 62.2 — 100.8 71.5 62.9 53.1
Mercyhurst U 1 IIA PR 89.3 68.0 62.5 47.9 54.3 63.9 116.8 90.2 81.5 64.1 68.9 84.0 31.4 96.2 100.0 0.0 0.0 1.1 1.9 1.6 2.5 18 23 30 12 8 16 38 29 92.3 67.9 64.8 49.3 82.5 68.3 60.7 47.3
Messiah Coll 1 IIA PR 92.4 74.7 63.8 59.7 77.6 128.8 102.1 82.0 80.8 105.7 36.3 96.1 88.5 2.2 1.3 3.5 3.5 58 27 22 0 19 25 24 0 92.9 74.6 64.5 91.0 74.8 63.1
Millersville U Pennsylvania IIA PU 112.9 89.5 67.9 53.8 90.0 140.7 114.2 83.9 65.4 113.0 25.5 100.0 98.2 34.2 0.0 1.1 2.0 4.4 52 59 35 1 38 53 47 4 113.3 88.7 69.8 — 112.3 90.3 66.6 54.5
Misericordia U 7 IIA PR 100.4 78.7 65.5 58.1 74.5 133.0 106.4 88.1 73.1 99.8 33.9 95.8 100.0 0.0 0.0 2.0 1.2 2.4 2.0 15 16 21 5 9 19 49 3 99.0 75.9 65.7 62.3 102.7 81.0 65.4 51.2
Moravian Coll 1 IIA PR 87.4 74.2 65.6 56.1 72.2 114.5 98.0 85.9 71.9 94.6 31.0 97.1 92.0 0.0 0.0 4.3 4.3 2.8 2.8 20 17 13 8 14 33 27 14 89.9 71.4 66.2 58.1 83.8 75.7 65.4 55.0
Muhlenberg Coll IIB PR 103.3 81.0 70.0 60.8 — 81.7 144.4 107.2 91.9 82.4 — 110.7 35.4 98.3 100.0 0.0 0.6 1.5 1.9 38 23 22 0 19 22 31 0 106.7 82.0 69.2 96.6 80.0 70.6
Neumann U IIA PR 82.4 62.0 58.2 53.4 65.1 111.4 84.6 77.7 78.5 88.2 35.6 0.0 0.0 0.0 0.0 1.0 0.0 0.0 0.0 13 13 12 2 10 19 22 4 82.1 59.2 57.3 — 82.9 64.0 58.7 51.2
Pennsylvania St U-IIA campuses 7,32 IIA PU 126.7 101.9 78.4 68.2 64.4 88.6 163.2 137.0 110.1 99.1 92.7 121.4 37.0 93.8 85.5 0.0 0.0 43 113 148 1 21 46 96 8 129.9 104.8 81.2 — 120.2 95.0 74.2 68.4
Pennsylvania St U-IIB campuses 7,22 IIB PU 110.1 85.5 67.9 60.9 57.4 75.6 146.4 116.4 96.1 91.2 86.5 105.8 40.0 96.1 86.0 2.4 0.0 88 156 178 41 40 150 205 78 109.3 86.7 69.5 63.5 111.7 84.3 66.4 59.5
Pennsylvania St U-Main Campus 7,47 I PU 155.5 102.2 80.7 54.1 59.2 106.9 196.9 135.2 108.9 75.3 85.1 139.8 30.9 91.0 67.7 0.0 0.0 730 395 418 126 250 298 407 117 159.2 107.8 85.2 54.9 144.6 94.8 76.1 53.3
Pittsburgh Theological Sem IIA PR 105.5 87.5 69.2 92.6 139.1 117.6 96.9 123.9 33.9 100.0 50.0 0.0 6 2 3 0 1 2 0 0 105.7 — 69.2 — —
Robert Morris U 1 I PI 120.8 99.2 95.9 47.9 105.1 156.2 128.7 120.5 67.3 135.5 28.9 98.8 83.9 31.8 2.5 3.7 2.8 50 29 22 0 35 33 22 0 122.4 103.0 90.1 118.5 95.9 101.7
Saint Joseph’s U IIA PR 126.9 96.2 86.5 61.6 94.9 156.6 121.8 106.1 77.5 118.2 24.5 100.0 100.0 31.5 2.7 3.5 3.2 48 44 42 0 27 48 31 0 131.5 102.5 86.0 118.7 90.4 87.3
Saint Vincent Coll IIA PR 88.9 70.7 58.9 49.1 69.8 127.4 103.6 81.7 76.5 100.5 44.0 87.0 95.1 0.0 0.0 2.1 2.5 3.2 1.0 17 30 17 5 6 11 15 1 90.3 71.4 59.8 48.2 84.8 68.8 57.8 —
© 2019 American Association of University Professors
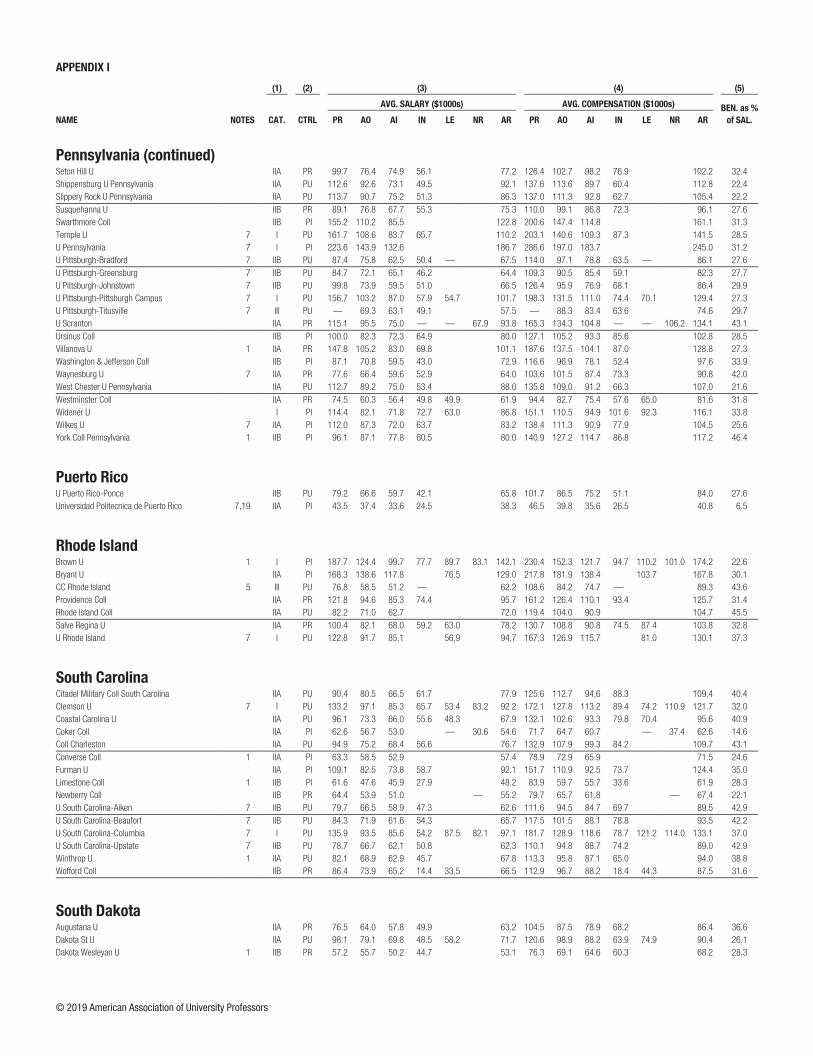
APPENDIX I APPENDIX I
NAME NOTES
(1) (2) (3) (4) (5) (6) (7) (8) (9)
CAT. CTRL
AVG. SALARY ($1000s) AVG. COMPENSATION ($1000s) BEN. as %
of SAL.
PCT. TENURED PCT. INCR. (CONT. FAC.) F-T FAC. MEN F-T FAC. WOMEN AVG. SAL. MEN AVG. SAL. WOMEN
PR AO AI IN LE NR AR PR AO AI IN LE NR AR PR AO AI IN PR AO AI IN PR AO AI IN PR AO AI IN PR AO AI IN PR AO AI IN
Pennsylvania (continued)Seton Hill U IIA PR 99.7 76.4 74.9 56.1 77.2 126.4 102.7 98.2 76.9 102.2 32.4 92.3 70.6 0.0 0.0 3.8 2.0 2.4 4.3 7 25 11 2 6 26 16 7 112.9 78.0 86.7 — 84.3 74.8 66.8 54.3
Shippensburg U Pennsylvania IIA PU 112.6 92.6 73.1 49.5 92.1 137.6 113.6 89.7 60.4 112.8 22.4 100.0 89.3 41.2 0.0 1.2 1.7 4.0 -3.3 71 72 28 12 40 50 23 20 113.7 93.0 73.4 48.8 110.8 92.0 72.6 50.0
Slippery Rock U Pennsylvania IIA PU 113.7 90.7 75.2 51.3 86.3 137.0 111.3 92.8 62.7 105.4 22.2 100.0 83.6 32.4 0.0 1.0 2.2 3.7 4.9 40 63 51 24 44 59 54 24 113.8 91.2 75.5 51.2 113.5 90.1 74.9 51.4
Susquehanna U IIB PR 89.1 76.8 67.7 55.3 75.3 110.0 99.1 86.8 72.3 96.1 27.6 100.0 95.3 0.0 0.0 1.8 2.0 2.3 3.2 16 36 21 1 8 28 25 3 90.1 79.8 71.3 — 87.1 72.9 64.7 55.2
Swarthmore Coll IIB PI 155.2 110.2 85.5 122.8 200.6 147.4 114.8 161.1 31.3 97.8 90.5 0.0 2.3 4.8 3.3 51 20 31 0 40 22 34 0 158.9 107.5 86.1 150.4 112.7 85.0
Temple U 7 I PU 161.7 108.6 83.7 65.7 110.2 203.1 140.6 109.3 87.3 141.5 28.5 84.4 54.5 0.2 1.4 3.5 4.0 4.2 3.7 289 295 331 29 121 228 314 44 169.4 110.1 85.0 62.8 143.2 106.8 82.4 67.6
U Pennsylvania 7 I PI 223.6 143.9 132.6 186.7 286.6 197.0 183.7 245.0 31.2 100.0 96.4 0.0 3.7 5.8 5.2 475 132 133 0 161 87 127 0 228.0 149.9 142.1 210.7 134.7 122.5
U Pittsburgh-Bradford 7 IIB PU 87.4 75.8 62.5 50.4 — 67.5 114.0 97.1 78.8 63.5 — 86.1 27.6 100.0 87.0 0.0 0.0 3.3 3.7 2.7 2.4 7 17 14 7 2 6 13 6 86.9 76.9 63.6 49.2 — 72.8 61.2 51.8
U Pittsburgh-Greensburg 7 IIB PU 84.7 72.1 65.1 46.2 64.4 109.3 90.5 85.4 59.1 82.3 27.7 85.7 86.7 0.0 0.0 2.7 3.2 4.4 6.6 5 13 5 8 2 17 11 13 86.2 71.1 67.5 47.8 — 72.9 64.0 45.3
U Pittsburgh-Johnstown 7 IIB PU 99.8 73.9 59.5 51.0 66.5 126.4 95.9 76.9 68.1 86.4 29.9 100.0 92.7 0.0 0.0 2.9 3.0 5.1 3.8 9 34 25 10 3 21 20 22 99.6 75.8 60.9 55.5 100.4 70.8 57.8 49.0
U Pittsburgh-Pittsburgh Campus 7 I PU 156.7 103.2 87.0 57.9 54.7 101.7 198.3 131.5 111.0 74.4 70.1 129.4 27.3 88.8 69.8 0.0 0.0 3.4 3.3 3.3 4.1 348 217 247 63 134 193 256 117 161.6 105.9 89.8 63.7 143.8 100.2 84.2 54.8
U Pittsburgh-Titusville 7 III PU — 69.3 63.1 49.1 57.5 — 88.3 83.4 63.6 74.6 29.7 100.0 100.0 0.0 0.0 2.6 2.2 2.2 1 3 2 3 0 1 5 9 — 68.9 — 46.6 — 56.9 49.9
U Scranton IIA PR 115.1 95.5 75.0 — — 67.9 93.8 165.3 134.3 104.8 — — 106.2 134.1 43.1 100.0 93.1 23.2 0.0 2.6 4.4 2.5 62 49 34 2 28 38 22 0 117.5 98.4 78.8 — 109.8 91.8 69.0
Ursinus Coll IIB PI 100.0 82.3 72.3 64.9 80.0 127.1 105.2 93.3 85.6 102.8 28.5 100.0 100.0 0.0 0.0 1.9 2.1 2.1 3.8 17 15 14 5 8 22 30 11 100.8 81.9 72.7 67.4 98.3 82.6 72.1 63.8
Villanova U 1 IIA PR 147.8 105.2 83.0 69.8 101.1 187.6 137.5 104.1 87.0 128.8 27.3 98.7 94.7 7.2 0.0 3.2 3.5 2.9 3.9 116 106 116 58 39 81 120 60 150.5 107.4 81.0 74.1 139.8 102.3 84.9 65.7
Washington & Jefferson Coll IIB PI 87.1 70.8 59.5 43.0 72.9 116.6 96.9 78.1 52.4 97.6 33.9 100.0 97.1 0.0 0.0 0.0 0.4 0.0 0.0 25 17 13 2 19 18 17 3 89.1 72.8 62.5 — 84.5 68.9 57.1 38.6
Waynesburg U 7 IIA PR 77.6 66.4 59.6 52.9 64.0 103.6 101.5 87.4 73.3 90.8 42.0 85.7 100.0 13.0 0.0 3.0 3.2 6.7 5.1 13 7 12 6 8 8 11 14 79.7 61.4 60.8 47.5 74.1 70.7 58.3 55.2
West Chester U Pennsylvania IIA PU 112.7 89.2 75.0 53.4 88.0 135.8 109.0 91.2 66.3 107.0 21.6 98.1 74.2 6.4 1.1 1.1 2.6 4.3 2.1 102 100 76 35 105 117 97 55 114.3 90.4 75.3 54.6 111.2 88.2 74.7 52.6
Westminster Coll IIA PR 74.5 60.3 56.4 49.8 49.9 61.9 94.4 82.7 75.4 57.6 65.0 81.6 31.8 100.0 88.9 12.5 0.0 0.1 1.0 0.0 14 17 8 2 10 19 8 2 74.8 63.5 59.7 — 74.2 57.5 53.1 —
Widener U I PI 114.4 82.1 71.8 72.7 63.0 86.8 151.1 110.5 94.9 101.6 92.3 116.1 33.8 96.1 94.4 0.0 0.0 4.4 3.2 3.0 2.9 41 39 35 1 36 51 41 9 114.3 86.6 74.2 — 114.6 78.6 69.8 72.1
Wilkes U 7 IIA PI 112.0 87.3 72.0 63.7 83.2 138.4 111.3 90.9 77.9 104.5 25.6 97.1 100.0 0.0 0.0 2.6 2.4 3.8 2.5 26 33 33 8 9 31 35 18 112.4 88.3 74.6 61.3 110.8 86.3 69.5 64.8
York Coll Pennsylvania 1 IIB PI 96.1 87.1 77.8 60.5 80.0 140.9 127.2 114.7 86.8 117.2 46.4 92.9 92.8 27.8 0.0 2.0 2.0 2.0 1.8 10 36 35 14 4 33 37 14 93.6 92.5 82.3 60.8 102.2 81.3 73.4 60.1
Puerto RicoU Puerto Rico-Ponce IIB PU 79.2 66.6 59.7 42.1 65.8 101.7 86.5 75.2 51.1 84.0 27.6 100.0 100.0 62.5 55.6 0.1 0.3 0.1 0.5 11 8 8 8 15 10 16 1 79.4 69.0 61.7 41.9 79.1 64.6 58.6 —
Universidad Politecnica de Puerto Rico 7,19 IIA PI 43.5 37.4 33.6 24.5 38.3 46.5 39.8 35.6 26.5 40.8 6.5 44.7 9.9 0.0 0.0 30 51 10 2 8 30 6 2 44.4 39.6 35.6 — 40.0 33.7 30.4 —
Rhode IslandBrown U 1 I PI 187.7 124.4 99.7 77.7 89.7 83.1 142.1 230.4 152.3 121.7 94.7 110.2 101.0 174.2 22.6 98.3 96.5 0.0 0.0 2.7 4.3 4.6 3.0 301 89 97 30 100 54 61 29 190.1 127.1 100.7 75.9 180.4 120.0 98.2 79.6
Bryant U IIA PI 168.3 138.6 117.8 76.5 129.0 217.8 181.9 138.4 103.7 167.8 30.1 97.1 97.1 0.0 3.1 3.8 3.5 44 23 4 0 24 11 10 0 176.1 141.1 124.3 153.8 133.4 115.1
CC Rhode Island 5 III PU 76.8 58.5 51.2 — 62.2 108.6 84.2 74.7 — 89.3 43.6 100.0 100.0 26.9 0.0 0.0 0.4 0.0 37 25 46 0 73 44 73 2 80.6 58.9 51.0 74.8 58.3 51.3 —
Providence Coll IIA PR 121.8 94.6 85.3 74.4 95.7 161.2 126.4 110.1 93.4 125.7 31.4 100.0 92.2 27.7 0.0 6.4 5.9 4.3 3.0 44 60 62 10 18 42 50 6 123.1 96.4 84.1 72.6 118.7 92.0 86.7 77.4
Rhode Island Coll IIA PU 82.2 71.0 62.7 72.0 119.4 104.0 90.9 104.7 45.5 99.1 99.0 7.7 1.1 1.0 1.5 54 42 35 0 61 60 82 0 82.9 71.2 63.5 81.7 70.8 62.4
Salve Regina U IIA PR 100.4 82.1 68.0 59.2 63.0 78.2 130.7 108.8 90.8 74.5 87.4 103.8 32.8 100.0 100.0 0.0 0.0 0.8 4.3 3.0 14 20 7 0 13 15 24 4 101.5 82.4 66.4 99.3 81.7 68.5 59.2
U Rhode Island 7 I PU 122.8 91.7 85.1 56.9 94.7 167.3 126.9 115.7 81.0 130.1 37.3 95.6 86.6 0.0 1.3 1.9 0.8 176 68 76 0 97 81 104 0 125.5 94.8 86.4 118.1 89.1 84.1
South CarolinaCitadel Military Coll South Carolina IIA PU 90.4 80.5 66.5 61.7 77.9 125.6 112.7 94.6 88.3 109.4 40.4 96.9 71.6 1.7 0.0 -0.4 0.6 1.3 -1.0 52 38 33 12 13 29 26 7 91.3 85.4 69.9 63.9 86.9 74.0 62.1 57.9
Clemson U 7 I PU 133.2 97.1 85.3 65.7 53.4 83.2 92.2 172.1 127.8 113.2 89.4 74.2 110.9 121.7 32.0 99.4 92.4 0.4 0.0 2.0 2.1 2.2 0.0 265 183 161 1 72 119 122 3 134.9 98.3 88.1 — 127.2 95.3 81.6 66.3
Coastal Carolina U IIA PU 96.1 73.3 66.0 55.6 48.3 67.9 132.1 102.6 93.3 79.8 70.4 95.6 40.9 100.0 93.0 0.0 0.0 1.2 0.2 0.3 6.2 66 68 56 8 28 47 56 3 97.5 72.9 66.2 55.6 93.0 73.8 65.9 55.7
Coker Coll IIA PI 62.6 56.7 53.0 — 30.6 54.6 71.7 64.7 60.7 — 37.4 62.6 14.6 100.0 100.0 16.7 1.7 4.4 1.0 9 10 12 0 9 10 12 0 63.7 55.6 60.9 61.6 57.7 45.1
Coll Charleston IIA PU 94.9 75.2 68.4 56.6 76.7 132.9 107.9 99.3 84.2 109.7 43.1 98.0 97.2 0.7 0.0 0.8 0.4 1.5 0.9 92 100 73 21 55 80 74 39 96.0 78.3 71.6 58.3 93.1 71.3 65.3 55.6
Converse Coll 1 IIA PI 63.3 58.5 52.9 57.4 78.9 72.9 65.9 71.5 24.6 100.0 96.7 3.1 0.0 0.0 1.9 12 7 7 0 6 23 25 0 65.7 60.9 52.6 58.7 57.8 53.0
Furman U IIA PI 109.1 82.5 73.8 58.7 92.1 151.7 110.9 92.5 73.7 124.4 35.0 97.3 94.1 41.3 0.0 3.2 5.2 5.6 80 38 30 1 32 30 33 2 108.7 82.7 74.6 — 110.0 82.4 73.1 —
Limestone Coll 1 IIB PI 61.6 47.6 45.9 27.9 48.2 83.9 59.7 55.7 33.6 61.9 28.3 100.0 64.7 28.6 0.0 3.7 1.0 6.1 -0.8 18 9 13 7 12 8 15 9 61.2 52.9 46.9 29.6 62.2 41.7 44.9 26.6
Newberry Coll IIB PR 64.4 53.9 51.0 — 55.2 79.7 65.7 61.8 — 67.4 22.1 88.9 85.7 16.7 6.2 2.1 5.1 13 7 14 0 5 14 16 0 57.6 58.7 50.2 82.0 51.5 51.7
U South Carolina-Aiken 7 IIB PU 79.7 66.5 58.9 47.3 62.6 111.6 94.5 84.7 69.7 89.5 42.9 96.7 85.1 2.1 0.0 3.3 2.5 2.1 1.3 21 24 18 16 9 23 30 18 80.7 68.7 61.0 45.3 77.4 64.3 57.7 49.1
U South Carolina-Beaufort 7 IIB PU 84.3 71.9 61.6 54.3 65.7 117.5 101.5 88.1 78.8 93.5 42.2 76.9 70.8 0.0 0.0 0.5 -0.3 0.7 0.2 10 13 9 8 3 11 22 15 86.9 72.0 62.1 54.0 75.5 71.9 61.4 54.5
U South Carolina-Columbia 7 I PU 135.9 93.5 85.6 54.2 87.5 82.1 97.1 181.7 128.9 118.6 78.7 121.2 114.0 133.1 37.0 95.2 79.8 0.0 0.0 2.1 3.8 3.0 1.8 299 245 190 93 113 200 230 122 138.8 97.5 93.5 54.3 128.3 88.7 79.0 54.2
U South Carolina-Upstate 7 IIB PU 78.7 66.7 62.1 50.8 62.3 110.1 94.8 88.7 74.2 89.0 42.9 100.0 96.6 1.7 0.0 19 31 26 23 18 27 33 51 81.9 66.5 66.0 51.3 75.2 67.0 59.0 50.6
Winthrop U 1 IIA PU 82.1 68.9 62.9 45.7 67.8 113.3 95.8 87.1 65.0 94.0 38.8 95.1 74.7 4.4 0.0 0.2 1.6 2.0 2.1 44 37 36 10 38 38 56 27 82.8 68.6 67.0 47.1 81.2 69.2 60.3 45.1
Wofford Coll IIB PR 86.4 73.9 65.2 14.4 33.5 66.5 112.9 96.7 88.2 18.4 44.3 87.5 31.6 98.0 97.8 28.1 0.0 2.4 1.7 2.8 6.3 35 24 14 11 15 22 18 10 87.1 75.1 66.3 11.6 84.7 72.6 64.4 17.4
South DakotaAugustana U IIA PR 76.5 64.0 57.8 49.9 63.2 104.5 87.5 78.9 68.2 86.4 36.6 100.0 94.9 3.5 0.0 2.7 3.0 3.0 3.5 24 20 22 2 8 19 35 9 78.0 66.2 58.4 — 72.3 61.8 57.4 48.5
Dakota St U IIA PU 98.1 79.1 69.8 48.5 58.2 71.7 120.6 98.9 88.2 63.9 74.9 90.4 26.1 94.4 85.2 0.0 0.0 1.5 1.7 3.9 1.3 15 17 24 11 3 10 6 14 101.0 77.7 70.8 51.7 83.7 81.5 65.7 46.0
Dakota Wesleyan U 1 IIB PR 57.2 55.7 50.2 44.7 53.1 76.3 69.1 64.6 60.3 68.2 28.3 100.0 75.0 0.0 0.0 5.8 3.8 4.1 1.5 7 8 5 1 2 8 11 3 57.5 57.7 53.2 — — 53.8 48.9 44.8
© 2019 American Association of University Professors
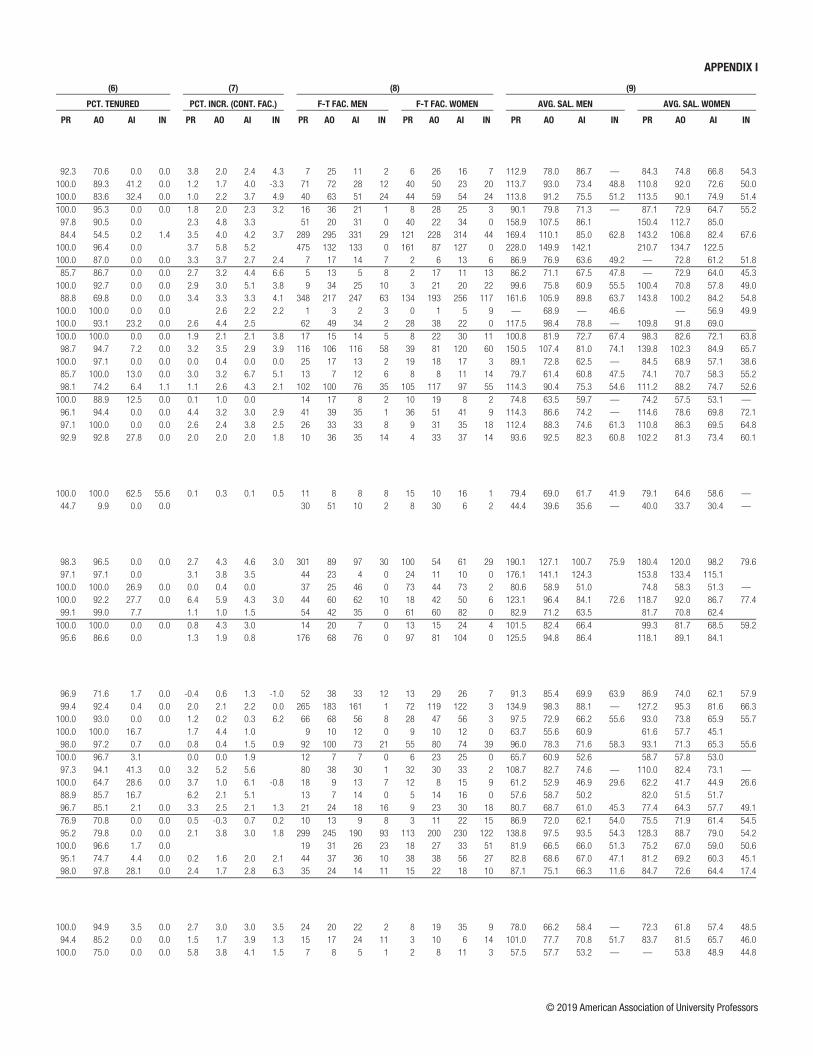
APPENDIX I APPENDIX I
NAME NOTES
(1) (2) (3) (4) (5) (6) (7) (8) (9)
CAT. CTRL
AVG. SALARY ($1000s) AVG. COMPENSATION ($1000s) BEN. as %
of SAL.
PCT. TENURED PCT. INCR. (CONT. FAC.) F-T FAC. MEN F-T FAC. WOMEN AVG. SAL. MEN AVG. SAL. WOMEN
PR AO AI IN LE NR AR PR AO AI IN LE NR AR PR AO AI IN PR AO AI IN PR AO AI IN PR AO AI IN PR AO AI IN PR AO AI IN
Pennsylvania (continued)Seton Hill U IIA PR 99.7 76.4 74.9 56.1 77.2 126.4 102.7 98.2 76.9 102.2 32.4 92.3 70.6 0.0 0.0 3.8 2.0 2.4 4.3 7 25 11 2 6 26 16 7 112.9 78.0 86.7 — 84.3 74.8 66.8 54.3
Shippensburg U Pennsylvania IIA PU 112.6 92.6 73.1 49.5 92.1 137.6 113.6 89.7 60.4 112.8 22.4 100.0 89.3 41.2 0.0 1.2 1.7 4.0 -3.3 71 72 28 12 40 50 23 20 113.7 93.0 73.4 48.8 110.8 92.0 72.6 50.0
Slippery Rock U Pennsylvania IIA PU 113.7 90.7 75.2 51.3 86.3 137.0 111.3 92.8 62.7 105.4 22.2 100.0 83.6 32.4 0.0 1.0 2.2 3.7 4.9 40 63 51 24 44 59 54 24 113.8 91.2 75.5 51.2 113.5 90.1 74.9 51.4
Susquehanna U IIB PR 89.1 76.8 67.7 55.3 75.3 110.0 99.1 86.8 72.3 96.1 27.6 100.0 95.3 0.0 0.0 1.8 2.0 2.3 3.2 16 36 21 1 8 28 25 3 90.1 79.8 71.3 — 87.1 72.9 64.7 55.2
Swarthmore Coll IIB PI 155.2 110.2 85.5 122.8 200.6 147.4 114.8 161.1 31.3 97.8 90.5 0.0 2.3 4.8 3.3 51 20 31 0 40 22 34 0 158.9 107.5 86.1 150.4 112.7 85.0
Temple U 7 I PU 161.7 108.6 83.7 65.7 110.2 203.1 140.6 109.3 87.3 141.5 28.5 84.4 54.5 0.2 1.4 3.5 4.0 4.2 3.7 289 295 331 29 121 228 314 44 169.4 110.1 85.0 62.8 143.2 106.8 82.4 67.6
U Pennsylvania 7 I PI 223.6 143.9 132.6 186.7 286.6 197.0 183.7 245.0 31.2 100.0 96.4 0.0 3.7 5.8 5.2 475 132 133 0 161 87 127 0 228.0 149.9 142.1 210.7 134.7 122.5
U Pittsburgh-Bradford 7 IIB PU 87.4 75.8 62.5 50.4 — 67.5 114.0 97.1 78.8 63.5 — 86.1 27.6 100.0 87.0 0.0 0.0 3.3 3.7 2.7 2.4 7 17 14 7 2 6 13 6 86.9 76.9 63.6 49.2 — 72.8 61.2 51.8
U Pittsburgh-Greensburg 7 IIB PU 84.7 72.1 65.1 46.2 64.4 109.3 90.5 85.4 59.1 82.3 27.7 85.7 86.7 0.0 0.0 2.7 3.2 4.4 6.6 5 13 5 8 2 17 11 13 86.2 71.1 67.5 47.8 — 72.9 64.0 45.3
U Pittsburgh-Johnstown 7 IIB PU 99.8 73.9 59.5 51.0 66.5 126.4 95.9 76.9 68.1 86.4 29.9 100.0 92.7 0.0 0.0 2.9 3.0 5.1 3.8 9 34 25 10 3 21 20 22 99.6 75.8 60.9 55.5 100.4 70.8 57.8 49.0
U Pittsburgh-Pittsburgh Campus 7 I PU 156.7 103.2 87.0 57.9 54.7 101.7 198.3 131.5 111.0 74.4 70.1 129.4 27.3 88.8 69.8 0.0 0.0 3.4 3.3 3.3 4.1 348 217 247 63 134 193 256 117 161.6 105.9 89.8 63.7 143.8 100.2 84.2 54.8
U Pittsburgh-Titusville 7 III PU — 69.3 63.1 49.1 57.5 — 88.3 83.4 63.6 74.6 29.7 100.0 100.0 0.0 0.0 2.6 2.2 2.2 1 3 2 3 0 1 5 9 — 68.9 — 46.6 — 56.9 49.9
U Scranton IIA PR 115.1 95.5 75.0 — — 67.9 93.8 165.3 134.3 104.8 — — 106.2 134.1 43.1 100.0 93.1 23.2 0.0 2.6 4.4 2.5 62 49 34 2 28 38 22 0 117.5 98.4 78.8 — 109.8 91.8 69.0
Ursinus Coll IIB PI 100.0 82.3 72.3 64.9 80.0 127.1 105.2 93.3 85.6 102.8 28.5 100.0 100.0 0.0 0.0 1.9 2.1 2.1 3.8 17 15 14 5 8 22 30 11 100.8 81.9 72.7 67.4 98.3 82.6 72.1 63.8
Villanova U 1 IIA PR 147.8 105.2 83.0 69.8 101.1 187.6 137.5 104.1 87.0 128.8 27.3 98.7 94.7 7.2 0.0 3.2 3.5 2.9 3.9 116 106 116 58 39 81 120 60 150.5 107.4 81.0 74.1 139.8 102.3 84.9 65.7
Washington & Jefferson Coll IIB PI 87.1 70.8 59.5 43.0 72.9 116.6 96.9 78.1 52.4 97.6 33.9 100.0 97.1 0.0 0.0 0.0 0.4 0.0 0.0 25 17 13 2 19 18 17 3 89.1 72.8 62.5 — 84.5 68.9 57.1 38.6
Waynesburg U 7 IIA PR 77.6 66.4 59.6 52.9 64.0 103.6 101.5 87.4 73.3 90.8 42.0 85.7 100.0 13.0 0.0 3.0 3.2 6.7 5.1 13 7 12 6 8 8 11 14 79.7 61.4 60.8 47.5 74.1 70.7 58.3 55.2
West Chester U Pennsylvania IIA PU 112.7 89.2 75.0 53.4 88.0 135.8 109.0 91.2 66.3 107.0 21.6 98.1 74.2 6.4 1.1 1.1 2.6 4.3 2.1 102 100 76 35 105 117 97 55 114.3 90.4 75.3 54.6 111.2 88.2 74.7 52.6
Westminster Coll IIA PR 74.5 60.3 56.4 49.8 49.9 61.9 94.4 82.7 75.4 57.6 65.0 81.6 31.8 100.0 88.9 12.5 0.0 0.1 1.0 0.0 14 17 8 2 10 19 8 2 74.8 63.5 59.7 — 74.2 57.5 53.1 —
Widener U I PI 114.4 82.1 71.8 72.7 63.0 86.8 151.1 110.5 94.9 101.6 92.3 116.1 33.8 96.1 94.4 0.0 0.0 4.4 3.2 3.0 2.9 41 39 35 1 36 51 41 9 114.3 86.6 74.2 — 114.6 78.6 69.8 72.1
Wilkes U 7 IIA PI 112.0 87.3 72.0 63.7 83.2 138.4 111.3 90.9 77.9 104.5 25.6 97.1 100.0 0.0 0.0 2.6 2.4 3.8 2.5 26 33 33 8 9 31 35 18 112.4 88.3 74.6 61.3 110.8 86.3 69.5 64.8
York Coll Pennsylvania 1 IIB PI 96.1 87.1 77.8 60.5 80.0 140.9 127.2 114.7 86.8 117.2 46.4 92.9 92.8 27.8 0.0 2.0 2.0 2.0 1.8 10 36 35 14 4 33 37 14 93.6 92.5 82.3 60.8 102.2 81.3 73.4 60.1
Puerto RicoU Puerto Rico-Ponce IIB PU 79.2 66.6 59.7 42.1 65.8 101.7 86.5 75.2 51.1 84.0 27.6 100.0 100.0 62.5 55.6 0.1 0.3 0.1 0.5 11 8 8 8 15 10 16 1 79.4 69.0 61.7 41.9 79.1 64.6 58.6 —
Universidad Politecnica de Puerto Rico 7,19 IIA PI 43.5 37.4 33.6 24.5 38.3 46.5 39.8 35.6 26.5 40.8 6.5 44.7 9.9 0.0 0.0 30 51 10 2 8 30 6 2 44.4 39.6 35.6 — 40.0 33.7 30.4 —
Rhode IslandBrown U 1 I PI 187.7 124.4 99.7 77.7 89.7 83.1 142.1 230.4 152.3 121.7 94.7 110.2 101.0 174.2 22.6 98.3 96.5 0.0 0.0 2.7 4.3 4.6 3.0 301 89 97 30 100 54 61 29 190.1 127.1 100.7 75.9 180.4 120.0 98.2 79.6
Bryant U IIA PI 168.3 138.6 117.8 76.5 129.0 217.8 181.9 138.4 103.7 167.8 30.1 97.1 97.1 0.0 3.1 3.8 3.5 44 23 4 0 24 11 10 0 176.1 141.1 124.3 153.8 133.4 115.1
CC Rhode Island 5 III PU 76.8 58.5 51.2 — 62.2 108.6 84.2 74.7 — 89.3 43.6 100.0 100.0 26.9 0.0 0.0 0.4 0.0 37 25 46 0 73 44 73 2 80.6 58.9 51.0 74.8 58.3 51.3 —
Providence Coll IIA PR 121.8 94.6 85.3 74.4 95.7 161.2 126.4 110.1 93.4 125.7 31.4 100.0 92.2 27.7 0.0 6.4 5.9 4.3 3.0 44 60 62 10 18 42 50 6 123.1 96.4 84.1 72.6 118.7 92.0 86.7 77.4
Rhode Island Coll IIA PU 82.2 71.0 62.7 72.0 119.4 104.0 90.9 104.7 45.5 99.1 99.0 7.7 1.1 1.0 1.5 54 42 35 0 61 60 82 0 82.9 71.2 63.5 81.7 70.8 62.4
Salve Regina U IIA PR 100.4 82.1 68.0 59.2 63.0 78.2 130.7 108.8 90.8 74.5 87.4 103.8 32.8 100.0 100.0 0.0 0.0 0.8 4.3 3.0 14 20 7 0 13 15 24 4 101.5 82.4 66.4 99.3 81.7 68.5 59.2
U Rhode Island 7 I PU 122.8 91.7 85.1 56.9 94.7 167.3 126.9 115.7 81.0 130.1 37.3 95.6 86.6 0.0 1.3 1.9 0.8 176 68 76 0 97 81 104 0 125.5 94.8 86.4 118.1 89.1 84.1
South CarolinaCitadel Military Coll South Carolina IIA PU 90.4 80.5 66.5 61.7 77.9 125.6 112.7 94.6 88.3 109.4 40.4 96.9 71.6 1.7 0.0 -0.4 0.6 1.3 -1.0 52 38 33 12 13 29 26 7 91.3 85.4 69.9 63.9 86.9 74.0 62.1 57.9
Clemson U 7 I PU 133.2 97.1 85.3 65.7 53.4 83.2 92.2 172.1 127.8 113.2 89.4 74.2 110.9 121.7 32.0 99.4 92.4 0.4 0.0 2.0 2.1 2.2 0.0 265 183 161 1 72 119 122 3 134.9 98.3 88.1 — 127.2 95.3 81.6 66.3
Coastal Carolina U IIA PU 96.1 73.3 66.0 55.6 48.3 67.9 132.1 102.6 93.3 79.8 70.4 95.6 40.9 100.0 93.0 0.0 0.0 1.2 0.2 0.3 6.2 66 68 56 8 28 47 56 3 97.5 72.9 66.2 55.6 93.0 73.8 65.9 55.7
Coker Coll IIA PI 62.6 56.7 53.0 — 30.6 54.6 71.7 64.7 60.7 — 37.4 62.6 14.6 100.0 100.0 16.7 1.7 4.4 1.0 9 10 12 0 9 10 12 0 63.7 55.6 60.9 61.6 57.7 45.1
Coll Charleston IIA PU 94.9 75.2 68.4 56.6 76.7 132.9 107.9 99.3 84.2 109.7 43.1 98.0 97.2 0.7 0.0 0.8 0.4 1.5 0.9 92 100 73 21 55 80 74 39 96.0 78.3 71.6 58.3 93.1 71.3 65.3 55.6
Converse Coll 1 IIA PI 63.3 58.5 52.9 57.4 78.9 72.9 65.9 71.5 24.6 100.0 96.7 3.1 0.0 0.0 1.9 12 7 7 0 6 23 25 0 65.7 60.9 52.6 58.7 57.8 53.0
Furman U IIA PI 109.1 82.5 73.8 58.7 92.1 151.7 110.9 92.5 73.7 124.4 35.0 97.3 94.1 41.3 0.0 3.2 5.2 5.6 80 38 30 1 32 30 33 2 108.7 82.7 74.6 — 110.0 82.4 73.1 —
Limestone Coll 1 IIB PI 61.6 47.6 45.9 27.9 48.2 83.9 59.7 55.7 33.6 61.9 28.3 100.0 64.7 28.6 0.0 3.7 1.0 6.1 -0.8 18 9 13 7 12 8 15 9 61.2 52.9 46.9 29.6 62.2 41.7 44.9 26.6
Newberry Coll IIB PR 64.4 53.9 51.0 — 55.2 79.7 65.7 61.8 — 67.4 22.1 88.9 85.7 16.7 6.2 2.1 5.1 13 7 14 0 5 14 16 0 57.6 58.7 50.2 82.0 51.5 51.7
U South Carolina-Aiken 7 IIB PU 79.7 66.5 58.9 47.3 62.6 111.6 94.5 84.7 69.7 89.5 42.9 96.7 85.1 2.1 0.0 3.3 2.5 2.1 1.3 21 24 18 16 9 23 30 18 80.7 68.7 61.0 45.3 77.4 64.3 57.7 49.1
U South Carolina-Beaufort 7 IIB PU 84.3 71.9 61.6 54.3 65.7 117.5 101.5 88.1 78.8 93.5 42.2 76.9 70.8 0.0 0.0 0.5 -0.3 0.7 0.2 10 13 9 8 3 11 22 15 86.9 72.0 62.1 54.0 75.5 71.9 61.4 54.5
U South Carolina-Columbia 7 I PU 135.9 93.5 85.6 54.2 87.5 82.1 97.1 181.7 128.9 118.6 78.7 121.2 114.0 133.1 37.0 95.2 79.8 0.0 0.0 2.1 3.8 3.0 1.8 299 245 190 93 113 200 230 122 138.8 97.5 93.5 54.3 128.3 88.7 79.0 54.2
U South Carolina-Upstate 7 IIB PU 78.7 66.7 62.1 50.8 62.3 110.1 94.8 88.7 74.2 89.0 42.9 100.0 96.6 1.7 0.0 19 31 26 23 18 27 33 51 81.9 66.5 66.0 51.3 75.2 67.0 59.0 50.6
Winthrop U 1 IIA PU 82.1 68.9 62.9 45.7 67.8 113.3 95.8 87.1 65.0 94.0 38.8 95.1 74.7 4.4 0.0 0.2 1.6 2.0 2.1 44 37 36 10 38 38 56 27 82.8 68.6 67.0 47.1 81.2 69.2 60.3 45.1
Wofford Coll IIB PR 86.4 73.9 65.2 14.4 33.5 66.5 112.9 96.7 88.2 18.4 44.3 87.5 31.6 98.0 97.8 28.1 0.0 2.4 1.7 2.8 6.3 35 24 14 11 15 22 18 10 87.1 75.1 66.3 11.6 84.7 72.6 64.4 17.4
South DakotaAugustana U IIA PR 76.5 64.0 57.8 49.9 63.2 104.5 87.5 78.9 68.2 86.4 36.6 100.0 94.9 3.5 0.0 2.7 3.0 3.0 3.5 24 20 22 2 8 19 35 9 78.0 66.2 58.4 — 72.3 61.8 57.4 48.5
Dakota St U IIA PU 98.1 79.1 69.8 48.5 58.2 71.7 120.6 98.9 88.2 63.9 74.9 90.4 26.1 94.4 85.2 0.0 0.0 1.5 1.7 3.9 1.3 15 17 24 11 3 10 6 14 101.0 77.7 70.8 51.7 83.7 81.5 65.7 46.0
Dakota Wesleyan U 1 IIB PR 57.2 55.7 50.2 44.7 53.1 76.3 69.1 64.6 60.3 68.2 28.3 100.0 75.0 0.0 0.0 5.8 3.8 4.1 1.5 7 8 5 1 2 8 11 3 57.5 57.7 53.2 — — 53.8 48.9 44.8
© 2019 American Association of University Professors
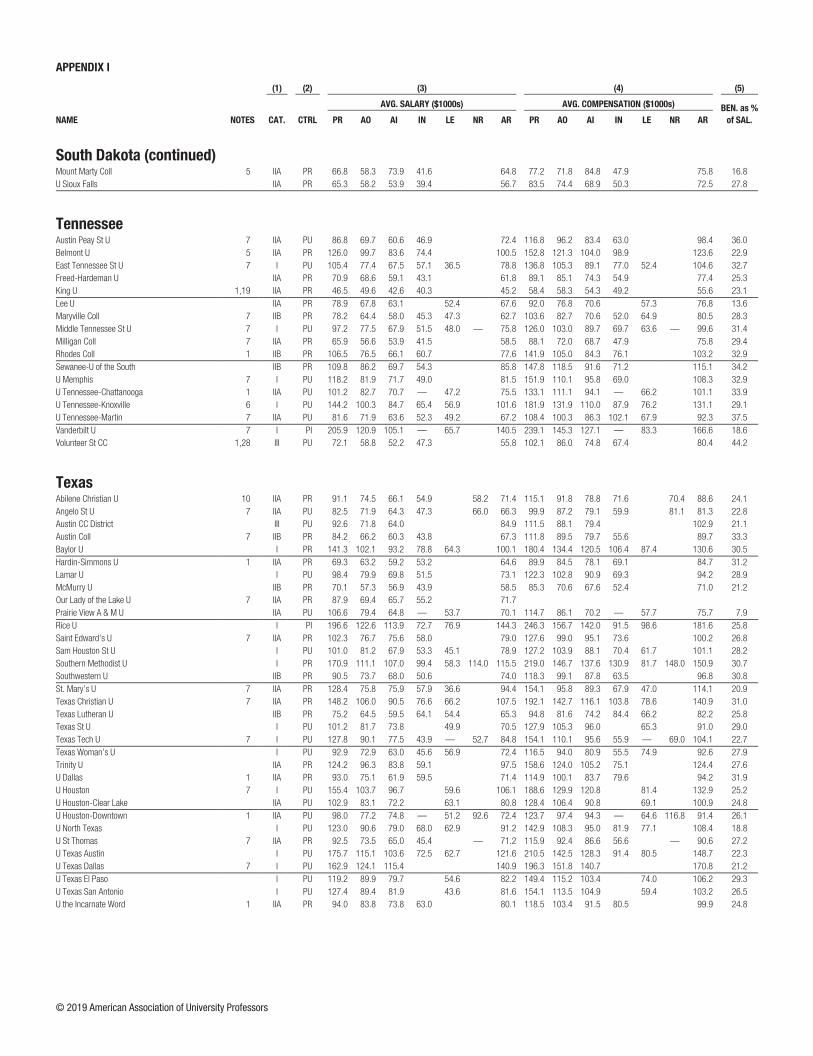
APPENDIX I APPENDIX I
NAME NOTES
(1) (2) (3) (4) (5) (6) (7) (8) (9)
CAT. CTRL
AVG. SALARY ($1000s) AVG. COMPENSATION ($1000s) BEN. as %
of SAL.
PCT. TENURED PCT. INCR. (CONT. FAC.) F-T FAC. MEN F-T FAC. WOMEN AVG. SAL. MEN AVG. SAL. WOMEN
PR AO AI IN LE NR AR PR AO AI IN LE NR AR PR AO AI IN PR AO AI IN PR AO AI IN PR AO AI IN PR AO AI IN PR AO AI IN
South Dakota (continued)Mount Marty Coll 5 IIA PR 66.8 58.3 73.9 41.6 64.8 77.2 71.8 84.8 47.9 75.8 16.8 100.0 81.8 15.8 0.0 0.0 0.0 0.0 1.6 6 7 3 3 2 4 16 2 70.3 51.1 71.2 39.3 — 71.0 74.4 —
U Sioux Falls IIA PR 65.3 58.2 53.9 39.4 56.7 83.5 74.4 68.9 50.3 72.5 27.8 100.0 91.3 0.0 0.0 12.0 -3.8 9.8 0.0 6 13 12 3 4 10 12 0 66.0 58.5 54.2 39.4 64.3 57.8 53.7
TennesseeAustin Peay St U 7 IIA PU 86.8 69.7 60.6 46.9 72.4 116.8 96.2 83.4 63.0 98.4 36.0 96.0 70.9 8.3 28.6 4.4 6.3 7.7 7.3 89 44 39 16 60 59 45 19 88.3 71.5 60.0 45.1 84.6 68.3 61.2 48.3
Belmont U 5 IIA PR 126.0 99.7 83.6 74.4 100.5 152.8 121.3 104.0 98.9 123.6 22.9 94.4 93.7 2.8 0.0 4.7 5.2 5.4 4.8 70 51 45 16 37 60 63 15 132.3 101.1 89.9 80.9 114.0 98.4 79.1 67.5
East Tennessee St U 7 I PU 105.4 77.4 67.5 57.1 36.5 78.8 136.8 105.3 89.1 77.0 52.4 104.6 32.7 88.9 76.5 7.3 2.9 177 141 103 6 76 102 159 28 110.6 80.9 66.6 72.1 93.2 72.6 68.0 53.9
Freed-Hardeman U IIA PR 70.9 68.6 59.1 43.1 61.8 89.1 85.1 74.3 54.9 77.4 25.3 95.0 77.8 23.5 0.0 0.6 2.6 2.5 2.9 16 19 21 7 4 8 13 8 73.2 68.1 56.8 40.7 61.6 69.9 62.9 45.1
King U 1,19 IIA PR 46.5 49.6 42.6 40.3 45.2 58.4 58.3 54.3 49.2 55.6 23.1 0.0 0.0 0.0 0.0 0.1 0.1 1.0 2.7 6 14 13 2 4 15 26 6 46.8 49.8 42.8 — 46.0 49.3 42.5 43.0
Lee U IIA PR 78.9 67.8 63.1 52.4 67.6 92.0 76.8 70.6 57.3 76.8 13.6 96.4 83.1 11.1 2.5 3.5 4.4 43 40 25 0 13 19 20 0 79.7 68.0 62.3 76.2 67.3 64.1
Maryville Coll 7 IIB PR 78.2 64.4 58.0 45.3 47.3 62.7 103.6 82.7 70.6 52.0 64.9 80.5 28.3 100.0 96.0 12.5 0.0 3.0 3.4 3.0 1.8 10 10 10 4 8 15 6 2 79.6 61.8 58.0 44.9 76.4 66.1 57.8 —
Middle Tennessee St U 7 I PU 97.2 77.5 67.9 51.5 48.0 — 75.8 126.0 103.0 89.7 69.7 63.6 — 99.6 31.4 99.1 91.6 0.5 0.0 5.7 5.3 5.7 4.4 193 111 94 14 122 102 95 35 99.9 78.9 70.0 52.0 92.8 75.9 65.8 51.3
Milligan Coll 7 IIA PR 65.9 56.6 53.9 41.5 58.5 88.1 72.0 68.7 47.9 75.8 29.4 90.9 94.1 0.0 0.0 0.8 0.6 5.0 3.7 21 16 10 2 12 18 14 2 65.9 56.4 55.1 — 66.0 56.9 53.1 —
Rhodes Coll 1 IIB PR 106.5 76.5 66.1 60.7 77.6 141.9 105.0 84.3 76.1 103.2 32.9 100.0 94.4 0.0 0.0 2.0 1.8 3.3 25 32 28 1 7 39 39 3 108.8 76.3 67.3 — 98.1 76.6 65.2 63.3
Sewanee-U of the South IIB PR 109.8 86.2 69.7 54.3 85.8 147.8 118.5 91.6 71.2 115.1 34.2 100.0 100.0 0.0 0.0 1.0 1.1 1.3 2.4 36 24 20 11 27 15 21 17 113.4 86.5 74.1 54.9 105.1 85.8 65.6 54.0
U Memphis 7 I PU 118.2 81.9 71.7 49.0 81.5 151.9 110.1 95.8 69.0 108.3 32.9 96.8 87.9 1.5 0.0 2.0 3.2 3.6 3.3 161 138 112 78 58 110 161 90 124.3 84.6 76.7 50.9 101.1 78.4 68.2 47.4
U Tennessee-Chattanooga 1 IIA PU 101.2 82.7 70.7 — 47.2 75.5 133.1 111.1 94.1 — 66.2 101.1 33.9 98.3 91.8 3.2 0.0 2.5 7.0 3.1 72 52 55 1 43 46 71 1 103.3 82.4 74.0 — 97.5 83.0 68.2 —
U Tennessee-Knoxville 6 I PU 144.2 100.3 84.7 65.4 56.9 101.6 181.9 131.9 110.0 87.9 76.2 131.1 29.1 95.7 87.4 0.0 0.0 2.3 3.4 4.0 2.6 360 216 164 6 154 166 179 29 149.1 105.2 88.1 81.8 132.8 94.0 81.6 62.0
U Tennessee-Martin 7 IIA PU 81.6 71.9 63.6 52.3 49.2 67.2 108.4 100.3 86.3 102.1 67.9 92.3 37.5 100.0 77.8 11.8 75.0 2.9 3.4 4.9 2.4 61 41 24 7 25 31 27 1 82.1 72.1 62.4 52.5 80.2 71.6 64.6 —
Vanderbilt U 7 I PI 205.9 120.9 105.1 — 65.7 140.5 239.1 145.3 127.1 — 83.3 166.6 18.6 92.8 76.9 0.0 0.0 2.5 2.6 4.0 280 141 107 0 95 88 104 2 205.6 121.4 108.3 206.9 120.0 101.8 —
Volunteer St CC 1,28 III PU 72.1 58.8 52.2 47.3 55.8 102.1 86.0 74.8 67.4 80.4 44.2 100.0 85.1 2.6 0.0 7.9 2.6 9.0 8.7 13 35 12 28 7 39 27 20 72.2 59.3 52.5 47.8 72.1 58.3 52.0 46.5
TexasAbilene Christian U 10 IIA PR 91.1 74.5 66.1 54.9 58.2 71.4 115.1 91.8 78.8 71.6 70.4 88.6 24.1 98.3 85.4 3.4 0.0 2.8 4.6 4.2 5.2 48 57 30 14 9 25 29 33 92.5 77.3 65.2 57.4 83.3 67.9 67.1 53.8
Angelo St U 7 IIA PU 82.5 71.9 64.3 47.3 66.0 66.3 99.9 87.2 79.1 59.9 81.1 81.3 22.8 100.0 100.0 2.9 0.0 1.2 1.7 1.9 1.8 54 31 40 30 26 24 28 47 81.9 74.8 66.1 48.4 83.5 68.2 61.6 46.5
Austin CC District III PU 92.6 71.8 64.0 84.9 111.5 88.1 79.4 102.9 21.1 0.0 0.0 0.0 3.7 4.4 4.1 169 55 15 0 192 110 14 0 93.8 72.5 64.0 91.6 71.4 64.0
Austin Coll 7 IIB PR 84.2 66.2 60.3 43.8 67.3 111.8 89.5 79.7 55.6 89.7 33.3 100.0 100.0 0.0 22.2 1.9 0.2 6.5 18.4 19 28 12 2 6 13 12 7 86.4 66.8 59.9 — 77.3 64.9 60.7 42.4
Baylor U I PR 141.3 102.1 93.2 78.8 64.3 100.1 180.4 134.4 120.5 106.4 87.4 130.6 30.5 95.2 84.9 0.0 0.0 3.0 3.4 4.1 3.0 228 171 98 0 61 114 111 9 144.3 104.4 98.2 130.4 98.7 88.8 78.8
Hardin-Simmons U 1 IIA PR 69.3 63.2 59.2 53.2 64.6 89.9 84.5 78.1 69.1 84.7 31.2 98.2 87.1 9.7 0.0 2.9 3.9 3.3 4.4 39 18 15 3 17 13 16 2 69.7 62.6 58.0 57.2 68.5 64.0 60.4 —
Lamar U I PU 98.4 79.9 69.8 51.5 73.1 122.3 102.8 90.9 69.3 94.2 28.9 98.9 91.3 7.7 0.0 1.4 2.7 2.3 3.2 61 70 52 57 31 45 52 72 100.2 83.0 73.9 52.1 94.9 75.3 65.8 51.1
McMurry U IIB PR 70.1 57.3 56.9 43.9 58.5 85.3 70.6 67.6 52.4 71.0 21.2 100.0 89.5 0.0 0.0 4.4 1.2 0.3 2.9 21 12 8 6 8 7 3 14 70.4 58.2 54.3 46.1 69.1 55.8 63.7 42.9
Our Lady of the Lake U 7 IIA PR 87.9 69.4 65.7 55.2 71.7 92.0 60.0 0.0 0.0 2.0 2.0 2.4 8 9 13 4 17 16 31 1 88.1 67.6 68.0 54.9 87.8 70.4 64.8 —
Prairie View A & M U IIA PU 106.6 79.4 64.8 — 53.7 70.1 114.7 86.1 70.2 — 57.7 75.7 7.9 100.0 98.4 1.3 0.0 53 45 39 1 16 19 39 0 109.6 80.2 64.9 — 96.7 77.6 64.6
Rice U I PI 196.6 122.6 113.9 72.7 76.9 144.3 246.3 156.7 142.0 91.5 98.6 181.6 25.8 100.0 100.0 0.0 0.0 2.8 4.4 4.0 2.0 241 69 70 14 68 40 43 9 199.1 127.7 113.4 73.4 187.7 113.9 114.6 71.6
Saint Edward’s U 7 IIA PR 102.3 76.7 75.6 58.0 79.0 127.6 99.0 95.1 73.6 100.2 26.8 97.4 68.7 0.0 0.0 3.0 3.4 4.4 2.4 17 29 25 15 22 38 22 13 105.9 77.8 81.1 59.0 99.5 75.8 69.3 56.9
Sam Houston St U I PU 101.0 81.2 67.9 53.3 45.1 78.9 127.2 103.9 88.1 70.4 61.7 101.1 28.2 99.4 92.0 1.6 6.7 3.6 4.3 4.4 6.9 115 116 90 9 60 71 99 6 104.6 82.4 69.1 50.2 94.2 79.2 66.8 57.9
Southern Methodist U I PR 170.9 111.1 107.0 99.4 58.3 114.0 115.5 219.0 146.7 137.6 130.9 81.7 148.0 150.9 30.7 100.0 98.2 0.9 0.0 2.8 2.9 3.5 5.1 169 104 53 64 47 59 54 57 176.3 113.1 115.5 107.6 151.7 107.6 98.7 90.1
Southwestern U IIB PR 90.5 73.7 68.0 50.6 74.0 118.3 99.1 87.8 63.5 96.8 30.8 100.0 100.0 0.0 0.0 2.8 3.7 3.5 6.0 16 20 5 10 25 11 8 15 97.9 73.6 65.1 55.7 85.7 73.9 69.8 47.2
St. Mary’s U 7 IIA PR 128.4 75.8 75.9 57.9 36.6 94.4 154.1 95.8 89.3 67.9 47.0 114.1 20.9 90.1 95.0 4.9 0.0 2.0 2.3 4.3 3.2 59 38 23 15 32 22 18 12 135.5 74.8 76.6 58.2 115.3 77.5 75.1 57.6
Texas Christian U 7 IIA PR 148.2 106.0 90.5 76.6 66.2 107.5 192.1 142.7 116.1 103.8 78.6 140.9 31.0 87.1 80.3 1.2 0.0 2.5 4.7 5.7 5.7 129 118 67 35 57 95 105 56 149.7 110.6 99.7 76.2 144.7 100.4 84.5 76.9
Texas Lutheran U IIB PR 75.2 64.5 59.5 64.1 54.4 65.3 94.8 81.6 74.2 84.4 66.2 82.2 25.8 100.0 87.5 3.7 0.0 2.4 1.5 1.1 5.8 13 10 12 0 12 14 15 4 78.3 62.8 57.3 71.8 65.7 61.3 64.1
Texas St U I PU 101.2 81.7 73.8 49.9 70.5 127.9 105.3 96.0 65.3 91.0 29.0 94.7 93.6 1.8 1.0 2.1 2.0 143 147 113 0 84 135 163 0 103.2 83.4 78.3 97.8 79.7 70.7
Texas Tech U 7 I PU 127.8 90.1 77.5 43.9 — 52.7 84.8 154.1 110.1 95.6 55.9 — 69.0 104.1 22.7 95.3 89.5 1.0 0.0 3.2 4.8 4.3 5.6 304 240 232 114 99 122 189 193 131.6 93.6 81.2 48.1 116.1 83.4 73.1 41.4
Texas Woman’s U I PU 92.9 72.9 63.0 45.6 56.9 72.4 116.5 94.0 80.9 55.5 74.9 92.6 27.9 91.1 61.2 1.8 0.0 1.7 3.3 5.0 25 30 48 0 65 117 118 3 93.2 77.2 63.9 92.8 71.8 62.6 45.6
Trinity U IIA PR 124.2 96.3 83.8 59.1 97.5 158.6 124.0 105.2 75.1 124.4 27.6 100.0 97.7 0.0 0.0 1.8 2.0 3.1 1.0 49 50 22 22 31 35 26 14 128.3 97.6 81.4 64.8 117.8 94.5 85.9 50.1
U Dallas 1 IIA PR 93.0 75.1 61.9 59.5 71.4 114.9 100.1 83.7 79.6 94.2 31.9 100.0 100.0 0.0 0.0 -1.5 4.4 4.3 2.7 16 41 15 15 4 19 12 18 92.4 73.7 62.4 63.5 95.6 78.2 61.3 56.1
U Houston 7 I PU 155.4 103.7 96.7 59.6 106.1 188.6 129.9 120.8 81.4 132.9 25.2 99.3 97.5 0.0 4.7 5.7 5.5 343 203 140 0 89 152 96 0 160.0 106.3 102.0 137.9 100.2 89.0
U Houston-Clear Lake IIA PU 102.9 83.1 72.2 63.1 80.8 128.4 106.4 90.8 69.1 100.9 24.8 100.0 100.0 0.0 1.0 0.3 0.9 32 56 46 0 21 38 46 0 106.1 85.6 73.4 98.0 79.5 71.0
U Houston-Downtown 1 IIA PU 98.0 77.2 74.8 — 51.2 92.6 72.4 123.7 97.4 94.3 — 64.6 116.8 91.4 26.1 100.0 96.5 0.0 0.0 0.4 0.7 0.7 35 62 37 1 20 51 38 0 103.3 77.9 77.2 — 88.9 76.4 72.4
U North Texas I PU 123.0 90.6 79.0 68.0 62.9 91.2 142.9 108.3 95.0 81.9 77.1 108.4 18.8 100.0 97.2 0.6 0.0 4.6 3.7 3.0 2.7 236 162 80 8 93 120 80 11 126.9 93.6 81.8 69.0 113.1 86.5 76.2 67.3
U St Thomas 7 IIA PR 92.5 73.5 65.0 45.4 — 71.2 115.9 92.4 86.6 56.6 — 90.6 27.2 81.6 93.9 9.8 0.0 -0.9 0.6 2.0 0.0 21 31 20 11 17 18 21 14 93.6 74.7 65.5 50.7 91.2 71.4 64.6 41.2
U Texas Austin I PU 175.7 115.1 103.6 72.5 62.7 121.6 210.5 142.5 128.3 91.4 80.5 148.7 22.3 99.9 99.0 0.0 0.0 5.1 7.8 6.3 1.0 692 285 181 8 244 214 149 2 179.9 120.0 111.1 73.1 163.8 108.6 94.6 —
U Texas Dallas 7 I PU 162.9 124.1 115.4 140.9 196.3 151.8 140.7 170.8 21.2 100.0 96.7 0.0 0.1 0.3 0.2 222 106 94 0 43 45 35 0 167.2 123.1 117.2 140.9 126.4 110.5
U Texas El Paso I PU 119.2 89.9 79.7 54.6 82.2 149.4 115.2 103.4 74.0 106.2 29.3 100.0 94.0 0.0 3.3 3.1 4.2 131 132 77 0 38 68 69 0 121.5 92.0 82.0 111.2 85.8 77.2
U Texas San Antonio I PU 127.4 89.4 81.9 43.6 81.6 154.1 113.5 104.9 59.4 103.2 26.5 100.0 85.8 100.0 1.9 1.6 1.8 188 127 98 0 59 77 66 0 132.7 91.5 81.3 110.7 86.0 82.8
U the Incarnate Word 1 IIA PR 94.0 83.8 73.8 63.0 80.1 118.5 103.4 91.5 80.5 99.9 24.8 86.7 84.3 1.7 0.0 0.9 2.6 4.0 6.0 38 44 54 11 37 45 64 26 94.2 83.1 75.2 61.7 93.8 84.4 72.6 63.5
© 2019 American Association of University Professors
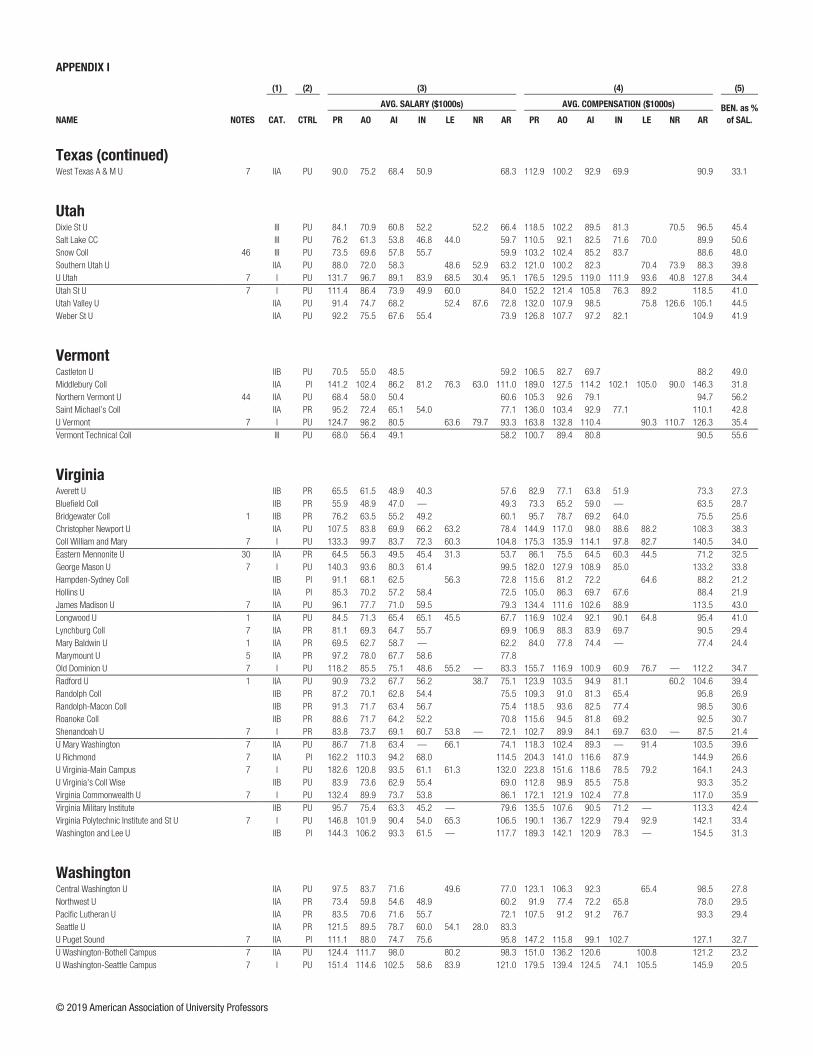
APPENDIX I APPENDIX I
NAME NOTES
(1) (2) (3) (4) (5) (6) (7) (8) (9)
CAT. CTRL
AVG. SALARY ($1000s) AVG. COMPENSATION ($1000s) BEN. as %
of SAL.
PCT. TENURED PCT. INCR. (CONT. FAC.) F-T FAC. MEN F-T FAC. WOMEN AVG. SAL. MEN AVG. SAL. WOMEN
PR AO AI IN LE NR AR PR AO AI IN LE NR AR PR AO AI IN PR AO AI IN PR AO AI IN PR AO AI IN PR AO AI IN PR AO AI IN
Texas (continued)West Texas A & M U 7 IIA PU 90.0 75.2 68.4 50.9 68.3 112.9 100.2 92.9 69.9 90.9 33.1 100.0 93.9 2.9 0.0 0.1 0.7 0.7 0.6 38 38 55 41 21 27 48 59 91.6 74.7 69.2 51.3 86.9 76.0 67.4 50.7
UtahDixie St U III PU 84.1 70.9 60.8 52.2 52.2 66.4 118.5 102.2 89.5 81.3 70.5 96.5 45.4 100.0 80.4 8.7 5.3 3.7 4.4 6.0 5.4 24 25 49 9 12 21 43 10 86.7 73.7 62.4 56.0 79.0 67.6 58.9 48.8
Salt Lake CC III PU 76.2 61.3 53.8 46.8 44.0 59.7 110.5 92.1 82.5 71.6 70.0 89.9 50.6 98.3 99.2 10.1 0.0 2.5 2.6 3.1 1.8 37 67 80 6 20 53 69 8 75.4 60.6 53.9 46.7 77.6 62.2 53.8 46.8
Snow Coll 46 III PU 73.5 69.6 57.8 55.7 59.9 103.2 102.4 85.2 83.7 88.6 48.0 87.5 89.3 17.0 1.5 10.8 12.4 29.4 57.2 7 17 36 42 1 11 17 24 73.9 69.4 58.2 56.3 — 70.0 57.0 54.6
Southern Utah U IIA PU 88.0 72.0 58.3 48.6 52.9 63.2 121.0 100.2 82.3 70.4 73.9 88.3 39.8 100.0 91.4 0.0 4.1 4.9 3.9 76.0 46 48 42 0 6 22 42 0 89.7 73.5 59.4 75.3 68.8 57.1
U Utah 7 I PU 131.7 96.7 89.1 83.9 68.5 30.4 95.1 176.5 129.5 119.0 111.9 93.6 40.8 127.8 34.4 98.9 89.5 0.4 0.0 2.2 4.1 3.8 336 167 164 3 123 129 121 0 134.3 102.2 95.0 83.9 124.6 89.5 81.3
Utah St U 7 I PU 111.4 86.4 73.9 49.9 60.0 84.0 152.2 121.4 105.8 76.3 89.2 118.5 41.0 96.8 90.5 0.3 3.3 3.0 3.9 4.6 4.2 187 179 172 13 65 84 160 17 114.5 90.2 79.1 51.3 102.6 78.5 68.3 48.8
Utah Valley U IIA PU 91.4 74.7 68.2 52.4 87.6 72.8 132.0 107.9 98.5 75.8 126.6 105.1 44.5 98.4 95.3 0.6 4.2 2.3 2.2 86 192 102 0 39 84 70 0 92.4 75.9 69.3 89.1 72.0 66.6
Weber St U IIA PU 92.2 75.5 67.6 55.4 73.9 126.8 107.7 97.2 82.1 104.9 41.9 100.0 98.1 0.0 0.0 2.2 10.0 4.5 19.7 106 61 84 47 61 45 84 70 94.9 79.8 69.2 60.6 87.5 69.8 66.0 52.0
VermontCastleton U IIB PU 70.5 55.0 48.5 59.2 106.5 82.7 69.7 88.2 49.0 100.0 91.3 0.0 17 13 8 0 14 10 16 0 69.8 54.7 47.6 71.3 55.4 48.9
Middlebury Coll IIA PI 141.2 102.4 86.2 81.2 76.3 63.0 111.0 189.0 127.5 114.2 102.1 105.0 90.0 146.3 31.8 99.2 95.6 0.0 0.0 4.4 4.9 5.6 4.3 85 32 37 3 42 36 46 5 144.3 101.8 86.1 80.5 135.1 102.9 86.2 81.6
Northern Vermont U 44 IIA PU 68.4 58.0 50.4 60.6 105.3 92.6 79.1 94.7 56.2 94.7 72.7 4.4 21 13 14 0 17 9 9 0 67.0 59.8 50.3 70.1 55.2 50.4
Saint Michael’s Coll IIA PR 95.2 72.4 65.1 54.0 77.1 136.0 103.4 92.9 77.1 110.1 42.8 100.0 100.0 0.0 0.0 0.6 11.3 3.6 1.3 35 27 3 10 17 21 5 17 98.0 73.2 68.4 53.5 89.6 71.5 63.0 54.3
U Vermont 7 I PU 124.7 98.2 80.5 63.6 79.7 93.3 163.8 132.8 110.4 90.3 110.7 126.3 35.4 100.0 100.0 0.0 114 83 43 0 52 93 41 0 126.4 101.7 85.4 120.9 95.1 75.5
Vermont Technical Coll III PU 68.0 56.4 49.1 58.2 100.7 89.4 80.8 90.5 55.6 90.6 57.1 3.1 23 4 13 0 9 10 19 0 69.0 58.2 50.5 65.5 55.7 48.1
VirginiaAverett U IIB PR 65.5 61.5 48.9 40.3 57.6 82.9 77.1 63.8 51.9 73.3 27.3 95.2 80.0 15.0 0.0 1.8 2.2 2.2 2.0 15 9 8 1 6 11 12 3 65.9 64.7 49.3 — 64.3 59.0 48.6 36.7
Bluefield Coll IIB PR 55.9 48.9 47.0 — 49.3 73.3 65.2 59.0 — 63.5 28.7 0.0 0.0 0.0 0.0 0.0 11.5 0.6 7 3 11 0 2 4 8 1 56.5 45.0 48.4 — 51.8 45.0 —
Bridgewater Coll 1 IIB PR 76.2 63.5 55.2 49.2 60.1 95.7 78.7 69.2 64.0 75.5 25.6 93.3 83.3 3.5 4.2 0.0 0.7 1.9 0.0 11 24 12 9 4 24 17 15 71.3 63.5 54.0 52.2 89.7 63.5 56.0 47.3
Christopher Newport U IIA PU 107.5 83.8 69.9 66.2 63.2 78.4 144.9 117.0 98.0 88.6 88.2 108.3 38.3 100.0 98.8 0.0 0.0 2.4 2.3 2.7 2.5 32 42 47 12 13 39 33 12 107.2 87.4 72.0 69.6 108.3 79.9 66.9 62.8
Coll William and Mary 7 I PU 133.3 99.7 83.7 72.3 60.3 104.8 175.3 135.9 114.1 97.8 82.7 140.5 34.0 97.2 88.1 1.6 0.0 0.1 0.1 1.0 1.2 167 112 76 2 87 82 47 11 138.6 100.9 87.5 — 123.2 98.1 77.4 70.2
Eastern Mennonite U 30 IIA PR 64.5 56.3 49.5 45.4 31.3 53.7 86.1 75.5 64.5 60.3 44.5 71.2 32.5 100.0 82.6 0.0 0.0 0.1 1.5 2.8 2.1 11 10 18 3 11 13 21 5 64.7 56.5 49.9 45.4 64.3 56.2 49.2 45.4
George Mason U 7 I PU 140.3 93.6 80.3 61.4 99.5 182.0 127.9 108.9 85.0 133.2 33.8 91.1 74.4 0.0 0.0 0.4 0.6 0.8 0.7 257 250 201 46 104 207 225 55 150.4 97.4 87.5 65.0 115.3 89.0 73.9 58.4
Hampden-Sydney Coll IIB PI 91.1 68.1 62.5 56.3 72.8 115.6 81.2 72.2 64.6 88.2 21.2 100.0 100.0 0.0 2.6 0.8 15.2 30 16 10 0 7 8 10 0 92.7 68.2 62.4 84.6 67.8 62.7
Hollins U IIA PI 85.3 70.2 57.2 58.4 72.5 105.0 86.3 69.7 67.6 88.4 21.9 100.0 91.7 0.0 0.0 2.2 2.2 2.0 4.8 10 13 2 4 16 11 5 8 91.6 73.4 — 54.2 81.3 66.4 56.5 60.6
James Madison U 7 IIA PU 96.1 77.7 71.0 59.5 79.3 134.4 111.6 102.6 88.9 113.5 43.0 98.3 91.8 0.4 0.0 0.2 0.6 1.2 0.1 206 153 106 60 142 139 155 100 97.8 80.8 73.1 59.8 93.6 74.4 69.5 59.4
Longwood U 1 IIA PU 84.5 71.3 65.4 65.1 45.5 67.7 116.9 102.4 92.1 90.1 64.8 95.4 41.0 100.0 98.6 0.0 0.0 1.1 0.7 1.4 3.4 31 35 39 4 22 35 49 5 86.1 72.1 64.5 68.2 82.3 70.6 66.2 62.6
Lynchburg Coll 7 IIA PR 81.1 69.3 64.7 55.7 69.9 106.9 88.3 83.9 69.7 90.5 29.4 93.9 85.3 2.9 0.0 2.3 2.7 2.6 2.0 31 27 30 5 18 34 40 5 83.3 74.3 63.4 51.6 77.3 65.3 65.6 59.8
Mary Baldwin U 1 IIA PR 69.5 62.7 58.7 — 62.2 84.0 77.8 74.4 — 77.4 24.4 95.2 66.7 0.0 0.0 1.3 2.7 2.9 8 11 8 0 13 22 35 1 69.5 72.0 59.4 69.5 58.0 58.5 —
Marymount U 5 IIA PR 97.2 78.0 67.7 58.6 77.8 95.7 87.2 0.0 0.0 2.8 3.8 4.3 8.4 12 17 12 5 35 30 38 17 105.2 78.7 69.4 60.1 94.5 77.6 67.2 58.1
Old Dominion U 7 I PU 118.2 85.5 75.1 48.6 55.2 — 83.3 155.7 116.9 100.9 60.9 76.7 — 112.2 34.7 98.2 94.4 0.0 0.0 0.6 1.6 1.6 167 130 90 2 54 85 89 5 122.3 86.7 79.3 — 105.6 83.7 70.9 43.0
Radford U 1 IIA PU 90.9 73.2 67.7 56.2 38.7 75.1 123.9 103.5 94.9 81.1 60.2 104.6 39.4 99.4 88.8 0.9 0.0 0.1 1.8 1.2 0.4 86 62 42 24 72 54 74 45 95.3 74.4 69.5 52.3 85.6 71.9 66.8 58.3
Randolph Coll IIB PR 87.2 70.1 62.8 54.4 75.5 109.3 91.0 81.3 65.4 95.8 26.9 100.0 93.8 0.0 0.0 4.2 4.4 4.1 15 7 4 0 17 9 12 4 89.2 69.6 62.0 85.4 70.4 63.0 54.4
Randolph-Macon Coll IIB PR 91.3 71.7 63.4 56.7 75.4 118.5 93.6 82.5 77.4 98.5 30.6 100.0 93.3 0.0 0.0 4.0 4.1 4.9 2.6 25 12 10 4 15 18 15 8 94.3 73.9 64.4 53.3 86.4 70.2 62.7 58.4
Roanoke Coll IIB PR 88.6 71.7 64.2 52.2 70.8 115.6 94.5 81.8 69.2 92.5 30.7 100.0 98.3 0.0 0.0 0.0 0.5 1.1 0.6 28 27 13 11 16 31 19 23 90.5 70.9 66.1 56.5 85.4 72.4 62.8 50.2
Shenandoah U 7 I PR 83.8 73.7 69.1 60.7 53.8 — 72.1 102.7 89.9 84.1 69.7 63.0 — 87.5 21.4 0.0 0.0 0.0 0.0 2.2 2.6 2.4 5.5 25 36 35 4 28 44 59 7 88.5 73.3 67.0 56.2 79.6 74.1 70.4 63.3
U Mary Washington 7 IIA PU 86.7 71.8 63.4 — 66.1 74.1 118.3 102.4 89.3 — 91.4 103.5 39.6 100.0 98.9 0.0 0.0 1.8 1.0 0.4 41 48 24 1 41 39 33 0 91.6 73.7 67.1 — 81.8 69.4 60.7
U Richmond 7 IIA PI 162.2 110.3 94.2 68.0 114.5 204.3 141.0 116.6 87.9 144.9 26.6 92.4 92.4 1.2 0.0 3.5 3.9 4.4 3.4 78 67 45 33 40 65 37 40 170.5 113.8 100.8 70.3 145.8 106.6 86.2 66.1
U Virginia-Main Campus 7 I PU 182.6 120.8 93.5 61.1 61.3 132.0 223.8 151.6 118.6 78.5 79.2 164.1 24.3 91.4 74.3 0.0 0.0 3.5 3.9 4.8 9.2 413 216 224 2 134 154 214 3 187.7 123.2 101.3 — 167.0 117.4 85.3 65.8
U Virginia’s Coll Wise IIB PU 83.9 73.6 62.9 55.4 69.0 112.8 98.9 85.5 75.8 93.3 35.2 100.0 91.7 10.3 0.0 4.9 5.5 1.6 3.7 19 15 19 9 9 9 10 17 84.5 72.5 65.4 56.7 82.6 75.6 58.2 54.8
Virginia Commonwealth U 7 I PU 132.4 89.9 73.7 53.8 86.1 172.1 121.9 102.4 77.8 117.0 35.9 87.7 72.0 0.0 0.0 0.8 2.0 1.7 1.7 155 190 237 72 64 188 264 95 136.8 92.8 77.1 55.5 121.8 87.1 70.6 52.6
Virginia Military Institute IIB PU 95.7 75.4 63.3 45.2 — 79.6 135.5 107.6 90.5 71.2 — 113.3 42.4 90.8 72.0 0.0 0.0 4.9 3.8 5.1 0.0 55 16 22 3 10 9 25 2 96.8 74.7 64.9 47.9 89.6 76.6 61.9 —
Virginia Polytechnic Institute and St U 7 I PU 146.8 101.9 90.4 54.0 65.3 106.5 190.1 136.7 122.9 79.4 92.9 142.1 33.4 97.3 89.4 0.0 0.0 2.7 4.2 5.0 3.3 479 324 305 114 102 197 212 124 150.3 103.8 93.7 55.3 130.4 98.7 85.5 52.9
Washington and Lee U IIB PI 144.3 106.2 93.3 61.5 — 117.7 189.3 142.1 120.9 78.3 — 154.5 31.3 98.9 96.2 0.0 0.0 3.4 5.1 5.1 2.7 64 28 24 7 30 24 17 8 149.5 109.0 90.7 69.8 133.3 102.9 97.0 54.2
WashingtonCentral Washington U IIA PU 97.5 83.7 71.6 49.6 77.0 123.1 106.3 92.3 65.4 98.5 27.8 100.0 97.5 0.0 3.8 2.2 5.5 90 68 39 0 50 52 45 0 98.3 84.6 76.9 96.0 82.4 66.9
Northwest U IIA PR 73.4 59.8 54.6 48.9 60.2 91.9 77.4 72.2 65.8 78.0 29.5 92.3 55.6 0.0 0.0 0.7 2.9 2.1 9 9 10 1 4 9 13 2 73.6 60.4 54.6 — 72.9 59.1 54.7 —
Pacific Lutheran U IIA PR 83.5 70.6 71.6 55.7 72.1 107.5 91.2 91.2 76.7 93.3 29.4 100.0 97.4 8.8 0.0 3.1 2.9 2.8 2.9 31 32 21 10 19 44 36 16 84.4 71.4 67.2 54.3 82.0 70.0 74.1 56.6
Seattle U IIA PR 121.5 89.5 78.7 60.0 54.1 28.0 83.3 96.6 95.5 2.3 0.0 2.8 2.7 3.8 3.6 49 94 35 50 39 84 52 67 130.3 87.9 83.7 60.7 110.6 91.3 75.3 59.4
U Puget Sound 7 IIA PI 111.1 88.0 74.7 75.6 95.8 147.2 115.8 99.1 102.7 127.1 32.7 98.3 73.7 0.0 0.0 0.7 4.5 3.3 0.5 66 19 23 8 53 19 27 15 112.2 87.5 74.5 74.9 109.8 88.5 74.9 76.0
U Washington-Bothell Campus 7 IIA PU 124.4 111.7 98.0 80.2 98.3 151.0 136.2 120.6 100.8 121.2 23.2 100.0 100.0 0.0 2.0 2.4 3.3 14 26 23 0 9 21 33 0 130.1 112.6 100.4 115.6 110.6 96.3
U Washington-Seattle Campus 7 I PU 151.4 114.6 102.5 58.6 83.9 121.0 179.5 139.4 124.5 74.1 105.5 145.9 20.5 100.0 98.4 0.0 0.0 4.5 5.9 5.7 2.9 471 231 155 22 258 204 172 28 156.3 119.2 103.8 61.5 142.4 109.4 101.4 56.4
© 2019 American Association of University Professors
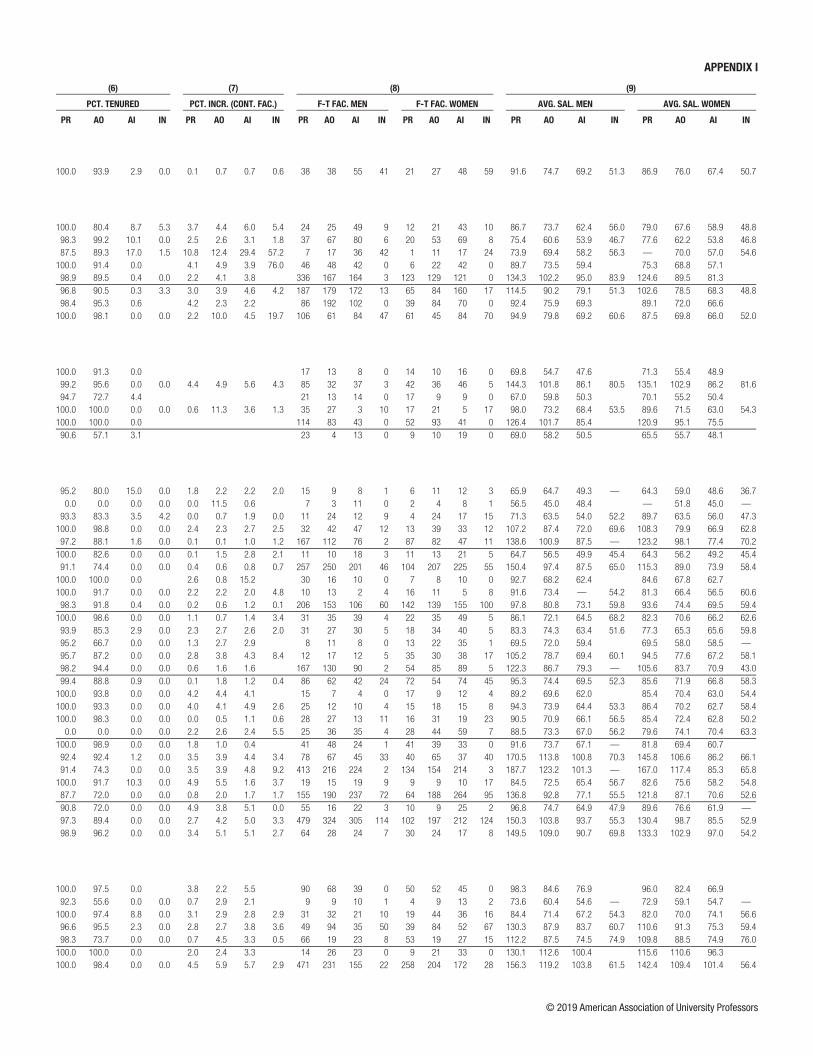
APPENDIX I APPENDIX I
NAME NOTES
(1) (2) (3) (4) (5) (6) (7) (8) (9)
CAT. CTRL
AVG. SALARY ($1000s) AVG. COMPENSATION ($1000s) BEN. as %
of SAL.
PCT. TENURED PCT. INCR. (CONT. FAC.) F-T FAC. MEN F-T FAC. WOMEN AVG. SAL. MEN AVG. SAL. WOMEN
PR AO AI IN LE NR AR PR AO AI IN LE NR AR PR AO AI IN PR AO AI IN PR AO AI IN PR AO AI IN PR AO AI IN PR AO AI IN
Texas (continued)West Texas A & M U 7 IIA PU 90.0 75.2 68.4 50.9 68.3 112.9 100.2 92.9 69.9 90.9 33.1 100.0 93.9 2.9 0.0 0.1 0.7 0.7 0.6 38 38 55 41 21 27 48 59 91.6 74.7 69.2 51.3 86.9 76.0 67.4 50.7
UtahDixie St U III PU 84.1 70.9 60.8 52.2 52.2 66.4 118.5 102.2 89.5 81.3 70.5 96.5 45.4 100.0 80.4 8.7 5.3 3.7 4.4 6.0 5.4 24 25 49 9 12 21 43 10 86.7 73.7 62.4 56.0 79.0 67.6 58.9 48.8
Salt Lake CC III PU 76.2 61.3 53.8 46.8 44.0 59.7 110.5 92.1 82.5 71.6 70.0 89.9 50.6 98.3 99.2 10.1 0.0 2.5 2.6 3.1 1.8 37 67 80 6 20 53 69 8 75.4 60.6 53.9 46.7 77.6 62.2 53.8 46.8
Snow Coll 46 III PU 73.5 69.6 57.8 55.7 59.9 103.2 102.4 85.2 83.7 88.6 48.0 87.5 89.3 17.0 1.5 10.8 12.4 29.4 57.2 7 17 36 42 1 11 17 24 73.9 69.4 58.2 56.3 — 70.0 57.0 54.6
Southern Utah U IIA PU 88.0 72.0 58.3 48.6 52.9 63.2 121.0 100.2 82.3 70.4 73.9 88.3 39.8 100.0 91.4 0.0 4.1 4.9 3.9 76.0 46 48 42 0 6 22 42 0 89.7 73.5 59.4 75.3 68.8 57.1
U Utah 7 I PU 131.7 96.7 89.1 83.9 68.5 30.4 95.1 176.5 129.5 119.0 111.9 93.6 40.8 127.8 34.4 98.9 89.5 0.4 0.0 2.2 4.1 3.8 336 167 164 3 123 129 121 0 134.3 102.2 95.0 83.9 124.6 89.5 81.3
Utah St U 7 I PU 111.4 86.4 73.9 49.9 60.0 84.0 152.2 121.4 105.8 76.3 89.2 118.5 41.0 96.8 90.5 0.3 3.3 3.0 3.9 4.6 4.2 187 179 172 13 65 84 160 17 114.5 90.2 79.1 51.3 102.6 78.5 68.3 48.8
Utah Valley U IIA PU 91.4 74.7 68.2 52.4 87.6 72.8 132.0 107.9 98.5 75.8 126.6 105.1 44.5 98.4 95.3 0.6 4.2 2.3 2.2 86 192 102 0 39 84 70 0 92.4 75.9 69.3 89.1 72.0 66.6
Weber St U IIA PU 92.2 75.5 67.6 55.4 73.9 126.8 107.7 97.2 82.1 104.9 41.9 100.0 98.1 0.0 0.0 2.2 10.0 4.5 19.7 106 61 84 47 61 45 84 70 94.9 79.8 69.2 60.6 87.5 69.8 66.0 52.0
VermontCastleton U IIB PU 70.5 55.0 48.5 59.2 106.5 82.7 69.7 88.2 49.0 100.0 91.3 0.0 17 13 8 0 14 10 16 0 69.8 54.7 47.6 71.3 55.4 48.9
Middlebury Coll IIA PI 141.2 102.4 86.2 81.2 76.3 63.0 111.0 189.0 127.5 114.2 102.1 105.0 90.0 146.3 31.8 99.2 95.6 0.0 0.0 4.4 4.9 5.6 4.3 85 32 37 3 42 36 46 5 144.3 101.8 86.1 80.5 135.1 102.9 86.2 81.6
Northern Vermont U 44 IIA PU 68.4 58.0 50.4 60.6 105.3 92.6 79.1 94.7 56.2 94.7 72.7 4.4 21 13 14 0 17 9 9 0 67.0 59.8 50.3 70.1 55.2 50.4
Saint Michael’s Coll IIA PR 95.2 72.4 65.1 54.0 77.1 136.0 103.4 92.9 77.1 110.1 42.8 100.0 100.0 0.0 0.0 0.6 11.3 3.6 1.3 35 27 3 10 17 21 5 17 98.0 73.2 68.4 53.5 89.6 71.5 63.0 54.3
U Vermont 7 I PU 124.7 98.2 80.5 63.6 79.7 93.3 163.8 132.8 110.4 90.3 110.7 126.3 35.4 100.0 100.0 0.0 114 83 43 0 52 93 41 0 126.4 101.7 85.4 120.9 95.1 75.5
Vermont Technical Coll III PU 68.0 56.4 49.1 58.2 100.7 89.4 80.8 90.5 55.6 90.6 57.1 3.1 23 4 13 0 9 10 19 0 69.0 58.2 50.5 65.5 55.7 48.1
VirginiaAverett U IIB PR 65.5 61.5 48.9 40.3 57.6 82.9 77.1 63.8 51.9 73.3 27.3 95.2 80.0 15.0 0.0 1.8 2.2 2.2 2.0 15 9 8 1 6 11 12 3 65.9 64.7 49.3 — 64.3 59.0 48.6 36.7
Bluefield Coll IIB PR 55.9 48.9 47.0 — 49.3 73.3 65.2 59.0 — 63.5 28.7 0.0 0.0 0.0 0.0 0.0 11.5 0.6 7 3 11 0 2 4 8 1 56.5 45.0 48.4 — 51.8 45.0 —
Bridgewater Coll 1 IIB PR 76.2 63.5 55.2 49.2 60.1 95.7 78.7 69.2 64.0 75.5 25.6 93.3 83.3 3.5 4.2 0.0 0.7 1.9 0.0 11 24 12 9 4 24 17 15 71.3 63.5 54.0 52.2 89.7 63.5 56.0 47.3
Christopher Newport U IIA PU 107.5 83.8 69.9 66.2 63.2 78.4 144.9 117.0 98.0 88.6 88.2 108.3 38.3 100.0 98.8 0.0 0.0 2.4 2.3 2.7 2.5 32 42 47 12 13 39 33 12 107.2 87.4 72.0 69.6 108.3 79.9 66.9 62.8
Coll William and Mary 7 I PU 133.3 99.7 83.7 72.3 60.3 104.8 175.3 135.9 114.1 97.8 82.7 140.5 34.0 97.2 88.1 1.6 0.0 0.1 0.1 1.0 1.2 167 112 76 2 87 82 47 11 138.6 100.9 87.5 — 123.2 98.1 77.4 70.2
Eastern Mennonite U 30 IIA PR 64.5 56.3 49.5 45.4 31.3 53.7 86.1 75.5 64.5 60.3 44.5 71.2 32.5 100.0 82.6 0.0 0.0 0.1 1.5 2.8 2.1 11 10 18 3 11 13 21 5 64.7 56.5 49.9 45.4 64.3 56.2 49.2 45.4
George Mason U 7 I PU 140.3 93.6 80.3 61.4 99.5 182.0 127.9 108.9 85.0 133.2 33.8 91.1 74.4 0.0 0.0 0.4 0.6 0.8 0.7 257 250 201 46 104 207 225 55 150.4 97.4 87.5 65.0 115.3 89.0 73.9 58.4
Hampden-Sydney Coll IIB PI 91.1 68.1 62.5 56.3 72.8 115.6 81.2 72.2 64.6 88.2 21.2 100.0 100.0 0.0 2.6 0.8 15.2 30 16 10 0 7 8 10 0 92.7 68.2 62.4 84.6 67.8 62.7
Hollins U IIA PI 85.3 70.2 57.2 58.4 72.5 105.0 86.3 69.7 67.6 88.4 21.9 100.0 91.7 0.0 0.0 2.2 2.2 2.0 4.8 10 13 2 4 16 11 5 8 91.6 73.4 — 54.2 81.3 66.4 56.5 60.6
James Madison U 7 IIA PU 96.1 77.7 71.0 59.5 79.3 134.4 111.6 102.6 88.9 113.5 43.0 98.3 91.8 0.4 0.0 0.2 0.6 1.2 0.1 206 153 106 60 142 139 155 100 97.8 80.8 73.1 59.8 93.6 74.4 69.5 59.4
Longwood U 1 IIA PU 84.5 71.3 65.4 65.1 45.5 67.7 116.9 102.4 92.1 90.1 64.8 95.4 41.0 100.0 98.6 0.0 0.0 1.1 0.7 1.4 3.4 31 35 39 4 22 35 49 5 86.1 72.1 64.5 68.2 82.3 70.6 66.2 62.6
Lynchburg Coll 7 IIA PR 81.1 69.3 64.7 55.7 69.9 106.9 88.3 83.9 69.7 90.5 29.4 93.9 85.3 2.9 0.0 2.3 2.7 2.6 2.0 31 27 30 5 18 34 40 5 83.3 74.3 63.4 51.6 77.3 65.3 65.6 59.8
Mary Baldwin U 1 IIA PR 69.5 62.7 58.7 — 62.2 84.0 77.8 74.4 — 77.4 24.4 95.2 66.7 0.0 0.0 1.3 2.7 2.9 8 11 8 0 13 22 35 1 69.5 72.0 59.4 69.5 58.0 58.5 —
Marymount U 5 IIA PR 97.2 78.0 67.7 58.6 77.8 95.7 87.2 0.0 0.0 2.8 3.8 4.3 8.4 12 17 12 5 35 30 38 17 105.2 78.7 69.4 60.1 94.5 77.6 67.2 58.1
Old Dominion U 7 I PU 118.2 85.5 75.1 48.6 55.2 — 83.3 155.7 116.9 100.9 60.9 76.7 — 112.2 34.7 98.2 94.4 0.0 0.0 0.6 1.6 1.6 167 130 90 2 54 85 89 5 122.3 86.7 79.3 — 105.6 83.7 70.9 43.0
Radford U 1 IIA PU 90.9 73.2 67.7 56.2 38.7 75.1 123.9 103.5 94.9 81.1 60.2 104.6 39.4 99.4 88.8 0.9 0.0 0.1 1.8 1.2 0.4 86 62 42 24 72 54 74 45 95.3 74.4 69.5 52.3 85.6 71.9 66.8 58.3
Randolph Coll IIB PR 87.2 70.1 62.8 54.4 75.5 109.3 91.0 81.3 65.4 95.8 26.9 100.0 93.8 0.0 0.0 4.2 4.4 4.1 15 7 4 0 17 9 12 4 89.2 69.6 62.0 85.4 70.4 63.0 54.4
Randolph-Macon Coll IIB PR 91.3 71.7 63.4 56.7 75.4 118.5 93.6 82.5 77.4 98.5 30.6 100.0 93.3 0.0 0.0 4.0 4.1 4.9 2.6 25 12 10 4 15 18 15 8 94.3 73.9 64.4 53.3 86.4 70.2 62.7 58.4
Roanoke Coll IIB PR 88.6 71.7 64.2 52.2 70.8 115.6 94.5 81.8 69.2 92.5 30.7 100.0 98.3 0.0 0.0 0.0 0.5 1.1 0.6 28 27 13 11 16 31 19 23 90.5 70.9 66.1 56.5 85.4 72.4 62.8 50.2
Shenandoah U 7 I PR 83.8 73.7 69.1 60.7 53.8 — 72.1 102.7 89.9 84.1 69.7 63.0 — 87.5 21.4 0.0 0.0 0.0 0.0 2.2 2.6 2.4 5.5 25 36 35 4 28 44 59 7 88.5 73.3 67.0 56.2 79.6 74.1 70.4 63.3
U Mary Washington 7 IIA PU 86.7 71.8 63.4 — 66.1 74.1 118.3 102.4 89.3 — 91.4 103.5 39.6 100.0 98.9 0.0 0.0 1.8 1.0 0.4 41 48 24 1 41 39 33 0 91.6 73.7 67.1 — 81.8 69.4 60.7
U Richmond 7 IIA PI 162.2 110.3 94.2 68.0 114.5 204.3 141.0 116.6 87.9 144.9 26.6 92.4 92.4 1.2 0.0 3.5 3.9 4.4 3.4 78 67 45 33 40 65 37 40 170.5 113.8 100.8 70.3 145.8 106.6 86.2 66.1
U Virginia-Main Campus 7 I PU 182.6 120.8 93.5 61.1 61.3 132.0 223.8 151.6 118.6 78.5 79.2 164.1 24.3 91.4 74.3 0.0 0.0 3.5 3.9 4.8 9.2 413 216 224 2 134 154 214 3 187.7 123.2 101.3 — 167.0 117.4 85.3 65.8
U Virginia’s Coll Wise IIB PU 83.9 73.6 62.9 55.4 69.0 112.8 98.9 85.5 75.8 93.3 35.2 100.0 91.7 10.3 0.0 4.9 5.5 1.6 3.7 19 15 19 9 9 9 10 17 84.5 72.5 65.4 56.7 82.6 75.6 58.2 54.8
Virginia Commonwealth U 7 I PU 132.4 89.9 73.7 53.8 86.1 172.1 121.9 102.4 77.8 117.0 35.9 87.7 72.0 0.0 0.0 0.8 2.0 1.7 1.7 155 190 237 72 64 188 264 95 136.8 92.8 77.1 55.5 121.8 87.1 70.6 52.6
Virginia Military Institute IIB PU 95.7 75.4 63.3 45.2 — 79.6 135.5 107.6 90.5 71.2 — 113.3 42.4 90.8 72.0 0.0 0.0 4.9 3.8 5.1 0.0 55 16 22 3 10 9 25 2 96.8 74.7 64.9 47.9 89.6 76.6 61.9 —
Virginia Polytechnic Institute and St U 7 I PU 146.8 101.9 90.4 54.0 65.3 106.5 190.1 136.7 122.9 79.4 92.9 142.1 33.4 97.3 89.4 0.0 0.0 2.7 4.2 5.0 3.3 479 324 305 114 102 197 212 124 150.3 103.8 93.7 55.3 130.4 98.7 85.5 52.9
Washington and Lee U IIB PI 144.3 106.2 93.3 61.5 — 117.7 189.3 142.1 120.9 78.3 — 154.5 31.3 98.9 96.2 0.0 0.0 3.4 5.1 5.1 2.7 64 28 24 7 30 24 17 8 149.5 109.0 90.7 69.8 133.3 102.9 97.0 54.2
WashingtonCentral Washington U IIA PU 97.5 83.7 71.6 49.6 77.0 123.1 106.3 92.3 65.4 98.5 27.8 100.0 97.5 0.0 3.8 2.2 5.5 90 68 39 0 50 52 45 0 98.3 84.6 76.9 96.0 82.4 66.9
Northwest U IIA PR 73.4 59.8 54.6 48.9 60.2 91.9 77.4 72.2 65.8 78.0 29.5 92.3 55.6 0.0 0.0 0.7 2.9 2.1 9 9 10 1 4 9 13 2 73.6 60.4 54.6 — 72.9 59.1 54.7 —
Pacific Lutheran U IIA PR 83.5 70.6 71.6 55.7 72.1 107.5 91.2 91.2 76.7 93.3 29.4 100.0 97.4 8.8 0.0 3.1 2.9 2.8 2.9 31 32 21 10 19 44 36 16 84.4 71.4 67.2 54.3 82.0 70.0 74.1 56.6
Seattle U IIA PR 121.5 89.5 78.7 60.0 54.1 28.0 83.3 96.6 95.5 2.3 0.0 2.8 2.7 3.8 3.6 49 94 35 50 39 84 52 67 130.3 87.9 83.7 60.7 110.6 91.3 75.3 59.4
U Puget Sound 7 IIA PI 111.1 88.0 74.7 75.6 95.8 147.2 115.8 99.1 102.7 127.1 32.7 98.3 73.7 0.0 0.0 0.7 4.5 3.3 0.5 66 19 23 8 53 19 27 15 112.2 87.5 74.5 74.9 109.8 88.5 74.9 76.0
U Washington-Bothell Campus 7 IIA PU 124.4 111.7 98.0 80.2 98.3 151.0 136.2 120.6 100.8 121.2 23.2 100.0 100.0 0.0 2.0 2.4 3.3 14 26 23 0 9 21 33 0 130.1 112.6 100.4 115.6 110.6 96.3
U Washington-Seattle Campus 7 I PU 151.4 114.6 102.5 58.6 83.9 121.0 179.5 139.4 124.5 74.1 105.5 145.9 20.5 100.0 98.4 0.0 0.0 4.5 5.9 5.7 2.9 471 231 155 22 258 204 172 28 156.3 119.2 103.8 61.5 142.4 109.4 101.4 56.4
© 2019 American Association of University Professors

APPENDIX I APPENDIX I
NAME NOTES
(1) (2) (3) (4) (5) (6) (7) (8) (9)
CAT. CTRL
AVG. SALARY ($1000s) AVG. COMPENSATION ($1000s) BEN. as %
of SAL.
PCT. TENURED PCT. INCR. (CONT. FAC.) F-T FAC. MEN F-T FAC. WOMEN AVG. SAL. MEN AVG. SAL. WOMEN
PR AO AI IN LE NR AR PR AO AI IN LE NR AR PR AO AI IN PR AO AI IN PR AO AI IN PR AO AI IN PR AO AI IN PR AO AI IN
Washington (continued)U Washington-Tacoma Campus 7 IIA PU 125.0 104.1 88.5 66.3 74.2 94.0 152.2 127.4 109.0 85.5 93.0 115.9 23.3 100.0 100.0 0.0 0.0 2.7 3.1 4.0 23 37 22 1 15 32 33 4 134.1 108.4 89.9 — 111.0 99.0 87.6 63.1
Washington St U 7,29 I PU 129.6 90.8 87.3 65.5 53.8 118.0 90.8 162.0 117.1 112.2 87.6 73.8 149.3 116.9 28.7 99.4 96.9 0.0 0.0 1.5 2.2 2.4 2.1 242 181 119 201 93 110 103 277 133.7 93.0 89.7 71.5 119.0 87.1 84.5 61.2
Western Washington U IIA PU 110.4 88.7 76.2 55.8 87.3 139.8 114.0 98.8 76.0 112.5 28.8 100.0 98.2 0.0 0.0 4.3 5.0 5.5 2.5 132 85 82 47 83 79 66 65 113.3 90.5 76.8 58.5 105.8 86.7 75.3 53.9
Whitman Coll IIB PI 118.3 91.5 69.2 — 66.7 88.9 152.2 119.5 92.0 — 88.0 116.1 30.6 97.5 96.4 2.0 0.0 2.1 3.6 4.6 2.1 29 26 26 0 11 29 25 1 120.4 91.2 70.0 112.8 91.9 68.3 —
Whitworth U IIA PR 87.9 70.7 68.1 59.9 35.6 68.6 122.4 95.0 90.8 85.9 49.7 93.7 36.5 83.3 75.9 2.2 0.0 3.0 4.7 5.9 10.1 30 26 22 6 12 28 23 6 87.4 69.3 67.7 61.7 89.1 71.9 68.5 58.1
West VirginiaDavis & Elkins Coll 7 IIB PR 58.3 53.4 47.2 43.2 51.6 73.2 72.0 59.3 55.9 65.8 27.6 86.7 77.8 4.8 0.0 0.1 2.5 0.5 5 2 11 2 10 7 10 1 59.4 — 48.7 — 57.7 51.5 45.7 —
Marshall U 1 IIA PU 82.3 70.1 64.2 39.4 68.4 102.9 87.9 80.1 51.4 85.8 25.5 98.4 92.5 1.9 0.0 5.6 7.3 7.2 5.8 116 59 81 26 70 61 74 48 84.1 73.2 68.2 39.8 79.4 67.0 59.9 39.2
Ohio Valley U 7 IIB PR 46.9 — 44.2 — 45.2 53.4 — 54.8 — 54.0 19.3 22.2 0.0 10.0 0.0 0.0 0.0 1.3 8 0 8 0 1 2 2 1 48.0 46.2 — — — —
Shepherd U 18 IIA PU 80.3 66.6 61.9 49.7 67.1 98.3 81.8 76.4 62.0 82.5 23.0 100.0 96.2 0.0 0.0 2.8 4.5 5.8 8.7 20 28 13 10 16 25 17 7 80.9 66.6 61.5 48.0 79.6 66.5 62.1 52.3
West Virginia U I PU 133.6 86.4 73.1 47.8 — 86.7 91.3 158.2 104.7 88.6 59.2 — 104.9 109.8 20.2 95.3 76.4 7.1 0.9 6.2 4.7 3.6 4.5 264 231 213 40 101 201 227 74 136.6 89.4 75.4 48.4 125.7 82.8 71.0 47.5
West Virginia Wesleyan Coll IIA PR 66.1 56.7 48.4 — 53.4 87.6 80.1 64.6 — 72.5 35.9 100.0 95.7 8.6 0.0 0.0 0.0 -0.6 6 8 17 1 3 15 18 1 67.2 60.0 47.2 — 64.1 55.0 49.4 —
WisconsinCarthage Coll IIB PR 95.4 74.7 64.7 — 76.2 113.5 88.6 75.4 — 89.8 17.9 91.3 85.2 0.0 5.0 7.3 6.5 34 34 29 0 12 20 42 0 97.4 73.2 67.3 89.7 77.2 62.9
Lakeland U IIA PR 75.4 64.9 56.5 54.5 63.3 99.1 82.9 74.6 68.0 81.9 29.4 100.0 92.3 0.0 0.0 2.0 7.2 4.6 7.7 7 8 5 2 1 5 6 3 75.8 65.3 59.6 — — 64.2 54.0 53.0
Lawrence U IIB PI 91.1 75.9 64.3 52.7 — 72.8 126.6 103.2 87.9 71.8 — 99.7 36.9 100.0 98.6 0.0 0.0 0.1 3.4 3.7 1.6 25 44 14 9 9 29 25 17 90.7 76.9 66.4 54.9 92.2 74.3 63.1 51.6
Marquette U 7 I PR 123.5 95.7 86.7 65.2 93.9 164.0 130.1 111.5 83.8 124.2 32.2 100.0 98.2 0.0 0.0 3.7 3.4 4.0 2.7 102 91 79 61 33 79 71 50 128.1 97.0 88.6 68.3 109.2 94.1 84.6 61.3
Milwaukee School Engineering IIA PI 99.6 85.9 77.8 70.8 87.4 131.0 120.6 101.9 86.0 117.0 33.8 0.0 0.0 0.0 0.0 2.9 3.4 3.3 3.0 35 31 22 4 11 13 17 3 99.4 88.4 84.3 71.1 100.2 80.1 69.4 70.4
Ripon Coll IIB PI 83.3 66.7 55.9 45.1 68.3 109.2 87.1 75.5 63.5 90.0 31.8 100.0 84.6 0.0 0.0 3.0 5.8 4.5 9 18 6 3 9 8 5 1 84.4 67.4 55.4 45.9 82.2 65.2 56.5 —
Saint Norbert Coll IIB PR 88.1 70.4 63.8 — 70.5 113.2 97.1 81.8 — 92.6 31.3 100.0 100.0 25.9 0.0 3.2 2.2 2.1 17 20 25 0 5 16 29 1 91.8 70.4 67.7 75.8 70.5 60.5 —
U Wisconsin-Eau Claire 7,25 IIA PU 81.1 66.5 67.0 57.9 48.7 68.6 107.4 90.6 91.2 80.8 70.2 93.0 35.6 100.0 93.4 4.4 0.0 2.6 3.5 3.7 3.1 91 54 36 0 50 67 54 10 82.3 65.9 70.5 78.9 66.9 64.6 57.9
U Wisconsin-Green Bay 7,34 IIA PU 68.9 59.8 62.3 48.4 59.8 93.4 82.9 85.8 69.8 83.0 38.7 100.0 100.0 0.0 1.8 1.7 3.3 22 49 29 0 18 37 26 0 72.0 61.5 65.2 65.1 57.5 59.1
U Wisconsin-La Crosse 7 IIA PU 81.4 67.5 64.3 47.0 64.2 107.7 91.8 88.1 68.2 88.0 37.1 97.9 83.7 15.9 2.0 2.6 2.6 59 64 68 0 35 71 83 0 83.4 68.4 66.1 77.9 66.7 62.8
U Wisconsin-Madison 7 I PU 142.6 106.3 92.9 68.2 69.2 112.5 176.2 135.7 120.7 92.6 93.7 142.5 26.7 95.1 83.4 0.0 0.0 4.8 6.2 6.5 4.7 665 186 215 155 306 169 200 174 147.9 111.9 95.5 70.6 131.0 100.1 90.1 66.1
U Wisconsin-Milwaukee 7,42 I PU 105.6 80.0 73.7 56.0 47.8 77.0 135.0 106.1 98.7 78.6 69.1 102.5 33.1 97.5 92.2 1.6 0.0 5.9 5.4 4.7 2.8 165 201 77 9 78 169 116 38 109.8 82.4 79.9 60.8 96.5 77.1 69.5 54.9
U Wisconsin-Oshkosh 7,31 IIA PU 78.8 64.9 66.9 — 49.0 65.8 104.5 88.6 90.9 — 70.3 89.6 36.2 99.3 95.2 0.0 0.0 2.2 2.6 2.7 89 64 41 1 46 60 43 0 81.7 66.2 72.4 — 73.1 63.4 61.6
U Wisconsin-Parkside 7 IIB PU 74.0 64.8 60.3 44.3 59.5 99.2 88.8 83.2 66.0 82.8 39.1 100.0 100.0 2.2 2.0 2.7 3.0 16 28 23 0 8 21 22 0 77.1 67.2 60.4 67.6 61.8 60.1
U Wisconsin-Platteville 7,24 IIA PU 76.0 63.3 61.5 46.8 61.8 101.5 87.0 84.9 68.0 85.2 37.9 97.9 96.7 0.0 6.0 6.5 5.5 59 37 65 0 34 24 28 0 76.9 63.0 62.1 74.4 63.9 60.1
U Wisconsin-River Falls 7 IIA PU 76.6 66.2 68.8 54.7 44.7 69.3 102.2 90.3 93.3 77.0 65.6 93.8 35.4 100.0 97.1 0.0 0.0 3.0 5.7 4.3 69 17 27 2 30 18 25 2 76.6 67.1 72.4 — 76.5 65.5 65.0 —
U Wisconsin-Stevens Point 7,35 IIA PU 70.5 57.7 58.0 39.8 43.3 60.9 95.2 80.5 80.9 59.9 64.0 84.2 38.3 99.3 97.6 1.9 0.0 2.3 3.3 2.8 5.0 85 47 60 0 56 35 43 3 71.3 57.6 58.9 69.3 57.9 56.7 39.8
U Wisconsin-Stout 7 IIA PU 75.5 66.6 63.4 — 50.5 64.8 101.0 90.8 87.1 — 72.2 88.6 36.9 100.0 90.1 4.9 0.0 4.7 6.2 3.6 47 43 58 1 47 28 45 1 78.0 68.4 66.4 — 73.0 64.0 59.5 —
U Wisconsin-Superior 7 IIB PU 69.0 57.1 58.9 46.1 58.4 93.5 79.8 81.9 67.1 81.4 39.2 100.0 81.8 10.3 2.9 2.9 3.3 21 13 15 0 11 20 14 0 68.5 60.2 62.5 69.8 55.1 55.0
U Wisconsin-Whitewater 7,38 IIA PU 78.8 69.1 73.8 52.6 67.7 104.7 93.6 99.0 74.7 92.0 35.9 99.0 98.0 0.8 1.8 2.9 2.8 52 77 63 0 48 76 68 0 82.3 71.3 76.9 75.0 66.9 71.0
Viterbo U IIA PR 70.8 61.0 55.9 41.5 60.5 91.4 82.1 74.9 57.8 80.5 33.0 95.8 93.6 6.8 0.0 0.0 0.2 0.0 1.8 10 16 14 0 14 15 30 3 69.7 59.7 54.5 71.6 62.4 56.5 41.5
WyomingU Wyoming 7 I PU 122.1 87.0 80.6 69.0 60.8 — 88.9 165.2 121.8 109.6 96.4 86.0 — 122.4 37.7 98.4 94.2 0.0 0.0 5.3 7.8 6.3 5.3 140 118 86 25 49 87 71 16 124.3 89.6 85.2 77.9 115.9 83.4 75.0 55.2
© 2019 American Association of University Professors
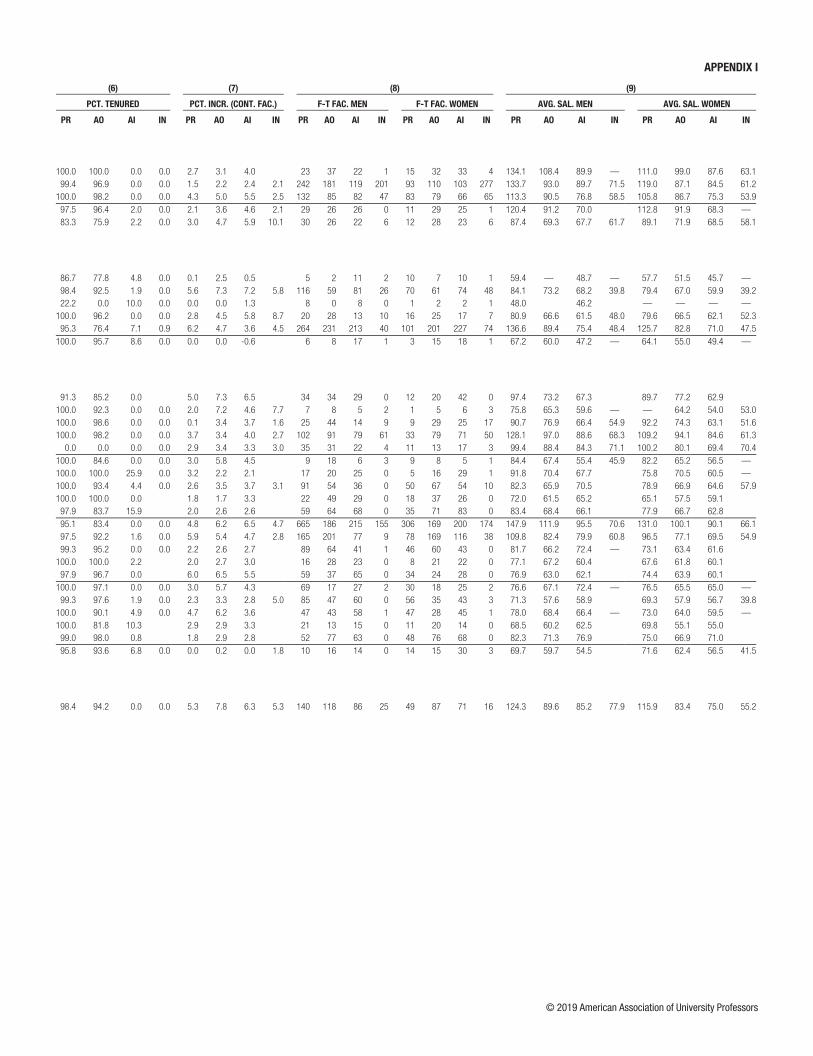
APPENDIX I APPENDIX I
NAME NOTES
(1) (2) (3) (4) (5) (6) (7) (8) (9)
CAT. CTRL
AVG. SALARY ($1000s) AVG. COMPENSATION ($1000s) BEN. as %
of SAL.
PCT. TENURED PCT. INCR. (CONT. FAC.) F-T FAC. MEN F-T FAC. WOMEN AVG. SAL. MEN AVG. SAL. WOMEN
PR AO AI IN LE NR AR PR AO AI IN LE NR AR PR AO AI IN PR AO AI IN PR AO AI IN PR AO AI IN PR AO AI IN PR AO AI IN
Washington (continued)U Washington-Tacoma Campus 7 IIA PU 125.0 104.1 88.5 66.3 74.2 94.0 152.2 127.4 109.0 85.5 93.0 115.9 23.3 100.0 100.0 0.0 0.0 2.7 3.1 4.0 23 37 22 1 15 32 33 4 134.1 108.4 89.9 — 111.0 99.0 87.6 63.1
Washington St U 7,29 I PU 129.6 90.8 87.3 65.5 53.8 118.0 90.8 162.0 117.1 112.2 87.6 73.8 149.3 116.9 28.7 99.4 96.9 0.0 0.0 1.5 2.2 2.4 2.1 242 181 119 201 93 110 103 277 133.7 93.0 89.7 71.5 119.0 87.1 84.5 61.2
Western Washington U IIA PU 110.4 88.7 76.2 55.8 87.3 139.8 114.0 98.8 76.0 112.5 28.8 100.0 98.2 0.0 0.0 4.3 5.0 5.5 2.5 132 85 82 47 83 79 66 65 113.3 90.5 76.8 58.5 105.8 86.7 75.3 53.9
Whitman Coll IIB PI 118.3 91.5 69.2 — 66.7 88.9 152.2 119.5 92.0 — 88.0 116.1 30.6 97.5 96.4 2.0 0.0 2.1 3.6 4.6 2.1 29 26 26 0 11 29 25 1 120.4 91.2 70.0 112.8 91.9 68.3 —
Whitworth U IIA PR 87.9 70.7 68.1 59.9 35.6 68.6 122.4 95.0 90.8 85.9 49.7 93.7 36.5 83.3 75.9 2.2 0.0 3.0 4.7 5.9 10.1 30 26 22 6 12 28 23 6 87.4 69.3 67.7 61.7 89.1 71.9 68.5 58.1
West VirginiaDavis & Elkins Coll 7 IIB PR 58.3 53.4 47.2 43.2 51.6 73.2 72.0 59.3 55.9 65.8 27.6 86.7 77.8 4.8 0.0 0.1 2.5 0.5 5 2 11 2 10 7 10 1 59.4 — 48.7 — 57.7 51.5 45.7 —
Marshall U 1 IIA PU 82.3 70.1 64.2 39.4 68.4 102.9 87.9 80.1 51.4 85.8 25.5 98.4 92.5 1.9 0.0 5.6 7.3 7.2 5.8 116 59 81 26 70 61 74 48 84.1 73.2 68.2 39.8 79.4 67.0 59.9 39.2
Ohio Valley U 7 IIB PR 46.9 — 44.2 — 45.2 53.4 — 54.8 — 54.0 19.3 22.2 0.0 10.0 0.0 0.0 0.0 1.3 8 0 8 0 1 2 2 1 48.0 46.2 — — — —
Shepherd U 18 IIA PU 80.3 66.6 61.9 49.7 67.1 98.3 81.8 76.4 62.0 82.5 23.0 100.0 96.2 0.0 0.0 2.8 4.5 5.8 8.7 20 28 13 10 16 25 17 7 80.9 66.6 61.5 48.0 79.6 66.5 62.1 52.3
West Virginia U I PU 133.6 86.4 73.1 47.8 — 86.7 91.3 158.2 104.7 88.6 59.2 — 104.9 109.8 20.2 95.3 76.4 7.1 0.9 6.2 4.7 3.6 4.5 264 231 213 40 101 201 227 74 136.6 89.4 75.4 48.4 125.7 82.8 71.0 47.5
West Virginia Wesleyan Coll IIA PR 66.1 56.7 48.4 — 53.4 87.6 80.1 64.6 — 72.5 35.9 100.0 95.7 8.6 0.0 0.0 0.0 -0.6 6 8 17 1 3 15 18 1 67.2 60.0 47.2 — 64.1 55.0 49.4 —
WisconsinCarthage Coll IIB PR 95.4 74.7 64.7 — 76.2 113.5 88.6 75.4 — 89.8 17.9 91.3 85.2 0.0 5.0 7.3 6.5 34 34 29 0 12 20 42 0 97.4 73.2 67.3 89.7 77.2 62.9
Lakeland U IIA PR 75.4 64.9 56.5 54.5 63.3 99.1 82.9 74.6 68.0 81.9 29.4 100.0 92.3 0.0 0.0 2.0 7.2 4.6 7.7 7 8 5 2 1 5 6 3 75.8 65.3 59.6 — — 64.2 54.0 53.0
Lawrence U IIB PI 91.1 75.9 64.3 52.7 — 72.8 126.6 103.2 87.9 71.8 — 99.7 36.9 100.0 98.6 0.0 0.0 0.1 3.4 3.7 1.6 25 44 14 9 9 29 25 17 90.7 76.9 66.4 54.9 92.2 74.3 63.1 51.6
Marquette U 7 I PR 123.5 95.7 86.7 65.2 93.9 164.0 130.1 111.5 83.8 124.2 32.2 100.0 98.2 0.0 0.0 3.7 3.4 4.0 2.7 102 91 79 61 33 79 71 50 128.1 97.0 88.6 68.3 109.2 94.1 84.6 61.3
Milwaukee School Engineering IIA PI 99.6 85.9 77.8 70.8 87.4 131.0 120.6 101.9 86.0 117.0 33.8 0.0 0.0 0.0 0.0 2.9 3.4 3.3 3.0 35 31 22 4 11 13 17 3 99.4 88.4 84.3 71.1 100.2 80.1 69.4 70.4
Ripon Coll IIB PI 83.3 66.7 55.9 45.1 68.3 109.2 87.1 75.5 63.5 90.0 31.8 100.0 84.6 0.0 0.0 3.0 5.8 4.5 9 18 6 3 9 8 5 1 84.4 67.4 55.4 45.9 82.2 65.2 56.5 —
Saint Norbert Coll IIB PR 88.1 70.4 63.8 — 70.5 113.2 97.1 81.8 — 92.6 31.3 100.0 100.0 25.9 0.0 3.2 2.2 2.1 17 20 25 0 5 16 29 1 91.8 70.4 67.7 75.8 70.5 60.5 —
U Wisconsin-Eau Claire 7,25 IIA PU 81.1 66.5 67.0 57.9 48.7 68.6 107.4 90.6 91.2 80.8 70.2 93.0 35.6 100.0 93.4 4.4 0.0 2.6 3.5 3.7 3.1 91 54 36 0 50 67 54 10 82.3 65.9 70.5 78.9 66.9 64.6 57.9
U Wisconsin-Green Bay 7,34 IIA PU 68.9 59.8 62.3 48.4 59.8 93.4 82.9 85.8 69.8 83.0 38.7 100.0 100.0 0.0 1.8 1.7 3.3 22 49 29 0 18 37 26 0 72.0 61.5 65.2 65.1 57.5 59.1
U Wisconsin-La Crosse 7 IIA PU 81.4 67.5 64.3 47.0 64.2 107.7 91.8 88.1 68.2 88.0 37.1 97.9 83.7 15.9 2.0 2.6 2.6 59 64 68 0 35 71 83 0 83.4 68.4 66.1 77.9 66.7 62.8
U Wisconsin-Madison 7 I PU 142.6 106.3 92.9 68.2 69.2 112.5 176.2 135.7 120.7 92.6 93.7 142.5 26.7 95.1 83.4 0.0 0.0 4.8 6.2 6.5 4.7 665 186 215 155 306 169 200 174 147.9 111.9 95.5 70.6 131.0 100.1 90.1 66.1
U Wisconsin-Milwaukee 7,42 I PU 105.6 80.0 73.7 56.0 47.8 77.0 135.0 106.1 98.7 78.6 69.1 102.5 33.1 97.5 92.2 1.6 0.0 5.9 5.4 4.7 2.8 165 201 77 9 78 169 116 38 109.8 82.4 79.9 60.8 96.5 77.1 69.5 54.9
U Wisconsin-Oshkosh 7,31 IIA PU 78.8 64.9 66.9 — 49.0 65.8 104.5 88.6 90.9 — 70.3 89.6 36.2 99.3 95.2 0.0 0.0 2.2 2.6 2.7 89 64 41 1 46 60 43 0 81.7 66.2 72.4 — 73.1 63.4 61.6
U Wisconsin-Parkside 7 IIB PU 74.0 64.8 60.3 44.3 59.5 99.2 88.8 83.2 66.0 82.8 39.1 100.0 100.0 2.2 2.0 2.7 3.0 16 28 23 0 8 21 22 0 77.1 67.2 60.4 67.6 61.8 60.1
U Wisconsin-Platteville 7,24 IIA PU 76.0 63.3 61.5 46.8 61.8 101.5 87.0 84.9 68.0 85.2 37.9 97.9 96.7 0.0 6.0 6.5 5.5 59 37 65 0 34 24 28 0 76.9 63.0 62.1 74.4 63.9 60.1
U Wisconsin-River Falls 7 IIA PU 76.6 66.2 68.8 54.7 44.7 69.3 102.2 90.3 93.3 77.0 65.6 93.8 35.4 100.0 97.1 0.0 0.0 3.0 5.7 4.3 69 17 27 2 30 18 25 2 76.6 67.1 72.4 — 76.5 65.5 65.0 —
U Wisconsin-Stevens Point 7,35 IIA PU 70.5 57.7 58.0 39.8 43.3 60.9 95.2 80.5 80.9 59.9 64.0 84.2 38.3 99.3 97.6 1.9 0.0 2.3 3.3 2.8 5.0 85 47 60 0 56 35 43 3 71.3 57.6 58.9 69.3 57.9 56.7 39.8
U Wisconsin-Stout 7 IIA PU 75.5 66.6 63.4 — 50.5 64.8 101.0 90.8 87.1 — 72.2 88.6 36.9 100.0 90.1 4.9 0.0 4.7 6.2 3.6 47 43 58 1 47 28 45 1 78.0 68.4 66.4 — 73.0 64.0 59.5 —
U Wisconsin-Superior 7 IIB PU 69.0 57.1 58.9 46.1 58.4 93.5 79.8 81.9 67.1 81.4 39.2 100.0 81.8 10.3 2.9 2.9 3.3 21 13 15 0 11 20 14 0 68.5 60.2 62.5 69.8 55.1 55.0
U Wisconsin-Whitewater 7,38 IIA PU 78.8 69.1 73.8 52.6 67.7 104.7 93.6 99.0 74.7 92.0 35.9 99.0 98.0 0.8 1.8 2.9 2.8 52 77 63 0 48 76 68 0 82.3 71.3 76.9 75.0 66.9 71.0
Viterbo U IIA PR 70.8 61.0 55.9 41.5 60.5 91.4 82.1 74.9 57.8 80.5 33.0 95.8 93.6 6.8 0.0 0.0 0.2 0.0 1.8 10 16 14 0 14 15 30 3 69.7 59.7 54.5 71.6 62.4 56.5 41.5
WyomingU Wyoming 7 I PU 122.1 87.0 80.6 69.0 60.8 — 88.9 165.2 121.8 109.6 96.4 86.0 — 122.4 37.7 98.4 94.2 0.0 0.0 5.3 7.8 6.3 5.3 140 118 86 25 49 87 71 16 124.3 89.6 85.2 77.9 115.9 83.4 75.0 55.2
© 2019 American Association of University Professors

APPENDIX II
NAME NOTES
(1) (2) (3) (4) (5) (6) (7) (8) (9)
CAT. CTRL
AVG. SAL.
($1000s)
AVG. COMP.
($1000s)
BEN. as
% of SAL.
PCT.
TEN.
PCT. INCR.
CONT. FAC.
NO. OF F-T FAC. AVG. SAL.
MEN WOMEN MEN WOMEN
AlabamaNorthwest-Shoals CC IV PU 55.2 75.9 37.5 21.8 7.9 31 47 57.8 53.5
CaliforniaClovis CC IV PU 92.8 123.5 33.1 33.3 5.7 44 43 93.5 92.0
Fresno City Coll IV PU 97.7 129.3 32.3 22.1 4.7 171 182 98.9 96.6
Reedley Coll IV PU 95.1 126.2 32.7 27.2 4.5 90 101 97.7 92.8
ColoradoMorgan CC IV PU 59.7 82.7 38.5 0.0 2.6 20 17 60.5 58.8
DelawareDelaware Technical CC 37 IV PU 76.1 111.8 46.8 0.0 3.6 137 261 76.4 76.0
IowaNorth Iowa Area CC IV PU 67.0 91.7 36.8 0.0 2.0 40 27 67.1 66.9
NebraskaCentral CC IV PU 58.3 88.3 51.5 0.0 3.7 80 91 57.4 59.1
New MexicoClovis CC 7 IV PU 47.5 64.2 35.2 0.0 17 38 46.2 48.1
TexasCentral Texas Coll IV PU 63.6 79.5 25.1 0.0 2.6 80 82 62.4 64.7
Vernon Coll IV PU 53.4 68.7 28.7 0.0 3.1 34 52 55.6 51.9
WashingtonEvergreen St Coll 48 IIA PU 77.4 101.6 31.4 0.0 2.4 55 79 79.8 75.7
© 2019 American Association of University Professors

© 2019 American Association of University Professors
NOTES TO APPENDICES I AND II 1. Factor used to convert 12-month data: 0.75000. 2. Factor used to convert 12-month data: 0.76596. 3. Factor used to convert 12-month data: 0.80000. 4. Factor used to convert 12-month data: 0.81000. 5. Factor used to convert 12-month data: 0.81800. 6. Factor used to convert 12-month data: 0.81810. 7. Factor used to convert 12-month data: 0.81818. 8. Factor used to convert 12-month data: 0.81820. 9. Factor used to convert 12-month data: 0.81966. 10. Factor used to convert 12-month data: 0.82000. 11. Factor used to convert 12-month data: 0.83300. 12. Factor used to convert 12-month data: 0.83333. 13. Factor used to convert 12-month data: 0.85470. 14. Factor used to convert 12-month data: 0.86300. 15. Factor used to convert 12-month data: 0.86364. 16. Factor used to convert 12-month data: 0.86400. 17. Factor used to convert 12-month data: 0.86700. 18. Factor used to convert 12-month data: 0.91667. 19. All faculty members on 12-month appointments. 20. Benefits expenditure includes increased contributions to state pension plans to address
past shortfalls. 21. Continuing full-time faculty members received two or more salary adjustments during
2018. 22. Includes Abington, Altoona, Beaver, Berks, Brandywine, DuBois, Fayette, Greater
Allegheny, Hazleton, Lehigh Valley, Mont Alto, New Kensington, Schuylkill, Shenango, Wilkes-Barre, Worthington Scranton, and York campuses. Some former instructors and lecturers were moved to newly established teaching ranks of professor, associate, and assistant. Data for 2018–19 are not comparable with prior years.
23. Includes Arts and Sciences, Engineering, School of Dental Medicine, public health faculty members in the School of Medicine, Cummings School of Veterinary Medicine, Fletcher School of Law and Diplomacy, and Friedman School of Nutrition Science and Policy. Faculty at the Schools of Nutrition and Veterinary Medicine have renewable contracts, not tenure.
24. Includes Baraboo/Sauk County and Richland branch campuses, previously part of the University of Wisconsin Colleges.
25. Includes Barron County branch campus, previously part of the University of Wisconsin Colleges.
26. Includes Brentwood, Brooklyn, Hudson at Westchester, Post, and Riverhead campuses. 27. Includes Chalon and Doheny campuses. 28. Includes Cookeville, Highland Crest, and Livingston campuses. 29. Includes Everett, Pullman, Spokane, Tri-Cities, and Vancouver campuses. 30. Includes faculty members teaching at least 3/4 of a full teaching load, reported at their
full-time equivalent salary. 31. Includes Fond du Lac and Fox Valley branch campuses, previously part of the
University of Wisconsin Colleges. 32. Includes Great Valley, Harrisburg, and Erie campuses. Some former instructors and

© 2019 American Association of University Professors
lecturers were moved to newly established teaching ranks of professor, associate, and assistant. Data for 2018–19 are not comparable with prior years.
33. Includes Kenai Peninsula, Kodiak, Matanuska Susitna, and Prince William Sound Colleges.
34. Includes Manitowoc, Marinette, and Sheboygan branch campuses, previously part of the University of Wisconsin Colleges.
35. Includes Marshfield and Wausau branch campuses, previously part of the University of Wisconsin Colleges.
36. Includes Mesa, Arizona, campus. 37. Includes Owens, Stanton/George, and Terry campuses. 38. Includes Rock County branch campus, previously part of the University of Wisconsin
Colleges. 39. Includes the McMinnville Campus; the School of Nursing in Portland, Oregon; and the
online and continuing education program. 40. Includes the Mount Ida Campus, formerly reported as a separate institution, Mount Ida
College. 41. Includes U of Arizona–South. 42. Includes Washington County and Waukesha branch campuses, previously part of the
University of Wisconsin Colleges. 43. Jefferson was created by the merger of Philadelphia University and Thomas Jefferson
University. 44. Johnson State College and Lyndon State College merged to form Northern Vermont
University, effective July 1, 2018. 45. Part of Ferris State U. Listed separately due to separate administrative structure and
labor agreement. 46. Salary increases for continuing full-time faculty are the result of a compensation
adjustment on July 1, 2018. 47. Some former instructors and lecturers were moved to newly established teaching ranks
of professor, associate, and assistant. Data for 2018–19 are not comparable with prior years.
48. This institution does not assign faculty ranks. 57. Does not include Kendall College of Art and Design.

THIS PAGE LEFT INTENTIONALLY BLANK

APPENDIX III
NAME NOTES
(1) (2) (3) (4) (5)
CAT. CTRL
PART-TIME FACULTY PAY PER
COURSE SECTION
PART-TIME FACULTY
BENEFITS
CALENDARNO. MIN. ($) MAX. ($) AVG. ($) RET. MED.
AlabamaAuburn U Montgomery IIA PU 79 Some None Semester
Northwest-Shoals CC IV PU 83 1,404 1,404 1,404 None None Semester
Troy U IIA PU 534 2,286 2,409 2,286 None None Semester
U North Alabama IIA PU 108 1,800 3,600 1,975 None None Semester
U West Alabama IIA PU 89 1,238 4,000 2,000 Semester
ArkansasHarding U IIA PR 176 2,300 2,600 2,450 None None
Hendrix Coll IIB PR 24 2,250 7,500 2,612 Semester
John Brown U IIA PI 137 2,100 3,675 3,063 None None Semester
Lyon Coll IIB PR 28 1,500 3,333 2,263 None None Semester
CaliforniaClovis CC IV PU 230 2,362 3,242 2,857 Some None Semester
Cogswell Coll IIB FP 75 3,000 5,000 3,525 None None Semester
Dominican U California IIA PI 146 5,661 7,530 6,355 Some Some Semester
Fresno City Coll IV PU 690 2,362 3,242 2,857 Some None Semester
Fresno Pacific U IIA PR 12 All All Semester
Holy Names U IIA PR 80 1,279 None None Semester
Mills Coll IIA PI 114 6,000 9,000 4,500 Some Some Semester
Mount Saint Mary’s U IIA PR 359 3,624 4,311 3,968 None None Semester
Occidental Coll IIB PI 85 8,000 8,000 8,000 Semester
Reedley Coll IV PU 324 2,362 3,242 2,857 Some None Semester
Saint Mary’s Coll California IIA PR 264 5,300 9,023 6,915 None Some Varies
Scripps Coll IIB PI 36 6,885 8,550 7,664 Some Some Semester
U San Diego IIA PR 149 5,320 10,500 5,782 None None 4-1-4
U San Francisco I PR 685 5,640 8,070 6,319 Some Some Semester
Westmont Coll IIB PI 55 3,450 9,375 4,137 None None Semester
Whittier Coll IIB PI 72 4,650 4,650 4,650 None None 4-1-4
ColoradoAdams St U IIA PU 72 240 4,200 1,709 Some None Semester
Fort Lewis Coll IIB PU 92 3,300 3,300 3,300 None
U Northern Colorado I PU 345 3,300 3,708 3,696 All Some Semester
ConnecticutAlbertus Magnus Coll IIA PR 190 1,000 3,000 2,800
Central Connecticut St U IIA PU 529 4,578 5,367 4,973 Some Some
Connecticut Coll IIB PI 60 5,800 5,800 5,800 None None Semester
U Hartford IIA PI 644 3,450 12,495 4,916 Some Some Semester
U New Haven IIA PI 295 2,505 6,000 3,613 None None 4-1-4
U Saint Joseph IIA PR 269 2,800 5,830 3,363 None None Semester
DelawareDelaware Technical CC IV PU 702 525 4,200 None None Semester
District of ColumbiaCatholic U America I PR 323 None None Semester
FloridaBethune-Cookman U IIA PR 87 1,800 2,000 None None Semester
Eckerd Coll IIB PR 23 2,000 2,000 2,000 None None 4-1-4
© 2019 American Association of University Professors
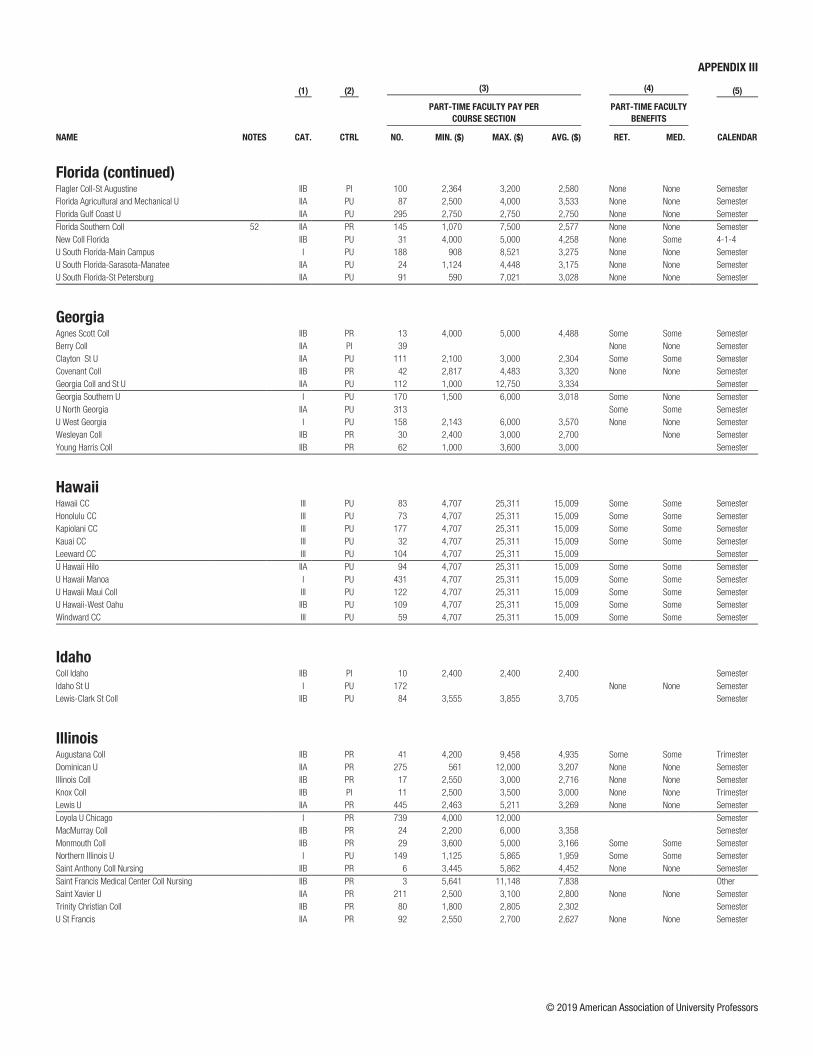
APPENDIX III
NAME NOTES
(1) (2) (3) (4) (5)
CAT. CTRL
PART-TIME FACULTY PAY PER
COURSE SECTION
PART-TIME FACULTY
BENEFITS
CALENDARNO. MIN. ($) MAX. ($) AVG. ($) RET. MED.
Florida (continued)Flagler Coll-St Augustine IIB PI 100 2,364 3,200 2,580 None None Semester
Florida Agricultural and Mechanical U IIA PU 87 2,500 4,000 3,533 None None Semester
Florida Gulf Coast U IIA PU 295 2,750 2,750 2,750 None None Semester
Florida Southern Coll 52 IIA PR 145 1,070 7,500 2,577 None None Semester
New Coll Florida IIB PU 31 4,000 5,000 4,258 None Some 4-1-4
U South Florida-Main Campus I PU 188 908 8,521 3,275 None None Semester
U South Florida-Sarasota-Manatee IIA PU 24 1,124 4,448 3,175 None None Semester
U South Florida-St Petersburg IIA PU 91 590 7,021 3,028 None None Semester
GeorgiaAgnes Scott Coll IIB PR 13 4,000 5,000 4,488 Some Some Semester
Berry Coll IIA PI 39 None None Semester
Clayton St U IIA PU 111 2,100 3,000 2,304 Some Some Semester
Covenant Coll IIB PR 42 2,817 4,483 3,320 None None Semester
Georgia Coll and St U IIA PU 112 1,000 12,750 3,334 Semester
Georgia Southern U I PU 170 1,500 6,000 3,018 Some None Semester
U North Georgia IIA PU 313 Some Some Semester
U West Georgia I PU 158 2,143 6,000 3,570 None None Semester
Wesleyan Coll IIB PR 30 2,400 3,000 2,700 None Semester
Young Harris Coll IIB PR 62 1,000 3,600 3,000 Semester
HawaiiHawaii CC III PU 83 4,707 25,311 15,009 Some Some Semester
Honolulu CC III PU 73 4,707 25,311 15,009 Some Some Semester
Kapiolani CC III PU 177 4,707 25,311 15,009 Some Some Semester
Kauai CC III PU 32 4,707 25,311 15,009 Some Some Semester
Leeward CC III PU 104 4,707 25,311 15,009 Semester
U Hawaii Hilo IIA PU 94 4,707 25,311 15,009 Some Some Semester
U Hawaii Manoa I PU 431 4,707 25,311 15,009 Some Some Semester
U Hawaii Maui Coll III PU 122 4,707 25,311 15,009 Some Some Semester
U Hawaii-West Oahu IIB PU 109 4,707 25,311 15,009 Some Some Semester
Windward CC III PU 59 4,707 25,311 15,009 Some Some Semester
IdahoColl Idaho IIB PI 10 2,400 2,400 2,400 Semester
Idaho St U I PU 172 None None Semester
Lewis-Clark St Coll IIB PU 84 3,555 3,855 3,705 Semester
IllinoisAugustana Coll IIB PR 41 4,200 9,458 4,935 Some Some Trimester
Dominican U IIA PR 275 561 12,000 3,207 None None Semester
Illinois Coll IIB PR 17 2,550 3,000 2,716 None None Semester
Knox Coll IIB PI 11 2,500 3,500 3,000 None None Trimester
Lewis U IIA PR 445 2,463 5,211 3,269 None None Semester
Loyola U Chicago I PR 739 4,000 12,000 Semester
MacMurray Coll IIB PR 24 2,200 6,000 3,358 Semester
Monmouth Coll IIB PR 29 3,600 5,000 3,166 Some Some Semester
Northern Illinois U I PU 149 1,125 5,865 1,959 Some Some Semester
Saint Anthony Coll Nursing IIB PR 6 3,445 5,862 4,452 None None Semester
Saint Francis Medical Center Coll Nursing IIB PR 3 5,641 11,148 7,838 Other
Saint Xavier U IIA PR 211 2,500 3,100 2,800 None None Semester
Trinity Christian Coll IIB PR 80 1,800 2,805 2,302 Semester
U St Francis IIA PR 92 2,550 2,700 2,627 None None Semester
© 2019 American Association of University Professors

APPENDIX III
NAME NOTES
(1) (2) (3) (4) (5)
CAT. CTRL
PART-TIME FACULTY PAY PER
COURSE SECTION
PART-TIME FACULTY
BENEFITS
CALENDARNO. MIN. ($) MAX. ($) AVG. ($) RET. MED.
Illinois (continued)Western Illinois U IIA PU 27 3,622 5,000 3,927 Some Some Semester
Wheaton Coll IIA PR 162 2,805 3,671 3,300 None None Semester
IndianaBall St U I PU 231 169 17,826 2,192 Some Some Semester
Bethel Coll-Indiana IIA PR 154 2,100 2,250 2,190 None None Semester
Franklin Coll IIB PR 55 1,944 4,167 2,626 None 4-1-4
Goshen Coll IIB PR 11 1,875 3,489 2,920 None None Semester
Indiana St U I PU 224 3,000 5,000 None None Semester
Rose-Hulman Institute Technology IIB PI 20 4,250 8,500 6,069 None None Quarter
U Evansville IIB PR 133 781 5,520 2,413 None None Semester
Valparaiso U IIA PR 112 900 16,000 4,000 None None Semester
IowaBuena Vista U IIA PR 400 2,100 2,650 None None Varies
Central Coll IIB PR 15 3,050 3,350 3,200 None None Semester
Cornell Coll IIB PR 33 3,200 6,242 4,024 Some Some Other
Faith Baptist Bible Coll Theol Sem IIB PR 30 3,000 3,000 3,000 None None Semester
Loras Coll IIB PR 41 2,385 2,385 2,385 Some Some Semester
Northwestern Coll IIB PR 94 1,022 4,088 3,066 None None Semester
Upper Iowa U IIA PI 446 2,100 2,500 2,300 None None Semester
KansasBaker U IIA PR 9 6,035 11,660 9,924 Some None Semester
Fort Hays St U IIA PU 237 2,495 3,095 2,795 Some Some Semester
Wichita St U I PU 217 3,375 Some Some Semester
KentuckyBellarmine U IIA PR 364 2,430 3,510 2,921 None None Semester
Berea Coll IIB PI 5 4,200 8,000 4,930 None None Semester
Georgetown Coll IIA PR 62 1,950 3,000 None None Semester
Kentucky Wesleyan Coll IIB PR 52 1,000 3,000 1,627 Some None Semester
Morehead St U IIA PU 89 2,100 2,100 2,100 None None Semester
Murray St U IIA PU 132 300 4,480 3,424 Some Some Semester
Transylvania U IIB PR 36 2,625 3,000 2,855 None None Semester
Western Kentucky U IIA PU 494 Some Some Semester
LouisianaCentenary Coll Louisiana IIB PR 17 795 6,300 2,520 None None Semester
Louisiana St U-Eunice III PU 69 1,700 1,950 Some None Semester
Nunez CC III PU 60 1,800 1,800 1,800 Some Some Semester
Southeastern Louisiana U IIA PU 106 1,032 3,792 2,295 Semester
U New Orleans I PU 150 300 24,000 10,229
MaineBates Coll IIB PI 16 8,000 12,000 10,000 Some Some Other
U Maine I PU 305 2,898 4,850 3,688 Semester
U Maine Augusta IIB PU 172 2,898 4,850 3,688 Semester
U Maine Farmington IIB PU 79 2,898 4,850 3,688 Semester
U Maine Fort Kent IIB PU 50 2,898 4,850 3,688 Semester
U Maine Machias IIB PU 39 2,898 4,850 3,688 Semester
U Maine Presque Isle IIB PU 46 2,898 4,850 3,688 Semester
U Southern Maine IIA PU 437 2,898 4,850 3,688 Semester
© 2019 American Association of University Professors

APPENDIX III
NAME NOTES
(1) (2) (3) (4) (5)
CAT. CTRL
PART-TIME FACULTY PAY PER
COURSE SECTION
PART-TIME FACULTY
BENEFITS
CALENDARNO. MIN. ($) MAX. ($) AVG. ($) RET. MED.
MarylandFrostburg St U IIA PU 276 4,000 4,400 4,200 Some Some Semester
Hood Coll IIA PI 108 2,610 4,500 None None Semester
Loyola U Maryland IIA PR 106 3,000 5,500 3,673 None None Semester
Montgomery Coll III PU 866 1,155 1,348 1,252 None Some Semester
Notre Dame Maryland U IIA PR 125 883 883 883 None None
Salisbury U IIA PU 119 2,500 3,750 2,553 None None 4-1-4
Towson U IIA PU 707 3,000 3,630 3,302 None Some Semester
U Maryland Eastern Shore IIA PU 84 1,500 3,600 2,358 None None Semester
Washington Coll IIB PI 48 1,800 3,750 2,250 None None Semester
MassachusettsBabson Coll IIA PI 84 6,221 7,629 7,010 None Some Semester
Bentley U IIA PI 132 6,300 6,300 6,300 All None Semester
Boston Coll I PR 528 6,355 7,200 6,761 None Some Semester
Coll of the Holy Cross IIB PR 44 6,425 9,809 6,709 None None Semester
Coll Our Lady of the Elms IIA PR 113 2,500 4,500 2,854 All None Semester
Emerson Coll IIA PI 283 5,593 10,872 6,255 Some Some Semester
Emmanuel Coll 51 IIA PR 100 4,500 5,000 4,750 None None Semester
Gordon Coll IIA PR 137 2,400 3,750 2,570 None None Semester
Hampshire Coll IIB PI 20 7,000 8,000 7,500 None None Semester
Holyoke CC III PU 186 3,198 3,864 3,727 None None Semester
Massachusetts Coll Art and Design IIB PU 155 3,550 6,908 6,398 None None Semester
Mount Holyoke Coll IIB PI 47 3,750 6,750 5,294 Some Some Semester
Springfield Coll IIA PI 406 2,370 3,063 2,855 None None Semester
Stonehill Coll IIB PR 115 3,525 5,195 4,095 Semester
U Massachusetts-Dartmouth IIA PU 182 3,963 5,136 4,460 Some Some Semester
Westfield St U IIA PU 231 3,441 5,181 4,974 None None Semester
Wheaton Coll IIB PI 39 5,000 7,500 5,270 Some Some Semester
Worcester St U IIA PU 221 3,300 5,181 4,493 None None
MichiganAlbion Coll IIB PR 32 1,825 6,750 3,680 Some None Semester
Alma Coll IIB PR 82 3,825 3,825 3,825 None None Semester
Aquinas Coll IIB PR 140 1,891 3,500 2,250 None None Semester
Central Michigan U I PU 129 3,300 6,924 4,132 None None Semester
Davenport U IIA PI 587 1,743 2,967 2,357 Some None Semester
Kalamazoo Coll IIB PI 25 2,500 5,150 3,558 None None Quarter
Michigan Technological U I PU 27 1,500 21,475 9,982 None None Semester
Northern Michigan U IIA PU 113 1,040 12,080 5,790 None None Semester
Oakland U I PU 226 3,792 5,189 None Some Semester
Saginaw Valley St U IIA PU 451 1,650 2,550 1,800 None None Semester
U Michigan-Flint IIA PU 255 4,750 11,406 All All Semester
MinnesotaAugsburg Coll IIA PR 291 3,188 5,250 4,410 Semester
Bethel U IIA PR 229 3,041 4,983 3,704 Some Some Semester
Concordia Coll Moorhead IIB PR 39 536 6,300 3,487 Some Some Semester
Gustavus Adolphus Coll IIB PR 40 4,000 4,000 4,000 None None 4-1-4
Saint Mary’s U Minnesota IIA PR 314 3,300 4,200 None None Semester
St Catherine U IIA PR 213 3,750 5,001 4,376 None None Semester
U St Thomas IIA PR 227 1,156 8,485 5,104 Some Some Semester
MississippiMillsaps Coll IIB PR 25 1,875 1,875 1,875 None None Semester
Mississippi Coll I PR 194 380 5,000 3,362 None None Semester
U Southern Mississippi I PU 184 1,666 36,000 12,525 Some All Other
© 2019 American Association of University Professors

APPENDIX III
NAME NOTES
(1) (2) (3) (4) (5)
CAT. CTRL
PART-TIME FACULTY PAY PER
COURSE SECTION
PART-TIME FACULTY
BENEFITS
CALENDARNO. MIN. ($) MAX. ($) AVG. ($) RET. MED.
MissouriDrury U IIA PI 21 2,127 3,192 2,658 None Some Semester
Lindenwood U I PI 882 2,500 4,200 3,020 None None Varies
Mineral Area Coll 50 III PU 167 150 2,550 1,912 Some None Semester
Missouri Baptist U IIA PR 190 360 1,800 1,498 None None Semester
Missouri St U-West Plains III PU 95 1,500 2,100 Some None Semester
Southeast Missouri St U IIA PU 199 2,520 3,651 2,719 None None
Truman St U IIA PU 47 2,400 4,800 3,800 Some Some Semester
U Central Missouri IIA PU 173 1,800 2,400 2,100 Semester
Westminster Coll IIB PR 40 2,400 2,600 2,500 None None Semester
MontanaU Montana I PU 255
U Montana-Western IIB PU 22 1,983 2,583 2,337 None None Semester
NebraskaCentral CC IV PU 169 None None Semester
Concordia U-Nebraska IIA PR 192 1,500 2,400 2,062 Some None Semester
Hastings Coll IIB PR 38 2,022 3,600 2,224 Some None Semester
Nebraska Wesleyan U IIA PR 117 1,125 7,875 2,656 None None Semester
U Nebraska Kearney IIA PU 124 None None Semester
NevadaU Nevada-Reno I PU 313 3,000 9,000 3,817 All All Semester
New HampshireColby-Sawyer Coll IIB PI 34 1,000 4,000 4,000 None None Semester
Franklin Pierce U IIA PI 146 2,000 4,763 3,382 Some Some Semester
Saint Anselm Coll IIB PR 62 4,350 4,350 4,350 Some None Semester
New JerseyBloomfield Coll IIB PR 140 1,819 2,119 None None Semester
Coll New Jersey IIA PU 491 3,380 4,050 3,715 Some Some Semester
Kean U IIA PU 933 Semester
Monmouth U IIA PI 367 2,500 4,800 4,209 Semester
Ramapo Coll New Jersey IIA PU 287 1,450 11,600 5,600 All None Semester
Rider U IIA PI 356 4,000 7,490 4,776 Some Some
Rutgers U-Camden I PU 385 Semester
Rutgers U-New Brunswick I PU 2,073 Semester
Rutgers U-Newark I PU 469 Semester
Saint Peter’s U IIA PR 178 2,142 3,726 2,604 None None Semester
William Paterson U New Jersey IIA PU 754 1,475 1,525 1,500 All None Semester
New MexicoClovis CC IV PU 66 585 7,020 1,755 All None Semester
New Mexico St U-Alamogordo III PU 60 750 24,106 4,742 All Some Semester
New Mexico St U-Carlsbad III PU 38 750 7,500 3,508 All Some Semester
New Mexico St U-Dona Ana III PU 289 1,123 13,403 5,865 All Some Semester
New Mexico St U-Grants III PU 34 250 6,335 2,707 All Some Semester
New Mexico St U-Main Campus I PU 207 1,100 32,065 7,500 All Some Semester
U New Mexico-Main Campus I PU 226 3,943 41,665 16,960 None None Semester
© 2019 American Association of University Professors

APPENDIX III
NAME NOTES
(1) (2) (3) (4) (5)
CAT. CTRL
PART-TIME FACULTY PAY PER
COURSE SECTION
PART-TIME FACULTY
BENEFITS
CALENDARNO. MIN. ($) MAX. ($) AVG. ($) RET. MED.
New YorkCayuga County CC III PU 140 1,095 6,025 3,322 Semester
Cazenovia Coll IIB PI 106 2,400 2,600 2,408 None None Semester
Colgate U IIB PI 28 6,533 12,704 7,966 Some Some Semester
Coll Staten Island CUNY 55 IIA PU 858 None Some Semester
CUNY Bernard M Baruch Coll 55 IIA PU 873 None Some Semester
CUNY Borough Manhattan CC 55 III PU 1,246 None Some Semester
CUNY Bronx CC 55 III PU 527 None Some Semester
CUNY Brooklyn Coll 55 IIA PU 1,075 None Some Semester
CUNY City Coll 55 I PU 1,171 None Some Semester
CUNY Grad School and U Center I PU 467 None Some Semester
CUNY Hostos CC III PU 306 None Some Semester
CUNY Hunter Coll 55 IIA PU 1,984 None Some Semester
CUNY John Jay Coll Criminal Justice 55 IIA PU 1,002 None Some Semester
CUNY Kingsborough CC 55 III PU 676 None Some Semester
CUNY LaGuardia CC III PU 961 None Some Semester
CUNY Lehman Coll IIA PU 862 None Some Semester
CUNY Medgar Evers Coll 55 IIB PU 413 None Some Semester
CUNY New York City Coll Technology 55 IIB PU 1,249 None Some Semester
CUNY Queens Coll 55 IIA PU 1,214 None Some Semester
CUNY Queensborough CC 55 III PU 555 None Some Semester
CUNY School Law IIA PU 34 None Some Semester
CUNY York Coll 55 IIB PU 478 None Some Semester
Farmingdale St Coll IIB PU 491
Finger Lakes CC III PU 181 2,715 2,790 2,752 None None Semester
Hartwick Coll IIB PI 106 2,490 2,910 2,700 Some Some Semester
Keuka Coll IIA PR 302 2,500 3,325 2,912 All All Semester
Le Moyne Coll IIA PR 129 3,100 3,400 3,250 None None Semester
Monroe CC III PU 438 3,111 3,801 3,284 None None Semester
Morrisville St Coll III PU 96
Mount Saint Mary Coll IIA PR 148 2,607 3,795 2,856 None None Semester
New School I PI 884 4,063 10,244 5,555 Semester
New York School Interior Design 56 IIB PI 163 5,010 5,775 5,328 None Some Semester
Niagara County CC III PU 185 2,025 2,349 2,187 Some None Semester
Rensselaer Polytechnic Institute I PI 56 3,750 9,600 5,602 Some Some Semester
Rochester Institute Technology I PI 310 2,325 8,000 3,803 None All Semester
Saint John Fisher Coll IIA PR 86 2,810 4,048 2,997 Some None Semester
Sarah Lawrence Coll IIA PI 118 10,500 19,890 13,778 None Some Semester
Skidmore Coll IIB PI 43 1,300 1,400 1,350 Some Some Semester
Stella and Charles Guttman CC 55 III PU 32 None Some Semester
Sullivan County CC III PU 67 1,794 2,028 1,912 None None Semester
SUNY Albany I PU 436
SUNY Binghamton I PU 248
SUNY Buffalo St IIA PU 434
SUNY Coll Agriculture and Technology Cobleskill IIB PU 75
SUNY Coll Brockport IIA PU 242
SUNY Coll Environmental Science and Forestry IIA PU 40
SUNY Coll Geneseo IIA PU 108
SUNY Coll Old Westbury IIA PU 85
SUNY Coll Oswego IIA PU 193
SUNY Coll Plattsburgh IIA PU 163
SUNY Coll Potsdam IIA PU 86
SUNY Coll Technology Alfred III PU 63
SUNY Coll Technology Canton III PU 92
SUNY Coll Technology Delhi III PU 65
SUNY Cortland IIA PU 216
SUNY Empire St Coll IIA PU 447
SUNY Fredonia IIA PU 155
SUNY Maritime Coll IIB PU 56 3,000 4,952 2,250 Some Some Other
SUNY New Paltz IIA PU 227
SUNY Oneonta IIA PU 167
SUNY Polytechnic Institute IIA PU 124
SUNY Purchase Coll IIB PU 268
© 2019 American Association of University Professors

APPENDIX III
NAME NOTES
(1) (2) (3) (4) (5)
CAT. CTRL
PART-TIME FACULTY PAY PER
COURSE SECTION
PART-TIME FACULTY
BENEFITS
CALENDARNO. MIN. ($) MAX. ($) AVG. ($) RET. MED.
New York (continued)Tompkins Cortland CC III PU 198 2,730 3,540 3,300 Some None Semester
U Buffalo I PU 460
Yeshiva U I PI 140 3,600 10,000 4,000 None None Semester
North CarolinaBarton Coll IIB PR 58 1,800 4,000 None None Semester
Belmont Abbey Coll IIB PR 88 2,800 2,800 2,800 None None Semester
Chowan U IIB PR 52 2,250 3,216 2,324 None None Semester
Davidson Coll IIB PR 16 7,000 8,334 7,321 None None Semester
Gardner-Webb U I PR 193 1,700 2,900 2,423 None None Semester
Greensboro Coll IIB PR 92 720 3,600 2,880 None Some Semester
Lees-McRae Coll IIB PR 148 2,250 2,250 2,250 None None Semester
Mars Hill U IIB PI 78 1,800 2,100 1,950 None None Semester
North Carolina Wesleyan Coll IIB PR 143 1,890 1,890 1,890 None None Semester
Salem Coll IIB PR 82 2,500 2,500 2,500 None None Semester
OhioAshland U IIA PR 196 2,640 None None Semester
Baldwin Wallace U IIA PR 254 3,300 4,740 3,952 None None Semester
Bowling Green St U-Main Campus I PU 653 805 10,000 5,194 All None Semester
Denison U IIB PI 47 4,125 4,500 4,325 Semester
John Carroll U IIA PR 205 760 6,000 3,745 None None Semester
Malone U IIA PR 85 2,100 2,535 2,253 None None Semester
Marietta Coll IIB PI 43 2,500 2,500 2,500 None None Semester
Oberlin Coll IIB PI 5 7,500 10,300 9,353 Some Some 4-1-4
Sinclair CC III PU 970 2,502 2,649 2,582 All None Semester
Tiffin U IIA PI 237 1,000 3,000 2,000 None None Semester
U Cincinnati-Blue Ash Coll III PU 175 1,313 14,103 2,946 All None Semester
U Cincinnati-Clermont Coll III PU 189 1,680 8,820 2,960 All None Semester
U Cincinnati-Main Campus I PU 811 1,131 15,000 4,132 All None Semester
Ursuline Coll IIA PR 119 2,099 2,795 2,447 None None Semester
Wittenberg U 51 IIB PR 67 3,000 3,750 None None Semester
Youngstown St U IIA PU 582 1,950 3,150 2,494 All None Semester
OklahomaCameron U IIA PU 116 1,650 3,750 2,353 None None Semester
Oklahoma St U-Oklahoma City III PU 292 675 17,475 2,887 None None Semester
Southeastern Oklahoma St U IIA PU 156 700 3,500 960 None None Semester
U Central Oklahoma IIA PU 371 2,100 2,880 2,344 None None Semester
U Science and Arts Oklahoma IIB PU 32 1,050 3,037 1,942 None None Trimester
U Tulsa I PR 82 2,000 8,200 4,269 None None Semester
OregonPortland St U I PU 718 2,784 9,954 3,125 Some Some Quarter
Reed Coll IIB PI 15 5,400 22,792 13,601 Some Some Semester
PennsylvaniaAlbright Coll IIB PR 105 1,913 3,863 2,353 None Some 4-1-4
Allegheny Coll IIB PR 16 3,500 3,500 3,500 Semester
Alvernia U IIA PR 171
Bucknell U IIB PI 13 4,470 6,950 5,074 None None Semester
Butler County CC III PU 252 2,400 2,400 2,400 None None Semester
Cedar Crest Coll IIB PI 169 3,513 3,513 3,513 None None Semester
Chatham U IIA PI 290 3,250 5,720 4,440 None None Semester
Delaware Valley U IIA PI 122 2,175 2,175 2,175 None None Semester
© 2019 American Association of University Professors

APPENDIX III
NAME NOTES
(1) (2) (3) (4) (5)
CAT. CTRL
PART-TIME FACULTY PAY PER
COURSE SECTION
PART-TIME FACULTY
BENEFITS
CALENDARNO. MIN. ($) MAX. ($) AVG. ($) RET. MED.
Pennsylvania (continued)Dickinson Coll IIB PI 58 4,600 Some None Semester
Drexel U I PI 930 250 17,290 2,903 Quarter
Duquesne U I PR 474
Gwynedd Mercy U IIA PR 221 None Varies
Holy Family U IIA PR 386 880 8,100 None None Semester
Juniata Coll IIB PI 48 3,000 4,500 Some Some Semester
La Roche Coll IIB PR 113 720 4,358 2,420 None None Semester
Lafayette Coll 51 IIB PR 52 3,250 6,000 4,413 None None Semester
Lebanon Valley Coll IIA PR 133 3,177 4,326 None None Semester
Lincoln U IIA PU 69 2,625 2,625 2,625 None None Semester
Marywood U IIA PR 245 2,205 3,000 2,350 None None Semester
Mercyhurst U IIA PR 99 2,050 2,300 2,222 Semester
Messiah Coll IIA PR 162 3,459 3,723 3,591 None None Semester
Misericordia U IIA PR 132 2,595 None None Semester
Moravian Coll IIA PR 212 1,617 5,828 3,544 None None Semester
Neumann U IIA PR 166 1,983 3,285 2,490 None None Semester
Robert Morris U I PI 231 2,460 3,240 2,805 Some None Semester
Saint Vincent Coll IIA PR 85 970 1,133 None None Semester
Seton Hill U IIA PR 72 2,145 4,500 2,408 None None
Swarthmore Coll IIB PI 19 6,000 12,000 7,970 Some Some Semester
Temple U I PU 1,400 3,900 37,500 5,025 None Some Semester
Ursinus Coll IIB PI 39 4,400 4,400 4,400 None None Semester
Washington & Jefferson Coll IIB PI 38 3,000 4,000 3,000 None None 4-1-4
Waynesburg U IIA PR 83 2,565 2,565 2,565 None None Semester
York Coll Pennsylvania IIB PI 264 3,796 4,860 None None Semester
Puerto RicoU Puerto Rico-Ponce IIB PU 103 1,781 7,832 4,274 None None Semester
Rhode IslandBrown U I PI 113 10,000 None None Semester
Bryant U IIA PI 127 5,200 5,200 5,200 None None Semester
Providence Coll IIA PR 139 500 4,250 4,034 None None Semester
Salve Regina U IIA PR 143 3,700 3,700 3,700 None None Semester
U Rhode Island I PU 383 4,101 4,725 4,413 None None Semester
South CarolinaCoker Coll IIA PI 90 1,900 2,300 None None Semester
Coll Charleston IIA PU 305 1,244 10,028 3,521 All Some Semester
Newberry Coll IIB PR 44 500 3,000 1,800 None None Semester
Winthrop U IIA PU 216 2,000 5,400 2,727 Semester
South DakotaAugustana U IIA PR 63 3,000 4,650 3,825 None None Semester
Dakota St U IIA PU 41 2,700 5,457 3,653 None None Semester
Mount Marty Coll IIA PR 56 1,080 1,950 1,515 Some Some Semester
U Sioux Falls IIA PR 127 2,400 3,000 None None Semester
TennesseeAustin Peay St U IIA PU 305 1,800 2,100 1,950 None None Semester
East Tennessee St U I PU 602 325 10,000 3,814 Semester
Freed-Hardeman U IIA PR 30 2,715 None None Semester
Lee U IIA PR 340 1,800 2,100 1,908 Some None Semester
Middle Tennessee St U I PU 299 1,650 2,100 2,106 None Some Semester
Rhodes Coll IIB PR 28 3,000 5,625 3,710 None None Semester
© 2019 American Association of University Professors

APPENDIX III
NAME NOTES
(1) (2) (3) (4) (5)
CAT. CTRL
PART-TIME FACULTY PAY PER
COURSE SECTION
PART-TIME FACULTY
BENEFITS
CALENDARNO. MIN. ($) MAX. ($) AVG. ($) RET. MED.
Tennessee (continued)Sewanee-U the South IIB PR 34 6,500 13,000 7,986 None None Semester
U Memphis I PU 456 1,532 3,000 2,354 None None Semester
TexasAbilene Christian U IIA PR 120 400 6,000 2,860 None None Semester
Angelo St U IIA PU 115 1,148 4,500 2,757 Some Some
Austin CC District III PU 1,325 2,865 7,260 4,005 Semester
Central Texas Coll IV PU 540 1,685 2,005 1,845 Some None Semester
Hardin-Simmons U IIA PR 58 1,500 3,375 2,342 None None Semester
McMurry U IIB PR 51 1,250 2,000 1,584 None None Semester
Our Lady of the Lake U IIA PR 117 2,300 2,750 2,563 None None Semester
Sam Houston St U I PU 122 2,462 6,750 4,340 None None Semester
Southwestern U IIB PR 21 3,700 7,000 4,395 Some Some Semester
Texas St U I PU 321 2,500 14,000 5,057 None None Semester
Texas Woman’s U I PU 235 1,035 6,489 2,595 Some Some Semester
U Dallas IIA PR 99 100 12,500 4,950 Some None Semester
U Houston-Clear Lake IIA PU 97 2,160 11,709 2,929 None None Semester
U Houston-Downtown IIA PU 317 3,000 4,800 3,900 None Some Semester
U North Texas I PU 537 2,500 9,375 3,873 Some Some Semester
U St Thomas IIA PR 324 225 6,100 2,608
U the Incarnate Word IIA PR 421 2,490 3,690 Some None Semester
West Texas A & M U IIA PU 67 600 20,000 3,931 Some Some Semester
UtahDixie St U III PU 404 2,250 6,300 2,400 None None Semester
Snow Coll III PU 171 2,331 2,331 2,331 None None Semester
Southern Utah U IIA PU 122
U Utah I PU 262 None None Semester
Utah Valley U IIA PU 694 2,960 None None Semester
VermontMiddlebury Coll IIA PI 26 9,000 11,850 10,359 Some None 4-1-4
Saint Michael’s Coll IIA PR 89 3,720 4,269 4,008 Some Some Semester
VirginiaBluefield Coll IIB PR 67 1,500 3,500 2,500 None All Varies
Bridgewater Coll IIB PR 33 800 3,600 2,534 None None Semester
Christopher Newport U IIA PU 168 3,000 3,600 3,108 None None Semester
Eastern Mennonite U IIA PR 72 1,500 8,622 3,073 Semester
Hampden-Sydney Coll IIB PI 7 4,000 7,767 6,886 Some Some Semester
Hollins U IIA PI 12 2,500 6,000 3,000 None None 4-1-4
James Madison U IIA PU 266 800 9,900 3,681 None None Semester
Longwood U IIA PU 73 1,200 16,900 5,442 None None Semester
Old Dominion U I PU 671 3,054 3,696 3,132 Semester
Radford U IIA PU 241 825 5,400 2,878 None None Semester
Randolph Coll IIB PR 61 3,500 3,500 3,500 None None Semester
Roanoke Coll 54 IIB PR 50 2,900 3,701 3,113 None None Semester
U Mary Washington IIA PU 138 300 25,000 4,860 Semester
U Virginia’s Coll Wise IIB PU 58 1,235 5,455 2,370 None None Semester
Virginia Military Institute IIB PU 68 4,736 7,287 5,561 None None Semester
WashingtonCentral Washington U IIA PU 45 2,599 11,854 4,338 All All Quarter
Evergreen St Coll IIA PU 68 8,630 18,611 12,443 Some Some Quarter
© 2019 American Association of University Professors
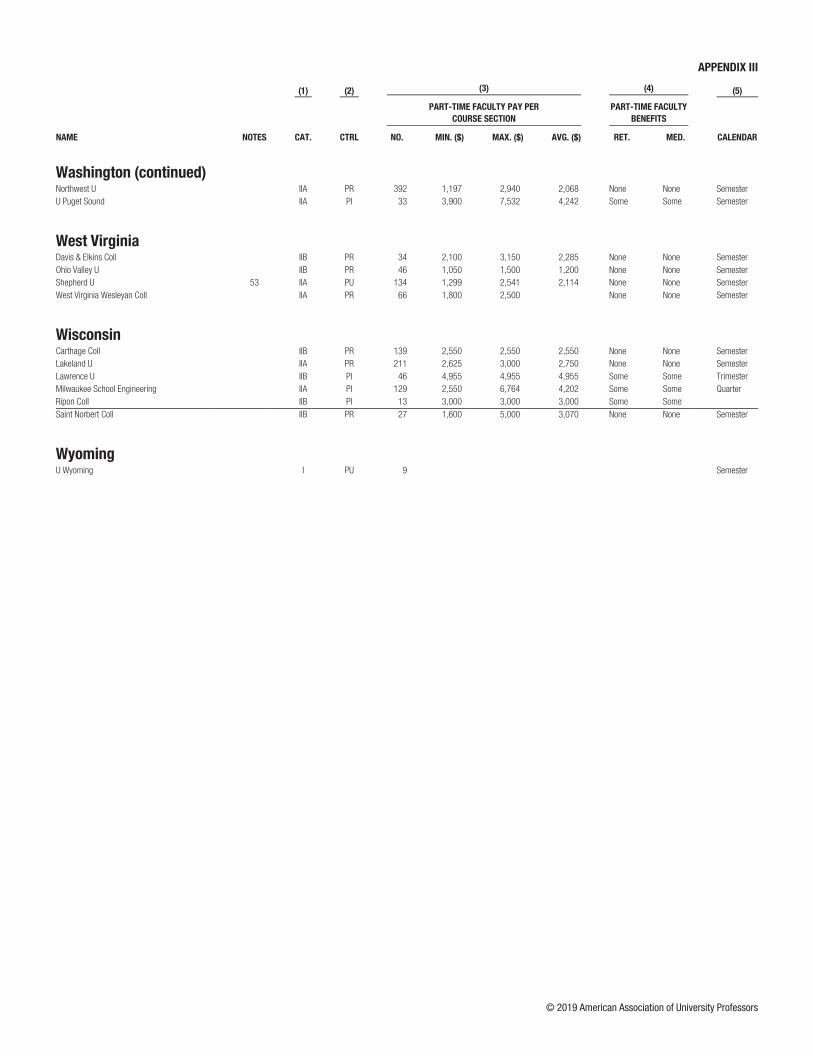
APPENDIX III
NAME NOTES
(1) (2) (3) (4) (5)
CAT. CTRL
PART-TIME FACULTY PAY PER
COURSE SECTION
PART-TIME FACULTY
BENEFITS
CALENDARNO. MIN. ($) MAX. ($) AVG. ($) RET. MED.
Washington (continued)Northwest U IIA PR 392 1,197 2,940 2,068 None None Semester
U Puget Sound IIA PI 33 3,900 7,532 4,242 Some Some Semester
West VirginiaDavis & Elkins Coll IIB PR 34 2,100 3,150 2,285 None None Semester
Ohio Valley U IIB PR 46 1,050 1,500 1,200 None None Semester
Shepherd U 53 IIA PU 134 1,299 2,541 2,114 None None Semester
West Virginia Wesleyan Coll IIA PR 66 1,800 2,500 None None Semester
WisconsinCarthage Coll IIB PR 139 2,550 2,550 2,550 None None Semester
Lakeland U IIA PR 211 2,625 3,000 2,750 None None Semester
Lawrence U IIB PI 46 4,955 4,955 4,955 Some Some Trimester
Milwaukee School Engineering IIA PI 129 2,550 6,764 4,202 Some Some Quarter
Ripon Coll IIB PI 13 3,000 3,000 3,000 Some Some
Saint Norbert Coll IIB PR 27 1,600 5,000 3,070 None None Semester
WyomingU Wyoming I PU 9 Semester
© 2019 American Association of University Professors

© 2019 American Association of University Professors
NOTES TO APPENDIX III The pay amounts reported here are for the 2017–18 academic year to enable more institutions to report. The standard course section is three credit hours, with some exceptions as noted. Some extreme values reported by the institutions are included here but were excluded from table 14. Some institutions could only provide counts of faculty without pay amounts. 49. Does not include part-time faculty members paid per credit hour. 50. Minimum part-time faculty pay according to policy, described as “rare.” 51. Most regular sections carry four credits. 52. Most regular sections carry four credits. Excludes sections with only one student enrolled. 53. Part-time faculty members are paid by the credit hour, with adjustments for qualifications,
discipline, and enrollment. The minimum shown is for a fully-enrolled three-credit class. 54. Part-time pay based on assigned instructional load (locally called TCU), with reported pay
converted to 1 TCU. 55. Per-section pay is not available, as part-time faculty members are paid an hourly wage and their
duties extend beyond instruction. 56. This institution does not employ full-time faculty.