Atmospheric measurements of O2 and CO2 suggest increasing oceanic respiratory disorder
38
Atmospheric measurements of O 2 and CO 2 suggests increasing oceanic respiratory disorder Sander van der Laan 1 Andrew C. Manning 1 , Laure Resplandy 2 , Laurent Bopp 3 , Penelope A. Pickers 1 , Ingrid T. van der Laan-Luijkx 4 and Ralph F. Keeling 2 1: University of East Anglia, Norwich, United Kingdom. 2: Scripps Institution of Oceanography, La Jolla, USA. 3: Laboratoire des Sciences du Climat et de l’Environnement, Gif sur Yvette, France. 4: Meteorology and Air Quality Group, Wageningen, the Netherlands.
-
Upload
integrated-carbon-observation-system-icos -
Category
Science
-
view
48 -
download
1
Transcript of Atmospheric measurements of O2 and CO2 suggest increasing oceanic respiratory disorder

Atmospheric measurements of O2 and CO2
suggests increasing oceanic respiratory disorder
Sander van der Laan1
Andrew C. Manning1, Laure Resplandy2, Laurent Bopp3, Penelope A. Pickers1, Ingrid T. van der Laan-Luijkx4 and Ralph F. Keeling2
1: University of East Anglia, Norwich, United Kingdom.2: Scripps Institution of Oceanography, La Jolla, USA.3: Laboratoire des Sciences du Climat et de l’Environnement, Gif sur Yvette, France.4: Meteorology and Air Quality Group, Wageningen, the Netherlands.

-1.1-1.4
un-coupled
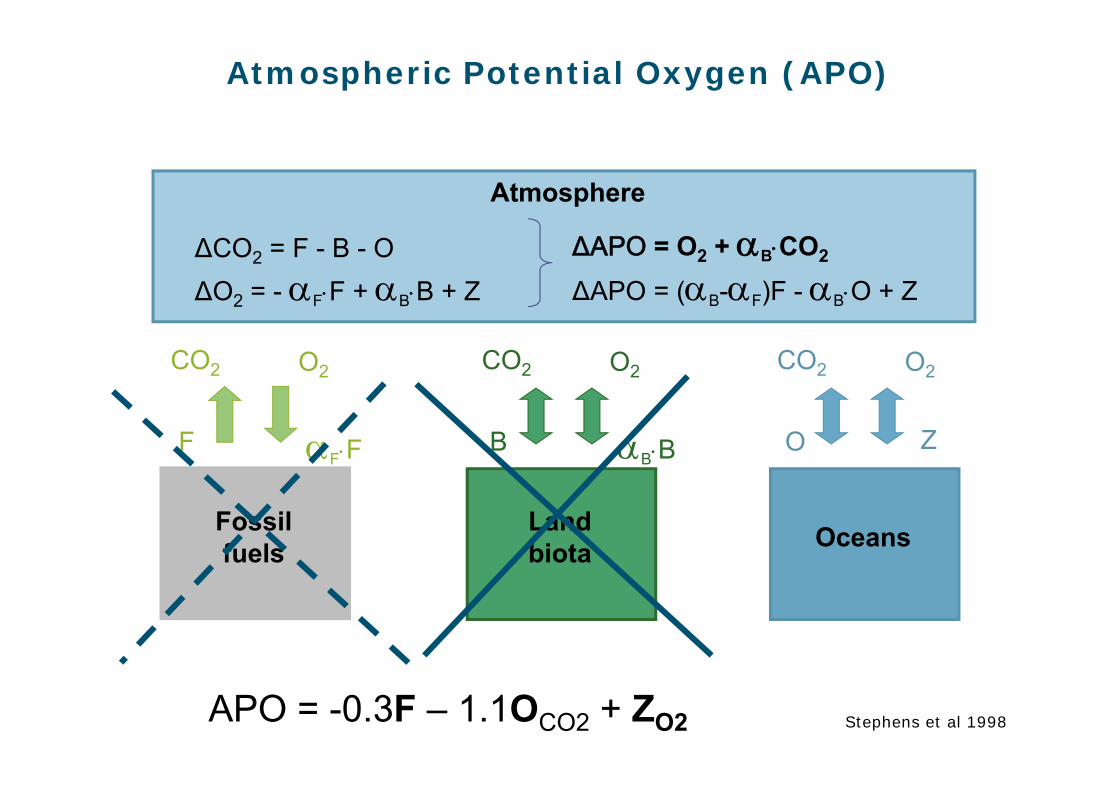
Fossil fuels
Atmosphere
Land biota Oceans
CO2 O2
O
ΔCO2 = F - B - OΔO2 = - FF + BB + Z
Z
CO2 O2
B BB
CO2 O2
F FF
ΔAPO = O2 + BCO2
ΔAPO = (B-F)F - BO + Z
APO = -0.3F – 1.1OCO2 + ZO2 Stephens et al 1998
Atmospheric Potential Oxygen (APO)
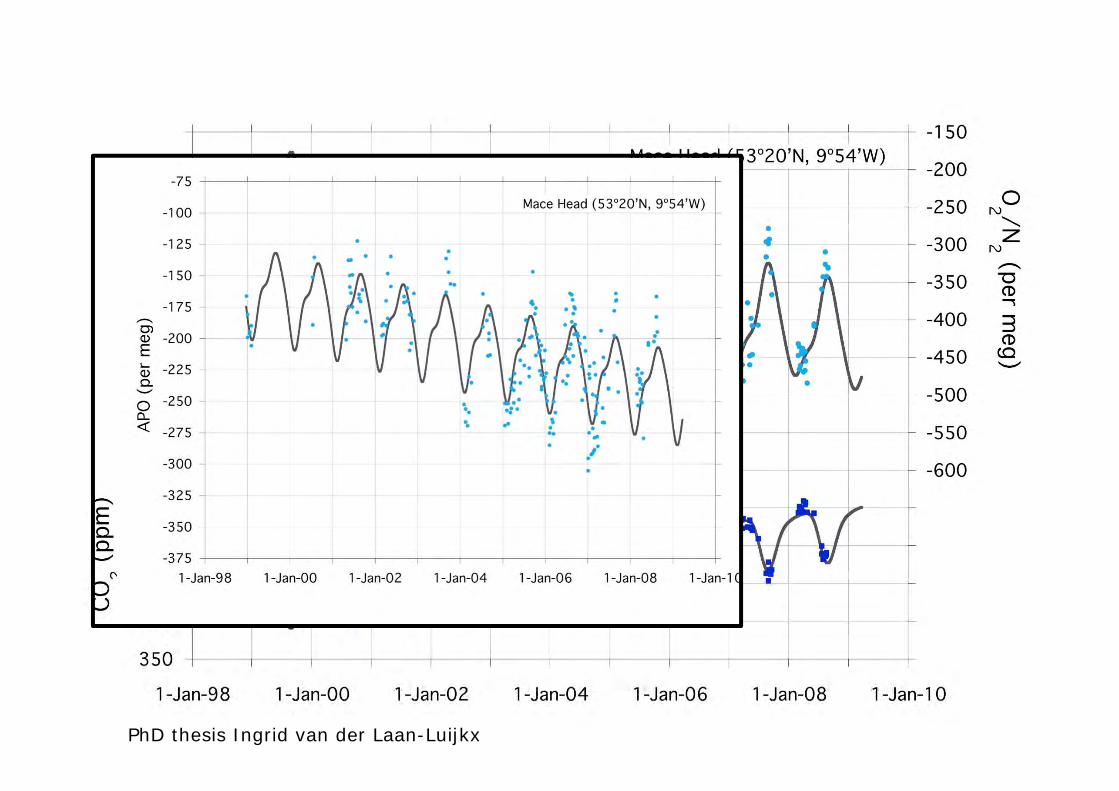
PhD thesis Ingrid van der Laan-Luijkx
Slide courtesy by Martin Heimann
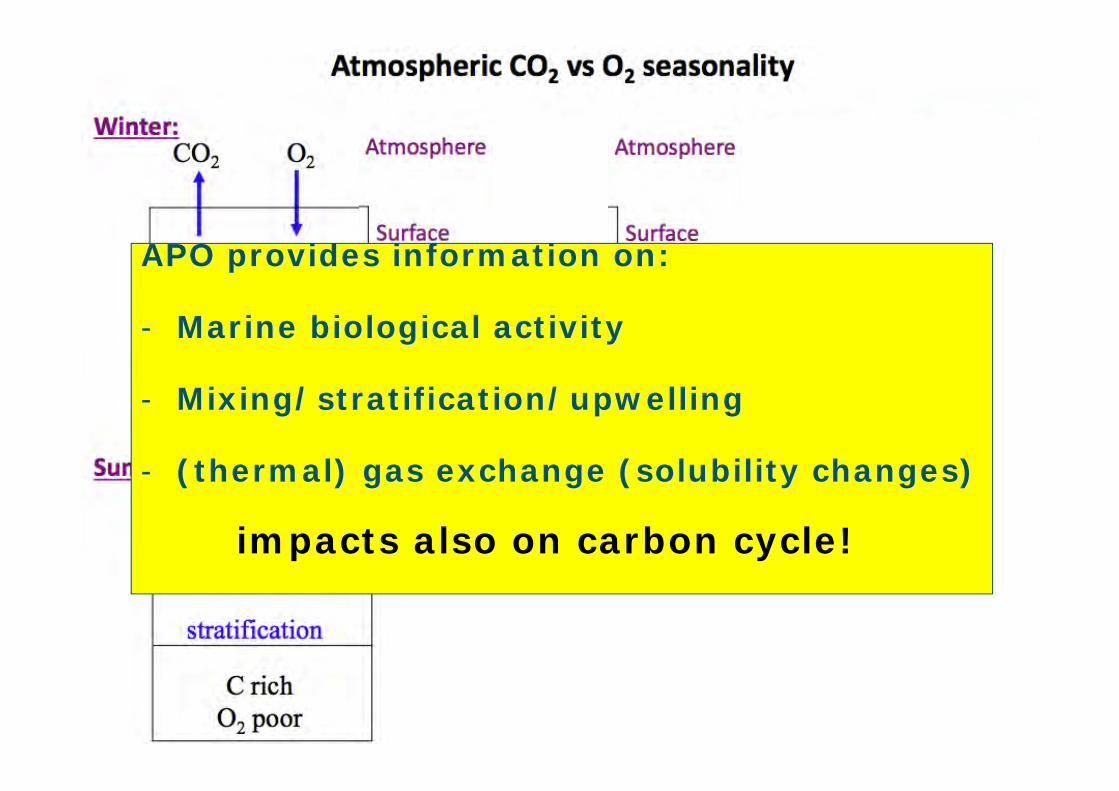
APO provides information on:
- Marine biological activity
- Mixing/stratification/upwelling
- (thermal) gas exchange (solubility changes)
impacts also on carbon cycle!

Methods
- APO flask data from Scripps network (Pacific focus)
- De-trend with CCGCRV curve fitting routines (Python version)
- Analysis: calculate potential LT trend in anomalies in
- Zero crossings Up, Down
- Season lengths
- Max, Min dates
- Surface areas
- Similar for model: NEMO-PISCES* + TM3
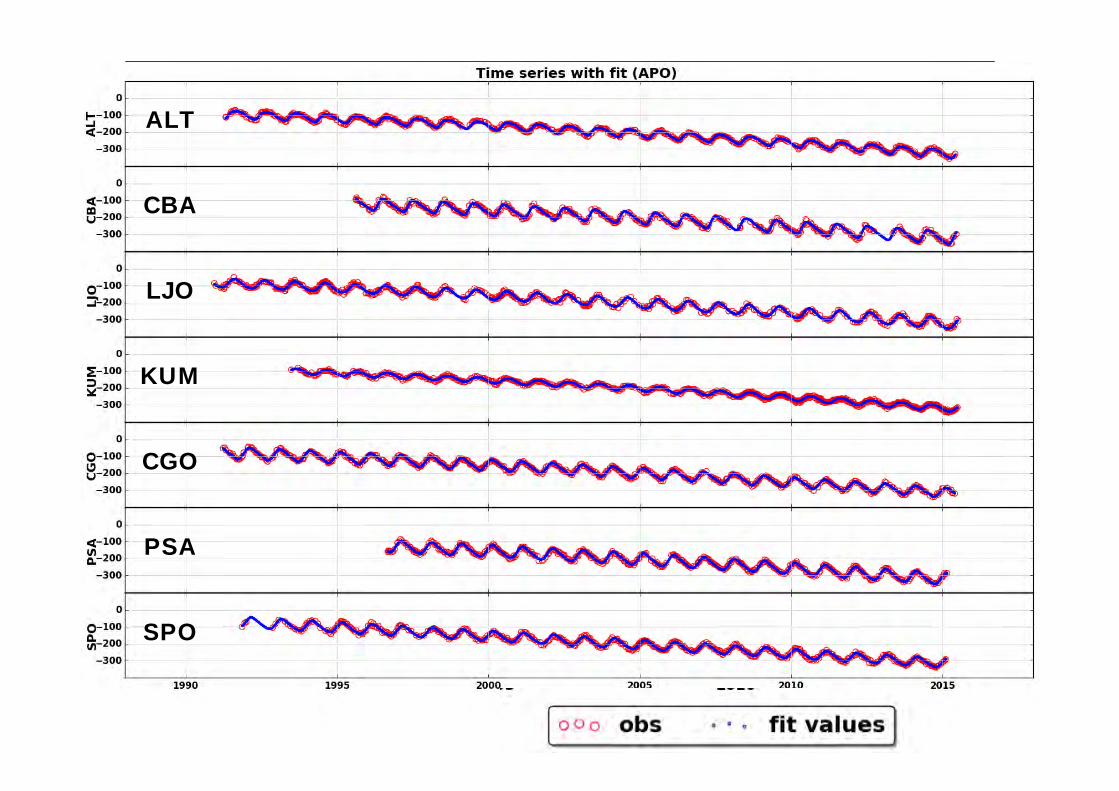
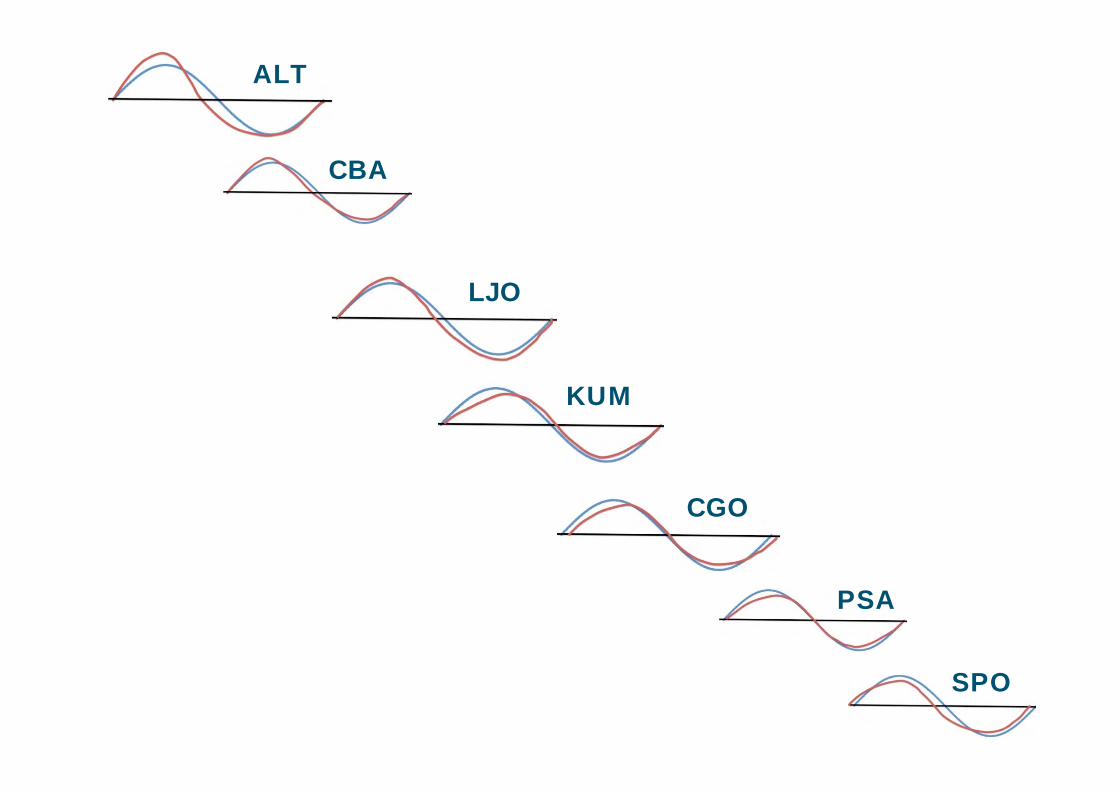
Methods Curve fittingALT
CBA
LJO
KUM
CGO
PSA
SPO

UP
DownALT
CBA
LJO
KUM
CGO
PSA
SPO
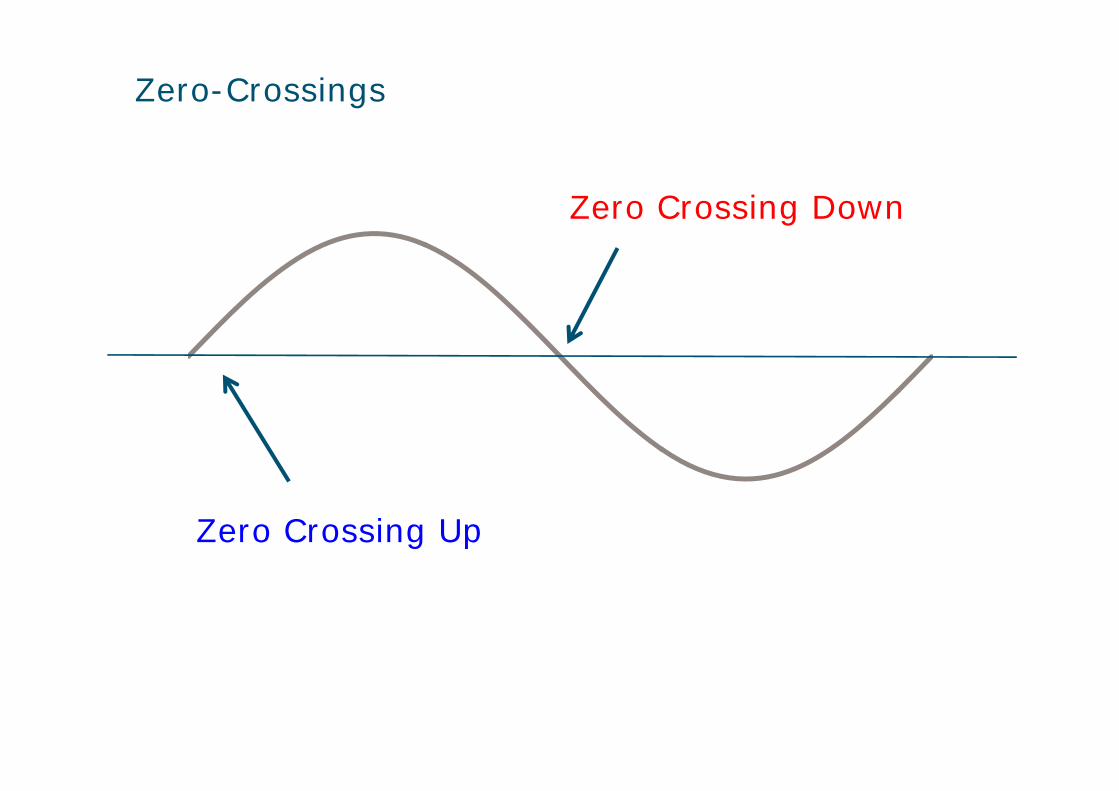
Zero-Crossings
Zero Crossing Down
Zero Crossing Up

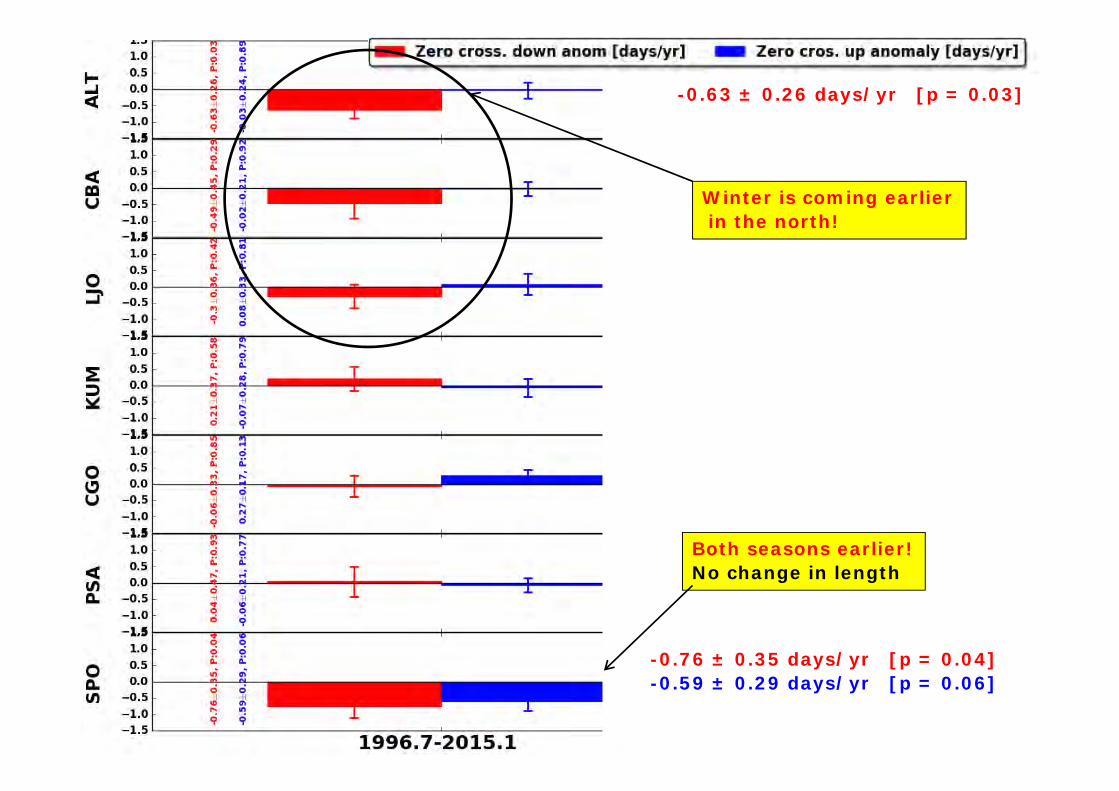
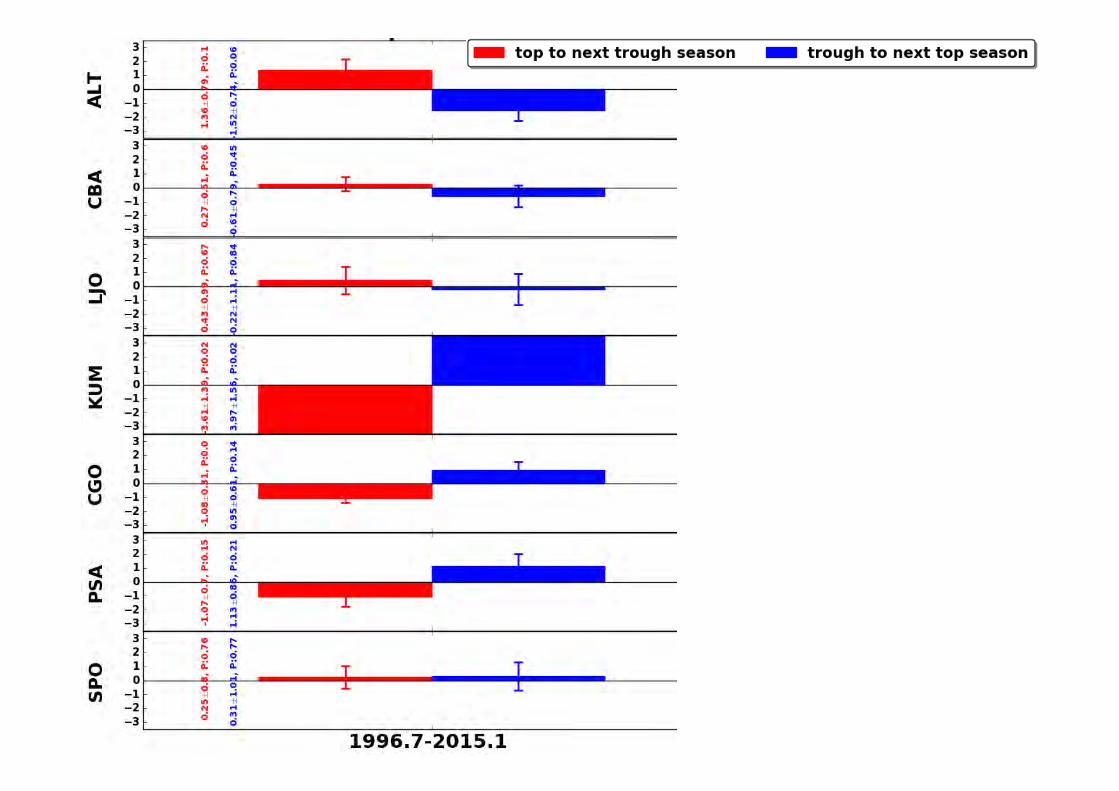
Method/Results long term trend anomaly up & downALT
CBA
LJO
KUM
CGO
PSA
SPO
Zero crossings anomalies
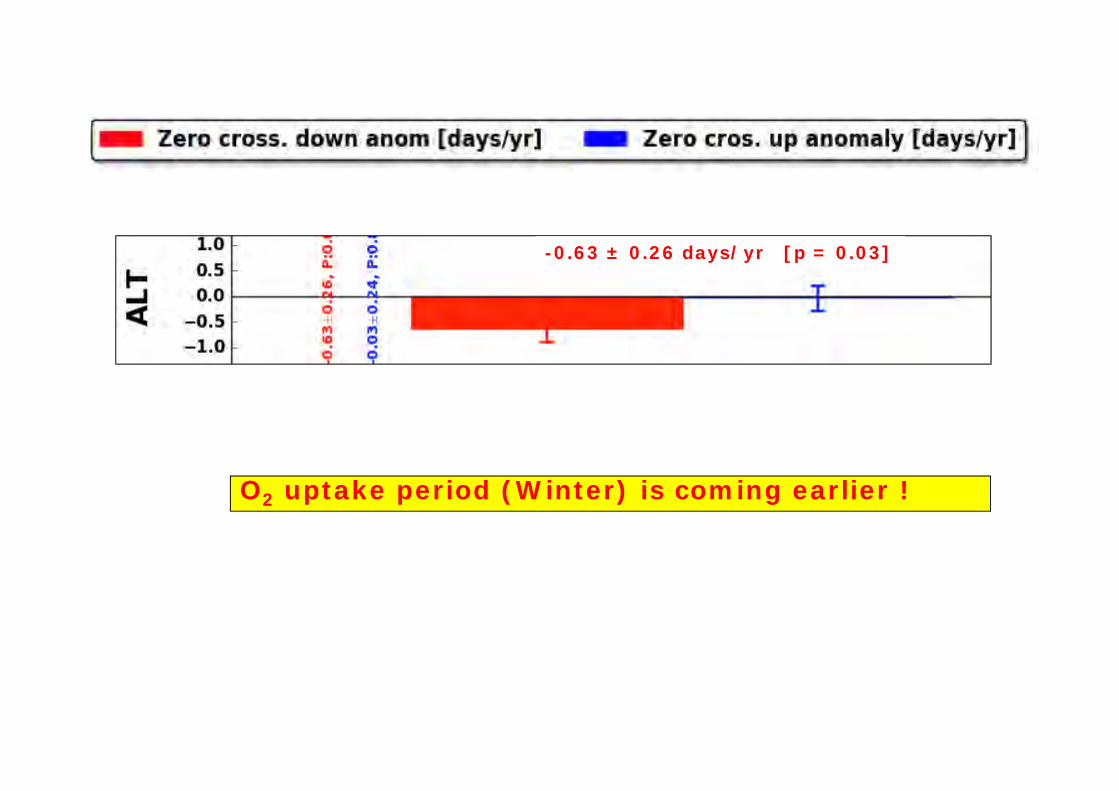
O2 uptake period (Winter) is coming earlier !
-0.63 ± 0.26 days/yr [p = 0.03]
-0.63 ± 0.26 days/yr [p = 0.03]
-0.76 ± 0.35 days/yr [p = 0.04]-0.59 ± 0.29 days/yr [p = 0.06]
Winter is coming earlierin the north!
Both seasons earlier!No change in length
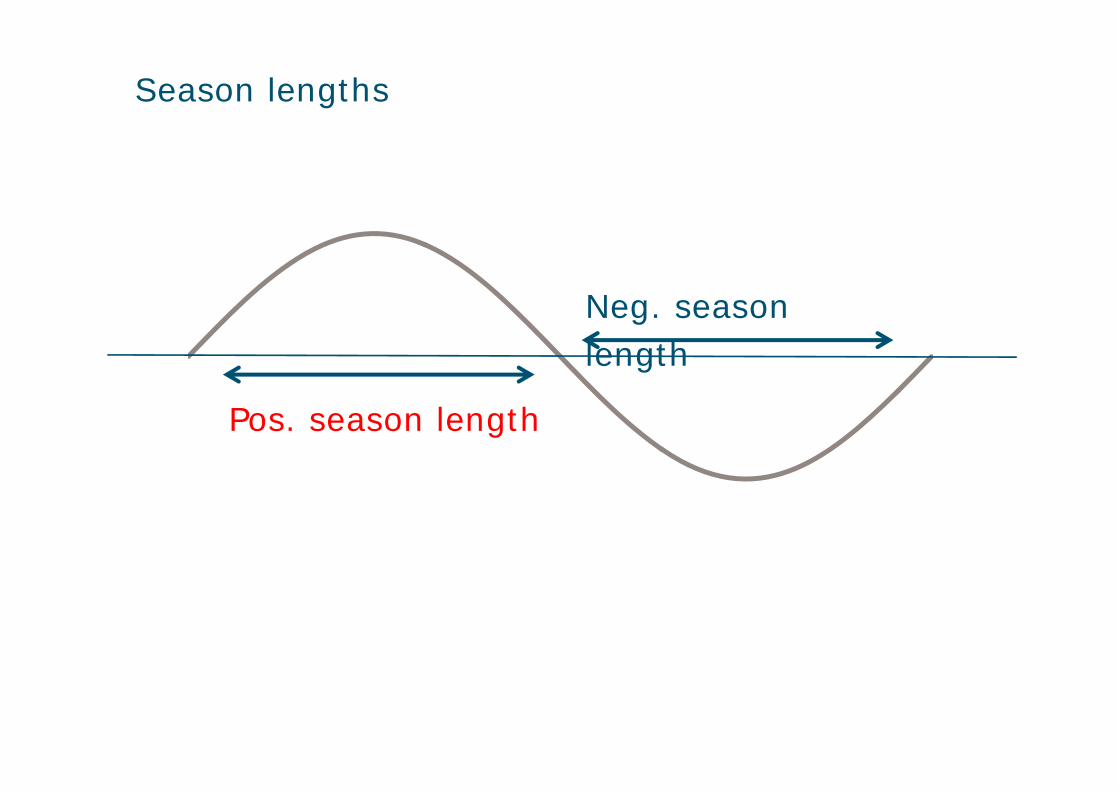
Season lengths
Pos. season length
Neg. season length
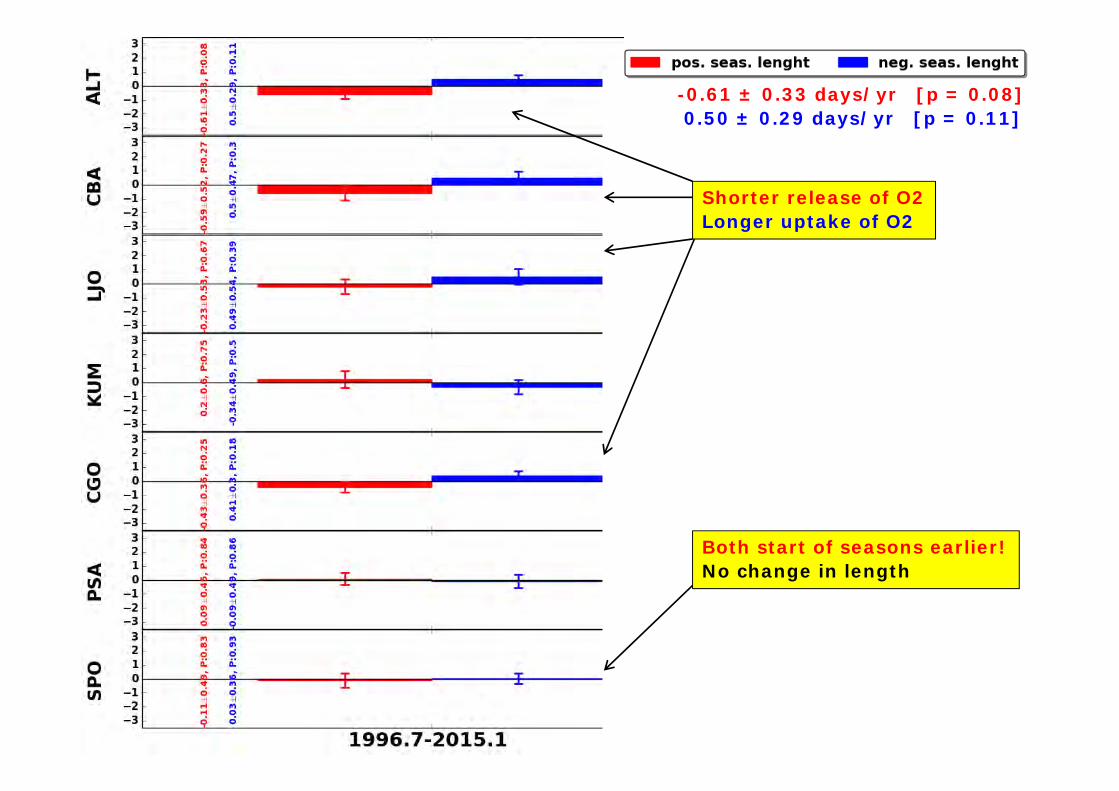
-0.61 ± 0.33 days/yr [p = 0.08]0.50 ± 0.29 days/yr [p = 0.11]
Both start of seasons earlier!No change in length
Shorter release of O2Longer uptake of O2
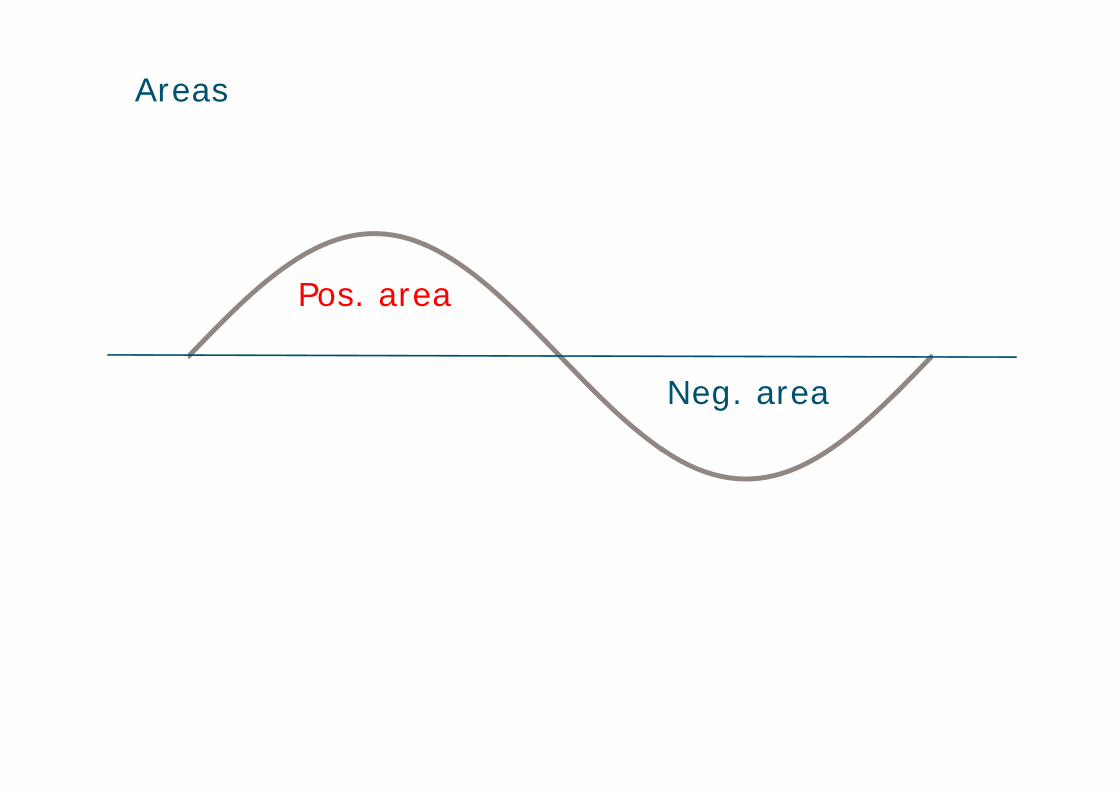
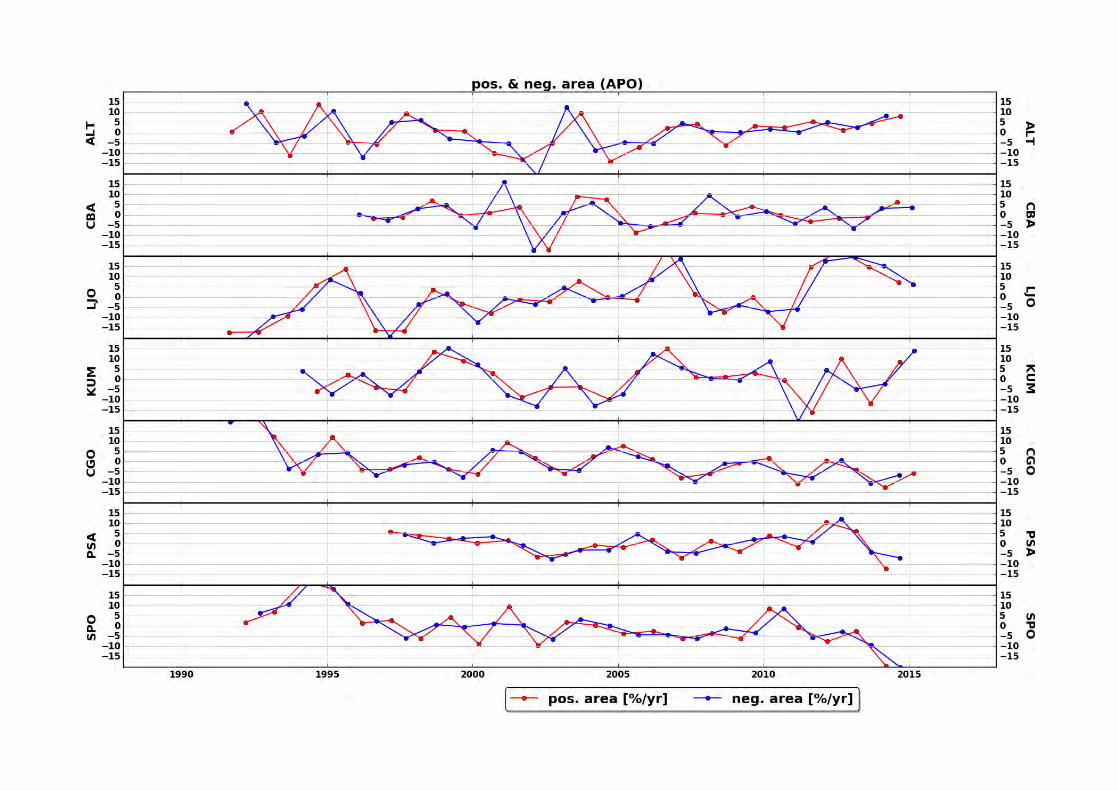
Areas
Pos. area
Neg. area

O2 out > O2 in
0.43 ± 0.30 %/yr [p = 0.17]0.36 ± 0.34 %/yr [p = 0.31]
1.04± 0.46 %/yr [p = 0.04]1.21 ± 0.42 %/yr [p = 0.01]
Both fluxes increase!
-0.37± 0. 26 %/yr [p = 0.17]-0.40 ± 0.22 %/yr [p = 0.09]
-0.44± 0.31 %/yr [p = 0.17]-0.48 ± 0.23 %/yr [p = 0.05]
Both fluxes decrease!
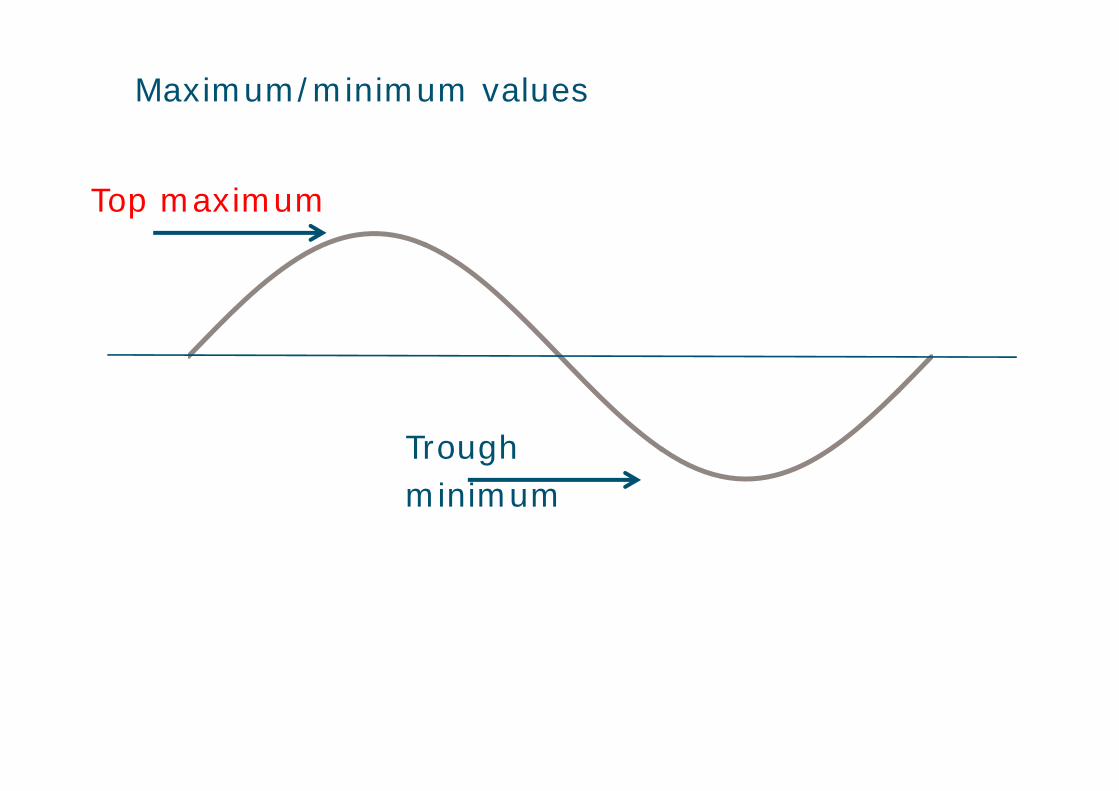
Maximum/minimum values
Top maximum
Trough minimum
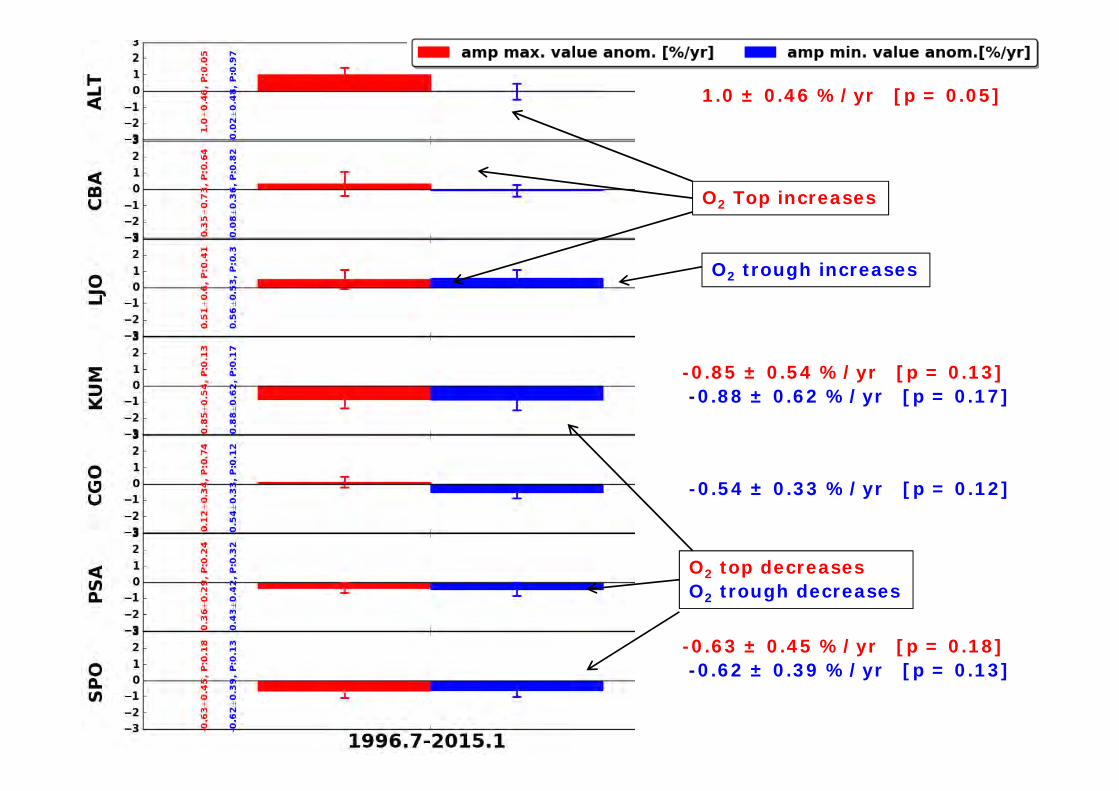
1.0 ± 0.46 %/yr [p = 0.05]
-0.85 ± 0.54 %/yr [p = 0.13]-0.88 ± 0.62 %/yr [p = 0.17]
-0.54 ± 0.33 %/yr [p = 0.12]
-0.63 ± 0.45 %/yr [p = 0.18]-0.62 ± 0.39 %/yr [p = 0.13]
O2 Top increases
O2 trough increases
O2 top decreases O2 trough decreases
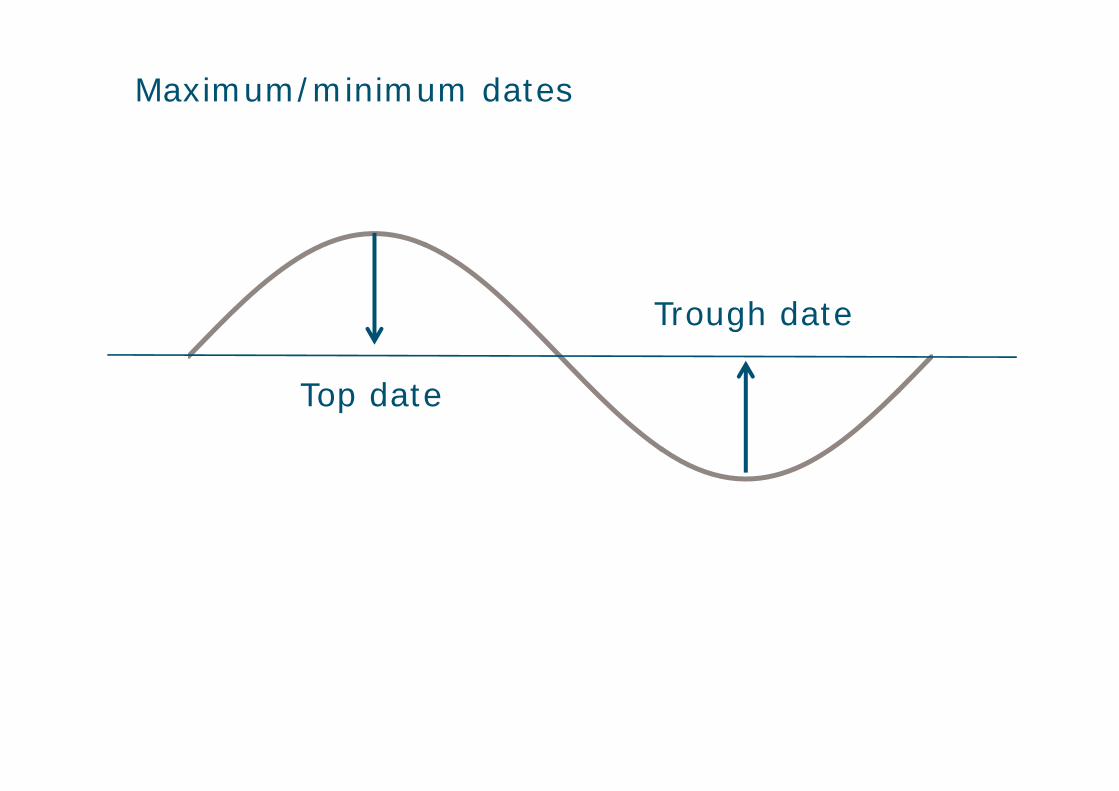
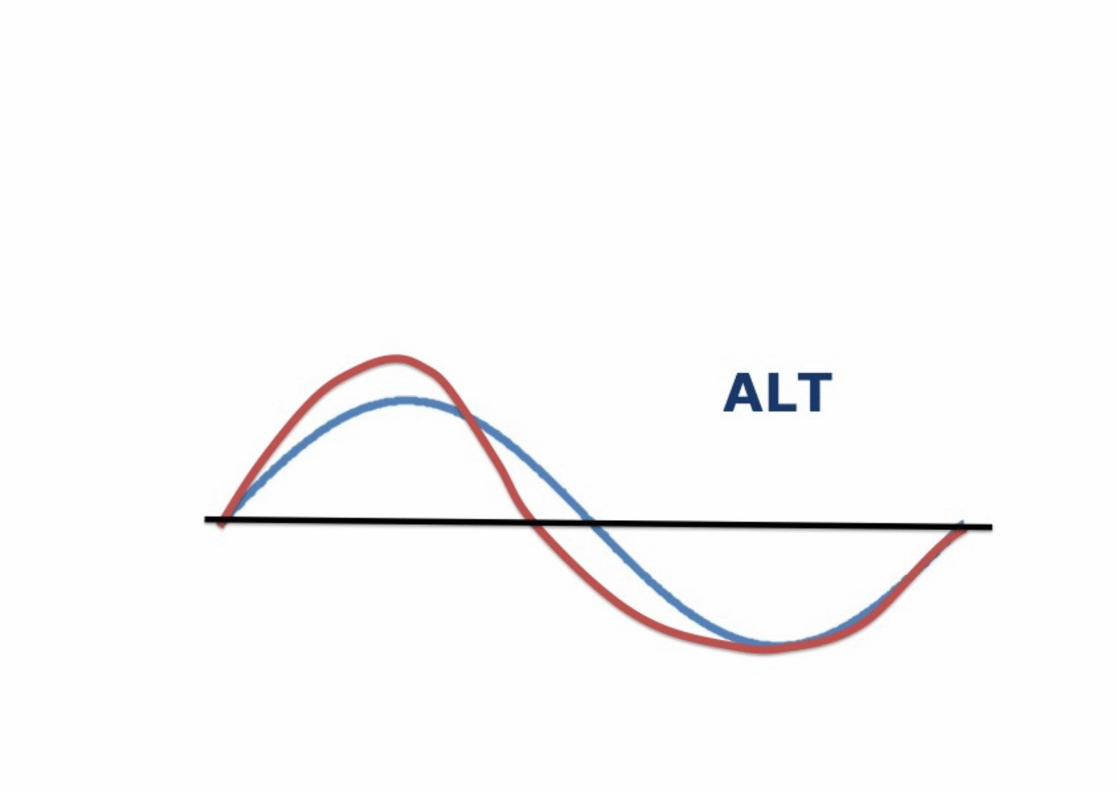
Maximum/minimum dates
Top date
Trough date

-1.36 ± 0.66 d/yr [p = 0.06]
Max O2 release (summer max.) is coming earlier in the north!
2.91 ± 0.91 d/yr [p = 0.01]
1.03 ± 0.42 d/yr [p = 0.03]
0.56 ± 0.30 d/yr [p = 0.09]
Max O2 release is coming Laterin the mid. and south!
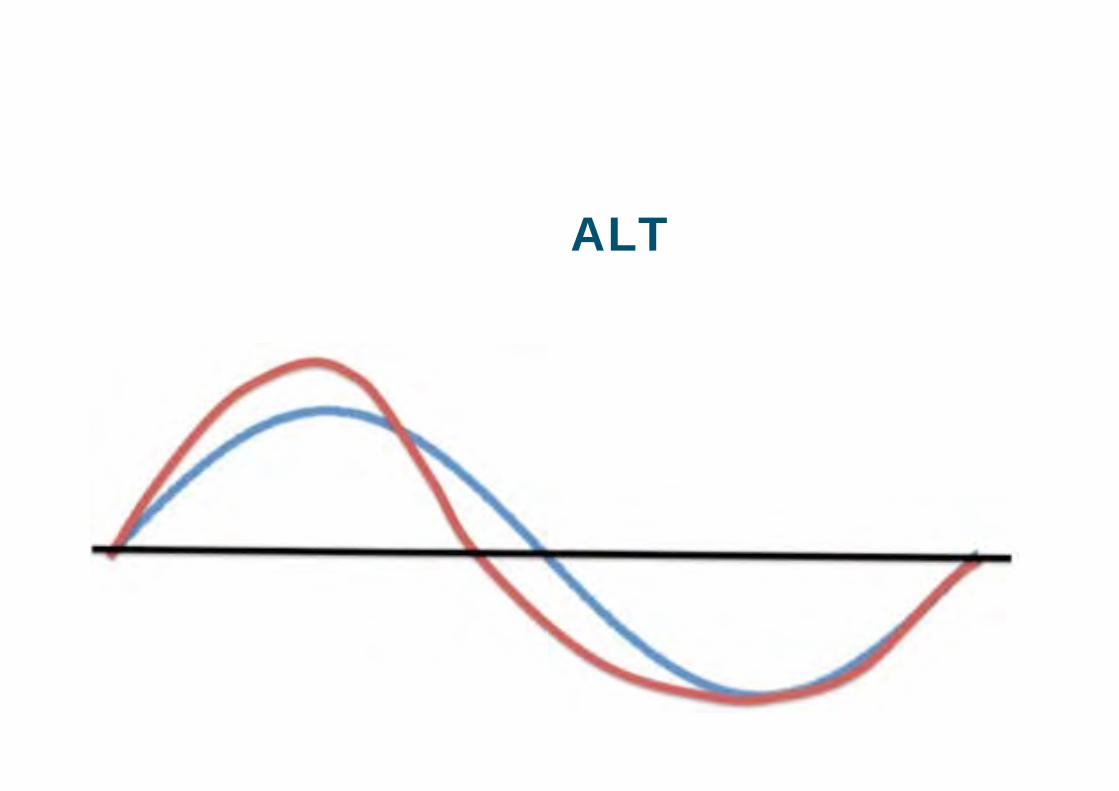
ALT
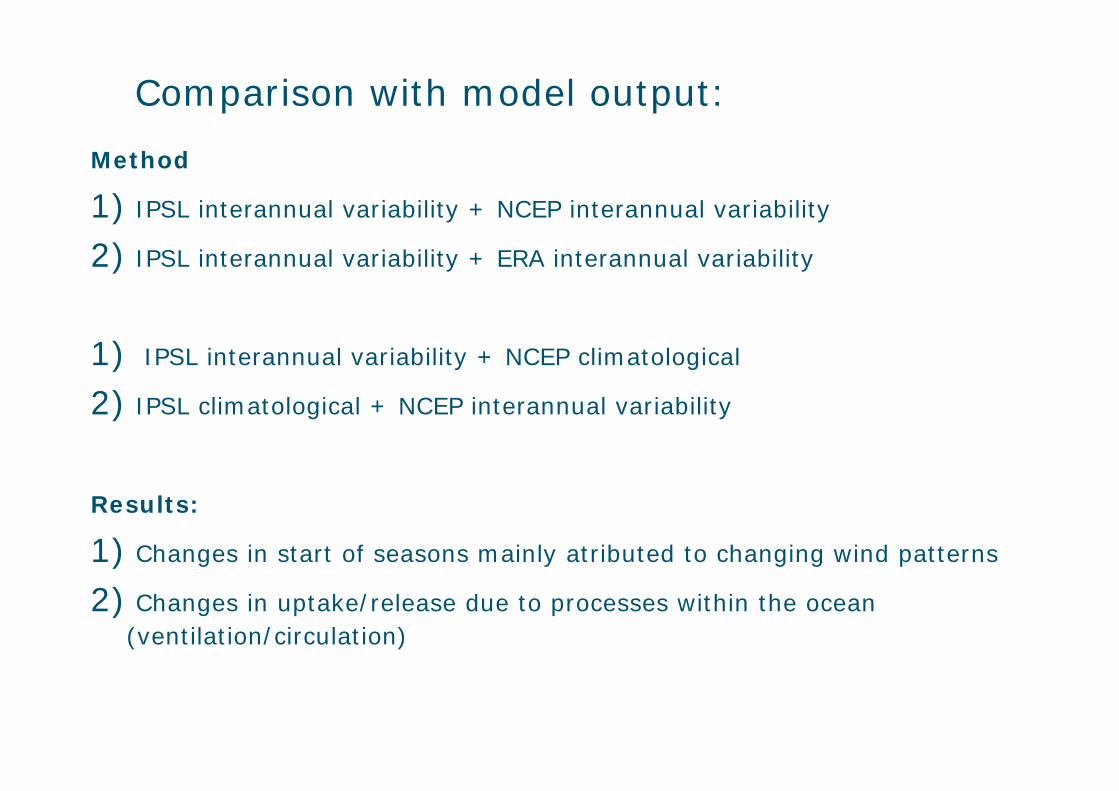
Method
1) IPSL interannual variability + NCEP interannual variability
2) IPSL interannual variability + ERA interannual variability
1) IPSL interannual variability + NCEP climatological
2) IPSL climatological + NCEP interannual variability
Results:
1) Changes in start of seasons mainly atributed to changing wind patterns
2) Changes in uptake/release due to processes within the ocean (ventilation/circulation)
Comparison with model output:

Preliminary conclusions :
North:
Winter comes earlier
Both uptake and release increase
[->wind patterns]
South:
Winter and summer come earlier
Both uptake and release decrease
[->ocean circulation/solubility/net production]
Differences are small but net effect: suggest net O2 release
Questions ?

Additional slides

Atmospheric measurements of O2 and CO2
suggests increasing oceanic respiratory disorder
Sander van der Laan1
Andrew C. Manning1, Laure Resplandy2, Laurent Bopp3, Penelope A. Pickers1, Ingrid T. van der Laan-Luijkx4 and Ralph F. Keeling2
1: University of East Anglia, Norwich, United Kingdom.2: Scripps Institution of Oceanography, La Jolla, USA.3: Laboratoire des Sciences du Climat et de l’Environnement, Gif sur Yvette, France.4: Meteorology and Air Quality Group, Wageningen, the Netherlands.
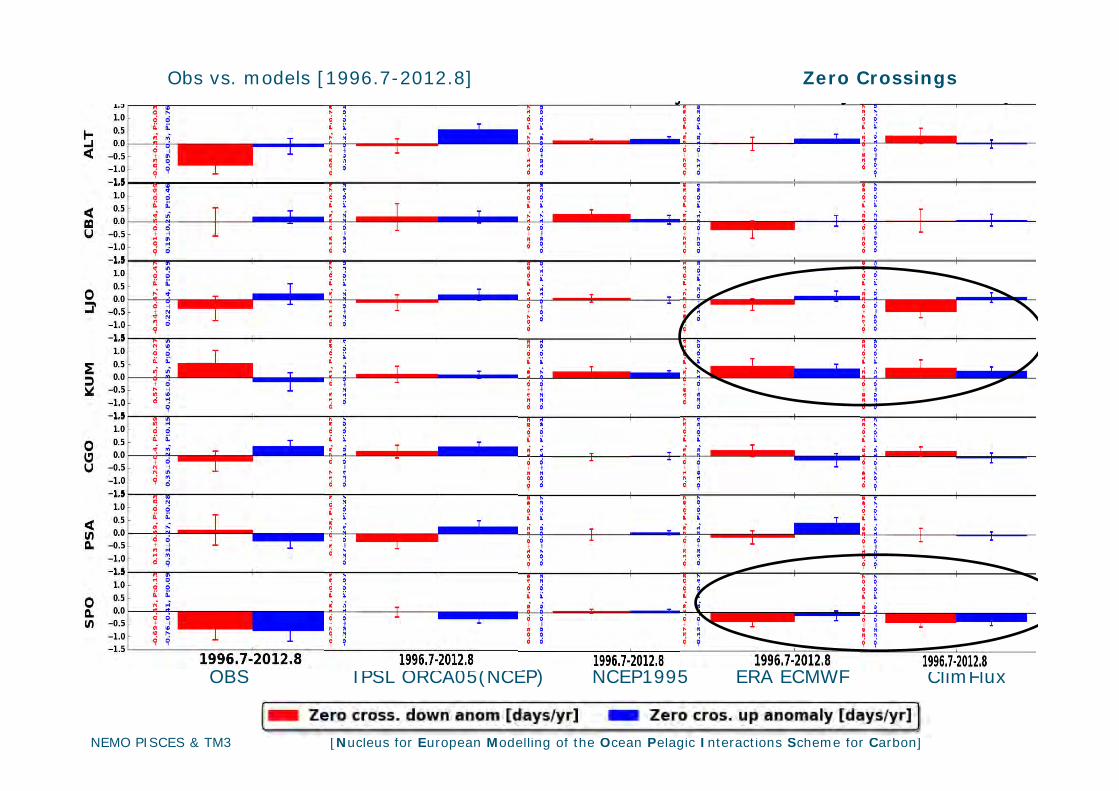
Obs vs. models [1996.7-2012.8] Zero Crossings
OBS IPSL ORCA05(NCEP) NCEP1995 ERA ECMWF ClimFlux
NEMO PISCES & TM3 [Nucleus for European Modelling of the Ocean Pelagic Interactions Scheme for Carbon]
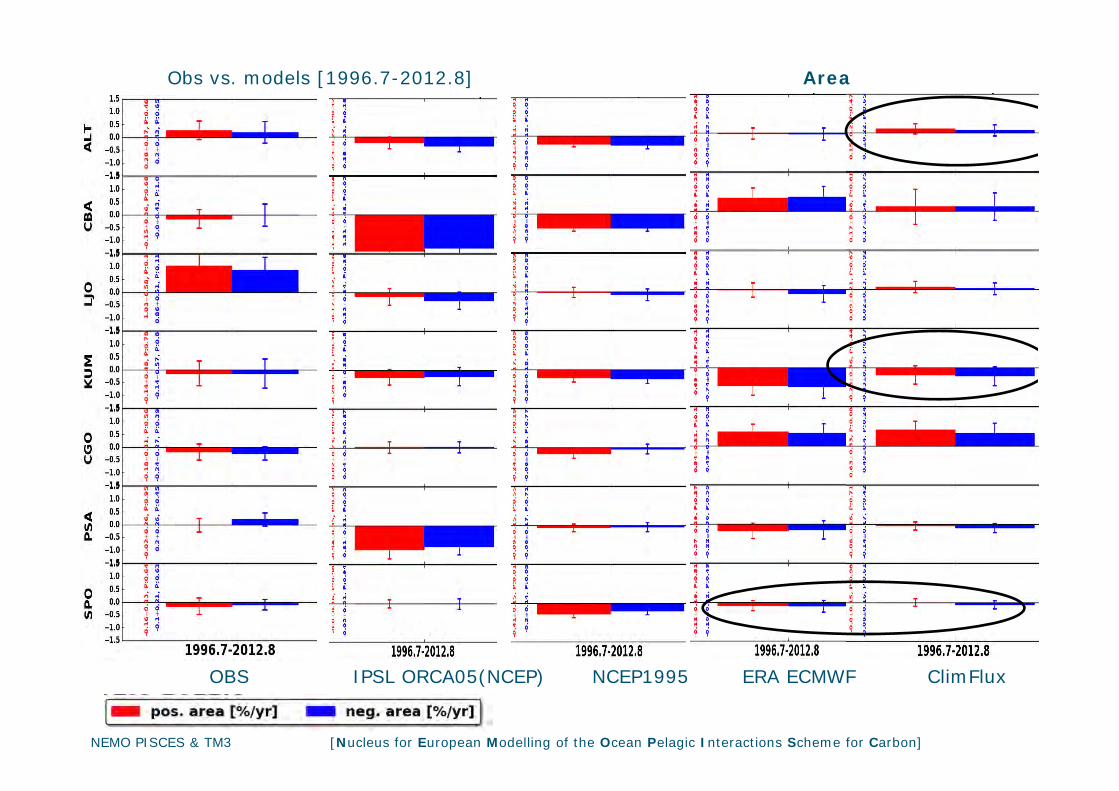
Obs vs. models [1996.7-2012.8] Area
OBS IPSL ORCA05(NCEP) NCEP1995 ERA ECMWF ClimFlux
NEMO PISCES & TM3 [Nucleus for European Modelling of the Ocean Pelagic Interactions Scheme for Carbon]
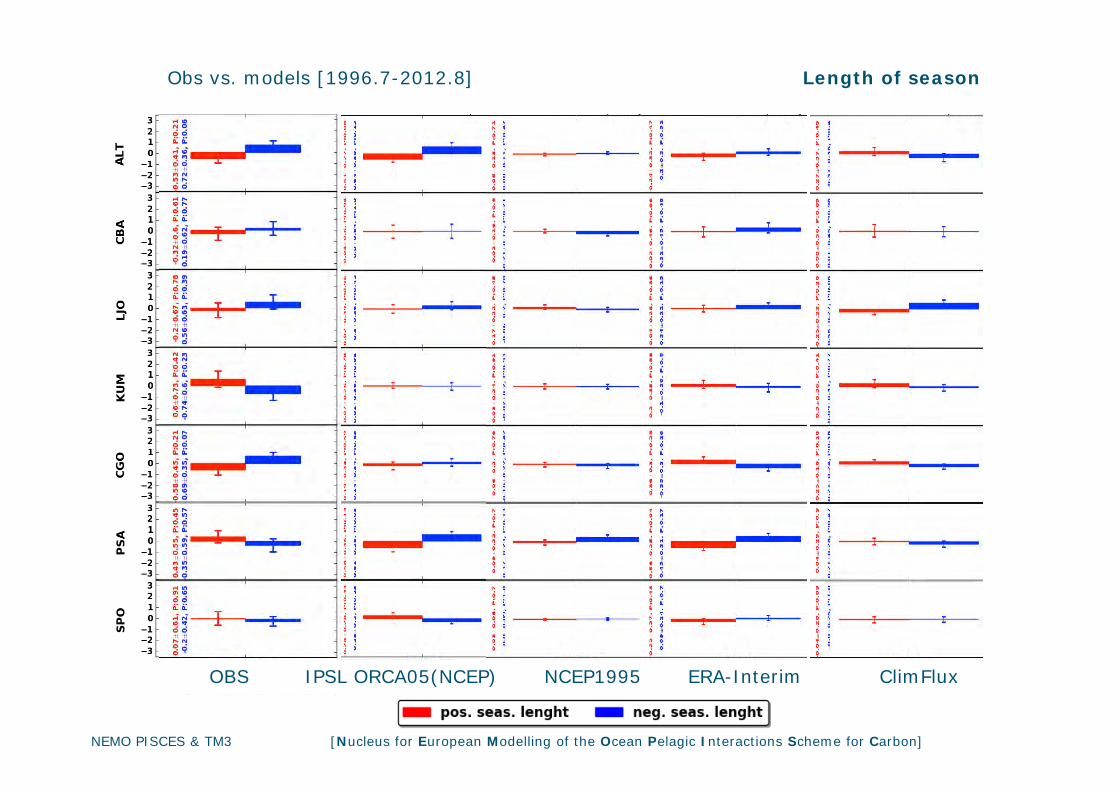
NEMO PISCES & TM3 [Nucleus for European Modelling of the Ocean Pelagic Interactions Scheme for Carbon]
OBS IPSL ORCA05(NCEP) NCEP1995 ERA-Interim ClimFlux
Obs vs. models [1996.7-2012.8] Length of season

Introduction
UP
Down
Piao et al. (Nature, 2008) found land biosphere climate response, from atmospheric CO2 measurements (trend in ‘zero crossing’).

Is it related ?
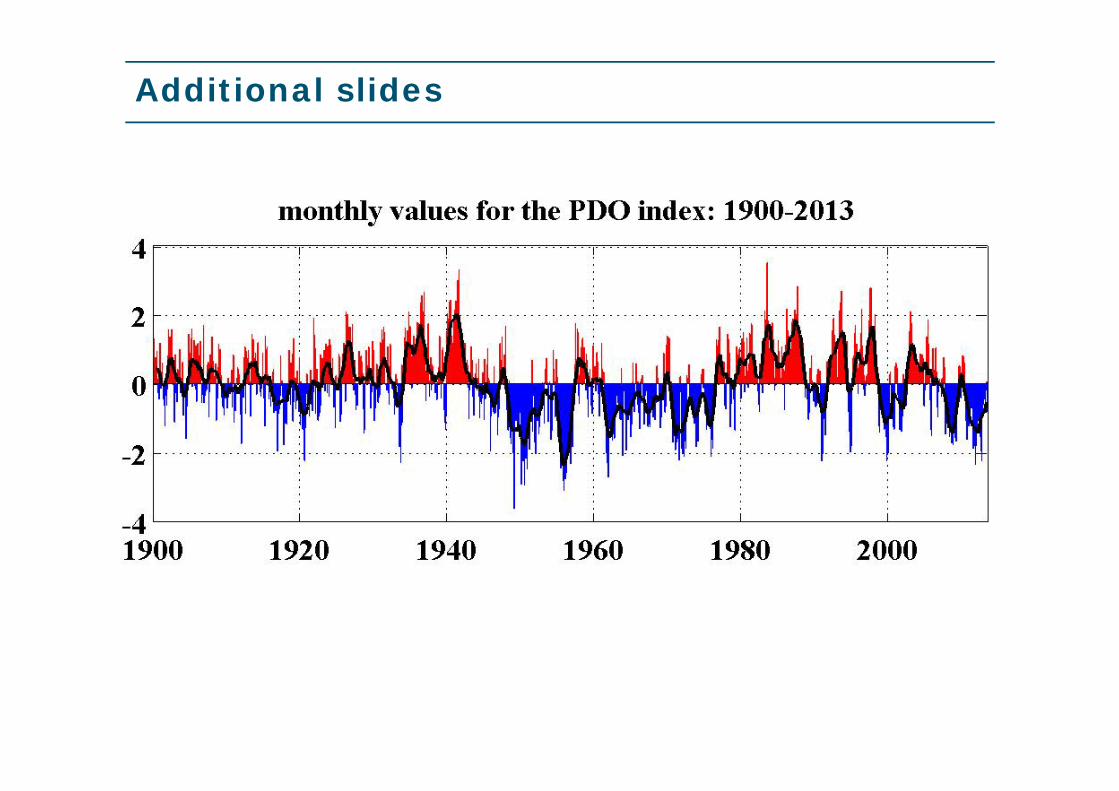
Lanschutzer et al 2015, Science
Additional slides
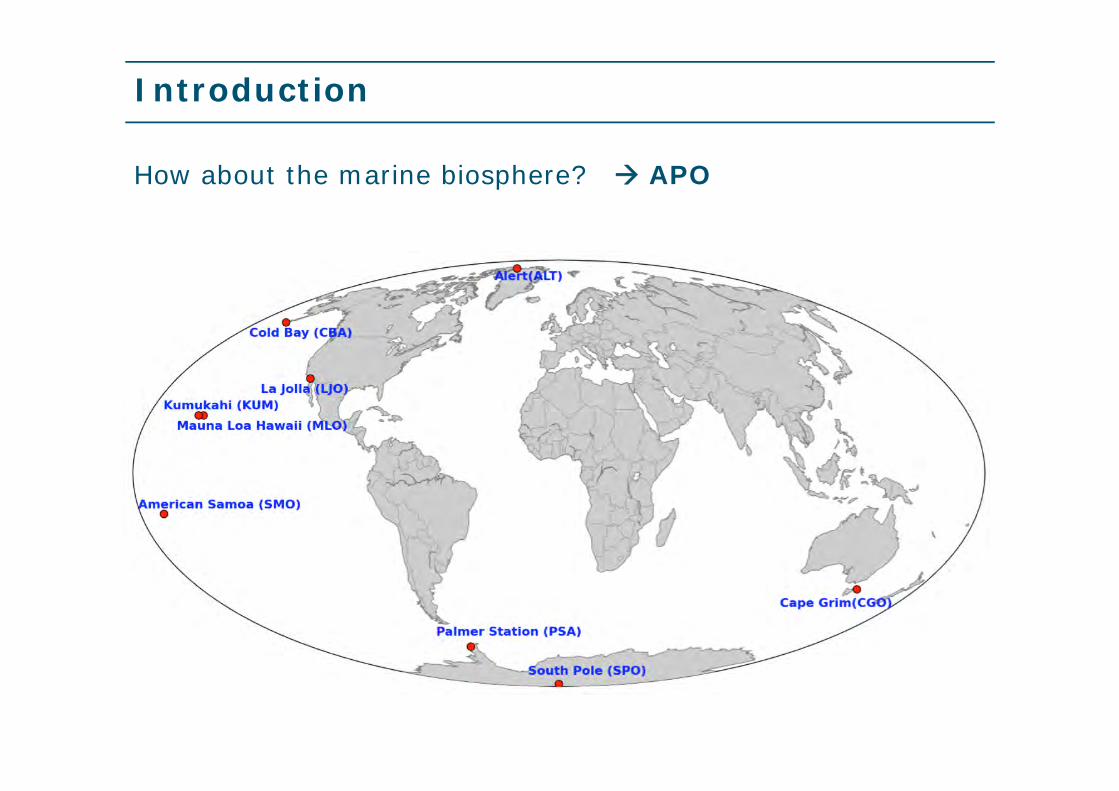
Introduction
How about the marine biosphere? APO
ALT
CBA
CGO
LJO
KUM
PSA
SPO