At the helm of IDBI MF - IDBI Mutual · om the current set of companies in the Ni y Index have been...
12
JUNE 2011 A total of about 37 companies om the current set of companies in the Niſty Index have been part of the Index since 2001. e companies, whose returns are given in the table above, are the best performers (over a 10 year period) in the Index and have outperformed their other long lasting peers, including heavyweights like Reliance Industries which has given a 20.2% CAGR over the 10 year period. is reflects the inherent strength of these companies, their growth potential and their ability to maintain their market capitalization. Top Performing Index Constituents in last 10 years Source: Bloomberg; As of 31st May, 2011 Company 10 Yr CAGR Sesa Goa 68.8% Jindal Steel & Power 66.1% Kotak Mahindra Bank 55.4% Siemens India 45.2% Axis Bank 42.8% Sterlite Industries 39.4% Source: Bloomberg Source: Bloomberg e S&P Niſty has performed consistently well over the years. In the last 10 years, the Index has delivered a CAGR of 16.9%, which is one of the best in the world. is means that ` 1,000 invested in the Niſty Index 10 years ago would have returned ` 4,766 today. It has not only fared better than the markets of the developed world, but has also outperformed most of its developing market peers. Niſty Performance Comparison Vs Peers Source: Bloomberg; As of 31st May, 2011 Mr. Debasish Mallick has taken charge as Managing Director & Chief Executive Officer of IDBI Asset Management Ltd. from 19th May, 2011. A post graduate in Economics and a Certified Associate of Indian Institute of Bankers, Mr. Mallick has nearly three decades of experience in the Banking industry. Immediately prior to joining the AMC, he was head of Personal Banking Business for IDBI Bank Ltd. (West Zone) which included distribution of Mutual Fund products. He also has long experience in the areas of Corporate Banking, International Banking, Resource Mobilization and Treasury among others. Mr. Debasish Mallick At the helm of IDBI MF Developing countries Developed countries USA Japan Brazil Russia India China Korea Malaysia Bovespa RTSI Niſty Shanghai Kospi Bursa Malaysia CAGR 0.7% -3.1% 16.0% 24.6% 16.9% 2.2% 13.3% 10.5% (10 Yrs)
Transcript of At the helm of IDBI MF - IDBI Mutual · om the current set of companies in the Ni y Index have been...

JUNE 2011
A total of about 37 companies om the current set of companies in the
Niy Index have been part of the Index since 2001. �e companies,
whose returns are given in the table above, are the best performers
(over a 10 year period) in the Index and have outperformed their
other long lasting peers, including heavyweights like Reliance
Industries which has given a 20.2% CAGR over the 10 year period.
�is re�ects the inherent strength of these companies, their growth
potential and their ability to maintain their market capitalization.
Top Performing Index Constituentsin last 10 years
Source: Bloomberg; As of 31st May, 2011
Company 10 Yr CAGR
Sesa Goa 68.8%
Jindal Steel & Power 66.1%
Kotak Mahindra Bank 55.4%
Siemens India 45.2%
Axis Bank 42.8%
Sterlite Industries 39.4%
Source: Bloomberg
Source: Bloomberg
�e S&P Niy has performed consistently well over the years. In the
last 10 years, the Index has delivered a CAGR of 16.9%, which is one
of the best in the world. �is means that ` 1,000 invested in the Niy
Index 10 years ago would have returned ` 4,766 today. It has not
only fared better than the markets of the developed world, but has also
outperformed most of its developing market peers.
Ni�y Performance Comparison Vs Peers
Source: Bloomberg; As of 31st May, 2011
Mr. Debasish Mallick has taken charge as Managing Director &Chief Executive O�cer of IDBI Asset Management Ltd. from 19th May, 2011. A post graduate in Economics and a Certi�ed Associate of Indian Institute of Bankers, Mr. Mallick has nearly three decades of experience in the Banking industry. Immediately prior to joining the AMC, he was head of Personal Banking Business for IDBI Bank Ltd. (West Zone) which included distribution of Mutual Fund products. He also has long experience in the areas of Corporate Banking, International Banking, Resource Mobilization and Treasury among others.
Mr. Debasish MallickAt the helm of IDBI MF
Developing countriesDeveloped countries
USA Japan Brazil Russia India China Korea Malaysia Bovespa RTSI Ni�y Shanghai Kospi Bursa Malaysia
CAGR 0.7% -3.1% 16.0% 24.6% 16.9% 2.2% 13.3% 10.5%(10 Yrs)


3
Inflation Check: According to the CSO, headline inflation which is based on wholesale prices stood at 8.66% in April 2011 lower than the 9.02% in March, while the CPI, based on consumer prices, accelerated to 9.41% in April 2011 compared with 8.82% in March. However this moderation in inflation is likely to be short-lived and is expected to increase due to the impending increase in diesel prices. The CSO has also upward revised the February inflation number to 9.54% from 8.31% previously.
Index of Industrial Production: According to the CSO, Industrial output rose to 7.3% in March 2011 versus 3.65% in February. This growth was driven by capital goods at 12.9% (YoY) and consumable durables at 12.3% (YoY). However the full year 2011 industrial output grew by a slower 7.8%, versus the 10.8% achieved during the previous fiscal.
March Quarter Results: The March quarter results so far has been a mixed bag. The capital goods sector has reported strong results while the auto sector has been disappointing, especially the results from the major players. But optimistic outlook from companies like L&T and BHEL have kept the market in fair trading range despite high crude prices and high inflation/interest rate worries. Announcement of an increase in the subsidy burden for the oil marketing companies (OMCs), coupled with rumors on withdrawal of export incentive scheme (DEPP), has however acted as dampeners to investor sentiments.
Market Summary: The key benchmark index, the Nifty, declined by ~2.29% mainly driven by lacklustre March quarter results combined with expectations of higher inflation. The market was further impacted by weak global cues including weak economic data from Japan, the Euro debt crisis and crude price movements. Among the sector indices, the BSE Auto index was down sharply by ~6.56% due to concerns over increasing interest rates coupled with a weak quarterly performance by the auto majors. The BSE Oil & Gas index also remained weak due to the increase subsidy burden on the OMCs. Positive news flow in the Healthcare sector increased the confidence of the investors and resulted in a gain of ~2.57% for the month of May.
-0.10%
-4.81%
-4.08%
-5.50%
-2.44%
-6.56%
2.57%
-4.02%
-4.14%
0.42%
2.74%
2.44%
-2.28%
-8.00% -6.00% -4.00% -2.00% 0.00% 2.00% 4.00%
BSE Realty
BSE Metal
BSE Bank
BSE Smallcap
BSE IT
BSE Auto
BSE Healthcare
BSE Power
BSE Oil & Gas
BSE Cap Goods
BSE FMCG
BSE Con Durables
BSE Technology
Major Indices Monthly Change (%) Apr'11-May'11
Global financial markets were once again in a state of uncertainty with renewed fears of default by Greece, as the European Union (EU) & International Monetary Fund hesitate to pay out the next tranche of bail-out funds in June. Greece has failed to reduce its fiscal deficit numbers sufficiently in line with the stated terms of the EU bailout. Currently, the various stakeholders are trying to reach a consensus so as to avoid a full-blown crisis that may likely be caused by a Greek sovereign default.
US macro data also depicted lower growth momentum as consumer confidence dipped and initial jobless claims rose. Also, forecast for emerging market powers like China and India has been lowered in light of their battle against inflation and the ensuing interest rate hikes. Equities and commodities have been hammered for the most part of the month as global funds found their way into safer assets.
Systemic liquidity in India progressively tightened through the month, with LAF registering a month-high deficit of Rs.75,800 crores on the back of government bond issues. Yields on 3-month Certificates of Deposits (CD’s) hardened from 8.40% to 9.70%, towards the end of the month. 1-year CD yields closed the month at 10.00%, up from 9.75%. RBI, in its monetary policy review on May 3, raised policy rates by 50 bps, contrary to market expectations of 25 bps. This significantly hawkish stance, combined with renewed inflationary expectations, caused flattening of the money market curve. Led by the inflation concerns
and potential widening of fiscal deficit due to rising crude prices, yields on the benchmark 10-year G-sec, 7.80% 2021, raced to a high of 8.46% before closing the month at 8.41%.
WPI for April corrected to 8.66% (YoY) from 9.02% in March (against market expectations of 8.50%) due to fall in food price inflation. Weekly food inflation fell further to 8.55% for the week ended May 14, from 8.76% for the week ended April 16, after touching an 18-month low at 7.47% for May 7. The fuel and power index fell to 12.11% from 12.53%, mainly due to electricity and aviation turbine fuel. Primary articles’ inflation also fell to 11.60% v/s 12.08%.
IIP growth for March improved to 7.30% YoY (much higher than market expectation of 4%), from a revised figure of 3.7% for last month, due to growth in capital goods. However, the erratic ‘capital goods’ data series provides little comfort on the growth momentum. The HSBC Purchasing Managers’ Index (PMI), an indicator of manufacturing activity in India, eased slightly in May due to rising interest rates and commodity prices, but the India growth story continues to be robust on the back of ‘above-long term’ output levels and strong consumption patterns.
Source: Bloomberg News, IDBI Asset Management Ltd. - Internal Research
Equity Market Overview
Fixed Income Overview
Source : Bloomberg

4
IDBI Nifty Index Fund(An open-ended passively managed equity scheme tracking the S&P CNX Nifty Index [Total Returns Index])
Scheme Performance as on 31/05/2011 (in %)1 Month 3 Months 6 Months Since Inception (25-Jun-2010)
IDBI Nifty Index Fund (Growth) -3.29 4.05 -5.64 4.76S&P Nifty Index - TRI -3.15 4.49 -4.85 6.35Source: Accord FintechDisclaimer: Returns are absolute and pertains to growth plan. Past Performance may or may not be sustained in the future.
Dividend HistoryDate Dividend
(in `)Cum Dividend NAV*
(in `)Ex Dividend NAV
(in `)IDBI Nifty Index Fund - Dividend15th Oct 2010 0.4000 11.5740 10.96281st Sept 2010 0.1200 10.2883 10.2886
Past performance may or may not be sustained in the future. After the payment of dividend, the per unit NAV falls to the extent of the dividend payout and distribution taxes, if any. * NAV of the previous business day.
Sector Classification
Scheme FeaturesInvestment objective:The investment objective of the scheme is to invest only in and all the stocks comprising the S&P CNX Nifty Index in the same weights of these stocks as in the Index with the objective to replicate the performance of the Total Returns Index of S&P CNX Nifty index. The scheme may also invest in derivatives instruments such as Futures and Options linked to stocks comprising the Index or linked to the S&P CNX Nifty index. The scheme will adopt a passive investment strategy and will seek to achieve the investment objective by minimizing the tracking error between the S&P CNX Nifty index (Total Returns Index) and the Scheme.Benchmark:S&P CNX Nifty Index (Total Returns Index)Fund Manager: Mr. Gautam KaulInception Date: 25th June, 2010
NAV (as on 31st May 2011): Growth: ` 10.4760Dividend: ` 9.9912Plans:• GrowthPlan• DividendPlan - Reinvestment - Payout
Asset Allocation Pattern:
InstrumentIndicative allocation
(% of total assets) Risk ProfileMin. Max.
Stocks in the S&P CNX Nifty Index and derivative instruments linked to the S&P CNX Nifty Index
95% 100% Medium to High
Cash and Money Market Instruments including money at call but excluding Subscription and Redemption Cash Flow
0% 5% Low to Medium
Min. Application Amount:New Purchase – ` 5000/- and in multiples of ` 1/- thereafterMin. Addl. Investment:` 1000/- and in multiples of ` 1/- thereafterLoad Structure:Entry Load: Nil. Exit Load:1% for exit (repurchase / switch-out / SWP), on or before 1 year from the date of allotment.For SIP1% of Exit (repurchase / switch-out), on or before 1 year from the date of allotment of each installment. SIP: Monthly Option: ` 500/- per month for a minimum period of 12 months or ` 1,000/- per month for a minimum period of six months. Quarterly Option: ` 1,500/- per quarter for a minimum period of 4 quarters.Investments above the minimum amount mentioned must be made in multiples of ` 1/-.SWP:Minimum balance in the Scheme should be ̀ 25,000/- at the time of enrollment for SWP. Minimum amount for each withdrawal should be ` 1,000/- and in multiples of ` 1/- thereafter for a minimum period of 6 months.STP:Available
Security Name % To Net
Assets*EQUITY 98.18Reliance Industries Ltd. 9.46Infosys Technologies Ltd. 7.92ICICI Bank Ltd. 7.36ITC Ltd. 6.06HDFC Ltd. 5.24Larsen & Toubro Ltd. 5.16HDFC Bank Ltd. 5.03State Bank of India Ltd. 3.50Tata Consultancy Services Ltd. 3.46Bharti Airtel Ltd. 2.66Tata Steel Ltd. 2.31Tata Motors Ltd. 2.26Oil & Natural Gas Corpn Ltd. 2.24Axis Bank Ltd. 1.94Hindustan Unilever Ltd. 1.84Mahindra & Mahindra Ltd. 1.83Bharat Heavy Electricals Ltd. 1.81Hindalco Industries Ltd. 1.50Jindal Steel & Power Ltd. 1.49Sterlite Industries ( India ) Ltd. 1.44Wipro Ltd. 1.33NTPC Ltd. 1.26Dr. Reddy's Laboratories Ltd. 1.20Gas Authority of India Ltd. 1.18Tata Power Company Ltd. 1.18Bajaj Auto Ltd. 1.07
Security Name % To Net
Assets*Sun Pharmaceuticals Industries Ltd. 1.05Hero Honda Motors Ltd. 1.04Infrastucture Development Finance Co. Ltd. 1.01
Cipla Ltd. 0.98Maruti Suzuki India Ltd. 0.96Kotak Mahindra Bank Ltd. 0.92Punjab National Bank Ltd. 0.86Grasim Industries Ltd. 0.86Power Grid Corporation of India Ltd. 0.85Cairn India Ltd. 0.74HCL Technologies Ltd. 0.73Ambuja Cements Ltd. 0.67Sesa Goa Ltd. 0.65Jaiprakash Associates Ltd. 0.59ACC Ltd. 0.59DLF Ltd. 0.51Ranbaxy Laboratories Ltd. 0.50Steel Authority of India Ltd. 0.49Bharat Petroleum Ltd. 0.49Reliance Infrastructure Ltd. 0.47Siemens Ltd. 0.44Reliance Power Ltd. 0.38Reliance Communications Ltd. 0.35Reliance Capital Ltd. 0.33Cash Receivables 1.82Total 100.00
Portfolio as on 31/05/2011
* Rounded off to the nearest two digits after the decimal point.
Please refer to the ‘Important Note’ in SID for disclaimers of S&P and IISL with respect to the usage of S&P CNX Nifty Index
7.16%
19.61%
1.84%
0.51%
8.77%
4.28%
6.59%1.18%7.41%0.65%
2.94%
2.98%
9.95%
3.73%
4.13%
13.44%
3.01%
AutomobilesBanksCementConstruction ProjectConsumer Non DurablesFerrous MetalsFinanceGasIndustrial Capital GoodsMinerals/MiningNon-Ferrous Metals OilPetroleum ProductsPharmaceuticalsPowerSo�wareTelecom-Services
Average AUM for the month of May’ 2011 : ` 137.99 Crs.

5
IDBI Nifty Junior Index Fund(An open-ended passively managed equity scheme tracking the CNX Nifty Junior Index (Total Returns Index)
Scheme Performance as on 31/05/2011 (in %)1 Month 3 Months 6 Months Since Inception (20-Sept-2010)
IDBI Nifty Junior Index (G)* 0.47 8.83 -7.92 -10.60CNX Nifty Junior-TRI 0.60 9.60 -7.08 -9.67*Source: Accord FintechDisclaimer: Returns are absolute and pertains to growth plan. Past Performance may or may not be sustained in the future.
Sector Classification
Scheme FeaturesInvestment objective:The investment objective of the scheme is to invest only in and all the stocks comprising the CNX Nifty Junior Index in the same weights of these stocks as in the Index with the objective to replicate the performance of the Total Returns Index of CNX Nifty Junior Index. The scheme may also invest in derivatives instruments such as Futures and Options linked to stocks comprising the Index or linked to the CNX Nifty Junior Index as and when the derivative products on the same are made available. The scheme will adopt a passive investment strategy and will seek to achieve the investment objective by minimizing the tracking error between the CNX Nifty Junior Index (Total Returns Index) and the Scheme.Benchmark:CNX Nifty Junior Index (Total Returns Index)Fund Manager: Mr. Gautam KaulInception Date: 20th September, 2010
NAV (as on 31st May 2011): Growth: ` 8.9404Dividend: ` 8.9404Plans:• GrowthPlan• DividendPlan - Reinvestment - Payout
Asset Allocation Pattern:
InstrumentIndicative allocation
(% of total assets) Risk ProfileMin. Max.
Stocks in the CNX Nifty Junior Index and derivative instruments linked to the CNX Nifty Junior Index as and when the derivative products are made available on the same
95% 100% Medium to High
Cash and Money Market Instruments including money at call but excluding Subscription and Redemption Cash Flow
0% 5% Low to Medium
Min. Application Amount:New Purchase – ` 5000/- and in multiples of ` 1/- thereafter
Min. Addl. Investment:` 1000/- and in multiples of ` 1/- thereafter
Load Structure:Entry Load: Nil. Exit Load:1% for exit ( repurchase/switch-out/SWP/STP) on or before 1 year from the date of allotment.For SIP1% for exit(repurchase/switch-out/SWP/STP) on or before 1 year from the date of allotment of each installment.
SIP: Monthly Option: ` 500/- per month for a minimum period of 12 months or ` 1,000/- per month for a minimum period of six months. Quarterly Option: ` 1,500/- per quarter for a minimum period of 4 quarters.Investments above the minimum amount mentioned must be made in multiples of ` 1/-.
SWP:Minimum balance in the Scheme should be ̀ 25,000/- at the time of enrollment for SWP. Minimum amount for each withdrawal should be ` 1,000/- and in multiples of ` 1/- thereafter for a minimum period of 6 months.
STP:Available
Security Name % To Net Assets*
EQUITY 99.30Coal India Ltd. 7.58Adani Enterprises Ltd. 4.51Bank of Baroda Ltd. 4.26Asian Paints Ltd. 4.24Lupin Ltd. 3.25JSW Steel Ltd. 3.05Crompton Greaves Ltd. 2.96UltraTech Cement Ltd. 2.93Glaxosmithkline Pharmaceuticals Ltd. 2.86Shriram Transport Finance Company Ltd. 2.74
United Spirits Ltd. 2.74Titan Industries Ltd. 2.71IndusInd Bank Ltd. 2.67Bank of India Ltd. 2.47Canara Bank Ltd. 2.28Zee Entertainment Enterprises Ltd. 2.28The Federal Bank Ltd. 2.23Exide Industries Ltd. 2.15Mundra Port and Special Economic Zone Ltd. 2.13
Yes Bank Ltd. 2.10Union Bank of India Ltd. 2.09Rural Electrification Corporation Ltd. 2.04LIC Housing Finance Ltd. 2.03Tata Chemicals Ltd. 1.98Cummins India Ltd. 1.96Hindustan Petroleum Corporation Ltd. 1.84
Security Name % To Net Assets*
Colgate Palmolive (India) Ltd. 1.75
United Phosphorus Ltd. 1.62Container Corporation of India Ltd. 1.54Aditya Birla Nuvo Ltd. 1.46IDBI Bank Ltd. 1.36Bharat Forge Ltd. 1.26Glenmark Pharmaceuticals Ltd. 1.26Torrent Power Ltd. 1.23Housing Development and Infrastructure Ltd. 1.20
GMR Infrastructure Ltd. 1.19The Indian Hotels Co. Ltd. 1.19Oracle Financial Services Software Ltd. 1.07MphasiS Ltd. 1.00Andhra Bank Ltd. 0.99Ashok Leyland Ltd. 0.98Industrial Finance Corporation Ltd. 0.96Bharat Electronics Ltd. 0.94Indian Overseas Bank Ltd. 0.88Biocon Ltd. 0.72Power Finance Corporation Ltd. 0.70Tech Mahindra Ltd. 0.68Syndicate Bank Ltd. 0.60Punj Lloyd Ltd. 0.42Patni Computer Systems Ltd. 0.25India Bulls Wholesale Services Ltd.# 0.00Cash Receivables 0.70Total 100.00
Portfolio as on 31/05/2011
#Due to corporate action on India Bulls Real Estate Ltd., the scheme currently holds 6005 unlisted shares of Indiabulls Wholesale Services Ltd. (IWSL)* Rounded off to the nearest two digits after the decimal point.
Please refer to IISL disclaimer on page 10
3.13%
21.93%
2.93%
2.80%
12.90%
3.05%1.98%8.47%1.19%
3.90%3.22%
1.62%1.84%
8.08%
1.23%
3.00%
4.51%
3.67%2.28%
7.58%AutomobilesBanksCementConstruction ProjectConsumer Non DurablesFerrous MetalsFertilisersFinanceHotelsIndustrial Capital GoodsIndustrial ProductsPesticidesPetroleum ProductsPharmaceuticalsPowerSo�wareTradingTransportationMedia & EntertainmentMinerals/Mining
Average AUM for the month of May’ 2011 : ` 51.27 Crs.

6 * For rating disclaimers, please refer to page 10
Rated ‘CARE AAAf ’ by CARE* Rated ‘AAAf ‘ by CRISIL*IDBI Liquid Fund(An open-ended liquid scheme)
Scheme FeaturesInvestment objective:The investment objective of the Scheme will be to provide investors with high level of liquidity along with regular income for their investment. The Scheme will endeavour to achieve this objective through an allocation of the investment corpus in a low risk portfolio of money market and debt instruments.Benchmark:CRISIL Liquid Fund IndexFund Manager: Mr. Gautam KaulInception Date: 9th July, 2010
NAV (as on 31st May 2011): Growth ` 1066.8873Daily Dividend ` 1000.0000Weekly Dividend ` 1000.6877 Monthly Dividend ` 1001.3890
Plans:•GrowthOption•DividendOption - Daily Dividend - Weekly Dividend - Monthly DividendAsset Allocation Pattern:
InstrumentIndicative allocation
(% of total assets) Risk ProfileMin. Max.
Money market instruments with maturity/residual maturity up to 91 days
50% 100% Low
Debt instruments (including floating rate debt instruments and securitized debt)* with maturity/residual maturity/ interest rate resets up to 91 days
0% 50% Low to Medium
* Investment is securitized debt not to exceed 50% of the net assets of the Scheme. Investment in Derivatives will be up to 50% of the net assets of the Scheme. The Scheme does not propose to invest in foreign securities.
Min. Application Amount:New Purchase – ` 5000/- and in multiples of ` 1/- thereafterMin. Addl. Investment:` 1000/- and in multiples of ` 1/- thereafterLoad Structure:Entry Load: Not ApplicableExit Load : NilSIP: Monthly Option:` 500/- per month for a minimum period of 12 months or ` 1,000/- per month for a minimum period of 6 months Quarterly Option:` 1,500/- per quarter for a minimum period of 4 quarters. Investments above the minimum amount mentioned must be made in multiples of ` 1/-.SWP:Minimum balance in the Scheme should be ` 25,000/- at the time of enrollment for SWP. Minimum amount for each withdrawal should be ` 1,000/- and in multiples of ` 1/- thereafter for a minimum period of 6 months.STP:Available
Security Name Rating % To Net
Assets*CERTIFICATES OF DEPOSIT 58.08Central Bank of India Ltd. PR1+ 13.14UCO Bank Ltd. P1+ 8.55Oriental Bank of Commerce Ltd. P1+ 6.16Bank of India Ltd. P1+ 5.38Allahabad Bank Ltd. A1+ 4.75Punjab National Bank Ltd. PR1+ 3.17Union Bank of India Ltd. P1+ 3.17Allahabad Bank Ltd. P1+ 3.16Syndicate Bank Ltd. PR1+ 2.38Andhra Bank Ltd. PR1+ 2.37Canara Bank Ltd. P1+ 1.59Vijaya Bank Ltd. PR1+ 1.58Canara Bank Ltd. PR1+ 0.79Vijaya Bank Ltd. A1+ 0.79Corporation Bank Ltd. P1+ 0.79ING Vysya Bank Ltd. P1+ 0.16Punjab National Bank Ltd. P1+ 0.16COMMERCIAL PAPERS 28.37SBI Global Factors Ltd. P1+ 5.07Srei Equipment Finance Pvt. Ltd. A1+ 4.28
Security Name Rating % To Net
Assets*Hindalco Industries Ltd. P1+ 3.00Tata Motors Finance Ltd. A1+ 1.59Aditya Birla Finance Ltd. A1+ 1.59L & T Finance Ltd. PR1+ 1.59Infrastructure Leasing and Finance Ltd. PR1+ 1.59
Mahindra & Mahindra Fin Ser Ltd. P1+ 1.58
JM Financial Services Pvt. Ltd. P1+ 1.43Redington (India) Ltd. A1+ 0.95Srei Infrastructure Finance Ltd. PR1+ 0.79Marico Ltd. P1+ 0.79Srei Infrastructure Finance Ltd. A1+ 0.79Reliance Capital Ltd. A1+ 0.79Kesoram Industries Ltd. PR1+ 0.79Kotak Mahindra Prime Ltd. P1+ 0.64Birla TMT Holdings Pvt Ltd. P1+ 0.63Sterlite Industries ( India ) Ltd. P1+ 0.32Hindustan Petroleum Corporation Ltd. P1+ 0.16
Cash "n" Call Assets & Receivables 13.54TOTAL 100.00
Portfolio as on 31/05/2011
Scheme Performance as on 31/05/2011 (in %)1 Week 2 Week 1 Month 3 Months 6 Months Since Inception (9-July-2010)
IDBI Liquid Fund (G) 8.45 8.48 8.45 8.48 8.18 7.49Crisil Liquid Fund Index 7.87 7.69 7.65 7.81 7.79 7.10
Source: Accord FintechDisclaimer: Returns are simple annualised and pertains to growth plan. Past Performance may or may not be sustained in the future.
Dividend HistoryDate Individual / HUF
Dividend (in `)Others Dividend
(in `)Cum Dividend
NAV* (in `)Ex Dividend NAV (in `)
IDBI Liquid Fund - Weekly Dividend29th May 2011 1.2785 1.2785 1001.3858 1000.220022nd May 2011 1.2723 1.2723 1001.3783 1000.220015th May 2011 1.2837 1.2837 1001.3955 1000.22008th May 2011 1.2510 1.2510 1001.3479 1000.22001st May 2011 1.2635 1.2635 1001.3639 1000.220024th April 2011 1.2281 1.2281 1001.1288 1000.220017th April 2011 1.2303 1.2303 1001.3420 1000.220010th April 2011 1.2053 1.2053 1001.3659 1000.22003rd April 2011 1.4347 1.4347 1001.5241 1000.2200IDBI Liquid Fund - Monthly Dividend25th May 2011 5.4614 5.4614 1006.7047 1000.000025th April 2011 5.7071 5.7071 1007.0221 1000.0000
Past performance may or may not be sustained in the future. After the payment of dividend, the per unit NAV falls to the extent of the dividend payout and distribution taxes, if any. * NAV of the previous business day.
* Rounded off to the nearest two digits after the decimal point.
Asset Profile
YTM : 8.55% Average Maturity : 17.69 daysModified Duration : 17.69 days Average AUM for the month of May’ 2011 : ` 3407.69 Crs.
Cash & Cash Equivalent 13.54%
A1+/P1+/PR1+86.46%

7
IDBI Ultra Short Term Fund(An open-ended debt scheme)
Scheme Performance as on 31/05/2011 (in %)
1 Week 2 Week 1 Month 3 Months 6 MonthsSince Inception (3-Sept-2010)
IDBI Ultra Short Term Fund (G) 0.17 0.36 0.78 2.26 4.32 6.08Crisil Liquid Fund Index 0.15 0.32 0.67 1.97 3.89 5.45
Source: Accord FintechDisclaimer: Returns are absolute and pertains to growth plan. Past Performance may or may not be sustained in the future.
Dividend HistoryDate Individual / HUF
Dividend (in `)Others Dividend
(in `)Cum Dividend
NAV* (in `)Ex Dividend NAV (in `)
IDBI Ultra Short Term Fund - Weekly Dividend31st May 2011 0.0149 0.0139 10.0169 10.002524th May 2011 0.0149 0.0139 10.0169 10.002618th May 2011 0.0150 0.0140 10.0170 10.004910th May 2011 0.0147 0.0137 10.0167 10.00243rd May 2011 0.0153 0.0143 10.0174 10.002526th April 2011 0.0148 0.0138 10.0168 10.002519th April 2011 0.0149 0.0139 10.0169 10.002413th April 2011 0.0156 0.0146 10.0178 10.00476th April 2011 0.0160 0.0149 10.0182 10.0046
IDBI Ultra Short Term Fund - Monthly Dividend26th May 2011 0.0644 0.0601 10.0731 10.002426th April 2011 0.0682 0.0636 10.0774 10.0025
Past performance may or may not be sustained in the future. After the payment of dividend, the per unit NAV falls to the extent of the dividend payout and distribution taxes, if any. * NAV of the previous business day.
Scheme FeaturesInvestment objective:The objective of the Scheme will be to provide investors with regular income for their investment. The Scheme will endeavour to achieve this objective through an allocation of the investment corpus in a diversified portfolio of money market and debt instruments with maturity predominantly between a liquid fund and a short term fund while maintaining a portfolio risk profile similar to a liquid fund.
Benchmark:CRISIL Liquid Fund Index
Fund Manager: Mr. Gautam Kaul
Inception Date: 3rd September, 2010
NAV (as on 31st May 2011): Growth ` 10.6079Daily Dividend ` 10.0000Weekly Dividend ` 10.0025Monthly Dividend ` 10.0144
Plans:•GrowthOption•DividendOption - Daily Dividend - Weekly Dividend - Monthly DividendAsset Allocation Pattern:
InstrumentIndicative allocation
(% of total assets)Risk
ProfileMin. Max.Money market instruments/debt instruments (including floating rate debt instruments and securitized debt*) with maturity/residual maturity up to 1 year (or 365 days)
80% 100% Low to Medium
Debt instruments (including floating rate debt instruments and securitized debt*) with duration/maturity/residual maturity above 1 year
0% 20% Medium
It is the intent of the Scheme to maintain the average maturity of the portfolio within a range of 30 days to 120 days under normal market conditions depending on the fund manager’s assessment of various parameters including interest rate environment, liquidity and macro-economic factors. However, the maturity profile of the scheme can undergo a change in case the market conditions warrant and at the discretion of the fund manager.*Investment in Securitized Debt not to exceed 50% of the net assets of the Scheme. Investment in Derivatives will be upto 50% of the net assets of the Scheme.
Min. Application Amount:New Purchase – ` 5000/- and in multiples of ` 1/- thereafterMin. Addl. Investment:` 1000/- and in multiples of ` 1/- thereafterLoad Structure:Entry Load: Not ApplicableExit Load : NilSIP: Monthly Option:` 500/- per month for a minimum period of 12 months or ` 1,000/- per month for a minimum period of 6 months Quarterly Option:` 1,500/- per quarter for a minimum period of 4 quarters .Investments above the minimum amount mentioned must be made in multiples of ` 1/-.SWP:Minimum balance in the Scheme should be ` 25,000/- at the time of enrollment for SWP. Minimum amount for each withdrawal should be ` 1,000/- and in multiples of ` 1 thereafter for a minimum period of 6 months.
STP:Available
* For rating disclaimers, please refer to page 10
Rated ‘CARE AAAf ’ by CARE* Rated ‘AAAf ‘ by CRISIL*
Security Name Rating % To Net
Assets*CERTIFICATES OF DEPOSIT 62.57
Punjab National Bank Ltd. PR1+ 16.28
UCO Bank Ltd. P1+ 12.21
Bank of India Ltd. P1+ 8.41
HDFC Bank Ltd. PR1+ 8.14
Syndicate Bank Ltd. P1+ 4.09
State Bank of India Ltd. P1+ 4.07
Canara Bank Ltd. P1+ 4.07
Bank of Maharashtra Ltd. P1+ 3.68
Indian Overseas Bank Ltd. A1+ 0.81
United Bank of India A1+ 0.41
Yes Bank P1+ 0.40
Security Name Rating % To Net
Assets*COMMERCIAL PAPERS 37.27Kotak Mahindra Prime Ltd. P1+ 5.14JM Financial Products Pvt Ltd. P1+ 4.88Cormandal International Ltd. P1+ 4.08Srei Infrastructure Finance Ltd. A1+ 4.08Magma Fincorp Ltd. PR1+ 4.08HCL Infosystems Ltd. A1+ 4.02SBI Global Factors Ltd. P1+ 3.26Ballarpur Industries Ltd. F1+ 2.44Motherson Sumi Systems Ltd. A1+ 2.04Aditya Birla Finance Ltd. A1+ 2.01Srei Equipment Finance Pvt. Ltd. A1+ 1.22Cash "n" Call Assets & Receivables 0.16TOTAL 100.00
Portfolio as on 31/05/2011
Asset includes subscription money received & utilized on 31st May, 2011* Rounded off to the nearest two digits after the decimal point.
Asset Profile
YTM : 9.33% Average Maturity : 24.43 daysModified Duration : 24.43 days Average AUM for the month of May’ 2011 : ` 1,180.15 Crs.
Cash & Cash Equivalent 0.16%
A1+/P1+/PR1+99.84%

8
Asset Profile
IDBI Monthly Income Plan(An open ended Income Scheme. Monthly Income is not assured and is subject to availability of distributable surplus)
Scheme FeaturesInvestment objective:The investment objective of the scheme would be to provide regular income along with opportunities for capital appreciation through investments in a diversified basket of debt instruments, equity and money market instruments.
Benchmark:CRISIL MIP Blended IndexFund Manager: Mr. Gautam Kaul & Mr. Syed SagheerInception Date: 7th March 2011
NAV (as on 31st May 2011): Growth ` 10.1693Monthly Dividend ` 10.1693Quarterly Dividend ` 10.1693
Plans:•GrowthOption•DividendOption - Monthly Dividend - Quartely DividendAsset Allocation Pattern:
InstrumentIndicative allocation
(% of total assets)Risk
ProfileMin. Max.Debt instruments (including floating rate debt instruments and securitized debt*) and money market instruments
80% 100% Low to Medium
Equity and equity related instruments^ 0% 20% Medium to High
*Investment in Securitized Debt will be only in investment grade rated papers and will not to exceed 25% of the net assets of the Scheme.^The Scheme will invest in the equity and equity related instruments of only such companies which are the constituents of either the S&P CNX Nifty Index (Nifty 50) or the CNX Nifty Junior Indices (Nifty Junior) comprising a combined universe of 100 stocks. These two indices are collectively referred to as the CNX 100 Index. The equity portfolio will be well-diversified and actively managed to ensure the scheme’s investment objectives are realized.
Min. Application Amount:New Purchase – ` 5000/- and in multiples of ` 1/- thereafterMin. Addl. Investment:` 1000/- and in multiples of ` 1/- thereafterLoad Structure:Entry Load: NilExit Load:1% for exit up to 12 months from the date of allotment.For SIP1% for exit up to 12 months from the date of allotment of each installment.SIP: Monthly Option:` 500/- per month for a minimum period of 12 months or ` 1,000/- per month for a minimum period of 6 months Quarterly Option:` 1,500/- per quarter for a minimum period of 4 quarters .Investments above the minimum amount mentioned must be made in multiples of ` 1/-.SWP:Minimum balance in the scheme should be ` 25,000/- at the time of enrollment for SWP. Minimum amount for each withdrawal should be ` 1000/- and in multiples of ` 1/- thereafter for a minimum period of 6 months. STP:Available
Security Name Rating % To Net
Assets*EQUITY/EQUITY RELATED 3.25Infosys Technologies Ltd. 0.76Bank of Baroda Ltd. 0.59Tata Motors Ltd. 0.38Infrastucture Development Finance Co.Ltd. 0.29
Bharat Heavy Electricals Ltd. 0.26Mahindra & Mahindra Ltd. 0.21Rural Electrification Corporation Ltd. 0.17
State Bank of India Ltd. 0.12Larsen & Toubro Ltd. 0.11Gas Authority of India Ltd. 0.09Cipla Ltd. 0.09Crompton Greaves Ltd. 0.07Shriram Transport Finance Company Ltd. 0.05
Security Name Rating % To Net
Assets*Exide Industries Ltd. 0.04Mundra Port and Special Economic Zone Ltd. 0.02
CERTIFICATES OF DEPOSIT 93.67
Bank of India Ltd. PR1+ 20.25
UCO Bank Ltd. P1+ 13.25
Axis Bank Ltd. P1+ 13.17
Oriental Bank of Commerce Ltd. P1+ 12.59
Punjab & Sind Bank Ltd. A1+ 12.59
Canara Bank Ltd. P1+ 12.59
Central Bank of India Ltd. A1+ 6.27
Vijaya Bank PR1+ 2.95
Cash "n" Call Assets & Receivables 3.07
TOTAL 100.00
Portfolio as on 31/05/2011
* Rounded off to the nearest two digits after the decimal point.
Scheme Performance as on 31/05/2011 (in %)1 Week 2 Weeks 1 Month Since Inception (7-Mar-11 )
IDBI Monthly Income Plan (G) 0.13 0.20 0.41 1.69
Crisil MIP Blended Index 0.38 0.13 -0.47 1.14
Source: Accord FintechDisclaimer: Returns are absolute and pertains to growth plan. Past Performance may or may not be sustained in the future.
YTM (Debt Component) : 9.82% Average Maturity : 171.02 daysModified Duration : 171.02 days Average AUM for the month of May’ 2011 : ` 72.56 Crs.
Equity3.25%
Cash & Cash Equivalent3.07%
Debt93.67%
9
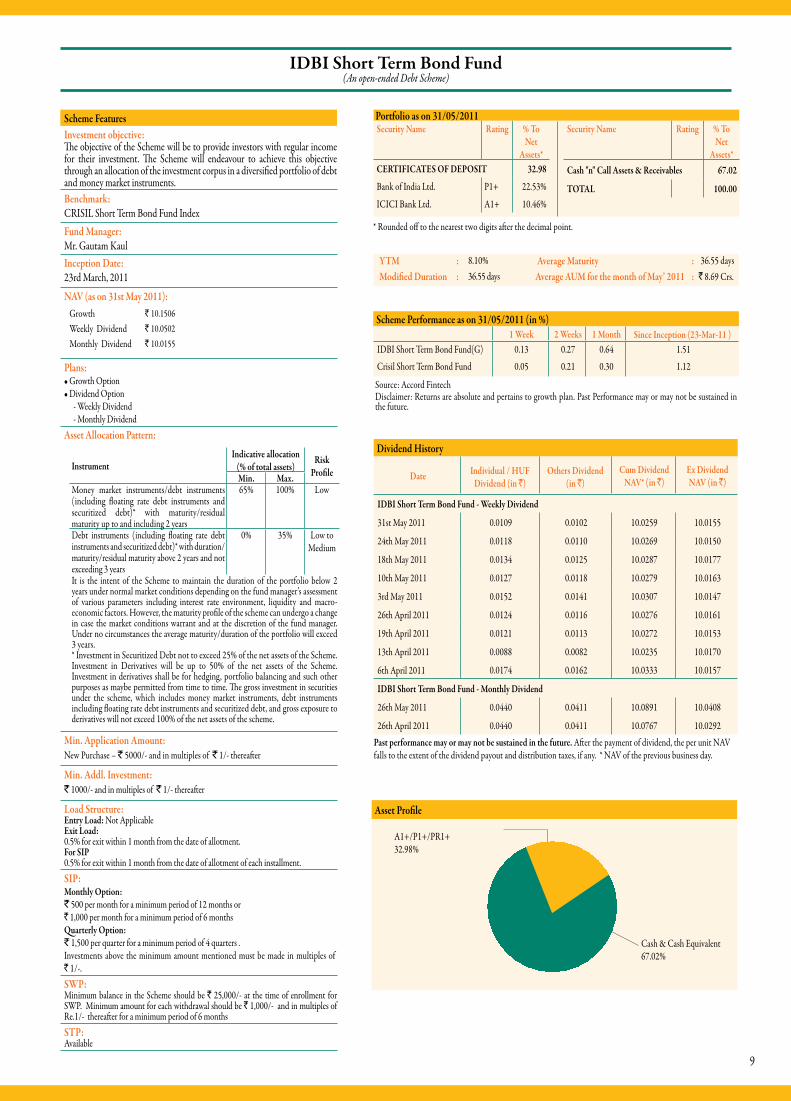
IDBI Short Term Bond Fund(An open-ended Debt Scheme)
Scheme FeaturesInvestment objective:The objective of the Scheme will be to provide investors with regular income for their investment. The Scheme will endeavour to achieve this objective through an allocation of the investment corpus in a diversified portfolio of debt and money market instruments.Benchmark:CRISIL Short Term Bond Fund IndexFund Manager: Mr. Gautam KaulInception Date: 23rd March, 2011
NAV (as on 31st May 2011): Growth ` 10.1506Weekly Dividend ` 10.0502Monthly Dividend ` 10.0155
Plans:•GrowthOption•DividendOption - Weekly Dividend - Monthly DividendAsset Allocation Pattern:
InstrumentIndicative allocation
(% of total assets)Risk
ProfileMin. Max.Money market instruments/debt instruments (including floating rate debt instruments and securitized debt)* with maturity/residual maturity up to and including 2 years
65% 100% Low
Debt instruments (including floating rate debt instruments and securitized debt)* with duration/ maturity/residual maturity above 2 years and not exceeding 3 years
0% 35% Low to Medium
It is the intent of the Scheme to maintain the duration of the portfolio below 2 years under normal market conditions depending on the fund manager’s assessment of various parameters including interest rate environment, liquidity and macro-economic factors. However, the maturity profile of the scheme can undergo a change in case the market conditions warrant and at the discretion of the fund manager. Under no circumstances the average maturity/duration of the portfolio will exceed 3 years.* Investment in Securitized Debt not to exceed 25% of the net assets of the Scheme. Investment in Derivatives will be up to 50% of the net assets of the Scheme. Investment in derivatives shall be for hedging, portfolio balancing and such other purposes as maybe permitted from time to time. The gross investment in securities under the scheme, which includes money market instruments, debt instruments including floating rate debt instruments and securitized debt, and gross exposure to derivatives will not exceed 100% of the net assets of the scheme.
Min. Application Amount:New Purchase – ` 5000/- and in multiples of ` 1/- thereafter
Min. Addl. Investment:` 1000/- and in multiples of ` 1/- thereafter
Load Structure:Entry Load: Not ApplicableExit Load:0.5% for exit within 1 month from the date of allotment.For SIP0.5% for exit within 1 month from the date of allotment of each installment.SIP: Monthly Option:` 500 per month for a minimum period of 12 months or ` 1,000 per month for a minimum period of 6 months Quarterly Option:` 1,500 per quarter for a minimum period of 4 quarters .Investments above the minimum amount mentioned must be made in multiples of ` 1/-.SWP:Minimum balance in the Scheme should be ` 25,000/- at the time of enrollment for SWP. Minimum amount for each withdrawal should be ` 1,000/- and in multiples of Re.1/- thereafter for a minimum period of 6 monthsSTP:Available
Security Name Rating % To Net
Assets*CERTIFICATES OF DEPOSIT 32.98
Bank of India Ltd. P1+ 22.53%
ICICI Bank Ltd. A1+ 10.46%
Security Name Rating % To Net
Assets*Cash "n" Call Assets & Receivables 67.02
TOTAL 100.00
Portfolio as on 31/05/2011
Dividend History
Date Individual / HUF Dividend (in `)
Others Dividend (in `)
Cum Dividend NAV* (in `)
Ex Dividend NAV (in `)
IDBI Short Term Bond Fund - Weekly Dividend
31st May 2011 0.0109 0.0102 10.0259 10.0155
24th May 2011 0.0118 0.0110 10.0269 10.0150
18th May 2011 0.0134 0.0125 10.0287 10.0177
10th May 2011 0.0127 0.0118 10.0279 10.0163
3rd May 2011 0.0152 0.0141 10.0307 10.0147
26th April 2011 0.0124 0.0116 10.0276 10.0161
19th April 2011 0.0121 0.0113 10.0272 10.0153
13th April 2011 0.0088 0.0082 10.0235 10.0170
6th April 2011 0.0174 0.0162 10.0333 10.0157
IDBI Short Term Bond Fund - Monthly Dividend
26th May 2011 0.0440 0.0411 10.0891 10.0408
26th April 2011 0.0440 0.0411 10.0767 10.0292Past performance may or may not be sustained in the future. After the payment of dividend, the per unit NAV falls to the extent of the dividend payout and distribution taxes, if any. * NAV of the previous business day.
Scheme Performance as on 31/05/2011 (in %)1 Week 2 Weeks 1 Month Since Inception (23-Mar-11 )
IDBI Short Term Bond Fund(G) 0.13 0.27 0.64 1.51
Crisil Short Term Bond Fund 0.05 0.21 0.30 1.12
Source: Accord FintechDisclaimer: Returns are absolute and pertains to growth plan. Past Performance may or may not be sustained in the future.
* Rounded off to the nearest two digits after the decimal point.
YTM : 8.10% Average Maturity : 36.55 daysModified Duration : 36.55 days Average AUM for the month of May’ 2011 : ` 8.69 Crs.
Asset Profile
A1+/P1+/PR1+32.98%
Cash & Cash Equivalent 67.02%

10
The products on CNX Nifty Junior Index is not sponsored, endorsed, sold or promoted by India Index Services & Products Limited (IISL). IISL does not make and expressly disclaims any representation or warranty,
express or implied (including warranties of merchantability or fitness for particular purpose or use) regarding the advisability of investing in the products linked to CNX Nifty Junior Index or particularly in the ability
of the CNX Nifty Junior Index to track general stock market performance in India. Please read the full Disclaimers in relation to the CNX Nifty Junior Index in the Scheme Information Document.
*CARE’s fund credit quality rating is not a recommendation to purchase, sell, or hold a security / fund. It neither comments on the current market price, suitability for a particular investor nor on the prospective
performance of the fund with respect to appreciation, volatility of net asset value (NAV), or yield of the fund. The ratings do not address the funds ability to meet the payment obligations to the investors. The ratings are
based on current information furnished to CARE by the issuer or obtained by CARE from sources it considers reliable. CARE does not, however, guarantee the accuracy, adequacy or completeness of any information
and is not responsible for any errors or omissions or for the results obtained from the use of such information. CARE does not perform an audit in connection with any rating and may, on occasion, rely on unaudited
information. The ratings may be changed, suspended, or withdrawn as a result of changes in, or unavailability of, such information, or based on other circumstances. Funds rated by CARE have paid a rating fee.
CRISIL: The assigned rating AAAf is valid for “IDBI Liquid Fund” and “IDBI Ultra Short Term Fund”. The rating of CRISIL is not an opinion of the Asset Management Company’s willingness or ability to make
timely payments to the investor. The rating is also not an opinion on the stability of the NAV of the Fund, which could vary with market developments.
Our BranchesAhmedabad : IDBI Mutual Fund, IDBI Complex, 1st Floor, Near Lal Bunglow, Off CG Road, Ahmedabad - 380 006.
Tel.: 079 – 64502167 / 68. Fax : 079 – 26400844.
Bangalore : IDBI Mutual Fund, IDBI House, 3rd Floor, IDBI Mutual Fund No. 58, Mission Road, Bangalore - 560 027. Tel.: 080-41495263 / 41409786 Fax : 080-41495264.
Chandigarh : IDBI Mutual Fund, IDBI Bank Ltd., 3rd Floor, SCO 72/73, Bank Square, Sector - 17B, Chandigarh - 160 016. Tel.: 0172-5076705 Fax: 0172-5086705.
Chennai : IDBI Mutual Fund, Ground Floor, Lancor Westminster Building, Old No. 108, New No. 70, Dr. Radhakrishnan Salai, Mylapore, Chennai – 600 004. Tel.: 044-43456113 Fax: 044-43456110.
Delhi : IDBI Mutual Fund, IDBI Bank, 5th Floor, Red Cross Building, Red Cross Road, Parliament Street, New Delhi - 110 001. Tel.: 011-66130050 Fax: 011-66130051.
Hyderabad : IDBI Mutual Fund, 3rd Floor, 5-9-89/1, Chapel Road, Hyderabad - 500 001. Tel.: 040 - 66663559 Fax: 040 - 66663889
Indore : IDBI Mutual Fund, IDBI Bank Ltd., Ground Floor, Alankar Chambers, Ratlam Kothi, Indore - 452 001. Tel.: 0731-6679127 Fax: 0731-2510101
Kochi : IDBI Mutual Fund, IDBI Bank, Corporate Office, Near Passport Office, Panampally Nagar, Kochi - 680 366. Tel.: 0484 - 6462112.
Kolkatta : IDBI Mutual Fund, IDBI House, 6th floor, 44, Shakespeare Sarani, Kolkata - 700 017. Tel.: 033- 66337627 Fax: 033-66337629
Lucknow : IDBI Mutual Fund, IDBI Bank, 2 M G Marg, Kisan Sekhari Bhawan, Hazratganj, Lucknow - 226 001. Tel.: 0522- 2202863 / 6500103
Mumbai : IDBI Mutual Fund, Mittal Court, 2nd Floor, C-Wing, Nariman Point, Mumbai - 400021. Tel.: 022-67498397 Fax: 022-67498399.
Pune : IDBI Mutual Fund, IDBI House, 4th Floor, Dnayaneshwar, Paduka Chowk, S C Road, Shivaji Nagar, Pune - 411 004. Tel.: 020-66057037/36 Fax: 020-66057035
Contact us
Corporate OfficeIDBI Asset Management Limited
2nd Floor, IDBI Building, Plot No.39-41, Sector-11, CBD Belapur, Navi Mumbai – 400614.
Phone: 022-66096100 Fax: 022-66096110 e-mail: [email protected] website: www.idbimutual.co.in
SMS: IDBIMF on 09220092200 Tollfree: 1800-22-4324 (between 9 a.m. – 6 p.m. from Monday to Friday)

11