Associazione Galileo 2001 · Associazione Galileo 2001 Convegno Clima, Energia, Societ Roma, 13 e...
27
Massimo Frezzotti [email protected] ENEA, Roma, Italy Programma Nazionale di Ricerche in Antartide www.taldice.org Il ghiaccio e i cambiamenti climatici Associazione Galileo 2001 Convegno Clima, Energia, Società Roma, 13 e 14, ottobre 2009
Transcript of Associazione Galileo 2001 · Associazione Galileo 2001 Convegno Clima, Energia, Societ Roma, 13 e...
Massimo [email protected]
ENEA, Roma, Italy
Programma Nazionale di Ricerche in Antartide
www.taldice.org
Il ghiaccio e i cambiamenti climatici
Associazione Galileo 2001
Convegno
Clima, Energia, Società
Roma, 13 e 14, ottobre 2009
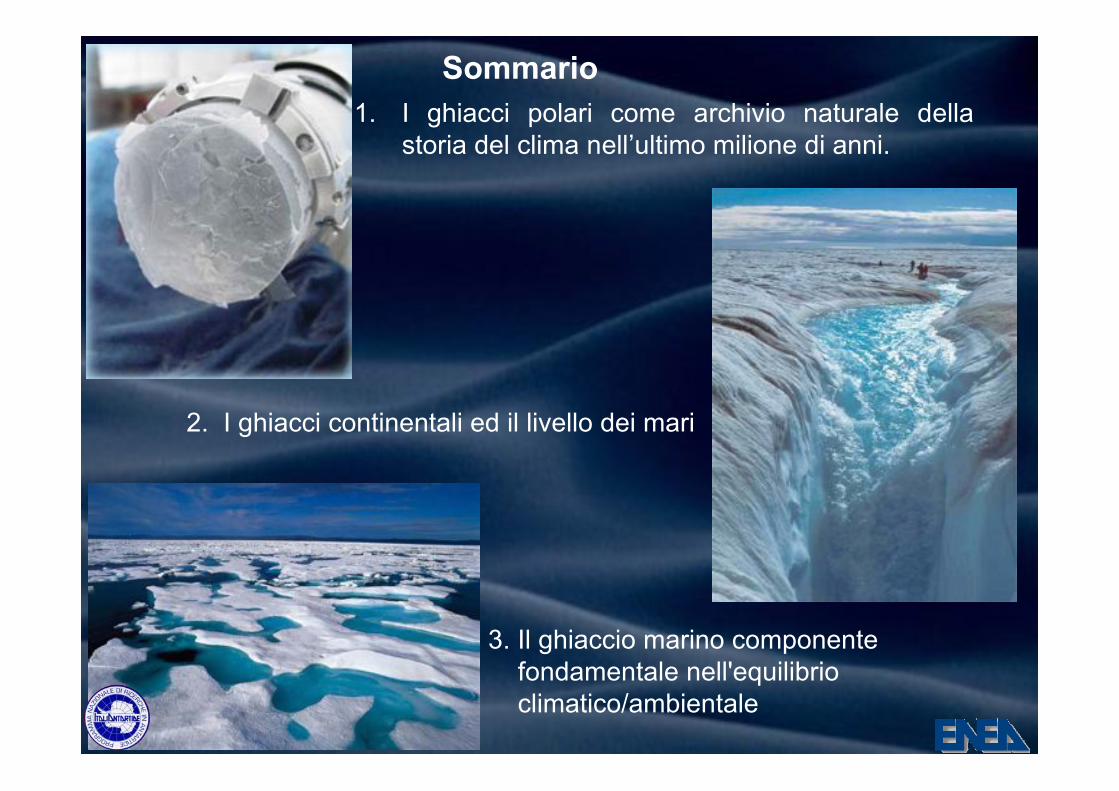
1. I ghiacci polari come archivio naturale della
storia del clima nell’ultimo milione di anni.
Sommario
2. I ghiacci continentali ed il livello dei mari
3. Il ghiaccio marino componente
fondamentale nell'equilibrio
climatico/ambientale
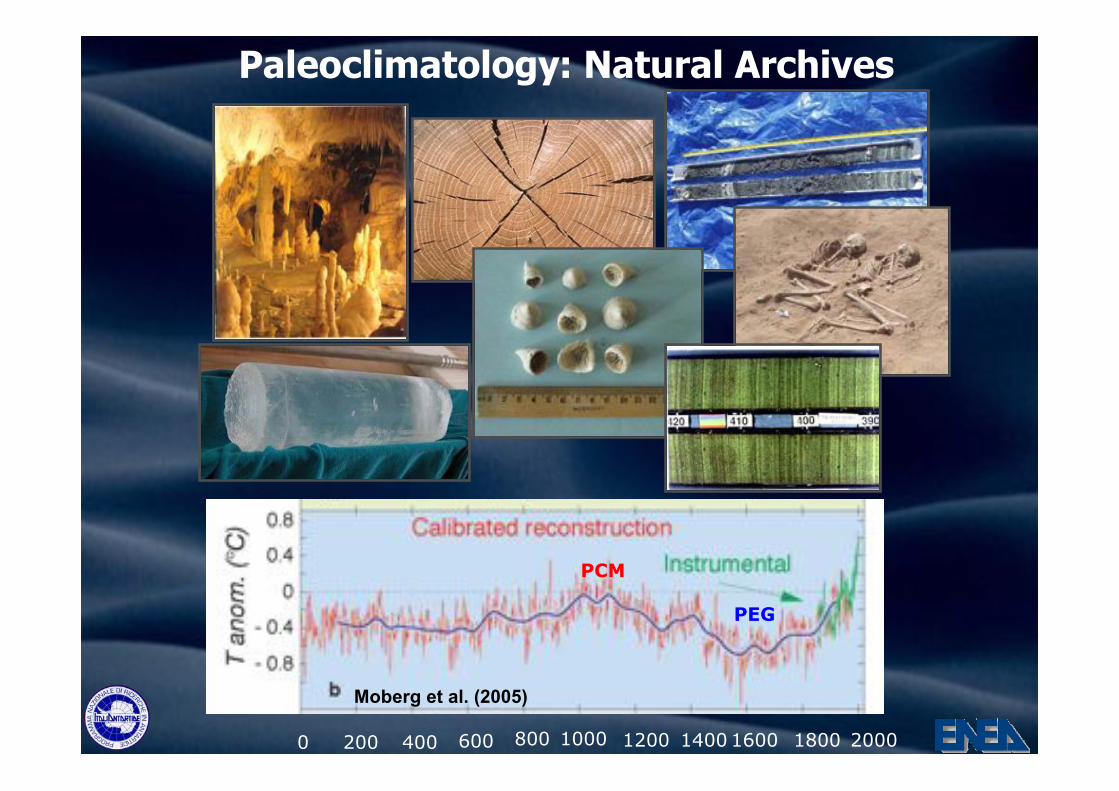
Paleoclimatology: Natural Archives
0 200 400 600 800 1000 1200 14001600 1800 2000
Moberg et al. (2005)
PEG
PCM
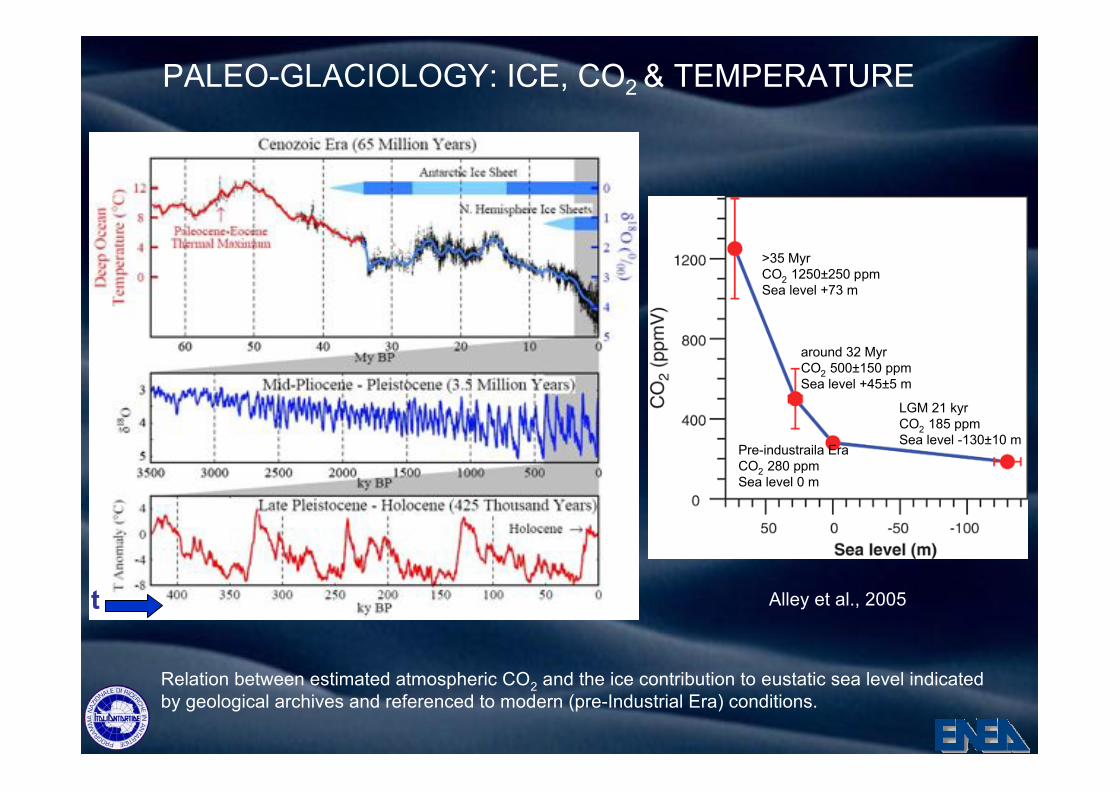
>35 Myr
CO2 1250±250 ppm
Sea level +73 m
around 32 Myr
CO2 500±150 ppm
Sea level +45±5 m
Pre-industraila Era
CO2 280 ppm
Sea level 0 m
LGM 21 kyr
CO2 185 ppm
Sea level -130±10 m
PALEO-GLACIOLOGY: ICE, CO2 & TEMPERATURE
t Alley et al., 2005
Relation between estimated atmospheric CO2 and the ice contribution to eustatic sea level indicated
by geological archives and referenced to modern (pre-Industrial Era) conditions.
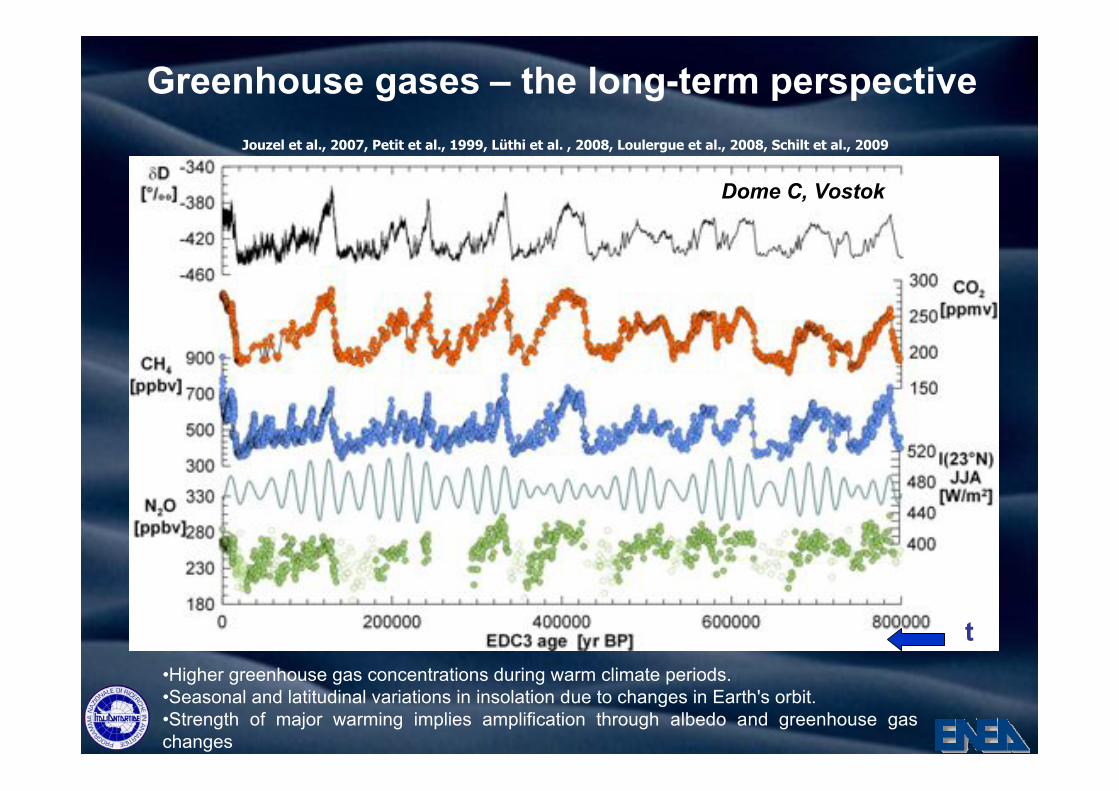
Greenhouse gases – the long-term perspective
•Higher greenhouse gas concentrations during warm climate periods.
•Seasonal and latitudinal variations in insolation due to changes in Earth's orbit.
•Strength of major warming implies amplification through albedo and greenhouse gas
changes
Jouzel et al., 2007, Petit et al., 1999, Lüthi et al. , 2008, Loulergue et al., 2008, Schilt et al., 2009
Dome C, Vostok
t
!D
CO2
CH4
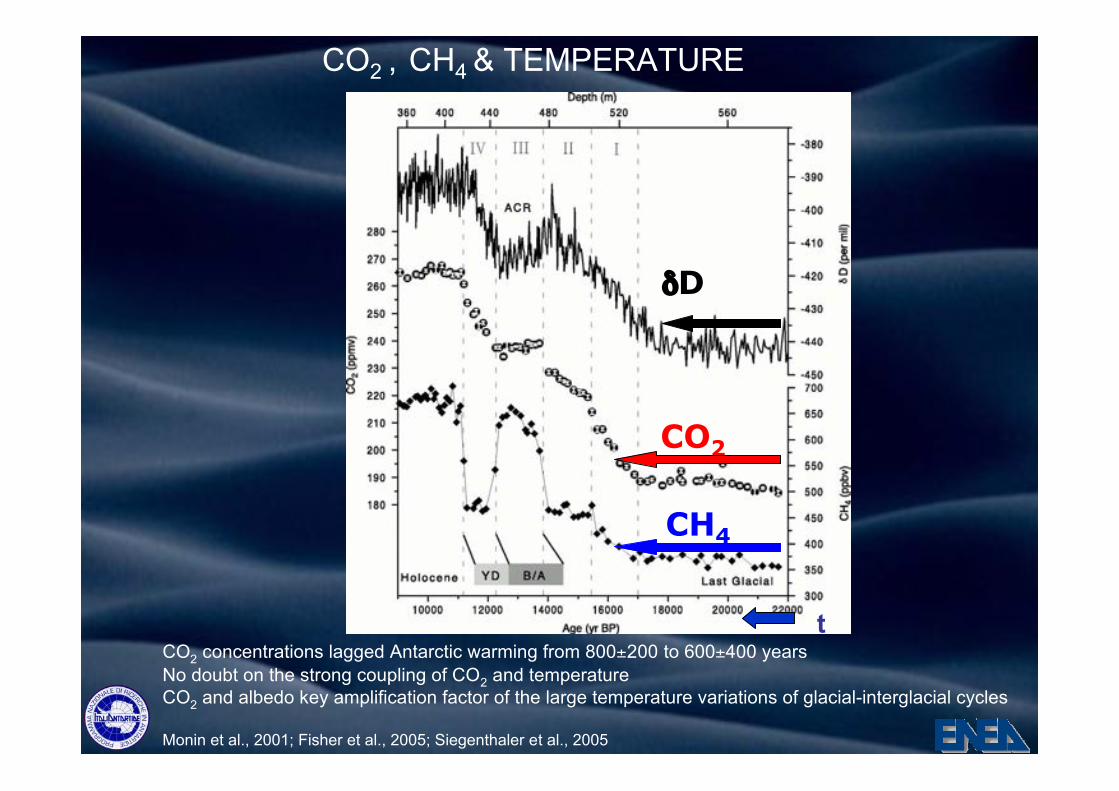
tCO2 concentrations lagged Antarctic warming from 800±200 to 600±400 years
No doubt on the strong coupling of CO2 and temperature
CO2 and albedo key amplification factor of the large temperature variations of glacial-interglacial cycles
Monin et al., 2001; Fisher et al., 2005; Siegenthaler et al., 2005
CO2 , CH4 & TEMPERATURE
Siegenthaler et al, 2005 ; Spahni et al., 2005 ; Lüthi et al., 2008 ; Loulergue et al., 2008
!"#$%&'()*&$
!"#$%&'()*&$
!"#$%&'()*&$
+(,-(.300
170
750
350
MBEMBE
t
CO2 , CH4 & TEMPERATURE
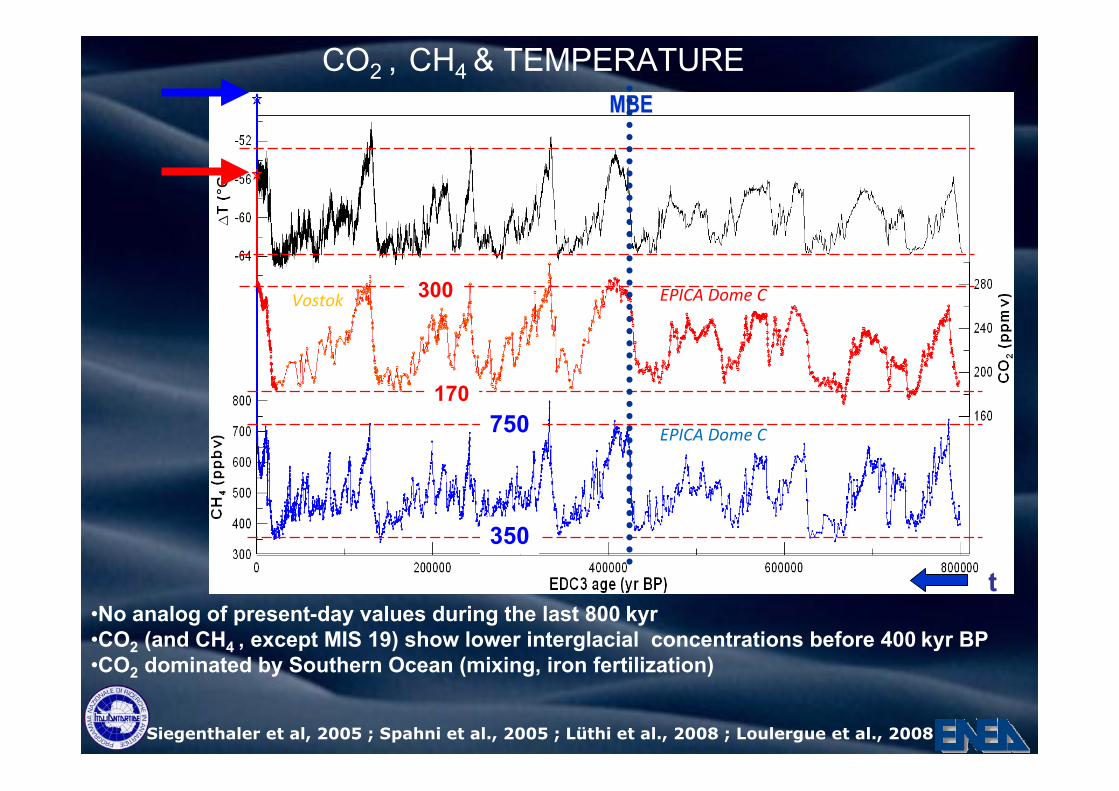
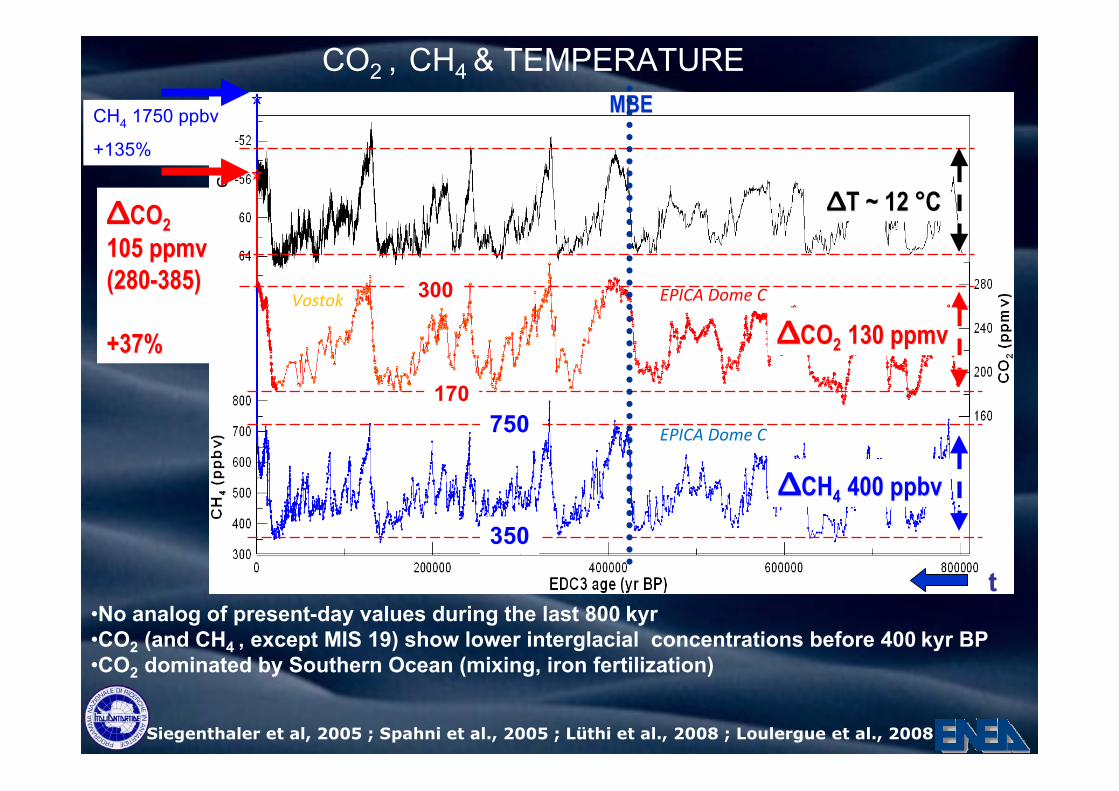
•No analog of present-day values during the last 800 kyr
•CO2 (and CH4 , except MIS 19) show lower interglacial concentrations before 400 kyr BP
•CO2 dominated by Southern Ocean (mixing, iron fertilization)
Siegenthaler et al, 2005 ; Spahni et al., 2005 ; Lüthi et al., 2008 ; Loulergue et al., 2008
•No analog of present-day values during the last 800 kyr
•CO2 (and CH4 , except MIS 19) show lower interglacial concentrations before 400 kyr BP
•CO2 dominated by Southern Ocean (mixing, iron fertilization)
!"#$%&'()*&$
!"#$%&'()*&$
!"#$%&'()*&$
+(,-(.
!!COCO22
105 ppmv105 ppmv
(280-385)(280-385)
+37%+37%
300
170
CH4 1750 ppbv
+135%
750
350
!!T ~ 12 °CT ~ 12 °C
!!COCO22 130 ppmv 130 ppmv
MBEMBE
!!CHCH44 400 400 ppbvppbv
t
CO2 , CH4 & TEMPERATURE
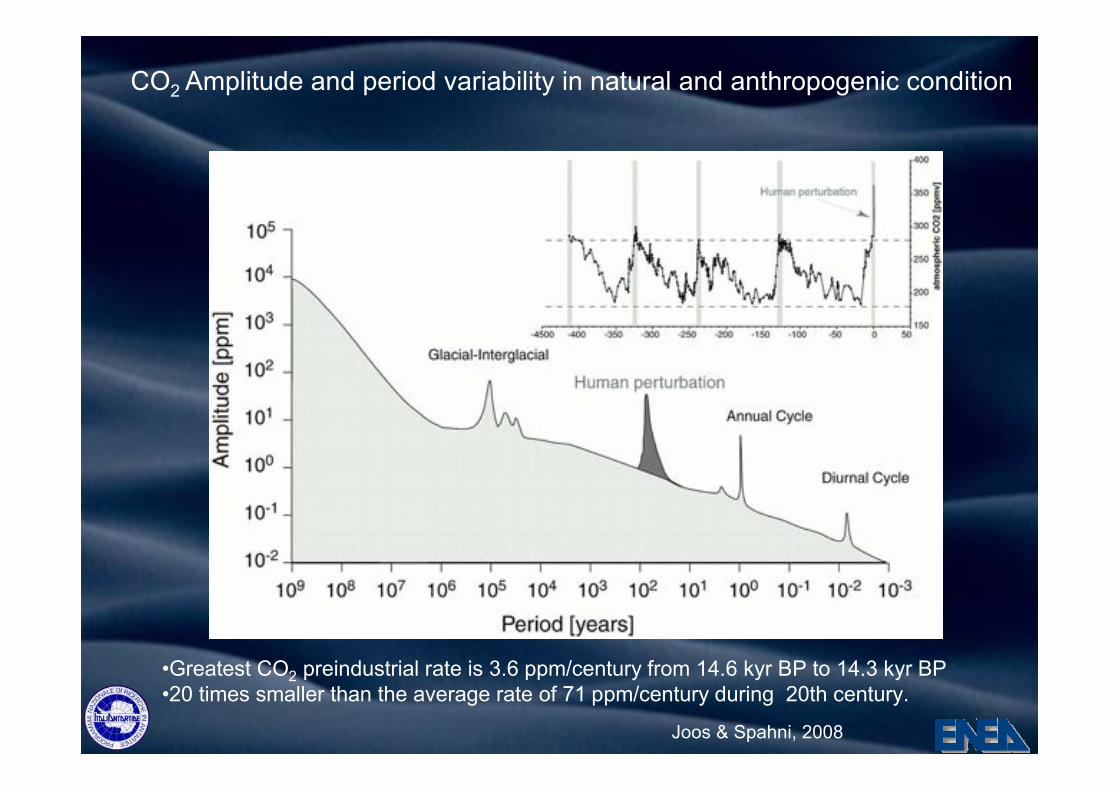
•Greatest CO2 preindustrial rate is 3.6 ppm/century from 14.6 kyr BP to 14.3 kyr BP
•20 times smaller than the average rate of 71 ppm/century during 20th century.
CO2 Amplitude and period variability in natural and anthropogenic condition
Joos & Spahni, 2008
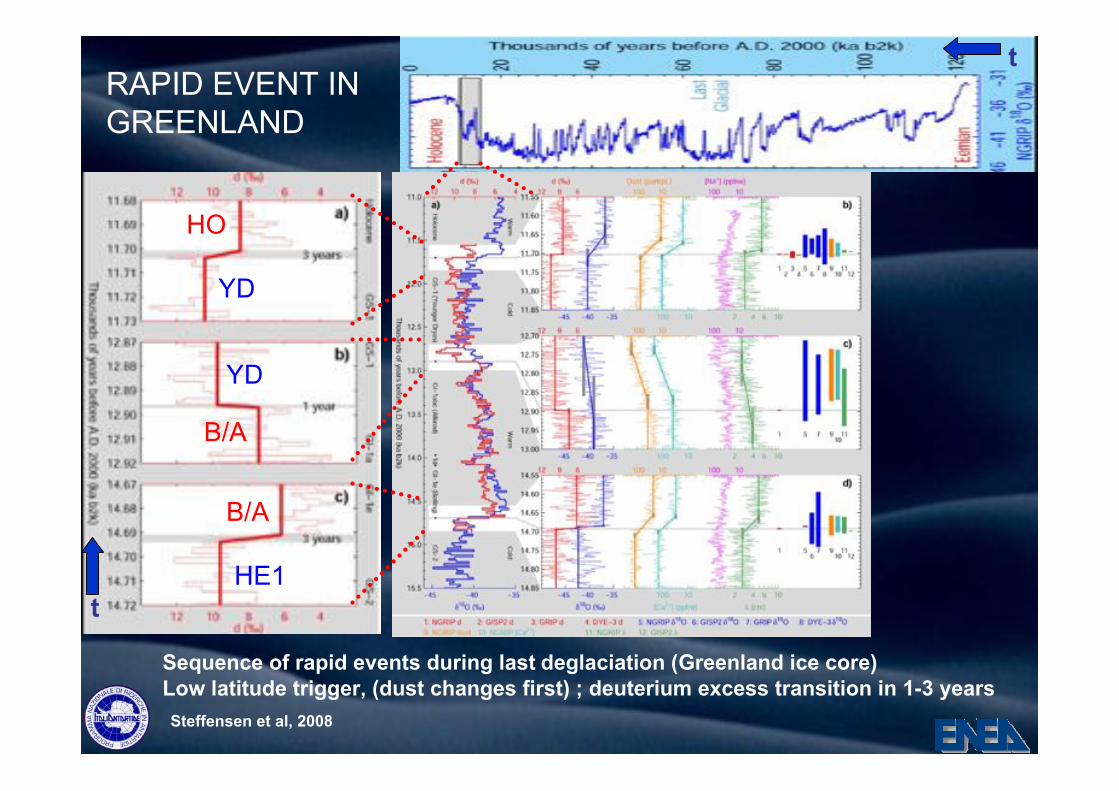
Sequence of rapid events during last deglaciation (Greenland ice core)
Low latitude trigger, (dust changes first) ; deuterium excess transition in 1-3 years
Steffensen et al, 2008
t
t
HE1
B/A
B/A
YD
YD
HO
RAPID EVENT IN
GREENLAND
-45
-41
-37
-33
-450
-430
-410
350
500
650
800
10000 20000 30000 40000 50000 60000
-52
-49
-46
-43
-52
-48
-44
EDML Tsu
rf
[ °C
]
!18
Oco
rr
[ °/ °
°]
NGRIP age [yr BP]
CH4
[p
pb
v]
ACR
AIM 8
NorthGRIP
Greenland CH4
composite
EDML
DO1
23 4 5 6 7
DO8
910 11
DO12
EDC
!18
O [ °
/ °°]
!Dc
orr
[ °
/ °°]
AIM 12AIM 1
AIM 2
AIM 45 6
7
39
10 11
4.1
4.1
H1
H2 H3 H4 H5
0.0
1.0
2.0
3.0
12
11
10
9
8
7
65
4.1
4
3
500 1000 1500 2000
NGRIP stadial duration [yr]
ED
ML !
Tsu
r f [°
C]
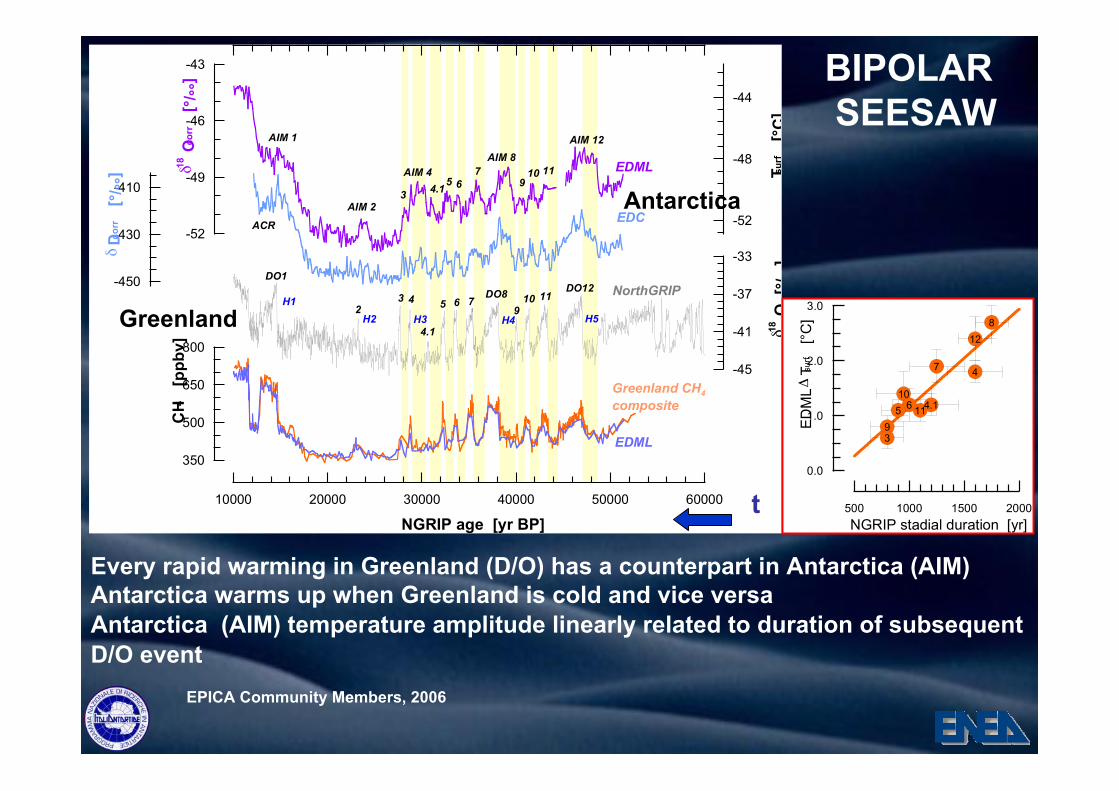
Every rapid warming in Greenland (D/O) has a counterpart in Antarctica (AIM)
Antarctica warms up when Greenland is cold and vice versa
Antarctica (AIM) temperature amplitude linearly related to duration of subsequent
D/O event
EPICA Community Members, 2006
t
Greenland
Antarctica
BIPOLAR
SEESAW
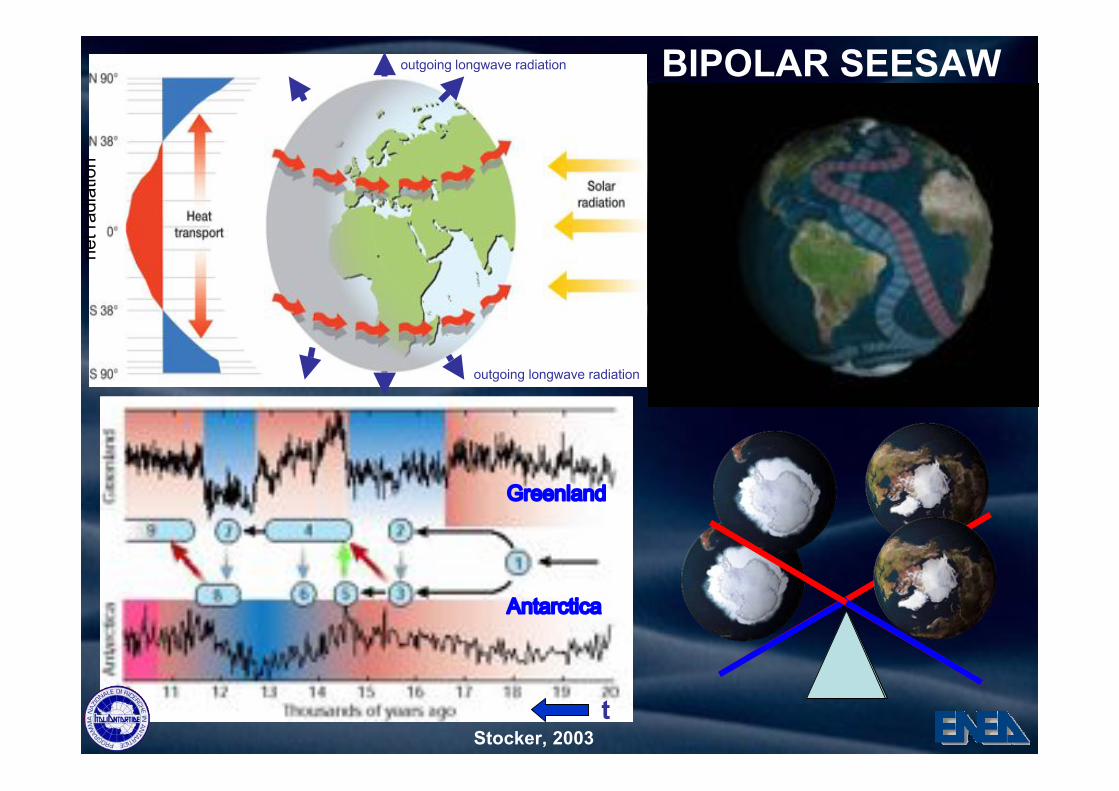
Stocker, 2003
!"##$%&$'
($)&"*)+*&
Sud Nord
BIPOLAR SEESAWoutgoing longwave radiation
outgoing longwave radiation
ne
t ra
dia
tio
n
t
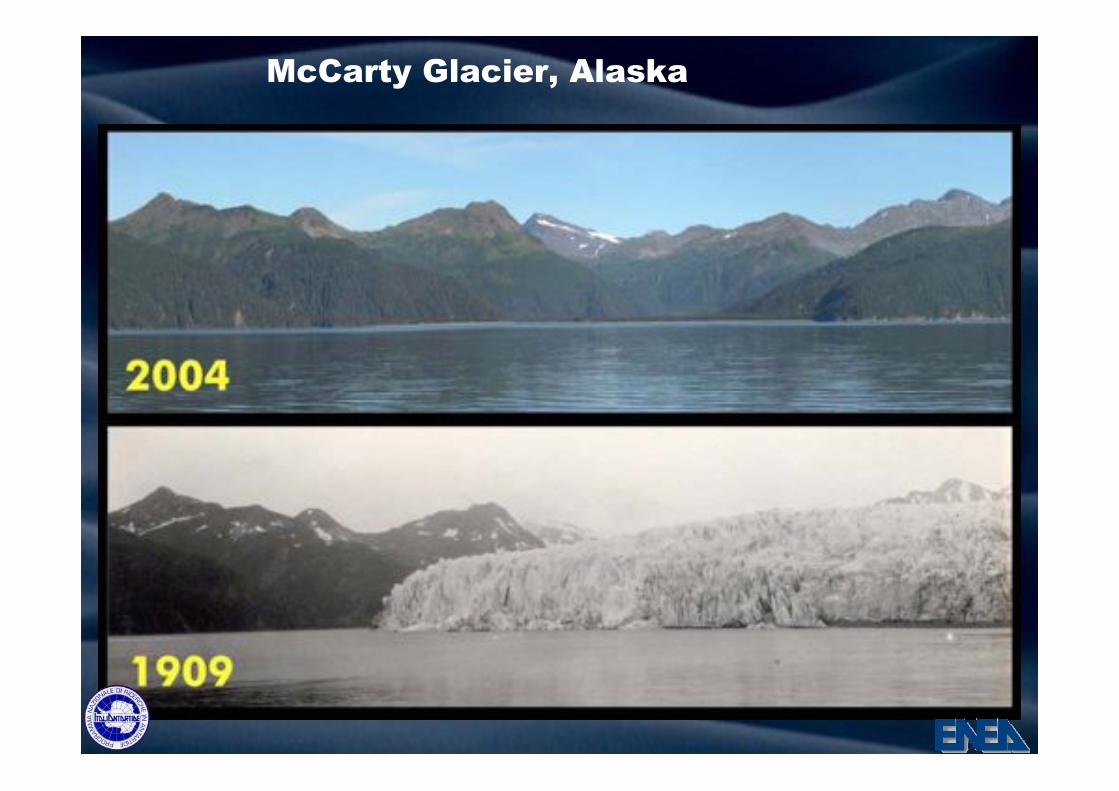
McCarty Glacier, Alaska
1932 2003
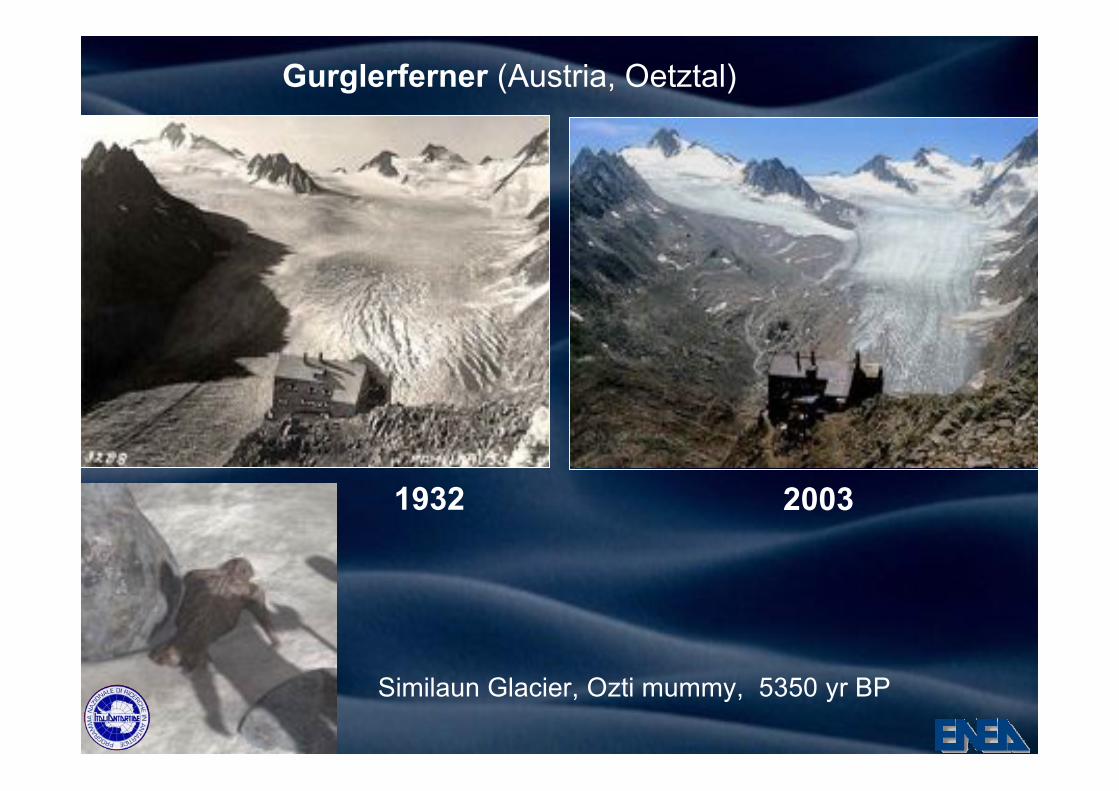
Gurglerferner (Austria, Oetztal)
Similaun Glacier, Ozti mummy, 5350 yr BP
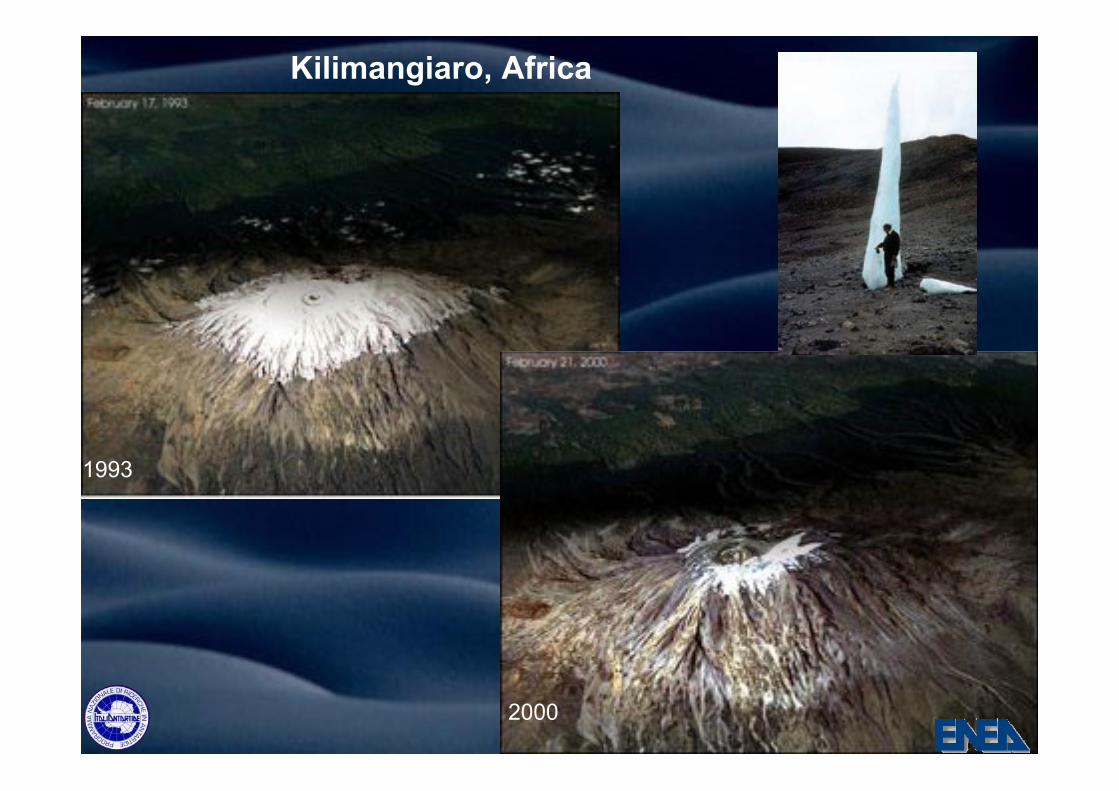
1993
2000
Kilimangiaro, Africa
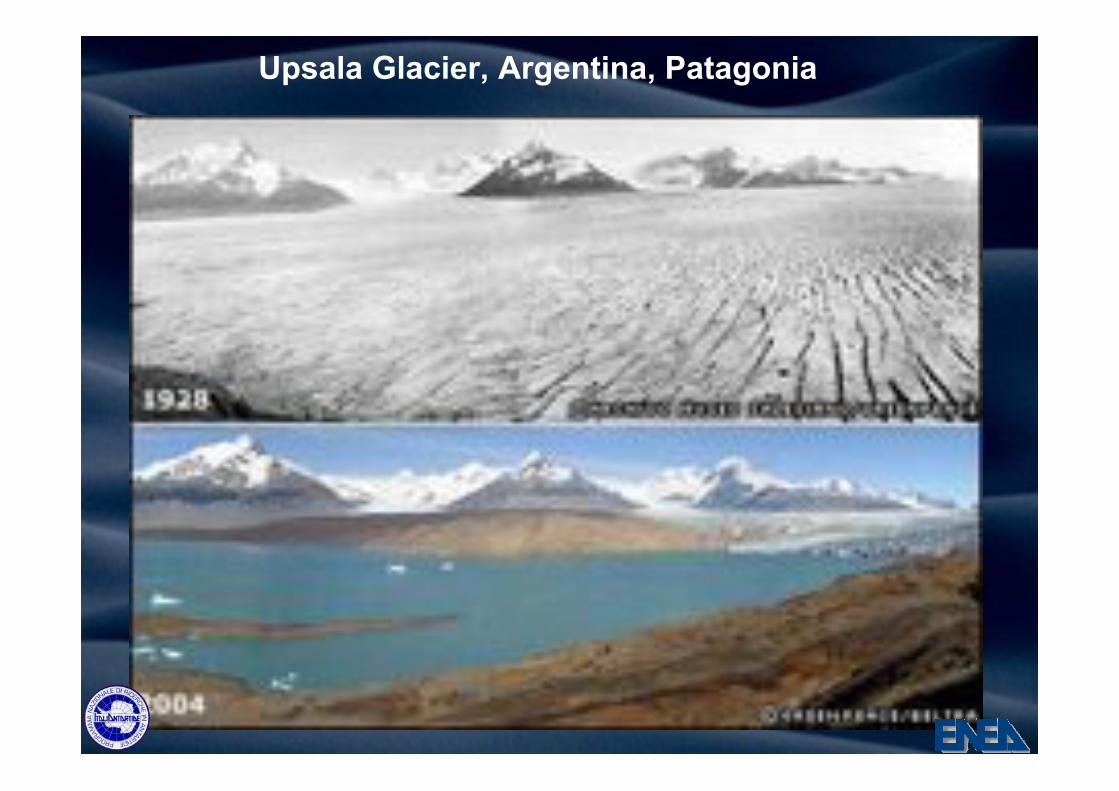
Upsala Glacier, Argentina, Patagonia
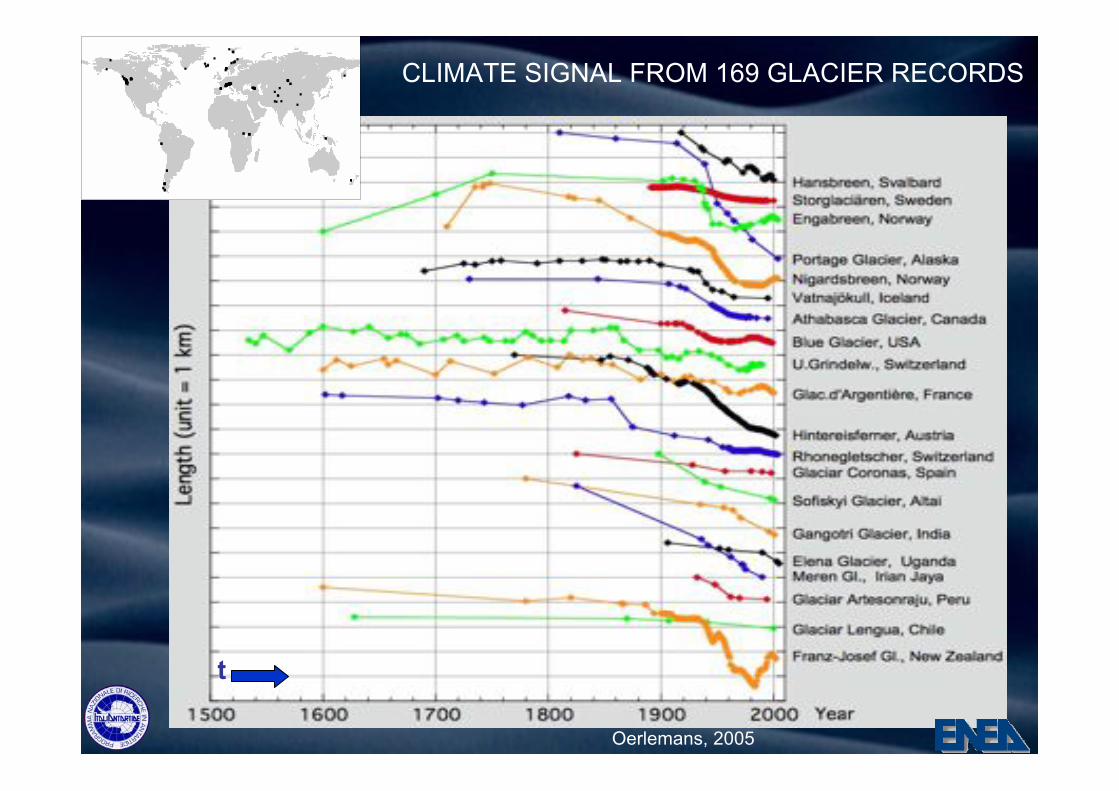
CLIMATE SIGNAL FROM 169 GLACIER RECORDS
Oerlemans, 2005
t
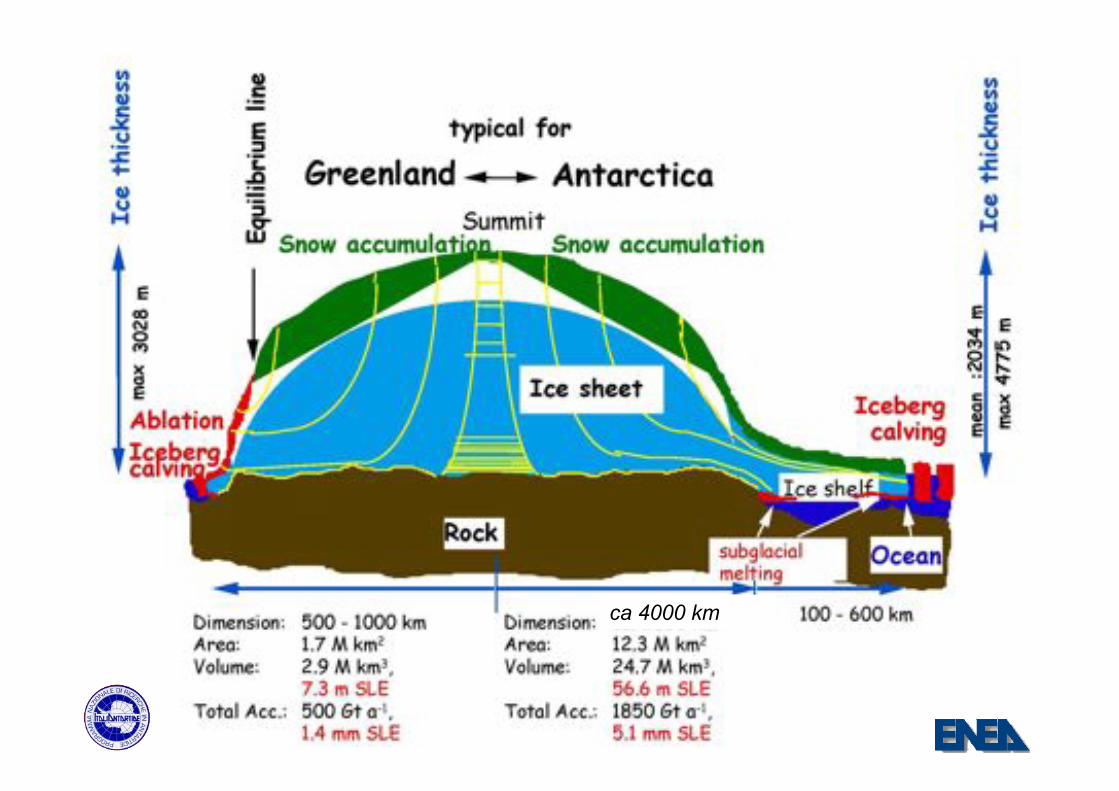
ca 4000 km
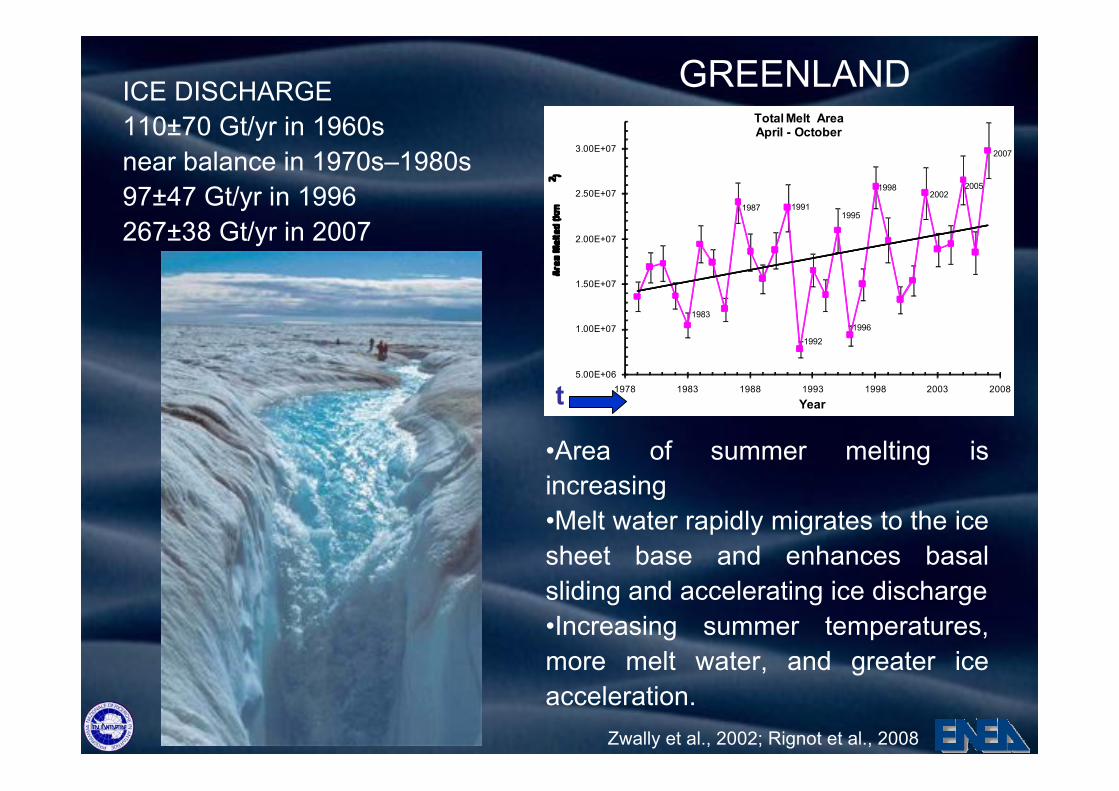
ICE DISCHARGE
110±70 Gt/yr in 1960s
near balance in 1970s–1980s
97±47 Gt/yr in 1996
267±38 Gt/yr in 2007
5.00E+06
1.00E+07
1.50E+07
2.00E+07
2.50E+07
3.00E+07
1978 1983 1988 1993 1998 2003 2008
Year
Total Melt AreaApril - October
20021998
1995
1991
1992
1996
2005
1987
1983
2007
•Area of summer melting is
increasing
•Melt water rapidly migrates to the ice
sheet base and enhances basal
sliding and accelerating ice discharge
•Increasing summer temperatures,
more melt water, and greater ice
acceleration.
GREENLAND
Zwally et al., 2002; Rignot et al., 2008
t
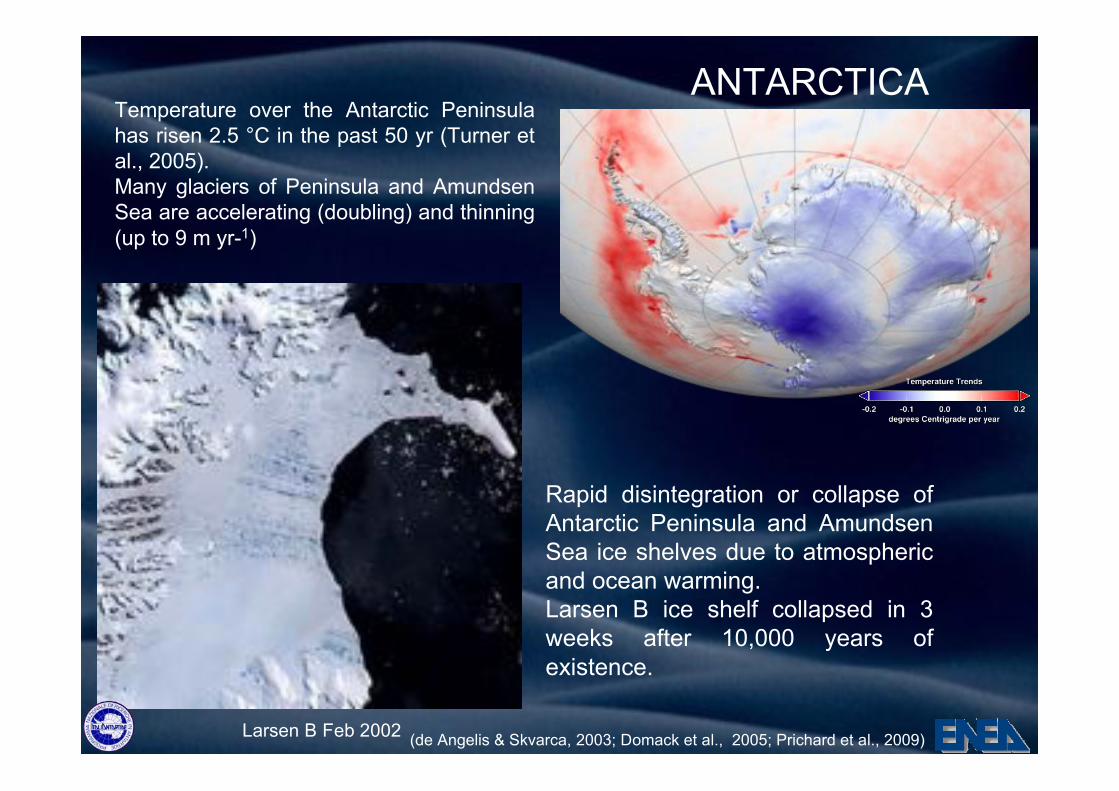
(de Angelis & Skvarca, 2003; Domack et al., 2005; Prichard et al., 2009) Larsen B Feb 2002
Rapid disintegration or collapse of
Antarctic Peninsula and Amundsen
Sea ice shelves due to atmospheric
and ocean warming.
Larsen B ice shelf collapsed in 3
weeks after 10,000 years of
existence.
Temperature over the Antarctic Peninsula
has risen 2.5 °C in the past 50 yr (Turner et
al., 2005).
Many glaciers of Peninsula and Amundsen
Sea are accelerating (doubling) and thinning
(up to 9 m yr-1)
ANTARCTICA
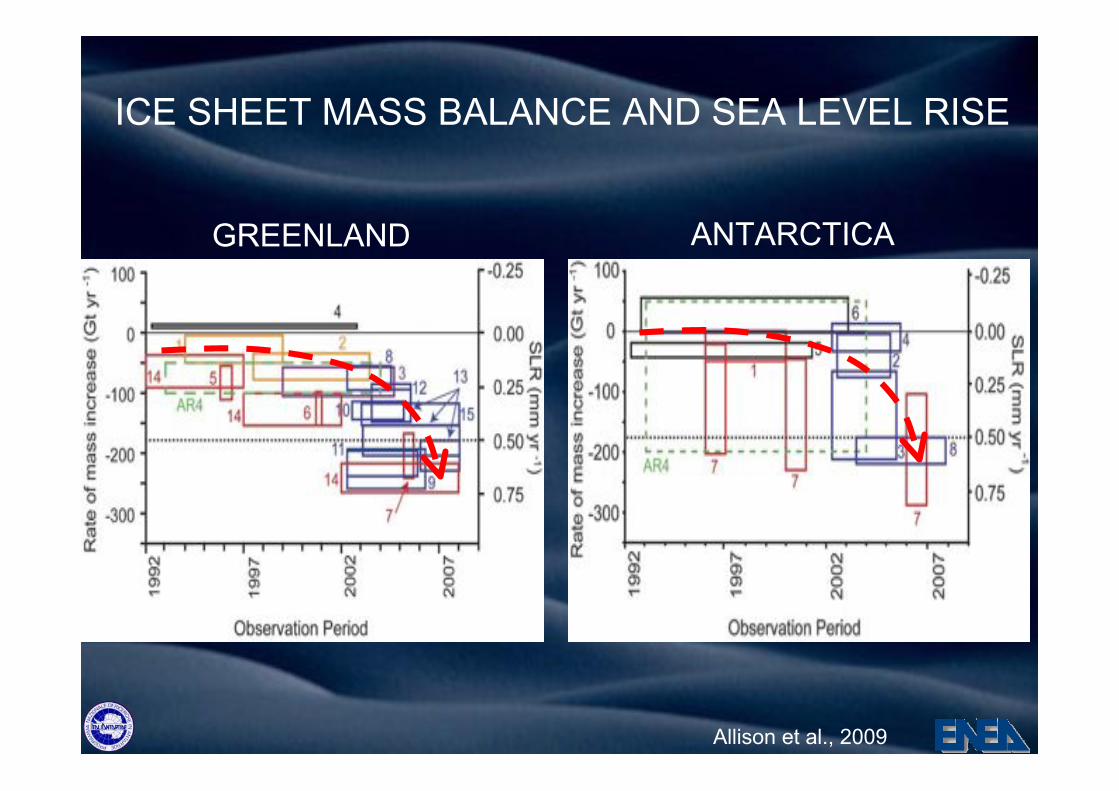
ICE SHEET MASS BALANCE AND SEA LEVEL RISE
Allison et al., 2009
GREENLAND ANTARCTICA
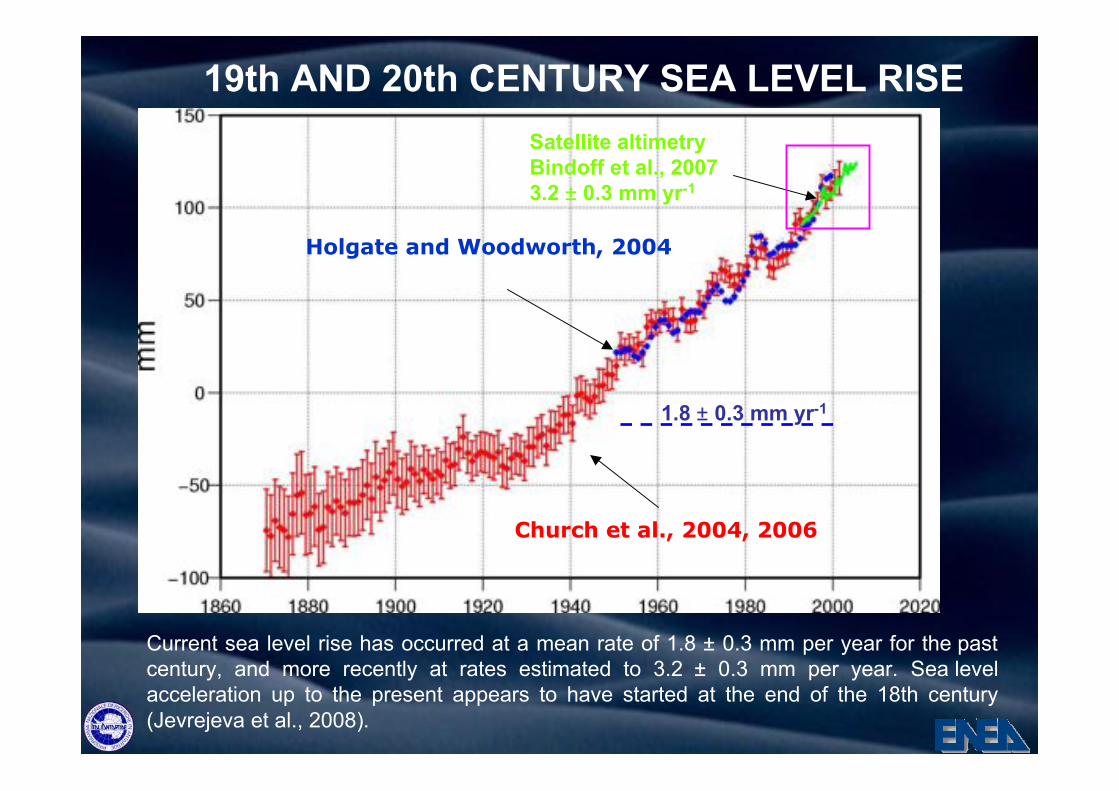
Church et al., 2004, 2006
Holgate and Woodworth, 2004
19th AND 20th CENTURY SEA LEVEL RISE
Satellite altimetry
Bindoff et al., 2007
3.2 ± 0.3 mm yr-1
1.8 ± 0.3 mm yr-1
Current sea level rise has occurred at a mean rate of 1.8 ± 0.3 mm per year for the past
century, and more recently at rates estimated to 3.2 ± 0.3 mm per year. Sea level
acceleration up to the present appears to have started at the end of the 18th century
(Jevrejeva et al., 2008).
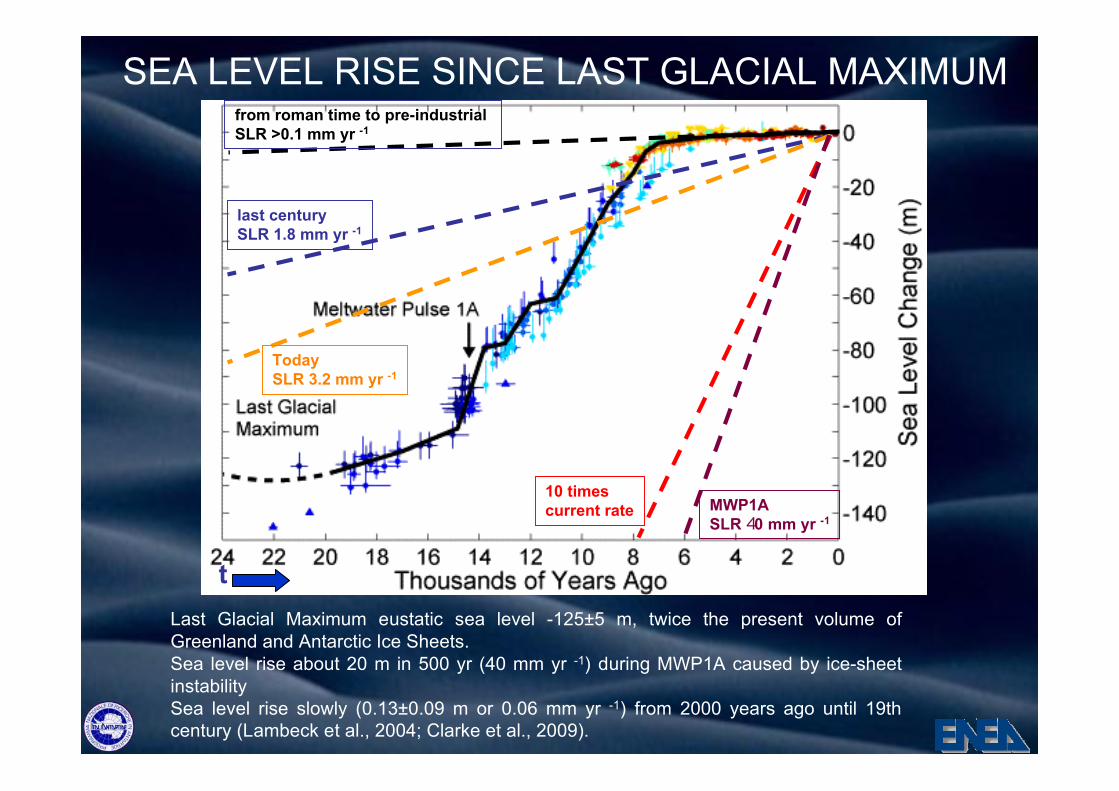
SEA LEVEL RISE SINCE LAST GLACIAL MAXIMUM
last century
SLR 1.8 mm yr -1
Today
SLR 3.2 mm yr -1
10 times
current rate MWP1A
SLR 40 mm yr -1
from roman time to pre-industrial
SLR >0.1 mm yr -1
Last Glacial Maximum eustatic sea level -125±5 m, twice the present volume of
Greenland and Antarctic Ice Sheets.
Sea level rise about 20 m in 500 yr (40 mm yr -1) during MWP1A caused by ice-sheet
instability
Sea level rise slowly (0.13±0.09 m or 0.06 mm yr -1) from 2000 years ago until 19th
century (Lambeck et al., 2004; Clarke et al., 2009).
t
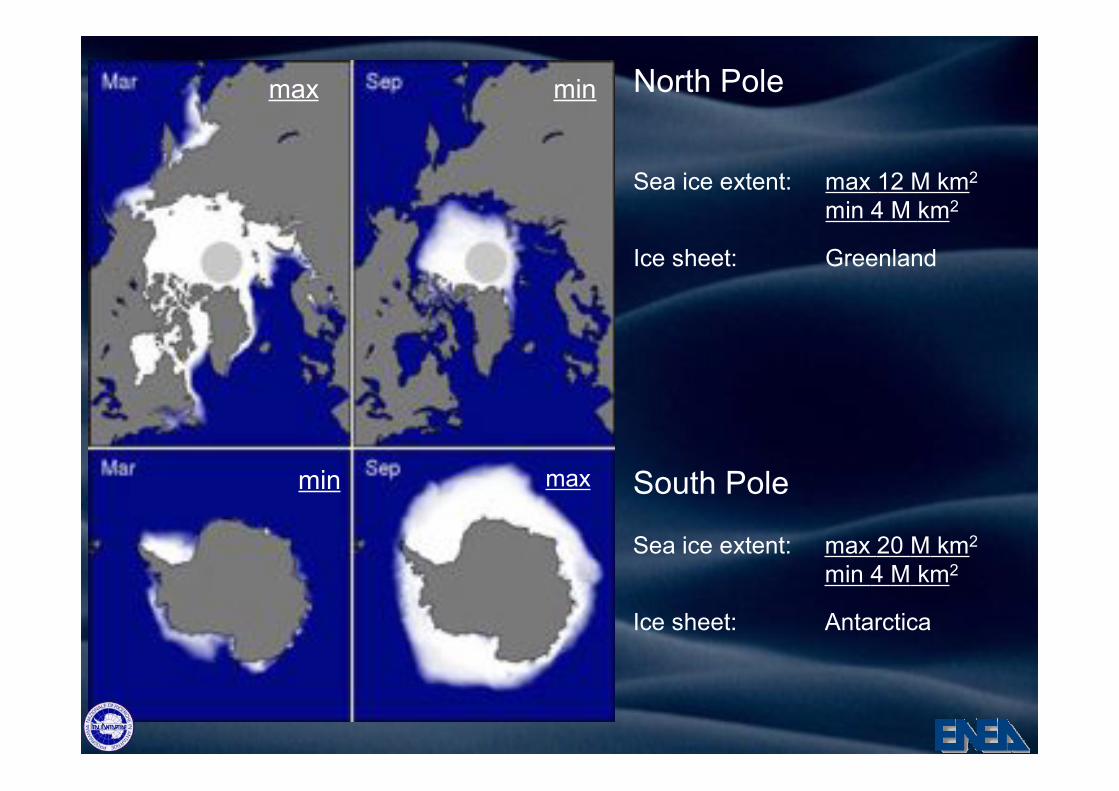
max
max
min
min
North Pole
Sea ice extent: max 12 M km2
min 4 M km2
Ice sheet: Greenland
South Pole
Sea ice extent: max 20 M km2
min 4 M km2
Ice sheet: Antarctica
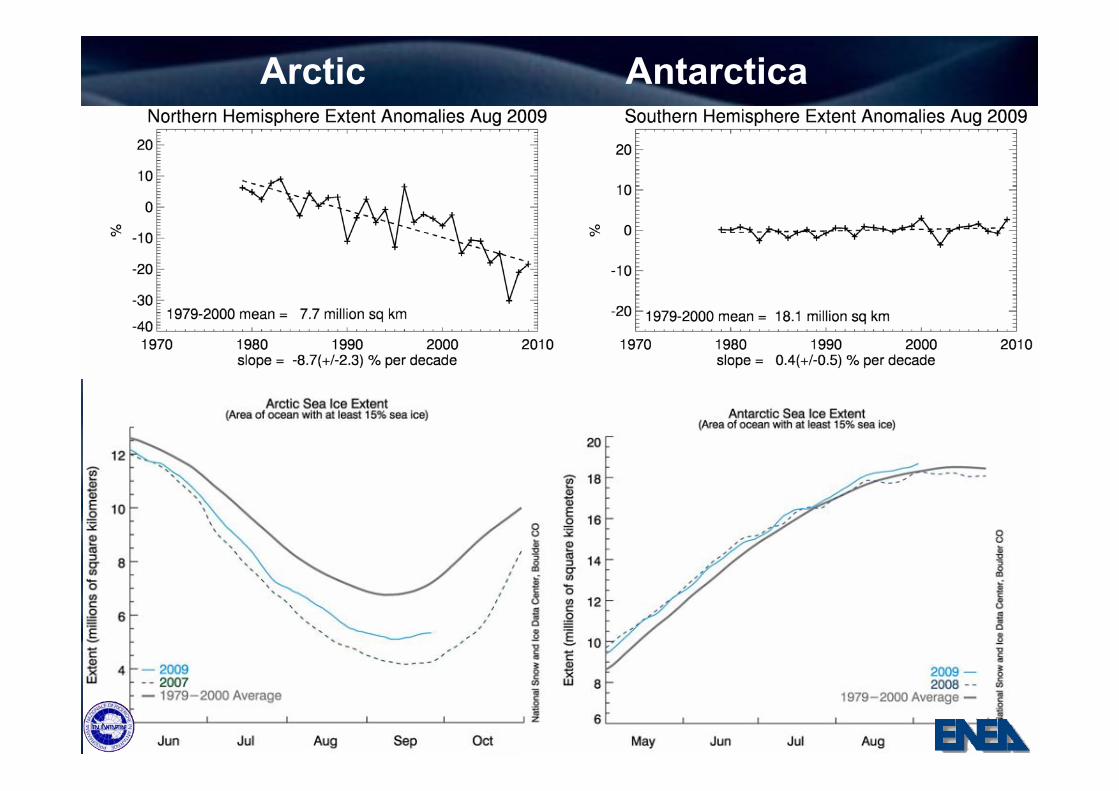
Arctic Antarctica
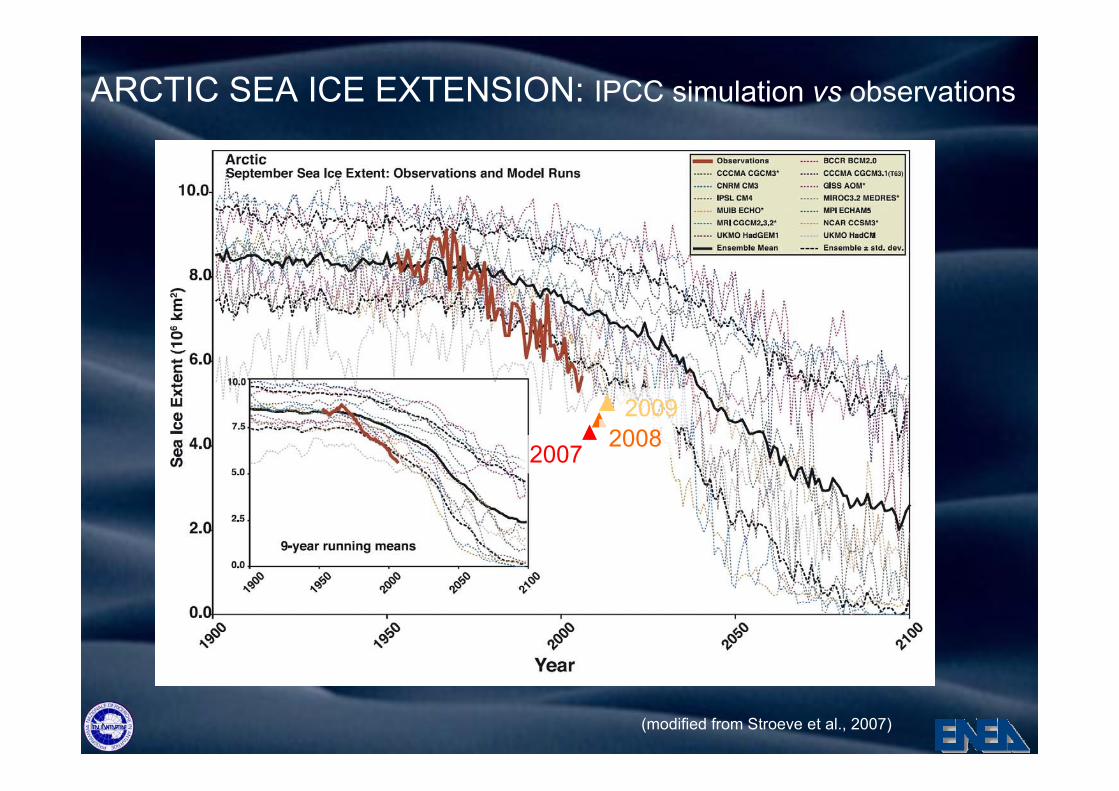
(modified from Stroeve et al., 2007)
ARCTIC SEA ICE EXTENSION: IPCC simulation vs observations
20072008
2009
Grazie per la vostra [email protected]