Asset Creation and Destruction in the Sporting Industry · PDF fileAsset Creation and...
27
© George Foster March 25, 2014 Asset Creation and Destruction in the Sporting Industry George Foster Konosuke Matsushita Professor of Management Graduate School of Business Stanford University February 2014 1
Transcript of Asset Creation and Destruction in the Sporting Industry · PDF fileAsset Creation and...

© George Foster March 25, 2014
Asset Creation and Destruction in the Sporting Industry
George Foster Konosuke Matsushita Professor of
Management Graduate School of Business
Stanford University
February 2014
1
Graduate School of Business Stanford University
© George Foster 3/25/2014
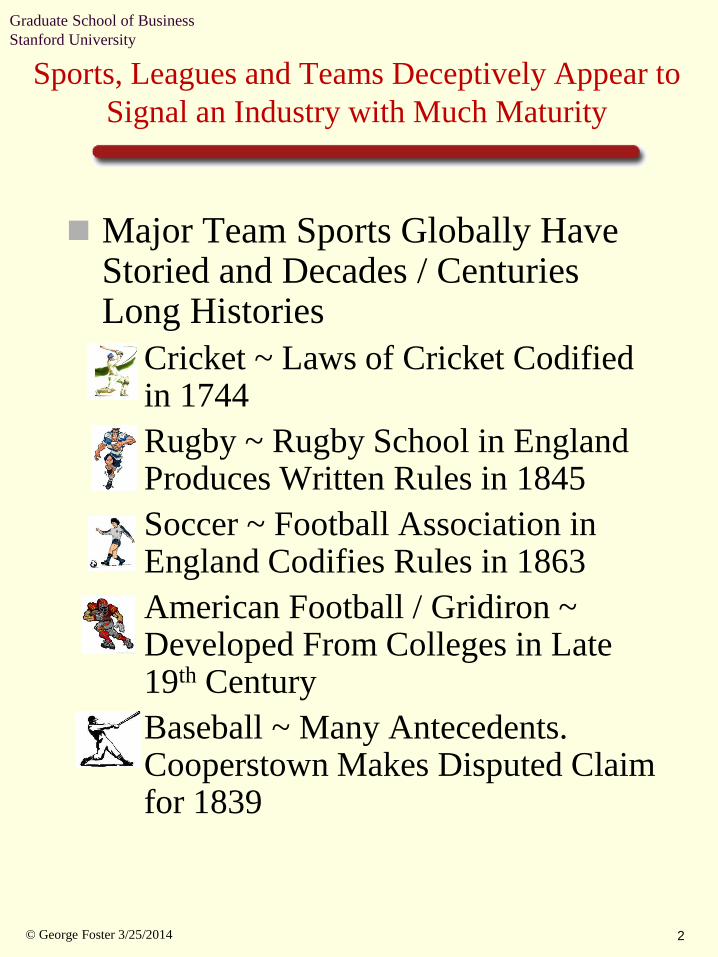
Major Team Sports Globally Have Storied and Decades / Centuries Long Histories Cricket ~ Laws of Cricket Codified
in 1744 Rugby ~ Rugby School in England
Produces Written Rules in 1845 Soccer ~ Football Association in
England Codifies Rules in 1863 American Football / Gridiron ~
Developed From Colleges in Late 19th Century
Baseball ~ Many Antecedents. Cooperstown Makes Disputed Claim for 1839
2
Sports, Leagues and Teams Deceptively Appear to Signal an Industry with Much Maturity
Graduate School of Business Stanford University
© George Foster 3/25/2014
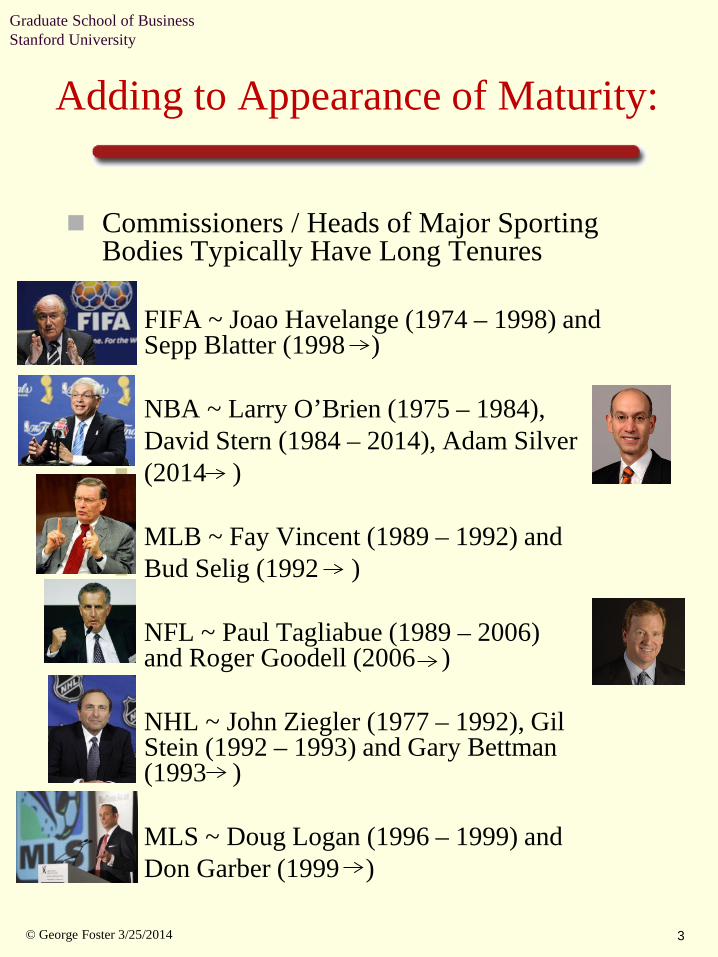
Commissioners / Heads of Major Sporting Bodies Typically Have Long Tenures FIFA ~ Joao Havelange (1974 – 1998) and
Sepp Blatter (1998 )
NBA ~ Larry O’Brien (1975 – 1984), David Stern (1984 – 2014), Adam Silver (2014 )
MLB ~ Fay Vincent (1989 – 1992) and Bud Selig (1992 )
NFL ~ Paul Tagliabue (1989 – 2006)
and Roger Goodell (2006 )
NHL ~ John Ziegler (1977 – 1992), Gil Stein (1992 – 1993) and Gary Bettman (1993 )
MLS ~ Doug Logan (1996 – 1999) and Don Garber (1999 )
3
Adding to Appearance of Maturity:

Graduate School of Business Stanford University
© George Foster 3/25/2014
Apparel Industry ~ Nike Builds Scale in 1960s and 1970s; Under Armour (1996 )
Agency / Marketing ~ IMG in 1960s and 1970s Builds Scale with Individual Athlete Representations and Marketing; Wasserman Media Group in Early 2000’s builds scale.
Television ~ Regional Sports networks Started in 1980s / 1990s and Now Dominate MLB, NBA and NHL Coverage YES Network Launched in 2002 and is Now
Most Valuable RSN Internet ~ MLBAM Started in 2000 and Now a
Key Asset Owned Equally by MLB Teams New Ventures ~ Ultimate Fighting
Championship (UFC) Started in 1993 and Close to Bankrupt in 2000 Zuffa Acquisition in 2001 Leads to Buildup of
MMA Powerhouse College Sports – Pac-12 Network and Pac-12
Media Deal
4
Sporting Industry Shows Continuing Evidence of Much Vibrancy and Mega Asset Creation
Graduate School of Business Stanford University
© George Foster 3/25/2014
ESPN
YES Network
NFL Network
College Conference Networks Pack-12 Network
5
Cable Television As Platform For Asset Creation

Graduate School of Business Stanford University
© George Foster 3/25/2014
Launched September 1979 in Bristol, Connecticut by Bill/Scott Rasmussen, Ed Eagan
Getty Oil Provided Early Funding Approximate 2013 Monthly
Subscriber Rate $5.40 a month Yields $6.480 billion Annual Revenues with 100 million Subscribers
QUESTION
Was ESPN a One-Off Opportunity?
6
ESPN (Entertainment and Sports Programming Network)
Graduate School of Business Stanford University
© George Foster 3/25/2014
1999 YankeeNets Pools Media Rights of (MLB) N.Y. Yankees: N.J. Nets (NBA), N.J. Devils (NHL). 2001 (June) YES Network Formed With Approximate Valuation of $850 million. YankeeNets majority shareholder (+ Goldman Sachs Providence Equity Partners, Leo Hindery, Bill Bresnan) 2012 (Nov) News Corp. acquires 49% equity in YES Network at reported valuation of $3.000 billion. 2014 (Jan) 21st Century Fox moves to 80% equity. Remaining 20% held by Yankee Global Enterprises. Prior 2012 media report put valuation implicit in 2014 transaction a $3.800 billion.
7
YES Network (Yankees Entertainment and Sports Network)
Graduate School of Business Stanford University
© George Foster 3/25/2014
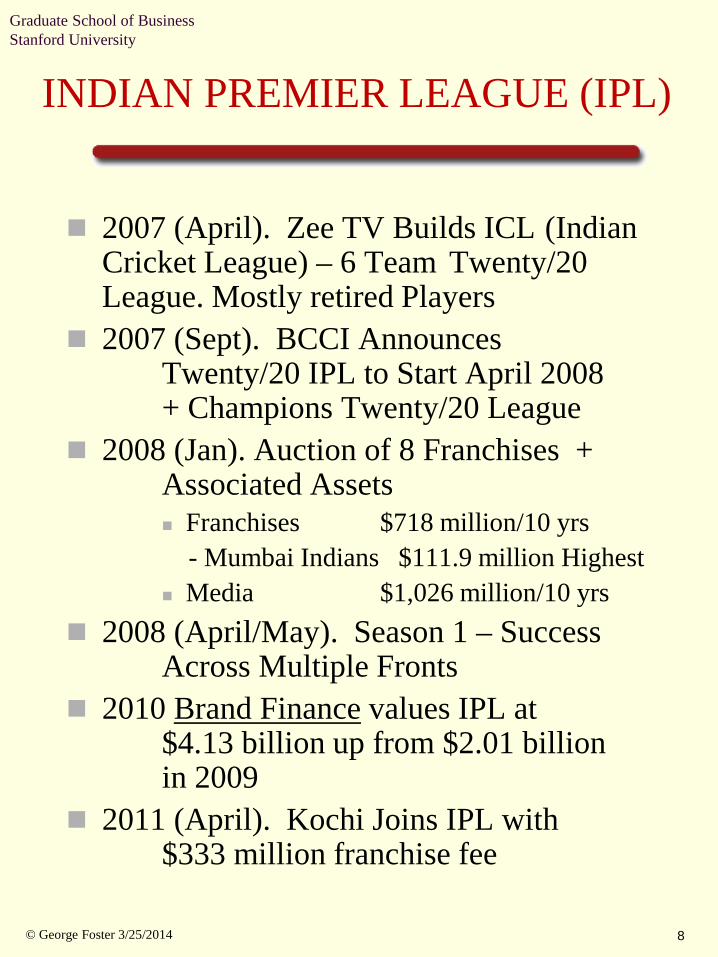
2007 (April). Zee TV Builds ICL (Indian Cricket League) – 6 Team Twenty/20 League. Mostly retired Players
2007 (Sept). BCCI Announces Twenty/20 IPL to Start April 2008 + Champions Twenty/20 League
2008 (Jan). Auction of 8 Franchises + Associated Assets
Franchises $718 million/10 yrs - Mumbai Indians $111.9 million Highest Media $1,026 million/10 yrs
2008 (April/May). Season 1 – Success Across Multiple Fronts
2010 Brand Finance values IPL at $4.13 billion up from $2.01 billion in 2009
2011 (April). Kochi Joins IPL with $333 million franchise fee
8
INDIAN PREMIER LEAGUE (IPL)
Graduate School of Business Stanford University
© George Foster 3/25/2014
Competitors to Existing Leagues USFL (1983 – 1987) and XFL (2001)
in U.S. Super League (1997) in Australia
MMA Competitors to UFL Spill Red Ink – IFL and Pro-elite
Shifts Within Competitive Landscape Champs – IFL – IndyCar v. Nascar
Declining Sectors Horse Racing Boxing Bowling (Ten-Pin)
U.S. Motor Raang – CART v. IRL While Nascar Solidifies!
Dot-Com Implosions Quokka
9
Sporting Industry Has Continuing Evidence of Mega Asset Destruction / Asset Writeoffs

Graduate School of Business Stanford University
© George Foster 3/25/2014 10
The XFL One-Season Flame Out
XFL - UPN (2001)
0.7
2.1
1.51.4
1.21.1
1.0
0.7 0.60.7
3.1
0.0
0.5
1.0
1.5
2.0
2.5
3.0
3.5
4.0
1 2 3 4 5 6 7 8 9 10 11 12 13
Week
Ratin
g
9.5
4.6
3.12.6
2.4 2.4
1.6 1.81.5 1.5
1.82.1
0.0
1.0
2.0
3.0
4.0
5.0
6.0
7.0
8.0
9.0
10.0
1 2 3 4 5 6 7 8 9 10 11 12 13
Ratin
g
Week
XFL - NBC (2001)
How Quickly can TV Ratings Sink?
Graduate School of Business Stanford University
© George Foster 3/25/2014
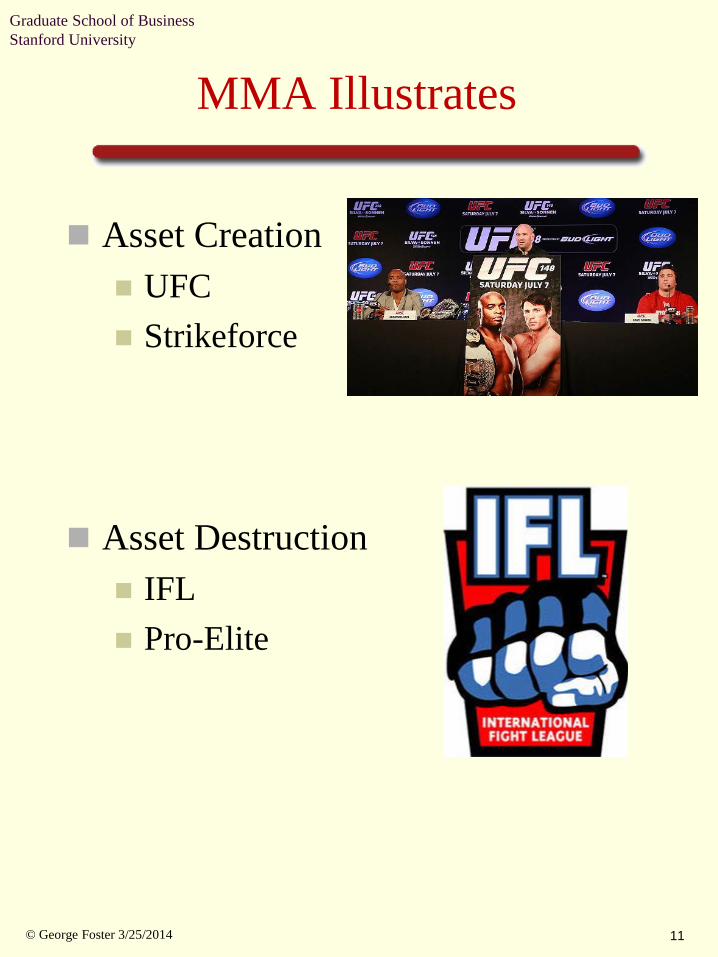
Asset Creation UFC Strikeforce
Asset Destruction IFL Pro-Elite
11
MMA Illustrates

Graduate School of Business Stanford University
© George Foster 3/25/2014
UFC PRIDE IFL Pro-Elite Strikeforce Affliction Bellator
1993
1994
1995
1996
1997
1998
1999
2000
2001
2002
2003
2004
2005
2006
2007
2008
2009 Feb
2010
2011
2012
1993 1997-07 to Zuffa
2006-08 Shut Down
2006-09 Shut Down
2006-11 to Zuffa
2008-09 Shut Down
2008 Acquisition
by MTV
12
MMA’s Competitive Landscape
Graduate School of Business Stanford University
© George Foster 3/25/2014
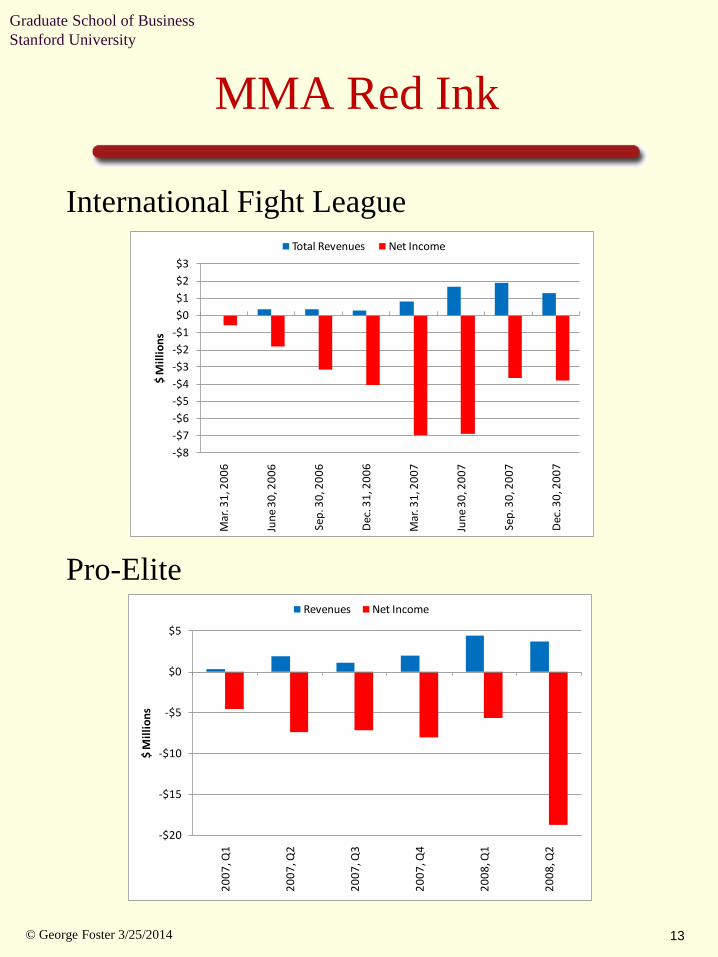
International Fight League Pro-Elite
13
MMA Red Ink
-$8-$7-$6-$5-$4-$3-$2-$1$0$1$2$3
Mar
. 31,
200
6
June
30,
200
6
Sep.
30,
200
6
Dec.
31,
200
6
Mar
. 31,
200
7
June
30,
200
7
Sep.
30,
200
7
Dec.
30,
200
7
$ M
illio
ns
Total Revenues Net Income
-$20
-$15
-$10
-$5
$0
$5
2007
, Q1
2007
, Q2
2007
, Q3
2007
, Q4
2008
, Q1
2008
, Q2
$ M
illio
ns
Revenues Net Income

Graduate School of Business Stanford University
© George Foster 3/25/2014
Annual Races held in the United States and Canada
14
The Decline of a Major U.S. Sport: North American Thoroughbred Racing
United States
Canada

Graduate School of Business Stanford University
© George Foster 3/25/2014
The pari-mutuel handle in the U.S. (in millions of nominal dollars):
Source: Data from “Pari-Mutuel Handle,” The Jockey Club Online Fact Book, accessed
September 16, 2011.
15
On-Track Betting Decline in Horse Racing
Off-track
On-track
Total
Graduate School of Business Stanford University
© George Foster 3/25/2014
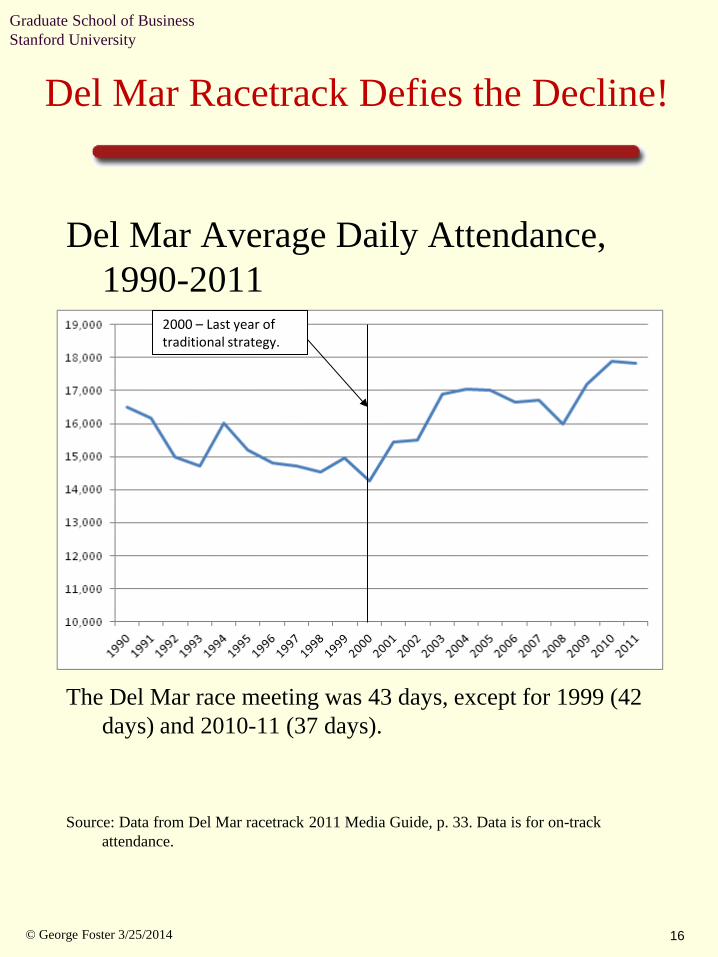
Del Mar Average Daily Attendance, 1990-2011
The Del Mar race meeting was 43 days, except for 1999 (42
days) and 2010-11 (37 days). Source: Data from Del Mar racetrack 2011 Media Guide, p. 33. Data is for on-track
attendance.
16
Del Mar Racetrack Defies the Decline!
2000 – Last year of traditional strategy.

Graduate School of Business Stanford University
© George Foster 3/25/2014 17
Del Mar Racetrack
Graduate School of Business Stanford University
© George Foster 3/25/2014 18
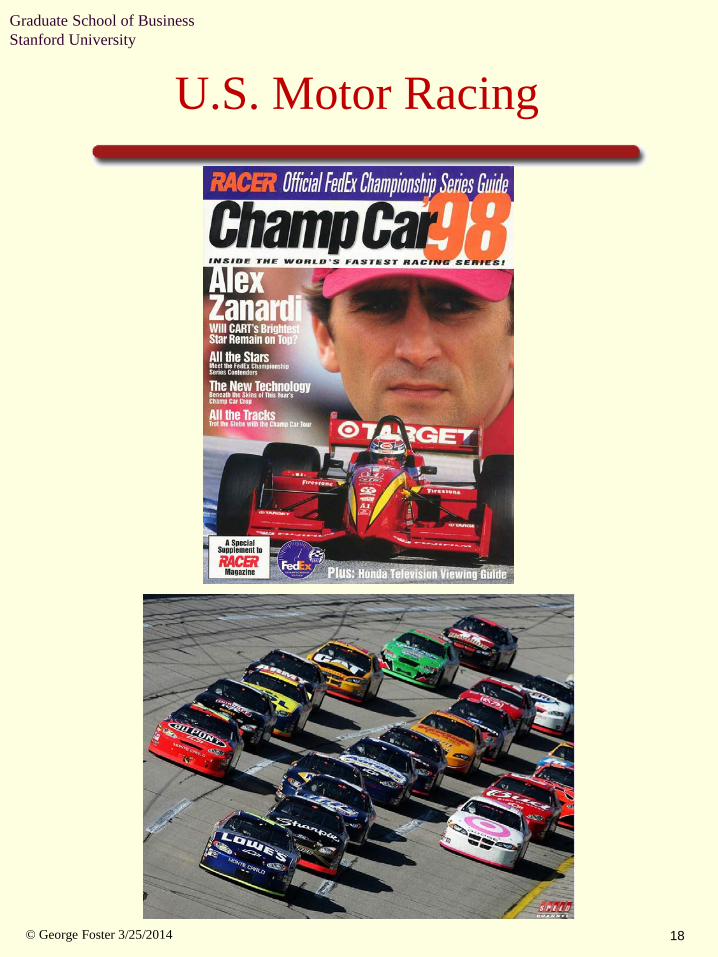
U.S. Motor Racing
Graduate School of Business Stanford University
© George Foster 3/25/2014 19
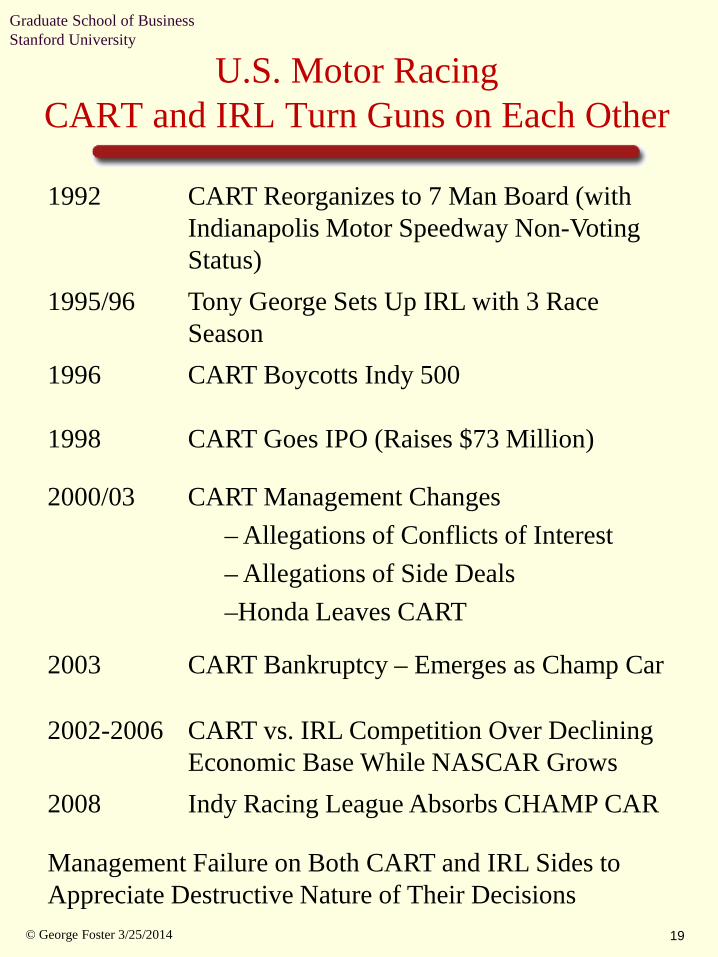
U.S. Motor Racing CART and IRL Turn Guns on Each Other
1992 CART Reorganizes to 7 Man Board (with Indianapolis Motor Speedway Non-Voting Status)
1995/96 Tony George Sets Up IRL with 3 Race Season
1996 CART Boycotts Indy 500
1998 CART Goes IPO (Raises $73 Million)
2000/03 CART Management Changes – Allegations of Conflicts of Interest – Allegations of Side Deals –Honda Leaves CART
2003 CART Bankruptcy – Emerges as Champ Car
2002-2006 CART vs. IRL Competition Over Declining Economic Base While NASCAR Grows
2008 Indy Racing League Absorbs CHAMP CAR
Management Failure on Both CART and IRL Sides to Appreciate Destructive Nature of Their Decisions
Graduate School of Business Stanford University
© George Foster 3/25/2014
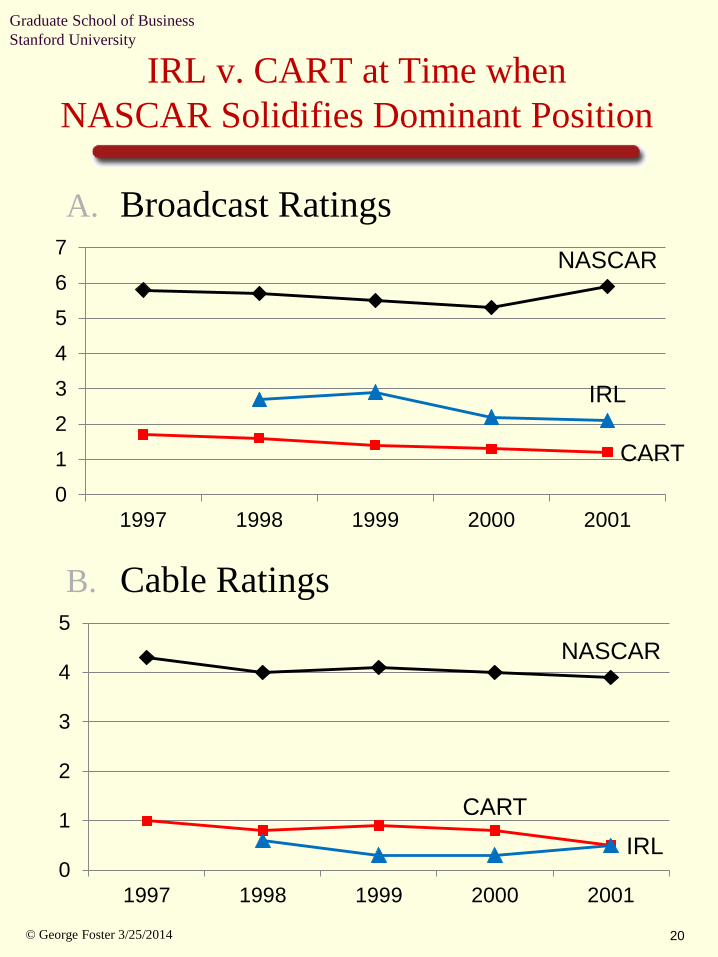
A. Broadcast Ratings
B. Cable Ratings
20
IRL v. CART at Time when NASCAR Solidifies Dominant Position
NASCAR
CART
IRL
01234567
1997 1998 1999 2000 2001
NASCAR
CART IRL
0
1
2
3
4
5
1997 1998 1999 2000 2001
Graduate School of Business Stanford University
© George Foster 3/25/2014
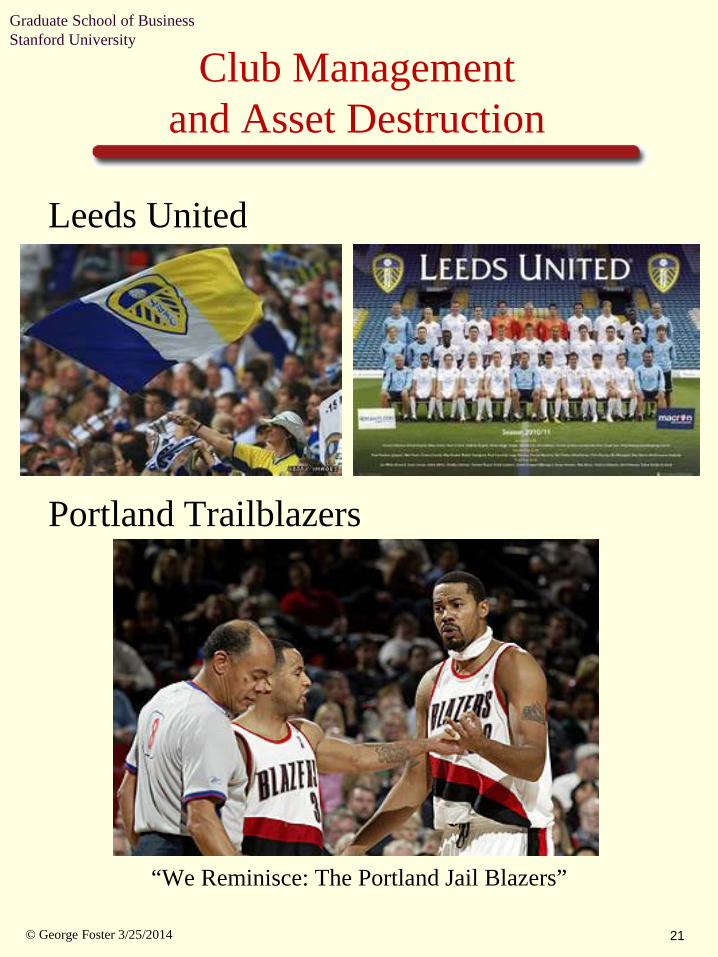
Leeds United Portland Trailblazers
“We Reminisce: The Portland Jail Blazers”
21
Club Management and Asset Destruction

Graduate School of Business Stanford University
© George Foster 3/25/2014 22
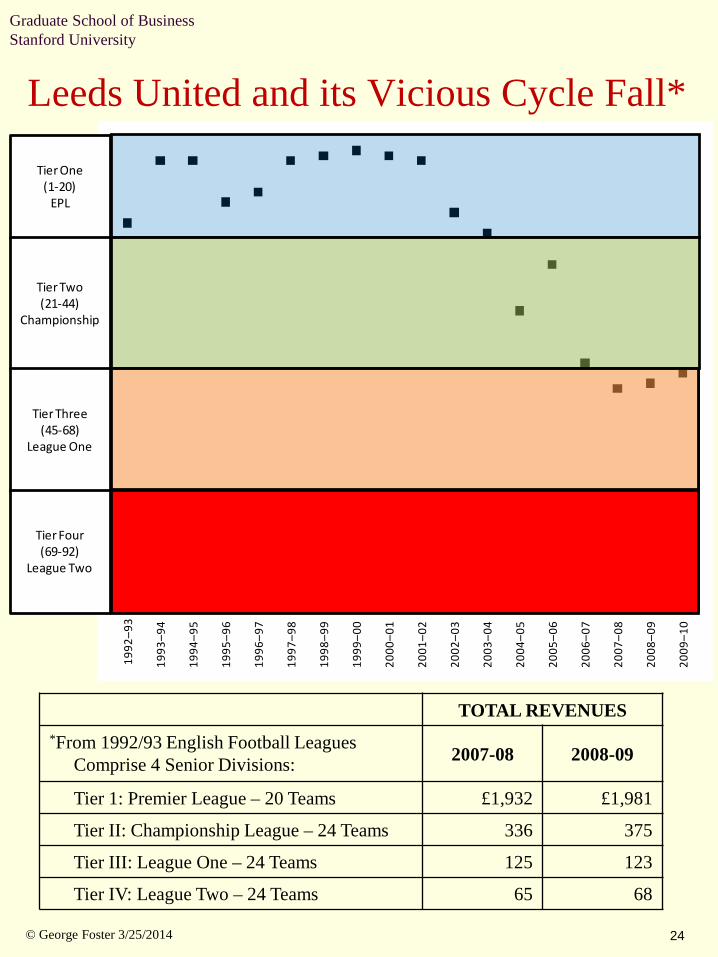
Clubs in Vicious Downward Circle: Leeds United Rolls the Dice and Loses!!
1996-1999 ERA Steady/Managed Growth Financing For New Player Acquisition From New
Equity Issues
1999-2002 “Roll The Dice” Era Strong Attendance At Elland Road High Wage Cost Fueled By Debt-Related Financing
(£60 Million Securitization)
2003 Vicious Downward Cycle High Level of Debt/Public Listing Status Created
Crushing Financial Crisis Fire Sale of Players Provided Short-Run Cash
Infusion May 2003 – Avoid Relegation But Sword Remains
Over Their Heads. Little Progress on Re-Negotiating Debt
May 2004 – Relegated To Championship League May 2007 – Relegated to League One
Graduate School of Business Stanford University
© George Foster 3/25/2014 23
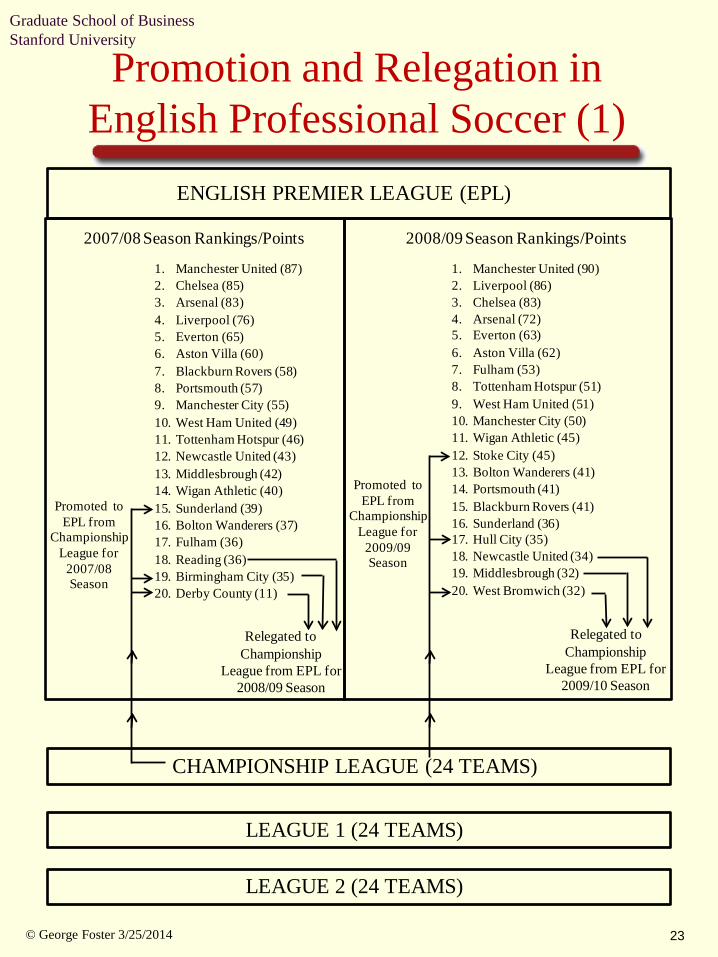
Promotion and Relegation in English Professional Soccer (1)
1. Manchester United (87)2. Chelsea (85)3. Arsenal (83)4. Liverpool (76)5. Everton (65)6. Aston Villa (60)7. Blackburn Rovers (58)8. Portsmouth (57)9. Manchester City (55)10. West Ham United (49)11. Tottenham Hotspur (46)12. Newcastle United (43)13. Middlesbrough (42)14. Wigan Athletic (40)15. Sunderland (39)16. Bolton Wanderers (37)17. Fulham (36)18. Reading (36)19. Birmingham City (35)20. Derby County (11)
1. Manchester United (90)2. Liverpool (86)3. Chelsea (83)4. Arsenal (72)5. Everton (63)6. Aston Villa (62)7. Fulham (53)8. Tottenham Hotspur (51)9. West Ham United (51)10. Manchester City (50)11. Wigan Athletic (45)12. Stoke City (45)13. Bolton Wanderers (41)14. Portsmouth (41)15. Blackburn Rovers (41)16. Sunderland (36)17. Hull City (35)18. Newcastle United (34)19. Middlesbrough (32)20. West Bromwich (32)
Relegated to Championship
League from EPL for 2008/09 Season
Relegated to Championship
League from EPL for 2009/10 Season
ENGLISH PREMIER LEAGUE (EPL)
CHAMPIONSHIP LEAGUE (24 TEAMS)
LEAGUE 1 (24 TEAMS)
LEAGUE 2 (24 TEAMS)
2007/08 Season Rankings/Points 2008/09 Season Rankings/Points
Promoted to EPL from
Championship League for
2007/08 Season
Promoted to EPL from
Championship League for
2009/09 Season
Graduate School of Business Stanford University
© George Foster 3/25/2014 24
Leeds United and its Vicious Cycle Fall* 19
92–9
3
1993
–94
1994
–95
1995
–96
1996
–97
1997
–98
1998
–99
1999
–00
2000
–01
2001
–02
2002
–03
2003
–04
2004
–05
2005
–06
2006
–07
2007
–08
2008
–09
2009
–10
Tier One(1-20)
EPL
Tier Two(21-44)
Championship
Tier Three(45-68)
League One
Tier Four(69-92)
League Two
TOTAL REVENUES *From 1992/93 English Football Leagues
Comprise 4 Senior Divisions: 2007-08 2008-09
Tier 1: Premier League – 20 Teams £1,932 £1,981
Tier II: Championship League – 24 Teams 336 375
Tier III: League One – 24 Teams 125 123
Tier IV: League Two – 24 Teams 65 68
Graduate School of Business Stanford University
© George Foster 3/25/2014 25
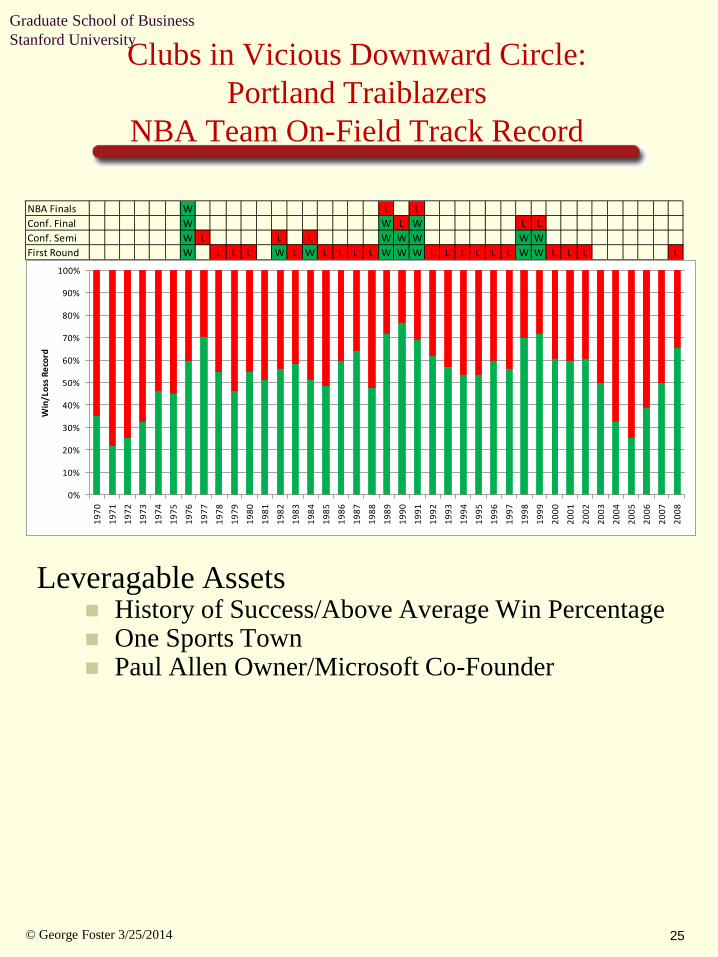
Clubs in Vicious Downward Circle: Portland Traiblazers
NBA Team On-Field Track Record
Leveragable Assets History of Success/Above Average Win Percentage One Sports Town Paul Allen Owner/Microsoft Co-Founder
NBA Finals W L LConf. Final W W L W L LConf. Semi W L L L W W W W WFirst Round W L L L W L W L L L L W W W L L L L L L W W L L L L
0%
10%
20%
30%
40%
50%
60%
70%
80%
90%
100%
1970
1971
1972
1973
1974
1975
1976
1977
1978
1979
1980
1981
1982
1983
1984
1985
1986
1987
1988
1989
1990
1991
1992
1993
1994
1995
1996
1997
1998
1999
2000
2001
2002
2003
2004
2005
2006
2007
2008
Win
/Los
s Rec
ord

Graduate School of Business Stanford University
© George Foster 3/25/2014 26
Risk Management Issues at Portland Trailblazers
Multiple High Risk Strategy Aging Players Risk (Scotty Pippen Highest Paid) Badly Behaving Player Recruiting Risk High Payroll Risk High Debt on Arena Risk
Financial Consequences/Forbes Estimates
Player Salaries
Club Revenues
Club Profitability
Player Salaries/ Revenues
1999-2000 $76.4 $97.3 -$12.8 78.5%
2000-2001 86.5 101.0 -19.3 85.6%
2001-2002 83.7 96.0 -22.8 87.2%
2002-2003 100.0 97.0 -85.1 103.1%
2003-2004 84.3 88.0 -47.0 95.8%
2004-2005 87.0 78.0 -31.5 111.5%
2005-2006 66.0 77.0 -15.2 85.7%
2006-2007 82.0 82.0 -25.1 100.0%
2007-2008 73.0 114.0 -0.9 64.0%

Graduate School of Business Stanford University
© George Foster 3/25/2014
Sports Industry One in Which Entrepreneurship on the March
Many Examples of Huge Asset Creation in Short Time Periods
Much Evidence of Innovation Opportunities at Club Level
Many Examples of Asset Destruction.
27
Themes
Pivotal Role of Self-Inflicted
Wounds