
ASCP API USCAP 3 22 2015 Anand Dighe Meeting (CM)/CM28-15...Outline • The need for computational...
63
Sld Anand Dighe, MD, PhD Associate Pathologist Director, Core Laboratory Massachusetts General Hospital Boston, MA A joint collaboration between Mining of Laboratory Data for Test Utilization - Abnormal Laboratory Value Interpretation
-
Upload
truongkien -
Category
Documents
-
view
216 -
download
3
Transcript of ASCP API USCAP 3 22 2015 Anand Dighe Meeting (CM)/CM28-15...Outline • The need for computational...

Sld
Anand Dighe, MD, PhDAssociate Pathologist
Director, Core LaboratoryMassachusetts General Hospital
Boston, MA
A joint collaboration between
Mining of Laboratory Data for Test Utilization - Abnormal
Laboratory Value Interpretation

Outline
• The need for computational pathology in clinical care
• Why it is fundamentally different than current care models and requires new thinking, infrastructure development, and collaborations
• Approach to integrate computational techniques into our routine clinical work to improve utilization and the value of test results

IOM Report (Best Care at Lower Cost—2012)
• Medical knowledge increasing at rapid pace
• The amount and complexity of data that can be extracted from blood, tissue, fluid, and imaging will continue to increase
• Patient care remains poorly delivered
• The challenge for healthcare will be to do less (less redundant and ineffective/harmful treatments) with less
MALDI TOF MS
PLoS One. 2014 May 29;9(5):e97954

U.S. Healthcare: Missed Opportunities, Waste, and Harm
The IOM’s Vision to Improve Care and Reduce Waste New Tools
• Computing Power • Connectivity • Improvements in organizational capabilities
• Collaboration between teams of clinicians and with patients

Clinical Computational Pathology
• Computational pathology is more than advanced platforms (total lab automation, mass spec, NGS, imaging)
• The key differentiator is the use of data integration and mathematical approaches
• Numerous examples of clinical computational pathology exist
MIT Integration Bee 2013

• Data integration: Rules-based evaluation of CBC/differentials
• Imaging integration. When necessary, system digitally captures WBC images and computer classifies them based on a set of objective criteria as well as comparison with an imaging library. Imaging not separate but a part of the hematology workflow.
• Decision support rules based on current and prior results, analyzer data, physician, patient Operator alertsthat guide the workup
“Computational hematology” works because almost all relevant data is structured (including imaging data)and there is a modifiable rules engineand data management system
“Computational Hematology”Rules Based Hematology and Digital Image Analysis

Computational Microbiology
• Mass spec identification of organisms becoming the norm
• More accurate, faster• Relies on bioinformatics and
comparison with library of known spectra
• Enters the realm of computational pathology when we start to combine this organism ID data with pharmacy data (antibiotic usage), drug resistance data, and the resistance antibiogram

• Review clinical history of all patients newly started on a carbapenem
• Review current and last 3 months of microbiology data
• Determine “appropriate” versus “inappropriate” use of carbapenem
• If “inappropriate”, we send an e-mail to the ordering physician and care team
• If no change, we follow up with a page the next day
• Cost savings of >$100,000 per year
Infectious Disease Division
Pharmacy
Microbiology
Combining Lab and Clinical Data
(the hard way)
MGH antibiotic stewardship

Steps Toward Clinical Computational Pathology
• Raw material for computational pathology– Structured data– Connectivity (e.g. clinical data, genomic databases)
• Changing role of pathology within organizations– Adapting to the EMR centric organization– Collaboration with other departments
• Getting started with computational approaches

WBC 84E3/mm3
HCT 23%
Plt 59E3/mm3
Neutr 94%
Meta 2%
Lymph 0%
Myelo 2%
Mono 1%
Promyelo 1%
Blast 0%
CD33+ CD45+: 99%, CD33+ CD34+: <1%
nuc ish (ABL1x3),(BCRx3),(ABL1 con BCRx2) [45/50]
Non‐contrast abdomen CT: splenomegaly
BCR/ABL1 of b3a2 Type: 85.5%
Clinical History:50 yo male presents w/ left upper quadrant pain, weight loss, low‐grade fevers, night sweatsPE: 99.0F, 110/70, 70 BPM, 20 RRModerate splenomegaly, bruises left shin, right arm
Clinical History:50 yo male presents w/ left upper quadrant pain, weight loss, low‐grade fevers, night sweatsPE: 99.0F, 110/70, 70 BPM, 20 RRModerate splenomegaly, bruises left shin, right arm
Current “Integration Engine”
• Although pathology data comprises a large part of the medical record much of the key data for computational pathology will be either clinical data not in pathology systems or data found in external databases
• Identifying the necessary data and gaining access to it are key steps

Components of the Analytical Data Warehouse
A key task is to catalog and gain access to the data required for computational pathology (decision support, integrated reporting, modeling, operations improvement)
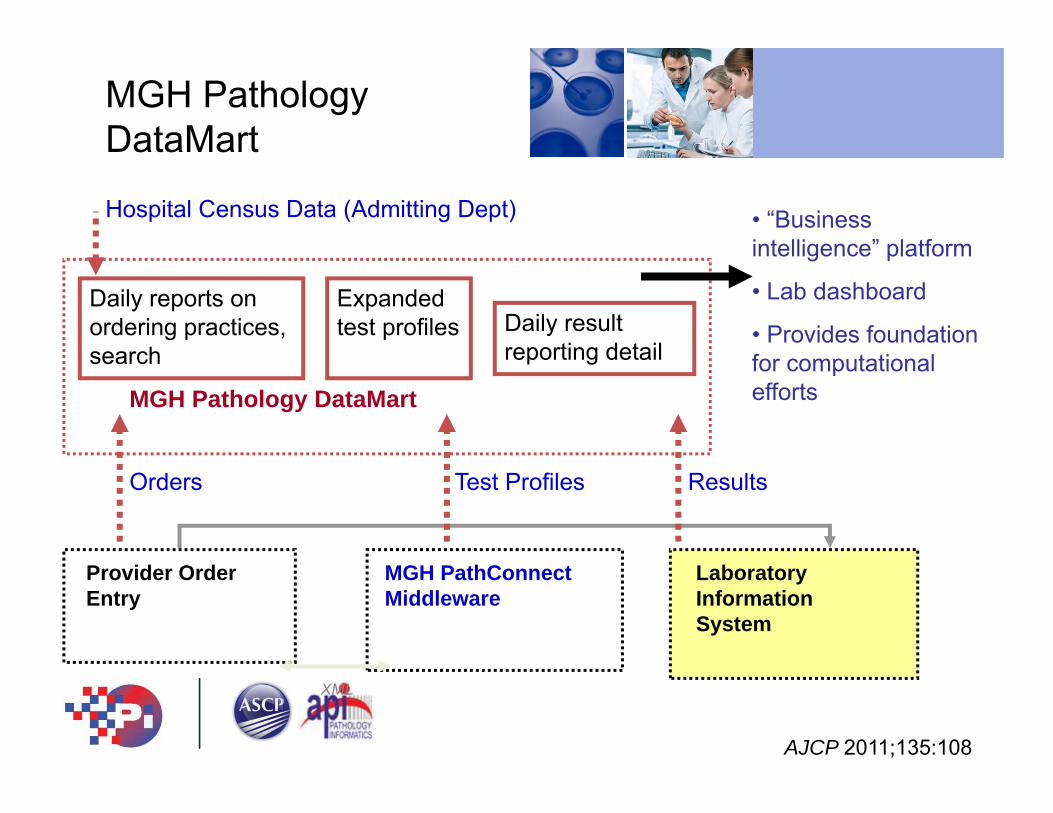
Daily reports on ordering practices, search
MGH Pathology DataMart
Expanded test profiles Daily result
reporting detail
MGH Pathology DataMart
Provider Order Entry
Laboratory Information System
MGH PathConnect Middleware
XML
• “Business intelligence” platform
• Lab dashboard
• Provides foundation for computational efforts
Orders Test Profiles Results
Hospital Census Data (Admitting Dept)
AJCP 2011;135:108

Variability/Waste in Reference Lab Testing: Top 25 Providers
Genetic tests ordered by top 25 providers account for 27% of entire reference lab expense
$0
$100,000
$200,000
$300,000
$400,000
$500,000
$600,000P
ED
I GE
NE
TIC
S (A
)
NE
UR
OLO
GY
(B)
PE
DI G
EN
ETI
CS
(C)
PE
DI G
EN
ETI
CS
(D)
PE
DI G
EN
ETI
CS
(E)
OB
GY
N (F
)
PE
DI N
EU
RO
LOG
Y (G
)
NE
UR
OLO
GY
(H)
NE
UR
OLO
GY
(I)
PE
DI N
EU
RO
LOG
Y (J
)
PE
DI N
EU
RO
LOG
Y (K
)
OB
GY
N (L
)
NE
UR
OLO
GY
(M)
NE
UR
OLO
GY
(N)
PE
DI I
D (O
)
PE
DI N
EU
RO
LOG
Y (P
)
PE
DI G
EN
ETI
CS
(Q)
NE
UR
OLO
GY
(R)
PE
DI N
EU
RO
LOG
Y (S
)
OB
GY
N (T
)
PE
DI G
EN
ETI
CS
(U)
NE
UR
OLO
GY
(V)
NE
UR
OLO
GY
(W)
OB
GY
N (X
)
PE
DI P
ULM
ON
AR
Y (Y
)
Ann
ual R
efer
ence
Lab
Spe
ndin
g
0%
5%
10%
15%
20%
25%
30%
% o
f Tot
al E
xpen
ses
High level of variability among providers

$0
$50,000
$100,000
$150,000
A D Y s 74 B N J G M x C h o k t m 54 57 67 71 E S X O b Z p 53 58 64 63 F I P K c f H a U u 68 L Q g l d 55 62 75 R W T z r y 66 72 e V w n v 59 69
Clinician (LetterCode)
Act
ual M
inus
Exp
ecte
d C
ost
Cost in Excess of Expectation
behavior
emg
gen
memory
movement
other
pedi
stroke
Neurology Sendout Adjusted Expenditure, Accounting for Diagnosis
Combined sendout data with provider data, diagnosis, and economic modeling of care episodes link to provider P for P metric
Enterprise Pathology Data Warehouse
• Externalize the useful parts of the vast trove of data in CP LIS, AP LIS, BTS systems, imaging systems, and molecular systems in a format that can be shared and with sufficient structure for computation
• Pathology can bring a lot of value to the table with lab analytics, structured data, molecular curation
• Just as important is for pathology to understand, obtain access, and create linkages to enterprise EMRs and clinical data warehouses
Steps Toward Clinical Computational Pathology
• Raw material for computational pathology– Structured data– Connectivity (clinical data, external data)
• Changing the role of pathology within organizations– Adapting to the EMR centric organization– Collaboration with other departments
• Getting starting with computational approaches

The EMR Centric Enterprise
• Much of U.S. healthcare is dominated by a few large EMR vendors
• Little to no evidence that EMRs contribute to decreased cost or broadly improve patient safety or quality
• Most of current value of the EMR accrues downstream to actual patient care – Billing, incentive payments– Consolidation

EMR• EMR provides
– Platform for clinical interactions (orders, results, CDS interventions, reporting, etc)
– Key clinical and outcomes data for computational pathology
– Basis for the enterprise data warehouse
• Pathologists need to be represented across the EMR governing structure– Clinical Council, Clinical Content, Clinical Decision Support, Process redesign, Research, etc

Bringing Computational Pathology to Clinical Care
• Pathology needs to understand how computationally derived algorithms and decision support can be integrated into patient care
• Touchpoints:– CPOE– Results reporting– Clinical Decision Support – Quality and safety

Through 2010 in the U.S. only 12% of hospitals utilize computerized provider order entry
“Meaningful use” initiatives and other health care reforms are dramatically changing this
Advantages of CPOE• Opportunity to interact with the ordering clinician in real
time• Can present information to the clinician at the time of the
decision• Education is much less effective before or after the decision
• Links ordering physician tightly with the order, simplifying utilization audits
Computerized Provider Order Entry (CPOE)
Pathology must play a role in CPOE

Decision Support Needed…

Inpatient/ED/Outpatient Provider Order Entry
Providers
CPOE: Pathology’s Perspective
Laboratory Information System
Laboratory Staff
Lab Orders
Pathology must avoid from being “shut out” from the CPOE system
• Improved diagnosis
• Error reduction
• Utilization control
• Laboratory efficiency
• Decision support

MGH PathConnectMiddleware
Laboratory Staff
Permits Pathology to have control over Provider Order Entry screens
Inpatient/ED/Outpatient Provider Order Entry
Laboratory Information System
Lab Orders
MGH PathConnect Middleware
Web services
AJCP 2010 133:860
Providers
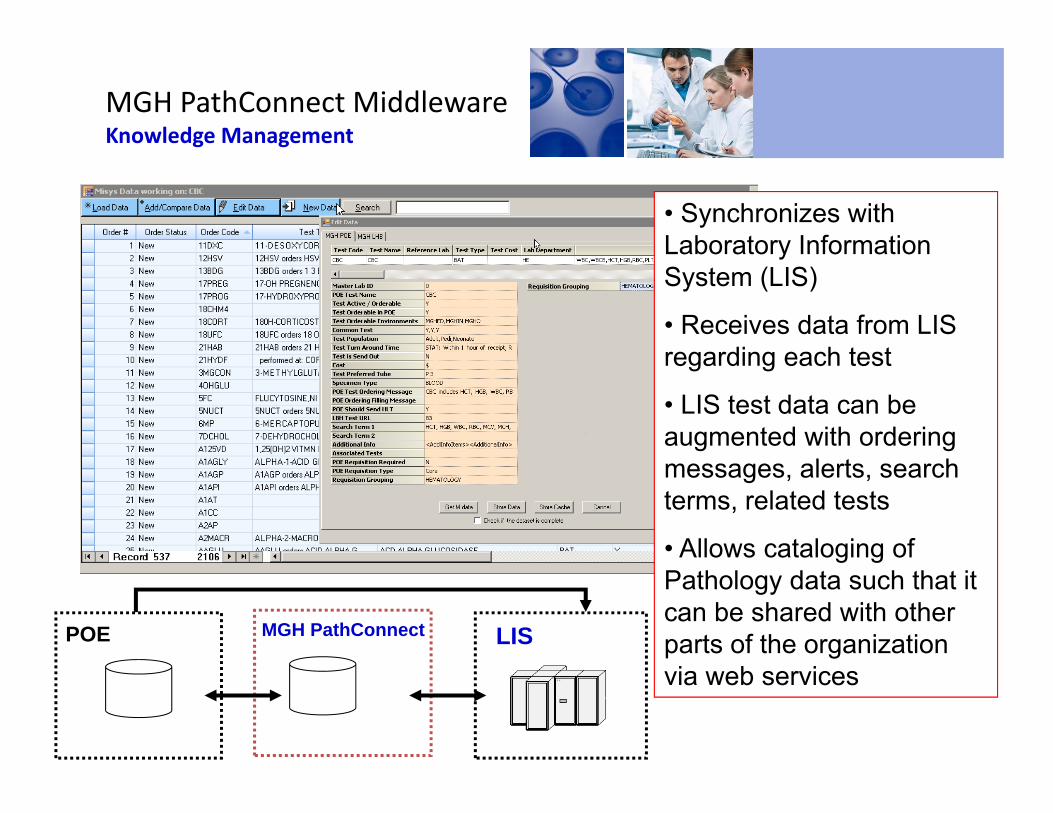
MGH PathConnect MiddlewareKnowledge Management
• Synchronizes with Laboratory Information System (LIS)
• Receives data from LIS regarding each test
• LIS test data can be augmented with ordering messages, alerts, search terms, related tests
• Allows cataloging of Pathology data such that it can be shared with other parts of the organization via web services
POE LISMGH PathConnect

MGH PathConnectMiddleware(5 minutes to create and test new alert with no IS involvement)

Order Entry: the Importance of Search
• Support synonyms
• Support misspellings
• Provide key test information (TAT, cost)
With 1,000 tests on the menu a robust search engine must be a part of all test order entry applications.
Provide information to guide appropriate utilization

Improving Vitamin D Utilization with CPOE
Search provides more than a list of possible matches
Provides information to guide appropriate utilization
Middleware enables rapid (minutes, to author and update test) responses to utilization issues
• Adding non-interruptive ordering message dropped 1,25 OH vitamin D orders by 70% (p < 0.001)
• Cost savings = $20K/yr

MGH Order Entry Screen
Passive, non-interruptive ordering message

CK‐MB Additional Info Screen (Interruptive Alert)

Inpatient CK‐MB Results Per Day
0
20
40
60
80
100
120
140
1/18/2
011
1/25/2
011
2/1/20
112/8
/2011
2/15/2
011
2/22/2
011
3/1/20
113/8
/2011
3/15/2
011
3/22/2
011
3/29/2
011
4/5/20
114/1
2/201
14/1
9/201
14/2
6/201
1
• Sustained 80% reduction in CK-MB orders within 3 weeks
• Cost savings of $30,000 per year
Added interruptive alert to POE

Just in Time Education
Long Term Learning
Goal: Alert should not only change current behavior but should educate so alert is triggered less over time
Monitoring a key to success
Understanding What Makes a Good Alert
Requires monitoring of all searches, orders, and user behavior
J Pathol Inform. 2012;3:11.

The Negative Impact of Daily Labs
• Wastes laboratory and nursing resources collecting and analyzing specimens
• Wastes provider resources reviewing results, following up on false positive/negative and mildly abnormal labs
• Contributes to cost of care, including increased blood transfusion
• Reduces patient satisfaction: increases number of blood draws
• Development of Hospital Acquired Anemia (HAA) may be associated with worse outcomes (increased readmission, 12 month mortality)
• Daily labs are a major contributor to HAA

POE Changes
Will still be able to enter daily labs but ALL daily labs will require a reason AND will be closely monitored
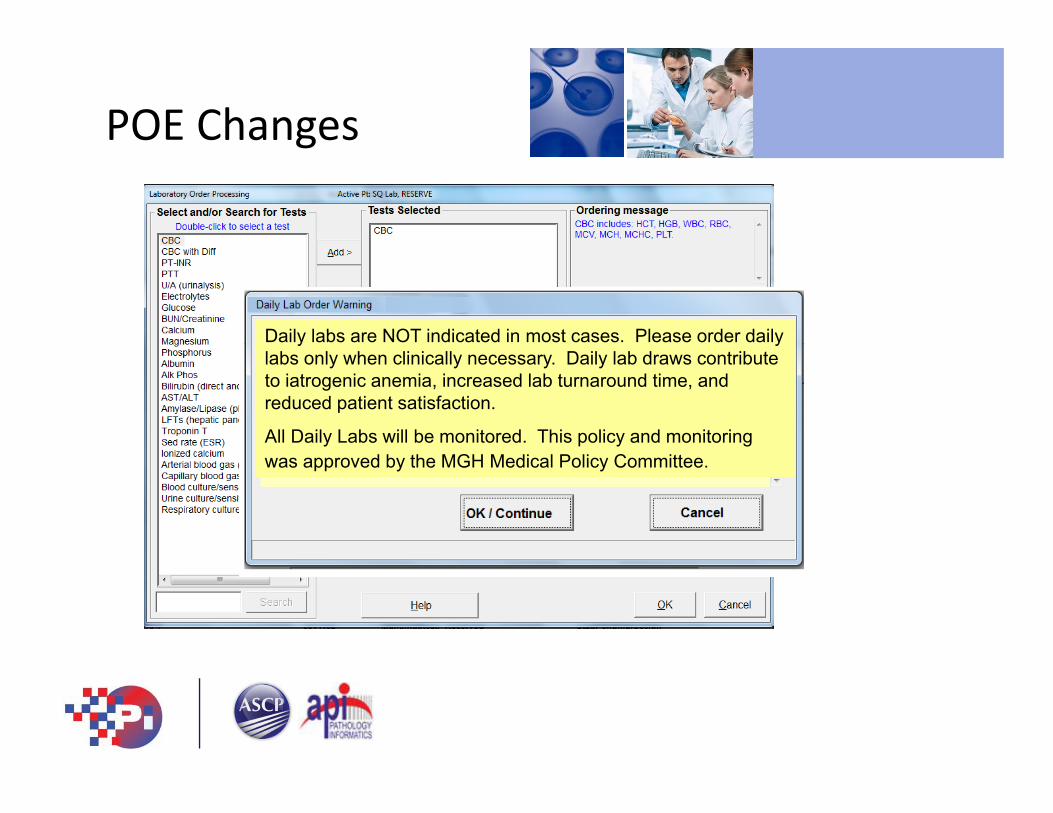
POE Changes
Daily labs are NOT indicated in most cases. Please order daily labs only when clinically necessary. Daily lab draws contribute to iatrogenic anemia, increased lab turnaround time, and reduced patient satisfaction.
All Daily Labs will be monitored. This policy and monitoring was approved by the MGH Medical Policy Committee.

POE Changes

Reduction in
Non-template Daily Orders

( )
-2.00%-1.00%0.00%1.00%2.00%3.00%4.00%5.00%6.00%7.00%8.00%
Album
in
Alk phos
CB
C w
ith diff Surrogate
(alymph)
Direct bilirubin
CB
C surrogate (R
BC
)
Mg
Bun
Cl
Cr
Glucose
Phos
K PT
PTT
Total bilibubin
Total proteinTest Volumes of Commonly Ordered Tests
• Normalized inpatient test volumes to daily inpatient census for a set of commonly ordered tests
• Compared a two week pre-intervention period (3/1—3/14) with a two week post intervention period (4/22—5/5)
• Inpatient routine testing volumes have declined 5% since POE intervention
Percentage Decline in Inpatient Test Volumes

Steps Toward Clinical Computational Pathology
• Raw material for computational pathology– Structured data– Connectivity (clinical data, external data)
• Changing role of pathology within organizations– Adapting to the EMR centric organization– Collaboration with other departments
• Getting started with computational approaches

Information Processing in the Laboratory Testing Process
Inter-pretationReportingProcessing/AnalysisCollectionOrdering
Post-AnalyticAnalyticPre-analytic
Middleware• Interference checking • Rules-based auto-dilution• Automated add-ons
Test Result Auto-verification
Info Buttons• Guidelines• Literature• Online resources
PathologyInterpretativeServices
PRO
CESS
Computerized Provider Order Entry (CPOE)• Test panels • Redundancy alerts• Clinical guidelines
Automated Specimen Collection Process
RFID/bar coding
• Enhanced Electronic Medical Record systems
• Actionable result reporting
Institutional ReflexAlgorithms
Enhanced Result
Generation

The Need for Computational Approaches
• Millions of results per year• Reported 24/7 with high levels of auto-verification• Rate of data production exceeds capacity of clinicians, pathologists and technologists to generate information • The human brain is not well equipped to process high dimensional data Human intuition doesn’t scale to multidimensional data but human subjective bias does.

Example Case
• A 86 year old man was admitted and placed on nafcillin
• Day 5: Cr 1.48 (still within the reference range)– Patient rising creatinine noted– Diagnosed with acute interstitial nephritis secondary to nafcillin
Acute Kidney Injury and the Limits of Standard Reporting
Acute Kidney Injury (AKI)
• Acute kidney injury AKI is a common problem in hospitalized patients
• AKI is frequently of iatrogenic origin
Issues with current Cr reporting
• Values are only flagged if outside of the reference range
• Values indicative of AKI often remain within the reference range
• Clinicians often quickly scan lab values for flagged result outside of reference range
Day Cr(mg/dl)
eGFR (mL/min/1.73m2)
1 0.81 >602 0.91 >603 1.03 >604 1.37 54

RIFLE Criteria for Acute Kidney Injury
• AKI primarily diagnosed based upon creatinine increase from baseline
• Increase by– ≥1.5 fold but <2 fold Risk
– ≥2.0 fold but <3 fold Injury
– ≥3.0 fold Failure

Traditional Reference Ranges are Inadequate for AKI Detection
Total =
~60,000
Results in rectangle
25% of patients with creatinine trends suggestive of AKI are within the “normal” range
AJCP, 2015 143:42.

Tracked Minimums vs. Delta Checks
Sensitivity: % of AKI (RIFLE risk level) flagged at each threshold
False positive rate:% of results not indicative of AKI that are flagged at each threshold
Flag Cr results increased over the 72 hour baseline by
• 0.3 mg/dl if the baseline is ≤ 2.0 mg/dL
or
• 0.5 mg/dl if baseline >2.0 mg/dL
AJCP, 2015 143:42.

T=0T=46 hrs
T=70 hrs
The Flags in Operation

Putting the Creatinine Rule in Perspective
• Demonstrates statistical and computational approaches that can result in a practical intervention with broad impact. Currently investigating clinical outcomes related to avoiding AKI
• Creatinine provides an example of single analyte interpretation—What about multi-analyte data?
• Can we use multi-analyte analysis to trap pre-analytic errors?

Which Specimen Results are
Spurious and which are Real?
Glu
K
BUN
Na
AST
Cl

Desired Black Box
OR
Refuse or add comment
Release to medical record

Proof of Concept: Spurious Glucose Values
• Spuriously elevated glucose values may occur on inpatients due to line draw errors
• Challenging for lab to identify spurious results in real time
• Inaccurate glucose results can lead to patient harm
• “Gold standard” available: retrospective medical record review able to rigorously determine spurious vs. real in almost all cases Use as test case for machine learning

Compile and Preprocess Data
Creating Decision Trees with
Supervised Machine Learning
Recursive partitioning to “purify” data and generate intuitive decision trees

Combining Decision Tree Output With Pathology Knowledge
Parameters Supplied in
Building Tree
Data Set Spurious Correctly Classified
Total Spurious
Real Correctly Classified
Total Real
Sensitivity (95% CI)
%
Specificity (95% CI)
%
Current Na, K, Cl, Bicarb, Anion Gap, Glucose
Training 57 64 84 92 89 (79-95) 91 (84-96)
Implemented algorithm performed prospectively on real patients with 74% sensitivity and with 100% specificity
AJCP 2012: 138: 406.
Pre-intervention, technologist judgment identified spurious results only 9% of time (9% sensitivity)

Machine Learning and Error
• Machine learning and similar techniques may be broadly applicable to aid in the detection of a wide variety of errors
• Such approaches may be useful in enhancing the diagnostic value of a broad array of existing laboratory testing
• In addition to finding new value in existing testing computational approaches can be used to predict the results of testing and suggest diagnoses and additional testing

Raw
Most Processed
“Given this patient’s test results and clinical data, administration of vancomycin will improve odds of survival from 37% to 87%.”
“EBV‐positive immunoblastic reaction, consistent with infectious mononucleosis”
Present
Comp Path
Atomic data
Interpretive comments
Diagnoses
Integrated Information
Predictive Information
103127
3.8
101
21 1.86
19

Test Result Prediction
• Approach: Apply machine learning to predict laboratory test results and outcomes from other laboratory test results
• Why predict test results?• Avoid redundancy• Predict tests that should be ordered• Amplify or modulate signal coming from results• Better understand disease mechanisms by uncovering relations between analytes
• Application: Intelligent decision support for test selection and result interpretation

Example: Ferritin Prediction
• Ferritin• A marker of iron stores
• Used in the diagnosis of iron deficiency• Must be interpreted in the setting of other clinical and laboratory data Thus a good problem for data integration
• Decreased in iron deficiency
• Increased in inflammation

Ferritin Data
1.0
0.9
0.4
0.3
0.2
0.1
0.8
0.7
0.6
0.5
0
Scaled Result
Patient-Case
FerritinMCH
MCVCreatinine
Gender
IronSGPT
HGB
TIBC
RDW
Platelet
RBC

Ferritin Classification Results
AUC ValuesImputation Method
Value
Mean 0.910MICE full 0.894Mice sel 0.903missForest 0.964

Discrepancies between Ferritin and Predicted Ferritin
Test dataset
FerritinResults
Predicted FerritinResults
compare
Differ by a factor of 10 or more Highly discrepant
resultsN=26 (1.7%)
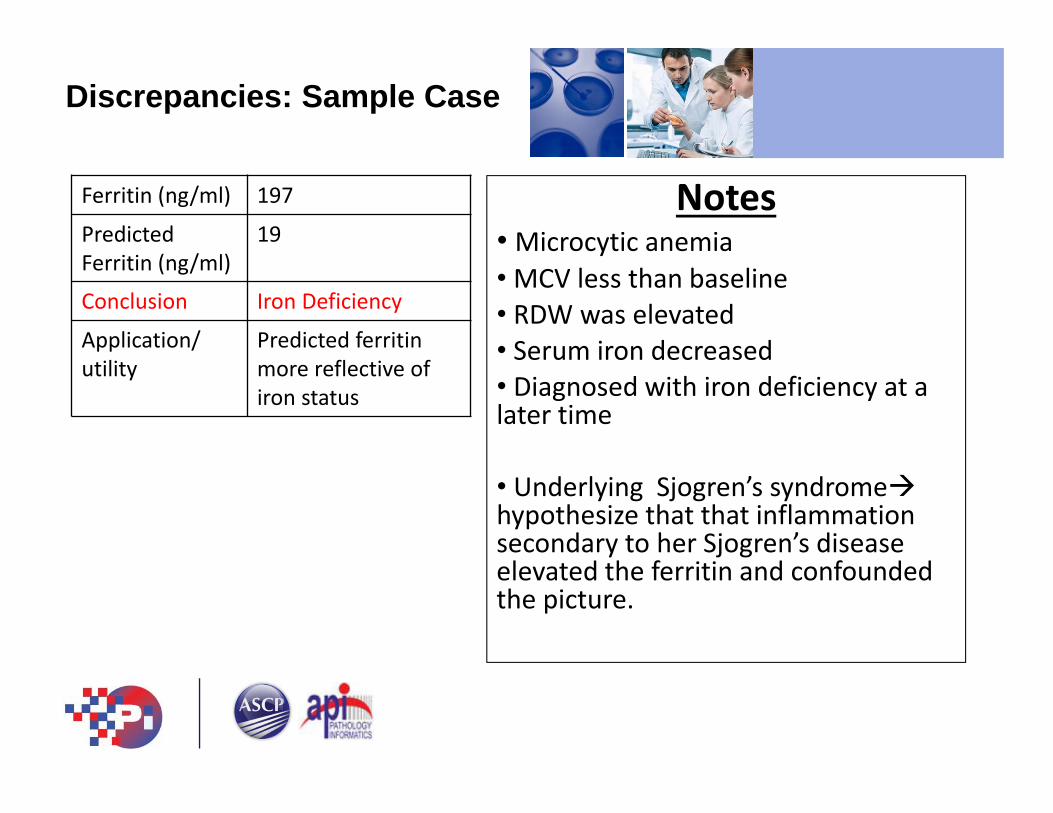
Discrepancies: Sample Case
Ferritin (ng/ml) 197
Predicted Ferritin (ng/ml)
19
Conclusion Iron Deficiency
Application/ utility
Predicted ferritinmore reflective of iron status
Notes• Microcytic anemia • MCV less than baseline • RDW was elevated • Serum iron decreased• Diagnosed with iron deficiency at a later time
• Underlying Sjogren’s syndromehypothesize that that inflammation secondary to her Sjogren’s disease elevated the ferritin and confounded the picture.

• Predicted Ferritin Offers Value in Interpreting Measured Ferritin
Goal: Refine and develop into a decision support flag to append a comment to ferritin results that are much higher than predicted
Clinical Utility ofFerritin Prediction
Laboratory informatics and computational approaches can provide the tools to address a wide variety of clinical issues.
• Orders: Pathology must exert control over the laboratory ordering modules of order entry systems to exert influence on diagnosis
• Results: Machine learning and predictive modeling may prove to be a valuable tools in integrating multiple elements of clinical and Pathology data to improve result interpretation
Summary

Thank You
MGH Medicine
Partners • Jason Baron
• Kent Lewandrowski
• Craig Mermel
• Ricky Grisson
• Ji Yeon Kim
• Chris Roy
• Irina Kamis
• Balaji Singh
• Shalini Batra
• Sidi Belkziz
• Hal Myers
• Alex Demyanov
• Hasan Bazari
• Xingxing Cheng
• Ishir Bhan
MGH Pathology
MIT CSAIL• Peter Szolovits
• Yuon Luo