Articol Brunello
25
CEO turnover in insider-dominated boards: The Italian case Giorgio Brunello a , Clara Graziano b, * , Bruno M. Parigi a a Department of Economics, University of Padua, Via del Santo 33, 35123 Padua, Italy b Department of Economics, University of Udine, Via Tomadini 30/a, 33100 Udine, Italy Received 2 October 2000; accepted 8 January 2002 Abstract We investigate CEO turnover in relationship to performance, ownership concentration and CEO ownership in a sample of 60 private companies listed on the Italian Stock Exchanges over the 9-year period 1988–1996. Concentrated ownership, family control, limited institutional in- vestors activism, and lack of main bank monitoring make Italy a corporate governance envi- ronment dominated by insiders. As a result, boards of directors are dominated by insiders and/or represent the interests of the controlling shareholders. Our main finding is that CEO turnover is negatively rel ated to firm performance also in this environment , but this relationship holds only if the controlling shareholder is not the CEO. Our findings suggest that insiders with large stakes monitor and replace under-performing outside CEOs. The paper offers positive em- pirical evidence that non-CEO controlling shareholders are a governance mechanism that pro- vides a substitute for outside members on boards of directors in lowering agency costs. When the CEO is an owner, however, we have all the negative aspects of insider-dominated boards. 2003 Elsevier Science B.V. All rights reserved. JEL classification: G34; J63 Keywords: CEO turnover; Corporate governance 1. Introduction CEO turnover is an important ingredient of corporate governance. Italy is an in- teresting example of CEO turnover because of its corporate governance environment largely dominated by insiders: Company ownership is concentrated in the hands of * Corresponding author. Tel.: +39-432-249216; fax: +39-432-249229/512529. E-mail address: clara.grazia [email protected]d.it (C. Graziano). 0378-4266/03/$ - see front matter 2003 Elsevier Science B.V. All rights reserved. doi:10.1016/S0378-4266(02)00244-3 Journal of Banking & Finance 27 (2003) 1027–1051 www.elsevier.com/locate/econbase
-
Upload
iulia-balaceanu -
Category
Documents
-
view
214 -
download
0
Transcript of Articol Brunello
8/15/2019 Articol Brunello
http://slidepdf.com/reader/full/articol-brunello 1/25
CEO turnover in insider-dominated boards:The Italian case
Giorgio Brunello a, Clara Graziano b,*, Bruno M. Parigi a
a Department of Economics, University of Padua, Via del Santo 33, 35123 Padua, Italyb Department of Economics, University of Udine, Via Tomadini 30/a, 33100 Udine, Italy
Received 2 October 2000; accepted 8 January 2002
Abstract
We investigate CEO turnover in relationship to performance, ownership concentration and
CEO ownership in a sample of 60 private companies listed on the Italian Stock Exchanges over
the 9-year period 1988–1996. Concentrated ownership, family control, limited institutional in-
vestors activism, and lack of main bank monitoring make Italy a corporate governance envi-ronment dominated by insiders. As a result, boards of directors are dominated by insiders
and/or represent the interests of the controlling shareholders. Our main finding is that CEO
turnover is negatively related to firm performance also in this environment, but this relationship
holds only if the controlling shareholder is not the CEO. Our findings suggest that insiders with
large stakes monitor and replace under-performing outside CEOs. The paper offers positive em-
pirical evidence that non-CEO controlling shareholders are a governance mechanism that pro-
vides a substitute for outside members on boards of directors in lowering agency costs. When
the CEO is an owner, however, we have all the negative aspects of insider-dominated boards.
2003 Elsevier Science B.V. All rights reserved.
JEL classification: G34; J63
Keywords: CEO turnover; Corporate governance
1. Introduction
CEO turnover is an important ingredient of corporate governance. Italy is an in-
teresting example of CEO turnover because of its corporate governance environment
largely dominated by insiders: Company ownership is concentrated in the hands of
*Corresponding author. Tel.: +39-432-249216; fax: +39-432-249229/512529.
E-mail address: [email protected] (C. Graziano).
0378-4266/03/$ - see front matter 2003 Elsevier Science B.V. All rights reserved.
doi:10.1016/S0378-4266(02)00244-3
Journal of Banking & Finance 27 (2003) 1027–1051
www.elsevier.com/locate/econbase

8/15/2019 Articol Brunello
http://slidepdf.com/reader/full/articol-brunello 2/25
families, families take active part in management, and there is marked separation of
control and cash flow rights. These factors are not mitigated by an active external
market for corporate control because of limited firm contestability through hostile
takeovers, underdeveloped capital markets, weak institutional investor activism, andthe absence of main bank relationships.
The object of this study is an investigation of CEO turnover when insiders run the
boards. We perform an econometric analysis of CEO turnover in relationship to per-
formance, ownership concentration and CEO ownership using a sample of compa-
nies listed on the Italian Stock Exchanges over the 9-year period 1988–1996. We
investigate whether there is a negative relationship between CEO turnover and firm
performance as most of the literature documents, and whether and how turnover is
affected by ownership concentration and by the CEO being a controlling share-
holder.
To preview our main results we find that:
i(i) CEO turnover is negatively related to firm performance;
(ii) the turnover performance relationship is significant when the CEO is not a con-
trolling shareholder, and it is absent altogether when the CEO is a controlling
shareholder.
The finding of a negative relationship between turnover and performance can be
interpreted as evidence that large blockholders do not remain passive but exercise
monitoring. Moreover, the significant relationship between turnover and perfor-
mance when the CEO is not a controlling shareholder is an indication of monitoring
of ‘‘outside’’ managers by the largest shareholder(s). On the other hand, the absence
of any turnover–performance relationship when the CEO is an owner points to the
high benefits of control that lead to entrenchment.
The main implication for the corporate governance literature is that when insiders
dominate boards of directors, potentially making the boards tools in the hands of
managers we do not have necessarily a failure of corporate governance. Financial
markets evolve to substitute governance mechanisms that put a check on agency
costs. The paper offers positive empirical evidence that non-CEO controlling share-
holders are a governance mechanism that provides a substitute for outside memberson boards of directors. Interestingly, the turnover performance relationship in our
study is stronger than that found for the US by Denis et al. (1997) and Weisbach
(1988). Thus, insider boards are not necessarily bad per se, and do not necessarily
lead to higher agency costs. On the contrary, having insiders on the board when
the CEO is not a controlling shareholder may actually be a positive complement
to the strategy of having large blockholders.
We measure the effectiveness of governance with CEO turnover measures. An im-
portant and closely related issue is whether firms that changed the CEO improved
their performance. Unfortunately the quality of our data does not allow us to pursue
this line of research in this paper.The rest of the paper is organized as follows. Section 2 discusses the institutional
aspects of Italian capitalism and the main features of boards of directors in Italy.
1028 G. Brunello et al. / Journal of Banking & Finance 27 (2003) 1027–1051

8/15/2019 Articol Brunello
http://slidepdf.com/reader/full/articol-brunello 3/25
Section 3 describes the sample data and reports some descriptive statistics on own-
ership structure and CEO turnover. Section 4 describes the empirical strategy. The
results of the regressions are presented in Section 5. Section 6 summarizes our fin-
dings and indicates possible extensions.
2. Institutional background
2.1. Corporate governance in Italy
CEO turnover is better understood in the context of the Italian system of corpo-
rate governance. This system is generally regarded as a poorly functioning one
because of the weak legal protection of small shareholders (see, for example, La Porta
et al., 1999), the underdeveloped capital markets, and the limited monitoring role of banks.
These factors offer ample possibilities of expropriation of small shareholders
through a number of schemes such as pyramids and cross-ownership (see Bebchuk
et al. (1999), for a theoretical model). In Italy, companies typically belong to groups
(i.e. they have a common controlling shareholder) which are often organized as pyra-
mids with a holding company at the top controlling one or more subsidiaries (see
Brioschi et al. (1990), for an analysis of pyramidal groups in Italy). Hierarchical
group control accounts for over 57% (32.6%) of manufacturing companies of more
(less) than 200 employees (Bianco et al., 1996). The holding company is often con-
trolled through cross shareholding with allied groups.
Pyramids and cross-ownership ties produce a marked separation of control rights
from cash flow rights. As a result, the benefits of control are larger than elsewhere;
for example, stocks enjoy an abnormally high voting premium. Zingales (1994) re-
ports an 82% premium associated with the voting rights of stocks of companies listed
on the Milan Stock Exchange against a voting premium of between 10% and 20%
common in other countries.
The literature predicts that under these circumstances a partial alleviation of the
agency conflicts between controlling and non-controlling shareholders may come from
concentrated ownership (see, for example, Shleifer and Vishny, 1986, 1997). Indeed adistinctive feature of the listed firms in Italy is a strong ownership concentration. Leav-
ing the detailed description of our sample of firms to Section 3, we anticipate here that
the largest shareholder owns on average more than 50% of common shares. The me-
dian value of largest shareholding is above 50%, which indicates that in more than half
of listed firms one shareholder owns the absolute majority of common shares. Similar
findings hold for other samples of large and medium-sized companies. In 1996 the larg-
est shareholder and the largest three shareholders owned 48% and 62% of the shares,
respectively (Bianco and Casavola, 1999). In the 123 private companies continuously
listed in the 1990–2000 period, the average share of the largest shareholder remained
almost unchanged at slightly less than 50% (CONSOB, 2001).For a number of reasons large independent shareholders and institutional inves-
tors play only a minor role in monitoring the controlling shareholder in this context.
G. Brunello et al. / Journal of Banking & Finance 27 (2003) 1027–1051 1029

8/15/2019 Articol Brunello
http://slidepdf.com/reader/full/articol-brunello 4/25
First, as Shleifer and Vishny (1997) point out, large minority shareholders may be
effective only in countries with relatively sophisticated legal systems. Second, in all
top 20 Italian companies by stock market capitalization in 1995 there was no second
largest shareholder with at least 10% of the shares (La Porta et al., 1999). In our sam-ple the average percentage of shares held by the second largest shareholder is
between 8% and 10%. Third, institutional investors hold a small fraction of the
equity of Italian firms. In 1997 mutual funds owned 6% of the stocks in the Milan
Stock Exchange capitalization, insurance companies 5%, pension funds 0.5% and
stock brokers 0.2% (Banca dItalia, 1998). In general, institutional investors are
not active investors (Bianchi and Enriques, 1999).
Although the above features make the Italian system more similar to the German
and Japanese models than to the Anglo-Saxon model, it differs significantly from
these models too. In the relationship-based systems, banks monitor insiders and re-
place the missing external markets for corporate control. However, bank governancein Italy has been ineffective for various reasons: State ownership of banks, the prac-
tice of multiple loans, the reliance on good collateral as the main criterion to grant
credit, and, unlike their German counterparts (Franks and Mayer, 1998), the legal
prohibition for banks to vote for the shares in custody or to solicit proxy votes
(Art. 2372 of the Civil Code, hereafter c.c.).
2.2. Insider-dominated boards
Concentrated ownership, the absence of large independent shareholders, and limi-
ted bank monitoring have a number of implications both for the composition and
for the functions of the boards of directors.
First, directors mainly represent the interests of the controlling shareholders, de-
spite the fact that the law explicitly addresses the conflicts of interests (Art. 1710,
2390, 2391 c.c.) and states that directors must act with due diligence in the interests
of all shareholders (Art. 2392 c.c.). A survey conducted in 1994 (Crisci and Tarizzo,
1995) on the boards of directors of 500 Italian companies provides a clear picture. To
the question ‘‘Who do you represent in the board?’’, 83% of the directors answered
‘‘the controlling shareholders’’ and only 12% ‘‘the minority shareholders’’.
Second, outside directors are rare, and insiders and affiliated outsiders dominateboards. Crisci and Tarizzo (1995) report that more than 70% of directors are execu-
tives and that in most instances directors had previous strong ties with the firm: In
64% of the cases directors were chosen from former managers or consultants of the
firm (the so-called ‘‘gray directors’’ or affiliated outsiders), in 26% of the cases from
either shareholders or their relatives, and only in 6% of the cases did the director
have no previous relationship with the firm. The same survey reports that the choice
of a new director is based more on personal contacts than on the search for the best
candidate. These data contrast with those on US boards where the average propor-
tion of outside directors ranges from 40% (Denis and Sarin, 1999) to 64% (Kaplan,
1994a). However, Denis and Denis (1994) find that US firms controlled by majorityowner-managers have a lower fraction of outsiders on their boards, and Denis and
Sarin (1999) show that there is a negative correlation between the presence of the
1030 G. Brunello et al. / Journal of Banking & Finance 27 (2003) 1027–1051
8/15/2019 Articol Brunello
http://slidepdf.com/reader/full/articol-brunello 5/25
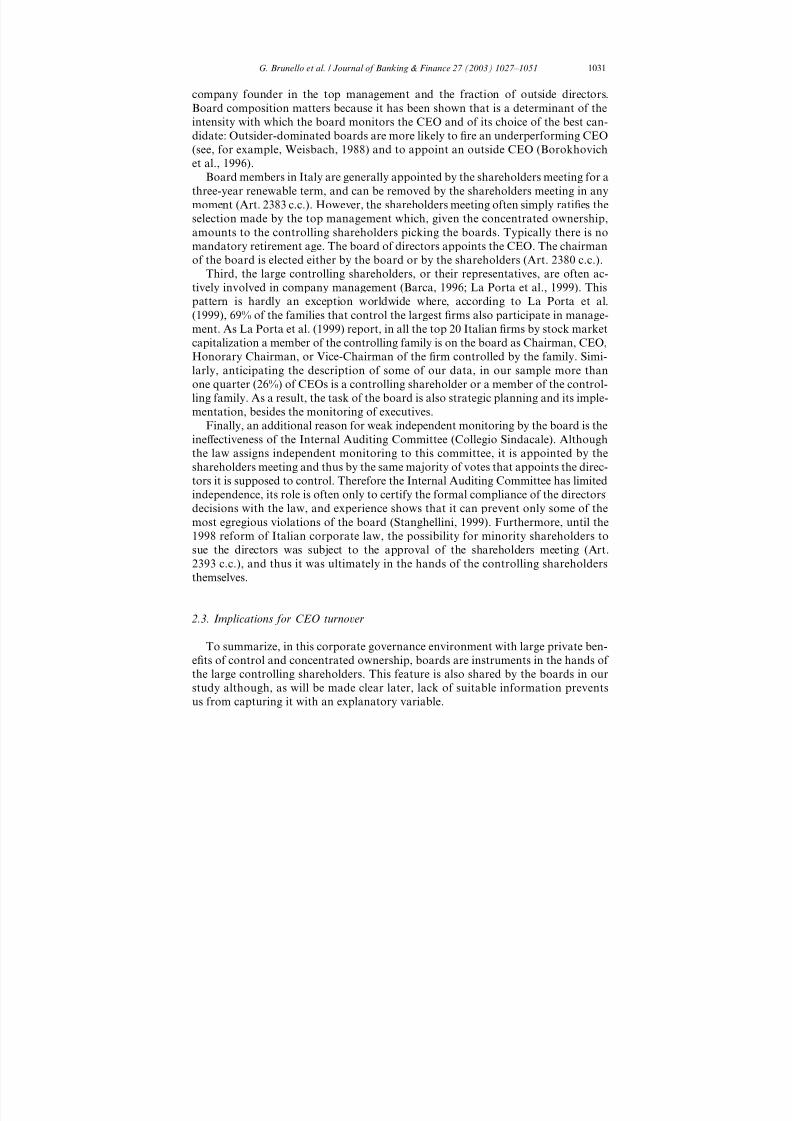
company founder in the top management and the fraction of outside directors.
Board composition matters because it has been shown that is a determinant of the
intensity with which the board monitors the CEO and of its choice of the best can-
didate: Outsider-dominated boards are more likely to fire an underperforming CEO(see, for example, Weisbach, 1988) and to appoint an outside CEO (Borokhovich
et al., 1996).
Board members in Italy are generally appointed by the shareholders meeting for a
three-year renewable term, and can be removed by the shareholders meeting in any
moment (Art. 2383 c.c.). However, the shareholders meeting often simply ratifies the
selection made by the top management which, given the concentrated ownership,
amounts to the controlling shareholders picking the boards. Typically there is no
mandatory retirement age. The board of directors appoints the CEO. The chairman
of the board is elected either by the board or by the shareholders (Art. 2380 c.c.).
Third, the large controlling shareholders, or their representatives, are often ac-tively involved in company management (Barca, 1996; La Porta et al., 1999). This
pattern is hardly an exception worldwide where, according to La Porta et al.
(1999), 69% of the families that control the largest firms also participate in manage-
ment. As La Porta et al. (1999) report, in all the top 20 Italian firms by stock market
capitalization a member of the controlling family is on the board as Chairman, CEO,
Honorary Chairman, or Vice-Chairman of the firm controlled by the family. Simi-
larly, anticipating the description of some of our data, in our sample more than
one quarter (26%) of CEOs is a controlling shareholder or a member of the control-
ling family. As a result, the task of the board is also strategic planning and its imple-
mentation, besides the monitoring of executives.
Finally, an additional reason for weak independent monitoring by the board is the
ineffectiveness of the Internal Auditing Committee (Collegio Sindacale). Although
the law assigns independent monitoring to this committee, it is appointed by the
shareholders meeting and thus by the same majority of votes that appoints the direc-
tors it is supposed to control. Therefore the Internal Auditing Committee has limited
independence, its role is often only to certify the formal compliance of the directors
decisions with the law, and experience shows that it can prevent only some of the
most egregious violations of the board (Stanghellini, 1999). Furthermore, until the
1998 reform of Italian corporate law, the possibility for minority shareholders tosue the directors was subject to the approval of the shareholders meeting (Art.
2393 c.c.), and thus it was ultimately in the hands of the controlling shareholders
themselves.
2.3. Implications for CEO turnover
To summarize, in this corporate governance environment with large private ben-
efits of control and concentrated ownership, boards are instruments in the hands of
the large controlling shareholders. This feature is also shared by the boards in ourstudy although, as will be made clear later, lack of suitable information prevents
us from capturing it with an explanatory variable.
G. Brunello et al. / Journal of Banking & Finance 27 (2003) 1027–1051 1031
8/15/2019 Articol Brunello
http://slidepdf.com/reader/full/articol-brunello 6/25
The fact that large shareholders control the boards in our sample leads to oppo-
site predictions on the intensity of the monitoring activity of the board. On the one
hand, as the empirical evidence on the US suggests, turnover and turnover–perfor-
mance sensitivity should be lower in insider-dominated boards and in boards thatinclude the company founder. By this token we should expect both low CEO turn-
over and low CEO turnover–performance sensitivity in Italy. On the other hand, the
strong ownership concentration in Italy provides the majority shareholders with all
the incentives to actively monitor outside managers. This, in turn, would lead us to
expect both high turnover and high turnover–performance sensitivity.
To determine the interplay of these two effects, we distinguish whether the CEO is
an owner. When the CEO is not an owner we expect the large shareholders in the
boards to exercise a close monitoring on the outside CEOs and replace those who
under-perform. When the CEO is an owner, however, we expect the entrenchment
effect to prevail.In the following sections we analyze the probability of CEO turnover as a func-
tion of firm performance, of ownership characteristics (percentage of shares held
by the largest and second largest shareholder, the presence of a syndicate among
the main shareholders) and of CEO ownership. Before specifying our empirical stra-
tegy in this institutional setting we present our data.
3. The data
3.1. Sources
The identity of CEOs and the measures of accounting-based firm performance are
from Calepino dellAzionista (1987–1997), an annual publication on Italian listed com-
panies. To eliminate discrepancies, information on CEOs is cross-checked with infor-
mation from another stock-exchange yearbook, Taccuino dellAzionista (1987–1997),
and from company filings with CONSOB (the Italian Securities and Exchanges regu-
lator). The data on the ownership structure are both from Taccuino dellAzionista
(1987–1997) and from company filings with CONSOB. Data on shareholders syndi-
cates and on the percentage of shares in each syndicate are from company filings withCONSOB and from Taccuino dellAzionista (1987–1997). Data on stock prices and
dividends are from the leading Italian business daily newspaper Sole 24 Ore (1987–
1998). Finally, data on the changes of nominal capital (e.g. stock splits, free distribu-
tions of stocks, rights issues, etc.) are from Taccuino dellAzionista (1987–1997) and
R&S (1994), a yearbook specializing in financial information about Italian companies.
3.2. Firm sample
We consider all firms listed on the Italian Stock Exchanges over the period 1988–
1996. From this universe we have excluded banks, insurance companies and financialholding companies because, for accounting reasons, before 1993 their performance
measures are not easily comparable with those of the other companies. We have also
1032 G. Brunello et al. / Journal of Banking & Finance 27 (2003) 1027–1051

8/15/2019 Articol Brunello
http://slidepdf.com/reader/full/articol-brunello 7/25
eliminated firms that are either state-owned or that have been listed for only part of
the period. New entries during the period are ignored. Hence, our sample includes
only ‘‘stayers’’, which can be observed for a relatively long period of time.
We choose to focus on stayers for three reasons: (a) As explained below, we needat least three consecutive years in the data to construct our measures of turnover and
changes in performance; (b) directors contracts typically last three years and we are
interested in capturing also the turnover that occurs after contracts expire; and (c) we
lack the information to compute turnover after a firm is de-listed. The empirical con-
sequences of the endogenous selection of stayers in the sample are discussed in the
next section. This gives us a sample of 60 firms, slightly less than one third of all
listed firms (the number of listed firms was 196 in 1988 and 215 in 1996). The average
sales of our sample firms in 1995 were 2166 billion lire, the average number of em-
ployees was 5913, and the average stock market capitalization was 894 billion lire.
3.3. Turnover
We construct a measure of CEO turnover at the firm level, as is done in the litera-
ture. Unfortunately, published sources do not allow us to identify the causes of
turnover, e.g. forced resignation, voluntary quit, death, illness, retirement, etc. Fur-
thermore, we have no information on whether the company charter specifies a man-
datory retirement age. Turnover is defined as the exit rate from the board between
year t and t þ 1. Thus turnover is the percentage of CEOs in a given board that left
the board during the period.
Since large companies may have more than one CEO, this percentage can take
values greater than 0 and smaller than 1. From this we have constructed the dummy
variable CEO TURNOVER that takes value 1 if turnover takes place, and 0 other-
wise. Our main source (Calepino dellAzionista) reports information on board mem-
bers only at the time of the survey (June 30 of each year). Therefore, we have no
information on spells on the board that start after the survey in year t and end before
the survey in year t þ 1. While this leads to a potential underestimate of turnover,
anectodal evidence indicates that cases of CEOs resigning, or being fired, after only
a few months in the job are rare.
3.4. Information on CEOs
Since 1983, when data on firm tenure started to be registered by CONSOB, for
each CEO we have information on the number of years on the board, on the total
number of directorships held, and also on individual age. Using this information,
we have constructed the following company level variables for the CEOs: The aver-
age age (AGE); the average number of years (TENURE) spent on a board since
1983; and the average number of positions held in boards of other companies
(NUMBER OF DIRECTORSHIPS). For each firm we have also constructed the
variable NUMBER OF CEOs.As mentioned above, we have classified CEOs according to whether they are con-
trolling shareholders. To do so we have integrated information about ownership
G. Brunello et al. / Journal of Banking & Finance 27 (2003) 1027–1051 1033

8/15/2019 Articol Brunello
http://slidepdf.com/reader/full/articol-brunello 8/25
structure (see the discussions in Section 3.6) with recent company history from Tac-
cuino dellAzionista and Sole 24 Ore, and constructed the dummy variable CEO
OWNERSHIP that takes value 1 when the CEO is a controlling shareholder or a
member of the controlling family, and 0 otherwise.
3.5. Performance measures
Turning to the measures of firm performance, we follow several previous studies
in using both accounting-based and market-based performance variables (see, for ex-
ample, the discussions in Weisbach (1988) and Kaplan (1994a)). As an accounting-
based measure we use the change in operating income, defined as earnings before
interest, taxes, depreciation and amortization, deflated by firm sales (DEBITDA).
We choose EBITDA (the standard way of analyzing the operating profitability of
a firm) rather than EBIT as in previous studies because the latter variable allowssome degree of choice of the depreciation.
We depart from previous literature also in that we divide the change in EBITDA
by firm sales rather than by the book value of firm assets (as, for example, Kaplan,
1994a; Weisbach, 1988). This is done for two reasons. First, in the Italian context
data on assets are less reliable than data on sales. Second, our sources do not report
asset data for all the firm-years. In addition to DEBITDA we also use STOCK RE-
TURN, defined as the sum of the percentage capital gain in a year plus the dividend
yield for that year, relative to industry returns, which we capture in the regressions
with a set of industry dummies, and corrected to take into account changes in nomi-
nal capital (e.g. stock splits, free distributions of stocks, rights issues, etc.).
Given the characteristics of the Italian environment, both DEBITDA and
STOCK RETURN are noisy indicators of performance. However, since the mea-
surement errors are not necessarily correlated, their combined use adds explanatory
power. All these measures refer to changes occurring between year t 1 and year t.
Given our definition of turnover we relate the probability of turnover to firm perfor-
mance over the previous calendar year. Since we have only information on CEOs at
survey time, the interval between the measured performance and the instance of
turnover will be longer than one year in some cases and shorter in others. Additional
company information includes SIZE (the logarithm of real sales).
3.6. Ownership structure
We have information on the percentage of common shares held by both the
LARGEST SHAREHOLDER and by the SECOND SHAREHOLDER. Beside
common shares, firms in our sample often have two other types of shares outstan-
ding: Preference shares (with or without voting rights, and with higher dividend
rights); and saving shares (without voting rights but with predetermined dividend
rights and dividend priority over the other types of share). Unfortunately we only
have information on common shares.Furthermore, ownership disclosure is mandatory only for shares exceeding 2% of
firm capital, which makes it difficult to identify second largest shareholders when
1034 G. Brunello et al. / Journal of Banking & Finance 27 (2003) 1027–1051
8/15/2019 Articol Brunello
http://slidepdf.com/reader/full/articol-brunello 9/25
they are small. Missing values of the shares of the second shareholders (less than 3%
of the observations) have been assigned a share of 1.99%.
In companies where no shareholder has the absolute majority of votes, a share-
holder syndicate often links the main blockholders. A shareholder syndicate is a co-alition of shareholders aimed at exercising some of their rights in a predetermined
fashion (Art. n.10, Law 18/2/1992, n.149). The most common types of syndicates
are voting trusts, consultation agreements, and agreements limiting the transfers
of blocks of shares. CONSOB (2001) reports that syndicates are present in more
than half of listed private companies where the largest shareholder owns less than
25% of the shares. In our sample of listed firms, about 20% have a syndicate with
an average percentage of common shares slightly above 50%, and the correlation
between the percentage of shares of the largest shareholder and the presence of
a syndicate is )0.48. We have constructed the dummy variable SYNDICATE
which takes value 1 if the main shareholders are linked by a syndicate, and 0 other-wise.
Table 1 provides a summary of the variables, their definition, and their source.
3.7. Descriptive statistics
Turning to CEO related variables, the CEOs average age and tenure in our sample
are 53.75 and 4.89 years, respectively. Because tenure is only available from 1983 on-
wards, the left censoring in the data imparts an obvious downward bias on this vari-
able. The average board size is slightly more than 10 members, similar to the size in
other one-tier board systems such as the US (Denis et al., 1997; Denis and Sarin,
1999) and Belgium (Renneboog, 2000). The average number of CEOs in the board
is 1.13, and the maximum number is 4.
Many directors sit on the boards of more than one firm. Interlocking membership
is a common feature in companies that belong to a group or are controlled through a
syndicate, and might lead to collusive behavior between directors (Bianco and Pag-
noni, 1997). While directors hold an average of 1.30 outside directorships, the num-
ber of outside directorships falls to 1.09 for the CEOs.
Episodes of CEO turnover occur in slightly more than half of the firms in oursample (31 firms). In the remaining firms, CEO turnover is always equal to zero.
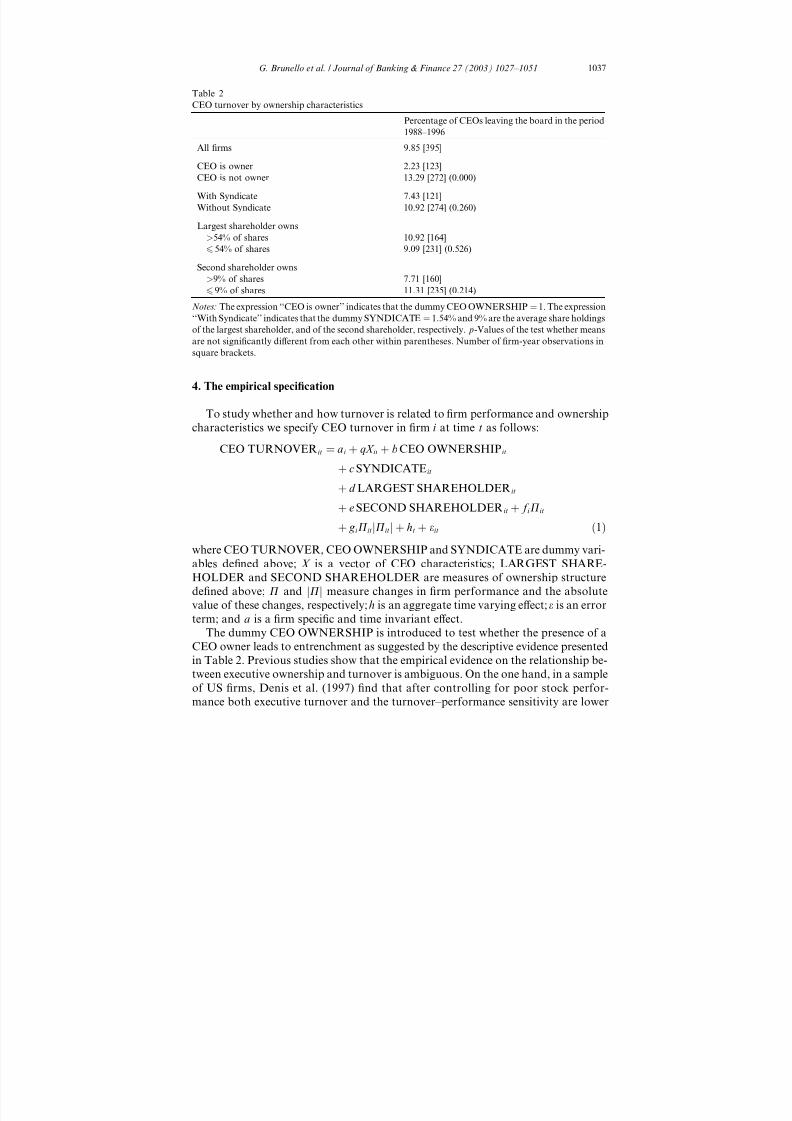
Table 2 shows that, on average, about 10% of the CEOs leave their post during
the sample period. Table 2 also shows that CEO turnover is associated with the owner-
ship characteristics of firms: In firms where the CEO is the controlling shareholder,
turnover is only 2.23%, significantly lower than in firms where the CEO is not the
controlling shareholder (13.29%). This difference is much larger than the one found
by Denis and Denis (1994) who show that top executive turnover in a sample of US
firms controlled by majority owner-managers is roughly one-half of the turnover of
the control firms. The presence of a syndicate is also associated with lower CEO
turnover, but the difference is not significant at the 5% level of confidence ( p-valueof the test: 0.260). Finally, Table 2 shows that CEO turnover is not significantly
lower in firms where the largest shareholder holds more than the average percentage
G. Brunello et al. / Journal of Banking & Finance 27 (2003) 1027–1051 1035

8/15/2019 Articol Brunello
http://slidepdf.com/reader/full/articol-brunello 10/25
of common shares (54%) and the second shareholder has more than the average per-
centage of common shares (9%).
To sum up, our data show that CEO turnover varies with important firm charac-
teristics, such as CEO ownership, but is not affected by other characteristics, such as
the presence of a syndicate, or by ownership concentration. The differences revealed
are based on the comparison of unconditional means and could simply reflect the
presence of other unmeasured differences, such as firm performance. For instance,
firms where the CEO is not a controlling shareholder could display higher CEO turn-
over in the sample because their average performance has been worse than the per-
formance of firms where the CEO is an owner. To disentangle the multiplicity of factors affecting CEO turnover, we need to turn to an econometric analysis of the
data.
Table 1
Definition of the variables
Variable Description Source
Panel A: Board characteristicsAGE Average age of CEOs Company filings with
CONSOB
TENURE Years spent on the board of a given company since 1983 Company filings with
CONSOB
NUMBER OF
DIRECTOR-
SHIPS
Average number of positions held in other boards by CEOs Company filings with
CONSOB
CEO OWNER-
SHIP
A dummy variable ¼ 1 when the CEO is a controlling
shareholder or a member of the controlling family,
and ¼ 0 otherwise
Authors classification
based on Taccuino
dellAzionista
CEO
TURNOVER
A dummy variable ¼ 1 if turnover takes place,
and ¼ 0 otherwise
Calepino dellAzionista
NUMBER
OF CEOs
Number of CEOs Calepino dellAzionista
Panel B: Firm characteristics
DEBITDA Annual change in earnings, before interest, taxes, deprecia-
tion and amortization, deflated by sales in the previous year
Calepino dellAzionista
STOCK RE-
TURN
Defined as the sum of the percentage capital gain in a
year and of the dividend yield for that year, corrected to take
into account changes in nominal capital (e.g. stock splits,
free distributions of stocks, rights issues, etc.)
Sole 24 Ore, R&S, Tac-
cuino dellAzionista
LARGEST
SHARE-HOLDER
Percentage of common shares held by largest shareholder Company filings with
CONSOB and TaccuinodellAzionista
SECOND
SHARE-
HOLDER
Percentage of common shares held by second largest
shareholder
Company filings with
CONSOB and Taccuino
dellAzionista
SYNDICATE A firm dummy variable ¼ 1 if the main shareholders are
linked by a shareholder syndicate, and ¼ 0 otherwise
Company filings with
CONSOB and Taccuino
dellAzionista
SIZE Logarithm of real sales Calepino dellAzionista
1036 G. Brunello et al. / Journal of Banking & Finance 27 (2003) 1027–1051
8/15/2019 Articol Brunello
http://slidepdf.com/reader/full/articol-brunello 11/25
4. The empirical specification
To study whether and how turnover is related to firm performance and ownership
characteristics we specify CEO turnover in firm i at time t as follows:
CEO TURNOVERit ¼ ai þ qX it þ bCEO OWNERSHIPit
þ cSYNDICATEit
þ d LARGEST SHAREHOLDERit
þ eSECOND SHAREHOLDERit þ f iPit
þ g iPit Pit j j þ ht þ eit ð1Þ
where CEO TURNOVER, CEO OWNERSHIP and SYNDICATE are dummy vari-
ables defined above; X is a vector of CEO characteristics; LARGEST SHARE-
HOLDER and SECOND SHAREHOLDER are measures of ownership structure
defined above; P and Pj j measure changes in firm performance and the absolute
value of these changes, respectively; h is an aggregate time varying effect; e is an error
term; and a is a firm specific and time invariant effect.
The dummy CEO OWNERSHIP is introduced to test whether the presence of a
CEO owner leads to entrenchment as suggested by the descriptive evidence presented
in Table 2. Previous studies show that the empirical evidence on the relationship be-
tween executive ownership and turnover is ambiguous. On the one hand, in a sampleof US firms, Denis et al. (1997) find that after controlling for poor stock perfor-
mance both executive turnover and the turnover–performance sensitivity are lower
Table 2
CEO turnover by ownership characteristics
Percentage of CEOs leaving the board in the period
1988–1996All firms 9.85 [395]
CEO is owner 2.23 [123]
CEO is not owner 13.29 [272] (0.000)
With Syndicate 7.43 [121]
Without Syndicate 10.92 [274] (0.260)
Largest shareholder owns
>54% of shares 10.92 [164]
654% of shares 9.09 [231] (0.526)
Second shareholder owns>9% of shares 7.71 [160]
69% of shares 11.31 [235] (0.214)
Notes: The expression ‘‘CEO is owner’’ indicates that the dummy CEO OWNERSHIP¼ 1. The expression
‘‘With Syndicate’’ indicates that the dummy SYNDICATE ¼ 1.54% and 9% are the average share holdings
of the largest shareholder, and of the second shareholder, respectively. p-Values of the test whether means
are not significantly different from each other within parentheses. Number of firm-year observations in
square brackets.
G. Brunello et al. / Journal of Banking & Finance 27 (2003) 1027–1051 1037
8/15/2019 Articol Brunello
http://slidepdf.com/reader/full/articol-brunello 12/25
the higher the officers equity ownership. They also document that turnover is lower
when the executive is a member of the founding family (see also Rosenstein and
Wyatt, 1997).
On the other hand, boards with significant managerial ownership are more likelyto behave in the interest of shareholders (Morck et al., 1988) and are more likely to
have better information on strategies (Rosenstein and Wyatt, 1997). Furthermore, as
suggested by Franks and Mayer (2001), ‘‘concentrated ownership may be more effec-
tive when it is in the hands of principals, for example families, than it is with agents’’.
Indeed in Italy ownership concentration is often of the first type as owners are di-
rectly involved in firm management.
With the dummy SYNDICATE we want to test the effect of the presence of a syn-
dicate on turnover. 1 Syndicates are designed to maintain control and may strengthen
entrenchment of the controlling shareholder. At the same time, companies with a
syndicate have more outside equity and are more exposed to the instability of coali-tion control, thus they are more contestable than companies with just one controlling
shareholder, which, in turn, may increase turnover.
By including the variable LARGEST SHAREHOLDER we want to analyze
whether ownership concentration is associated with better internal monitoring. If
large shareholders play an important monitoring role, turnover and the turnover–
performance sensitivity should be stronger the larger the controlling shareholder.
Renneboog (2000), for example, finds that higher board turnover is positively corre-
lated with ownership concentration in Belgian listed companies. Less clear-cut find-
ings for Germany emerge from Kaplan (1994b), who finds that the relationship
between the management board turnover and firm performance does not vary with
ownership concentration or with bank voting power. Similar results are found in an-
other study on Germany by Franks and Mayer (2001) who, however, point out that
ownership structure matters in the dynamics of control: In transfers of ownership in
particular, large shareholders fare much better than minorities.
Previous studies on the US point to a monitoring role by large non-controlling
blockholders. Warner et al. (1988) find some evidence, albeit weak, of monitoring
by blockholders. Stronger results are reported by Denis et al. (1997) who find that
top executive turnover is positively related to the presence of an outside blockholder.
However, if the monitoring role of the second shareholder arises mainly in countrieswith sophisticated legal systems, as Shleifer and Vishny (1997) point out, we should
expect the second shareholder to play only a marginal role in Italy. To test whether
this is indeed the case we use the variable SECOND SHAREHOLDER.
In the specification we include the product of the performance variable and its ab-
solute value because we expect the sensitivity of CEO turnover to changes in firm
performance to vary with the size of these changes (in absolute value). There is some
evidence that the relationships between firm performance and top-executive compen-
sation, and between performance and the turnover of top executives, are not linear.
1 More than 10% of the firms in our sample (7 out of 60) change status with respect to the presence of a
syndicate pact.
1038 G. Brunello et al. / Journal of Banking & Finance 27 (2003) 1027–1051
8/15/2019 Articol Brunello
http://slidepdf.com/reader/full/articol-brunello 13/25
Kaplan (1994a) finds that both the turnover and the compensation of Japanese top
executives react differently to positive and negative earnings, and in particular
boards are quite passive except in extreme circumstances. Similarly Warner et al.
(1988) document that a true performance disaster is required before boards actuallyact. In a study on executive compensation in Italy Brunello et al. (2001) find that the
penalty for profits decline is larger than the reward for profits increase.
When a captures unobserved or unmeasured firm characteristics, ignoring these
effects in estimation leads to biased results (Greene, 1993, pp. 482–485). We deal with
this problem by introducing firm-specific dummies in the regressions. The use of
firm-specific dummies also captures the time invariant component of the selection
mechanism that allocates firms to ‘‘stayers’’ and ‘‘leavers’’ (firms that are quoted
on the Italian Stock Exchanges for only part of the sample period). Suppose that bet-
ter-quality firms are more likely to be quoted continuously on the stock exchange
than other firms are. If quality has a time invariant component, firm-specific dum-mies will capture it. Notice that the inclusion of firm dummies means that the emp-
irical analysis focuses exclusively on the sub-sample of firms (31 out of 60) that have
changes in their CEO turnover over time.
Assuming that the error term e has a normal distribution, we estimate the follow-
ing probit model:
Pr CEO TURNOVERit ð ¼ 1Þ ¼ U Z 0it b
ð2Þ
where Z is the vector of explanatory variables and b is the vector of the parametersgiven in Eq. (1). We assign the value 1 to the dummy variable CEO TURNOVER
when the percentage of CEO turnover in the firm is higher than 0, and the value 0
otherwise. 2 All regressions include time dummies that control for economy-wide
shocks, including aggregate price dynamics. The tables below report neither the
coefficient of these dummies nor the coefficients of firm specific dummies.
Since Z 0b has a normal distribution, interpreting probit coefficients requires think-
ing in a non-standard metric. To facilitate interpretation, we choose to report in the
tables with estimation results the marginal effect on the probability of turnover of
each explanatory variable, rather than its estimated coefficient. To illustrate, let Z 1t be a variable belonging to the vector Z and b1 the associated coefficient. The mar-
ginal effect of Z 1t is the change in the probability of turnover /ðZ 0it bÞb1, where / is
the normal density function, when Z 1t changes marginally.
Since we cannot identify and exclude episodes of CEO turnover due to retirement
from our data, we attempt to eliminate many instances of retirement by focusing
only on CEOs aged 70 or younger. 3 To further control for CEO turnover due to re-
tirement, we include in the regressions both AGE and TENURE.
2 We have also run ordered probit regressions where CEO TURNOVER is allowed to take more than 2
values, with no significant changes in the results.3 In Italy there is no mandatory retirement system and old age pensions usually start at 65. By focusing
on CEOs 70 or younger we capture the fact that most CEOs to stay on the job after 65.
G. Brunello et al. / Journal of Banking & Finance 27 (2003) 1027–1051 1039
8/15/2019 Articol Brunello
http://slidepdf.com/reader/full/articol-brunello 14/25
5. Results
5.1. The turnover–performance relationship
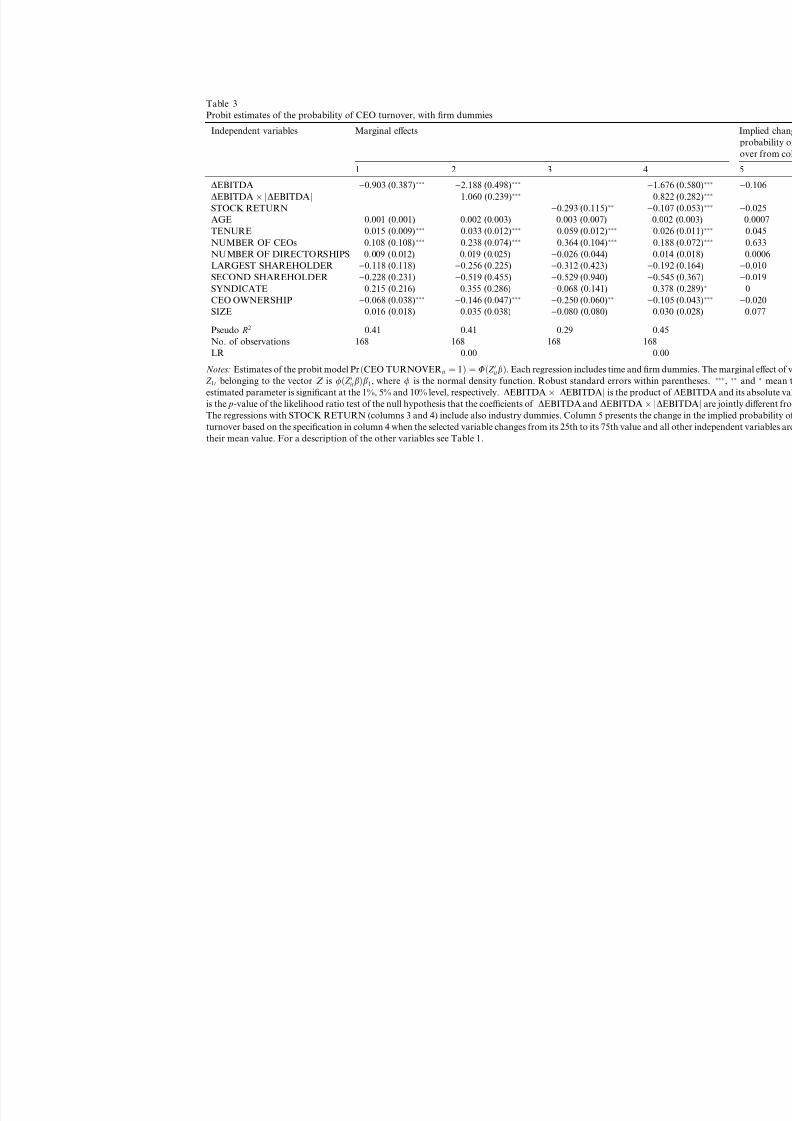
We present our first set of results in Table 3. The regressions in Table 3 exclude all
the firm year data with DEBITDA larger than 10 in absolute value (1 observation)
and with the CEO younger than 18. Since firms with no turnover in the sample pe-
riod are excluded, we end up with 168 valid observations for at most 60 parameters
(9 year dummies þ 31 firm dummies þ 9 industry dummies þ at most 11 independent
variables).
In column 1 of Table 3 we show the estimates of the baseline empirical model that
includes both CEO and firm characteristics and DEBITDA in the vector of ex-
planatory variables Z . In column 2 we present the estimates of the same regression
augmented with a non-linear specification of performance that includes bothDEBITDA and the product of DEBITDA, and its absolute value (DEBITDA jDEBITDAj).
The key result is that there is a negative and significant relationship between CEO
turnover and change in operating income. This holds when DEBITDA enters in both
a linear (column 1) and a non-linear form (column 2). Therefore, a decrease in DEB-
ITDA between year t 1 and year t increases the probability of CEO turnover be-
tween year t and year t þ 1. The relationship between CEO turnover and DEBITDA
is non-linear, as shown by the positive and significant coefficient (at 1%) attracted by
the product of the performance measure and its absolute value (column 2). Hence, a
negative change in DEBITDA increases the probability of CEO turnover, and this
effect declines with the absolute value of this change. This means that the penalty
for poor performance is less than proportional to the magnitude of the poor perfor-
mance, reflecting the fact that turnover is a bounded variable that can only vary in
the interval between zero and one.
The negative relationship between turnover and performance also holds when we
replace DEBITDA with STOCK RETURN and when we run regressions with both
measures. Column 3 of Table 3 reports the baseline empirical model with STOCK
RETURN, relative to industry performance, which we capture by including industry
dummies, and shows that CEO turnover is significantly and negatively related tostock return. We do not report the regression with the non-linear specification for
STOCK RETURN since the product of this performance measure by its absolute
value is never significant. In column 4 we add STOCK RETURN to the specification
in column 2 and find that, conditional on DEBITDA, positive values of STOCK RE-
TURN significantly reduce CEO turnover.
These findings are consistent with previous empirical evidence that points to a
negative relationship between CEO turnover and firm performance measures (stock
returns, earnings, sales) in different corporate governance environments like the US
(see, among others, Coughlan and Schmidt (1985), Warner et al. (1988), Denis et al.
(1997) and the surveys by John and Senbet (1998) and Mayer (1998)), Japan(Kaplan, 1994a; Kang and Shivdasani, 1995), Germany (Kaplan, 1994b; Franks
and Mayer, 2001) and Belgium (Renneboog, 2000).
1040 G. Brunello et al. / Journal of Banking & Finance 27 (2003) 1027–1051
8/15/2019 Articol Brunello
http://slidepdf.com/reader/full/articol-brunello 15/25
Table 3
Probit estimates of the probability of CEO turnover, with firm dummies
Independent variables Marginal effects
1 2 3 4
DEBITDA )0.903 (0.387))2.188 (0.498)
)1.67
DEBITDA jDEBITDAj 1.060 (0.239) 0.82
STOCK RETURN )0.293 (0.115))0.10
AGE 0.001 (0.001) 0.002 (0.003) 0.003 (0.007) 0.00
TENURE 0.015 (0.009) 0.033 (0.012) 0.059 (0.012) 0.02
NUMBER OF CEOs 0.108 (0.108) 0.238 (0.074) 0.364 (0.104) 0.18
NUMBER OF DIRECTORSHIPS 0.009 (0.012) 0.019 (0.025) )0.026 (0.044) 0.01
LARGEST SHAREHOLDER )
0.118 (0.118) )
0.256 (0.225) )
0.312 (0.423) )
0.19SECOND SHAREHOLDER )0.228 (0.231) )0.519 (0.455) )0.529 (0.940) )0.54
SYNDICATE 0.215 (0.216) 0.355 (0.286) )0.068 (0.141) 0.37
CEO OWNERSHIP )0.068 (0.038))0.146 (0.047)
)0.250 (0.060))0.10
SIZE 0.016 (0.018) 0.035 (0.038) )0.080 (0.080) 0.03
Pseudo R2 0.41 0.41 0.29 0.45
No. of observations 168 168 168 168
LR 0.00 0.00
Notes: Estimates of the probit model PrðCEO TURNOVERit ¼ 1Þ ¼ UðZ 0it bÞ. Each regression includes time and firm d
Z 1t belonging to the vector Z is /ðZ 0it bÞb1, where / is the normal density function. Robust standard errors within p
estimated parameter is significant at the 1%, 5% and 10% level, respectively. DEBITDA jDEBITDAj is the product o
is the p-value of the likelihood ratio test of the null hypothesis that the coefficients of DEBITDA and DEBITDA jDEThe regressions with STOCK RETURN (columns 3 and 4) include also industry dummies. Column 5 presents the cha
turnover based on the specification in column 4 when the selected variable changes from its 25th to its 75th value and a
their mean value. For a description of the other variables see Table 1.
8/15/2019 Articol Brunello
http://slidepdf.com/reader/full/articol-brunello 16/25
5.2. Turnover and ownership concentration
The regressions in Table 3 also include some variables related to the ownership
structure of the firm: LARGEST SHAREHOLDER, SECOND SHAREHOLDER,SYNDICATE and CEO OWNERSHIP. The main result is that CEO turnover is sig-
nificantly lower when the CEO is a controlling shareholder. The size of the LARGEST
SHAREHOLDER and of the SECOND SHAREHOLDER do not have a significant
impact on CEO turnover independently of the model specification (columns 1–4). The
lack of significance of the coefficient of the LARGEST SHAREHOLDER might be
the result of two contrasting effects. On the one hand, high ownership concentration
induces high monitoring, high turnover, and high turnover–performance sensitivity.
On the other hand, it induces entrenchment, low turnover, and low turnover–perfor-
mance sensitivity. Of all the regressions of Table 3 SYNDICATE is statistically signi-
ficant at the 10% level of confidence only in the model of column 4.We interpret these results as indicative that it is the presence of a CEO controlling
shareholder that affects turnover rather than ownership concentration per se or the
presence of a large or second shareholder. These findings confirm the descriptive sta-
tistics presented in Table 2. The role of CEO ownership as a determinant of turnover
is further analyzed later in the paper.
5.3. Turnover and CEO characteristics
In Table 3 we also show whether and how CEO turnover is affected by other CEO
characteristics. Independently of our measure of firm performance, the NUMBER
OF CEOs attracts a statistically significant and positive coefficient (columns 1–4).
While average AGE is never significant (columns 1–4), average TENURE attracts
a significant coefficient (columns 1–4). In particular, turnover is higher the greater
the number of years spent by the CEOs in the position since 1983. We conjecture that
the presence of a three-year contract might bring an element of inertia: It is easier not
to renew a CEO when the mandate expires than to fire him midterm. If we had data on
tenure that are not left censored, we could have tested this hypothesis by adding a
dummy equal to 1 to the regressions when the CEO is in the last year of his three-year
contract. Since tenure in our data is only measured from 1983 this option is precluded.The NUMBER OF DIRECTORSHIPS is never significant (columns 1–4) and there-
fore we find no evidence that interlocking directorships make it more difficult to remove
a CEO. Also the coefficient of firm SIZE is never significant (columns 1–4), thus sugges-
ting that small and large firms exhibit similar turnover. This is in contrast with empirical
evidence provided by Denis et al. (1997) for the US, who document that turnover is lower
in larger firms. The difference, however, may be due to the fact that we use the log of real
sales as a measure of firm size while they use the log of book value to total assets.
5.4. Implied change in the probability of turnover
To facilitate the comparison between our findings and previous literature we use
the specification in column 4 of Table 3 to compute the implied change in the prob-
1042 G. Brunello et al. / Journal of Banking & Finance 27 (2003) 1027–1051

8/15/2019 Articol Brunello
http://slidepdf.com/reader/full/articol-brunello 17/25
ability of turnover for each independent variable (column 5). This computation is
done assuming that the selected variable changes from its 25th to its 75th percentile
value and conditional on all other independent variables remaining constant at their
respective sample means. To illustrate, the implied change in the probability of turn-over associated to a 25th to 75th percentile value shift of Z 1t is Uðb1Z 1t ;0:75Þ Uðb1Z 1t ;0:25Þ, with all the remaining variables in the vector Z evaluated at their sample
means. This procedure is similar to the one used by Weisbach (1988) and Denis et al.
(1997) for the US.
We find that a 25th to 75th percentile value change in DEBITDA, given stock
market returns, reduces the probability of turnover by 0.106. A similar change in
STOCK RETURN, given DEBITDA, has a smaller impact and reduces CEO turn-
over by only 0.025. This suggests that the probability of turnover reacts more to
changes occurring in an accounting-based measure of performance than in a mar-
ket-based one, and indicates that boards look more at accounting measures of per-formance than at stock returns when they decide whether to replace the CEO. A
qualitatively similar result has been found by Weisbach (1988) for the US.
For comparability, we also compute the decline in the probability of turnover as-
sociated to a 25th to 75th percentile value shift in STOCK RETURN using the spec-
ification in column 3 that excludes DEBITDA and associated interactions from the
list of explanatory variables. In this case we find a probability change equal to 0.133,
not reported in Table 3. This value is much larger than the value found by Denis et al.
(1997), who use a similar specification and estimate a decline in turnover equal to
0.015 in their sample of US firms. This is prima facie evidence that the sensitivity
of CEO turnover to performance is relatively high in the Italian institutional envi-
ronment.
Returning to column 5 of Table 3, a 25th to 75th percentile value change in CEO
OWNERSHIP when the measures of performance are equal to their sample averages
reduces the probability of turnover by 0.020 (Table 3 column 5). This value is very
close to the one found by Denis et al. (1997), who estimate that the probability of
turnover declines by 0.023 when the dummy ‘‘member of the founding family’’
changes from its 25th to its 75th percentile.
Finally, the probability of turnover increases significantly when the number of
CEOs in the board and average CEO tenure increases. Adding one CEO to the board(from 1 to 2) increases the probability of turnover by 0.633. When the CEO TEN-
URE varies from its 25th percentile (2 years) to its 75th percentile (6.6 years), the
probability of turnover increases by 0.045 (column 5). This change is not small when
compared to the impact on turnover of the performance variables.
5.5. Alternative empirical specifications
These findings are robust to changes in the empirical specification. We check
whether the results are affected by multicollinearity by running simpler specifications
that drop most CEO and firm characteristics and retain only firm and year dummies,SIZE and our measure of performance, and find no qualitative changes to our fin-
dings.
G. Brunello et al. / Journal of Banking & Finance 27 (2003) 1027–1051 1043
8/15/2019 Articol Brunello
http://slidepdf.com/reader/full/articol-brunello 18/25
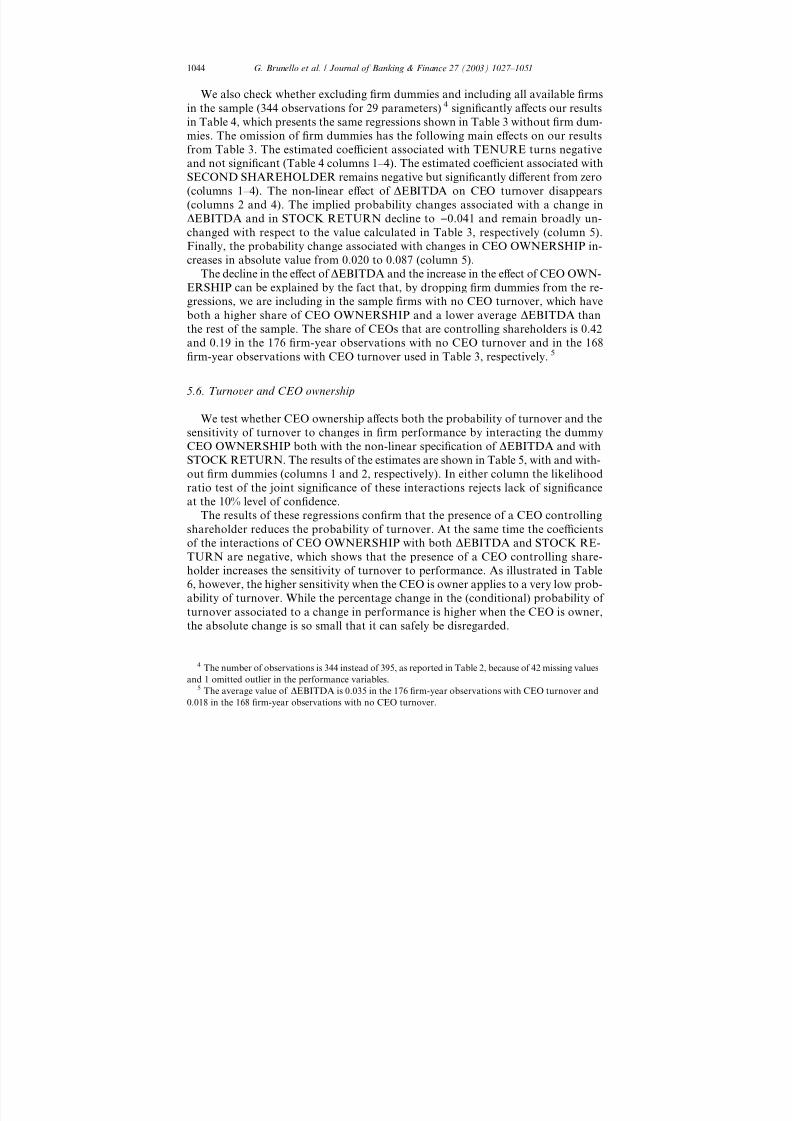
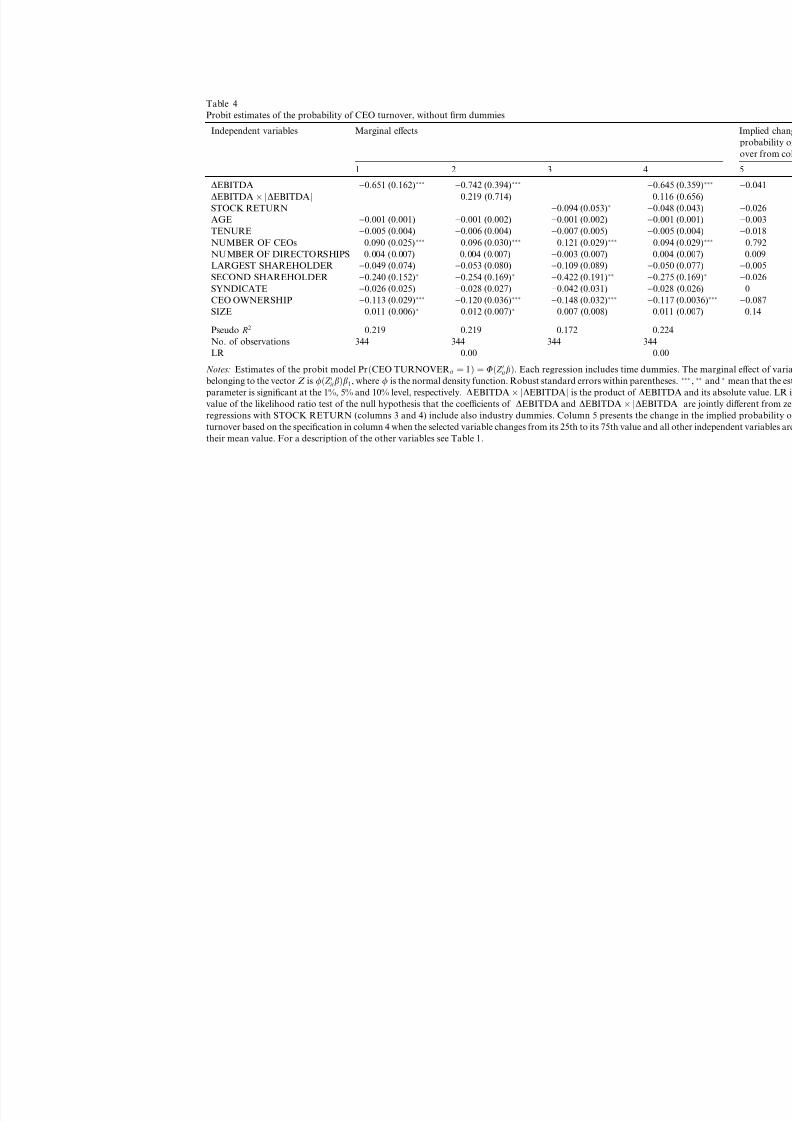
We also check whether excluding firm dummies and including all available firms
in the sample (344 observations for 29 parameters) 4 significantly affects our results
in Table 4, which presents the same regressions shown in Table 3 without firm dum-
mies. The omission of firm dummies has the following main effects on our resultsfrom Table 3. The estimated coefficient associated with TENURE turns negative
and not significant (Table 4 columns 1–4). The estimated coefficient associated with
SECOND SHAREHOLDER remains negative but significantly different from zero
(columns 1–4). The non-linear effect of DEBITDA on CEO turnover disappears
(columns 2 and 4). The implied probability changes associated with a change in
DEBITDA and in STOCK RETURN decline to )0.041 and remain broadly un-
changed with respect to the value calculated in Table 3, respectively (column 5).
Finally, the probability change associated with changes in CEO OWNERSHIP in-
creases in absolute value from 0.020 to 0.087 (column 5).
The decline in the effect of DEBITDA and the increase in the effect of CEO OWN-ERSHIP can be explained by the fact that, by dropping firm dummies from the re-
gressions, we are including in the sample firms with no CEO turnover, which have
both a higher share of CEO OWNERSHIP and a lower average DEBITDA than
the rest of the sample. The share of CEOs that are controlling shareholders is 0.42
and 0.19 in the 176 firm-year observations with no CEO turnover and in the 168
firm-year observations with CEO turnover used in Table 3, respectively. 5
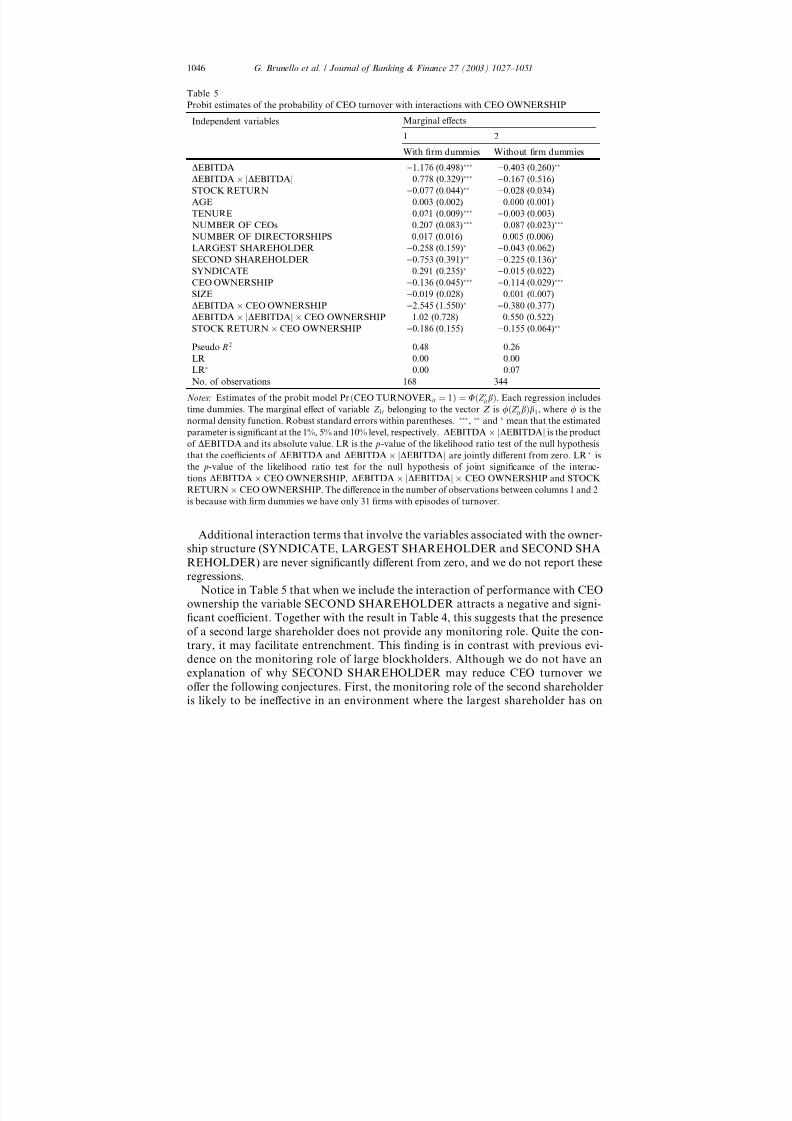
5.6. Turnover and CEO ownership
We test whether CEO ownership affects both the probability of turnover and the
sensitivity of turnover to changes in firm performance by interacting the dummy
CEO OWNERSHIP both with the non-linear specification of DEBITDA and with
STOCK RETURN. The results of the estimates are shown in Table 5, with and with-
out firm dummies (columns 1 and 2, respectively). In either column the likelihood
ratio test of the joint significance of these interactions rejects lack of significance
at the 10% level of confidence.
The results of these regressions confirm that the presence of a CEO controlling
shareholder reduces the probability of turnover. At the same time the coefficients
of the interactions of CEO OWNERSHIP with both DEBITDA and STOCK RE-TURN are negative, which shows that the presence of a CEO controlling share-
holder increases the sensitivity of turnover to performance. As illustrated in Table
6, however, the higher sensitivity when the CEO is owner applies to a very low prob-
ability of turnover. While the percentage change in the (conditional) probability of
turnover associated to a change in performance is higher when the CEO is owner,
the absolute change is so small that it can safely be disregarded.
4 The number of observations is 344 instead of 395, as reported in Table 2, because of 42 missing values
and 1 omitted outlier in the performance variables.5 The average value of DEBITDA is 0.035 in the 176 firm-year observations with CEO turnover and
0.018 in the 168 firm-year observations with no CEO turnover.
1044 G. Brunello et al. / Journal of Banking & Finance 27 (2003) 1027–1051
8/15/2019 Articol Brunello
http://slidepdf.com/reader/full/articol-brunello 19/25
Table 4
Probit estimates of the probability of CEO turnover, without firm dummies
Independent variables Marginal effects
1 2 3 4
DEBITDA )0.651 (0.162))0.742 (0.394)
)0.64
DEBITDA jDEBITDAj 0.219 (0.714) 0.11
STOCK RETURN )0.094 (0.053))0.04
AGE )0.001 (0.001) )0.001 (0.002) )0.001 (0.002) )0.00
TENURE )0.005 (0.004) )0.006 (0.004) )0.007 (0.005) )0.00
NUMBER OF CEOs 0.090 (0.025) 0.096 (0.030) 0.121 (0.029) 0.09
NUMBER OF DIRECTORSHIPS 0.004 (0.007) 0.004 (0.007) )0.003 (0.007) 0.00
LARGEST SHAREHOLDER )
0.049 (0.074) )
0.053 (0.080) )
0.109 (0.089) )
0.05SECOND SHAREHOLDER )0.240 (0.152)
)0.254 (0.169))0.422 (0.191)
)0.27
SYNDICATE )0.026 (0.025) )0.028 (0.027) )0.042 (0.031) )0.02
CEO OWNERSHIP )0.113 (0.029))0.120 (0.036)
)0.148 (0.032))0.11
SIZE 0.011 (0.006) 0.012 (0.007) 0.007 (0.008) 0.01
Pseudo R2 0.219 0.219 0.172 0.22
No. of observations 344 344 344 344
LR 0.00 0.00
Notes: Estimates of the probit model PrðCEO TURNOVERit ¼ 1Þ ¼ UðZ 0it bÞ. Each regression includes time dumm
belonging to the vector Z is /ðZ 0it bÞb1, where / is the normal density function. Robust standard errors within parenthes
parameter is significant at the 1%, 5% and 10% level, respectively. DEBITDA jDEBITDAj is the product of DEBIT
value of the likelihood ratio test of the null hypothesis that the coefficients of DEBITDA and DEBITDA jDEBITDregressions with STOCK RETURN (columns 3 and 4) include also industry dummies. Column 5 presents the chan
turnover based on the specification in column 4 when the selected variable changes from its 25th to its 75th value and a
their mean value. For a description of the other variables see Table 1.
8/15/2019 Articol Brunello
http://slidepdf.com/reader/full/articol-brunello 20/25
Additional interaction terms that involve the variables associated with the owner-ship structure (SYNDICATE, LARGEST SHAREHOLDER and SECOND SHA
REHOLDER) are never significantly different from zero, and we do not report these
regressions.
Notice in Table 5 that when we include the interaction of performance with CEO
ownership the variable SECOND SHAREHOLDER attracts a negative and signi-
ficant coefficient. Together with the result in Table 4, this suggests that the presence
of a second large shareholder does not provide any monitoring role. Quite the con-
trary, it may facilitate entrenchment. This finding is in contrast with previous evi-
dence on the monitoring role of large blockholders. Although we do not have an
explanation of why SECOND SHAREHOLDER may reduce CEO turnover weoffer the following conjectures. First, the monitoring role of the second shareholder
is likely to be ineffective in an environment where the largest shareholder has on
Table 5
Probit estimates of the probability of CEO turnover with interactions with CEO OWNERSHIP
Independent variables Marginal effects
1 2
With firm dummies Without firm dummies
DEBITDA )1.176 (0.498))0.403 (0.260)
DEBITDA jDEBITDAj 0.778 (0.329))0.167 (0.516)
STOCK RETURN )0.077 (0.044))0.028 (0.034)
AGE 0.003 (0.002) 0.000 (0.001)
TENURE 0.021 (0.009))0.003 (0.003)
NUMBER OF CEOs 0.207 (0.083) 0.087 (0.023)
NUMBER OF DIRECTORSHIPS 0.017 (0.016) 0.005 (0.006)
LARGEST SHAREHOLDER )0.258 (0.159))0.043 (0.062)
SECOND SHAREHOLDER )0.753 (0.391))0.225 (0.136)
SYNDICATE 0.291 (0.235))
0.015 (0.022)CEO OWNERSHIP )0.136 (0.045)
)0.114 (0.029)
SIZE )0.019 (0.028) 0.001 (0.007)
DEBITDA CEO OWNERSHIP )2.545 (1.550))0.380 (0.377)
DEBITDA jDEBITDAj CEO OWNERSHIP 1.02 (0.728) 0.550 (0.522)
STOCK RETURN CEO OWNERSHIP )0.186 (0.155) )0.155 (0.064)
Pseudo R2 0.48 0.26
LR 0.00 0.00
LR 0.00 0.07
No. of observations 168 344
Notes: Estimates of the probit model PrðCEO TURNOVERit ¼ 1Þ ¼ UðZ 0it
bÞ. Each regression includes
time dummies. The marginal effect of variable Z 1t belonging to the vector Z is /ðZ 0it bÞb1, where / is the
normal density function. Robust standard errors within parentheses. , and mean that the estimated
parameter is significant at the 1%, 5% and 10% level, respectively. DEBITDA jDEBITDAj is the product
of DEBITDA and its absolute value. LR is the p-value of the likelihood ratio test of the null hypothesis
that the coefficients of DEBITDA and DEBITDA jDEBITDAj are jointly different from zero. LR is
the p-value of the likelihood ratio test for the null hypothesis of joint significance of the interac-
tions DEBITDA CEO OWNERSHIP, DEBITDA jDEBITDAj CEO OWNERSHIP and STOCK
RETURN CEO OWNERSHIP. The difference in the number of observations between columns 1 and 2
is because with firm dummies we have only 31 firms with episodes of turnover.
1046 G. Brunello et al. / Journal of Banking & Finance 27 (2003) 1027–1051
8/15/2019 Articol Brunello
http://slidepdf.com/reader/full/articol-brunello 21/25
average more than 50% of the shares. Indeed, evidence of the monitoring role of out-
side blockholders has been found in firms where on average the first shareholder has
less than 50% of the shares (see Denis et al. (1997), for evidence on the US, and
Renneboog (2000), for evidence on Belgium). Second, although we have information
on formal shareholders coalitions, the second shareholder may be informally linked
to the first shareholder through reciprocal holding arrangements, which would in-
crease the power of the latter. Since we do not have any variable that captures this
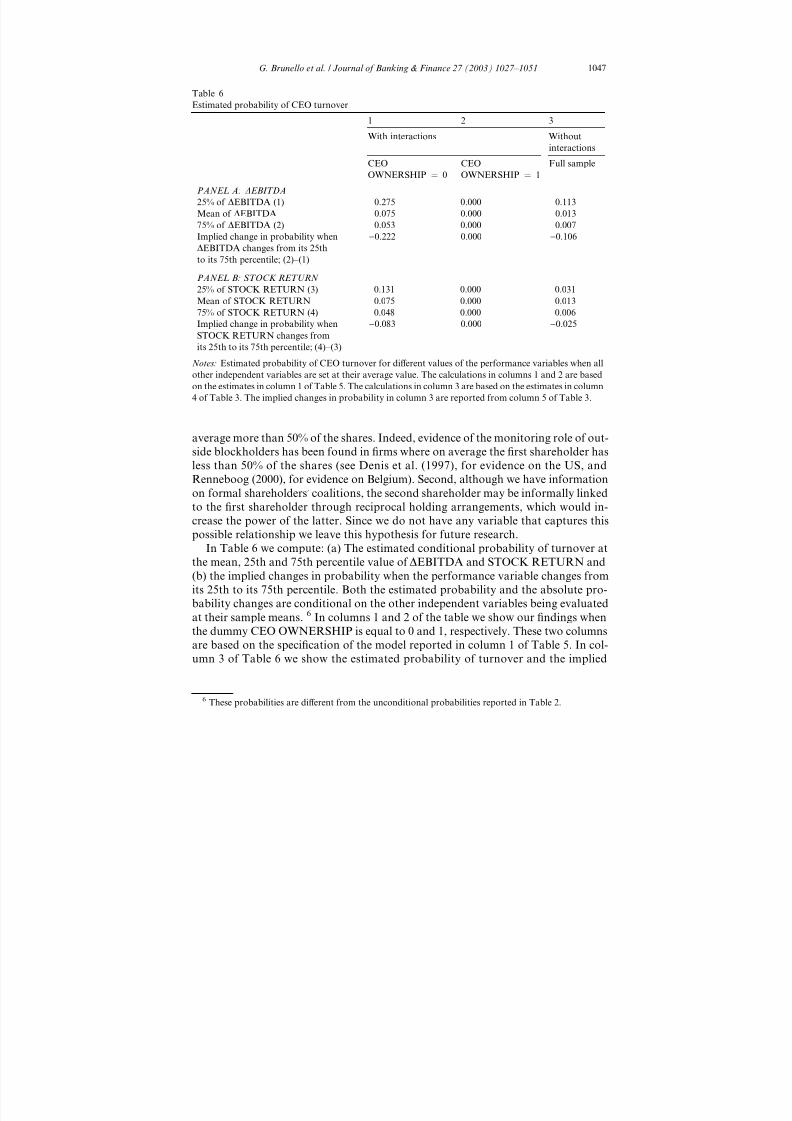
possible relationship we leave this hypothesis for future research.In Table 6 we compute: (a) The estimated conditional probability of turnover at
the mean, 25th and 75th percentile value of DEBITDA and STOCK RETURN and
(b) the implied changes in probability when the performance variable changes from
its 25th to its 75th percentile. Both the estimated probability and the absolute pro-
bability changes are conditional on the other independent variables being evaluated
at their sample means. 6 In columns 1 and 2 of the table we show our findings when
the dummy CEO OWNERSHIP is equal to 0 and 1, respectively. These two columns
are based on the specification of the model reported in column 1 of Table 5. In col-
umn 3 of Table 6 we show the estimated probability of turnover and the implied
Table 6
Estimated probability of CEO turnover
1 2 3
With interactions Withoutinteractions
CEO
OWNERSHIP ¼ 0
CEO
OWNERSHIP ¼ 1
Full sample
PANEL A: DEBITDA
25% of DEBITDA (1) 0.275 0.000 0.113
Mean of DEBITDA 0.075 0.000 0.013
75% of DEBITDA (2) 0.053 0.000 0.007
Implied change in probability when
DEBITDA changes from its 25th
to its 75th percentile; (2)–(1)
)0.222 0.000 )0.106
PANEL B: STOCK RETURN
25% of STOCK RETURN (3) 0.131 0.000 0.031
Mean of STOCK RETURN 0.075 0.000 0.013
75% of STOCK RETURN (4) 0.048 0.000 0.006
Implied change in probability when
STOCK RETURN changes from
its 25th to its 75th percentile; (4)–(3)
)0.083 0.000 )0.025
Notes: Estimated probability of CEO turnover for different values of the performance variables when all
other independent variables are set at their average value. The calculations in columns 1 and 2 are based
on the estimates in column 1 of Table 5. The calculations in column 3 are based on the estimates in column
4 of Table 3. The implied changes in probability in column 3 are reported from column 5 of Table 3.
6 These probabilities are different from the unconditional probabilities reported in Table 2.
G. Brunello et al. / Journal of Banking & Finance 27 (2003) 1027–1051 1047
8/15/2019 Articol Brunello
http://slidepdf.com/reader/full/articol-brunello 22/25
8/15/2019 Articol Brunello
http://slidepdf.com/reader/full/articol-brunello 23/25
and it takes a substantial change in the performance measure to have a positive prob-
ability of turnover. Indeed, our results indicate that the probability of turnover in the
whole sample is entirely driven by turnover in firms where the CEO is not the con-
trolling shareholder. We interpret this last result as evidence of the monitoring roleplayed by the majority shareholder on outside managers.
A broader implication of our analysis for the governance literature is that the sep-
aration of the large shareholders from the CEOs does not necessarily cause loss of
efficiency. This is in contrast with the prediction of the principal–agent literature that
incentives should be most powerful when principal and agent coincide. Besides mo-
tivating effort to alleviate moral hazard, boards have also the task of selecting the
right CEO/replacing the wrong CEO. In corporate governance environments where
the potential for exploitation of private benefits is large and the risk of entrenchment
is strong, the task of removing an underperforming CEO is likely to be better perfor-
med when the CEO is not a large shareholder. One way in which this is achieved is tohave powerful inside shareholders on the board. Thus, insider-dominated boards
may alleviate rather than exacerbate agency costs.
Furthermore, our study offers new evidence of the importance of the accounting
measure of performance relative to stock return in the boards decision whether to
change the CEO. We do not find support for the descriptive evidence that the pres-
ence of a shareholder syndicate among the main shareholders facilitates managerial
entrenchment, or for the monitoring role of large blockholders documented in stud-
ies on top executive turnover in the US.
With additional data this research could be extended to integrate the analysis of
CEO and board turnover and executive compensation in Italian firms. Turnover pol-
icy is indeed part of the overall compensation policy of the firm, which has only re-
cently begun to receive academic attention in Italy. In a recent study on executive
compensation in Italy Brunello et al. (2001) report that the variable component of
pay accounts for a smaller proportion of total executive compensation than in Ger-
many, the UK and the US. In the mid-1990s the base salary was about 74% of total
compensation of an Italian CEO, annual bonuses about 20%, employee benefits
about 2%, and stock plans and (seldom) stock options the remaining 3–4%. The
same study reports weak pay–performance sensitivity (an increase of profits by 1 bil-
lion lire raises the pay of upper and middle rank executives by only 31,000 lire). Thissensitivity is higher when the firm belongs to a multinational group, is owned by for-
eign capital and is listed on the stock exchange. It is difficult to establish direct links
between our results on CEO turnover and these findings on upper and middle man-
ager compensation. However, an integrated analysis of turnover and compensation
could shed light on the interplay between monetary and non-monetary incentives for
top executives in family firms.
Acknowledgements
We are particularly grateful to two anonymous referees whose comments greatly
helped to improve the paper. We would also like to thank Marcello Bianchi, Fahad
G. Brunello et al. / Journal of Banking & Finance 27 (2003) 1027–1051 1049

8/15/2019 Articol Brunello
http://slidepdf.com/reader/full/articol-brunello 24/25
8/15/2019 Articol Brunello
http://slidepdf.com/reader/full/articol-brunello 25/25
John, K., Senbet, L.W., 1998. Corporate governance and board effectiveness. Journal of Banking and
Finance 22, 371–401.
Kang, J., Shivdasani, A., 1995. Firm performance, corporate governance, and top executive turnover in
Japan. Journal of Financial Economics 38, 29–58.
Kaplan, S., 1994a. Top Executives rewards and firm performance: A comparison of Japan and the United
States. Journal of Political Economy 102, 510–546.
Kaplan, S., 1994b. Top executives, turnover, and firm performance in Germany. Journal of Law
Economics and Organization 10, 142–159.
La Porta, R., Lopez-de-Silanes, F., Shleifer, A., 1999. Corporate ownership around the world. Journal of
Finance 54, 471–517.
Mayer, C., 1998. Financial systems and corporate governance: A review of the international evidence.
Journal of Institutional and Theoretical Economics 154, 144–165.
Morck, R., Shleifer, A., Vishny, R., 1988. Management ownership and market valuation. Journal of
Financial Economics 20, 293–315.
Renneboog, L., 2000. Ownership, managerial control and the governance of companies listed on the
Brussels stock exchange. Journal of Banking and Finance. 24, 1959–1995.R&S, 1994. Mediobanca S.p.A., Milan.
Rosenstein, S., Wyatt, J., 1997. Inside directors, board effectiveness, and shareholder wealth. Journal of
Financial Economics 44, 229–250.
Shleifer, A., Vishny, R., 1986. Large shareholders and corporate control. Journal of Political Economy 94,
461–488.
Shleifer, A., Vishny, R., 1997. A survey of corporate governance. Journal of Finance 52, 737–775.
Sole 24 Ore (II), 1987–1998. Rome.
Stanghellini, L., 1999. Family and government-owned firms in Italy. Columbia Law School Project on
Corporate Governance, Mimeo., June.
Taccuino dellAzionista, 1987–1997. Edizioni Sole 24 Ore, Milan.
Volpin, P.F., 2002. Governance with poor investor protection: Evidence from top executive turnover in
Italy. Journal of Financial Economics 64 (1), 61–90.Warner, J., Watts, R., Wruck, K., 1988. Stock prices and management changes. Journal of Financial
Economics 20, 461–492.
Weisbach, M., 1988. Outside directors and C.E.O. turnover. Journal of Financial Economics 20, 431–460.
Zingales, L., 1994. The value of the voting right: A study of the Milan stock exchange experience. Review
of Financial Studies 7, 125–148.
G. Brunello et al. / Journal of Banking & Finance 27 (2003) 1027–1051 1051