
Aranday-Cortes, E., Kaveh, D., Nunez-Garcia, J., …eprints.gla.ac.uk/103658/1/103658.pdf ·...
12
s Aranday-Cortes, E., Kaveh, D., Nunez-Garcia, J., Hogarth, P. J., and Vordermeier, H. M. (2010) Mycobacterium bovis-BCG vaccination induces specific pulmonary transcriptome biosignatures in mice. PLoS ONE, 5(6). e11319. Copyright © 2010 Crown http://eprints.gla.ac.uk/103658 Deposited on: 05 March 2015 Enlighten – Research publications by members of the University of Glasgow http://eprints.gla.ac.uk
Transcript of Aranday-Cortes, E., Kaveh, D., Nunez-Garcia, J., …eprints.gla.ac.uk/103658/1/103658.pdf ·...
s
Aranday-Cortes, E., Kaveh, D., Nunez-Garcia, J., Hogarth, P. J., and Vordermeier, H. M. (2010) Mycobacterium bovis-BCG vaccination induces specific pulmonary transcriptome biosignatures in mice. PLoS ONE, 5(6). e11319. Copyright © 2010 Crown http://eprints.gla.ac.uk/103658 Deposited on: 05 March 2015
Enlighten – Research publications by members of the University of Glasgow
http://eprints.gla.ac.uk
Mycobacterium bovis-BCG Vaccination Induces SpecificPulmonary Transcriptome Biosignatures in MiceElihu Aranday Cortes, Daryan Kaveh, Javier Nunez-Garcia, Philip J. Hogarth, H. Martin Vordermeier*
TB Research Group, Veterinary Laboratories Agency, Addlestone, United Kingdom
Abstract
Background: In the present study, we applied microarray technology to define biosignatures by microarray transcriptomeanalysis in lung and spleen samples after BCG vaccination and M. bovis infection of BALB/c mice. The aims were two-fold,namely to define biosignatures that could predict vaccine success before challenge, and biomarker patterns that correlatedwith anamnestic protective responses following exposure to virulent M. bovis. Further, these biosignatures should bedetectable without in vitro antigenic challenge.
Principal Findings: After BCG vaccination, we defined a specific pulmonary gene expression signature related to theconnective tissue development and function network that predicted vaccine success before M. bovis challenge. In addition,a Th17-related cytokine profile was found that correlated with vaccine-induced protective immunity following infectionwith virulent M. bovis in the lung as well as additional genes that were up-regulated in the spleens of vaccinated animalspost-infection related to neutrophil biology and inflammation.
Conclusions: This study has therefore prioritized both biomarkers predicting vaccination success before challenge and bio-signatures that are potentially associated with protective immune responses that will be useful to evaluate future vaccinecandidates.
Citation: Aranday Cortes E, Kaveh D, Nunez-Garcia J, Hogarth PJ, Vordermeier HM (2009) Mycobacterium bovis-BCG Vaccination Induces Specific PulmonaryTranscriptome Biosignatures in Mice. PLoS ONE 5(6): e11319. doi:10.1371/journal.pone.0011319
Editor: Leonardo A. Sechi, Universita di Sassari, Italy
Received April 23, 2010; Accepted June 1, 2010; Published June 28, 2010
Copyright: � 2010 Crown. This is an open-access article distributed under the terms of the Re-use of Public Sector Information Regulations 2005, which permitunrestricted use, distribution, and reproduction in any medium, provided the original author and source are credited.
Funding: Funding was provided by the Department for Environment, Food and Rural Affairs, United Kingdom. The funders had no role in study design, datacollection and analysis, decision to publish, or preparation of the manuscript.
Competing Interests: The authors have declared that no competing interests exist.
* E-mail: [email protected]
Introduction
BCG is the most widely used human vaccine with an excellent
and unmatched safety record in immuno-competent humans.
Protection against TB conferred by BCG is thought to be
mediated by the induction of cell mediated immune responses
characterized by the cytokine IFN-c. Although necessary, IFN-calone is not sufficient for protection and therefore, it is unreliable
as a predictor or correlate of protection (rev. in [1]). More reliable
markers of protection would accelerate the development of novel
and more effective vaccination strategies against human and
bovine tuberculosis.
Biomics approaches (transcripto- proteo- and metabolo- mics)
have changed the way researchers are conducting experiments.
For example, transcriptome analysis measure changes in global
gene expression comparing different gene expression profiles
between different experimental conditions. This approach has
been used, for example, in cancer related studies in order to obtain
prognostic values [2] and predicting therapeutic outcome [3]. In
addition, these approaches are now also being used to identify
biomarkers of infection [4] or to study vaccine-induced responses,
such as after yellow fever vaccination [5].
The effect of BCG vaccination to protect cattle against M. bovis
infection has been studied since 1911, and several recent reviews
have covered these studies in details [1,6]. The results of the
majority of experimental vaccine challenge studies have demon-
strated a considerable degree of protection. Further, BCG
vaccination constitutes a good model vaccine to investigate the
mechanisms of protective immunity against tuberculosis infection
in small and large animal models. We have shown that the murine
M. bovis infection model is predictive of BCG and sub-unit
vaccination success in cattle [7], and have therefore applied
microarray technology to define biosignatures from the whole
transcriptome in lung and spleens of BALB/c mice following BCG
vaccination and M. bovis infection. We identified specific
pulmonary gene expression signatures related to connective tissue
development and a Th17-related cytokine profile. These signa-
tures predicted vaccine success prior to challenge, or correlated
with vaccine-induced protective immunity following infection with
virulent M. bovis.
Materials and Methods
AnimalsFemale BALB/C mice were obtained from SPF facilities at
Charles River Laboratories, Margate, UK. All animals were
housed in appropriate biological containment facilities at VLA and
work was carried out in accordance with the UK Home Office
Animal (Scientific Procedures) Act 1986, following approval by the
VLA Ethical Review Board and the UK Home Office.
PLoS ONE | www.plosone.org 1 June 2010 | Volume 5 | Issue 6 | e11319
MycobacteriaThe vaccination strain used was M. bovis BCG Danish strain
1331 (SSI, Copenhagen, Denmark) which was reconstituted from
freeze-dried stocks stored at 4uC in Sauton’s medium supplied as
per instructions. M. bovis isolate AF2122/97 grown to mid log
phase in Middlebrook 7H9 broth supplemented with 4.16 g/L
pyruvic acid, 10% (v/v) oleic acid, albumin, dextrose, and catalase
(OADC) and 0.05% (v/v) Tween 80, subsequently stored at
280uC, was used for all virulent challenges.
Immunisation and mycobacterial challengeTwo groups of 15 mice each were immunised by a single
intradermal injection of 26105 CFU of M. bovis BCG (Vaccinat-
ed), or Sauton’s medium (Unvaccinated). Vaccinations were
carried out into the base of the tail in 50 ml volumes. Six weeks
later 5 mice from each group were euthanized for immunological
analyses and the remaining mice from each group were challenged
with approx 600 CFU M. bovis via the intranasal route [8]. At days
3 and 14 post challenge five mice per group were euthanized and
spleens and lungs harvested (Table 1). To validate results obtained
from samples before infection, we also prepared cells (as described
below) from a further experiment conducted in the same way as
described above. In this experiment, 5 vaccinated and 5
unvaccinated control mice were euthanized 6 weeks post-
vaccination and cells and RNA prepared for qRT-PCR analysis
as described below.
Cell isolationFive mice per group were euthanized to evaluate the immune
response of splenic lymphocytes. Spleen cells were prepared by
passage through a 40 mm cell strainer into DMEM supplemented
with 10% (v/v) foetal calf serum (FCS) and antibiotics (100 U/ml
penicillin and 100 mg/ml streptomycin) (Gibco, UK) Following
washing at 3006g for 10 minutes cells were suspended at 56106/ml
for assay.
Lung cells were isolated as follows. Briefly, thoracic cavities were
opened, descending aorta transected and sterile HBSS gently
injected into right heart ventricles to perfuse lungs. Lungs were
excised, resuspended into digestion media (DMEM supplemented
plus 10 U/ml DNAse II (Sigma) and 150 U/ml collagenase type I
(Gibco)) and incubated for 1 hour at 37uC with gentle agitation
(200 rpm). After digestion lungs were prepared by passage through
100 mm cell strainer into supplemented DMEM. Following
washing at 1600 rpm for 5 minutes, cells were poured into
another tube through a 40 mm cell strainer, washed and used at
56105/well.
Determination of bacterial loadSpleen and lungs were removed and homogenised in distilled
H2O containing 0.05% v/v Tween 80 using a 10 mm coarse
dispersing homogeniser. Serial dilutions were plated onto modified
Middlebrook 7H11 agar media (Gallagher, et. al. 1977) and
incubated at 37uC for 4 weeks prior to Colony Forming Units
(CFU) determination.
RNA preparation and microarray hybridizationSpleen and lung cells prepared as and identical to the samples
described above were pelleted, and then resuspended in Trizol
and stored at 280uC until further processing. Trizol was chosen
as storage medium because our validation experiments had
demonstrated that M. bovis was effectively killed in Trizol.
Therefore, further processing could be performed outside a
biosafety containment level 3 (CL3) facility. RNA was isolated
from spleen and lung cells derived from BCG vaccinated and
control mice before and after M. bovis challenge using standard
RNA extraction protocols (Miltenyi Biotech Ltd, Bergisch
Gladbach, Germany). The quality of RNA samples was assessed
using the Agilent 2100 Bioanalyzer platform. All RNA samples
revealed acceptable RNA Integrity Number (RIN) values
between 6.8 and 9.5. For the linear T7-based amplification step,
0.5 mg of each total RNA samples was used. To produce Cy3-
labeled cDNA, the RNA samples were amplified and labeled
using the Agilent Low RNA Input Linear Amp Kit following the
manufacturer’s protocol. Yields of cDNA and the dye-incorpo-
ration rate were measured with the ND-1000 Spectrophotometer.
The hybridization procedure was performed according to
the Agilent 60-mer oligo microarray processing protocol using
the Agilent Gene Expression Hybridization Kit. Briefly, 1.65 mg
Cy3-labeled fragmented cDNA in hybridization buffer was
hybridized overnight (17 hours, 65uC) to Agilent Whole Mouse
Genome Oligo Microarrays 4644K using Agilent’s recommend-
ed hybridization chamber and oven. Finally, the microarrays
were washed once with 66 SSPE buffer (3.6 M NaCl, 0.2 M
NaH2PO4, 0.02 M EDTA pH 7.4) containing 0.005% N-
lauroylsarcosine for 1 min at room termperature followed by a
second wash with preheated 0.066 SSPE buffer (37uC)
containing 0.005% N-lauroylsarcosine for 1 min. The last
washing step was performed with acetonitrile for 30 seconds.
Normalization, filtering procedures and data analysisFluorescence signals of the hybridized Agilent Microarrays
were detected using Agilent’s Microarray Scanner System. The
Agilent Feature Software (FES) was used to read out and process
the microarray image files. The software determines feature
intensities (including background subtraction), rejects outliers and
calculates statistical confidences. For determination of differential
gene expression FES derived output data files were further
analyzed using GeneSpring GX 11 (Agilent). The default
normalization for Agilent one-color data in the GeneSpring
GX program is quantile normalization following Agilent’
guidelines. This was done across all arrays and caused all
distributions to be the same. Therefore, this non-linear normal-
ization corrects array biases. After normalization and baseline
transformation performed using median of UU samples as a
baseline; we decided to focus on those genes that reliably change
their expression, then we filtered the microarrays following three
conditions: 1) Filter by value. Genes that do not have normalized
signal intensity values of more than 20.5 and 0.5 were
disregarded. 2) Filter by flags. All the genes with flag present in
at least 100% of the values in any 1 out of the 6 conditions (see
Table 1) were considered. Flags are attributes that denote the
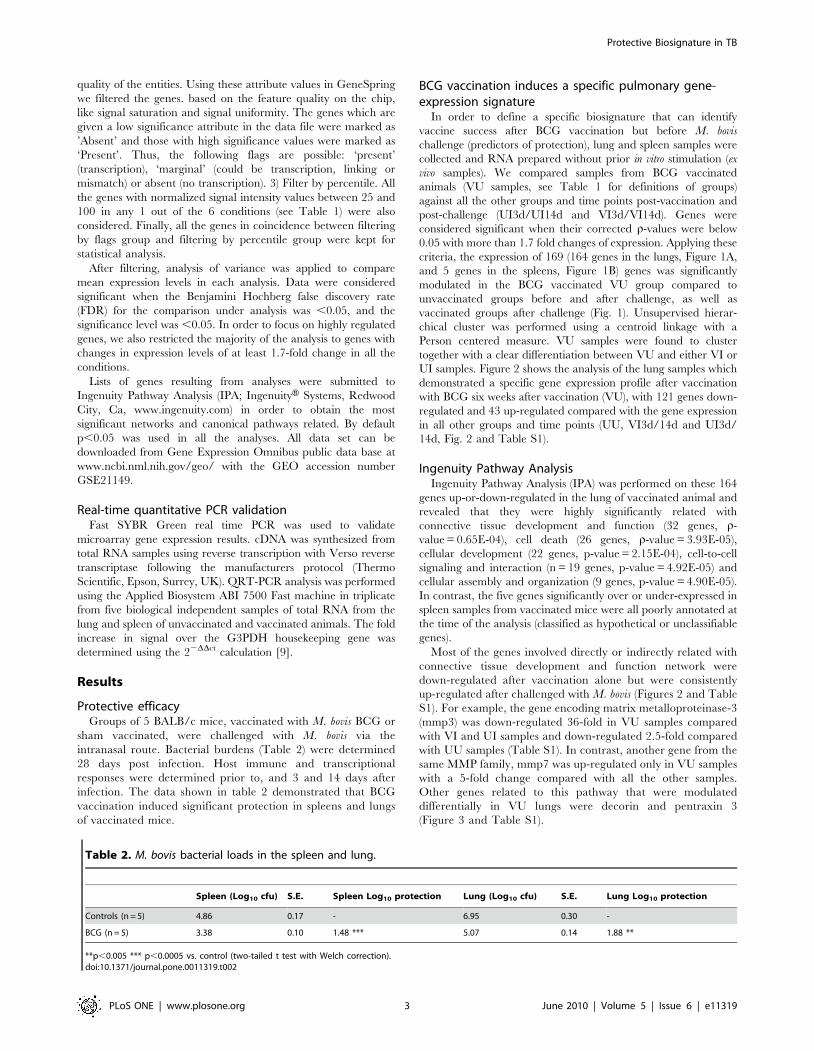
Table 1. Vaccination and challenge design.
Pre-Infection Post-Infection
Day 3 Day 14
Naı̈ve 5 animals (UU) 5 animals (UI3d) 5 animals (UI14d)
BCG Vaccinated 5 animals (VU) 5 animals (VI3d) 5 animals (VI14d)
Experimental design used for microarray study of gene expression in spleen andlung from vaccinated and unvaccinated mice. 6 groups with 5 animals pergroup and one microarray for each animal (30 microarrays) were used.Definition of abbreviations used: UU = Unvaccinated prior to infection; UI3d,UI14d = Unvaccinated euthanized 3 or 14 days post-M. bovis infection; VU =BCG Vaccinated Prior infection; VI3d, VI14d = Vaccinated 3 or 14 days post-infection.doi:10.1371/journal.pone.0011319.t001
Protective Biosignature in TB
PLoS ONE | www.plosone.org 2 June 2010 | Volume 5 | Issue 6 | e11319
quality of the entities. Using these attribute values in GeneSpring
we filtered the genes. based on the feature quality on the chip,
like signal saturation and signal uniformity. The genes which are
given a low significance attribute in the data file were marked as
’Absent’ and those with high significance values were marked as
‘Present’. Thus, the following flags are possible: ‘present’
(transcription), ‘marginal’ (could be transcription, linking or
mismatch) or absent (no transcription). 3) Filter by percentile. All
the genes with normalized signal intensity values between 25 and
100 in any 1 out of the 6 conditions (see Table 1) were also
considered. Finally, all the genes in coincidence between filtering
by flags group and filtering by percentile group were kept for
statistical analysis.
After filtering, analysis of variance was applied to compare
mean expression levels in each analysis. Data were considered
significant when the Benjamini Hochberg false discovery rate
(FDR) for the comparison under analysis was ,0.05, and the
significance level was ,0.05. In order to focus on highly regulated
genes, we also restricted the majority of the analysis to genes with
changes in expression levels of at least 1.7-fold change in all the
conditions.
Lists of genes resulting from analyses were submitted to
Ingenuity Pathway Analysis (IPA; IngenuityH Systems, Redwood
City, Ca, www.ingenuity.com) in order to obtain the most
significant networks and canonical pathways related. By default
p,0.05 was used in all the analyses. All data set can be
downloaded from Gene Expression Omnibus public data base at
www.ncbi.nml.nih.gov/geo/ with the GEO accession number
GSE21149.
Real-time quantitative PCR validationFast SYBR Green real time PCR was used to validate
microarray gene expression results. cDNA was synthesized from
total RNA samples using reverse transcription with Verso reverse
transcriptase following the manufacturers protocol (Thermo
Scientific, Epson, Surrey, UK). QRT-PCR analysis was performed
using the Applied Biosystem ABI 7500 Fast machine in triplicate
from five biological independent samples of total RNA from the
lung and spleen of unvaccinated and vaccinated animals. The fold
increase in signal over the G3PDH housekeeping gene was
determined using the 22DDct calculation [9].
Results
Protective efficacyGroups of 5 BALB/c mice, vaccinated with M. bovis BCG or
sham vaccinated, were challenged with M. bovis via the
intranasal route. Bacterial burdens (Table 2) were determined
28 days post infection. Host immune and transcriptional
responses were determined prior to, and 3 and 14 days after
infection. The data shown in table 2 demonstrated that BCG
vaccination induced significant protection in spleens and lungs
of vaccinated mice.
BCG vaccination induces a specific pulmonary gene-expression signature
In order to define a specific biosignature that can identify
vaccine success after BCG vaccination but before M. bovis
challenge (predictors of protection), lung and spleen samples were
collected and RNA prepared without prior in vitro stimulation (ex
vivo samples). We compared samples from BCG vaccinated
animals (VU samples, see Table 1 for definitions of groups)
against all the other groups and time points post-vaccination and
post-challenge (UI3d/UI14d and VI3d/VI14d). Genes were
considered significant when their corrected r-values were below
0.05 with more than 1.7 fold changes of expression. Applying these
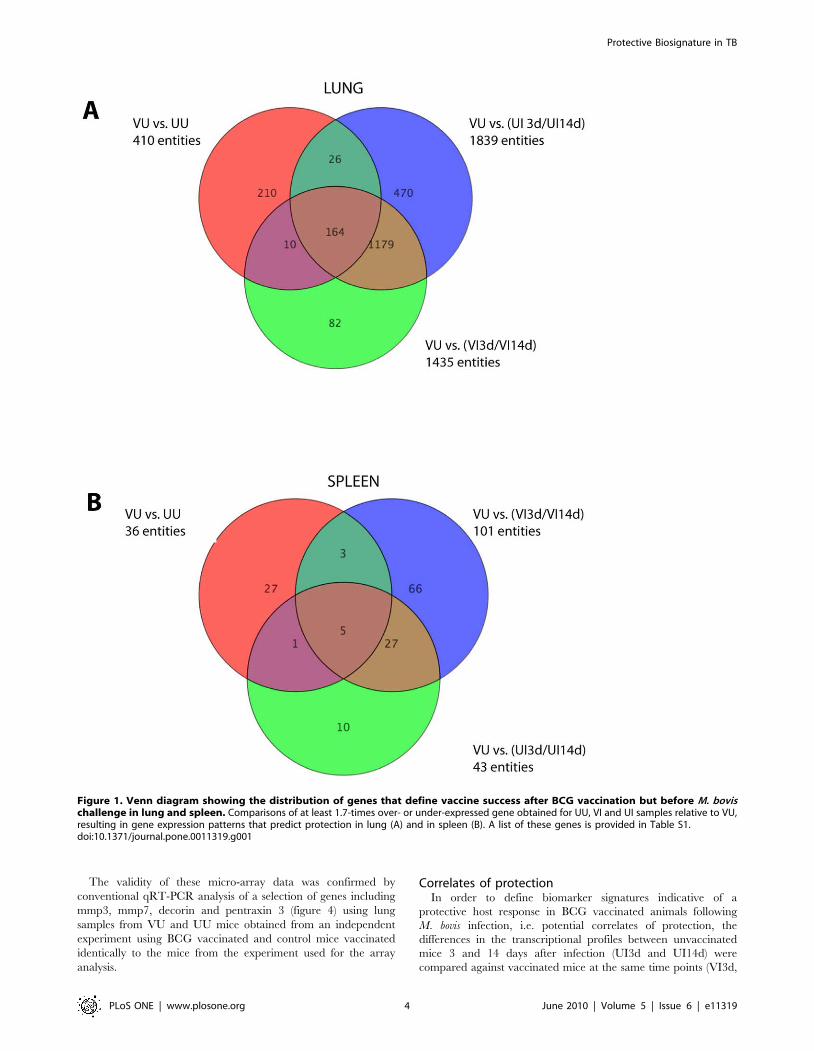
criteria, the expression of 169 (164 genes in the lungs, Figure 1A,
and 5 genes in the spleens, Figure 1B) genes was significantly
modulated in the BCG vaccinated VU group compared to
unvaccinated groups before and after challenge, as well as
vaccinated groups after challenge (Fig. 1). Unsupervised hierar-
chical cluster was performed using a centroid linkage with a
Person centered measure. VU samples were found to cluster
together with a clear differentiation between VU and either VI or
UI samples. Figure 2 shows the analysis of the lung samples which
demonstrated a specific gene expression profile after vaccination
with BCG six weeks after vaccination (VU), with 121 genes down-
regulated and 43 up-regulated compared with the gene expression
in all other groups and time points (UU, VI3d/14d and UI3d/
14d, Fig. 2 and Table S1).
Ingenuity Pathway AnalysisIngenuity Pathway Analysis (IPA) was performed on these 164
genes up-or-down-regulated in the lung of vaccinated animal and
revealed that they were highly significantly related with
connective tissue development and function (32 genes, r-
value = 0.65E-04), cell death (26 genes, r-value = 3.93E-05),
cellular development (22 genes, p-value = 2.15E-04), cell-to-cell
signaling and interaction (n = 19 genes, p-value = 4.92E-05) and
cellular assembly and organization (9 genes, p-value = 4.90E-05).
In contrast, the five genes significantly over or under-expressed in
spleen samples from vaccinated mice were all poorly annotated at
the time of the analysis (classified as hypothetical or unclassifiable
genes).
Most of the genes involved directly or indirectly related with
connective tissue development and function network were
down-regulated after vaccination alone but were consistently
up-regulated after challenged with M. bovis (Figures 2 and Table
S1). For example, the gene encoding matrix metalloproteinase-3
(mmp3) was down-regulated 36-fold in VU samples compared
with VI and UI samples and down-regulated 2.5-fold compared
with UU samples (Table S1). In contrast, another gene from the
same MMP family, mmp7 was up-regulated only in VU samples
with a 5-fold change compared with all the other samples.
Other genes related to this pathway that were modulated
differentially in VU lungs were decorin and pentraxin 3
(Figure 3 and Table S1).
Table 2. M. bovis bacterial loads in the spleen and lung.
Spleen (Log10 cfu) S.E. Spleen Log10 protection Lung (Log10 cfu) S.E. Lung Log10 protection
Controls (n = 5) 4.86 0.17 - 6.95 0.30 -
BCG (n = 5) 3.38 0.10 1.48 *** 5.07 0.14 1.88 **
**p,0.005 *** p,0.0005 vs. control (two-tailed t test with Welch correction).doi:10.1371/journal.pone.0011319.t002
Protective Biosignature in TB
PLoS ONE | www.plosone.org 3 June 2010 | Volume 5 | Issue 6 | e11319
The validity of these micro-array data was confirmed by
conventional qRT-PCR analysis of a selection of genes including
mmp3, mmp7, decorin and pentraxin 3 (figure 4) using lung
samples from VU and UU mice obtained from an independent
experiment using BCG vaccinated and control mice vaccinated
identically to the mice from the experiment used for the array
analysis.
Correlates of protectionIn order to define biomarker signatures indicative of a
protective host response in BCG vaccinated animals following
M. bovis infection, i.e. potential correlates of protection, the
differences in the transcriptional profiles between unvaccinated
mice 3 and 14 days after infection (UI3d and UI14d) were
compared against vaccinated mice at the same time points (VI3d,
Figure 1. Venn diagram showing the distribution of genes that define vaccine success after BCG vaccination but before M. bovischallenge in lung and spleen. Comparisons of at least 1.7-times over- or under-expressed gene obtained for UU, VI and UI samples relative to VU,resulting in gene expression patterns that predict protection in lung (A) and in spleen (B). A list of these genes is provided in Table S1.doi:10.1371/journal.pone.0011319.g001
Protective Biosignature in TB
PLoS ONE | www.plosone.org 4 June 2010 | Volume 5 | Issue 6 | e11319

Figure 2. Pulmonary gene signature after BCG vaccination but before M. bovis challenge. By using unsupervised hierarchical clustering oftranscripts and samples with centroid linkage and Pearson centered measure, lung samples were segregated into two distinct groups based on the164 genes identified previously (Fig.1A). All VU samples (red squares at the bottom) were clustered together with two UU samples. Bright redrepresents a 3.4-fold increase in expression above the mean and bright blue represents a 3.4-fold change decrease in the expression from the averageto all UU mice. Yellow indicates the unchanged expression level of a partiuclar gene between vaccinated and uninfected control mice (VU and UUgroups, respectively).doi:10.1371/journal.pone.0011319.g002
Protective Biosignature in TB
PLoS ONE | www.plosone.org 5 June 2010 | Volume 5 | Issue 6 | e11319
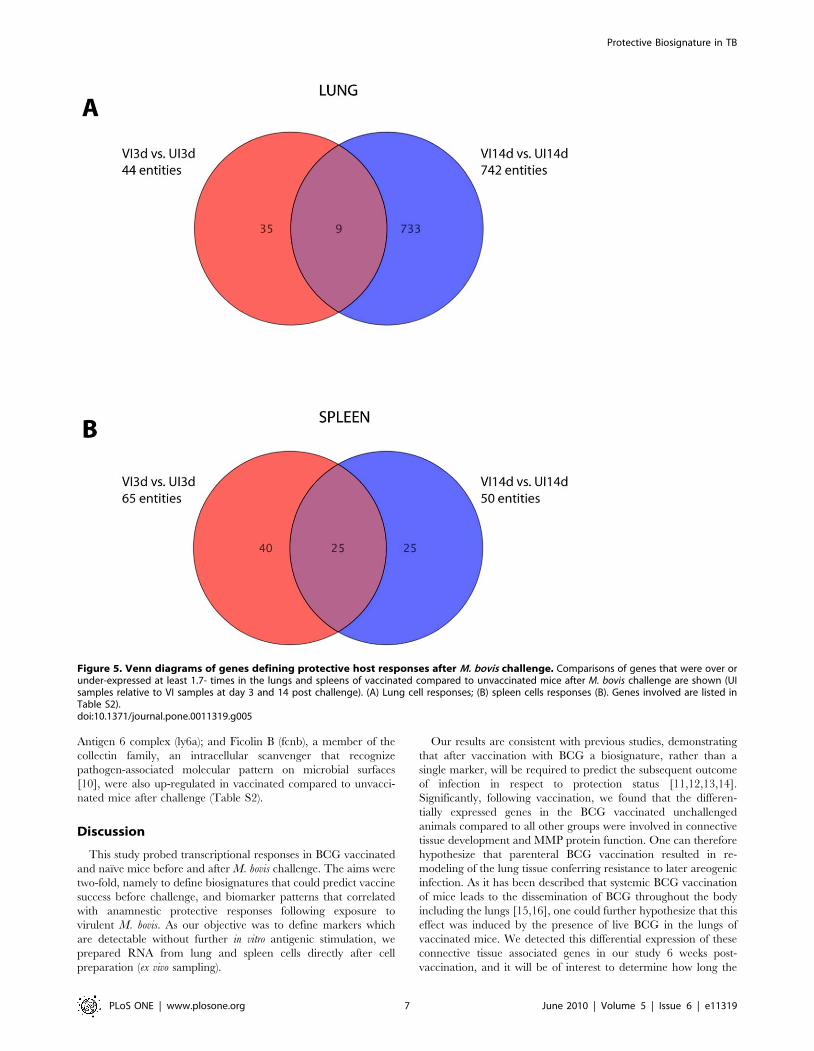
VI14d). At day 3 and 14-post infection, 44 and 742 genes,
respectively, were significantly differentially expressed between
vaccinated and unvaccinated mice in lung samples, respectively.
Only 9 genes of these 786 genes were differentially expressed at
both time-points post-infection (Fig. 5A). When we assessed the
functions of these 786 differentially expressed genes, we found that
genes associated with the TH17 differentiation and effector
pathways were prominent amongst them. For example, both
expression of Interleukin-17A and F encoding genes was up-
regulated in the lung samples of BCG vaccinated animals both 3
and 14 days after challenge with M. bovis, whilst expression of the
genes encoding interleukin-22 and interleukin-23 receptor were
up-regulated in lung samples from vaccinated animals 14 days
after challenge with M. bovis (Figure 6A). As expected, IFN-c was
also strongly and significantly up-regulated in the lungs of
protected mice (Fig. 6A).
After comparative analysis of the spleen samples we found 65
and 50 genes, respectively, to be differentially expressed at days 3
and 14 between vaccinated and unvaccinated animals (Fig. 6B),
with 25 genes differentially expressed at both time points post-
infection. For this set of genes IPA analysis revealed that genes
associated with inflammatory responses were found to be the
primary network up-regulated (score 39) in vaccinated samples.
For example, three days post-challenge, the eosinophil related
genes eosinophil peroxidase (Epx), proteoglycan 2 and eosinophil
granule major basic protein (MBP2) were up-regulated (Table S2).
Interestingly, 8/25 of these up-regulated genes listed in Table S2
were neutrophil-related (Figure 6B): myeloperosidase (mpo),
CD177, neutrophilic granule protein (npg), lactotransferrin (ltf),
cathepsin G (ctsg), chitinase 3-like 3 (chi3l3); chemokines related to
neutrophil chemotaxis (Figure 6B: cxcl-10, cxcl-11); or related to
the IL-8 activity of neutrophils (Figure 6B: elastase-2 (ela2),
proteoglucan 3 (prg3). Further, interferon related genes, for
example, 29-59 oligoadenylate synthetase-like2 (oasl2) and inter-
feron-induced protein tetrapeptide repeats 3 (ifit3); Lymphocyte
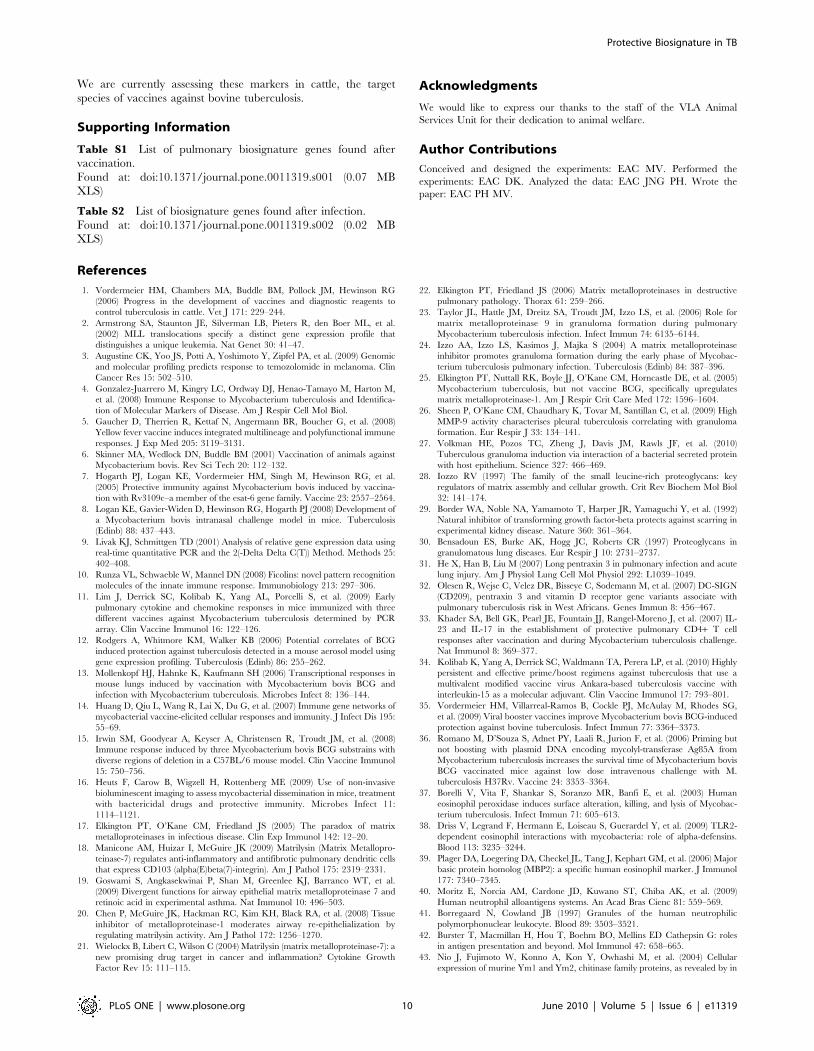
Figure 3. Connective tissue disorder network genes are differentially modulated after BCG vaccination but before M. bovischallenge in lungs. The connective tissue disorder network was identified after Ingenuity Analysis (p-value 1.65E-4) based on a subset of 164 genesidentified previously in lung (Fig.1A). The relationship between individual genes is depicted in this figure. Red: up-regulated; Blue: down-regulated;White: not found to be modulated.doi:10.1371/journal.pone.0011319.g003
Figure 4. Confirmation of the modulation of selected genes byquantitative RT-PCR. To confirm the expression patterns of somegenes identified in the microarray studies, real-time RT-PCR (QRT-PCR)was performed using total RNA collected from vaccinated andunvaccinated mice prior to infection form an experiment independentfrom the original experiment that provided samples for the microarrayanalysis. Data are expressed as log10 relative expression levels invaccinated compared to naı̈ve control mice.doi:10.1371/journal.pone.0011319.g004
Protective Biosignature in TB
PLoS ONE | www.plosone.org 6 June 2010 | Volume 5 | Issue 6 | e11319
Antigen 6 complex (ly6a); and Ficolin B (fcnb), a member of the
collectin family, an intracellular scanvenger that recognize
pathogen-associated molecular pattern on microbial surfaces
[10], were also up-regulated in vaccinated compared to unvacci-
nated mice after challenge (Table S2).
Discussion
This study probed transcriptional responses in BCG vaccinated
and naı̈ve mice before and after M. bovis challenge. The aims were
two-fold, namely to define biosignatures that could predict vaccine
success before challenge, and biomarker patterns that correlated
with anamnestic protective responses following exposure to
virulent M. bovis. As our objective was to define markers which
are detectable without further in vitro antigenic stimulation, we
prepared RNA from lung and spleen cells directly after cell
preparation (ex vivo sampling).
Our results are consistent with previous studies, demonstrating
that after vaccination with BCG a biosignature, rather than a
single marker, will be required to predict the subsequent outcome
of infection in respect to protection status [11,12,13,14].
Significantly, following vaccination, we found that the differen-
tially expressed genes in the BCG vaccinated unchallenged
animals compared to all other groups were involved in connective
tissue development and MMP protein function. One can therefore
hypothesize that parenteral BCG vaccination resulted in re-
modeling of the lung tissue conferring resistance to later areogenic
infection. As it has been described that systemic BCG vaccination
of mice leads to the dissemination of BCG throughout the body
including the lungs [15,16], one could further hypothesize that this
effect was induced by the presence of live BCG in the lungs of
vaccinated mice. We detected this differential expression of these
connective tissue associated genes in our study 6 weeks post-
vaccination, and it will be of interest to determine how long the
Figure 5. Venn diagrams of genes defining protective host responses after M. bovis challenge. Comparisons of genes that were over orunder-expressed at least 1.7- times in the lungs and spleens of vaccinated compared to unvaccinated mice after M. bovis challenge are shown (UIsamples relative to VI samples at day 3 and 14 post challenge). (A) Lung cell responses; (B) spleen cells responses (B). Genes involved are listed inTable S2).doi:10.1371/journal.pone.0011319.g005
Protective Biosignature in TB
PLoS ONE | www.plosone.org 7 June 2010 | Volume 5 | Issue 6 | e11319
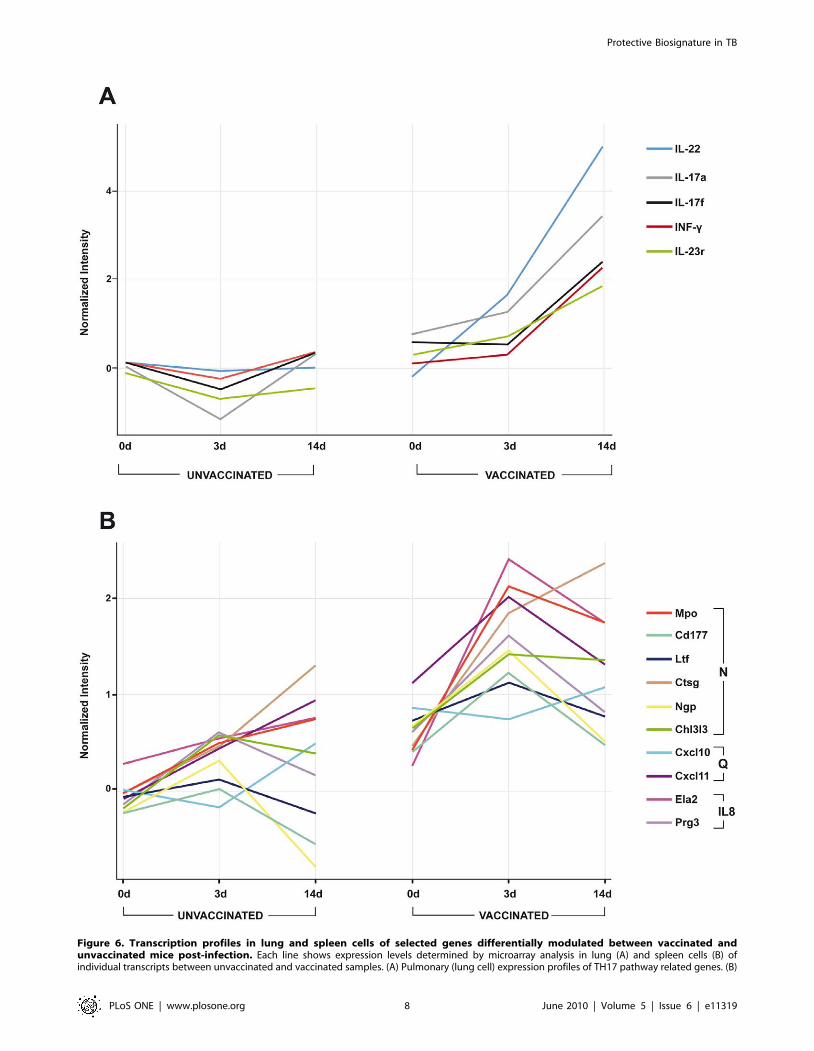
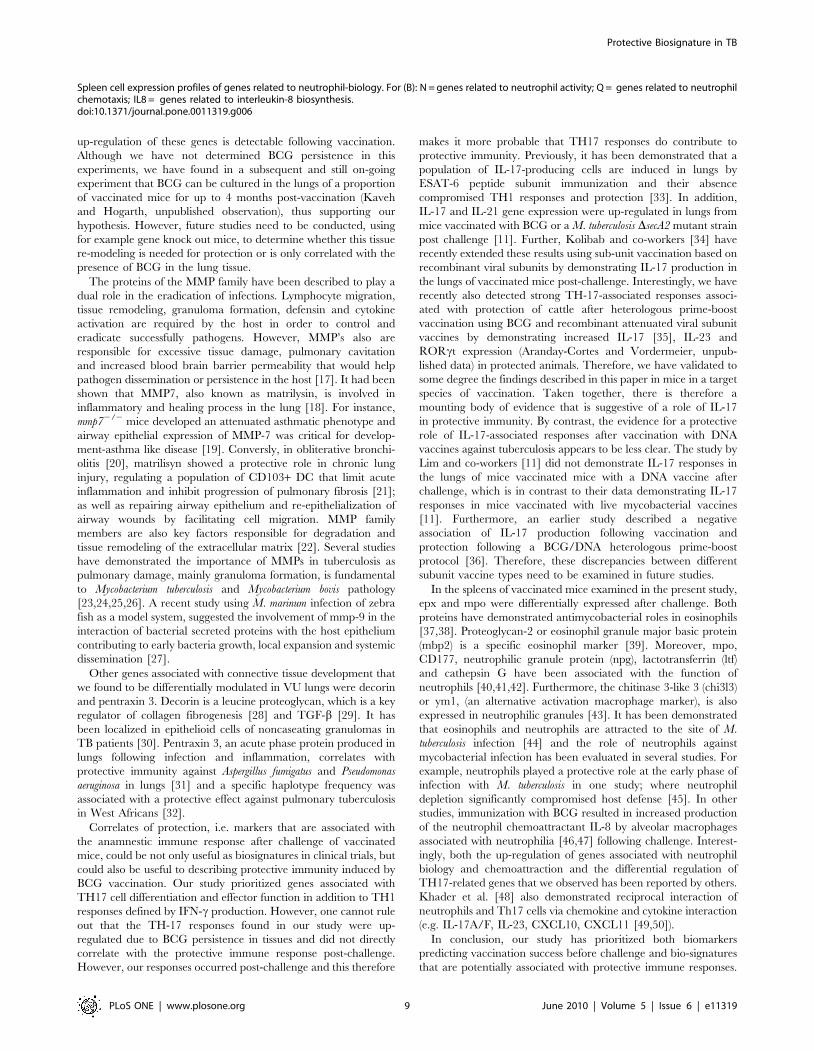
Figure 6. Transcription profiles in lung and spleen cells of selected genes differentially modulated between vaccinated andunvaccinated mice post-infection. Each line shows expression levels determined by microarray analysis in lung (A) and spleen cells (B) ofindividual transcripts between unvaccinated and vaccinated samples. (A) Pulmonary (lung cell) expression profiles of TH17 pathway related genes. (B)
Protective Biosignature in TB
PLoS ONE | www.plosone.org 8 June 2010 | Volume 5 | Issue 6 | e11319
up-regulation of these genes is detectable following vaccination.
Although we have not determined BCG persistence in this
experiments, we have found in a subsequent and still on-going
experiment that BCG can be cultured in the lungs of a proportion
of vaccinated mice for up to 4 months post-vaccination (Kaveh
and Hogarth, unpublished observation), thus supporting our
hypothesis. However, future studies need to be conducted, using
for example gene knock out mice, to determine whether this tissue
re-modeling is needed for protection or is only correlated with the
presence of BCG in the lung tissue.
The proteins of the MMP family have been described to play a
dual role in the eradication of infections. Lymphocyte migration,
tissue remodeling, granuloma formation, defensin and cytokine
activation are required by the host in order to control and
eradicate successfully pathogens. However, MMP’s also are
responsible for excessive tissue damage, pulmonary cavitation
and increased blood brain barrier permeability that would help
pathogen dissemination or persistence in the host [17]. It had been
shown that MMP7, also known as matrilysin, is involved in
inflammatory and healing process in the lung [18]. For instance,
mmp72/2 mice developed an attenuated asthmatic phenotype and
airway epithelial expression of MMP-7 was critical for develop-
ment-asthma like disease [19]. Conversly, in obliterative bronchi-
olitis [20], matrilisyn showed a protective role in chronic lung
injury, regulating a population of CD103+ DC that limit acute
inflammation and inhibit progression of pulmonary fibrosis [21];
as well as repairing airway epithelium and re-epithelialization of
airway wounds by facilitating cell migration. MMP family
members are also key factors responsible for degradation and
tissue remodeling of the extracellular matrix [22]. Several studies
have demonstrated the importance of MMPs in tuberculosis as
pulmonary damage, mainly granuloma formation, is fundamental
to Mycobacterium tuberculosis and Mycobacterium bovis pathology
[23,24,25,26]. A recent study using M. marinum infection of zebra
fish as a model system, suggested the involvement of mmp-9 in the
interaction of bacterial secreted proteins with the host epithelium
contributing to early bacteria growth, local expansion and systemic
dissemination [27].
Other genes associated with connective tissue development that
we found to be differentially modulated in VU lungs were decorin
and pentraxin 3. Decorin is a leucine proteoglycan, which is a key
regulator of collagen fibrogenesis [28] and TGF-b [29]. It has
been localized in epithelioid cells of noncaseating granulomas in
TB patients [30]. Pentraxin 3, an acute phase protein produced in
lungs following infection and inflammation, correlates with
protective immunity against Aspergillus fumigatus and Pseudomonas
aeruginosa in lungs [31] and a specific haplotype frequency was
associated with a protective effect against pulmonary tuberculosis
in West Africans [32].
Correlates of protection, i.e. markers that are associated with
the anamnestic immune response after challenge of vaccinated
mice, could be not only useful as biosignatures in clinical trials, but
could also be useful to describing protective immunity induced by
BCG vaccination. Our study prioritized genes associated with
TH17 cell differentiation and effector function in addition to TH1
responses defined by IFN-c production. However, one cannot rule
out that the TH-17 responses found in our study were up-
regulated due to BCG persistence in tissues and did not directly
correlate with the protective immune response post-challenge.
However, our responses occurred post-challenge and this therefore
makes it more probable that TH17 responses do contribute to
protective immunity. Previously, it has been demonstrated that a
population of IL-17-producing cells are induced in lungs by
ESAT-6 peptide subunit immunization and their absence
compromised TH1 responses and protection [33]. In addition,
IL-17 and IL-21 gene expression were up-regulated in lungs from
mice vaccinated with BCG or a M. tuberculosis DsecA2 mutant strain
post challenge [11]. Further, Kolibab and co-workers [34] have
recently extended these results using sub-unit vaccination based on
recombinant viral subunits by demonstrating IL-17 production in
the lungs of vaccinated mice post-challenge. Interestingly, we have
recently also detected strong TH-17-associated responses associ-
ated with protection of cattle after heterologous prime-boost
vaccination using BCG and recombinant attenuated viral subunit
vaccines by demonstrating increased IL-17 [35], IL-23 and
RORct expression (Aranday-Cortes and Vordermeier, unpub-
lished data) in protected animals. Therefore, we have validated to
some degree the findings described in this paper in mice in a target
species of vaccination. Taken together, there is therefore a
mounting body of evidence that is suggestive of a role of IL-17
in protective immunity. By contrast, the evidence for a protective
role of IL-17-associated responses after vaccination with DNA
vaccines against tuberculosis appears to be less clear. The study by
Lim and co-workers [11] did not demonstrate IL-17 responses in
the lungs of mice vaccinated mice with a DNA vaccine after
challenge, which is in contrast to their data demonstrating IL-17
responses in mice vaccinated with live mycobacterial vaccines
[11]. Furthermore, an earlier study described a negative
association of IL-17 production following vaccination and
protection following a BCG/DNA heterologous prime-boost
protocol [36]. Therefore, these discrepancies between different
subunit vaccine types need to be examined in future studies.
In the spleens of vaccinated mice examined in the present study,
epx and mpo were differentially expressed after challenge. Both
proteins have demonstrated antimycobacterial roles in eosinophils
[37,38]. Proteoglycan-2 or eosinophil granule major basic protein
(mbp2) is a specific eosinophil marker [39]. Moreover, mpo,
CD177, neutrophilic granule protein (npg), lactotransferrin (ltf)
and cathepsin G have been associated with the function of
neutrophils [40,41,42]. Furthermore, the chitinase 3-like 3 (chi3l3)
or ym1, (an alternative activation macrophage marker), is also
expressed in neutrophilic granules [43]. It has been demonstrated
that eosinophils and neutrophils are attracted to the site of M.
tuberculosis infection [44] and the role of neutrophils against
mycobacterial infection has been evaluated in several studies. For
example, neutrophils played a protective role at the early phase of
infection with M. tuberculosis in one study; where neutrophil
depletion significantly compromised host defense [45]. In other
studies, immunization with BCG resulted in increased production
of the neutrophil chemoattractant IL-8 by alveolar macrophages
associated with neutrophilia [46,47] following challenge. Interest-
ingly, both the up-regulation of genes associated with neutrophil
biology and chemoattraction and the differential regulation of
TH17-related genes that we observed has been reported by others.
Khader et al. [48] also demonstrated reciprocal interaction of
neutrophils and Th17 cells via chemokine and cytokine interaction
(e.g. IL-17A/F, IL-23, CXCL10, CXCL11 [49,50]).
In conclusion, our study has prioritized both biomarkers
predicting vaccination success before challenge and bio-signatures
that are potentially associated with protective immune responses.
Spleen cell expression profiles of genes related to neutrophil-biology. For (B): N = genes related to neutrophil activity; Q = genes related to neutrophilchemotaxis; IL8 = genes related to interleukin-8 biosynthesis.doi:10.1371/journal.pone.0011319.g006
Protective Biosignature in TB
PLoS ONE | www.plosone.org 9 June 2010 | Volume 5 | Issue 6 | e11319
We are currently assessing these markers in cattle, the target
species of vaccines against bovine tuberculosis.
Supporting Information
Table S1 List of pulmonary biosignature genes found after
vaccination.
Found at: doi:10.1371/journal.pone.0011319.s001 (0.07 MB
XLS)
Table S2 List of biosignature genes found after infection.
Found at: doi:10.1371/journal.pone.0011319.s002 (0.02 MB
XLS)
Acknowledgments
We would like to express our thanks to the staff of the VLA Animal
Services Unit for their dedication to animal welfare.
Author Contributions
Conceived and designed the experiments: EAC MV. Performed the
experiments: EAC DK. Analyzed the data: EAC JNG PH. Wrote the
paper: EAC PH MV.
References
1. Vordermeier HM, Chambers MA, Buddle BM, Pollock JM, Hewinson RG
(2006) Progress in the development of vaccines and diagnostic reagents to
control tuberculosis in cattle. Vet J 171: 229–244.
2. Armstrong SA, Staunton JE, Silverman LB, Pieters R, den Boer ML, et al.
(2002) MLL translocations specify a distinct gene expression profile that
distinguishes a unique leukemia. Nat Genet 30: 41–47.
3. Augustine CK, Yoo JS, Potti A, Yoshimoto Y, Zipfel PA, et al. (2009) Genomic
and molecular profiling predicts response to temozolomide in melanoma. Clin
Cancer Res 15: 502–510.
4. Gonzalez-Juarrero M, Kingry LC, Ordway DJ, Henao-Tamayo M, Harton M,
et al. (2008) Immune Response to Mycobacterium tuberculosis and Identifica-
tion of Molecular Markers of Disease. Am J Respir Cell Mol Biol.
5. Gaucher D, Therrien R, Kettaf N, Angermann BR, Boucher G, et al. (2008)
Yellow fever vaccine induces integrated multilineage and polyfunctional immune
responses. J Exp Med 205: 3119–3131.
6. Skinner MA, Wedlock DN, Buddle BM (2001) Vaccination of animals against
Mycobacterium bovis. Rev Sci Tech 20: 112–132.
7. Hogarth PJ, Logan KE, Vordermeier HM, Singh M, Hewinson RG, et al.
(2005) Protective immunity against Mycobacterium bovis induced by vaccina-
tion with Rv3109c–a member of the esat-6 gene family. Vaccine 23: 2557–2564.
8. Logan KE, Gavier-Widen D, Hewinson RG, Hogarth PJ (2008) Development of
a Mycobacterium bovis intranasal challenge model in mice. Tuberculosis
(Edinb) 88: 437–443.
9. Livak KJ, Schmittgen TD (2001) Analysis of relative gene expression data using
real-time quantitative PCR and the 2(-Delta Delta C(T)) Method. Methods 25:
402–408.
10. Runza VL, Schwaeble W, Mannel DN (2008) Ficolins: novel pattern recognition
molecules of the innate immune response. Immunobiology 213: 297–306.
11. Lim J, Derrick SC, Kolibab K, Yang AL, Porcelli S, et al. (2009) Early
pulmonary cytokine and chemokine responses in mice immunized with three
different vaccines against Mycobacterium tuberculosis determined by PCR
array. Clin Vaccine Immunol 16: 122–126.
12. Rodgers A, Whitmore KM, Walker KB (2006) Potential correlates of BCG
induced protection against tuberculosis detected in a mouse aerosol model using
gene expression profiling. Tuberculosis (Edinb) 86: 255–262.
13. Mollenkopf HJ, Hahnke K, Kaufmann SH (2006) Transcriptional responses in
mouse lungs induced by vaccination with Mycobacterium bovis BCG and
infection with Mycobacterium tuberculosis. Microbes Infect 8: 136–144.
14. Huang D, Qiu L, Wang R, Lai X, Du G, et al. (2007) Immune gene networks of
mycobacterial vaccine-elicited cellular responses and immunity. J Infect Dis 195:
55–69.
15. Irwin SM, Goodyear A, Keyser A, Christensen R, Troudt JM, et al. (2008)
Immune response induced by three Mycobacterium bovis BCG substrains with
diverse regions of deletion in a C57BL/6 mouse model. Clin Vaccine Immunol
15: 750–756.
16. Heuts F, Carow B, Wigzell H, Rottenberg ME (2009) Use of non-invasive
bioluminescent imaging to assess mycobacterial dissemination in mice, treatment
with bactericidal drugs and protective immunity. Microbes Infect 11:
1114–1121.
17. Elkington PT, O’Kane CM, Friedland JS (2005) The paradox of matrix
metalloproteinases in infectious disease. Clin Exp Immunol 142: 12–20.
18. Manicone AM, Huizar I, McGuire JK (2009) Matrilysin (Matrix Metallopro-
teinase-7) regulates anti-inflammatory and antifibrotic pulmonary dendritic cells
that express CD103 (alpha(E)beta(7)-integrin). Am J Pathol 175: 2319–2331.
19. Goswami S, Angkasekwinai P, Shan M, Greenlee KJ, Barranco WT, et al.
(2009) Divergent functions for airway epithelial matrix metalloproteinase 7 and
retinoic acid in experimental asthma. Nat Immunol 10: 496–503.
20. Chen P, McGuire JK, Hackman RC, Kim KH, Black RA, et al. (2008) Tissue
inhibitor of metalloproteinase-1 moderates airway re-epithelialization by
regulating matrilysin activity. Am J Pathol 172: 1256–1270.
21. Wielockx B, Libert C, Wilson C (2004) Matrilysin (matrix metalloproteinase-7): a
new promising drug target in cancer and inflammation? Cytokine Growth
Factor Rev 15: 111–115.
22. Elkington PT, Friedland JS (2006) Matrix metalloproteinases in destructive
pulmonary pathology. Thorax 61: 259–266.
23. Taylor JL, Hattle JM, Dreitz SA, Troudt JM, Izzo LS, et al. (2006) Role for
matrix metalloproteinase 9 in granuloma formation during pulmonary
Mycobacterium tuberculosis infection. Infect Immun 74: 6135–6144.
24. Izzo AA, Izzo LS, Kasimos J, Majka S (2004) A matrix metalloproteinase
inhibitor promotes granuloma formation during the early phase of Mycobac-
terium tuberculosis pulmonary infection. Tuberculosis (Edinb) 84: 387–396.
25. Elkington PT, Nuttall RK, Boyle JJ, O’Kane CM, Horncastle DE, et al. (2005)
Mycobacterium tuberculosis, but not vaccine BCG, specifically upregulates
matrix metalloproteinase-1. Am J Respir Crit Care Med 172: 1596–1604.
26. Sheen P, O’Kane CM, Chaudhary K, Tovar M, Santillan C, et al. (2009) High
MMP-9 activity characterises pleural tuberculosis correlating with granuloma
formation. Eur Respir J 33: 134–141.
27. Volkman HE, Pozos TC, Zheng J, Davis JM, Rawls JF, et al. (2010)
Tuberculous granuloma induction via interaction of a bacterial secreted protein
with host epithelium. Science 327: 466–469.
28. Iozzo RV (1997) The family of the small leucine-rich proteoglycans: key
regulators of matrix assembly and cellular growth. Crit Rev Biochem Mol Biol
32: 141–174.
29. Border WA, Noble NA, Yamamoto T, Harper JR, Yamaguchi Y, et al. (1992)
Natural inhibitor of transforming growth factor-beta protects against scarring in
experimental kidney disease. Nature 360: 361–364.
30. Bensadoun ES, Burke AK, Hogg JC, Roberts CR (1997) Proteoglycans in
granulomatous lung diseases. Eur Respir J 10: 2731–2737.
31. He X, Han B, Liu M (2007) Long pentraxin 3 in pulmonary infection and acute
lung injury. Am J Physiol Lung Cell Mol Physiol 292: L1039–1049.
32. Olesen R, Wejse C, Velez DR, Bisseye C, Sodemann M, et al. (2007) DC-SIGN
(CD209), pentraxin 3 and vitamin D receptor gene variants associate with
pulmonary tuberculosis risk in West Africans. Genes Immun 8: 456–467.
33. Khader SA, Bell GK, Pearl JE, Fountain JJ, Rangel-Moreno J, et al. (2007) IL-
23 and IL-17 in the establishment of protective pulmonary CD4+ T cell
responses after vaccination and during Mycobacterium tuberculosis challenge.
Nat Immunol 8: 369–377.
34. Kolibab K, Yang A, Derrick SC, Waldmann TA, Perera LP, et al. (2010) Highly
persistent and effective prime/boost regimens against tuberculosis that use a
multivalent modified vaccine virus Ankara-based tuberculosis vaccine with
interleukin-15 as a molecular adjuvant. Clin Vaccine Immunol 17: 793–801.
35. Vordermeier HM, Villarreal-Ramos B, Cockle PJ, McAulay M, Rhodes SG,
et al. (2009) Viral booster vaccines improve Mycobacterium bovis BCG-induced
protection against bovine tuberculosis. Infect Immun 77: 3364–3373.
36. Romano M, D’Souza S, Adnet PY, Laali R, Jurion F, et al. (2006) Priming but
not boosting with plasmid DNA encoding mycolyl-transferase Ag85A from
Mycobacterium tuberculosis increases the survival time of Mycobacterium bovis
BCG vaccinated mice against low dose intravenous challenge with M.
tuberculosis H37Rv. Vaccine 24: 3353–3364.
37. Borelli V, Vita F, Shankar S, Soranzo MR, Banfi E, et al. (2003) Human
eosinophil peroxidase induces surface alteration, killing, and lysis of Mycobac-
terium tuberculosis. Infect Immun 71: 605–613.
38. Driss V, Legrand F, Hermann E, Loiseau S, Guerardel Y, et al. (2009) TLR2-
dependent eosinophil interactions with mycobacteria: role of alpha-defensins.
Blood 113: 3235–3244.
39. Plager DA, Loegering DA, Checkel JL, Tang J, Kephart GM, et al. (2006) Major
basic protein homolog (MBP2): a specific human eosinophil marker. J Immunol
177: 7340–7345.
40. Moritz E, Norcia AM, Cardone JD, Kuwano ST, Chiba AK, et al. (2009)
Human neutrophil alloantigens systems. An Acad Bras Cienc 81: 559–569.
41. Borregaard N, Cowland JB (1997) Granules of the human neutrophilic
polymorphonuclear leukocyte. Blood 89: 3503–3521.
42. Burster T, Macmillan H, Hou T, Boehm BO, Mellins ED Cathepsin G: roles
in antigen presentation and beyond. Mol Immunol 47: 658–665.
43. Nio J, Fujimoto W, Konno A, Kon Y, Owhashi M, et al. (2004) Cellular
expression of murine Ym1 and Ym2, chitinase family proteins, as revealed by in
Protective Biosignature in TB
PLoS ONE | www.plosone.org 10 June 2010 | Volume 5 | Issue 6 | e11319

situ hybridization and immunohistochemistry. Histochem Cell Biol 121:
473–482.
44. Ordway D, Palanisamy G, Henao-Tamayo M, Smith EE, Shanley C, et al.
(2007) The cellular immune response to Mycobacterium tuberculosis infection in
the guinea pig. J Immunol 179: 2532–2541.
45. Pedrosa J, Saunders BM, Appelberg R, Orme IM, Silva MT, et al. (2000)
Neutrophils play a protective nonphagocytic role in systemic Mycobacterium
tuberculosis infection of mice. Infect Immun 68: 577–583.
46. Appelberg R, Silva MT (1989) T cell-dependent chronic neutrophilia during
mycobacterial infections. Clin Exp Immunol 78: 478–483.
47. Lyons MJ, Yoshimura T, McMurray DN (2002) Mycobacterium bovis BCG
vaccination augments interleukin-8 mRNA expression and protein production inguinea pig alveolar macrophages infected with Mycobacterium tuberculosis.
Infect Immun 70: 5471–5478.
48. Khader SA, Cooper AM (2008) IL-23 and IL-17 in tuberculosis. Cytokine 41:79–83.
49. Pelletier M, Maggi L, Micheletti A, Lazzeri E, Tamassia N, et al. Evidence for across-talk between human neutrophils and Th17 cells. Blood 115: 335–343.
50. Hoshino A, Nagao T, Nagi-Miura N, Ohno N, Yasuhara M, et al. (2008) MPO-
ANCA induces IL-17 production by activated neutrophils in vitro via classicalcomplement pathway-dependent manner. J Autoimmun 31: 79–89.
Protective Biosignature in TB
PLoS ONE | www.plosone.org 11 June 2010 | Volume 5 | Issue 6 | e11319