Appendix C: Other Materials · In this research, we found that one of our largest competitors was...
18
Transcript of Appendix C: Other Materials · In this research, we found that one of our largest competitors was...
Table of Contents
Executive Summary 1
Quantitative Research 2
Introduction 2
Problem Statement 3
Research Objectives 4
Concepts of Interest 4
Research Method 5
Findings 8
Research Conclusions 10
References12
Appendices 13
Appendix A: Survey Questionnaire 13
Appendix B: Results (Tables and Graphs) 13
Appendix C: Other Materials 15
1
Executive Summary
We began our research with the same problem statement as both our secondary and qualitative
research. This problem statement being:
“Red Bull must expand its target audience beyond what they currently use in order to capitalize on brand promotion and marketing strategy.”
For this area of research, we decided to expand on some of the topics that were
discovered in the focus group. We wanted to further learn how consumers used the
product, how they used social media, and what their reasons were for their behaviors. In
qualitative research, our objectives were to gather indepth responses for what the target
audience felt about Red Bull and other caffeinated beverages. It also looked at
consumption habits and societal views on these drinks. Our secondary research objectives
were to learn more about the Red Bull brand in general, the current caffeinated beverage
market, a SWOT analysis on Red Bull, and to see what our target audience wants, needs,
and already thinks about our brand and other caffeinated beverages.
For our secondary research, we broke down the different aspects of situational
analysis to get a more in depth look at the Red Bull brand. We looked at the industry,
company, product/brand, competitive, and consumer analyses when conducting secondary
research. We also completed a SWOT analysis.
For our qualitative study, we conducted a focus group with our target audience
(college students aged 1724) that focused on their views and consumption habits. This
method allowed us to get a more detailed and personal look at this topic, that was low
budget, in a relaxed safe atmosphere. This focus group was led by a moderator who used a
2
premade moderator guide that covered our objectives along with a series of projective
techniques that was focused on how our target sees and attributes the Red Bull brand to
various lifestyles and characteristics.
Our research showed us that our target consumes caffeinated beverages regularly,
using them for a variety of purposes from staying awake to alcoholic drink mixers, and
values quality over the price. This target uses social media, but is only somewhat swayed
by spokespersons and advertisements targeted to them. They also value the health and
social characteristics of a drink.
Overall, we found that energy drinks and other caffeinated beverages, are a staple
in the college target audience’s life. Red Bull, is consumed and is seen as a luxury brand
no matter the possible health risk. Even though it’s marketing presence is focused on
males who enjoy an adventurous lifestyle, Red Bull would benefit by expanding to the
female audience. In future studies, Red Bull should look at how their other ventures (e.g.
Red Bull Academy music) could possibly influence this market. They should also look
into the possible health effects of Red Bull and possibly adding/substituting ingredients
for more natural ingredients. This would be a more long term, preventative measure in the
event that this product does have any negative outcomes. Right now, this area has very
incomplete findings and by conducting more research before other companies, Red Bull
can take more steps to ensure the brand is not damaged.
Introduction
3
Before we conducted our quantitative study, we conducted both secondary and
qualitative research. In our secondary research, we looked at multiple analyses of the Red
Bull brand that spanned from industry analyses to consumer analyses. We also took an in
depth look at our direct and indirect competitors and their influence on the market.
Finally, we conducted a SWOT analysis of the Red Bull brand.
In this research, we found that one of our largest competitors was the CocaCola
company. CocaCola not only creates one of the most recognizable and widely available
caffeinated soft drinks on the market, but it also owns energy drink brand, Monster
Energy. This company and brand is something that Red Bull needed to keep on its radar.
Also, we further learned that coffee, especially brands like Starbucks and Dunkin
Doughnuts were our biggest competitors.
For our qualitative analysis, we conducted a moderated focus group with our target
audience. We mainly focused on how learning how this target uses caffeinated beverages
and their thoughts and feelings on Red Bull. In this study, we learned that this target uses
caffeinated beverages for many various reasons and at any time in the day. They do value
the taste and quality of the drink over the price.
In all of our studies (secondary, quantitative, and qualitative) we focused on a
target demographic of college students, aged 1724. We did this because this in our
secondary research, we noticed that Red Bull spent a large majority of their marketing
towards this demo. Also, they are the demo that actively consumes these types of
beverages.
Problem Statement
4
Our overall problem statement for all of our research is:
“Red Bull must expand its target audience beyond what they currently use in order to capitalize on brand promotion and marketing strategy.” As noted before, Red Bull caters its marketing to males in our target demo (1724)
as a drink for adventurous lifestyles that like to live outside the norm. For this project, we
identified further in our other research that Red Bull was consistently leaving out females
in this demo of college students aged 1724. We also wanted more data on this audience’s
consumption habits, as well as social media preferences.
Research Objectives
Due to the need of more information and to continue looking into our problem
statement, we determined the following to be our objectives.
a. What are the consumption habits and relationships between our target audience and caffeinated beverages?
b. What views does our target audience have on our product?
c. How does our target use social media? How does their social
media habits influence their buying and consumption habits?
These, paired with previous research and our new quantitative research
study, should be able to provide us with a larger picture of the brand.
Concepts of Interest
The concepts of interest examined in the quantitative research included our target
demographic’s consumption habits, brand perceptions, social media use, and behavior.
These concepts were identified through our qualitative research survey in which
we first observed wariness amongst our target demographic in regards to ill health effects
5
of energy drink consumption. We then discerned that Brand perception may be affected by
celebrity spokesperson endorsements and peer behavior. Detecting that both celebrity
endorsement and peer behavior could possibly have an effect on consumer perception and
behavior, we wanted to analyze the outlets through which this can occur; we hypothesized
that social media might have a large amount of influence in this regard.
Due to our initial qualitative research findings, we decided that the aforementioned
concepts were important topics of research as they would help us to understand and
achieve our research objectives; specifically, evaluating our target demographic’s
consumption habits will allow us to better understand the relationship between our
demographic’s overall caffeinated beverage consumption and Red Bull consumption.
Tying that research to the evaluation of consumer brand perceptions will directly relate to
better understanding our consumer’s health concerns, and both peer and celebrity
influence on behavior and perception. Lastly, evaluation of our target demographic’s
social media use will directly correlate to understanding how social media use affects
consumer perception of both Red Bull as a brand and a product, and understanding of
consumer behaviors influenced by social media.
Research Method Qualitative research is used to gain an understanding of underlying reasons and motivations
while also providing insights into generating ideas or hypotheses for later research. Earlier in this
study we used qualitative research to gain an indepth explanation for why our target market has the
beliefs, ideas, and values that they do about Red Bull. We followed our qualitative research with
quantitative research in order to quantify data and generalize results from a sample to the population
6
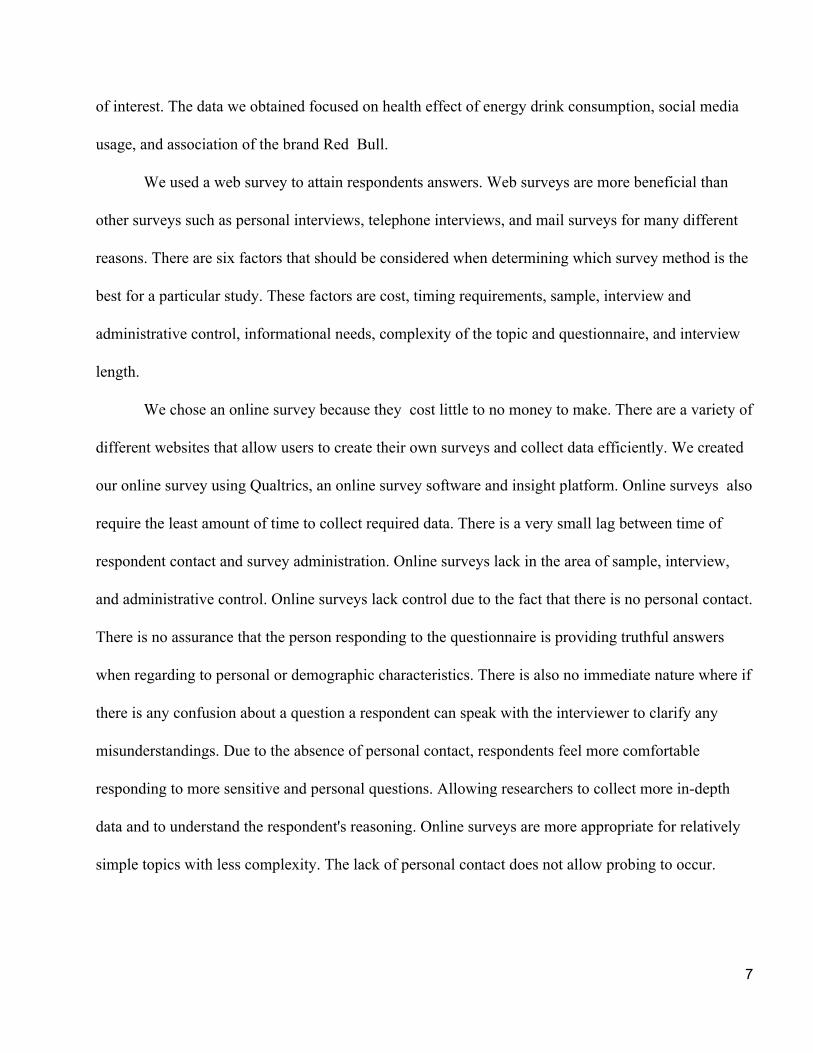
of interest. The data we obtained focused on health effect of energy drink consumption, social media
usage, and association of the brand Red Bull.
We used a web survey to attain respondents answers. Web surveys are more beneficial than
other surveys such as personal interviews, telephone interviews, and mail surveys for many different
reasons. There are six factors that should be considered when determining which survey method is the
best for a particular study. These factors are cost, timing requirements, sample, interview and
administrative control, informational needs, complexity of the topic and questionnaire, and interview
length.
We chose an online survey because they cost little to no money to make. There are a variety of
different websites that allow users to create their own surveys and collect data efficiently. We created
our online survey using Qualtrics, an online survey software and insight platform. Online surveys also
require the least amount of time to collect required data. There is a very small lag between time of
respondent contact and survey administration. Online surveys lack in the area of sample, interview,
and administrative control. Online surveys lack control due to the fact that there is no personal contact.
There is no assurance that the person responding to the questionnaire is providing truthful answers
when regarding to personal or demographic characteristics. There is also no immediate nature where if
there is any confusion about a question a respondent can speak with the interviewer to clarify any
misunderstandings. Due to the absence of personal contact, respondents feel more comfortable
responding to more sensitive and personal questions. Allowing researchers to collect more indepth
data and to understand the respondent's reasoning. Online surveys are more appropriate for relatively
simple topics with less complexity. The lack of personal contact does not allow probing to occur.
7
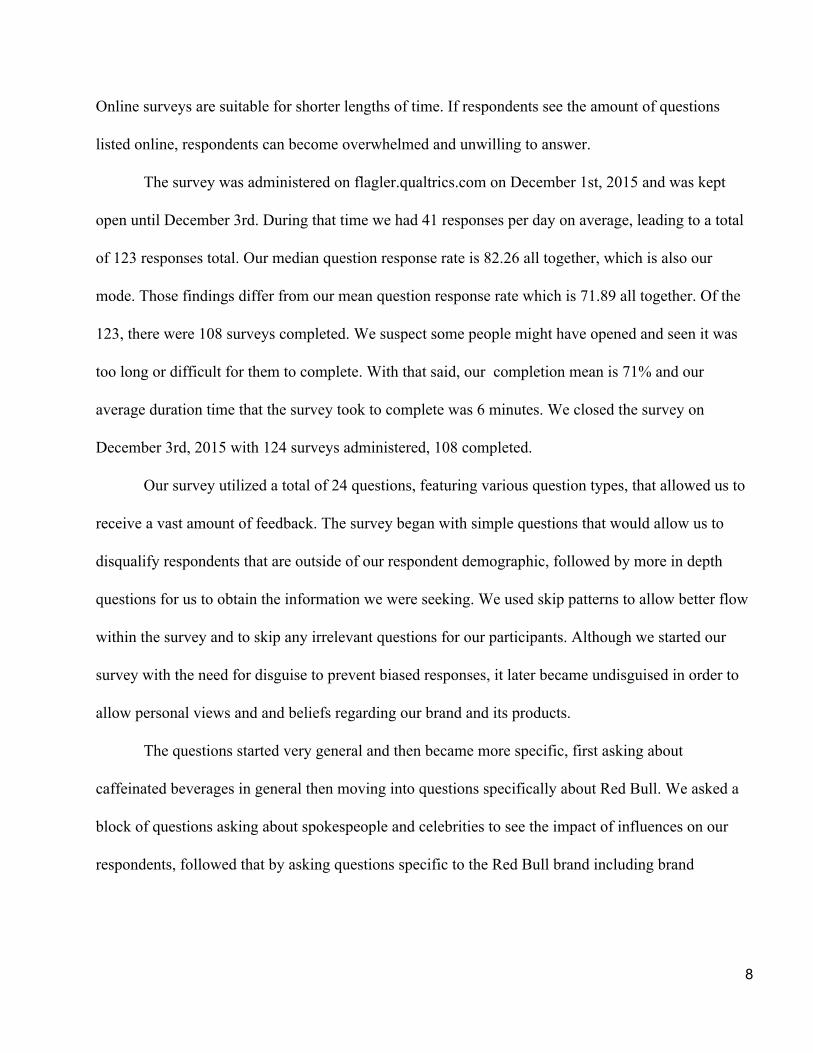
Online surveys are suitable for shorter lengths of time. If respondents see the amount of questions
listed online, respondents can become overwhelmed and unwilling to answer.
The survey was administered on flagler.qualtrics.com on December 1st, 2015 and was kept
open until December 3rd. During that time we had 41 responses per day on average, leading to a total
of 123 responses total. Our median question response rate is 82.26 all together, which is also our
mode. Those findings differ from our mean question response rate which is 71.89 all together. Of the
123, there were 108 surveys completed. We suspect some people might have opened and seen it was
too long or difficult for them to complete. With that said, our completion mean is 71% and our
average duration time that the survey took to complete was 6 minutes. We closed the survey on
December 3rd, 2015 with 124 surveys administered, 108 completed.
Our survey utilized a total of 24 questions, featuring various question types, that allowed us to
receive a vast amount of feedback. The survey began with simple questions that would allow us to
disqualify respondents that are outside of our respondent demographic, followed by more in depth
questions for us to obtain the information we were seeking. We used skip patterns to allow better flow
within the survey and to skip any irrelevant questions for our participants. Although we started our
survey with the need for disguise to prevent biased responses, it later became undisguised in order to
allow personal views and and beliefs regarding our brand and its products.
The questions started very general and then became more specific, first asking about
caffeinated beverages in general then moving into questions specifically about Red Bull. We asked a
block of questions asking about spokespeople and celebrities to see the impact of influences on our
respondents, followed that by asking questions specific to the Red Bull brand including brand
8
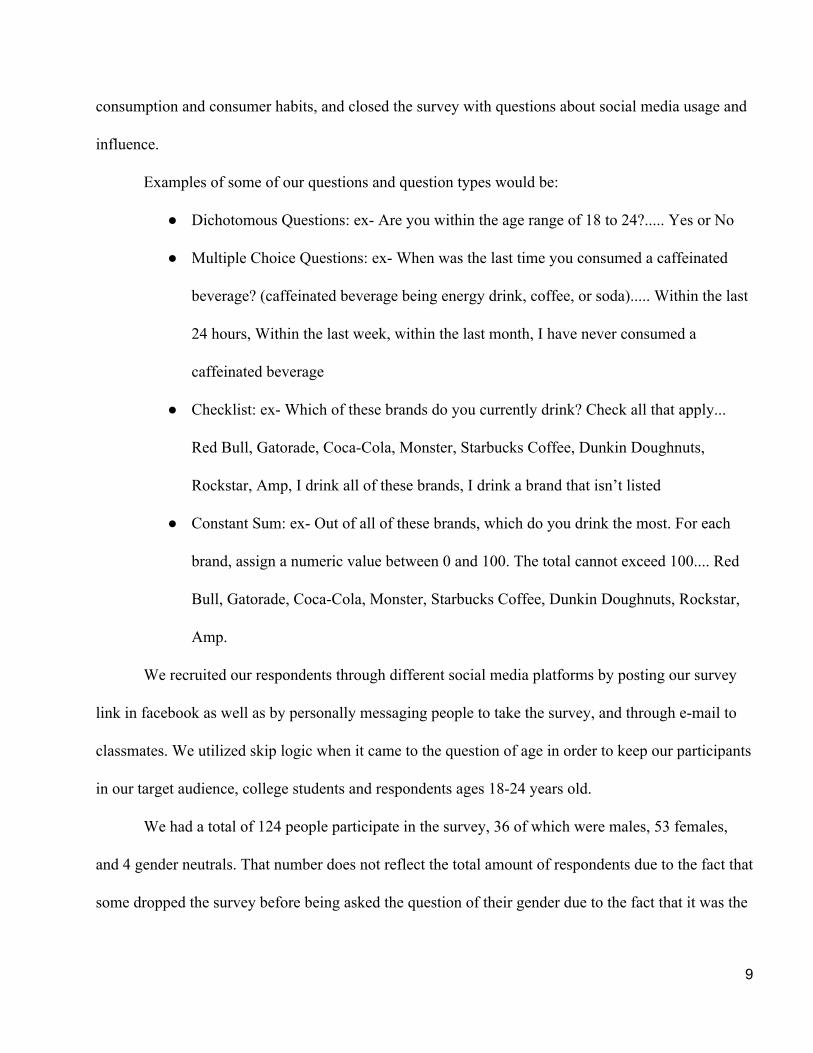
consumption and consumer habits, and closed the survey with questions about social media usage and
influence.
Examples of some of our questions and question types would be:
Dichotomous Questions: ex Are you within the age range of 18 to 24?..... Yes or No
Multiple Choice Questions: ex When was the last time you consumed a caffeinated
beverage? (caffeinated beverage being energy drink, coffee, or soda)..... Within the last
24 hours, Within the last week, within the last month, I have never consumed a
caffeinated beverage
Checklist: ex Which of these brands do you currently drink? Check all that apply...
Red Bull, Gatorade, CocaCola, Monster, Starbucks Coffee, Dunkin Doughnuts,
Rockstar, Amp, I drink all of these brands, I drink a brand that isn’t listed
Constant Sum: ex Out of all of these brands, which do you drink the most. For each
brand, assign a numeric value between 0 and 100. The total cannot exceed 100.... Red
Bull, Gatorade, CocaCola, Monster, Starbucks Coffee, Dunkin Doughnuts, Rockstar,
Amp.
We recruited our respondents through different social media platforms by posting our survey
link in facebook as well as by personally messaging people to take the survey, and through email to
classmates. We utilized skip logic when it came to the question of age in order to keep our participants
in our target audience, college students and respondents ages 1824 years old.
We had a total of 124 people participate in the survey, 36 of which were males, 53 females,
and 4 gender neutrals. That number does not reflect the total amount of respondents due to the fact that
some dropped the survey before being asked the question of their gender due to the fact that it was the
9
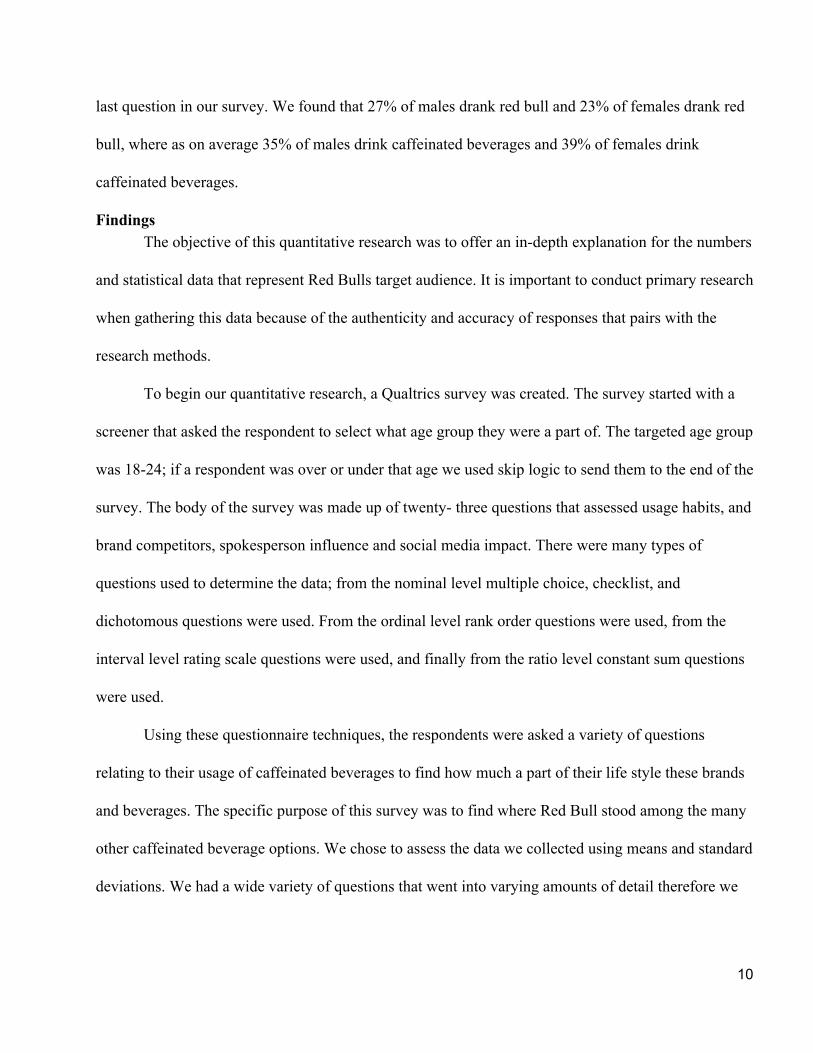
last question in our survey. We found that 27% of males drank red bull and 23% of females drank red
bull, where as on average 35% of males drink caffeinated beverages and 39% of females drink
caffeinated beverages.
Findings The objective of this quantitative research was to offer an indepth explanation for the numbers
and statistical data that represent Red Bulls target audience. It is important to conduct primary research
when gathering this data because of the authenticity and accuracy of responses that pairs with the
research methods.
To begin our quantitative research, a Qualtrics survey was created. The survey started with a
screener that asked the respondent to select what age group they were a part of. The targeted age group
was 1824; if a respondent was over or under that age we used skip logic to send them to the end of the
survey. The body of the survey was made up of twenty three questions that assessed usage habits, and
brand competitors, spokesperson influence and social media impact. There were many types of
questions used to determine the data; from the nominal level multiple choice, checklist, and
dichotomous questions were used. From the ordinal level rank order questions were used, from the
interval level rating scale questions were used, and finally from the ratio level constant sum questions
were used.
Using these questionnaire techniques, the respondents were asked a variety of questions
relating to their usage of caffeinated beverages to find how much a part of their life style these brands
and beverages. The specific purpose of this survey was to find where Red Bull stood among the many
other caffeinated beverage options. We chose to assess the data we collected using means and standard
deviations. We had a wide variety of questions that went into varying amounts of detail therefore we
10
decided to only display the numerical values of the questions that explicitly had to do with Red Bull.
The following data tables are displayed in our appendices.
How does the research support our objectives?
1. What are the consumption habits and relationships between our target audience and
caffeinated beverages?
After crosstabulation was used to analyze the questions regarding this concept of
interest, we decided to use the mode of the data to better understand the results of this
nominal measurement (see figure 3). Our results showed that the majority of our target
demographic drink caffeinated beverages more than once a day. This statistic is in Red
Bull’s favor because it shows that the target audience is already dependent on caffeinated
beverages therefore if RedBull uses good marketing techniques they could attract this
target audience easily.
2. How does our target demographic perceive RedBull as both a brand and product?
From examining our data we found that the majority of our respondents associate
RedBull with “extreme sports” (see figure 4.) In many ways this is a plus because RedBull
has put a lot of emphasis on extreme sports in their marketing plan. The second
characteristic that respondents associated RedBull with is “energizing” which is of course
a good sign for a energy drink brand. The characteristic that respondents related RedBull
to least was “healthy”. This may become a problem for redbull in the future because in
this day and age people are becoming more aware of what they are putting in their bodies
and are striving for healthy alternatives.
11
3. How does our target use social media? How does their social media habits influence
their buying and consumption habits?
We used cross tabulation to display the results for this objective (see figure 2.) The
results were best analyzed in regards of the mode due to the question being of the ordinal
level of measurement; consequently, we established that Facebook is the most popular
social media platform among RedBull drinkers and non RedBull drinkers alike. From
these results we can hypothesize that Facebook would be the best social platform for
RedBull to focus its advertising. The second most popular platform was instagram and the
least popular was Myspace.
Research Conclusion:
We have come to several interesting conclusions through our research on the Red
Bull Brand. Through qualitative research we found that our target audience enjoys
caffeinated beverages but does not always reach for Red Bull because of factors like cost,
lack of nutritional value, and it’s side effects. Our quantitative research had the same
results. Again, the audience enjoys and uses caffeinated beverages daily, however they
choose them based off of social contexts, monetary value, and health concerns.
Based on these outcomes we have several strategic suggestions for how Red Bull
could improve their brand image within the 1824 target audience. The first strategic
suggestion we have is for Red Bull to strive to create a product free of artificial chemicals.
Respondents widely acknowledged that energy drinks are not very healthy, however they
still choose them. This shows us that it is only a small concern, but one they are taking
12
more into account. The next suggestion we have has to do with the price of the Red Bull
product. Some respondents said they do not buy Red Bull because of the price, however,
the brand is considered a premium drink and therefore the price was justifiable in
comparison to similar lifestyle brands. To compromise, Red Bull should create strategic
marketing promotions.
To conclude, Red Bull is still a strong brand in the wide market of caffeinated
beverages. Even though Red Bull has a strong marketing base towards the male audience
of ages 1830, we have noted that females in this age range go unnoticed. We believe that
Red Bull should address this issue as well as possible health concerns and pricing to keep
their already successful target loyal and recruit new customers. By conducting this survey,
we found that college students aged 1824 have a variety of uses and habits when
consuming these beverages. Participants noted that they have consumed Red Bull, but
listed price, lack of natural ingredients, and taste as reasons for not consuming it again. By
taking all of the data from the last three projects into account, Red Bull could further
expand their consumer reach.
13
References Auer, Michael et al. 'It Gives You Wings: A Qualitative Study'. 2015. Presentation. Auer, Michael et al. 'It Gives You Wings: A Secondary Research Study'. 2015. Presentation. Hammick, Jinhyon. 'Quantitative Research'. 2015. Presentation.
14
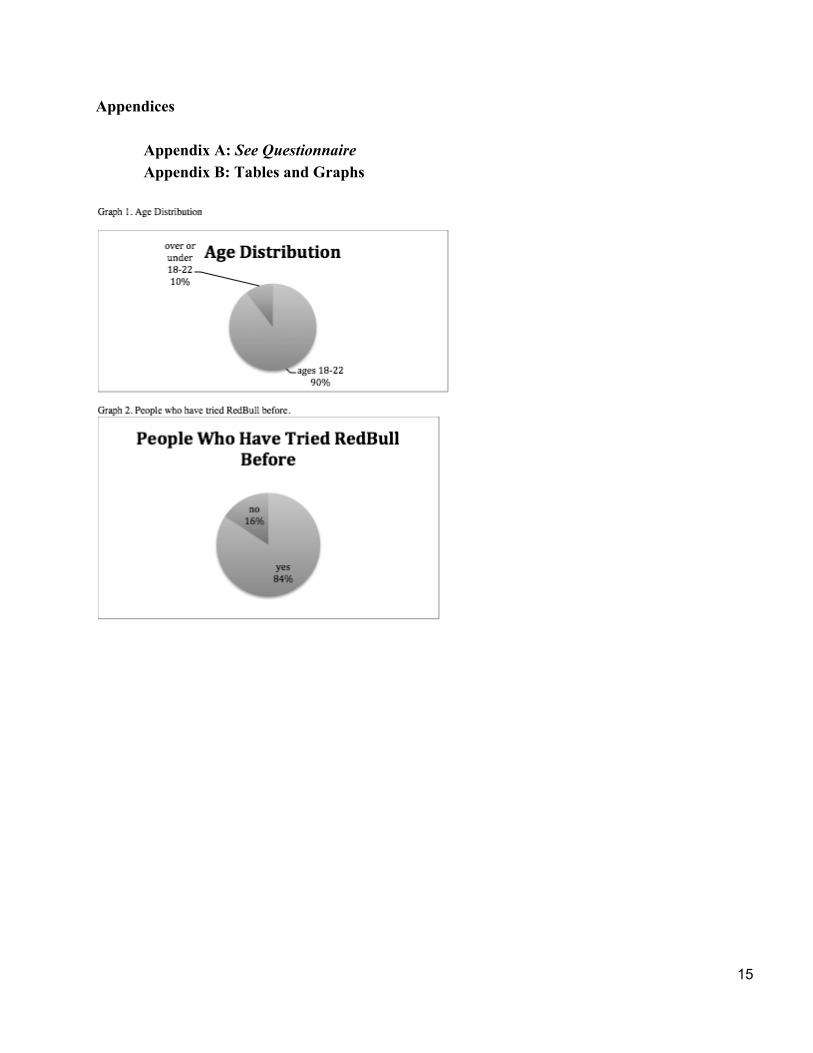
Appendices
Appendix A: See Questionnaire Appendix B: Tables and Graphs
15
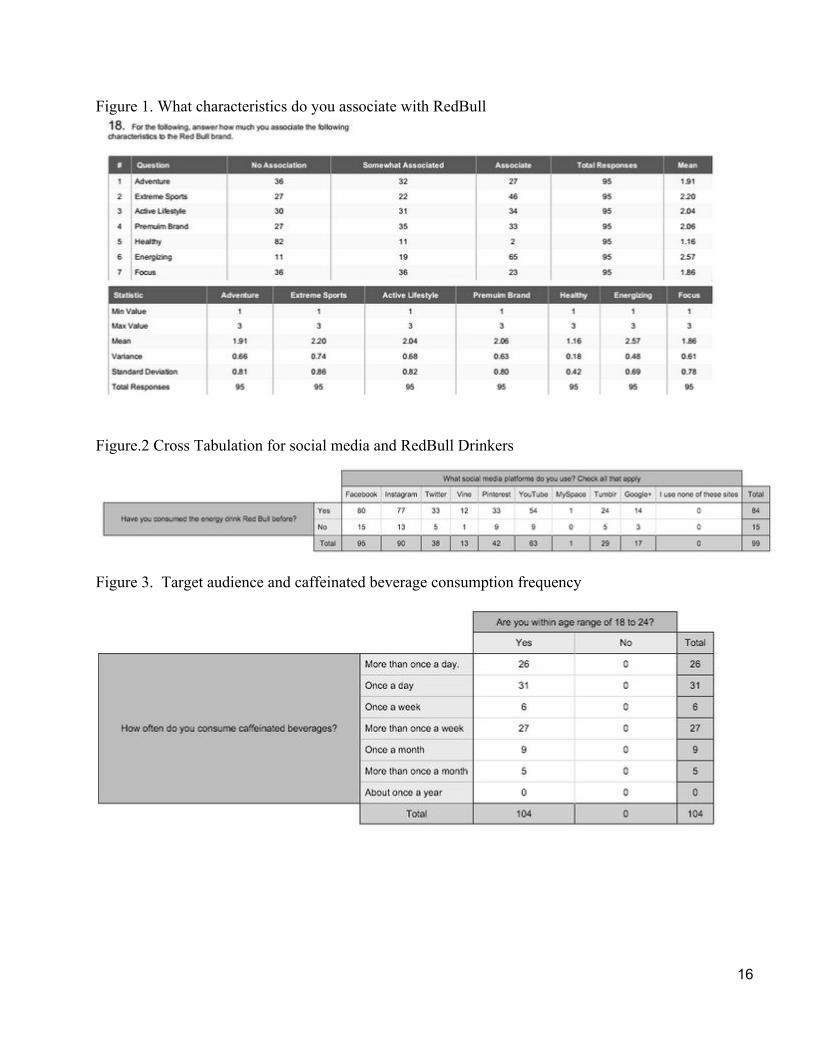
Figure 1. What characteristics do you associate with RedBull
Figure.2 Cross Tabulation for social media and RedBull Drinkers
Figure 3. Target audience and caffeinated beverage consumption frequency
16
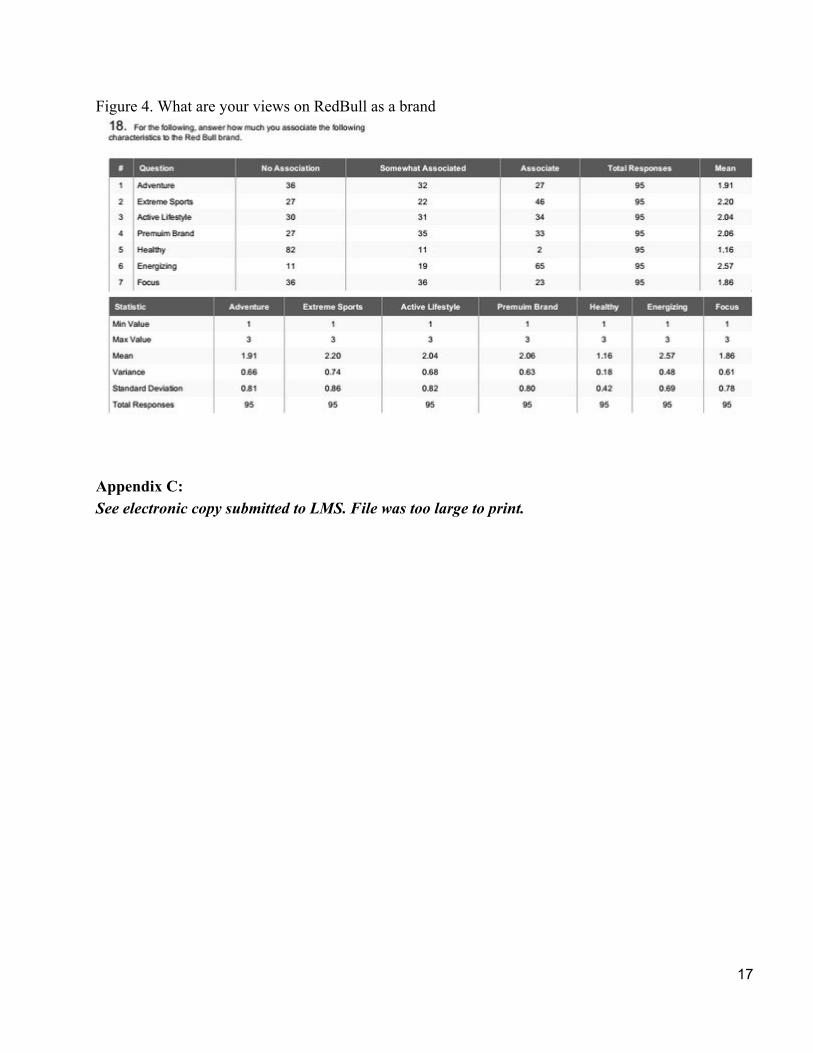
Figure 4. What are your views on RedBull as a brand
Appendix C: See electronic copy submitted to LMS. File was too large to print.
17