APPENDIX 2 Forecast Planned NTP SC - mwra.state.ma.us · Mill Cove Siphon Sluice Gates ‐ Design...
29
APPENDIX 2 Expenditure Forecast Report with Planned NTP and SC dates
Transcript of APPENDIX 2 Forecast Planned NTP SC - mwra.state.ma.us · Mill Cove Siphon Sluice Gates ‐ Design...

APPENDIX 2
Expenditure Forecast Report with Planned NTP
and SC dates
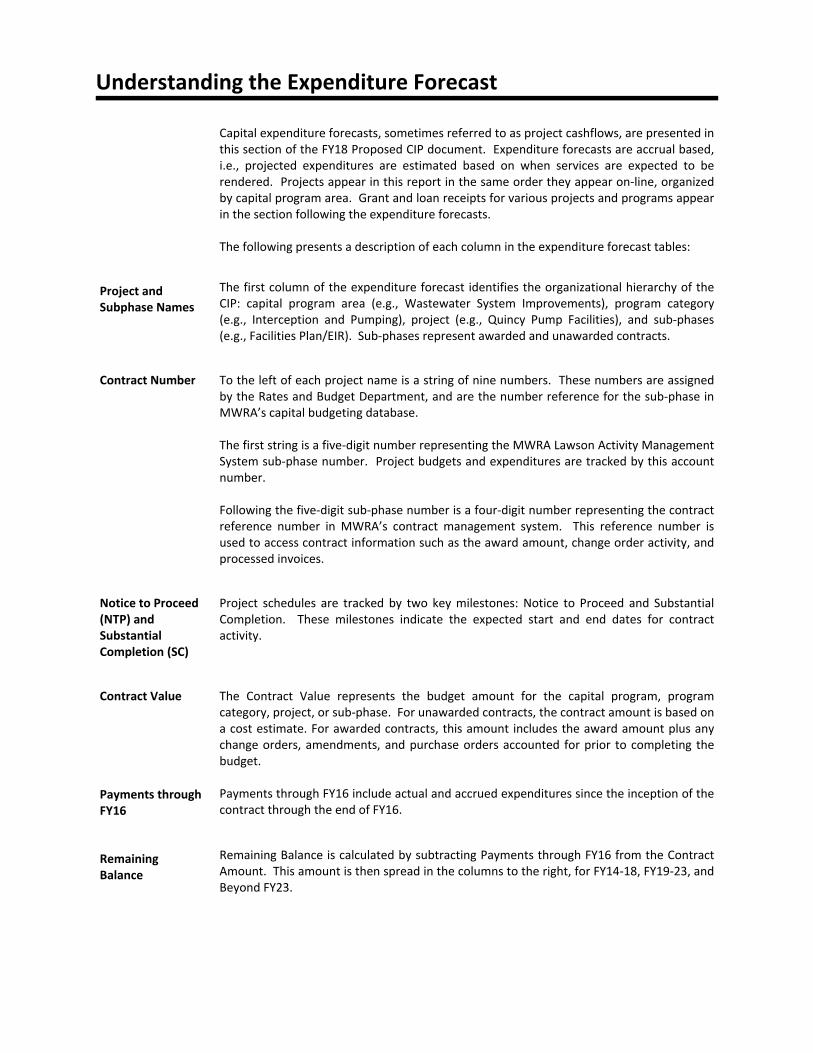
Understanding the Expenditure Forecast
Capital expenditure forecasts, sometimes referred to as project cashflows, are presented in this section of the FY18 Proposed CIP document. Expenditure forecasts are accrual based, i.e., projected expenditures are estimated based on when services are expected to be rendered. Projects appear in this report in the same order they appear on‐line, organized by capital program area. Grant and loan receipts for various projects and programs appear in the section following the expenditure forecasts. The following presents a description of each column in the expenditure forecast tables:
Project and Subphase Names
The first column of the expenditure forecast identifies the organizational hierarchy of the CIP: capital program area (e.g., Wastewater System Improvements), program category (e.g., Interception and Pumping), project (e.g., Quincy Pump Facilities), and sub‐phases (e.g., Facilities Plan/EIR). Sub‐phases represent awarded and unawarded contracts.
Contract Number
To the left of each project name is a string of nine numbers. These numbers are assigned by the Rates and Budget Department, and are the number reference for the sub‐phase in MWRA’s capital budgeting database. The first string is a five‐digit number representing the MWRA Lawson Activity Management System sub‐phase number. Project budgets and expenditures are tracked by this account number. Following the five‐digit sub‐phase number is a four‐digit number representing the contract reference number in MWRA’s contract management system. This reference number is used to access contract information such as the award amount, change order activity, and processed invoices.
Notice to Proceed (NTP) and Substantial Completion (SC)
Project schedules are tracked by two key milestones: Notice to Proceed and Substantial Completion. These milestones indicate the expected start and end dates for contract activity.
Contract Value
Payments through FY16
The Contract Value represents the budget amount for the capital program, program category, project, or sub‐phase. For unawarded contracts, the contract amount is based on a cost estimate. For awarded contracts, this amount includes the award amount plus any change orders, amendments, and purchase orders accounted for prior to completing the budget. Payments through FY16 include actual and accrued expenditures since the inception of the contract through the end of FY16.
Remaining Balance
Remaining Balance is calculated by subtracting Payments through FY16 from the Contract Amount. This amount is then spread in the columns to the right, for FY14‐18, FY19‐23, and Beyond FY23.
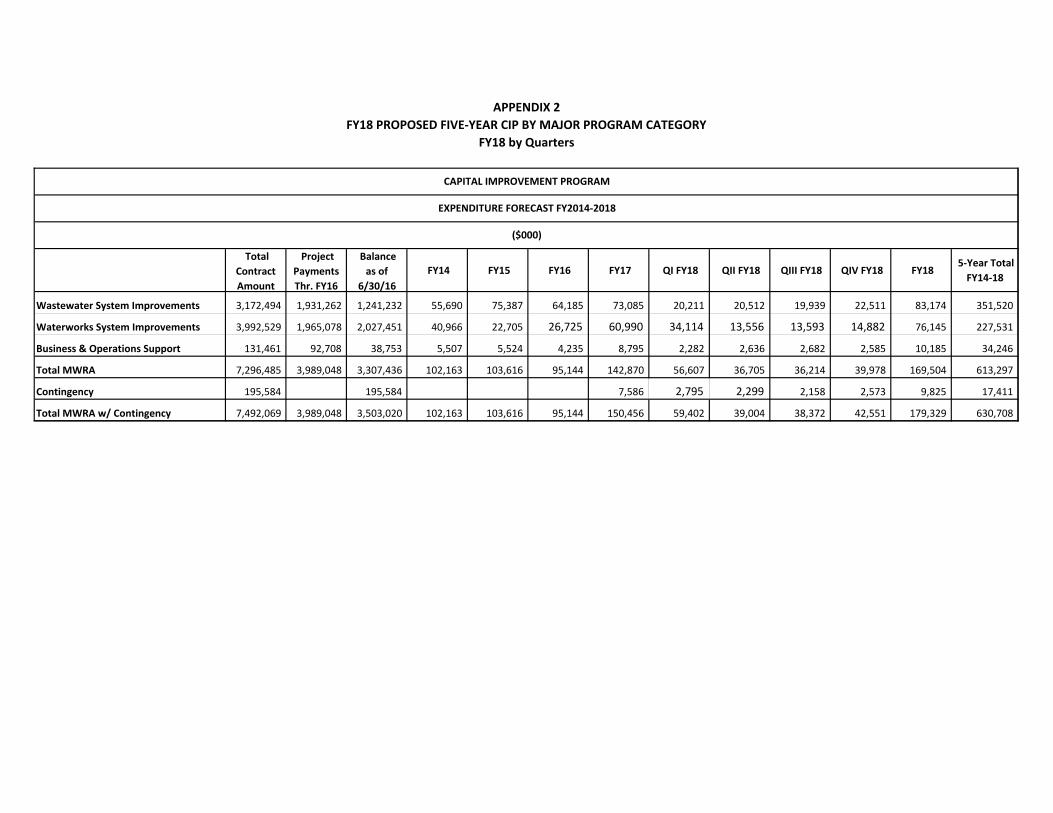
APPENDIX 2
FY18 PROPOSED FIVE‐YEAR CIP BY MAJOR PROGRAM CATEGORY
FY18 by Quarters
Total
Contract
Amount
Project
Payments
Thr. FY16
Balance
as of
6/30/16
FY14 FY15 FY16 FY17 QI FY18 QII FY18 QIII FY18 QIV FY18 FY18 5‐Year Total
FY14‐18
Wastewater System Improvements 3,172,494 1,931,262 1,241,232 55,690 75,387 64,185 73,085 20,211 20,512 19,939 22,511 83,174 351,520
Waterworks System Improvements 3,992,529 1,965,078 2,027,451 40,966 22,705 26,725 60,990 34,114 13,556 13,593 14,882 76,145 227,531
Business & Operations Support 131,461 92,708 38,753 5,507 5,524 4,235 8,795 2,282 2,636 2,682 2,585 10,185 34,246
Total MWRA 7,296,485 3,989,048 3,307,436 102,163 103,616 95,144 142,870 56,607 36,705 36,214 39,978 169,504 613,297
Contingency 195,584 195,584 7,586 2,795 2,299 2,158 2,573 9,825 17,411
Total MWRA w/ Contingency 7,492,069 3,989,048 3,503,020 102,163 103,616 95,144 150,456 59,402 39,004 38,372 42,551 179,329 630,708
CAPITAL IMPROVEMENT PROGRAM
EXPENDITURE FORECAST FY2014‐2018
($000)

Massachusetts Water Resources Authority
FY18 Proposed Expenditure Forecast
Program/Project/Subphase Contract No.
Notice
To
Proceed
Substantial
Completion
Total Contract
Amount
Payments
through FY16
Remaining
Balance FY17 FY18 FY14 ‐ FY18 FY19‐FY23 Beyond FY23
Total MWRA 7,296,484,522 3,989,048,179 3,307,436,343 142,870,027 169,503,932 613,297,221 1,406,312,374 1,588,749,993
Wastewater 3,172,494,495 1,931,262,178 1,241,232,317 73,084,692 83,174,142 351,520,357 775,726,450 309,247,029
Interception & Pumping 980,614,986 542,626,109 437,988,877 21,534,912 36,712,381 80,333,339 301,064,667 78,676,916
102 Quincy Pump Facilities completed project 25,907,202 25,907,202 ‐
104 Braintree‐Weymouth Relief Facilities 234,492,623 227,704,621 6,788,001 240,899 241,588 6,547,101
Geotechnical ‐ Marine 10001_5333 Nov‐91 Apr‐92 442,860 442,860 ‐
Geotechnical ‐ Land 10044_5332 Nov‐91 Mar‐92 7,980 7,980 ‐
Facilities Planning ‐ Phase 1 10045_5311 Oct‐81 Dec‐90 331,140 331,140 ‐
EIR ‐ Phase 1 10046_5312 Nov‐84 Oct‐90 513,530 513,530 ‐
Design 1/CS/RI 10047_5313 Nov‐94 Jun‐06 18,882,312 18,882,312 ‐
Land Acquisition 10048_5314 Mar‐97 Jun‐10 12,841,909 12,841,908 ‐
Tunnel Construction/Rescue 10049_5315 Jun‐99 Jul‐03 83,190,599 83,190,599 ‐
Intermediate Pump Station ‐ Construction 10050_5316 Dec‐00 Apr‐05 47,444,929 47,444,929 ‐
North Weymouth Relief Interceptor 10051_5303 Mar‐01 Jun‐02 4,704,618 4,704,618 ‐
HDD Siphon ‐ Construction 10052_5373 Jul‐03 May‐07 16,357,407 16,357,407 ‐
Braintree‐Weymouth Replacement Pump Station 10054_5375 Jan‐05 Apr‐08 17,728,028 17,728,028 ‐
Design ‐ Rehab 10055_5308 Sep‐88 Dec‐89 23,710 23,710 ‐
Construction ‐ Rehab 10056_5309 Jan‐92 Dec‐96 255,490 255,490 ‐
Final EIR/Facility Plan 10057_5324 Apr‐91 Aug‐93 1,111,007 1,111,007 ‐
Design 2/CS/RI 10058_5331 Apr‐95 Dec‐11 14,999,141 14,999,141 ‐ (573)
Rehabilitation of Section 624 ‐ Construction 10060_5310 Jul‐10 Dec‐10 2,505,767 2,505,767 ‐
Technical Assistance 10061_5951 Nov‐84 Apr‐07 144,264 144,264 ‐
Sedimentation Testing 10251_6016 Sep‐94 Apr‐96 95,880 95,880 ‐
Legal 10263_6072 Jul‐95 Apr‐08 849,220 849,220 ‐
Public Relations 10264_6073 Jul‐95 Apr‐07 ‐ ‐ ‐
Hazardous Waste 10265_6074 Jul‐95 Apr‐07 7,937 7,937 ‐
Marine Pipeline ‐ Design 10278_6119 Feb‐97 Aug‐97 1,100,000 1,100,000 ‐
Mill Cove Siphon ‐ Construction 10302_6368 Aug‐97 Jun‐98 2,748,908 2,748,908 ‐
Community Technical Assistance 10354_6631 Jul‐99 Apr‐07 1,111,451 1,111,451 ‐
Geotechnical Consultant 10375_6766 Sep‐00 Mar‐03 56,045 56,045 ‐
IPS/RPS Communication System 10378_6792 Dec‐02 Apr‐08 224,884 224,884 ‐
Rehabilitation of Section 624 ‐ Design 10452_7193 ‐ ‐ ‐
Wetlands Replication 10470_7290 25,607 25,606 1 1,262
Mill Cove Siphon Sluice Gates ‐ Design 10479_7326 Jul‐17 Mar‐21 788,000 ‐ 788,000 157,599 157,599 630,401
Mill Cove Sluice Gates ‐ Construction 10480_7327 Mar‐19 Mar‐20 2,000,000 ‐ 2,000,000 2,000,000
B/W Improvements ‐ Construction 10493_7366 Dec‐19 Dec‐21 3,200,000 ‐ 3,200,000 3,200,000
B/W Improvements ‐ Design/CS/RI 19567_9586 Dec‐17 Nov‐22 800,000 ‐ 800,000 83,300 83,300 716,700
105 New Neponset Valley Relief Sewer completed project 30,300,304 30,300,304 ‐
106 Wellesley Extension Replacement Sewer completed project 64,358,543 64,358,543 ‐
107 Framingham Extension Relief Sewer completed project 47,855,986 47,855,986 ‐
1 of 25
Massachusetts Water Resources Authority
FY18 Proposed Expenditure Forecast
Program/Project/Subphase Contract No.
Notice
To
Proceed
Substantial
Completion
Total Contract
Amount
Payments
through FY16
Remaining
Balance FY17 FY18 FY14 ‐ FY18 FY19‐FY23 Beyond FY23
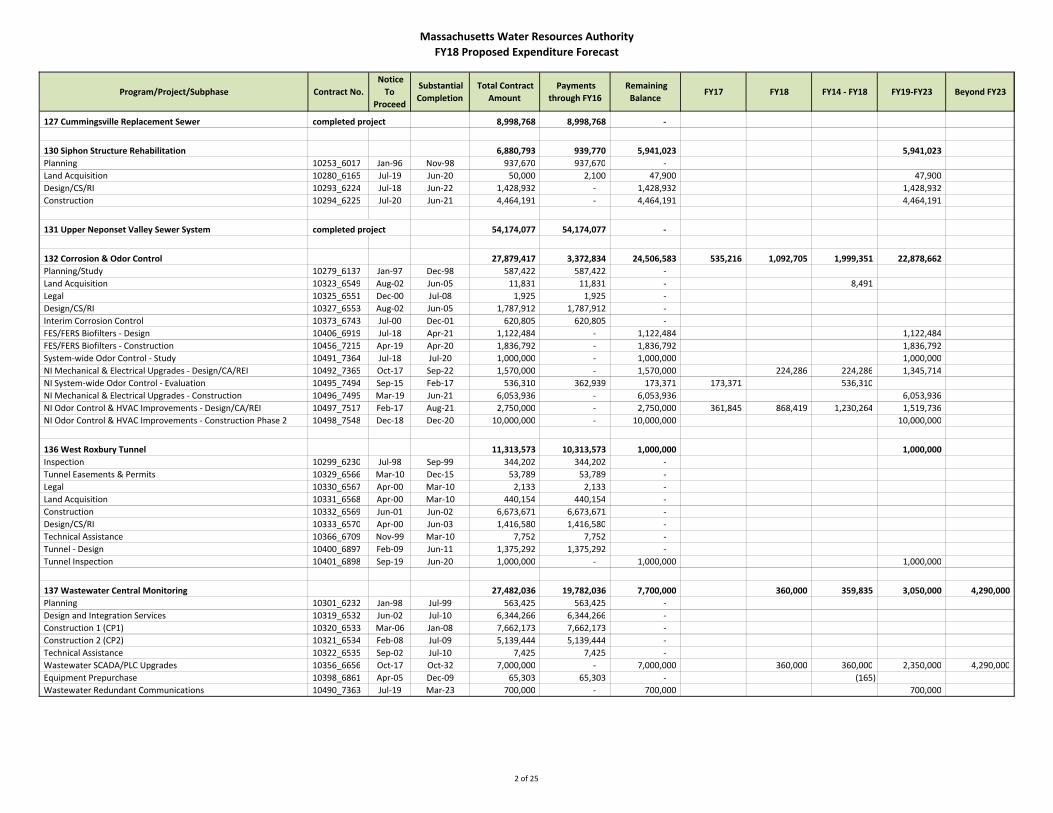
127 Cummingsville Replacement Sewer completed project 8,998,768 8,998,768 ‐
130 Siphon Structure Rehabilitation 6,880,793 939,770 5,941,023 5,941,023
Planning 10253_6017 Jan‐96 Nov‐98 937,670 937,670 ‐
Land Acquisition 10280_6165 Jul‐19 Jun‐20 50,000 2,100 47,900 47,900
Design/CS/RI 10293_6224 Jul‐18 Jun‐22 1,428,932 ‐ 1,428,932 1,428,932
Construction 10294_6225 Jul‐20 Jun‐21 4,464,191 ‐ 4,464,191 4,464,191
131 Upper Neponset Valley Sewer System completed project 54,174,077 54,174,077 ‐
132 Corrosion & Odor Control 27,879,417 3,372,834 24,506,583 535,216 1,092,705 1,999,351 22,878,662
Planning/Study 10279_6137 Jan‐97 Dec‐98 587,422 587,422 ‐
Land Acquisition 10323_6549 Aug‐02 Jun‐05 11,831 11,831 ‐ 8,491
Legal 10325_6551 Dec‐00 Jul‐08 1,925 1,925 ‐
Design/CS/RI 10327_6553 Aug‐02 Jun‐05 1,787,912 1,787,912 ‐
Interim Corrosion Control 10373_6743 Jul‐00 Dec‐01 620,805 620,805 ‐
FES/FERS Biofilters ‐ Design 10406_6919 Jul‐18 Apr‐21 1,122,484 ‐ 1,122,484 1,122,484
FES/FERS Biofilters ‐ Construction 10456_7215 Apr‐19 Apr‐20 1,836,792 ‐ 1,836,792 1,836,792
System‐wide Odor Control ‐ Study 10491_7364 Jul‐18 Jul‐20 1,000,000 ‐ 1,000,000 1,000,000
NI Mechanical & Electrical Upgrades ‐ Design/CA/REI 10492_7365 Oct‐17 Sep‐22 1,570,000 ‐ 1,570,000 224,286 224,286 1,345,714
NI System‐wide Odor Control ‐ Evaluation 10495_7494 Sep‐15 Feb‐17 536,310 362,939 173,371 173,371 536,310
NI Mechanical & Electrical Upgrades ‐ Construction 10496_7495 Mar‐19 Jun‐21 6,053,936 ‐ 6,053,936 6,053,936
NI Odor Control & HVAC Improvements ‐ Design/CA/REI 10497_7517 Feb‐17 Aug‐21 2,750,000 ‐ 2,750,000 361,845 868,419 1,230,264 1,519,736
NI Odor Control & HVAC Improvements ‐ Construction Phase 2 10498_7548 Dec‐18 Dec‐20 10,000,000 ‐ 10,000,000 10,000,000
136 West Roxbury Tunnel 11,313,573 10,313,573 1,000,000 1,000,000
Inspection 10299_6230 Jul‐98 Sep‐99 344,202 344,202 ‐
Tunnel Easements & Permits 10329_6566 Mar‐10 Dec‐15 53,789 53,789 ‐
Legal 10330_6567 Apr‐00 Mar‐10 2,133 2,133 ‐
Land Acquisition 10331_6568 Apr‐00 Mar‐10 440,154 440,154 ‐
Construction 10332_6569 Jun‐01 Jun‐02 6,673,671 6,673,671 ‐
Design/CS/RI 10333_6570 Apr‐00 Jun‐03 1,416,580 1,416,580 ‐
Technical Assistance 10366_6709 Nov‐99 Mar‐10 7,752 7,752 ‐
Tunnel ‐ Design 10400_6897 Feb‐09 Jun‐11 1,375,292 1,375,292 ‐
Tunnel Inspection 10401_6898 Sep‐19 Jun‐20 1,000,000 ‐ 1,000,000 1,000,000
137 Wastewater Central Monitoring 27,482,036 19,782,036 7,700,000 360,000 359,835 3,050,000 4,290,000
Planning 10301_6232 Jan‐98 Jul‐99 563,425 563,425 ‐
Design and Integration Services 10319_6532 Jun‐02 Jul‐10 6,344,266 6,344,266 ‐
Construction 1 (CP1) 10320_6533 Mar‐06 Jan‐08 7,662,173 7,662,173 ‐
Construction 2 (CP2) 10321_6534 Feb‐08 Jul‐09 5,139,444 5,139,444 ‐
Technical Assistance 10322_6535 Sep‐02 Jul‐10 7,425 7,425 ‐
Wastewater SCADA/PLC Upgrades 10356_6656 Oct‐17 Oct‐32 7,000,000 ‐ 7,000,000 360,000 360,000 2,350,000 4,290,000
Equipment Prepurchase 10398_6861 Apr‐05 Dec‐09 65,303 65,303 ‐ (165)
Wastewater Redundant Communications 10490_7363 Jul‐19 Mar‐23 700,000 ‐ 700,000 700,000
2 of 25

Massachusetts Water Resources Authority
FY18 Proposed Expenditure Forecast
Program/Project/Subphase Contract No.
Notice
To
Proceed
Substantial
Completion
Total Contract
Amount
Payments
through FY16
Remaining
Balance FY17 FY18 FY14 ‐ FY18 FY19‐FY23 Beyond FY23
139 South System Relief 4,939,244 3,439,244 1,500,000 1,500,000
Archdale ‐ CS/RI 10309_6419 Nov‐98 Aug‐99 5,379 5,379 ‐
Archdale ‐ Construction 10310_6420 May‐99 Aug‐99 210,748 210,748 ‐
Sections 70 & 71 HLS ‐ Evaluation 10318_6519 Sep‐98 Oct‐99 215,140 215,140 ‐
Outfall 023 ‐ Design 10345_6595 Jun‐99 Sep‐99 509 509 ‐
Outfall 023 ‐ Cleaning 10346_6596 Apr‐00 Nov‐00 1,097,526 1,097,526 ‐
Land Acquisition/Easements 10347_6605 Apr‐99 Apr‐05 5,053 5,053 ‐
Sections 70 & 71 HLS ‐ Construction 10349_6611 Jun‐99 Oct‐99 417,021 417,021 ‐
Milton Financial Assistance 10350_6616 Oct‐99 Jun‐00 1,487,868 1,487,868 ‐
Outfall 023 ‐ Structural Improvements 10386_6801 Jan‐19 Dec‐20 1,500,000 ‐ 1,500,000 1,500,000
141 Wastewater Process Optimization 10,416,274 1,501,767 8,914,507 296,588 5,195,484 3,719,023
Planning 10367_6733 Aug‐01 Aug‐04 930,308 930,308 ‐
North System Hydraulic Study 10412_6930 Nov‐11 Jun‐15 571,459 571,459 ‐ 296,588
Somerville Sewer ‐ Design 10413_6931 Oct‐19 Mar‐22 200,000 ‐ 200,000 200,000
Somerville Sewer ‐ Construction 10414_6932 Mar‐21 Mar‐22 1,122,484 ‐ 1,122,484 1,122,484
Siphon ‐ Planning 10415_6933 Nov‐18 Jun‐19 150,000 ‐ 150,000 150,000
Hydraulic Flood Engineering Design & Construction ‐ N. System 19401_7412 Jan‐19 Jun‐27 7,442,023 ‐ 7,442,023 3,723,000 3,719,023
142 Wastewater Meter System ‐ Equipment Replacement 28,437,912 5,137,912 23,300,000 512,500 512,500 8,187,500 14,600,000
Planning / Study / Design 10371_6739 Jul‐17 Oct‐20 2,700,000 ‐ 2,700,000 512,500 512,500 2,187,500
Equipment Purchase & Installation 10379_6793 Nov‐03 Jun‐08 5,137,912 5,137,912 ‐
Permanent Site Improvements ‐ Construction 10411_6929 Mar‐19 Apr‐20 2,000,000 ‐ 2,000,000 2,000,000
Wastewater Metering Asset Protection Equipment Purchases 10451_7191 Apr‐19 Apr‐30 18,600,000 ‐ 18,600,000 4,000,000 14,600,000
143 Regional I/I Management Planning completed project 168,987 168,987 ‐
145 Facility Asset Protection 391,259,249 38,670,485 352,588,764 20,999,697 34,506,277 76,923,477 241,014,897 56,067,893
Prison Point HVAC Upgrades ‐ Construction 10380_6795 Dec‐10 Dec‐13 2,764,188 2,764,181 7 7 318,377
Remote Headworks Heating System Upgrade 10381_6796 May‐05 May‐06 1,175,181 1,175,181 ‐
Alewife Brook Pump Station Rehab ‐ Construction 10382_6797 Jan‐16 May‐18 12,613,000 ‐ 12,613,000 6,818,032 5,794,968 12,613,000
Rehab of Section 93A Lexington 10383_6798 Jul‐03 Apr‐04 1,565,742 1,565,742 ‐
Chelsea Creek Upgrades ‐ REI 10387_6802 Oct‐16 Jan‐21 3,632,829 ‐ 3,632,829 419,172 838,345 1,257,517 2,375,312
Technical Assistance 10392_6829 Jul‐02 Mar‐22 83,688 83,688 ‐ 35,803
Sections 80 & 83 10394_6842 Apr‐07 Sep‐07 364,590 364,590 ‐
Section 160 10395_6843 Jun‐07 Dec‐08 1,581,369 1,581,369 ‐
Survey 10396_6857 Nov‐04 May‐05 10,708 10,708 ‐
Permits 10397_6858 May‐03 Nov‐08 12,856 12,856 ‐ 3,945
Remote Headworks Concept Plan 10399_6886 May‐08 Sep‐09 670,436 670,436 ‐
Cambridge Branch 1, Sections 26 & 27 ‐Construction 10418_6936 Sep‐20 Sep‐22 14,500,000 ‐ 14,500,000 14,500,000
Alewife Brook Pump Station Rehab ‐ Design/CA 10419_6937 Apr‐10 Oct‐11 223,194 223,194 ‐
Prison Point HVAC Upgrades ‐ Design 10420_6938 Jan‐08 Mar‐13 441,387 441,387 ‐ (10,818)
93A Force Main Replacement 10423_6987 May‐06 Jan‐07 461,962 461,962 ‐
Mill Brook Valley Sewer Sections 79 & 92 10424_7004 Jun‐04 Mar‐05 542,292 542,292 ‐
Hingham Pump Station Isolation Gate ‐ Construction 10427_7033 Sep‐11 May‐12 124,500 124,500 ‐
Alewife Brook Pump Station ‐ Final Design/CA/REI 10428_7034 Mar‐12 May‐19 1,813,026 1,030,539 782,487 243,698 248,672 898,474 290,117
Caruso Pump Station Improvements ‐ Design/CA/REI 10431_7037 Aug‐12 Jun‐17 865,096 528,118 336,978 163,822 138,526 607,025 34,630
Land/Easements 10440_7073 Jul‐03 Jun‐10 103,386 103,386 ‐
Nut Island Headworks Fire Alarm/Wire Conduit 10444_7144 Jun‐09 Dec‐09 285,391 285,391 ‐
3 of 25

Massachusetts Water Resources Authority
FY18 Proposed Expenditure Forecast
Program/Project/Subphase Contract No.
Notice
To
Proceed
Substantial
Completion
Total Contract
Amount
Payments
through FY16
Remaining
Balance FY17 FY18 FY14 ‐ FY18 FY19‐FY23 Beyond FY23
Chelsea Creek Headworks Upgrades ‐ Construction 10445_7161 Nov‐16 Nov‐20 72,859,000 ‐ 72,859,000 4,553,687 18,214,750 22,768,437 50,090,563
Pump Stations & CSOs Condition Assessment 10446_7162 Dec‐17 Dec‐19 3,254,970 ‐ 3,254,970 610,000 610,000 2,644,970
Interceptor Renewal 1, Reading Extension ‐ Design/CA/REI 10447_7163 Aug‐15 Jun‐19 1,156,116 249,743 906,373 258,774 287,822 796,338 359,777
Interceptor Renewal 1, Reading Extension ‐ Construction 10448_7164 Mar‐17 Jun‐18 4,425,581 ‐ 4,425,581 276,599 3,319,186 3,595,785 829,796
Chelsea Creek Headworks Upgrades ‐ Design/CA 10455_7206 Jul‐10 Jun‐21 8,786,831 5,480,852 3,305,979 544,438 649,775 4,383,852 2,111,766
Malden & Melrose Hydraulics & Structural ‐Study & Design 10457_7216 Jan‐19 Dec‐19 300,000 ‐ 300,000 300,000
Malden & Melrose Hydraulics & Structural ‐ Construction 10458_7217 Jul‐20 Jul‐22 1,000,000 ‐ 1,000,000 1,000,000
Headworks Effluent Shaft ‐ Study 10463_7237 Jul‐17 Jul‐18 500,000 ‐ 500,000 375,000 375,000 125,000
Interceptor Renewal 3, Dorchester Interceptor Sewer‐Construct. 10467_7279 Jan‐19 Jan‐21 4,146,152 ‐ 4,146,152 4,146,152
Cambridge Branch 2 Everett Sections 23, 24 ‐ Construction 10468_7280 Sep‐22 Sep‐24 10,000,000 ‐ 10,000,000 2,800,000 7,200,000
Cottage Farm Fuel System Upgrade 10469_7281 Jun‐12 Apr‐13 497,558 497,558 ‐
NI Elecrical & Grit/Sreenings Conveyance System ‐ Design/CA/RI 10477_7312 Mar‐11 May‐16 1,249,477 1,232,802 16,675 16,675 626,326
NI Electrical & Grit/Sreenings Conveyance System ‐ Construction 10478_7313 Jul‐13 May‐15 5,192,243 5,192,243 ‐ 5,192,243
Interceptor Renewal No. 5 ‐ Milton Sections 607, 608, 609, 610 10481_7328 Oct‐19 Oct‐21 10,000,000 ‐ 10,000,000 10,000,000
Interceptor Renewal No. 6 ‐ Chelsea Sections 12, 14, 15, 62 10482_7329 Mar‐21 Mar‐23 11,000,000 ‐ 11,000,000 11,000,000
Prison Point/Cottage Farm Pump & Gearbox Rebuilds ESDC 10483_7330 Feb‐14 Dec‐16 319,682 407,208 (87,526) (87,526) 319,682
Somerville/Marginal Influent Gates & Stop‐Log Replacement 10484_7344 Jul‐11 Nov‐11 366,848 366,848 ‐
Prison Point Rehab ‐ Design/CA/RI 10486_7359 Jul‐16 Jul‐21 2,838,370 ‐ 2,838,370 459,757 559,674 1,019,431 1,818,939
System Relief & Contingency Planning 10487_7360 Jul‐20 Jun‐23 500,000 ‐ 500,000 458,334 41,666
DeLauri Pump Station Screens, Gates, Valves & Security 10488_7361 Oct‐17 Mar‐19 1,078,570 ‐ 1,078,570 359,524 359,524 719,046
Caruso Pump Station Improvements ‐ Construction 10489_7362 Mar‐16 Mar‐17 4,484,597 578,884 3,905,713 3,905,712 4,484,597
Pump Station Rehab ‐ Preliminary Design/Study 10500_7375 Jul‐19 Jul‐20 750,000 ‐ 750,000 750,000
Section 156 Rehab ‐ Design/Build 10503_7393 Jul‐11 Jul‐12 2,562,778 2,562,773 5 5 5
Cambridge Branch 1 Sections 26, 27 ‐ Design/ ESDC 10504_7410 Sep‐18 Sep‐23 3,600,000 ‐ 3,600,000 3,245,902 354,098
Sections 4, 5, 6, 186 ‐ Design CA/RI 10505_7421 Nov‐18 Nov‐23 3,000,000 ‐ 3,000,000 2,605,000 395,000
Sections 4, 5, 6, 186 ‐ Construction 10506_7422 Nov‐20 Nov‐22 16,000,000 ‐ 16,000,000 16,000,000
Sections 4, 5, 6, 186 ‐ Study 10507_7423 Jan‐17 Jun‐18 1,831,878 ‐ 1,831,878 407,084 1,323,023 1,730,107 101,771
Columbus Park & Ward Street Headworks ‐ Design/CA/REI 10510_7429 Jul‐18 Jan‐26 10,510,532 ‐ 10,510,532 6,583,519 3,927,013
Columbus Park & Ward Street Headworks ‐ Construction 10511_7430 Aug‐20 Jan‐25 103,064,440 ‐ 103,064,440 62,227,586 40,836,854
Chelsea Screenhouse Upgrades 10512_7431 Aug‐15 Sep‐16 5,036,570 3,373,670 1,662,900 1,662,901 5,036,571
Prison Point/Cottage Farm Pump & Gearbox Rebuilds 10515_7452 Oct‐13 Nov‐15 6,439,438 6,439,438 ‐ 6,439,438
Prison Point Piping Rehab 10518_7459 Oct‐16 May‐17 466,200 ‐ 466,200 466,200 466,200
Prison Point Rehab ‐ Construction 10519_7462 Jul‐18 Jul‐20 5,822,752 ‐ 5,822,752 5,822,752
Cottage Farm Rehab ‐ Construction 10520_7463 Jul‐21 Jul‐23 10,073,880 ‐ 10,073,880 8,814,645 1,259,235
Chelsea Screenhouse Upgrades ‐ ESDC/REI 10521_7490 Sep‐15 Sep‐17 880,000 318,946 561,054 391,597 169,457 880,000
Cottage Farm Rehab ‐ Design/CA/REI 10522_7508 Jul‐19 Jul‐24 2,014,776 ‐ 2,014,776 1,511,082 503,694
Chelsea Headworks ‐ Caruso Pump Station ‐ Utilities 10523_7510 Jul‐16 Jun‐17 32,000 ‐ 32,000 26,714 5,286 32,000
Cambridge Branch 23, 24, 25, 25.5, 26, 27 ‐ Study 10524_7511 Oct‐16 Mar‐18 686,954 ‐ 686,954 228,984 457,970 686,954
Interceptor Renewal 3 Dorchester Interceptor Sewer ‐ Des/CA/RI 10525_7512 Jan‐17 Jan‐22 1,000,000 ‐ 1,000,000 50,000 200,000 250,000 750,000
Cambridge Branch 2 Everett Sections 23, 24 ‐ Design/ESDC 10526_7513 Sep‐20 Sep‐25 2,500,000 ‐ 2,500,000 1,353,000 1,147,000
Interceptor Renewal 6 Chelsea Sections 12, 14, 15, 62 ‐ Design CA/R 10527_7514 Mar‐19 Mar‐24 2,200,000 ‐ 2,200,000 1,796,667 403,333
Interceptor Renewal 5 Milton Sect. 607, 609, 610 ‐ Des/CA/REI 10528_7515 Oct‐17 Oct‐22 2,000,000 ‐ 2,000,000 200,000 200,000 1,800,000
Quincy & Hingham Pump Stations Fuel Storage Upgrades ‐ Const. 10529_7534 Jan‐17 Sep‐17 580,095 ‐ 580,095 193,365 386,730 580,095
Headworks Effluent Shaft Rehab ‐ Design/CA/REI 10530_7549 Jan‐19 Jul‐22 2,038,140 ‐ 2,038,140 2,038,140
Headworks Effluent Shaft Rehab ‐ Construction 10531_7550 Jul‐20 Jul‐21 10,190,700 ‐ 10,190,700 10,190,700
Wiggins Terminal Pump Station ‐ Design 10532_7551 Sep‐17 Apr‐21 508,855 ‐ 508,855 80,955 80,955 427,900
Wiggins Terminal Pump Station ‐ Construction 10533_7552 Apr‐19 Apr‐20 2,035,420 ‐ 2,035,420 2,035,420
Fuel Oil Tank Replacement at Various Facilities ‐ Design 10534_7553 Jul‐17 Jul‐21 1,528,605 ‐ 1,528,605 286,614 286,614 1,241,991
Fuel Oil Tank Replacement at Various Facilities ‐ Const. Phase 1 10535_7554 Jul‐18 Jul‐20 3,566,745 ‐ 3,566,745 3,566,745
Fuel Oil Tank Replacement at Various Facilities ‐ Const. Phase 2 10536_7555 Jan‐19 Jul‐20 2,547,675 ‐ 2,547,675 2,547,675
4 of 25
Massachusetts Water Resources Authority
FY18 Proposed Expenditure Forecast
Program/Project/Subphase Contract No.
Notice
To
Proceed
Substantial
Completion
Total Contract
Amount
Payments
through FY16
Remaining
Balance FY17 FY18 FY14 ‐ FY18 FY19‐FY23 Beyond FY23
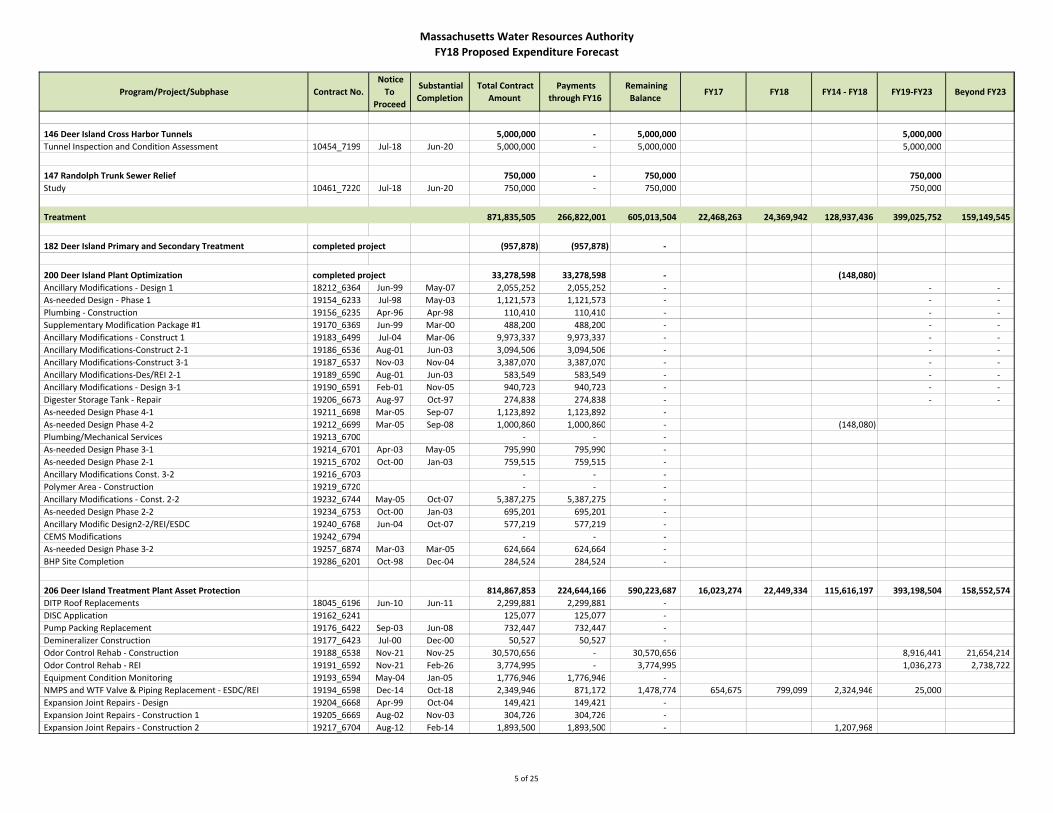
146 Deer Island Cross Harbor Tunnels 5,000,000 ‐ 5,000,000 5,000,000
Tunnel Inspection and Condition Assessment 10454_7199 Jul‐18 Jun‐20 5,000,000 ‐ 5,000,000 5,000,000
147 Randolph Trunk Sewer Relief 750,000 ‐ 750,000 750,000
Study 10461_7220 Jul‐18 Jun‐20 750,000 ‐ 750,000 750,000
Treatment 871,835,505 266,822,001 605,013,504 22,468,263 24,369,942 128,937,436 399,025,752 159,149,545
182 Deer Island Primary and Secondary Treatment completed project (957,878) (957,878) ‐
200 Deer Island Plant Optimization completed project 33,278,598 33,278,598 ‐ (148,080)
Ancillary Modifications ‐ Design 1 18212_6364 Jun‐99 May‐07 2,055,252 2,055,252 ‐ ‐ ‐
As‐needed Design ‐ Phase 1 19154_6233 Jul‐98 May‐03 1,121,573 1,121,573 ‐ ‐ ‐
Plumbing ‐ Construction 19156_6235 Apr‐96 Apr‐98 110,410 110,410 ‐ ‐ ‐
Supplementary Modification Package #1 19170_6369 Jun‐99 Mar‐00 488,200 488,200 ‐ ‐ ‐
Ancillary Modifications ‐ Construct 1 19183_6499 Jul‐04 Mar‐06 9,973,337 9,973,337 ‐ ‐ ‐
Ancillary Modifications‐Construct 2‐1 19186_6536 Aug‐01 Jun‐03 3,094,506 3,094,506 ‐ ‐ ‐
Ancillary Modifications‐Construct 3‐1 19187_6537 Nov‐03 Nov‐04 3,387,070 3,387,070 ‐ ‐ ‐
Ancillary Modifications‐Des/REI 2‐1 19189_6590 Aug‐01 Jun‐03 583,549 583,549 ‐ ‐ ‐
Ancillary Modifications ‐ Design 3‐1 19190_6591 Feb‐01 Nov‐05 940,723 940,723 ‐ ‐ ‐
Digester Storage Tank ‐ Repair 19206_6673 Aug‐97 Oct‐97 274,838 274,838 ‐ ‐ ‐
As‐needed Design Phase 4‐1 19211_6698 Mar‐05 Sep‐07 1,123,892 1,123,892 ‐
As‐needed Design Phase 4‐2 19212_6699 Mar‐05 Sep‐08 1,000,860 1,000,860 ‐ (148,080)
Plumbing/Mechanical Services 19213_6700 ‐ ‐ ‐
As‐needed Design Phase 3‐1 19214_6701 Apr‐03 May‐05 795,990 795,990 ‐
As‐needed Design Phase 2‐1 19215_6702 Oct‐00 Jan‐03 759,515 759,515 ‐
Ancillary Modifications Const. 3‐2 19216_6703 ‐ ‐ ‐
Polymer Area ‐ Construction 19219_6720 ‐ ‐ ‐
Ancillary Modifications ‐ Const. 2‐2 19232_6744 May‐05 Oct‐07 5,387,275 5,387,275 ‐
As‐needed Design Phase 2‐2 19234_6753 Oct‐00 Jan‐03 695,201 695,201 ‐
Ancillary Modific Design2‐2/REI/ESDC 19240_6768 Jun‐04 Oct‐07 577,219 577,219 ‐
CEMS Modifications 19242_6794 ‐ ‐ ‐
As‐needed Design Phase 3‐2 19257_6874 Mar‐03 Mar‐05 624,664 624,664 ‐
BHP Site Completion 19286_6201 Oct‐98 Dec‐04 284,524 284,524 ‐
206 Deer Island Treatment Plant Asset Protection 814,867,853 224,644,166 590,223,687 16,023,274 22,449,334 115,616,197 393,198,504 158,552,574
DITP Roof Replacements 18045_6196 Jun‐10 Jun‐11 2,299,881 2,299,881 ‐
DISC Application 19162_6241 125,077 125,077 ‐
Pump Packing Replacement 19176_6422 Sep‐03 Jun‐08 732,447 732,447 ‐
Demineralizer Construction 19177_6423 Jul‐00 Dec‐00 50,527 50,527 ‐
Odor Control Rehab ‐ Construction 19188_6538 Nov‐21 Nov‐25 30,570,656 ‐ 30,570,656 8,916,441 21,654,214
Odor Control Rehab ‐ REI 19191_6592 Nov‐21 Feb‐26 3,774,995 ‐ 3,774,995 1,036,273 2,738,722
Equipment Condition Monitoring 19193_6594 May‐04 Jan‐05 1,776,946 1,776,946 ‐
NMPS and WTF Valve & Piping Replacement ‐ ESDC/REI 19194_6598 Dec‐14 Oct‐18 2,349,946 871,172 1,478,774 654,675 799,099 2,324,946 25,000
Expansion Joint Repairs ‐ Design 19204_6668 Apr‐99 Oct‐04 149,421 149,421 ‐
Expansion Joint Repairs ‐ Construction 1 19205_6669 Aug‐02 Nov‐03 304,726 304,726 ‐
Expansion Joint Repairs ‐ Construction 2 19217_6704 Aug‐12 Feb‐14 1,893,500 1,893,500 ‐ 1,207,968
5 of 25
Massachusetts Water Resources Authority
FY18 Proposed Expenditure Forecast
Program/Project/Subphase Contract No.
Notice
To
Proceed
Substantial
Completion
Total Contract
Amount
Payments
through FY16
Remaining
Balance FY17 FY18 FY14 ‐ FY18 FY19‐FY23 Beyond FY23
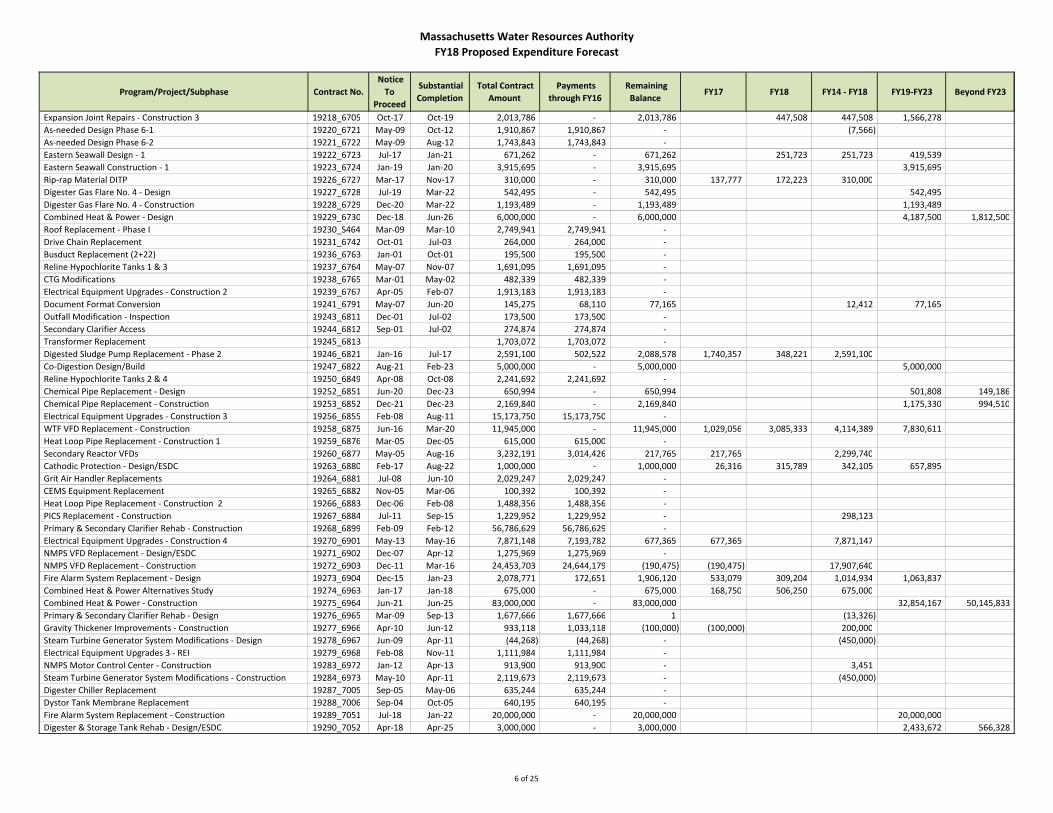
Expansion Joint Repairs ‐ Construction 3 19218_6705 Oct‐17 Oct‐19 2,013,786 ‐ 2,013,786 447,508 447,508 1,566,278
As‐needed Design Phase 6‐1 19220_6721 May‐09 Oct‐12 1,910,867 1,910,867 ‐ (7,566)
As‐needed Design Phase 6‐2 19221_6722 May‐09 Aug‐12 1,743,843 1,743,843 ‐
Eastern Seawall Design ‐ 1 19222_6723 Jul‐17 Jan‐21 671,262 ‐ 671,262 251,723 251,723 419,539
Eastern Seawall Construction ‐ 1 19223_6724 Jan‐19 Jan‐20 3,915,695 ‐ 3,915,695 3,915,695
Rip‐rap Material DITP 19226_6727 Mar‐17 Nov‐17 310,000 ‐ 310,000 137,777 172,223 310,000
Digester Gas Flare No. 4 ‐ Design 19227_6728 Jul‐19 Mar‐22 542,495 ‐ 542,495 542,495
Digester Gas Flare No. 4 ‐ Construction 19228_6729 Dec‐20 Mar‐22 1,193,489 ‐ 1,193,489 1,193,489
Combined Heat & Power ‐ Design 19229_6730 Dec‐18 Jun‐26 6,000,000 ‐ 6,000,000 4,187,500 1,812,500
Roof Replacement ‐ Phase I 19230_S464 Mar‐09 Mar‐10 2,749,941 2,749,941 ‐
Drive Chain Replacement 19231_6742 Oct‐01 Jul‐03 264,000 264,000 ‐
Busduct Replacement (2+22) 19236_6763 Jan‐01 Oct‐01 195,500 195,500 ‐
Reline Hypochlorite Tanks 1 & 3 19237_6764 May‐07 Nov‐07 1,691,095 1,691,095 ‐
CTG Modifications 19238_6765 Mar‐01 May‐02 482,339 482,339 ‐
Electrical Equipment Upgrades ‐ Construction 2 19239_6767 Apr‐05 Feb‐07 1,913,183 1,913,183 ‐
Document Format Conversion 19241_6791 May‐07 Jun‐20 145,275 68,110 77,165 12,412 77,165
Outfall Modification ‐ Inspection 19243_6811 Dec‐01 Jul‐02 173,500 173,500 ‐
Secondary Clarifier Access 19244_6812 Sep‐01 Jul‐02 274,874 274,874 ‐
Transformer Replacement 19245_6813 1,703,072 1,703,072 ‐
Digested Sludge Pump Replacement ‐ Phase 2 19246_6821 Jan‐16 Jul‐17 2,591,100 502,522 2,088,578 1,740,357 348,221 2,591,100
Co‐Digestion Design/Build 19247_6822 Aug‐21 Feb‐23 5,000,000 ‐ 5,000,000 5,000,000
Reline Hypochlorite Tanks 2 & 4 19250_6849 Apr‐08 Oct‐08 2,241,692 2,241,692 ‐
Chemical Pipe Replacement ‐ Design 19252_6851 Jun‐20 Dec‐23 650,994 ‐ 650,994 501,808 149,186
Chemical Pipe Replacement ‐ Construction 19253_6852 Dec‐21 Dec‐23 2,169,840 ‐ 2,169,840 1,175,330 994,510
Electrical Equipment Upgrades ‐ Construction 3 19256_6855 Feb‐08 Aug‐11 15,173,750 15,173,750 ‐
WTF VFD Replacement ‐ Construction 19258_6875 Jun‐16 Mar‐20 11,945,000 ‐ 11,945,000 1,029,056 3,085,333 4,114,389 7,830,611
Heat Loop Pipe Replacement ‐ Construction 1 19259_6876 Mar‐05 Dec‐05 615,000 615,000 ‐
Secondary Reactor VFDs 19260_6877 May‐05 Aug‐16 3,232,191 3,014,426 217,765 217,765 2,299,740
Cathodic Protection ‐ Design/ESDC 19263_6880 Feb‐17 Aug‐22 1,000,000 ‐ 1,000,000 26,316 315,789 342,105 657,895
Grit Air Handler Replacements 19264_6881 Jul‐08 Jun‐10 2,029,247 2,029,247 ‐
CEMS Equipment Replacement 19265_6882 Nov‐05 Mar‐06 100,392 100,392 ‐
Heat Loop Pipe Replacement ‐ Construction 2 19266_6883 Dec‐06 Feb‐08 1,488,356 1,488,356 ‐
PICS Replacement ‐ Construction 19267_6884 Jul‐11 Sep‐15 1,229,952 1,229,952 ‐ 298,123
Primary & Secondary Clarifier Rehab ‐ Construction 19268_6899 Feb‐09 Feb‐12 56,786,629 56,786,629 ‐
Electrical Equipment Upgrades ‐ Construction 4 19270_6901 May‐13 May‐16 7,871,148 7,193,782 677,365 677,365 7,871,147
NMPS VFD Replacement ‐ Design/ESDC 19271_6902 Dec‐07 Apr‐12 1,275,969 1,275,969 ‐
NMPS VFD Replacement ‐ Construction 19272_6903 Dec‐11 Mar‐16 24,453,703 24,644,179 (190,475) (190,475) 17,907,640
Fire Alarm System Replacement ‐ Design 19273_6904 Dec‐15 Jan‐23 2,078,771 172,651 1,906,120 533,079 309,204 1,014,934 1,063,837
Combined Heat & Power Alternatives Study 19274_6963 Jan‐17 Jan‐18 675,000 ‐ 675,000 168,750 506,250 675,000
Combined Heat & Power ‐ Construction 19275_6964 Jun‐21 Jun‐25 83,000,000 ‐ 83,000,000 32,854,167 50,145,833
Primary & Secondary Clarifier Rehab ‐ Design 19276_6965 Mar‐09 Sep‐13 1,677,666 1,677,666 1 (13,326)
Gravity Thickener Improvements ‐ Construction 19277_6966 Apr‐10 Jun‐12 933,118 1,033,118 (100,000) (100,000) 200,000
Steam Turbine Generator System Modifications ‐ Design 19278_6967 Jun‐09 Apr‐11 (44,268) (44,268) ‐ (450,000)
Electrical Equipment Upgrades 3 ‐ REI 19279_6968 Feb‐08 Nov‐11 1,111,984 1,111,984 ‐
NMPS Motor Control Center ‐ Construction 19283_6972 Jan‐12 Apr‐13 913,900 913,900 ‐ 3,451
Steam Turbine Generator System Modifications ‐ Construction 19284_6973 May‐10 Apr‐11 2,119,673 2,119,673 ‐ (450,000)
Digester Chiller Replacement 19287_7005 Sep‐05 May‐06 635,244 635,244 ‐
Dystor Tank Membrane Replacement 19288_7006 Sep‐04 Oct‐05 640,195 640,195 ‐
Fire Alarm System Replacement ‐ Construction 19289_7051 Jul‐18 Jan‐22 20,000,000 ‐ 20,000,000 20,000,000
Digester & Storage Tank Rehab ‐ Design/ESDC 19290_7052 Apr‐18 Apr‐25 3,000,000 ‐ 3,000,000 2,433,672 566,328
6 of 25
Massachusetts Water Resources Authority
FY18 Proposed Expenditure Forecast
Program/Project/Subphase Contract No.
Notice
To
Proceed
Substantial
Completion
Total Contract
Amount
Payments
through FY16
Remaining
Balance FY17 FY18 FY14 ‐ FY18 FY19‐FY23 Beyond FY23
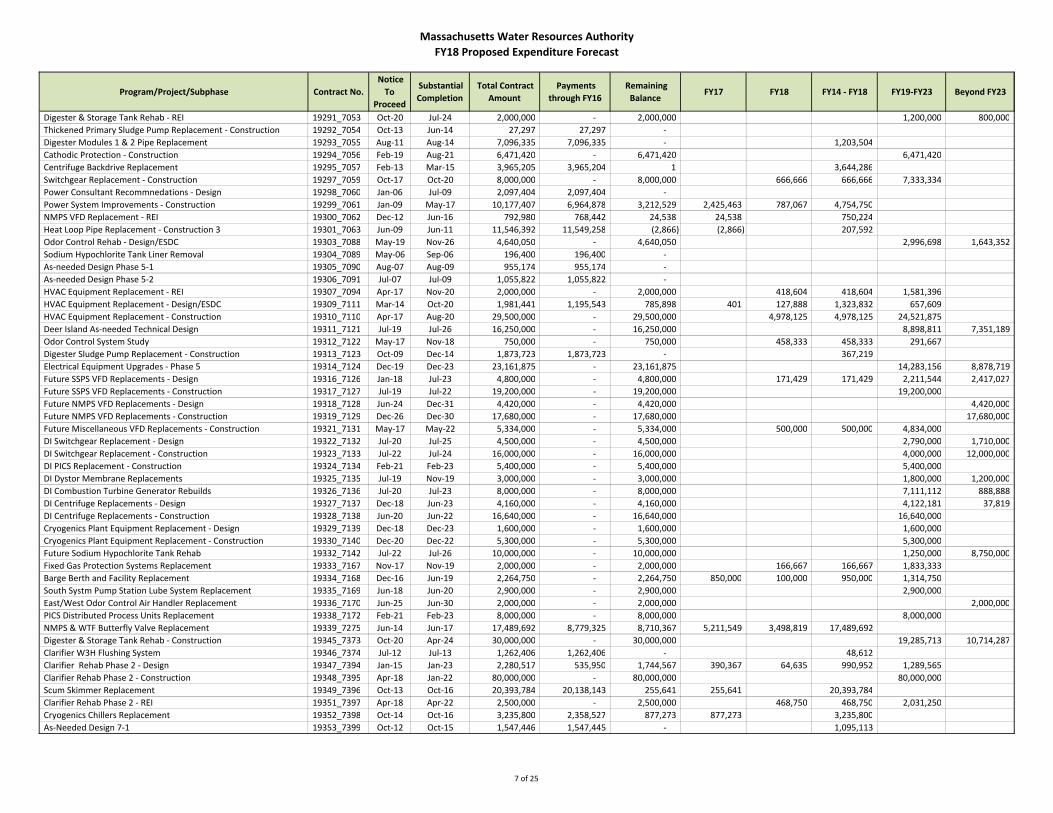
Digester & Storage Tank Rehab ‐ REI 19291_7053 Oct‐20 Jul‐24 2,000,000 ‐ 2,000,000 1,200,000 800,000
Thickened Primary Sludge Pump Replacement ‐ Construction 19292_7054 Oct‐13 Jun‐14 27,297 27,297 ‐
Digester Modules 1 & 2 Pipe Replacement 19293_7055 Aug‐11 Aug‐14 7,096,335 7,096,335 ‐ 1,203,504
Cathodic Protection ‐ Construction 19294_7056 Feb‐19 Aug‐21 6,471,420 ‐ 6,471,420 6,471,420
Centrifuge Backdrive Replacement 19295_7057 Feb‐13 Mar‐15 3,965,205 3,965,204 1 3,644,286
Switchgear Replacement ‐ Construction 19297_7059 Oct‐17 Oct‐20 8,000,000 ‐ 8,000,000 666,666 666,666 7,333,334
Power Consultant Recommnedations ‐ Design 19298_7060 Jan‐06 Jul‐09 2,097,404 2,097,404 ‐
Power System Improvements ‐ Construction 19299_7061 Jan‐09 May‐17 10,177,407 6,964,878 3,212,529 2,425,463 787,067 4,754,750
NMPS VFD Replacement ‐ REI 19300_7062 Dec‐12 Jun‐16 792,980 768,442 24,538 24,538 750,224
Heat Loop Pipe Replacement ‐ Construction 3 19301_7063 Jun‐09 Jun‐11 11,546,392 11,549,258 (2,866) (2,866) 207,592
Odor Control Rehab ‐ Design/ESDC 19303_7088 May‐19 Nov‐26 4,640,050 ‐ 4,640,050 2,996,698 1,643,352
Sodium Hypochlorite Tank Liner Removal 19304_7089 May‐06 Sep‐06 196,400 196,400 ‐
As‐needed Design Phase 5‐1 19305_7090 Aug‐07 Aug‐09 955,174 955,174 ‐
As‐needed Design Phase 5‐2 19306_7091 Jul‐07 Jul‐09 1,055,822 1,055,822 ‐
HVAC Equipment Replacement ‐ REI 19307_7094 Apr‐17 Nov‐20 2,000,000 ‐ 2,000,000 418,604 418,604 1,581,396
HVAC Equipment Replacement ‐ Design/ESDC 19309_7111 Mar‐14 Oct‐20 1,981,441 1,195,543 785,898 401 127,888 1,323,832 657,609
HVAC Equipment Replacement ‐ Construction 19310_7110 Apr‐17 Aug‐20 29,500,000 ‐ 29,500,000 4,978,125 4,978,125 24,521,875
Deer Island As‐needed Technical Design 19311_7121 Jul‐19 Jul‐26 16,250,000 ‐ 16,250,000 8,898,811 7,351,189
Odor Control System Study 19312_7122 May‐17 Nov‐18 750,000 ‐ 750,000 458,333 458,333 291,667
Digester Sludge Pump Replacement ‐ Construction 19313_7123 Oct‐09 Dec‐14 1,873,723 1,873,723 ‐ 367,219
Electrical Equipment Upgrades ‐ Phase 5 19314_7124 Dec‐19 Dec‐23 23,161,875 ‐ 23,161,875 14,283,156 8,878,719
Future SSPS VFD Replacements ‐ Design 19316_7126 Jan‐18 Jul‐23 4,800,000 ‐ 4,800,000 171,429 171,429 2,211,544 2,417,027
Future SSPS VFD Replacements ‐ Construction 19317_7127 Jul‐19 Jul‐22 19,200,000 ‐ 19,200,000 19,200,000
Future NMPS VFD Replacements ‐ Design 19318_7128 Jun‐24 Dec‐31 4,420,000 ‐ 4,420,000 4,420,000
Future NMPS VFD Replacements ‐ Construction 19319_7129 Dec‐26 Dec‐30 17,680,000 ‐ 17,680,000 17,680,000
Future Miscellaneous VFD Replacements ‐ Construction 19321_7131 May‐17 May‐22 5,334,000 ‐ 5,334,000 500,000 500,000 4,834,000
DI Switchgear Replacement ‐ Design 19322_7132 Jul‐20 Jul‐25 4,500,000 ‐ 4,500,000 2,790,000 1,710,000
DI Switchgear Replacement ‐ Construction 19323_7133 Jul‐22 Jul‐24 16,000,000 ‐ 16,000,000 4,000,000 12,000,000
DI PICS Replacement ‐ Construction 19324_7134 Feb‐21 Feb‐23 5,400,000 ‐ 5,400,000 5,400,000
DI Dystor Membrane Replacements 19325_7135 Jul‐19 Nov‐19 3,000,000 ‐ 3,000,000 1,800,000 1,200,000
DI Combustion Turbine Generator Rebuilds 19326_7136 Jul‐20 Jul‐23 8,000,000 ‐ 8,000,000 7,111,112 888,888
DI Centrifuge Replacements ‐ Design 19327_7137 Dec‐18 Jun‐23 4,160,000 ‐ 4,160,000 4,122,181 37,819
DI Centrifuge Replacements ‐ Construction 19328_7138 Jun‐20 Jun‐22 16,640,000 ‐ 16,640,000 16,640,000
Cryogenics Plant Equipment Replacement ‐ Design 19329_7139 Dec‐18 Dec‐23 1,600,000 ‐ 1,600,000 1,600,000
Cryogenics Plant Equipment Replacement ‐ Construction 19330_7140 Dec‐20 Dec‐22 5,300,000 ‐ 5,300,000 5,300,000
Future Sodium Hypochlorite Tank Rehab 19332_7142 Jul‐22 Jul‐26 10,000,000 ‐ 10,000,000 1,250,000 8,750,000
Fixed Gas Protection Systems Replacement 19333_7167 Nov‐17 Nov‐19 2,000,000 ‐ 2,000,000 166,667 166,667 1,833,333
Barge Berth and Facility Replacement 19334_7168 Dec‐16 Jun‐19 2,264,750 ‐ 2,264,750 850,000 100,000 950,000 1,314,750
South Systm Pump Station Lube System Replacement 19335_7169 Jun‐18 Jun‐20 2,900,000 ‐ 2,900,000 2,900,000
East/West Odor Control Air Handler Replacement 19336_7170 Jun‐25 Jun‐30 2,000,000 ‐ 2,000,000 2,000,000
PICS Distributed Process Units Replacement 19338_7172 Feb‐21 Feb‐23 8,000,000 ‐ 8,000,000 8,000,000
NMPS & WTF Butterfly Valve Replacement 19339_7275 Jun‐14 Jun‐17 17,489,692 8,779,325 8,710,367 5,211,549 3,498,819 17,489,692
Digester & Storage Tank Rehab ‐ Construction 19345_7373 Oct‐20 Apr‐24 30,000,000 ‐ 30,000,000 19,285,713 10,714,287
Clarifier W3H Flushing System 19346_7374 Jul‐12 Jul‐13 1,262,406 1,262,406 ‐ 48,612
Clarifier Rehab Phase 2 ‐ Design 19347_7394 Jan‐15 Jan‐23 2,280,517 535,950 1,744,567 390,367 64,635 990,952 1,289,565
Clarifier Rehab Phase 2 ‐ Construction 19348_7395 Apr‐18 Jan‐22 80,000,000 ‐ 80,000,000 80,000,000
Scum Skimmer Replacement 19349_7396 Oct‐13 Oct‐16 20,393,784 20,138,143 255,641 255,641 20,393,784
Clarifier Rehab Phase 2 ‐ REI 19351_7397 Apr‐18 Apr‐22 2,500,000 ‐ 2,500,000 468,750 468,750 2,031,250
Cryogenics Chillers Replacement 19352_7398 Oct‐14 Oct‐16 3,235,800 2,358,527 877,273 877,273 3,235,800
As‐Needed Design 7‐1 19353_7399 Oct‐12 Oct‐15 1,547,446 1,547,445 ‐ 1,095,113
7 of 25

Massachusetts Water Resources Authority
FY18 Proposed Expenditure Forecast
Program/Project/Subphase Contract No.
Notice
To
Proceed
Substantial
Completion
Total Contract
Amount
Payments
through FY16
Remaining
Balance FY17 FY18 FY14 ‐ FY18 FY19‐FY23 Beyond FY23
As‐Needed Design 7‐2 19354_7400 Oct‐12 Apr‐16 1,060,919 1,060,919 ‐ 764,426
Thermal Power Plant Boiler Controls Replacement 19355_7401 Nov‐14 Nov‐16 1,628,631 1,628,631 ‐ 1,628,631
NMPS Harmonic Filter Replacement 19557_7414 May‐18 May‐20 3,000,000 ‐ 3,000,000 3,000,000
Fuel Pipe Abandonment 19558_7415 Aug‐12 Jan‐13 230,000 230,000 ‐
Electrical Equipment Upgrades 4 ‐ REI 19559_7416 May‐14 Oct‐16 764,918 671,834 93,084 93,084 764,918
NMPS Motor Control Center Phase 2 ‐ Dsesign/ESDC/REI 19560_7419 Feb‐17 Jan‐23 2,500,000 ‐ 2,500,000 50,000 600,000 650,000 1,850,000
NMPS Motor Control Center Phase 2 ‐ Construction 19561_7420 Apr‐19 Jan‐22 10,585,725 ‐ 10,585,725 10,585,725
Roof Replacement Phase 3 19562_7424 Sep‐13 Jul‐14 610,500 610,500 ‐ 610,500
Fire System Replacement ‐ REI 19563_7426 Jul‐18 Apr‐22 1,800,000 ‐ 1,800,000 1,800,000
Gravity Thickener Center Column Replacement 19564_7427 Jan‐13 Jan‐14 825,457 825,457 ‐ 537,657
Gravity Thickener Rehabilitation 19565_7428 Apr‐18 Apr‐21 14,500,000 ‐ 14,500,000 14,500,000
As‐Needed Design 7‐3 19566_7434 Oct‐12 Apr‐16 895,799 885,637 10,162 10,162 841,007
As‐Needed Design 8‐1 19600_7501 Jul‐16 Jul‐19 1,400,000 ‐ 1,400,000 249,999 466,667 716,666 683,334
As‐Needed Design 8‐2 19601_7502 Jul‐16 Jul‐19 1,400,000 ‐ 1,400,000 392,999 323,667 716,666 683,334
As‐Needed Design 8‐3 19602_7503 Jul‐16 Jul‐19 1,400,000 ‐ 1,400,000 299,999 416,667 716,666 683,334
Co‐Digestion Temporary Facilities 26073_7148 Sep‐13 Sep‐22 2,300,000 433,832 1,866,168 433,832 1,866,168
Sodium Hypochlorite & Bisulfite Tanks Rehab. 40256_7449 Jun‐17 Jun‐19 5,000,000 ‐ 5,000,000 2,000,000 2,000,000 3,000,000
210 Clinton Wastewater Treatment Plant 22,419,257 7,629,442 14,789,815 6,444,989 1,920,608 13,469,319 5,827,248 596,971
Clinton Soda Ash Replacement 19302_7075 Nov‐07 Aug‐08 267,221 267,221 ‐
Clinton Permanent Standby Generator 19308_7095 Feb‐07 Nov‐07 230,440 230,440 ‐
Clinton Concrete Repair ‐ Design 19340_7276 Feb‐13 Dec‐13 62,615 62,615 ‐
Clinton Digester Cleaning & Rehab 19341_7277 May‐10 Apr‐17 3,441,094 3,417,382 23,712 23,712 3,352,494
Clinton Aeration Effciency Improvement 19342_7278 Apr‐12 Feb‐13 1,864,562 1,864,561 ‐ (12,283)
Valves & Screw Pumps Replacement 19344_7372 Sep‐17 Dec‐18 1,500,000 ‐ 1,500,000 400,000 400,000 1,100,000
Phosphorus Reduction ‐ Design/ESDC 19350_7377 Nov‐13 Sep‐18 1,395,284 508,956 886,329 301,909 117,000 927,865 467,420
Phosphorus Reduction ‐ Construction 19400_7411 Mar‐16 Sep‐17 7,476,256 882,505 6,593,751 5,797,375 796,376 7,476,256
Clinton Roofing Rehab 19405_7450 Mar‐17 Nov‐18 1,214,462 ‐ 1,214,462 227,712 607,232 834,944 379,519
Clinton Facilities Rehab 19406_7451 Sep‐18 Sep‐23 4,477,280 ‐ 4,477,280 3,880,309 596,971
NGRID Gas Line 19407_7528 Apr‐16 Jun‐16 490,043 395,762 94,281 94,281 490,043
211 Laboratory Services completed project 2,227,674 2,227,674 ‐
8 of 25
Massachusetts Water Resources Authority
FY18 Proposed Expenditure Forecast
Program/Project/Subphase Contract No.
Notice
To
Proceed
Substantial
Completion
Total Contract
Amount
Payments
through FY16
Remaining
Balance FY17 FY18 FY14 ‐ FY18 FY19‐FY23 Beyond FY23
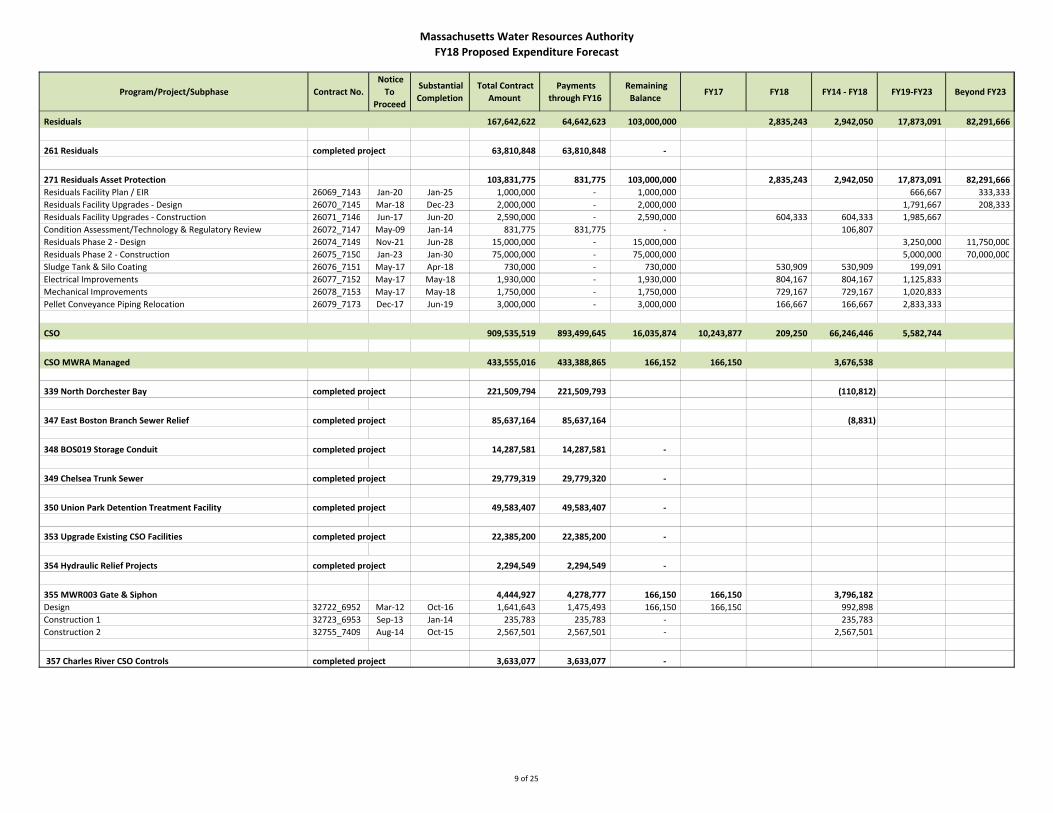
Residuals 167,642,622 64,642,623 103,000,000 2,835,243 2,942,050 17,873,091 82,291,666
261 Residuals completed project 63,810,848 63,810,848 ‐
271 Residuals Asset Protection 103,831,775 831,775 103,000,000 2,835,243 2,942,050 17,873,091 82,291,666
Residuals Facility Plan / EIR 26069_7143 Jan‐20 Jan‐25 1,000,000 ‐ 1,000,000 666,667 333,333
Residuals Facility Upgrades ‐ Design 26070_7145 Mar‐18 Dec‐23 2,000,000 ‐ 2,000,000 1,791,667 208,333
Residuals Facility Upgrades ‐ Construction 26071_7146 Jun‐17 Jun‐20 2,590,000 ‐ 2,590,000 604,333 604,333 1,985,667
Condition Assessment/Technology & Regulatory Review 26072_7147 May‐09 Jan‐14 831,775 831,775 ‐ 106,807
Residuals Phase 2 ‐ Design 26074_7149 Nov‐21 Jun‐28 15,000,000 ‐ 15,000,000 3,250,000 11,750,000
Residuals Phase 2 ‐ Construction 26075_7150 Jan‐23 Jan‐30 75,000,000 ‐ 75,000,000 5,000,000 70,000,000
Sludge Tank & Silo Coating 26076_7151 May‐17 Apr‐18 730,000 ‐ 730,000 530,909 530,909 199,091
Electrical Improvements 26077_7152 May‐17 May‐18 1,930,000 ‐ 1,930,000 804,167 804,167 1,125,833
Mechanical Improvements 26078_7153 May‐17 May‐18 1,750,000 ‐ 1,750,000 729,167 729,167 1,020,833
Pellet Conveyance Piping Relocation 26079_7173 Dec‐17 Jun‐19 3,000,000 ‐ 3,000,000 166,667 166,667 2,833,333
CSO 909,535,519 893,499,645 16,035,874 10,243,877 209,250 66,246,446 5,582,744
CSO MWRA Managed 433,555,016 433,388,865 166,152 166,150 3,676,538
339 North Dorchester Bay completed project 221,509,794 221,509,793 (110,812)
347 East Boston Branch Sewer Relief completed project 85,637,164 85,637,164 (8,831)
348 BOS019 Storage Conduit completed project 14,287,581 14,287,581 ‐
349 Chelsea Trunk Sewer completed project 29,779,319 29,779,320 ‐
350 Union Park Detention Treatment Facility completed project 49,583,407 49,583,407 ‐
353 Upgrade Existing CSO Facilities completed project 22,385,200 22,385,200 ‐
354 Hydraulic Relief Projects completed project 2,294,549 2,294,549 ‐
355 MWR003 Gate & Siphon 4,444,927 4,278,777 166,150 166,150 3,796,182
Design 32722_6952 Mar‐12 Oct‐16 1,641,643 1,475,493 166,150 166,150 992,898
Construction 1 32723_6953 Sep‐13 Jan‐14 235,783 235,783 ‐ 235,783
Construction 2 32755_7409 Aug‐14 Oct‐15 2,567,501 2,567,501 ‐ 2,567,501
357 Charles River CSO Controls completed project 3,633,077 3,633,077 ‐
9 of 25
Massachusetts Water Resources Authority
FY18 Proposed Expenditure Forecast
Program/Project/Subphase Contract No.
Notice
To
Proceed
Substantial
Completion
Total Contract
Amount
Payments
through FY16
Remaining
Balance FY17 FY18 FY14 ‐ FY18 FY19‐FY23 Beyond FY23
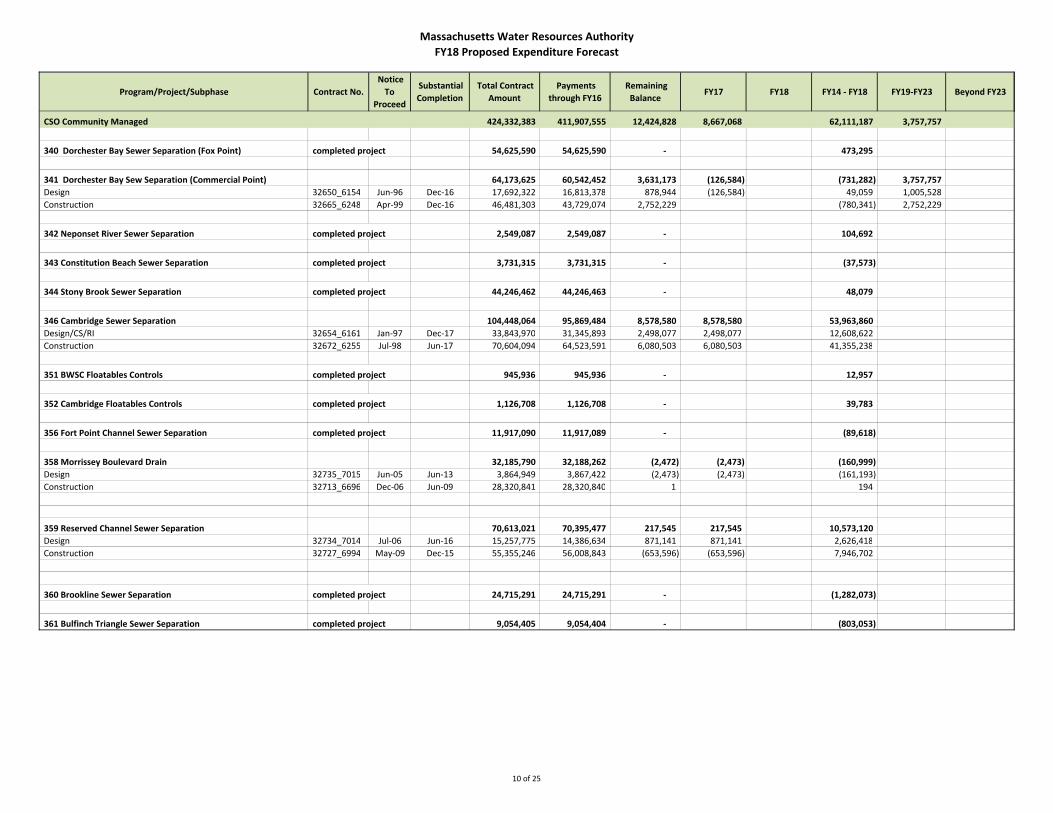
CSO Community Managed 424,332,383 411,907,555 12,424,828 8,667,068 62,111,187 3,757,757
340 Dorchester Bay Sewer Separation (Fox Point) completed project 54,625,590 54,625,590 ‐ 473,295
341 Dorchester Bay Sew Separation (Commercial Point) 64,173,625 60,542,452 3,631,173 (126,584) (731,282) 3,757,757
Design 32650_6154 Jun‐96 Dec‐16 17,692,322 16,813,378 878,944 (126,584) 49,059 1,005,528
Construction 32665_6248 Apr‐99 Dec‐16 46,481,303 43,729,074 2,752,229 (780,341) 2,752,229
342 Neponset River Sewer Separation completed project 2,549,087 2,549,087 ‐ 104,692
343 Constitution Beach Sewer Separation completed project 3,731,315 3,731,315 ‐ (37,573)
344 Stony Brook Sewer Separation completed project 44,246,462 44,246,463 ‐ 48,079
346 Cambridge Sewer Separation 104,448,064 95,869,484 8,578,580 8,578,580 53,963,860
Design/CS/RI 32654_6161 Jan‐97 Dec‐17 33,843,970 31,345,893 2,498,077 2,498,077 12,608,622
Construction 32672_6255 Jul‐98 Jun‐17 70,604,094 64,523,591 6,080,503 6,080,503 41,355,238
351 BWSC Floatables Controls completed project 945,936 945,936 ‐ 12,957
352 Cambridge Floatables Controls completed project 1,126,708 1,126,708 ‐ 39,783
356 Fort Point Channel Sewer Separation completed project 11,917,090 11,917,089 ‐ (89,618)
358 Morrissey Boulevard Drain 32,185,790 32,188,262 (2,472) (2,473) (160,999)
Design 32735_7015 Jun‐05 Jun‐13 3,864,949 3,867,422 (2,473) (2,473) (161,193)
Construction 32713_6696 Dec‐06 Jun‐09 28,320,841 28,320,840 1 194
359 Reserved Channel Sewer Separation 70,613,021 70,395,477 217,545 217,545 10,573,120
Design 32734_7014 Jul‐06 Jun‐16 15,257,775 14,386,634 871,141 871,141 2,626,418
Construction 32727_6994 May‐09 Dec‐15 55,355,246 56,008,843 (653,596) (653,596) 7,946,702
360 Brookline Sewer Separation completed project 24,715,291 24,715,291 ‐ (1,282,073)
361 Bulfinch Triangle Sewer Separation completed project 9,054,405 9,054,404 ‐ (803,053)
10 of 25

Massachusetts Water Resources Authority
FY18 Proposed Expenditure Forecast
Program/Project/Subphase Contract No.
Notice
To
Proceed
Substantial
Completion
Total Contract
Amount
Payments
through FY16
Remaining
Balance FY17 FY18 FY14 ‐ FY18 FY19‐FY23 Beyond FY23
324 CSO Support 51,648,120 48,203,225 3,444,896 1,410,659 209,250 458,721 1,824,987
Technical Assistance 32400_5790 Feb‐94 Dec‐95 228,320 228,320 ‐
Planning/EIR 32401_5791 Mar‐88 Sep‐90 10,768,610 10,768,610 ‐
Master Planning 32403_5716 Mar‐92 Sep‐04 21,762,805 21,762,805 ‐
Technical Assistance ‐ Geotech 32407_5970 Jun‐90 Jun‐92 61,110 61,110 ‐
Modeling 32409_5795 May‐92 Mar‐95 299,840 299,840 ‐
SOP Program 32411_5767 Jan‐94 May‐01 772,828 772,829 ‐ (1,183,721)
Watershed Planning 32645_6036 Dec‐94 Apr‐01 877,134 877,134 ‐
Technical Review 32648_6150 Jul‐96 Dec‐20 1,933,448 528,932 1,404,516 100,000 100,000 1,304,516
Land Acquisition/Easement 32658_6169 Jul‐96 Sep‐21 12,875,388 12,835,008 40,380 10,659 9,250 42,442 20,471
System Assessment 32691_6372 May‐97 Dec‐20 668,637 68,637 600,000 100,000 100,000 500,000
Somerville Marginal In‐System Storage 32748_7539 Nov‐16 Jun‐18 1,400,000 ‐ 1,400,000 1,400,000 1,400,000
Other Wastewater 242,865,861 163,671,801 79,194,061 18,837,640 19,047,325 73,061,085 52,180,196 (10,871,098)
128 I/I Local Financial Assistance 242,584,985 163,390,925 79,194,061 18,837,640 19,047,325 73,061,085 52,180,196 (10,871,098)
Phase II ‐ Grants 10273_6084 May‐93 May‐06 15,928,524 15,928,524 ‐
Phase II ‐ Loans 10274_6085 May‐93 May‐06 47,664,000 47,664,000 ‐
Phase II ‐ Repayments 10282_6170 May‐94 May‐11 (47,664,000) (47,664,000) ‐
Public Participation 10348_6609 Feb‐99 Jun‐02 6,461 6,461 ‐
Phase IV ‐ Grants 10368_6736 Nov‐99 May‐10 34,650,000 34,650,000 ‐
Phase IV ‐ Loans 10369_6737 Nov‐99 May‐10 42,350,000 42,350,000 ‐
Phase IV ‐ Repayments 10370_6738 Nov‐00 May‐15 (42,350,000) (42,350,000) ‐ (587,977)
Phase V ‐ Grants 10407_6925 Aug‐04 May‐12 18,000,000 18,000,000 ‐
Phase V ‐ Loans 10408_6926 Aug‐04 May‐12 22,000,000 22,000,000 ‐
Phase V ‐ Repayments 10409_6927 Aug‐05 May‐17 (22,000,000) (21,619,242) (380,758) (380,758) (3,143,568)
Phase Vl ‐ Grants 10441_7107 Nov‐06 Jun‐21 18,000,000 17,194,117 805,883 180,000 625,884 3,436,468
Phase Vl ‐ Loans 10442_7108 Nov‐06 Jun‐21 22,000,000 21,015,031 984,969 220,000 764,969 4,200,127
Phase Vl ‐ Repayments 10443_7109 Nov‐07 Jun‐26 (22,000,000) (16,649,946) (5,350,054) (1,711,403) (1,375,913) (10,680,171) (2,262,738)
Phase VII ‐ Grants 10471_7293 Aug‐09 Jun‐21 18,000,000 15,573,817 2,426,183 1,800,000 626,183 6,242,288
Phase VII ‐ Loans 10472_7294 Aug‐09 Jun‐21 22,000,000 19,034,667 2,965,333 2,200,000 765,333 7,629,462
Phase VII ‐ Repayments 10473_7295 Aug‐10 Jun‐26 (22,000,000) (11,967,282) (10,032,718) (2,977,493) (2,683,586) (14,784,676) (4,371,638)
Phase VIII ‐ Grants 10474_7296 Aug‐12 Jun‐21 18,000,000 12,675,543 5,324,457 2,137,950 2,479,951 13,105,126 706,556
Phase VIII ‐ Loans 10475_7297 Aug‐12 Jun‐21 22,000,000 15,492,331 6,507,669 2,613,050 3,031,050 16,017,375 863,569
Phase VIII ‐ Repayments 10476_7298 Aug‐13 Jun‐26 (22,000,000) (5,967,135) (16,032,865) (3,077,162) (3,012,162) (12,056,460) (9,150,919) (792,621)
Phase IX Grants 10560_7464 Jul‐14 Jun‐21 60,000,000 15,548,925 44,451,075 11,250,000 11,250,000 38,048,925 21,951,075
Phase IX Loans 10561_7465 Jul‐14 Jun‐21 20,000,000 5,182,975 14,817,025 3,750,000 3,750,000 12,682,975 7,317,025
Phase IX Repayments 10562_7466 Jul‐15 Jun‐31 (20,000,000) (543,098) (19,456,903) (560,286) (982,751) (2,086,134) (8,570,234) (9,343,632)
Phase X Grants 10563_7467 Jul‐16 Jun‐25 60,000,000 5,932,650 54,067,350 2,688,025 3,000,000 11,620,675 37,500,000 10,879,325
Phase X Loans 10564_7468 Jul‐16 Jun‐25 20,000,000 1,977,550 18,022,450 896,008 1,000,000 3,873,558 12,500,000 3,626,442
Phase X Repayments 10565_7469 Jul‐16 Jun‐35 (20,000,000) (75,000) (19,925,000) (190,255) (191,633) (456,888) (4,302,500) (15,240,612)
138 Sewerage System Mapping Upgrades completed project 280,876 280,876 ‐
11 of 25
Massachusetts Water Resources Authority
FY18 Proposed Expenditure Forecast
Program/Project/Subphase Contract No.
Notice
To
Proceed
Substantial
Completion
Total Contract
Amount
Payments
through FY16
Remaining
Balance FY17 FY18 FY14 ‐ FY18 FY19‐FY23 Beyond FY23
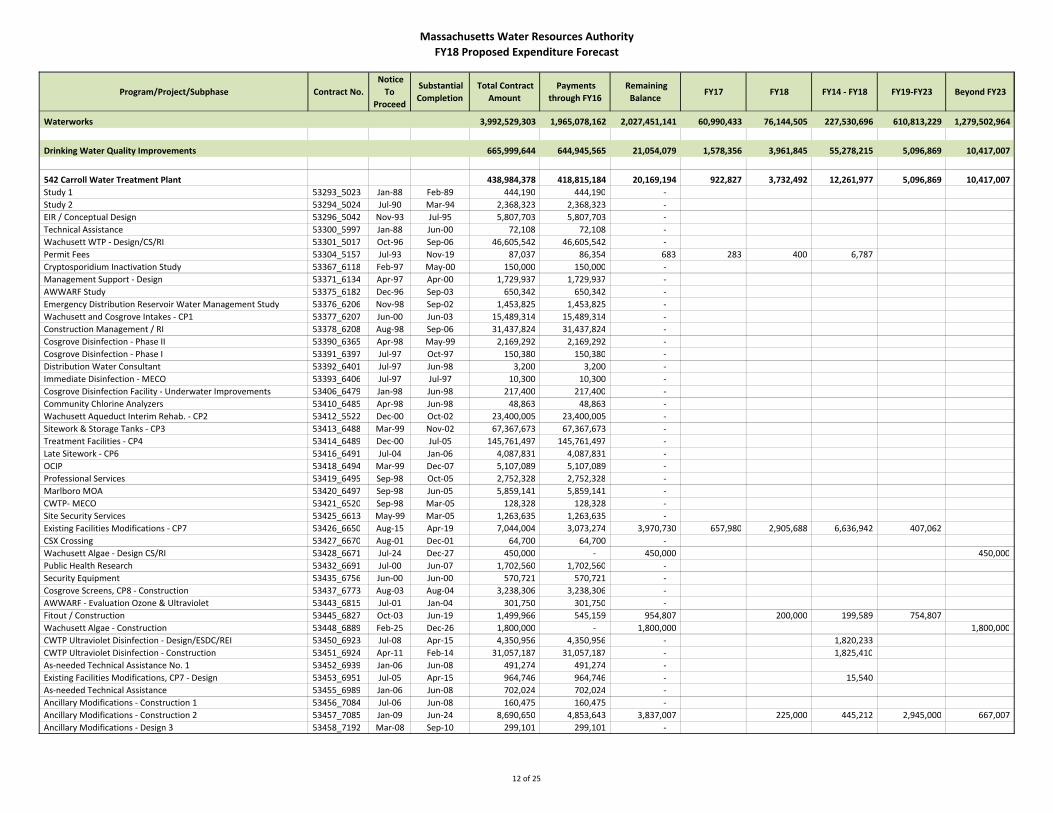
Waterworks 3,992,529,303 1,965,078,162 2,027,451,141 60,990,433 76,144,505 227,530,696 610,813,229 1,279,502,964
Drinking Water Quality Improvements 665,999,644 644,945,565 21,054,079 1,578,356 3,961,845 55,278,215 5,096,869 10,417,007
542 Carroll Water Treatment Plant 438,984,378 418,815,184 20,169,194 922,827 3,732,492 12,261,977 5,096,869 10,417,007
Study 1 53293_5023 Jan‐88 Feb‐89 444,190 444,190 ‐
Study 2 53294_5024 Jul‐90 Mar‐94 2,368,323 2,368,323 ‐
EIR / Conceptual Design 53296_5042 Nov‐93 Jul‐95 5,807,703 5,807,703 ‐
Technical Assistance 53300_5997 Jan‐88 Jun‐00 72,108 72,108 ‐
Wachusett WTP ‐ Design/CS/RI 53301_5017 Oct‐96 Sep‐06 46,605,542 46,605,542 ‐
Permit Fees 53304_5157 Jul‐93 Nov‐19 87,037 86,354 683 283 400 6,787
Cryptosporidium Inactivation Study 53367_6118 Feb‐97 May‐00 150,000 150,000 ‐
Management Support ‐ Design 53371_6134 Apr‐97 Apr‐00 1,729,937 1,729,937 ‐
AWWARF Study 53375_6182 Dec‐96 Sep‐03 650,342 650,342 ‐
Emergency Distribution Reservoir Water Management Study 53376_6206 Nov‐98 Sep‐02 1,453,825 1,453,825 ‐
Wachusett and Cosgrove Intakes ‐ CP1 53377_6207 Jun‐00 Jun‐03 15,489,314 15,489,314 ‐
Construction Management / RI 53378_6208 Aug‐98 Sep‐06 31,437,824 31,437,824 ‐
Cosgrove Disinfection ‐ Phase II 53390_6365 Apr‐98 May‐99 2,169,292 2,169,292 ‐
Cosgrove Disinfection ‐ Phase I 53391_6397 Jul‐97 Oct‐97 150,380 150,380 ‐
Distribution Water Consultant 53392_6401 Jul‐97 Jun‐98 3,200 3,200 ‐
Immediate Disinfection ‐ MECO 53393_6406 Jul‐97 Jul‐97 10,300 10,300 ‐
Cosgrove Disinfection Facility ‐ Underwater Improvements 53406_6479 Jan‐98 Jun‐98 217,400 217,400 ‐
Community Chlorine Analyzers 53410_6485 Apr‐98 Jun‐98 48,863 48,863 ‐
Wachusett Aqueduct Interim Rehab. ‐ CP2 53412_5522 Dec‐00 Oct‐02 23,400,005 23,400,005 ‐
Sitework & Storage Tanks ‐ CP3 53413_6488 Mar‐99 Nov‐02 67,367,673 67,367,673 ‐
Treatment Facilities ‐ CP4 53414_6489 Dec‐00 Jul‐05 145,761,497 145,761,497 ‐
Late Sitework ‐ CP6 53416_6491 Jul‐04 Jan‐06 4,087,831 4,087,831 ‐
OCIP 53418_6494 Mar‐99 Dec‐07 5,107,089 5,107,089 ‐
Professional Services 53419_6495 Sep‐98 Oct‐05 2,752,328 2,752,328 ‐
Marlboro MOA 53420_6497 Sep‐98 Jun‐05 5,859,141 5,859,141 ‐
CWTP‐ MECO 53421_6520 Sep‐98 Mar‐05 128,328 128,328 ‐
Site Security Services 53425_6613 May‐99 Mar‐05 1,263,635 1,263,635 ‐
Existing Facilities Modifications ‐ CP7 53426_6650 Aug‐15 Apr‐19 7,044,004 3,073,274 3,970,730 657,980 2,905,688 6,636,942 407,062
CSX Crossing 53427_6670 Aug‐01 Dec‐01 64,700 64,700 ‐
Wachusett Algae ‐ Design CS/RI 53428_6671 Jul‐24 Dec‐27 450,000 ‐ 450,000 450,000
Public Health Research 53432_6691 Jul‐00 Jun‐07 1,702,560 1,702,560 ‐
Security Equipment 53435_6756 Jun‐00 Jun‐00 570,721 570,721 ‐
Cosgrove Screens, CP8 ‐ Construction 53437_6773 Aug‐03 Aug‐04 3,238,306 3,238,306 ‐
AWWARF ‐ Evaluation Ozone & Ultraviolet 53443_6815 Jul‐01 Jan‐04 301,750 301,750 ‐
Fitout / Construction 53445_6827 Oct‐03 Jun‐19 1,499,966 545,159 954,807 200,000 199,589 754,807
Wachusett Algae ‐ Construction 53448_6889 Feb‐25 Dec‐26 1,800,000 ‐ 1,800,000 1,800,000
CWTP Ultraviolet Disinfection ‐ Design/ESDC/REI 53450_6923 Jul‐08 Apr‐15 4,350,956 4,350,956 ‐ 1,820,233
CWTP Ultraviolet Disinfection ‐ Construction 53451_6924 Apr‐11 Feb‐14 31,057,187 31,057,187 ‐ 1,825,410
As‐needed Technical Assistance No. 1 53452_6939 Jan‐06 Jun‐08 491,274 491,274 ‐
Existing Facilities Modifications, CP7 ‐ Design 53453_6951 Jul‐05 Apr‐15 964,746 964,746 ‐ 15,540
As‐needed Technical Assistance 53455_6989 Jan‐06 Jun‐08 702,024 702,024 ‐
Ancillary Modifications ‐ Construction 1 53456_7084 Jul‐06 Jun‐08 160,475 160,475 ‐
Ancillary Modifications ‐ Construction 2 53457_7085 Jan‐09 Jun‐24 8,690,650 4,853,643 3,837,007 225,000 445,212 2,945,000 667,007
Ancillary Modifications ‐ Design 3 53458_7192 Mar‐08 Sep‐10 299,101 299,101 ‐
12 of 25
Massachusetts Water Resources Authority
FY18 Proposed Expenditure Forecast
Program/Project/Subphase Contract No.
Notice
To
Proceed
Substantial
Completion
Total Contract
Amount
Payments
through FY16
Remaining
Balance FY17 FY18 FY14 ‐ FY18 FY19‐FY23 Beyond FY23
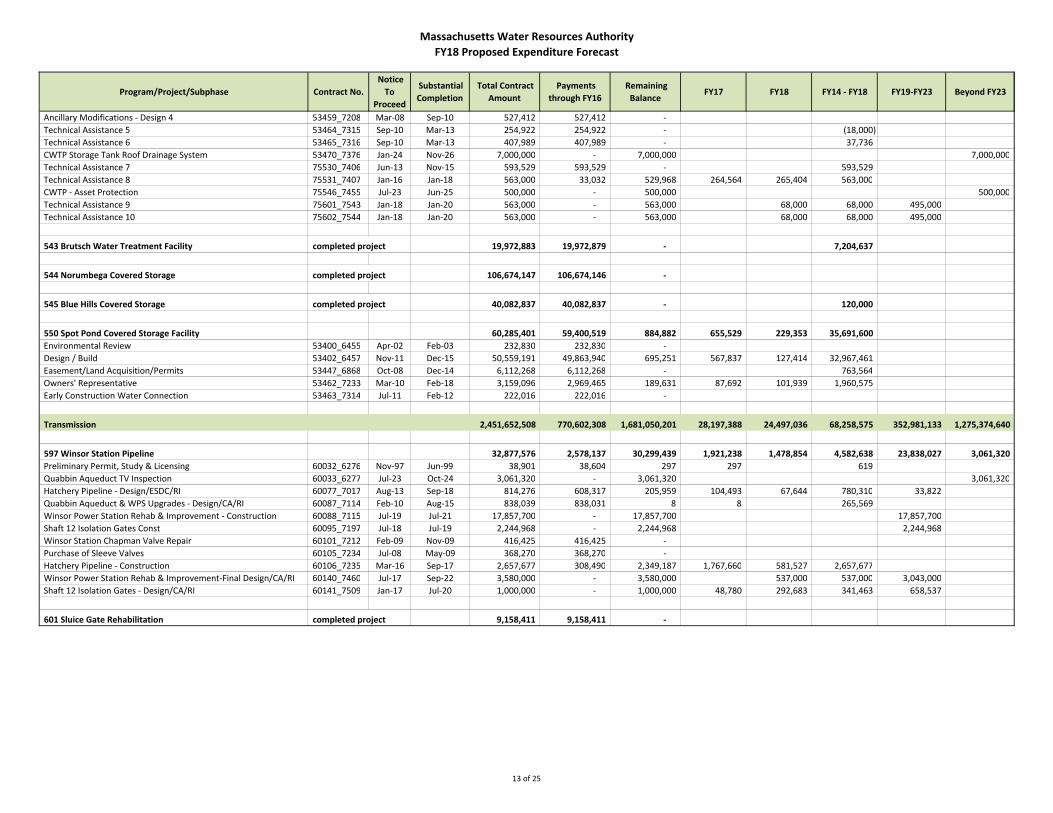
Ancillary Modifications ‐ Design 4 53459_7208 Mar‐08 Sep‐10 527,412 527,412 ‐
Technical Assistance 5 53464_7315 Sep‐10 Mar‐13 254,922 254,922 ‐ (18,000)
Technical Assistance 6 53465_7316 Sep‐10 Mar‐13 407,989 407,989 ‐ 37,736
CWTP Storage Tank Roof Drainage System 53470_7376 Jan‐24 Nov‐26 7,000,000 ‐ 7,000,000 7,000,000
Technical Assistance 7 75530_7406 Jun‐13 Nov‐15 593,529 593,529 ‐ 593,529
Technical Assistance 8 75531_7407 Jan‐16 Jan‐18 563,000 33,032 529,968 264,564 265,404 563,000
CWTP ‐ Asset Protection 75546_7455 Jul‐23 Jun‐25 500,000 ‐ 500,000 500,000
Technical Assistance 9 75601_7543 Jan‐18 Jan‐20 563,000 ‐ 563,000 68,000 68,000 495,000
Technical Assistance 10 75602_7544 Jan‐18 Jan‐20 563,000 ‐ 563,000 68,000 68,000 495,000
543 Brutsch Water Treatment Facility completed project 19,972,883 19,972,879 ‐ 7,204,637
544 Norumbega Covered Storage completed project 106,674,147 106,674,146 ‐
545 Blue Hills Covered Storage completed project 40,082,837 40,082,837 ‐ 120,000
550 Spot Pond Covered Storage Facility 60,285,401 59,400,519 884,882 655,529 229,353 35,691,600
Environmental Review 53400_6455 Apr‐02 Feb‐03 232,830 232,830 ‐
Design / Build 53402_6457 Nov‐11 Dec‐15 50,559,191 49,863,940 695,251 567,837 127,414 32,967,461
Easement/Land Acquisition/Permits 53447_6868 Oct‐08 Dec‐14 6,112,268 6,112,268 ‐ 763,564
Owners' Representative 53462_7233 Mar‐10 Feb‐18 3,159,096 2,969,465 189,631 87,692 101,939 1,960,575
Early Construction Water Connection 53463_7314 Jul‐11 Feb‐12 222,016 222,016 ‐
Transmission 2,451,652,508 770,602,308 1,681,050,201 28,197,388 24,497,036 68,258,575 352,981,133 1,275,374,640
597 Winsor Station Pipeline 32,877,576 2,578,137 30,299,439 1,921,238 1,478,854 4,582,638 23,838,027 3,061,320
Preliminary Permit, Study & Licensing 60032_6276 Nov‐97 Jun‐99 38,901 38,604 297 297 619
Quabbin Aqueduct TV Inspection 60033_6277 Jul‐23 Oct‐24 3,061,320 ‐ 3,061,320 3,061,320
Hatchery Pipeline ‐ Design/ESDC/RI 60077_7017 Aug‐13 Sep‐18 814,276 608,317 205,959 104,493 67,644 780,310 33,822
Quabbin Aqueduct & WPS Upgrades ‐ Design/CA/RI 60087_7114 Feb‐10 Aug‐15 838,039 838,031 8 8 265,569
Winsor Power Station Rehab & Improvement ‐ Construction 60088_7115 Jul‐19 Jul‐21 17,857,700 ‐ 17,857,700 17,857,700
Shaft 12 Isolation Gates Const 60095_7197 Jul‐18 Jul‐19 2,244,968 ‐ 2,244,968 2,244,968
Winsor Station Chapman Valve Repair 60101_7212 Feb‐09 Nov‐09 416,425 416,425 ‐
Purchase of Sleeve Valves 60105_7234 Jul‐08 May‐09 368,270 368,270 ‐
Hatchery Pipeline ‐ Construction 60106_7235 Mar‐16 Sep‐17 2,657,677 308,490 2,349,187 1,767,660 581,527 2,657,677
Winsor Power Station Rehab & Improvement‐Final Design/CA/RI 60140_7460 Jul‐17 Sep‐22 3,580,000 ‐ 3,580,000 537,000 537,000 3,043,000
Shaft 12 Isolation Gates ‐ Design/CA/RI 60141_7509 Jan‐17 Jul‐20 1,000,000 ‐ 1,000,000 48,780 292,683 341,463 658,537
601 Sluice Gate Rehabilitation completed project 9,158,411 9,158,411 ‐
13 of 25
Massachusetts Water Resources Authority
FY18 Proposed Expenditure Forecast
Program/Project/Subphase Contract No.
Notice
To
Proceed
Substantial
Completion
Total Contract
Amount
Payments
through FY16
Remaining
Balance FY17 FY18 FY14 ‐ FY18 FY19‐FY23 Beyond FY23
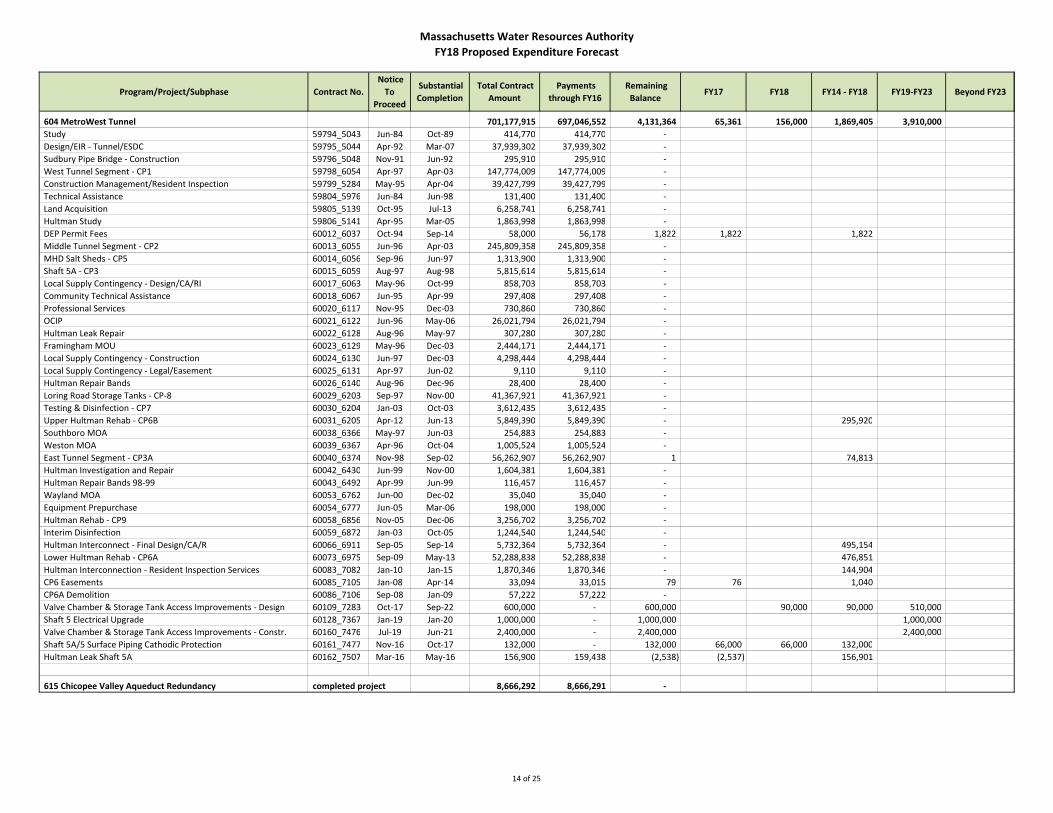
604 MetroWest Tunnel 701,177,915 697,046,552 4,131,364 65,361 156,000 1,869,405 3,910,000
Study 59794_5043 Jun‐84 Oct‐89 414,770 414,770 ‐
Design/EIR ‐ Tunnel/ESDC 59795_5044 Apr‐92 Mar‐07 37,939,302 37,939,302 ‐
Sudbury Pipe Bridge ‐ Construction 59796_5048 Nov‐91 Jun‐92 295,910 295,910 ‐
West Tunnel Segment ‐ CP1 59798_6054 Apr‐97 Apr‐03 147,774,009 147,774,009 ‐
Construction Management/Resident Inspection 59799_5284 May‐95 Apr‐04 39,427,799 39,427,799 ‐
Technical Assistance 59804_5976 Jun‐84 Jun‐98 131,400 131,400 ‐
Land Acquisition 59805_5139 Oct‐95 Jul‐13 6,258,741 6,258,741 ‐
Hultman Study 59806_5141 Apr‐95 Mar‐05 1,863,998 1,863,998 ‐
DEP Permit Fees 60012_6037 Oct‐94 Sep‐14 58,000 56,178 1,822 1,822 1,822
Middle Tunnel Segment ‐ CP2 60013_6055 Jun‐96 Apr‐03 245,809,358 245,809,358 ‐
MHD Salt Sheds ‐ CP5 60014_6056 Sep‐96 Jun‐97 1,313,900 1,313,900 ‐
Shaft 5A ‐ CP3 60015_6059 Aug‐97 Aug‐98 5,815,614 5,815,614 ‐
Local Supply Contingency ‐ Design/CA/RI 60017_6063 May‐96 Oct‐99 858,703 858,703 ‐
Community Technical Assistance 60018_6067 Jun‐95 Apr‐99 297,408 297,408 ‐
Professional Services 60020_6117 Nov‐95 Dec‐03 730,860 730,860 ‐
OCIP 60021_6122 Jun‐96 May‐06 26,021,794 26,021,794 ‐
Hultman Leak Repair 60022_6128 Aug‐96 May‐97 307,280 307,280 ‐
Framingham MOU 60023_6129 May‐96 Dec‐03 2,444,171 2,444,171 ‐
Local Supply Contingency ‐ Construction 60024_6130 Jun‐97 Dec‐03 4,298,444 4,298,444 ‐
Local Supply Contingency ‐ Legal/Easement 60025_6131 Apr‐97 Jun‐02 9,110 9,110 ‐
Hultman Repair Bands 60026_6140 Aug‐96 Dec‐96 28,400 28,400 ‐
Loring Road Storage Tanks ‐ CP‐8 60029_6203 Sep‐97 Nov‐00 41,367,921 41,367,921 ‐
Testing & Disinfection ‐ CP7 60030_6204 Jan‐03 Oct‐03 3,612,435 3,612,435 ‐
Upper Hultman Rehab ‐ CP6B 60031_6205 Apr‐12 Jun‐13 5,849,390 5,849,390 ‐ 295,920
Southboro MOA 60038_6366 May‐97 Jun‐03 254,883 254,883 ‐
Weston MOA 60039_6367 Apr‐96 Oct‐04 1,005,524 1,005,524 ‐
East Tunnel Segment ‐ CP3A 60040_6374 Nov‐98 Sep‐02 56,262,907 56,262,907 1 74,813
Hultman Investigation and Repair 60042_6430 Jun‐99 Nov‐00 1,604,381 1,604,381 ‐
Hultman Repair Bands 98‐99 60043_6492 Apr‐99 Jun‐99 116,457 116,457 ‐
Wayland MOA 60053_6762 Jun‐00 Dec‐02 35,040 35,040 ‐
Equipment Prepurchase 60054_6777 Jun‐05 Mar‐06 198,000 198,000 ‐
Hultman Rehab ‐ CP9 60058_6856 Nov‐05 Dec‐06 3,256,702 3,256,702 ‐
Interim Disinfection 60059_6872 Jan‐03 Oct‐05 1,244,540 1,244,540 ‐
Hultman Interconnect ‐ Final Design/CA/R 60066_6911 Sep‐05 Sep‐14 5,732,364 5,732,364 ‐ 495,154
Lower Hultman Rehab ‐ CP6A 60073_6975 Sep‐09 May‐13 52,288,838 52,288,838 ‐ 476,851
Hultman Interconnection ‐ Resident Inspection Services 60083_7082 Jan‐10 Jan‐15 1,870,346 1,870,346 ‐ 144,904
CP6 Easements 60085_7105 Jan‐08 Apr‐14 33,094 33,015 79 76 1,040
CP6A Demolition 60086_7106 Sep‐08 Jan‐09 57,222 57,222 ‐
Valve Chamber & Storage Tank Access Improvements ‐ Design 60109_7283 Oct‐17 Sep‐22 600,000 ‐ 600,000 90,000 90,000 510,000
Shaft 5 Electrical Upgrade 60128_7367 Jan‐19 Jan‐20 1,000,000 ‐ 1,000,000 1,000,000
Valve Chamber & Storage Tank Access Improvements ‐ Constr. 60160_7476 Jul‐19 Jun‐21 2,400,000 ‐ 2,400,000 2,400,000
Shaft 5A/5 Surface Piping Cathodic Protection 60161_7477 Nov‐16 Oct‐17 132,000 ‐ 132,000 66,000 66,000 132,000
Hultman Leak Shaft 5A 60162_7507 Mar‐16 May‐16 156,900 159,438 (2,538) (2,537) 156,901
615 Chicopee Valley Aqueduct Redundancy completed project 8,666,292 8,666,291 ‐
14 of 25

Massachusetts Water Resources Authority
FY18 Proposed Expenditure Forecast
Program/Project/Subphase Contract No.
Notice
To
Proceed
Substantial
Completion
Total Contract
Amount
Payments
through FY16
Remaining
Balance FY17 FY18 FY14 ‐ FY18 FY19‐FY23 Beyond FY23
616 Quabbin Transmission System 16,405,914 7,456,913 8,949,001 1,049,000 1,303,449 7,900,000
Facilities Inspection 60055_6828 Oct‐05 Oct‐07 1,005,413 1,005,413 ‐
Oakdale High Line Replacement ‐ Construction 60068_6940 Aug‐18 Feb‐19 500,000 ‐ 500,000 500,000
Equipment Pre‐purchase 60075_7007 Feb‐05 Jun‐08 534,366 534,366 ‐
Oakdale Phase 1A Electrical ‐ Design 60103_7229 Oct‐09 Jul‐14 775,534 775,534 ‐ 77,651
Oakdale Phase 1A Electrical ‐ Construction 60104_7230 Apr‐12 Jul‐13 2,260,002 2,260,001 1 176,798
Ware River Intake Valve Replacement ‐ Design 60108_7282 Jul‐18 Jun‐23 300,000 ‐ 300,000 300,000
Rehab Wachusett Gatehouse/Bastion Lower Gatehouse ‐ Design 60113_7333 Jul‐18 Jun‐23 1,000,000 ‐ 1,000,000 1,000,000
Rehabilitate Oakdale Turbine 60135_7378 May‐20 Jan‐21 1,000,000 ‐ 1,000,000 1,000,000
Rehab Wachusett Gatehouse/Bastion Lower Gatehouse ‐ Const. 60137_7380 Jul‐20 Jun‐22 4,000,000 ‐ 4,000,000 4,000,000
Ware Rver Intake Valve Replacement ‐ Construction 60138_7487 Jul‐20 Jun‐22 900,000 ‐ 900,000 900,000
CVA Intake Motorized Screens Replacement ‐ Construction 60139_7488 Nov‐16 Jun‐17 1,049,000 ‐ 1,049,000 1,049,000 1,049,000
Oakdale Turbine Rehab ‐ Design 60201_7545 May‐19 Jun‐23 200,000 ‐ 200,000 200,000
Oakdale Valves ‐ Phase 1 Construction 75491_6690 Oct‐05 Jun‐06 1,811,309 1,811,309 ‐
Oakdale Valves ‐ Phase 1 Study & Design 75496_6831 Apr‐04 Jun‐07 1,070,290 1,070,290 ‐
617 Sudbury/Weston Aqueduct Repairs 6,452,684 1,371,948 5,080,736 1,290,069 427,664 2,429,733 3,363,003
Sudbury Aqueduct Inspection 60056_6838 Aug‐05 Oct‐06 369,520 369,520 ‐
Technical Assistance 60057_6839 Sep‐09 Dec‐11 25,000 25,000 ‐
Sudbury Short‐Term Repairs 60076_7016 Jul‐17 Jun‐18 460,012 ‐ 460,012 345,009 345,009 115,003
Sudbury Short‐Term Repairs ‐ Phase 2 60110_7317 Jul‐23 Jul‐24 2,098,000 ‐ 2,098,000 2,098,000
Ash Street Sluice Gates ‐ Construction 60130_7369 Jun‐20 Jun‐21 800,000 ‐ 800,000 800,000
Rosemary Brook Siphon Building Repair 60150_7472 Mar‐16 Nov‐16 1,745,598 712,000 1,033,598 1,033,598 1,745,598
Evaluation of Farm Pond Buildings ‐ Waban Arches 60151_7473 Jul‐16 Jul‐17 339,126 ‐ 339,126 256,471 82,655 339,126
Ash Street Sluice Gates ‐ Design 60152_7491 Jun‐18 Jan‐22 350,000 ‐ 350,000 350,000
Hazardous Materials Sudbury Aqueduct 75486_6617 Apr‐99 May‐05 265,428 265,428 ‐
620 Wachusett Reservoir Spillway Improvements completed project 9,287,460 9,287,460 ‐
621 Watershed Land 24,000,000 19,277,400 4,722,600 1,580,000 1,500,000 5,015,000 1,642,600
Land Acquisition 60081_7069 Apr‐06 Jun‐20 24,000,000 19,277,400 4,722,600 1,580,000 1,500,000 5,015,000 1,642,600
622 Cosgrove Tunnel Redundancy 53,030,240 9,131,536 43,898,704 21,840,654 16,435,405 46,232,153 5,621,291 1,354
Wachusett Aqueduct Pump Station ‐ Design/ESDC/RI 60090_7156 Feb‐12 May‐20 6,842,240 4,219,757 2,622,483 916,461 538,744 4,499,520 1,167,278
Wachusett Aqueduct Pump Station ‐ Construction 60091_7157 Mar‐16 Feb‐19 46,173,000 4,905,869 41,267,131 20,923,333 15,895,515 41,724,717 4,448,283
Permits/Easements 60124_7354 Aug‐15 Dec‐25 15,000 5,910 9,090 860 1,146 7,916 5,730 1,354
623 Dam Projects 4,538,205 3,115,745 1,422,460 5 515,113 545,681 907,342
Dam Safety Modifications & Repairs ‐ Construction 60094_7194 Aug‐11 Sep‐12 2,054,559 2,054,554 5 5 5
Dam Safety Modifications & Repairs ‐ Design/ESDC 60100_7211 Sep‐09 Jun‐14 1,532,646 1,060,757 471,889 471,889 502,377
Quinapoxet Dam Permits 60118_7346 Jul‐17 Dec‐20 1,000 434 566 366 441 200
Quinapoxet Dam Removal ‐ Design/ESDC/RI 60119_7347 Jul‐17 Dec‐20 200,000 ‐ 200,000 42,858 42,858 157,142
Quinapoxet Dam Removal ‐ Construction 60120_7348 Jul‐18 Dec‐20 750,000 ‐ 750,000 750,000
15 of 25

Massachusetts Water Resources Authority
FY18 Proposed Expenditure Forecast
Program/Project/Subphase Contract No.
Notice
To
Proceed
Substantial
Completion
Total Contract
Amount
Payments
through FY16
Remaining
Balance FY17 FY18 FY14 ‐ FY18 FY19‐FY23 Beyond FY23
625 Metropolitan Tunnel Redundancy 1,357,685,868 3,008,809 1,354,677,059 228,177 2,020,000 3,590,530 151,110,826 1,201,318,056
Water Transmission Redundancy Plan 60035_6273 Oct‐08 Sep‐11 1,396,572 1,396,572 ‐ (1,848)
Conceptual Design EIR 60092_7159 Jul‐17 Jul‐19 7,549,990 ‐ 7,549,990 2,000,000 2,000,000 5,549,990
Tunnel Construction 60107_7291 Jul‐22 Jun‐34 924,010,917 ‐ 924,010,917 57,750,681 866,260,236
Sudbury Aqueduct ‐ MEPA Review 60122_7352 Oct‐12 Jun‐17 3,405,107 1,612,237 1,792,870 228,177 20,000 1,592,378 1,544,693
Construction Management 60126_7356 Jul‐21 Jun‐35 110,014,140 ‐ 110,014,140 13,751,767 96,262,373
Tops of Shafts Connecting Mains Surface Construction 60127_7357 Jul‐30 Jun‐33 39,049,626 ‐ 39,049,626 39,049,626
Public Relations, Legal & Administration 60170_7516 Jul‐18 Jun‐34 160,695,877 ‐ 160,695,877 47,706,587 112,989,290
Tops of Shafts Rehab ‐ Design/CA/RI 60172_7521 Jul‐34 Jul‐39 1,186,427 ‐ 1,186,427 1,186,427
Tops of Shafts Rehab ‐ Construction 60173_7522 Jul‐36 Jul‐38 4,961,422 ‐ 4,961,422 4,961,422
Final Design/ESDC 60174_7556 Jul‐19 Dec‐34 99,228,440 ‐ 99,228,440 24,807,108 74,421,332
Shaft 7 ‐ Design CA/RI 60176_7558 Jun‐33 Jan‐35 1,237,470 ‐ 1,237,470 1,237,470
Shaft 7 Buildings ‐ Construction 60177_7559 Jan‐35 Jun‐39 4,949,880 ‐ 4,949,880 4,949,880
628 Metropolitan Redundancy Interim Improvements 213,371,942 503,104 212,868,838 222,884 1,350,000 2,075,988 140,302,044 70,993,910
Metropolitan Redundancy Interim Design CA/RI 60200_7560 Jan‐18 Jul‐23 10,414,895 ‐ 10,414,895 150,000 150,000 9,412,000 852,895
Tops of Shafts Interim Improvement ‐ Costruction 60202_7561 Jan‐19 Jan‐20 6,114,420 ‐ 6,114,420 6,114,420
Chestnut Hill Emergency PS Improvements ‐ Construction 60203_7562 Jul‐20 Jul‐22 18,343,260 ‐ 18,343,260 18,343,260
WASM/Spot Pond Supply Mains West PRV Improvements‐Const. 60204_7563 Jul‐19 Jul‐21 8,152,560 ‐ 8,152,560 8,152,560
Chestnut Hill Emergency PS Stand‐by Generator ‐ Construction 60205_7566 Jan‐20 Jan‐21 8,886,290 ‐ 8,886,290 8,886,290
WASM 3 ‐ MEPA/Design/CA/RI 68166_6539 Jul‐13 Oct‐26 15,482,625 503,104 14,979,521 122,884 500,000 1,125,988 8,340,000 6,016,637
WASM 3 Sliplining 68170_6543 Jul‐22 Jun‐26 58,609,494 ‐ 58,609,494 8,880,228 49,729,266
WASM 3 Rehab 68171_6544 Jul‐19 Jun‐22 61,203,455 ‐ 61,203,455 61,203,455
Section 101/Waltham Section ‐ Construction 68333_7457 Jul‐23 Jul‐25 12,826,112 ‐ 12,826,112 12,826,112
Section 101/Waltham Section ‐ Design CA/RI 68334_7547 Jul‐21 Jun‐26 3,000,000 ‐ 3,000,000 1,431,000 1,569,000
Commonwealth Ave. PS Improvements ‐ Design/CA/RI 75580_7523 Dec‐16 Dec‐21 2,775,831 ‐ 2,775,831 100,000 700,000 800,000 1,975,831
Commonwealth Ave. PS Improvements ‐ Construction 75581_7524 Dec‐18 Dec‐20 7,563,000 ‐ 7,563,000 7,563,000
630 Watershed Division Capital Improvements 15,000,000 ‐ 15,000,000 614,000 614,000 14,386,000
Quabbin Admin Building Rehab ‐ Design CA\RI 60300_7564 Jul‐17 Jul‐21 3,000,000 ‐ 3,000,000 614,000 614,000 2,386,000
Quabbin Admin Building Rehab ‐ Construction 60301_7565 Jul‐19 Jul‐21 12,000,000 ‐ 12,000,000 12,000,000
16 of 25
Massachusetts Water Resources Authority
FY18 Proposed Expenditure Forecast
Program/Project/Subphase Contract No.
Notice
To
Proceed
Substantial
Completion
Total Contract
Amount
Payments
through FY16
Remaining
Balance FY17 FY18 FY14 ‐ FY18 FY19‐FY23 Beyond FY23
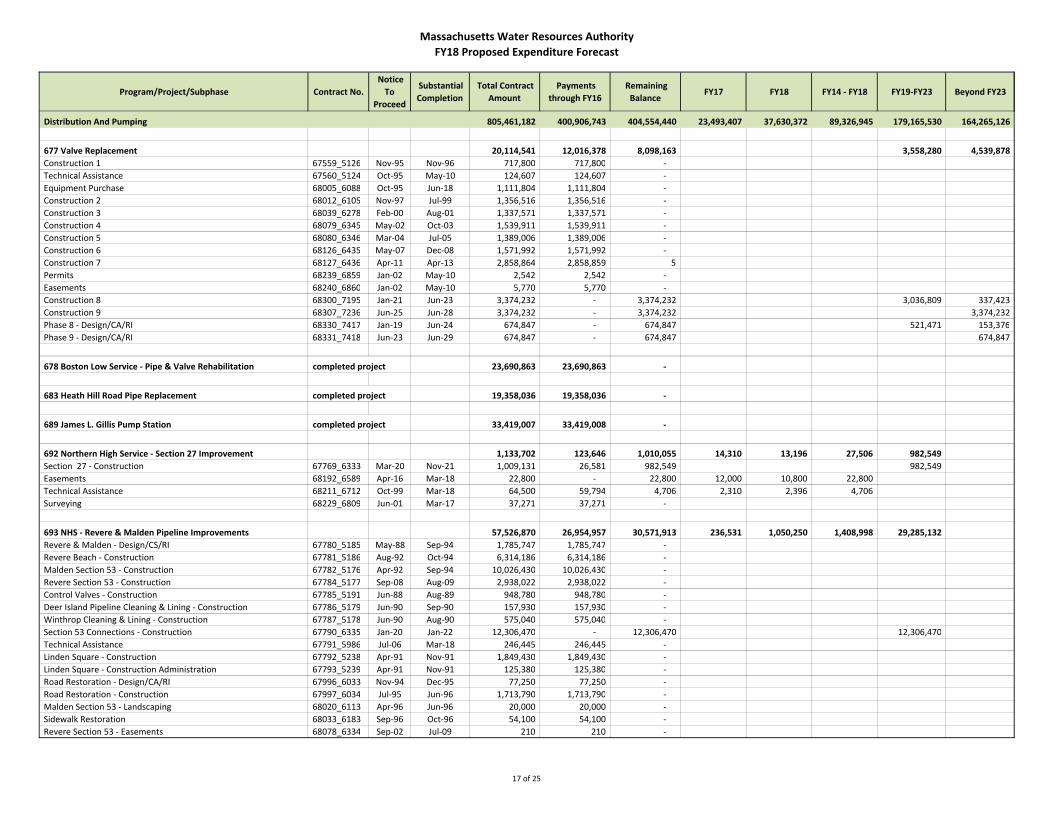
Distribution And Pumping 805,461,182 400,906,743 404,554,440 23,493,407 37,630,372 89,326,945 179,165,530 164,265,126
677 Valve Replacement 20,114,541 12,016,378 8,098,163 3,558,280 4,539,878
Construction 1 67559_5126 Nov‐95 Nov‐96 717,800 717,800 ‐
Technical Assistance 67560_5124 Oct‐95 May‐10 124,607 124,607 ‐
Equipment Purchase 68005_6088 Oct‐95 Jun‐18 1,111,804 1,111,804 ‐
Construction 2 68012_6105 Nov‐97 Jul‐99 1,356,516 1,356,516 ‐
Construction 3 68039_6278 Feb‐00 Aug‐01 1,337,571 1,337,571 ‐
Construction 4 68079_6345 May‐02 Oct‐03 1,539,911 1,539,911 ‐
Construction 5 68080_6346 Mar‐04 Jul‐05 1,389,006 1,389,006 ‐
Construction 6 68126_6435 May‐07 Dec‐08 1,571,992 1,571,992 ‐
Construction 7 68127_6436 Apr‐11 Apr‐13 2,858,864 2,858,859 5
Permits 68239_6859 Jan‐02 May‐10 2,542 2,542 ‐
Easements 68240_6860 Jan‐02 May‐10 5,770 5,770 ‐
Construction 8 68300_7195 Jan‐21 Jun‐23 3,374,232 ‐ 3,374,232 3,036,809 337,423
Construction 9 68307_7236 Jun‐25 Jun‐28 3,374,232 ‐ 3,374,232 3,374,232
Phase 8 ‐ Design/CA/RI 68330_7417 Jan‐19 Jun‐24 674,847 ‐ 674,847 521,471 153,376
Phase 9 ‐ Design/CA/RI 68331_7418 Jun‐23 Jun‐29 674,847 ‐ 674,847 674,847
678 Boston Low Service ‐ Pipe & Valve Rehabilitation completed project 23,690,863 23,690,863 ‐
683 Heath Hill Road Pipe Replacement completed project 19,358,036 19,358,036 ‐
689 James L. Gillis Pump Station completed project 33,419,007 33,419,008 ‐
692 Northern High Service ‐ Section 27 Improvement 1,133,702 123,646 1,010,055 14,310 13,196 27,506 982,549
Section 27 ‐ Construction 67769_6333 Mar‐20 Nov‐21 1,009,131 26,581 982,549 982,549
Easements 68192_6589 Apr‐16 Mar‐18 22,800 ‐ 22,800 12,000 10,800 22,800
Technical Assistance 68211_6712 Oct‐99 Mar‐18 64,500 59,794 4,706 2,310 2,396 4,706
Surveying 68229_6809 Jun‐01 Mar‐17 37,271 37,271 ‐
693 NHS ‐ Revere & Malden Pipeline Improvements 57,526,870 26,954,957 30,571,913 236,531 1,050,250 1,408,998 29,285,132
Revere & Malden ‐ Design/CS/RI 67780_5185 May‐88 Sep‐94 1,785,747 1,785,747 ‐
Revere Beach ‐ Construction 67781_5186 Aug‐92 Oct‐94 6,314,186 6,314,186 ‐
Malden Section 53 ‐ Construction 67782_5176 Apr‐92 Sep‐94 10,026,430 10,026,430 ‐
Revere Section 53 ‐ Construction 67784_5177 Sep‐08 Aug‐09 2,938,022 2,938,022 ‐
Control Valves ‐ Construction 67785_5191 Jun‐88 Aug‐89 948,780 948,780 ‐
Deer Island Pipeline Cleaning & Lining ‐ Construction 67786_5179 Jun‐90 Sep‐90 157,930 157,930 ‐
Winthrop Cleaning & Lining ‐ Construction 67787_5178 Jun‐90 Aug‐90 575,040 575,040 ‐
Section 53 Connections ‐ Construction 67790_6335 Jan‐20 Jan‐22 12,306,470 ‐ 12,306,470 12,306,470
Technical Assistance 67791_5986 Jul‐06 Mar‐18 246,445 246,445 ‐
Linden Square ‐ Construction 67792_5238 Apr‐91 Nov‐91 1,849,430 1,849,430 ‐
Linden Square ‐ Construction Administration 67793_5239 Apr‐91 Nov‐91 125,380 125,380 ‐
Road Restoration ‐ Design/CA/RI 67996_6033 Nov‐94 Dec‐95 77,250 77,250 ‐
Road Restoration ‐ Construction 67997_6034 Jul‐95 Jun‐96 1,713,790 1,713,790 ‐
Malden Section 53 ‐ Landscaping 68020_6113 Apr‐96 Jun‐96 20,000 20,000 ‐
Sidewalk Restoration 68033_6183 Sep‐96 Oct‐96 54,100 54,100 ‐
Revere Section 53 ‐ Easements 68078_6334 Sep‐02 Jul‐09 210 210 ‐
17 of 25

Massachusetts Water Resources Authority
FY18 Proposed Expenditure Forecast
Program/Project/Subphase Contract No.
Notice
To
Proceed
Substantial
Completion
Total Contract
Amount
Payments
through FY16
Remaining
Balance FY17 FY18 FY14 ‐ FY18 FY19‐FY23 Beyond FY23
Section 99 Connection ‐ Construction 68258_6958 Mar‐20 Mar‐22 3,135,662 ‐ 3,135,662 3,135,662
Easements 68265_6978 Jul‐06 Dec‐20 30,000 ‐ 30,000 5,000 10,000 15,000 15,000
Permits 68280_7049 Apr‐05 Mar‐22 5,000 ‐ 5,000 750 1,250 2,000 3,000
Section 56 Replacement/Saugus River ‐ Design CA/RI 75545_7454 Apr‐18 Apr‐23 2,000,000 ‐ 2,000,000 2,000,000
Section 53 and 99 Connections ‐ Design CA/RI 75548_7485 Jun‐17 Mar‐23 3,750,000 ‐ 3,750,000 225,000 225,000 3,525,000
Section 56 Replacement‐ Construction 75549_7486 Apr‐20 Apr‐22 8,300,000 ‐ 8,300,000 8,300,000
Section 56 Replacement/Saugus River ‐ Feasibility Study 75565_7500 Dec‐15 Jun‐17 246,998 122,217 124,781 124,781 246,998
Section 56 Pipe Demo Des CA/RI 75569_7535 Jan‐17 Jun‐18 320,000 ‐ 320,000 106,000 214,000 320,000
Section 56 Pipe Demolition ‐ Construction 75570_7536 Sep‐17 Mar‐18 600,000 ‐ 600,000 600,000 600,000
702 New Connecting Mains ‐ Shaft 7 to WASM 3 37,860,699 11,315,807 26,544,892 906,100 1,143,000 2,404,100 21,907,133 2,588,658
Routing Study 67846_5163 Aug‐94 Nov‐96 397,087 397,087 ‐
Watertown MOU 68035_6199 Jun‐94 Sep‐97 167,000 167,000 ‐
CP1‐ Design/CA/RI 68110_6383 Sep‐98 Jul‐11 3,532,814 3,532,814 ‐
Des/CA/RI DP2/4 Meter 120 68111_6384 Aug‐02 Oct‐08 1,277,722 1,277,722 ‐
CP3 (Sect 23,24,47)‐Final Des/CA/RI 68112_6385 Jul‐16 Jun‐22 3,506,868 ‐ 3,506,868 896,100 900,000 1,796,100 1,710,768
CP1 A&B ‐ Easements 68114_6387 16,919 16,919 ‐
CP3 ‐ Easements 68115_6388 Jan‐18 Dec‐18 40,000 ‐ 40,000 20,000 20,000 20,000
CP5 ‐ Easements 68117_6390 Dec‐06 Jan‐11 21,659 21,659 ‐
CP3‐Sect 23,24,47, Rehab 68119_6392 Jul‐18 Jun‐21 8,083,561 ‐ 8,083,561 8,083,561
CP5 ‐ Northeast Segment 68121_6394 Aug‐09 Nov‐11 5,902,607 5,902,606 1 355,000
CP2 ‐ Clean & Line Sections 59&60 ‐ Cons 68174_6548 Mar‐22 Mar‐24 5,431,859 ‐ 5,431,859 3,336,201 2,095,658
CP2 ‐Easements 68175_6547 May‐17 May‐25 33,000 ‐ 33,000 10,000 23,000 33,000
Repl Sect 25, 75, 59460 Des CA/RI 68255_6955 Jan‐18 Mar‐25 3,000,000 ‐ 3,000,000 200,000 200,000 2,307,000 493,000
Replacement of Section 25 ‐ Construction 68256_6956 Jul‐19 Feb‐21 2,929,603 ‐ 2,929,603 2,929,603
Section 75 Extension ‐ Construction 68350_7484 Mar‐20 Mar‐22 3,520,000 ‐ 3,520,000 3,520,000
704 Rehab of Other Pump Stations 50,257,852 30,057,852 20,200,000 1,320,834 18,879,166
Preliminary Design 67885_5153 Aug‐94 Mar‐96 351,000 351,000 ‐
Design/CS/RI 68017_6110 May‐97 Nov‐04 2,545,826 2,545,826 ‐
Construction II & C 68072_6304 Jan‐00 Feb‐01 639,272 639,272 ‐
Rehab of 5 Pump Stations 68102_6375 Oct‐06 Jun‐10 21,847,856 21,847,856 ‐
Legal 68179_6557 Jul‐99 Jan‐10 6,097 6,097 ‐
Proprietary Equipment Purchases 68204_6676 Jun‐99 Jan‐10 157,638 157,638 ‐
Design 2 CS/RI 68266_6980 Dec‐04 Jun‐11 4,510,163 4,510,163 ‐
Pump Station Rehab ‐ Evaluation 75582_7525 Jul‐19 Jul‐21 500,000 ‐ 500,000 500,000
Pump Station Rehab ‐ Design/CA/RI 75583_7526 Jan‐22 Jan‐28 3,940,000 ‐ 3,940,000 820,834 3,119,166
Pump Station Rehab ‐ Construction 75584_7527 Jan‐25 Jan‐27 15,760,000 ‐ 15,760,000 15,760,000
706 NHS‐Connecting Mains from Section 91 completed project 2,360,194 2,360,194 ‐
18 of 25
Massachusetts Water Resources Authority
FY18 Proposed Expenditure Forecast
Program/Project/Subphase Contract No.
Notice
To
Proceed
Substantial
Completion
Total Contract
Amount
Payments
through FY16
Remaining
Balance FY17 FY18 FY14 ‐ FY18 FY19‐FY23 Beyond FY23
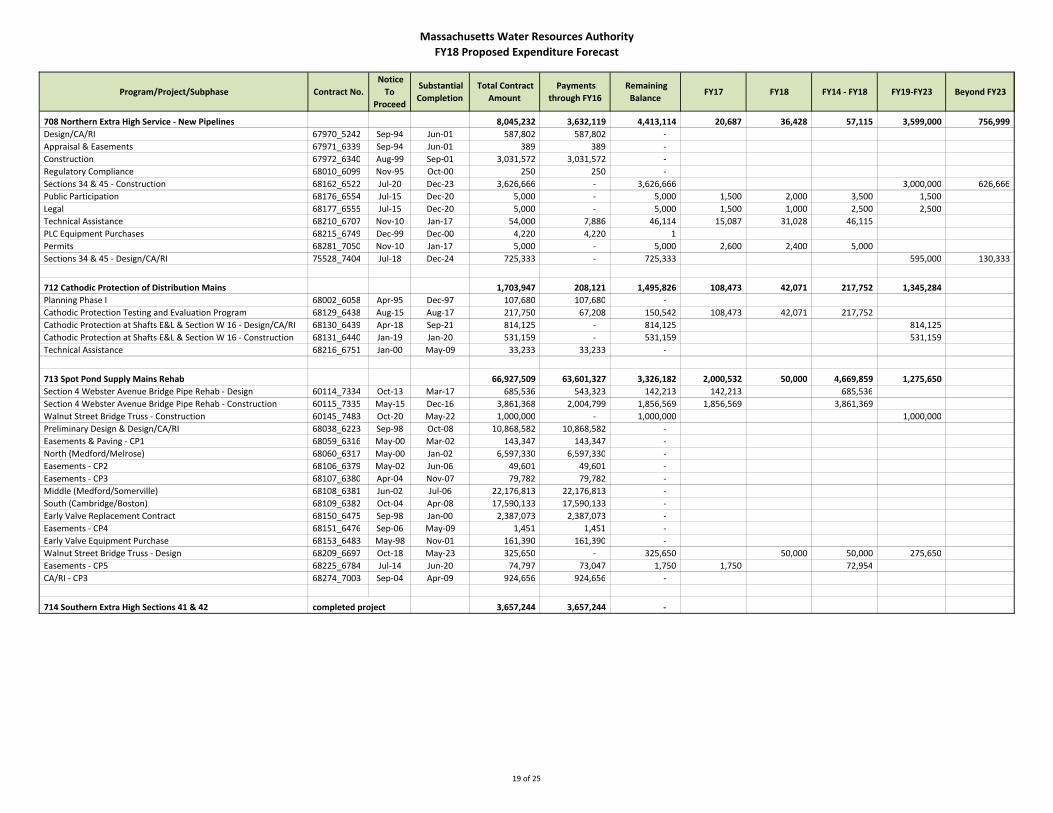
708 Northern Extra High Service ‐ New Pipelines 8,045,232 3,632,119 4,413,114 20,687 36,428 57,115 3,599,000 756,999
Design/CA/RI 67970_5242 Sep‐94 Jun‐01 587,802 587,802 ‐
Appraisal & Easements 67971_6339 Sep‐94 Jun‐01 389 389 ‐
Construction 67972_6340 Aug‐99 Sep‐01 3,031,572 3,031,572 ‐
Regulatory Compliance 68010_6099 Nov‐95 Oct‐00 250 250 ‐
Sections 34 & 45 ‐ Construction 68162_6522 Jul‐20 Dec‐23 3,626,666 ‐ 3,626,666 3,000,000 626,666
Public Participation 68176_6554 Jul‐15 Dec‐20 5,000 ‐ 5,000 1,500 2,000 3,500 1,500
Legal 68177_6555 Jul‐15 Dec‐20 5,000 ‐ 5,000 1,500 1,000 2,500 2,500
Technical Assistance 68210_6707 Nov‐10 Jan‐17 54,000 7,886 46,114 15,087 31,028 46,115
PLC Equipment Purchases 68215_6749 Dec‐99 Dec‐00 4,220 4,220 1
Permits 68281_7050 Nov‐10 Jan‐17 5,000 ‐ 5,000 2,600 2,400 5,000
Sections 34 & 45 ‐ Design/CA/RI 75528_7404 Jul‐18 Dec‐24 725,333 ‐ 725,333 595,000 130,333
712 Cathodic Protection of Distribution Mains 1,703,947 208,121 1,495,826 108,473 42,071 217,752 1,345,284
Planning Phase I 68002_6058 Apr‐95 Dec‐97 107,680 107,680 ‐
Cathodic Protection Testing and Evaluation Program 68129_6438 Aug‐15 Aug‐17 217,750 67,208 150,542 108,473 42,071 217,752
Cathodic Protection at Shafts E&L & Section W 16 ‐ Design/CA/RI 68130_6439 Apr‐18 Sep‐21 814,125 ‐ 814,125 814,125
Cathodic Protection at Shafts E&L & Section W 16 ‐ Construction 68131_6440 Jan‐19 Jan‐20 531,159 ‐ 531,159 531,159
Technical Assistance 68216_6751 Jan‐00 May‐09 33,233 33,233 ‐
713 Spot Pond Supply Mains Rehab 66,927,509 63,601,327 3,326,182 2,000,532 50,000 4,669,859 1,275,650
Section 4 Webster Avenue Bridge Pipe Rehab ‐ Design 60114_7334 Oct‐13 Mar‐17 685,536 543,323 142,213 142,213 685,536
Section 4 Webster Avenue Bridge Pipe Rehab ‐ Construction 60115_7335 May‐15 Dec‐16 3,861,368 2,004,799 1,856,569 1,856,569 3,861,369
Walnut Street Bridge Truss ‐ Construction 60145_7483 Oct‐20 May‐22 1,000,000 ‐ 1,000,000 1,000,000
Preliminary Design & Design/CA/RI 68038_6223 Sep‐98 Oct‐08 10,868,582 10,868,582 ‐
Easements & Paving ‐ CP1 68059_6316 May‐00 Mar‐02 143,347 143,347 ‐
North (Medford/Melrose) 68060_6317 May‐00 Jan‐02 6,597,330 6,597,330 ‐
Easements ‐ CP2 68106_6379 May‐02 Jun‐06 49,601 49,601 ‐
Easements ‐ CP3 68107_6380 Apr‐04 Nov‐07 79,782 79,782 ‐
Middle (Medford/Somerville) 68108_6381 Jun‐02 Jul‐06 22,176,813 22,176,813 ‐
South (Cambridge/Boston) 68109_6382 Oct‐04 Apr‐08 17,590,133 17,590,133 ‐
Early Valve Replacement Contract 68150_6475 Sep‐98 Jan‐00 2,387,073 2,387,073 ‐
Easements ‐ CP4 68151_6476 Sep‐06 May‐09 1,451 1,451 ‐
Early Valve Equipment Purchase 68153_6483 May‐98 Nov‐01 161,390 161,390 ‐
Walnut Street Bridge Truss ‐ Design 68209_6697 Oct‐18 May‐23 325,650 ‐ 325,650 50,000 50,000 275,650
Easements ‐ CP5 68225_6784 Jul‐14 Jun‐20 74,797 73,047 1,750 1,750 72,954
CA/RI ‐ CP3 68274_7003 Sep‐04 Apr‐09 924,656 924,656 ‐
714 Southern Extra High Sections 41 & 42 completed project 3,657,244 3,657,244 ‐
19 of 25
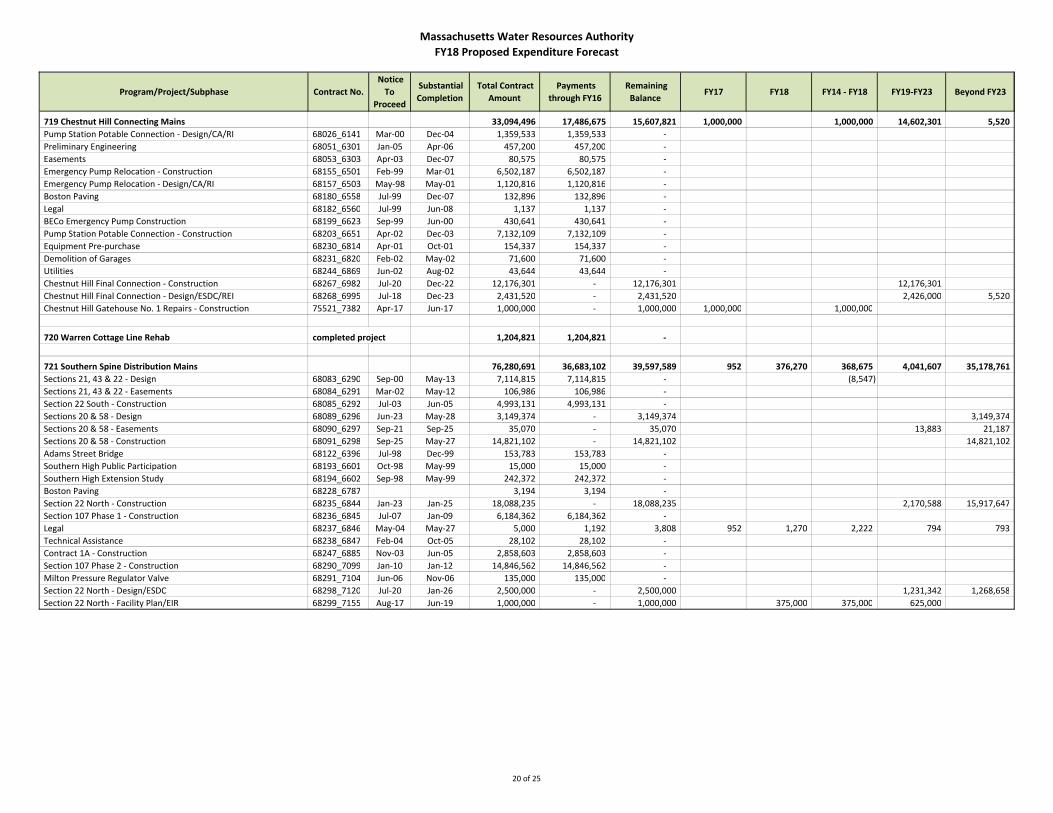
Massachusetts Water Resources Authority
FY18 Proposed Expenditure Forecast
Program/Project/Subphase Contract No.
Notice
To
Proceed
Substantial
Completion
Total Contract
Amount
Payments
through FY16
Remaining
Balance FY17 FY18 FY14 ‐ FY18 FY19‐FY23 Beyond FY23
719 Chestnut Hill Connecting Mains 33,094,496 17,486,675 15,607,821 1,000,000 1,000,000 14,602,301 5,520
Pump Station Potable Connection ‐ Design/CA/RI 68026_6141 Mar‐00 Dec‐04 1,359,533 1,359,533 ‐
Preliminary Engineering 68051_6301 Jan‐05 Apr‐06 457,200 457,200 ‐
Easements 68053_6303 Apr‐03 Dec‐07 80,575 80,575 ‐
Emergency Pump Relocation ‐ Construction 68155_6501 Feb‐99 Mar‐01 6,502,187 6,502,187 ‐
Emergency Pump Relocation ‐ Design/CA/RI 68157_6503 May‐98 May‐01 1,120,816 1,120,816 ‐
Boston Paving 68180_6558 Jul‐99 Dec‐07 132,896 132,896 ‐
Legal 68182_6560 Jul‐99 Jun‐08 1,137 1,137 ‐
BECo Emergency Pump Construction 68199_6623 Sep‐99 Jun‐00 430,641 430,641 ‐
Pump Station Potable Connection ‐ Construction 68203_6651 Apr‐02 Dec‐03 7,132,109 7,132,109 ‐
Equipment Pre‐purchase 68230_6814 Apr‐01 Oct‐01 154,337 154,337 ‐
Demolition of Garages 68231_6820 Feb‐02 May‐02 71,600 71,600 ‐
Utilities 68244_6869 Jun‐02 Aug‐02 43,644 43,644 ‐
Chestnut Hill Final Connection ‐ Construction 68267_6982 Jul‐20 Dec‐22 12,176,301 ‐ 12,176,301 12,176,301
Chestnut Hill Final Connection ‐ Design/ESDC/REI 68268_6995 Jul‐18 Dec‐23 2,431,520 ‐ 2,431,520 2,426,000 5,520
Chestnut Hill Gatehouse No. 1 Repairs ‐ Construction 75521_7382 Apr‐17 Jun‐17 1,000,000 ‐ 1,000,000 1,000,000 1,000,000
720 Warren Cottage Line Rehab completed project 1,204,821 1,204,821 ‐
721 Southern Spine Distribution Mains 76,280,691 36,683,102 39,597,589 952 376,270 368,675 4,041,607 35,178,761
Sections 21, 43 & 22 ‐ Design 68083_6290 Sep‐00 May‐13 7,114,815 7,114,815 ‐ (8,547)
Sections 21, 43 & 22 ‐ Easements 68084_6291 Mar‐02 May‐12 106,986 106,986 ‐
Section 22 South ‐ Construction 68085_6292 Jul‐03 Jun‐05 4,993,131 4,993,131 ‐
Sections 20 & 58 ‐ Design 68089_6296 Jun‐23 May‐28 3,149,374 ‐ 3,149,374 3,149,374
Sections 20 & 58 ‐ Easements 68090_6297 Sep‐21 Sep‐25 35,070 ‐ 35,070 13,883 21,187
Sections 20 & 58 ‐ Construction 68091_6298 Sep‐25 May‐27 14,821,102 ‐ 14,821,102 14,821,102
Adams Street Bridge 68122_6396 Jul‐98 Dec‐99 153,783 153,783 ‐
Southern High Public Participation 68193_6601 Oct‐98 May‐99 15,000 15,000 ‐
Southern High Extension Study 68194_6602 Sep‐98 May‐99 242,372 242,372 ‐
Boston Paving 68228_6787 3,194 3,194 ‐
Section 22 North ‐ Construction 68235_6844 Jan‐23 Jan‐25 18,088,235 ‐ 18,088,235 2,170,588 15,917,647
Section 107 Phase 1 ‐ Construction 68236_6845 Jul‐07 Jan‐09 6,184,362 6,184,362 ‐
Legal 68237_6846 May‐04 May‐27 5,000 1,192 3,808 952 1,270 2,222 794 793
Technical Assistance 68238_6847 Feb‐04 Oct‐05 28,102 28,102 ‐
Contract 1A ‐ Construction 68247_6885 Nov‐03 Jun‐05 2,858,603 2,858,603 ‐
Section 107 Phase 2 ‐ Construction 68290_7099 Jan‐10 Jan‐12 14,846,562 14,846,562 ‐
Milton Pressure Regulator Valve 68291_7104 Jun‐06 Nov‐06 135,000 135,000 ‐
Section 22 North ‐ Design/ESDC 68298_7120 Jul‐20 Jan‐26 2,500,000 ‐ 2,500,000 1,231,342 1,268,658
Section 22 North ‐ Facility Plan/EIR 68299_7155 Aug‐17 Jun‐19 1,000,000 ‐ 1,000,000 375,000 375,000 625,000
20 of 25
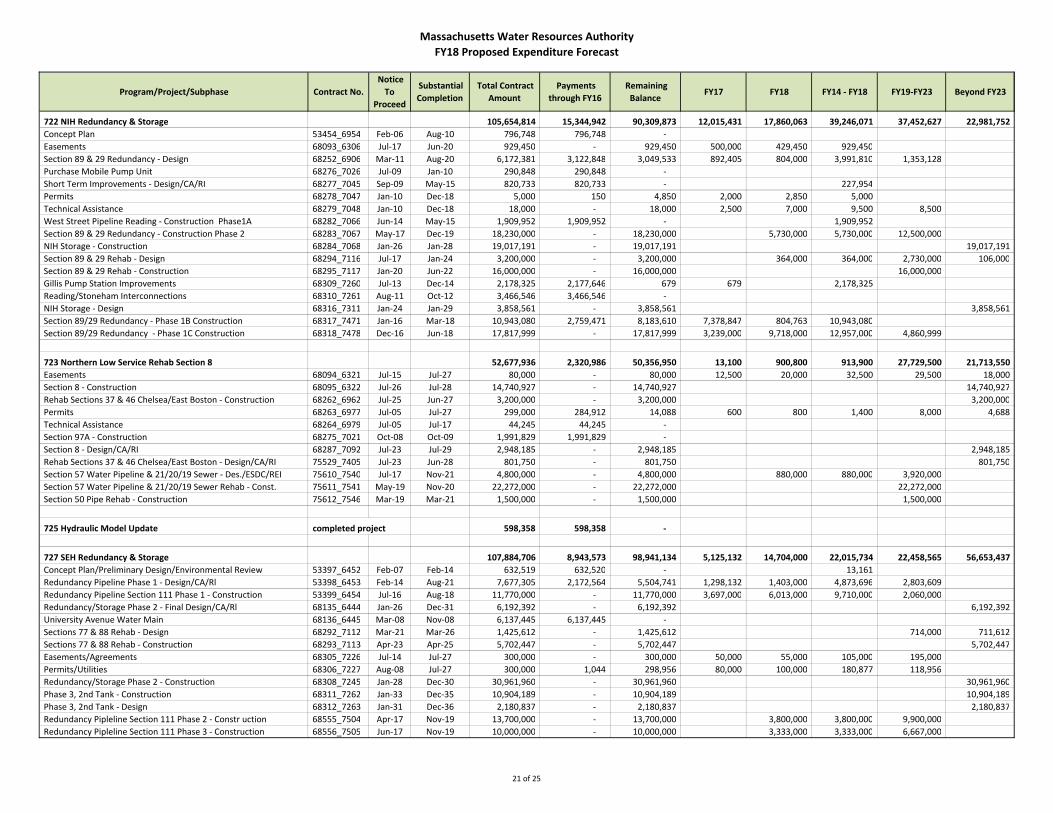
Massachusetts Water Resources Authority
FY18 Proposed Expenditure Forecast
Program/Project/Subphase Contract No.
Notice
To
Proceed
Substantial
Completion
Total Contract
Amount
Payments
through FY16
Remaining
Balance FY17 FY18 FY14 ‐ FY18 FY19‐FY23 Beyond FY23
722 NIH Redundancy & Storage 105,654,814 15,344,942 90,309,873 12,015,431 17,860,063 39,246,071 37,452,627 22,981,752
Concept Plan 53454_6954 Feb‐06 Aug‐10 796,748 796,748 ‐
Easements 68093_6306 Jul‐17 Jun‐20 929,450 ‐ 929,450 500,000 429,450 929,450
Section 89 & 29 Redundancy ‐ Design 68252_6906 Mar‐11 Aug‐20 6,172,381 3,122,848 3,049,533 892,405 804,000 3,991,810 1,353,128
Purchase Mobile Pump Unit 68276_7026 Jul‐09 Jan‐10 290,848 290,848 ‐
Short Term Improvements ‐ Design/CA/RI 68277_7045 Sep‐09 May‐15 820,733 820,733 ‐ 227,954
Permits 68278_7047 Jan‐10 Dec‐18 5,000 150 4,850 2,000 2,850 5,000
Technical Assistance 68279_7048 Jan‐10 Dec‐18 18,000 ‐ 18,000 2,500 7,000 9,500 8,500
West Street Pipeline Reading ‐ Construction Phase1A 68282_7066 Jun‐14 May‐15 1,909,952 1,909,952 ‐ 1,909,952
Section 89 & 29 Redundancy ‐ Construction Phase 2 68283_7067 May‐17 Dec‐19 18,230,000 ‐ 18,230,000 5,730,000 5,730,000 12,500,000
NIH Storage ‐ Construction 68284_7068 Jan‐26 Jan‐28 19,017,191 ‐ 19,017,191 19,017,191
Section 89 & 29 Rehab ‐ Design 68294_7116 Jul‐17 Jan‐24 3,200,000 ‐ 3,200,000 364,000 364,000 2,730,000 106,000
Section 89 & 29 Rehab ‐ Construction 68295_7117 Jan‐20 Jun‐22 16,000,000 ‐ 16,000,000 16,000,000
Gillis Pump Station Improvements 68309_7260 Jul‐13 Dec‐14 2,178,325 2,177,646 679 679 2,178,325
Reading/Stoneham Interconnections 68310_7261 Aug‐11 Oct‐12 3,466,546 3,466,546 ‐
NIH Storage ‐ Design 68316_7311 Jan‐24 Jan‐29 3,858,561 ‐ 3,858,561 3,858,561
Section 89/29 Redundancy ‐ Phase 1B Construction 68317_7471 Jan‐16 Mar‐18 10,943,080 2,759,471 8,183,610 7,378,847 804,763 10,943,080
Section 89/29 Redundancy ‐ Phase 1C Construction 68318_7478 Dec‐16 Jun‐18 17,817,999 ‐ 17,817,999 3,239,000 9,718,000 12,957,000 4,860,999
723 Northern Low Service Rehab Section 8 52,677,936 2,320,986 50,356,950 13,100 900,800 913,900 27,729,500 21,713,550
Easements 68094_6321 Jul‐15 Jul‐27 80,000 ‐ 80,000 12,500 20,000 32,500 29,500 18,000
Section 8 ‐ Construction 68095_6322 Jul‐26 Jul‐28 14,740,927 ‐ 14,740,927 14,740,927
Rehab Sections 37 & 46 Chelsea/East Boston ‐ Construction 68262_6962 Jul‐25 Jun‐27 3,200,000 ‐ 3,200,000 3,200,000
Permits 68263_6977 Jul‐05 Jul‐27 299,000 284,912 14,088 600 800 1,400 8,000 4,688
Technical Assistance 68264_6979 Jul‐05 Jul‐17 44,245 44,245 ‐
Section 97A ‐ Construction 68275_7021 Oct‐08 Oct‐09 1,991,829 1,991,829 ‐
Section 8 ‐ Design/CA/RI 68287_7092 Jul‐23 Jul‐29 2,948,185 ‐ 2,948,185 2,948,185
Rehab Sections 37 & 46 Chelsea/East Boston ‐ Design/CA/RI 75529_7405 Jul‐23 Jun‐28 801,750 ‐ 801,750 801,750
Section 57 Water Pipeline & 21/20/19 Sewer ‐ Des./ESDC/REI 75610_7540 Jul‐17 Nov‐21 4,800,000 ‐ 4,800,000 880,000 880,000 3,920,000
Section 57 Water Pipeline & 21/20/19 Sewer Rehab ‐ Const. 75611_7541 May‐19 Nov‐20 22,272,000 ‐ 22,272,000 22,272,000
Section 50 Pipe Rehab ‐ Construction 75612_7546 Mar‐19 Mar‐21 1,500,000 ‐ 1,500,000 1,500,000
725 Hydraulic Model Update completed project 598,358 598,358 ‐
727 SEH Redundancy & Storage 107,884,706 8,943,573 98,941,134 5,125,132 14,704,000 22,015,734 22,458,565 56,653,437
Concept Plan/Preliminary Design/Environmental Review 53397_6452 Feb‐07 Feb‐14 632,519 632,520 ‐ 13,161
Redundancy Pipeline Phase 1 ‐ Design/CA/Rl 53398_6453 Feb‐14 Aug‐21 7,677,305 2,172,564 5,504,741 1,298,132 1,403,000 4,873,696 2,803,609
Redundancy Pipeline Section 111 Phase 1 ‐ Construction 53399_6454 Jul‐16 Aug‐18 11,770,000 ‐ 11,770,000 3,697,000 6,013,000 9,710,000 2,060,000
Redundancy/Storage Phase 2 ‐ Final Design/CA/Rl 68135_6444 Jan‐26 Dec‐31 6,192,392 ‐ 6,192,392 6,192,392
University Avenue Water Main 68136_6445 Mar‐08 Nov‐08 6,137,445 6,137,445 ‐
Sections 77 & 88 Rehab ‐ Design 68292_7112 Mar‐21 Mar‐26 1,425,612 ‐ 1,425,612 714,000 711,612
Sections 77 & 88 Rehab ‐ Construction 68293_7113 Apr‐23 Apr‐25 5,702,447 ‐ 5,702,447 5,702,447
Easements/Agreements 68305_7226 Jul‐14 Jul‐27 300,000 ‐ 300,000 50,000 55,000 105,000 195,000
Permits/Utilities 68306_7227 Aug‐08 Jul‐27 300,000 1,044 298,956 80,000 100,000 180,877 118,956
Redundancy/Storage Phase 2 ‐ Construction 68308_7245 Jan‐28 Dec‐30 30,961,960 ‐ 30,961,960 30,961,960
Phase 3, 2nd Tank ‐ Construction 68311_7262 Jan‐33 Dec‐35 10,904,189 ‐ 10,904,189 10,904,189
Phase 3, 2nd Tank ‐ Design 68312_7263 Jan‐31 Dec‐36 2,180,837 ‐ 2,180,837 2,180,837
Redundancy Pipleline Section 111 Phase 2 ‐ Constr uction 68555_7504 Apr‐17 Nov‐19 13,700,000 ‐ 13,700,000 3,800,000 3,800,000 9,900,000
Redundancy Pipleline Section 111 Phase 3 ‐ Construction 68556_7505 Jun‐17 Nov‐19 10,000,000 ‐ 10,000,000 3,333,000 3,333,000 6,667,000
21 of 25
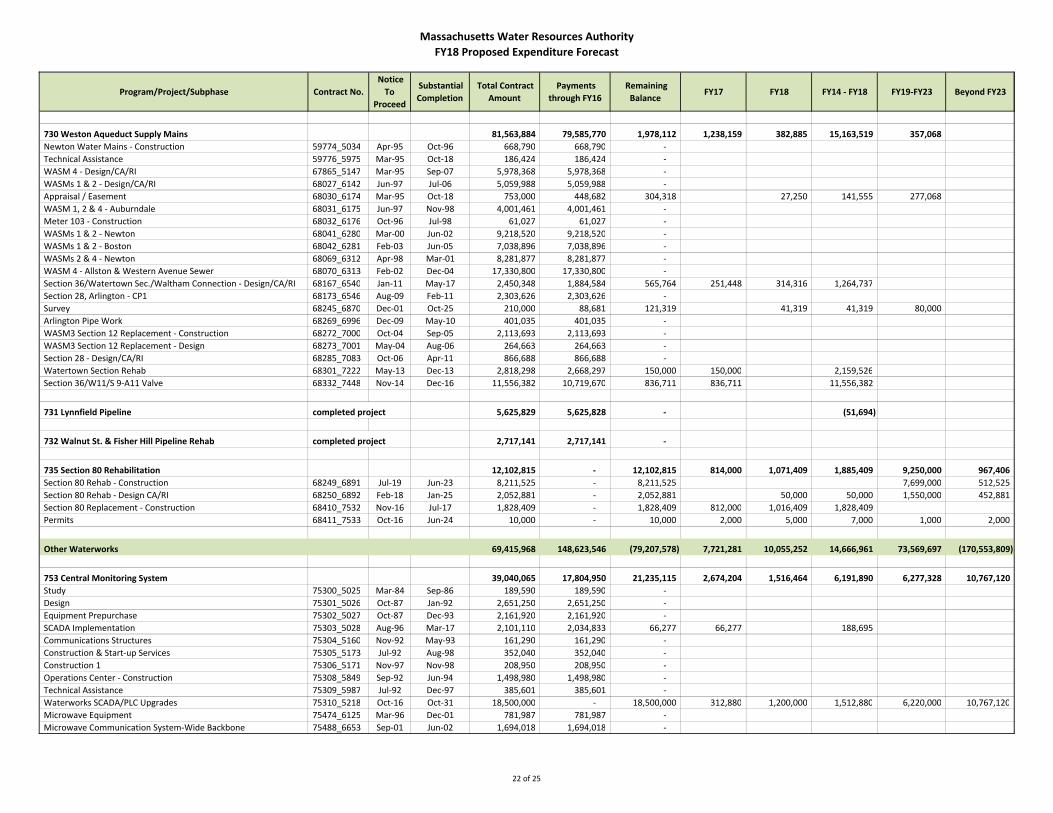
Massachusetts Water Resources Authority
FY18 Proposed Expenditure Forecast
Program/Project/Subphase Contract No.
Notice
To
Proceed
Substantial
Completion
Total Contract
Amount
Payments
through FY16
Remaining
Balance FY17 FY18 FY14 ‐ FY18 FY19‐FY23 Beyond FY23
730 Weston Aqueduct Supply Mains 81,563,884 79,585,770 1,978,112 1,238,159 382,885 15,163,519 357,068
Newton Water Mains ‐ Construction 59774_5034 Apr‐95 Oct‐96 668,790 668,790 ‐
Technical Assistance 59776_5975 Mar‐95 Oct‐18 186,424 186,424 ‐
WASM 4 ‐ Design/CA/RI 67865_5147 Mar‐95 Sep‐07 5,978,368 5,978,368 ‐
WASMs 1 & 2 ‐ Design/CA/RI 68027_6142 Jun‐97 Jul‐06 5,059,988 5,059,988 ‐
Appraisal / Easement 68030_6174 Mar‐95 Oct‐18 753,000 448,682 304,318 27,250 141,555 277,068
WASM 1, 2 & 4 ‐ Auburndale 68031_6175 Jun‐97 Nov‐98 4,001,461 4,001,461 ‐
Meter 103 ‐ Construction 68032_6176 Oct‐96 Jul‐98 61,027 61,027 ‐
WASMs 1 & 2 ‐ Newton 68041_6280 Mar‐00 Jun‐02 9,218,520 9,218,520 ‐
WASMs 1 & 2 ‐ Boston 68042_6281 Feb‐03 Jun‐05 7,038,896 7,038,896 ‐
WASMs 2 & 4 ‐ Newton 68069_6312 Apr‐98 Mar‐01 8,281,877 8,281,877 ‐
WASM 4 ‐ Allston & Western Avenue Sewer 68070_6313 Feb‐02 Dec‐04 17,330,800 17,330,800 ‐
Section 36/Watertown Sec./Waltham Connection ‐ Design/CA/RI 68167_6540 Jan‐11 May‐17 2,450,348 1,884,584 565,764 251,448 314,316 1,264,737
Section 28, Arlington ‐ CP1 68173_6546 Aug‐09 Feb‐11 2,303,626 2,303,626 ‐
Survey 68245_6870 Dec‐01 Oct‐25 210,000 88,681 121,319 41,319 41,319 80,000
Arlington Pipe Work 68269_6996 Dec‐09 May‐10 401,035 401,035 ‐
WASM3 Section 12 Replacement ‐ Construction 68272_7000 Oct‐04 Sep‐05 2,113,693 2,113,693 ‐
WASM3 Section 12 Replacement ‐ Design 68273_7001 May‐04 Aug‐06 264,663 264,663 ‐
Section 28 ‐ Design/CA/RI 68285_7083 Oct‐06 Apr‐11 866,688 866,688 ‐
Watertown Section Rehab 68301_7222 May‐13 Dec‐13 2,818,298 2,668,297 150,000 150,000 2,159,526
Section 36/W11/S 9‐A11 Valve 68332_7448 Nov‐14 Dec‐16 11,556,382 10,719,670 836,711 836,711 11,556,382
731 Lynnfield Pipeline completed project 5,625,829 5,625,828 ‐ (51,694)
732 Walnut St. & Fisher Hill Pipeline Rehab completed project 2,717,141 2,717,141 ‐
735 Section 80 Rehabilitation 12,102,815 ‐ 12,102,815 814,000 1,071,409 1,885,409 9,250,000 967,406
Section 80 Rehab ‐ Construction 68249_6891 Jul‐19 Jun‐23 8,211,525 ‐ 8,211,525 7,699,000 512,525
Section 80 Rehab ‐ Design CA/RI 68250_6892 Feb‐18 Jan‐25 2,052,881 ‐ 2,052,881 50,000 50,000 1,550,000 452,881
Section 80 Replacement ‐ Construction 68410_7532 Nov‐16 Jul‐17 1,828,409 ‐ 1,828,409 812,000 1,016,409 1,828,409
Permits 68411_7533 Oct‐16 Jun‐24 10,000 ‐ 10,000 2,000 5,000 7,000 1,000 2,000
Other Waterworks 69,415,968 148,623,546 (79,207,578) 7,721,281 10,055,252 14,666,961 73,569,697 (170,553,809)
753 Central Monitoring System 39,040,065 17,804,950 21,235,115 2,674,204 1,516,464 6,191,890 6,277,328 10,767,120
Study 75300_5025 Mar‐84 Sep‐86 189,590 189,590 ‐
Design 75301_5026 Oct‐87 Jan‐92 2,651,250 2,651,250 ‐
Equipment Prepurchase 75302_5027 Oct‐87 Dec‐93 2,161,920 2,161,920 ‐
SCADA Implementation 75303_5028 Aug‐96 Mar‐17 2,101,110 2,034,833 66,277 66,277 188,695
Communications Structures 75304_5160 Nov‐92 May‐93 161,290 161,290 ‐
Construction & Start‐up Services 75305_5173 Jul‐92 Aug‐98 352,040 352,040 ‐
Construction 1 75306_5171 Nov‐97 Nov‐98 208,950 208,950 ‐
Operations Center ‐ Construction 75308_5849 Sep‐92 Jun‐94 1,498,980 1,498,980 ‐
Technical Assistance 75309_5987 Jul‐92 Dec‐97 385,601 385,601 ‐
Waterworks SCADA/PLC Upgrades 75310_5218 Oct‐16 Oct‐31 18,500,000 ‐ 18,500,000 312,880 1,200,000 1,512,880 6,220,000 10,767,120
Microwave Equipment 75474_6125 Mar‐96 Dec‐01 781,987 781,987 ‐
Microwave Communication System‐Wide Backbone 75488_6653 Sep‐01 Jun‐02 1,694,018 1,694,018 ‐
22 of 25

Massachusetts Water Resources Authority
FY18 Proposed Expenditure Forecast
Program/Project/Subphase Contract No.
Notice
To
Proceed
Substantial
Completion
Total Contract
Amount
Payments
through FY16
Remaining
Balance FY17 FY18 FY14 ‐ FY18 FY19‐FY23 Beyond FY23
Monitoring & Control ‐ Study & Design 75489_6654 Dec‐99 Sep‐04 1,807,784 1,807,784 ‐
Microwave Communication for Waterworks Facilities 75494_6816 Sep‐02 Jul‐04 1,957,399 1,957,399 ‐
Ludlow Communications 75495_6825 Sep‐01 Oct‐01 40,504 40,504 ‐
Quabbin Power, Communication & Security ‐ Construction 75512_7338 Feb‐16 Apr‐17 3,505,320 1,335,490 2,169,830 2,081,056 88,774 3,505,320
Quabbin Power, Communication & Security ‐ Design/CA/RI 75540_7461 Sep‐14 Sep‐18 813,905 540,966 272,939 100,957 114,654 756,577 57,328
Utility Fees and Permits 75541_7475 Jul‐14 Dec‐17 228,418 2,348 226,070 113,034 113,036 228,418
763 Distribution System Facilities Mapping 2,298,919 1,036,368 1,262,551 1,262,551
Planning and Design 75458_5162 Feb‐95 Dec‐98 936,368 936,368 ‐
Data Purchase 75476_6152 Nov‐95 Aug‐96 100,000 100,000 ‐
Records Development 75484_6525 Oct‐19 Jan‐20 762,551 ‐ 762,551 762,551
Update of Record Drawings 75600_7489 Apr‐18 Apr‐19 500,000 ‐ 500,000 500,000
764 Local Water Infrastructure Rehab completed project 7,487,762 7,487,762 ‐
765 Local Water System Assistance Program ‐ 121,568,086 (121,568,085) 3,287,581 7,457,217 5,453,643 49,770,043 (182,082,929)
Community Loans 75485_6608 Aug‐00 Jun‐13 222,317,575 222,317,575 1
Community Repayments 75493_6759 Aug‐01 Jun‐23 (222,317,575) (179,105,788) (43,211,787) (11,832,783) (9,153,147) (66,753,948) (22,215,596) (10,261)
Local Water System Assistance Loans 75513_7339 Aug‐10 Jun‐20 200,000,000 97,711,357 102,288,643 19,000,000 18,000,000 96,142,246 65,288,643
Local Water System Assistance Repayments 75514_7340 Aug‐11 Jun‐30 (200,000,000) (20,721,058) (179,278,942) (9,771,136) (11,671,136) (39,482,155) (78,744,502) (79,092,168)
CVA Loans 75515_7350 Nov‐10 Jun‐20 10,000,000 2,085,000 7,915,000 1,100,000 1,100,000 2,200,000 5,715,000
CVA Repayments 75516_7351 Nov‐11 Jun‐30 (10,000,000) (719,000) (9,281,000) (208,500) (318,500) (1,152,500) (3,273,500) (5,480,500)
Lead Service Line Replacement Loans 75517_7529 Aug‐16 May‐36 100,000,000 ‐ 100,000,000 5,000,000 5,000,000 10,000,000 25,000,000 65,000,000
Lead Service Line Replacement Repayments 75518_7530 Aug‐17 May‐46 (100,000,000) ‐ (100,000,000) (500,000) (500,000) (10,000,000) (89,500,000)
LWSAP Phase 3 Loans 75620_7567 Aug‐17 May‐46 210,000,000 ‐ 210,000,000 5,000,000 5,000,000 85,000,000 120,000,000
LWSAP Phase 3 Repayments 75621_7568 Aug‐17 May‐46 (210,000,000) ‐ (210,000,000) (17,000,000) (193,000,000)
766 Waterworks Facility Asset Protection 20,589,222 726,381 19,862,841 1,759,496 1,081,571 3,021,429 16,259,774 762,000
Meter Vault Manhole Retrofits ‐ Design 75490_6689 Sep‐18 Jun‐22 423,925 ‐ 423,925 423,925
Walnut Hill Tank Rehab/Elevat. Water Tanks Repainting Design 75497_6832 Jul‐17 Jul‐22 800,000 ‐ 800,000 120,000 120,000 680,000
Walnut Hill Tank ‐ Construction 75498_6833 Jul‐18 Jul‐19 1,000,000 ‐ 1,000,000 1,000,000
Waltham Bridge Pipe Replacement 75501_6910 Mar‐04 Sep‐04 237,550 237,550 ‐
Permits and Legal Fees 75502_6920 Mar‐04 Jun‐18 16,340 10,156 6,184 2,388 3,796 7,184
Technical Assistance 75503_6921 ‐ 5,517 (5,517) (5,517)
Cosgrove Flat Roof Replacement 75505_7022 Sep‐17 Mar‐18 900,000 ‐ 900,000 900,000 900,000
Cosgrove Valve Replacement ‐ Construction 75509_7064 Jul‐20 Dec‐20 1,898,764 ‐ 1,898,764 1,898,764
Cosgrove Valve Replacement ‐ Design 75510_7065 Jul‐19 Dec‐21 223,384 ‐ 223,384 223,384
Transformer at Cosgrove Intake Building 75511_7228 Jun‐11 Jul‐12 299,313 299,313 ‐
Covered Storage Tank Rehab ‐ Design CA/RI 75524_7385 Jul‐19 Jul‐24 1,000,000 ‐ 1,000,000 914,000 86,000
Electrical Distribution Upgrades at Southborough 75535_7425 Apr ‐18 Apr‐19 400,000 ‐ 400,000 400,000
Water Meter Upgrade Replacement 75536_7453 Sep‐20 Jun‐23 1,000,000 ‐ 1,000,000 1,000,000
Beacon Street Line Repair ‐ Construction 75537_7458 Jun‐16 Jan‐17 1,551,178 ‐ 1,551,178 1,551,178 1,551,178
Beacon Street Line Repair ‐ Design/CA/RI 75538_7474 Nov‐14 Dec‐17 443,067 173,845 269,222 211,447 57,775 443,067
Meter Vault Manhole Retrofits ‐ Construction 75550_7479 Sep‐19 Jun‐21 1,695,701 ‐ 1,695,701 1,695,701
Covered Storage Tank Rehab ‐ Construction 75553_7482 Jul‐21 Jul‐23 4,000,000 ‐ 4,000,000 3,360,000 640,000
Water Meter Upgrade ‐ Design CA/RI 75554_7542 Sep‐18 Jun‐24 200,000 ‐ 200,000 164,000 36,000
Elevated Water Storage Tanks Repainting ‐ Construction 77552_7493 Jul‐19 Jun‐21 4,500,000 ‐ 4,500,000 4,500,000
Business & Operations Support 131,460,724 92,707,839 38,752,885 8,794,902 10,185,285 34,246,168 19,772,696
23 of 25
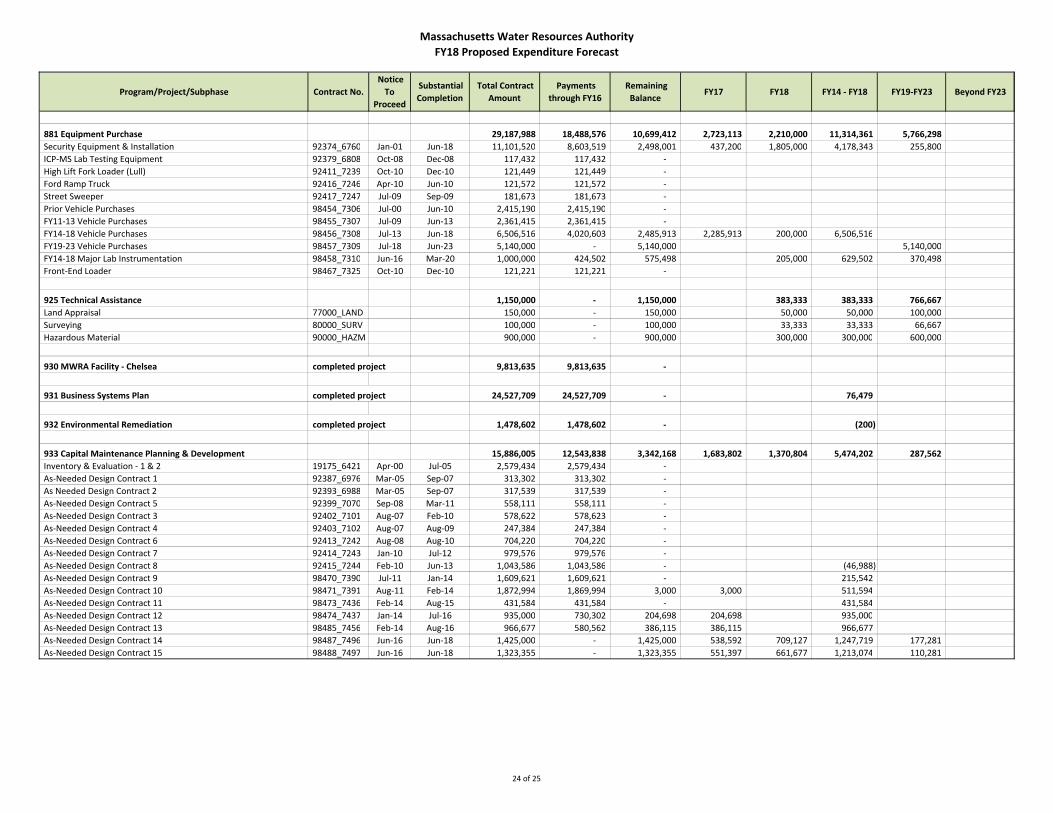
Massachusetts Water Resources Authority
FY18 Proposed Expenditure Forecast
Program/Project/Subphase Contract No.
Notice
To
Proceed
Substantial
Completion
Total Contract
Amount
Payments
through FY16
Remaining
Balance FY17 FY18 FY14 ‐ FY18 FY19‐FY23 Beyond FY23
881 Equipment Purchase 29,187,988 18,488,576 10,699,412 2,723,113 2,210,000 11,314,361 5,766,298
Security Equipment & Installation 92374_6760 Jan‐01 Jun‐18 11,101,520 8,603,519 2,498,001 437,200 1,805,000 4,178,343 255,800
ICP‐MS Lab Testing Equipment 92379_6808 Oct‐08 Dec‐08 117,432 117,432 ‐
High Lift Fork Loader (Lull) 92411_7239 Oct‐10 Dec‐10 121,449 121,449 ‐
Ford Ramp Truck 92416_7246 Apr‐10 Jun‐10 121,572 121,572 ‐
Street Sweeper 92417_7247 Jul‐09 Sep‐09 181,673 181,673 ‐
Prior Vehicle Purchases 98454_7306 Jul‐00 Jun‐10 2,415,190 2,415,190 ‐
FY11‐13 Vehicle Purchases 98455_7307 Jul‐09 Jun‐13 2,361,415 2,361,415 ‐
FY14‐18 Vehicle Purchases 98456_7308 Jul‐13 Jun‐18 6,506,516 4,020,603 2,485,913 2,285,913 200,000 6,506,516
FY19‐23 Vehicle Purchases 98457_7309 Jul‐18 Jun‐23 5,140,000 ‐ 5,140,000 5,140,000
FY14‐18 Major Lab Instrumentation 98458_7310 Jun‐16 Mar‐20 1,000,000 424,502 575,498 205,000 629,502 370,498
Front‐End Loader 98467_7325 Oct‐10 Dec‐10 121,221 121,221 ‐
925 Technical Assistance 1,150,000 ‐ 1,150,000 383,333 383,333 766,667
Land Appraisal 77000_LAND 150,000 ‐ 150,000 50,000 50,000 100,000
Surveying 80000_SURV 100,000 ‐ 100,000 33,333 33,333 66,667
Hazardous Material 90000_HAZM 900,000 ‐ 900,000 300,000 300,000 600,000
930 MWRA Facility ‐ Chelsea completed project 9,813,635 9,813,635 ‐
931 Business Systems Plan completed project 24,527,709 24,527,709 ‐ 76,479
932 Environmental Remediation completed project 1,478,602 1,478,602 ‐ (200)
933 Capital Maintenance Planning & Development 15,886,005 12,543,838 3,342,168 1,683,802 1,370,804 5,474,202 287,562
Inventory & Evaluation ‐ 1 & 2 19175_6421 Apr‐00 Jul‐05 2,579,434 2,579,434 ‐
As‐Needed Design Contract 1 92387_6976 Mar‐05 Sep‐07 313,302 313,302 ‐
As Needed Design Contract 2 92393_6988 Mar‐05 Sep‐07 317,539 317,539 ‐
As‐Needed Design Contract 5 92399_7070 Sep‐08 Mar‐11 558,111 558,111 ‐
As‐Needed Design Contract 3 92402_7101 Aug‐07 Feb‐10 578,622 578,623 ‐
As‐Needed Design Contract 4 92403_7102 Aug‐07 Aug‐09 247,384 247,384 ‐
As‐Needed Design Contract 6 92413_7242 Aug‐08 Aug‐10 704,220 704,220 ‐
As‐Needed Design Contract 7 92414_7243 Jan‐10 Jul‐12 979,576 979,576 ‐
As‐Needed Design Contract 8 92415_7244 Feb‐10 Jun‐13 1,043,586 1,043,586 ‐ (46,988)
As‐Needed Design Contract 9 98470_7390 Jul‐11 Jan‐14 1,609,621 1,609,621 ‐ 215,542
As‐Needed Design Contract 10 98471_7391 Aug‐11 Feb‐14 1,872,994 1,869,994 3,000 3,000 511,594
As‐Needed Design Contract 11 98473_7436 Feb‐14 Aug‐15 431,584 431,584 ‐ 431,584
As‐Needed Design Contract 12 98474_7437 Jan‐14 Jul‐16 935,000 730,302 204,698 204,698 935,000
As‐Needed Design Contract 13 98485_7456 Feb‐14 Aug‐16 966,677 580,562 386,115 386,115 966,677
As‐Needed Design Contract 14 98487_7496 Jun‐16 Jun‐18 1,425,000 ‐ 1,425,000 538,592 709,127 1,247,719 177,281
As‐Needed Design Contract 15 98488_7497 Jun‐16 Jun‐18 1,323,355 ‐ 1,323,355 551,397 661,677 1,213,074 110,281
24 of 25

Massachusetts Water Resources Authority
FY18 Proposed Expenditure Forecast
Program/Project/Subphase Contract No.
Notice
To
Proceed
Substantial
Completion
Total Contract
Amount
Payments
through FY16
Remaining
Balance FY17 FY18 FY14 ‐ FY18 FY19‐FY23 Beyond FY23
934 MWRA Facilities Management 2,150,535 370,533 1,780,002 1,780,002
Design/Engineering Services 92389_6983 Jul‐18 Sep‐19 150,000 (2) 150,002 150,002
Facilities Construction 92390_6984 Sep‐19 Sep‐20 2,000,535 370,535 1,630,000 1,630,000
935 Alternative Energy Initiatives 23,270,514 17,454,074 5,816,439 833,490 100,000 1,190,760 4,882,950
Deer Island Solar 19285_6974 Sep‐07 May‐08 903,714 903,714 ‐
DI Wind 92428_6974C Nov‐08 Apr‐10 4,063,294 4,063,294 ‐
Future DI Wind Construction (Battery D Location) 92430_7270 Oct‐19 Dec‐20 4,882,950 ‐ 4,882,950 4,882,950
Loring Road Hydro ‐ Design 92432_6974E Mar‐08 Sep‐09 2,344 2,344 ‐
Technical Assistance ‐ Solar 92439_7274 May‐09 Nov‐12 123,540 123,540 ‐ (600)
Energy Advisory Consultant Services 92440_6974B Jun‐08 Jun‐10 45,632 45,632 ‐
Wind Power Feasibility Study 92441_OP67 Mar‐07 Jun‐10 346,426 346,426 ‐
DI Photovoltaic System Phase 1 ‐ Construction 92442_7292 Sep‐09 Mar‐10 1,119,000 1,119,000 ‐
Technical Assistance ‐Energy Efficiency 92443_7274A May‐09 Nov‐13 463,085 463,085 ‐ 169,070
Technical Assistance ‐ Solar II 92444_7274B May‐09 Nov‐12 347,937 347,937 ‐
Technical Assistance ‐ Emerging Technology 92445_7274C May‐09 Dec‐13 101,264 101,263 ‐ 22,290
Technical Assistance ‐ Wind 92446_7274D May‐09 May‐13 460,242 460,242 ‐
Charlestown Wind ‐ Construction 98450_7302 Feb‐10 Oct‐11 5,124,506 5,124,502 4
John J. Carroll WTP Solar ‐ Construction 98452_7304 Jan‐10 Aug‐11 2,367,287 2,367,287 ‐
Loring Road Hydro ‐ Construction 98459_6974F Jan‐10 May‐11 1,882,218 1,882,218 ‐
DI Wind Phase II Construction 98463_7321 Aug‐18 Oct‐19 37,075 37,080 (5)
Fish Hatchery Pipeline Hydro 98465_7323 Mar‐16 Sep‐17 1,000,000 66,510 933,490 833,490 100,000 1,000,000
940 Application Improvement Program 9,980,394 1,476,397 8,503,997 1,180,218 2,984,227 5,567,717 4,339,552
GIS Applications & Integration 92420_7251 Jan‐14 Jun‐18 350,000 22,272 327,728 122,898 163,864 309,034 40,966
Lawson Enhancements 92435_7286 Mar‐17 Jun‐19 1,750,000 ‐ 1,750,000 62,500 750,000 812,500 937,500
Maximo Upgrade 92436_7287 Jul‐15 Dec‐18 2,625,904 992,166 1,633,738 703,716 531,441 2,227,323 398,581
PIMS Enhancements 92437_7288 Jan‐17 Sep‐18 400,000 ‐ 400,000 57,143 228,571 285,714 114,286
Enterprise Performance Management Enhancements 92469_7386 Mar‐16 Jun‐18 200,000 80,900 119,100 44,664 59,550 111,989 14,886
Enterprise Content Management 98475_7438 Sep‐17 Dec‐19 4,000,000 ‐ 4,000,000 1,166,667 1,166,667 2,833,333
Mobile Integrations 98476_7439 Apr‐14 Jun‐18 300,000 26,569 273,431 189,297 84,134 300,000
LIMS Enhancements 98484_7447 Mar‐15 Jun‐16 354,490 354,490 ‐ 354,490
942 Information Security Program (ISP) 2,821,703 1,180,838 1,640,865 273,819 665,093 1,584,560 701,953
IT Security Infrastructure ‐ Equipment 92434_7285 Sep‐11 Jun‐14 501,414 501,414 ‐
Information Security Protection Infrastructure Upgrade 92500_7499 Jun‐16 Jun‐19 1,456,292 361,013 1,095,279 273,819 365,093 999,925 456,367
Electronic Security Plan Implementation 98477_7440 Sep‐17 Jun‐19 545,586 ‐ 545,586 300,000 300,000 245,586
IT Security Program (ISP) Development 98483_7446 May‐13 Jun‐14 318,411 318,411 ‐ 284,635
944 Information Technology Management Program 922,640 ‐ 922,640 727,590 165,107 892,697 29,943
Service Delivery & Best Practices 92421_7252 Dec‐16 Aug‐17 110,640 ‐ 110,640 44,257 53,107 97,364 13,276
IT Project Management Methodology 98472_7408 Jan‐17 Jun‐18 200,000 ‐ 200,000 83,333 100,000 183,333 16,667
Software Development Life Cycle (SDLC) 98478_7441 Mar‐17 Jun‐18 612,000 ‐ 612,000 600,000 12,000 612,000
25 of 25

Massachusetts Water Resources Authority
FY18 Proposed Expenditure Forecast
Program/Project/Subphase Contract No.
Notice
To
Proceed
Substantial
Completion
Total Contract
Amount
Payments
through FY16
Remaining
Balance FY17 FY18 FY14 ‐ FY18 FY19‐FY23 Beyond FY23
946 IT Infrastructure Program 10,271,000 5,373,640 4,897,360 1,372,870 2,306,721 7,762,260 1,217,769
IT System Architecture 92404_7200 Sep‐12 Oct‐15 1,009,341 1,009,341 ‐ 546,568
Net 2020/Net 2020 DITP/Southborough 92405_7201 Mar‐11 Jun‐19 2,551,659 1,065,716 1,485,943 364,968 750,000 1,479,657 370,975
Storage Upgrades 92406_7203 Jul‐13 Jun‐19 1,575,000 891,532 683,468 284,779 284,779 1,341,925 113,910
Backup Upgrades 92407_7204 Jul‐13 Jun‐19 894,000 580,658 313,342 120,516 120,516 821,690 72,310
Server Management 92408_7205 Oct‐13 Jun‐19 500,000 266,939 233,061 62,810 75,667 405,416 94,584
Enterprise Application Integration 98480_7443 Jul‐14 Jun‐19 2,091,000 468,086 1,622,914 308,692 800,000 1,576,778 514,222
E‐Mail Upgrades 98481_7444 Jun‐16 Jun‐18 150,000 8,006 141,994 74,733 67,261 141,994
Enterprise Data Management 98482_7445 Jan‐14 Jun‐19 1,500,000 1,083,362 416,638 156,372 208,498 1,448,232 51,768
26 of 25