and tuber set as affected by - Partnerskap...
38
Master project in the Horticultural Science Programme 2007:2, 20 p (30 ECTS). 1 Potato yield and tuber set as affected by phosphorus fertilization By Joakim Ekelöf Department of horticulture ISSN 1403-0993
Transcript of and tuber set as affected by - Partnerskap...

Master project in the Horticultural Science Programme 2007:2, 20 p (30 ECTS).
1
Potato yield and tuber set as affected by phosphorus fertilization
By
Joakim Ekelöf
Department of horticulture
ISSN 1403-0993
2
Project information This is the result of a master thesis (30 ects) carried out at the department of horticulture within the horticultural programme at the Swedish University of Agricultural Sciences. The project includes both a literature study and a practical experiment. Håkan Asp was the head supervisor for this project, Harry Linnér the external principal and Gunnar Svensson the examiner.

3
Abstract In order to minimize phosphorus (P) leaching from potato cropping systems, P recommendations based on facts regarding the influence on the potato plant is needed. A literature study and a practical experiment were conducted in order to determine potato yield and tuber set as affected by P fertilization. The influence of soil moisture on P availability and the effects of foliar‐ P application were also investigated. Five different nutrient P treatments ranging from 0 to 0.3 g/pot were evaluated. Each nutrient P treatment was divided into 8 doses and applied weekly to plantlets grown in 50% pumice stone‐ 50% peat. Two different soil moisture levels were tested, “moist treatment” ranging from 0.35 to 0.45 g cm‐3 and “dry treatment” ranging from 0.25 to 0.35 g cm‐3. Foliar‐ P applications were applied 16 and 26 days after emergence (d.a.e.) in line with common practice recommendations. Nutrient P treatments significantly effected the total fresh weight of tubers, shoots and tuber number. The moist treatment gave significant higher yield of both tubers and tuber number compared to the dry treatment which could be explained by an increased P uptake. The foliar‐ P application resulted in higher tuber yield only in plants with low P status within the moist treatment; indicating that plant water and P status might be important for P uptake through leaves. The foliar‐ P applications however, gave no significant effects on tuber number. Referat I arbetet mot ett minskat forsforutsläpp från Sveriges potatisodlingar krävs grundläggande kunskaper om fosforns inverkan på potatisplantan för att korrekta rekommendationer skall kunna ges till våra odlare. I detta arbete som innefattar både en litteraturstudie och ett praktiskt odlingsförsök har fosforns inverkan på knölsättning och skörd studerats i detalj. Även markfuktens inverkan på fosforns tillgänglighet och bladgödslingens effekt på potatisplantan har studerats. I försöket som är utfört i artificiella växtkammare har fem fosforgivor som varierar mellan 0 och 0,3 g fosfor per kruka testats. Varje behandling delades upp i 8 givor och tillfördes en gång i veckan till varje individuell planta som var planterad i ett substrat som bestod av 50% pimpsten och 50% torv. Två olika fuktighetsnivåer testades, en ”fuktig behandling” som varierade från 0.35 till 0.45 g cm‐3 och en ”torr behandling” som varierade från 0.25 till 0.35 g cm‐3. Bladgödslingen utfördes vid två tillfällen, första behandlingen gjordes 16 dagar efter uppkomst och den andra efter 26, helt enligt de rekommendationer som finns. Fosforgivorna påverkade både vikt och knölantal signifikant liksom hög markfukt som gav högre skörd och fler knölar vilket kunde knytas till ett ökat fosforupptag. Bladgödslingen av fosfor gav en signifikant skördeökning endast i plantor med låg fosforstatus i de fuktiga leden vilket antyder att plantans vatten och fosforstatus kan vara av betydelse för fosforns upptag genom bladen. Bladgödslingen resulterade dock inte i fler antal knölar.

INTRODUCTION ...................................................................................................................................... 5
PHOSPHORUS IN SOIL .................................................................................................................................7 MICROBIAL TRANSFORMATION OF ORGANIC PHOSPHORUS .....................................................................8 THE ROLE OF PHOSPHORUS IN POTATO ....................................................................................................9 SYMPTOMS OF P DEFICIENCY .....................................................................................................................9 LIGHT INTERCEPTION AND YIELD ............................................................................................................10 TUBERIZATION AS AFFECTED BY P APPLICATION ....................................................................................10 P CONCENTRATION IN THE PLANT..........................................................................................................11 TOXICITY ..................................................................................................................................................11 PHOSPHORUS ACQUISITION .....................................................................................................................11 UPTAKE FROM SOIL ..................................................................................................................................11 P UPTAKE OVER TIME ...............................................................................................................................12 PREVIOUS FIELD STUDIES .........................................................................................................................14 DETERMINING THE OPTIMUM P RATE......................................................................................................15 DIFFERENCES IN P UPTAKE BETWEEN VARIETIES.....................................................................................16 FERTILIZER APPLICATION ........................................................................................................................17 THE EFFECT OF P ON TUBER QUALITY......................................................................................................18 ENVIRONMENTAL ASPECTS OF P IN POTATO PRODUCTION ....................................................................19
MATERIAL AND METHODS............................................................................................................... 20 PLANT MATERIAL.....................................................................................................................................20 PLANTING AND SUBSTRATE .....................................................................................................................20 FERTIGATION............................................................................................................................................20 FOLIAR‐ P APPLICATION ..........................................................................................................................20 IRRIGATION ..............................................................................................................................................21 CLIMATE...................................................................................................................................................21 ANALYSIS .................................................................................................................................................21 STATISTICS................................................................................................................................................21
RESULTS.................................................................................................................................................... 22 VISUAL OBSERVATIONS ............................................................................................................................22 VEGETATIVE WEIGHT ...............................................................................................................................22 NUMBER OF TUBERS .................................................................................................................................24 P CONCENTRATION IN THE PLANT ..........................................................................................................24 P BUDGET .................................................................................................................................................26 CONCENTRATION OF K, MG AND CA IN THE PLANTS ...........................................................................27
DISCUSSION............................................................................................................................................ 28 P NUTRIENT TREATMENTS .......................................................................................................................28 SOIL MOISTURE.........................................................................................................................................28 FOLIAR‐ P APPLICATIONS ........................................................................................................................29 SWEDISH P FERTILIZER RECOMMENDATIONS FOR POTATO.....................................................................31
ACKNOWLEDGEMENTS...................................................................................................................... 33 REFERENCES............................................................................................................................................ 34
ELECTRONIC REFERENCES........................................................................................................................37 PERSONAL CONTACTS..............................................................................................................................38
4

~ Introduction ~
5
Introduction hosphorus (P) is essential in many plant functions and is needed in a stable supply in order to avoid disruptions in plant growth. Soil in which potatoes
are grown generally contains large quantities of P, around 1000‐2000kg/ha (5). However, most of it is bound to the soil to the extent that it becomes unavailable to plants. Plants need about 1/5 to 1/10 as much phosphorus as they do nitrogen and potassium but the concentration of phosphates in soil solution is only about 1/20 or less of those of nitrogen and potassium (43). Moreover, the potato plant has a relatively small nutrient exploration area because of its shallow root system and low root/foliage ratio (15). Applications of P fertilizers are therefore recommended to potato crops and are believed to increase yield, quality, tuber set and early leaf development (29, 23, 34).
P
Table 1. P‐AL (ammoniumlaktat‐acetat extracted mg P/100g) and soil P Index. mg P/100g Soil P index
< 2 1 2,0-4,0 2 4,1-8,0 3 8,1-16 4 > 16 5
The P fertilizer recommendation for potatoes varies depending on soil P status and estimated yield. The P status of Swedish soils are classified according to the P‐ Al method were P is extracted with ammonium lactate and expressed as mg P/100g soil (table 1). According to the recommendation from Yara (46) the optimum P application rate for main crop potatoes on a index III (P‐Al 4,1‐8 mg/100g soil) soil is about 70 kg P/ha if yields are estimated to 50 metric ton/ha (table 2). These large P recommendations reflect the widespread and longstanding view that potatoes are responsive to P fertilizers even on soils that contain moderate to high P reserves (11, 5, 2). Table 2. Phosphorus fertilizer recommendations for potato presented in Kg P/ha at different yield estimates and soil P‐Al classes
Yield (ton/ha) Class I II III IV V
P-AL mg/100g soil 0-2 2-4 4-8 8-16 >16
Industrial 30 100 80 60 40 20
and food 40 105 85 65 45 20
potato 50 90 70 50 25
60 95 75 55 30
Potato for 40 105 85 65 45 20
starch 50 90 70 50 25
production 60 95 75 55 30
~ Introduction ~
6
The relationship between soil P status and fertilizer P recommended is based on many series of published experiments (17, 7, 11, 20). However, the relevance of these early experiments to current P recommendations is questionable since the yields of these early experiments are smaller than current yields. Over the last decades there has been a change in soil types used for potato production. Today more sandy soils are used and irrigation is used more frequently. The use of irrigated sandy soils which often is maintained at small soil moisture deficit makes nutrients more available than they are in for e.g. dry clay soils. Therefore, the response to fertilizer may be lower with today’s cultivation practices (29, 35, 39). This is also in line with what a reanalysis of 244 published experiments made by Allison et al., (2001) showed; that in many cases the probability of a response to P fertilizer has been overstated and the optimum P dressing overestimated. The use of P fertilizers in Sweden has decreased during the last decades. The amounts of applied P to farmland today are comparable to those in the beginning of 20th century (5). However, the recommendation for potato crops has not been changed notably over the last decades. The reason for this might be that phosphorus fertilizer costs are relatively low compared to the potential yield increase an application might give (1). Foliar‐ applied P fertilizers are recommended as a supplementary treatment to sustain an adequate P status of the potato crop (47). Results from scientific experiments of such treatments are however varying and quite few trials have actually shown any significant effects (1). The response of foliar‐ applied P seems to be highly dependent on several factors such as weather conditions prior and after the treatment, P status in the plant and in the soil, and application strategy. The main propose for this study was to investigate the effect of different P applications rates on yield and tuber number of the potato plant. The effect of foliar‐ applied P on plants with different P status and the effect of soil moisture were also studied. Controlled‐environment experiment and a literature study were carried out in order to encompass the subject. Overfertilization has been a problem in Sweden over the last decades, leading to eutrophication of aquatic ecosystems, where P commonly is regarded as the limiting nutrient for primary production (35). Therefore, nowadays P fertilization can not only be monitored anymore with the sole aim of getting maximum yields.
~ Introduction ~
7
Phosphorus in soil Phosphorus can be present in soils in two forms, inorganic and organic. In most Agricultural soils, 30‐60% of the P is present in inorganic forms, although this fraction can vary from 5‐95%. Phosphorus availability is controlled by solubilization and precipitation of phosphate in inorganic forms and through the mineralization and immobilization of the organic fraction (35). The primary inorganic form of P is apatite, with the basic formula M10(PO4)6X2, commonly, the mineral (M) is Ca and less often Al or Fe. The X stands for either F‐,Cl‐, OH‐, CO32‐. Apatite is found in crystalline Al and Fe compounds in acid soils and associated with Ca compounds in alkaline, calcareous soils. The chemical weathering of inorganic P results in the release of plant‐available orthophosphate (HPO42‐ and H2PO4‐). This reaction is slow and very little plant available P, derived from this source is present in soil solution at any time. Organically bound P is not available to plants and organisms because it cannot be absorbed into cells in this form. For cellular uptake to occur, P must first be released from the organic molecule through mineralization. Thus, much of the phosphorus used by plants, other than that from applied fertilizers, is believed to come from organic phosphate release by decomposition of organic matter. Organic P forms include both relatively labile pools such as phospholipids and nucleic acids but also more resistant pools such as humic acids. The more labile fraction represents the actively cycling pool of organic P in the soil (35). Solubility of P is complicated by common ion‐ion association and pH effects, and the amount of P adsorbed on clay mineral surfaces. Soluble P rapidly precipitates as iron and aluminum phosphates in acids soils and as calcium phosphates in alkaline soils. Soil pH, due to its influence on the presence and solubility of calcium, iron and aluminum, and its effect on microbial growth, influences plant‐available phosphorus. The optimum availability of orthophosphate occurs at a soil pH of about 6.5 where precipitation of both aluminum and calcium orthophosphates is minimized. Phosphate deficiencies are usually remedied by application of phosphate fertilizers. When P is added to soil as a soluble salt (fertilizers), it becomes fixed or bound to the extent that very little of the added P is re‐extractable with water. Therefore, the reactions which P undergoes in mineral soils results in poor (25 to 40%) efficiency of recovery of an annual application rate in the growing crop (39, 12, 37). However, fixation of fertilizer P does not occur to the same degree in all soils. Clay soils with its small particle

~ Introduction ~
8
size distribution allow greater P retention than soils without colloids or predominantly sandy in nature (39, 18).
Microbial transformation of organic phosphorus Soil organisms are intimately involved in the cycling of soil nutrients; they play a significant roll in the distribution of P between various inorganic and organic P fractions and subsequently for the potential availability of phosphate for plant acquisition. They participate in the solubilization of inorganic P and in the mineralization of the organic P pool. Organically bound P is released during the mineralization through the action of phosphatase enzymes. These enzymes are produced by approximately 70‐80% of the microbial population including bacteria such as Bacillus megaterium, Steptomyces spp, Penicillium spp etc (37). Results from experiments made by Covarrubias‐Ramírez et al., (2005) showed that the use of Bacillus subtilis can promote greater P uptake kinetics and there by influence in the growth of the potato plant. Once P is mineralized, it can be taken up by plants, immobilized by the microbial biomass, precipitated in organic complexes, or adsorbed to mineral surfaces. Therefore, plants have to compete for available P. Plants ability to do so vary not only among species but also varieties (40, 23). The prevailing soil environment will affect the competitiveness of plants and soil microorganisms. Microorganisms that are closely associated to plant roots in the rhizosphere are of particular importance. However, the role of rhizosphere microorganisms varies depending on the soil P status. Their capacity to increase P availability and plant P uptake is likely to be most important in low P soils, and their ability to accumulate P from high concentrations in the soil solution, and thereby function as a buffer against P loss, is most significant in high P soils (37). Immobilization of P can be caused either by promoting the formation of inorganic precipitates or by assimilation of P into cell constituents of the microorganism. The extent of immobilization are affected by the C:P ratio of the organic materials being decomposed and the amount of available P in solution. Generally, a C:P ratio less than 200 will result in net mineralization and a C:P ratios higher than 300 will result in net immobilization (fig 1.).

~ Introduction ~
9
Fig. 1. The soil P cycle (43).
The role of Phosphorus in Potato
Symptoms of P deficiency Phosphorus is an essential element which plays an important role in basic plant carbohydrate metabolism and energy transfer systems since it is a part of the structure of DNA, RNA, ATP and phospholipids in membranes. P deficiency leads to a general reduction of most metabolic processes including cell division, cell expansion, respiration and photosynthesis (29). Chlorophyll and chloroplast formation is less affected than cell and leaf expansion, the upper side of the leaves will therefore get a darker green color. The lower side of the leaf and the stem often turns purple, although it is more common to observe yield loss without these symptoms (18, 4). Large differences between symptoms among potato cultivars occurs, and some will show purple color even though they are not deficient (e.g. Ditta, which is used in this project). Deficiency symptoms in potatoes can be observed as stunted plants with shortened internodes and poor root systems which can be seen right from the early stages of growth. Under low P conditions, a greater proportion of total carbon production is used in root respiration than at adequate P levels. Therefore, overall top growth is retarded by P deficiency, while root growth is less severely affected, resulting in an increased shoot/root ratio (15), although, tuber set is negatively affected by P deficiency (14, 38).

~ Introduction ~
10
Light interception and yield
Table 3. Effects of fertilizer P level on leaf area index. total plat dry weight and total P uptake.
P level 12 July 23 August 4 October (kg P/ha)
Leaf area index 0 2.96 5.34 - 22 3.31 4.86 - 44 3.58 4.71 - 88 4.11 4.86 -
176 4.20 4.71 -
SE (df =12) 0.244 0.377 Plant dry weight (g m-2)
0 358.4 1176.1 1505.6 22 426.7 1201.9 1731.4 44 501.8 1241.5 1872.0 88 529.2 1221.0 1708.9
176 523.8 1287.3 1826.1
SE (df =12) 34.60 74.43 130.3 P uptake (kg P/ha)
0 8.3 21.2 29.3 22 8.5 20.1 31.4 44 10.8 20.9 34.1 88 12.3 25.6 33.6
176 14.4 25.7 36.1
Grewal & Trehan (1993) reviewed the effect of P in potato and stated that both height and leaf area index was positively related to P fertilizer applications in P deficient soils. Studies by Jenkins & Ali (1999) showed that yield increases as an effect of P fertilizer application due to an increased radiation interception rather than an increased conversion efficiency. This is also in line with what Allison et al., (2001) suggested, that the increased ground cover and radiation absorption observed is the mechanism by which P fertilizer may increase yields. Furthermore, Jenkins & Ali (1999) showed that P applications mostly enhance early crop development and that the response to P application decrease with time. Treatments which received low P fertilizer applications had in this particular experiment their optimum interception delayed by approximately 2‐3 weeks. Thus, indicating that higher P application rate promotes earlier senescence. Significant yield increases was measured at early harvest but no significant responses for either dry matter production or P uptake were found at final harvest (table 3). These experiments were conducted in low P soils (P‐Olsen 12‐20 mg/l).
Tuberization as affected by P application Tuber formation is a complex developmental process involving a number of important biological systems (19). The effect of P fertilization on tuber set is not clear, although, several experiments (38, 14) indicates that P concentration in the plant is positively correlated with tuber set. Experiments made by O´Brien et.al (1998) showed that number of tubers was positively correlated with light quantity absorbed by the crop during the first week of initiation. Since P fertilization increases the interception of solar radiation at low soil P conditions, it is likely to believe that P fertilization could have a positive effect on tuber set at certain conditions (38). Tukaki and Mahler (1990) found that tuber set increased linearly as the P concentration in the nutrient solution increased from 0 to 10 μg P/ml. However,

~ Introduction ~
11
increasing the nutrient solution from 10 to 55 μg P/ml did not result in a greater number of tubers produced per plant. Allison et al., (2001) reported an increase in number of tubers in three out of 22 field experiments. Fertilizer P had a significant effect on tuber number only at those sites where fertilizer P had an effect on fresh weight yield and where Olsen‐P was <16 (index 0 or 1). The total increase in tuber number (> 10mm) was not due to an increase of stems per plant but an increase of tubers per stem.
P Concentration in the plant Phosphorus fertilization is believed to increase P concentration in the potato plant; but not all fertilization trials has been able to show that (21). However, results presented by Tukaki and Mahler (1990) shows that plant P concentration increase linear with increasing concentration of the nutrient P solution and that vegetative weight increase curvilinear.
Toxicity The general P requirements for optimal plant growth is in the range of 0,2‐0,5% of dry matter during vegetative growth (29). No reports of P being toxic or having any negative effects on potato has been found (29, 18), but Marschner (1995) states that the probability of P toxicity increases at contents higher than 1% in the dry matter.
Phosphorus acquisition
Uptake from soil Diffusion is the main mechanism for the movement of P to the root surface. The driving force of diffusion is a concentration gradient. In soil‐grown plants a concentration gradient is formed between the root and the soil surface when uptake rate exceeds the supply by mass flow. The mobility of ions is defined by the diffusion gradient. Experiments made by Bhadoria et al., 1991 showed that the diffusion coefficient increased from 0,10 X 10‐13 to 4,45 X 10‐13 m2 s‐1 as the volumetric soil water content increased from 0,12 to 0,33 g cm‐3. It is also well known from field and greenhouse experiments that at low soil water contents and low temperature affect the P uptake negatively (29, 1, 35, 27). Harris (1985) reviewed the effect of on the availability of P and concluded that increased volumetric soil water content will improve the availability of P to the potato crop. At high soil water content the path length over which P has to diffuse to the root decreases, lower concentrations of P is therefore needed to maintain diffusive supply (1). The root growth has also been shown to increase with increasing soil water content (29). It is therefore probable that use of irrigation
~ Introduction ~
12
will increase the ability of the roots to search for nutrients and thus reducing the P fertilizer requirements. Also the activity of microorganisms which are involved in the mineralization is stimulated by high soil moisture since many of the organisms in the soil fauna are highly dependent on water in order to function (37).
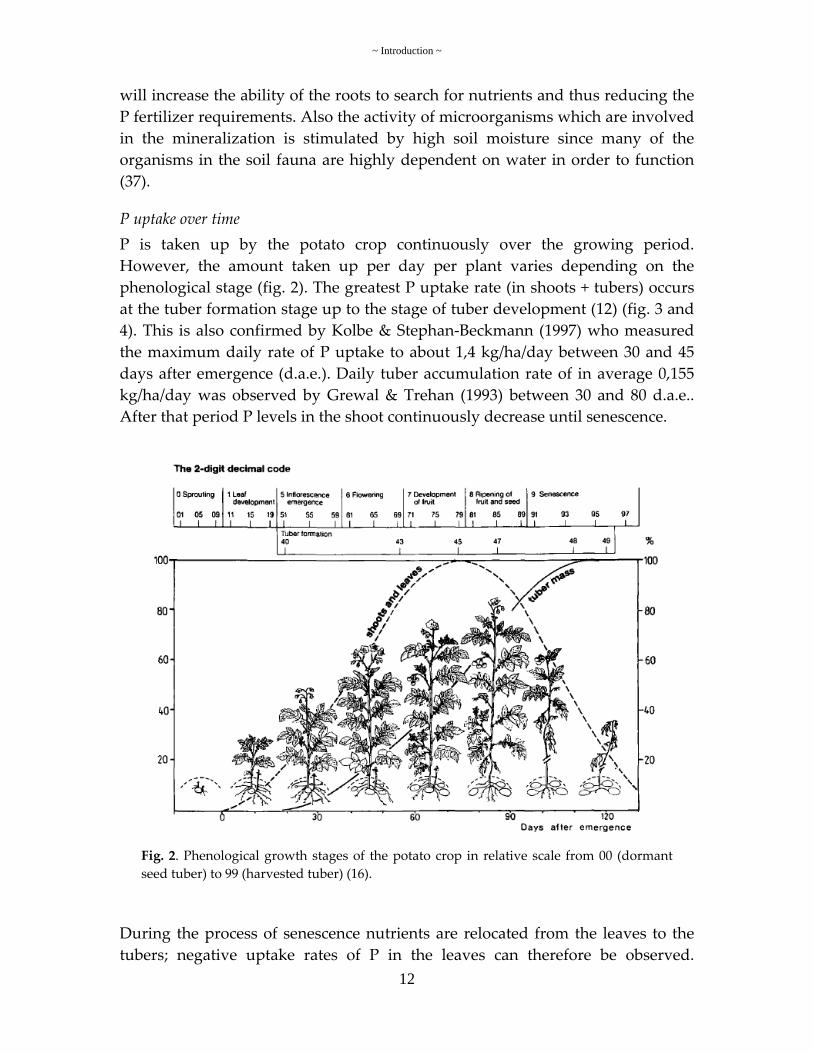
P uptake over time P is taken up by the potato crop continuously over the growing period. However, the amount taken up per day per plant varies depending on the phenological stage (fig. 2). The greatest P uptake rate (in shoots + tubers) occurs at the tuber formation stage up to the stage of tuber development (12) (fig. 3 and 4). This is also confirmed by Kolbe & Stephan‐Beckmann (1997) who measured the maximum daily rate of P uptake to about 1,4 kg/ha/day between 30 and 45 days after emergence (d.a.e.). Daily tuber accumulation rate of in average 0,155 kg/ha/day was observed by Grewal & Trehan (1993) between 30 and 80 d.a.e.. After that period P levels in the shoot continuously decrease until senescence.
Fig. 2. Phenological growth stages of the potato crop in relative scale from 00 (dormant seed tuber) to 99 (harvested tuber) (16).
During the process of senescence nutrients are relocated from the leaves to the tubers; negative uptake rates of P in the leaves can therefore be observed.
~ Introduction ~
13
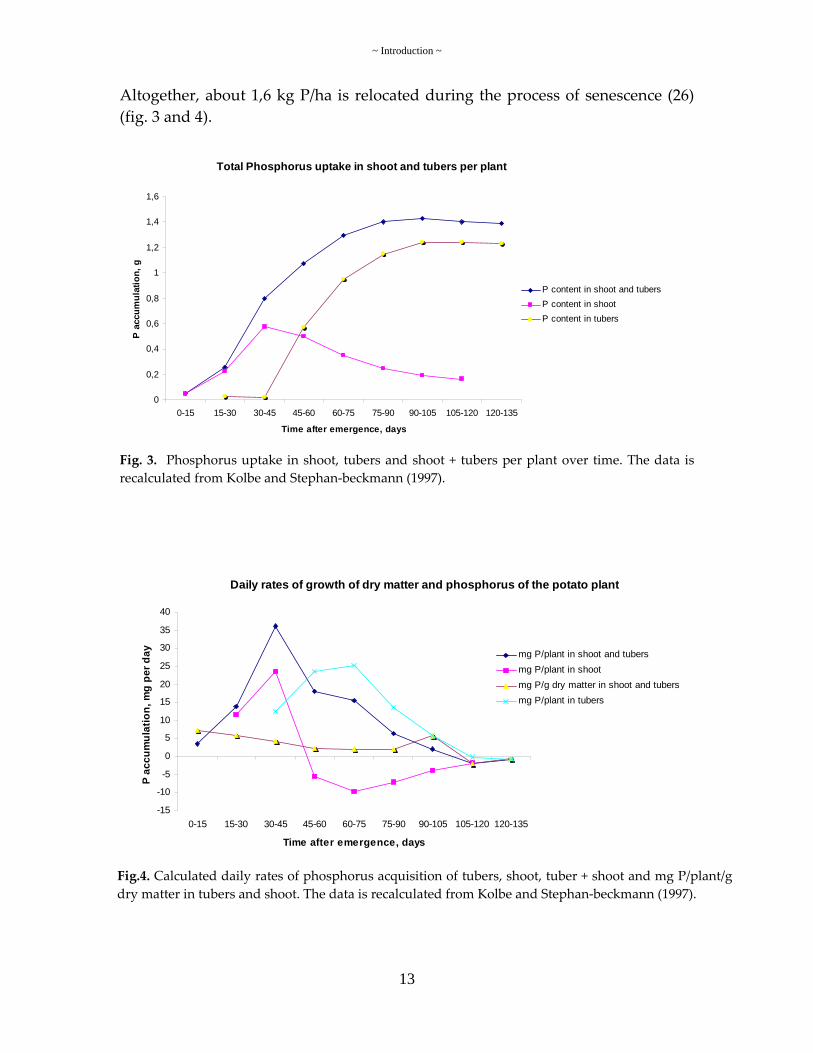
Altogether, about 1,6 kg P/ha is relocated during the process of senescence (26) (fig. 3 and 4).
Total Phosphorus uptake in shoot and tubers per plant
0
0,2
0,4
0,6
0,8
1
1,2
1,4
1,6
0-15 15-30 30-45 45-60 60-75 75-90 90-105 105-120 120-135
Time after emergence, days
P a
ccum
ulat
ion,
g
P content in shoot and tubersP content in shootP content in tubers
Fig. 3. Phosphorus uptake in shoot, tubers and shoot + tubers per plant over time. The data is recalculated from Kolbe and Stephan‐beckmann (1997).
Daily rates of growth of dry matter and phosphorus of the potato plant
-15
-10
-5
0
5
10
15
20
25
30
35
40
0-15 15-30 30-45 45-60 60-75 75-90 90-105 105-120 120-135
Time after emergence, days
P ac
cum
ulat
ion,
mg
per d
ay mg P/plant in shoot and tubersmg P/plant in shootmg P/g dry matter in shoot and tubersmg P/plant in tubers
Fig.4. Calculated daily rates of phosphorus acquisition of tubers, shoot, tuber + shoot and mg P/plant/g dry matter in tubers and shoot. The data is recalculated from Kolbe and Stephan‐beckmann (1997).
~ Introduction ~
14
Previous field studies Many field experiments have been conducted over the last century all over the world trying to find the optimum P fertilization rate for potato. The results from these field trials give even though they are varying a pretty good view over what responses P applications might give. When reading and comparing international recommendations it is important to know that most P fertilizers are reported as P2O5. In this report all data is recalculated from P2O5 to P with the conversion factor 0,44. Grewal & Trehan, (1993) has made a comprehensive collection of data from approximately 60 field experiments made in India over the last 6 decades regarding P fertilization of potato. In these trials the optimum application rates varied from 17‐77 kg P/ha and the yield response was in the range of 1 to 7.7 metric tonnes/ha. The response showed good correlation with soil P levels measured with the Olsen‐P method (14). Alvare´z‐Sánches et al., (1999) tested 13 different P application rates varying from 0 to 207kg P/ha. The experiment was carried out in an Andisol (7.8 mg Olsen P/l) in Mexico. The highest yield‐increase observed was 6000 kg/ha compared to the control with no P, and the optimum P application rate was 90 kg/ha. Oregon State University Extension Service conducted field experiments over a period of time starting in 1999 and lasted through 2004. In these experiments three application rates were tested, 0, 68 and 136kg P/ha. Yield on average increased by 6.7 metric tons/ha if P was added, but the difference was not significant. The experiments were conducted on soils with high P levels (P‐ Olsen 30 mg/l). Hahlin, (1992) investigated the optimum P fertilizer application rate for potatoes on loamy soils (P‐AL 8‐10) in the central parts of Sweden. Three application rates was tested 0, 45 and 90 kg P/ha. A yield increase from 29.05 to 30.00 tonnes /ha were found when application rates was increased from 45 to 90 kg P/ha. The author concluded that optimal application rate more likely was higher than 90 kg P/ha than lower and that the recommendations for potato at current time was adequate. In a summary of 244 field trials Allison et al., (2001) conclude that responses of P fertilizer are most likely to occur on Index 0 and 1 soils (P‐Olsen) and that
~ Introduction ~
15
statistically responses sometimes may occur on Index 3 soils but are highly unlikely.
Determining the optimum P rate Optimum level of P fertilizer application for maximum growth is varying considerably depending on several factors. Some of the most important ones are soil P status, physical and chemical properties, soil water content, variety, and application strategy (23). Since the availability is dependent on so many factors, any general P recommendation is hard give. Therefore, sampling of both soil and tissue is needed to be able to fertilize P with satisfying accuracy.
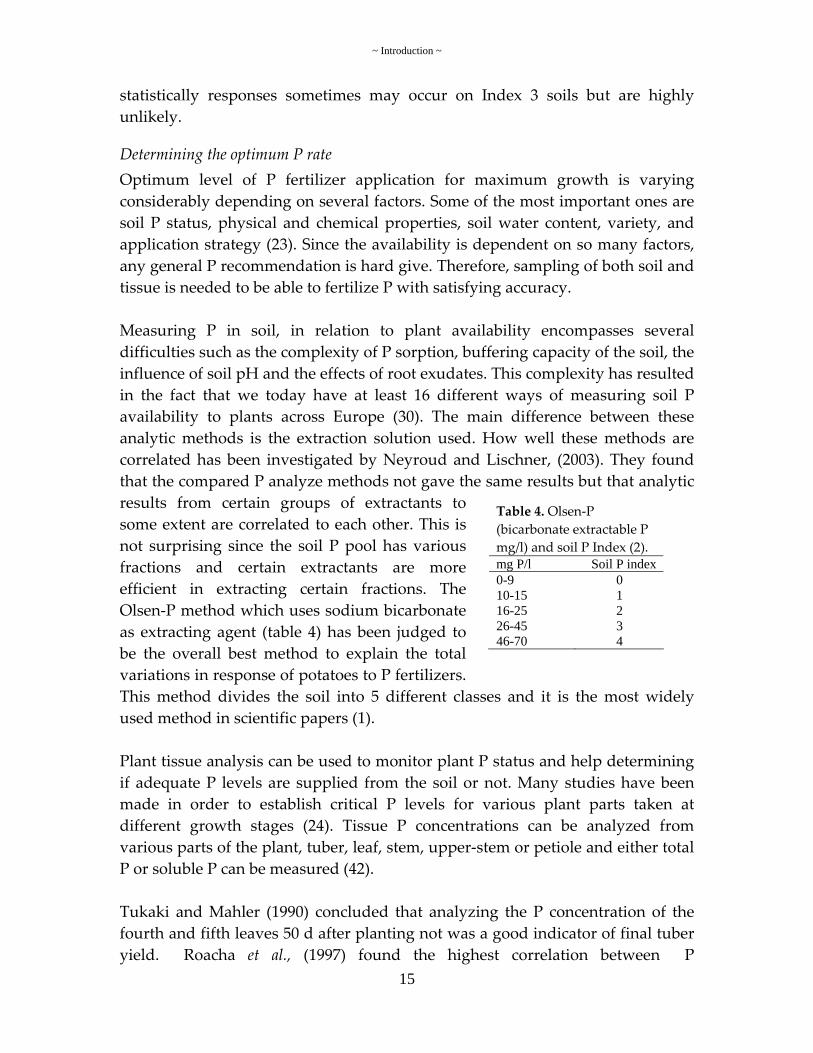
Table 4. Olsen‐P (bicarbonate extractable P mg/l) and soil P Index (2). mg P/l Soil P index 0-9 0 10-15 1 16-25 2 26-45 3 46-70 4
Measuring P in soil, in relation to plant availability encompasses several difficulties such as the complexity of P sorption, buffering capacity of the soil, the influence of soil pH and the effects of root exudates. This complexity has resulted in the fact that we today have at least 16 different ways of measuring soil P availability to plants across Europe (30). The main difference between these analytic methods is the extraction solution used. How well these methods are correlated has been investigated by Neyroud and Lischner, (2003). They found that the compared P analyze methods not gave the same results but that analytic results from certain groups of extractants to some extent are correlated to each other. This is not surprising since the soil P pool has various fractions and certain extractants are more efficient in extracting certain fractions. The Olsen‐P method which uses sodium bicarbonate as extracting agent (table 4) has been judged to be the overall best method to explain the total variations in response of potatoes to P fertilizers. This method divides the soil into 5 different classes and it is the most widely used method in scientific papers (1). Plant tissue analysis can be used to monitor plant P status and help determining if adequate P levels are supplied from the soil or not. Many studies have been made in order to establish critical P levels for various plant parts taken at different growth stages (24). Tissue P concentrations can be analyzed from various parts of the plant, tuber, leaf, stem, upper‐stem or petiole and either total P or soluble P can be measured (42). Tukaki and Mahler (1990) concluded that analyzing the P concentration of the fourth and fifth leaves 50 d after planting not was a good indicator of final tuber yield. Roacha et al., (1997) found the highest correlation between P

~ Introduction ~
16
PetiolePetiole
Fig. 5. Potato leaf sample identification. The immature leaf is the oldest leaf on the flat top. The second leaf is referred to as the most recently matured leaf (45).
concentration in potato plant part and tuber yield for the youngest fully expanded leaf petiole taken 20 d.a.e. (fig. 5.). This procedure for sampling was therefore recommended. At this stage and for this particular experiment the optimum P concentration needed to be kept between 0,557 and 0,574% of dry matter to obtain maximum yield (33). When taking samples it is important select only the youngest fully expanded leaf and to be consistent since P concentration significantly differs between petiole positions (43). Walworth and Muniz, (1993) reviewed current literature regarding the relationship between potato tissue nutrient concentration and yield. They found that optimal petiole P levels are decreasing with time. Early‐season optimal soluble P (PO4 –P) values in petiole tissue were found varying from 0.16 to 0.26%. The optimal mid season values ranged from 0.14 to 0.16% and late season levels should be greater than 0.10%. Adequate total P concentrations in early season were varying from 0.22 to 0.75% of dry matter, in mid season 0.15 to 0.50% and in late 0.14 to 0.50% (41). These figures are based on pre‐planting P applications with no in season application. In central Washington plant testing laboratories recommend maintaining P concentration in the 4th petiole between 0.6 to 0.8% of dry matter; in season applications are recommended if petiole levels drop to approximately 0.4% (45).
Differences in P uptake between varieties Potato cultivars differ in their ability to grow in low P soil (14, 23). These variations can be described as different internal or external P requirements among cultivars. The efficiency in which P is utilized to give yield; the amount needed in the plant to produce one unit of dry weight is called internal P requirement. The external P requirement is defined as the plant P uptake efficiency or roots ability to acquire P from soil and accumulate in the shoot (40). A pot experiment conducted by Trehan & Sharma (2002) showed that both internal and external P requirements of potato cultivars are varying considerably. Jenkins and Ali (1999) found that cultivars with longer growth period had lower P fertilizer demand than early varieties. These results indicate the importance of taking the choice of cultivar in to consideration when planning P applications in potato crop production.

~ Introduction ~
17
Fertilizer application P fertilizer application to the potato crop can be made in several ways, by banding, through fertigation, broadcasting, soaking seed tubers or by spraying liquid fertilizers on to the leaves. Although, the latter two options is mainly for supplementary needs since only small amounts can applied this way (29). The placement of P fertilizer near the active root zone (banding) is the most recommended method since most of the applied P is fixed by the soil and not mobile. Placing the fertilizer reduces the contact with soil, thus avoiding fixation (29). The P uptake use efficiency will therefore increase; which leads to a decreased P fertilization requirement with approximately 50 % (14). Higher tuber yield can be attained if P fertilizers are placed 5 cm to the sides of the seed pieces instead of below or mixed into the ridges (14). Application of P through drip irrigation systems is generally not recommended because of its high clogging potential and limited movement in soil. However, recent studies have shown that P fertilizer use efficiency can be increased by 45% with the use of fertigation compared to broadcasting and with 25% compared to banding (36). Results from the same study shows that leaf area index, dry‐matter accumulation and yield increased when P was applied by drip irrigation compared to a conventionally fertilization techniques. Broadcasting is the least efficient but most widely used application method since high capacity machines, which brings down costs for the application can be used. The fertilizer is spread prior to planting and cultivated into the ridges as they are formed. However, when the fertilizers are mixed into the soil; the fertilizer contact area increase which results in more P being fixed. Grewal & Trehan (1993) cite several references which have reported that soaking of seed tubers in P solutions prior to planting increases tuber yield and P uptake. Soaking of seed tubers was quite effective in meeting partly or even fully the P needs of the crop, depending upon the available status of the soil. Phosphorus can also be foliar‐ applied to the potato crop and is believed to increase tuber number but also the total yield (47, 14). Permeation of P solutes takes place in small (less than 1 nm) hydrophilic pores within the cuticle. These pores are readily permeable to solutes such as urea (radii 0,44nm) but not to larger molecules such as chelates. The rate at which leaves take up mineral nutrients are dependent on the nutrient status of the plant and the concentration applied to the leaf. Climate conditions during daytime is often less favorable for
~ Introduction ~
18
foliar‐ uptake, evaporation coefficient is at that time often higher which results in quicker drying of the sprays on the leaf surface. A survey done by the British Potato Council showed that about 15% of the potato area received applications of foliar‐ P in addition to soil‐applied P. Corresponding figures for Sweden has not been found. Applications of about 2 kg/ha is generally recommended when plant P status is low or when potatoes are grown on low P soil (47). Not all plants are able to take up P through the leaves but potato has been shown to do so (32, 29). In order to increase number of tubers, use of foliar‐ P must increase ground cover and radiation absorption by the time of tuber initiation (1). Tuber initiation occurs when visible tubers can be observed; it follows the tuber induction, which is defined as a swelling of the stolon tip that is twice the diameter of the subtending stolon. Initiation of tubers usually begins some time after emergence and is thought to be completed within 2‐6 weeks of that event (31). Foliar‐ P treatments therefore need to be applied rather soon after plant emergence in order to allow sufficient time to affect crop ground cover. However, crop ground cover at that time is relatively low (2‐32%), because of that most of the foliar‐ P will not be intercepted by the crop canopy but will end up on the soil (1). Allison et al., (2001) tested the effects of foliar‐ applied P on tuber FW yield and number of tubers in six experiments. No significant effects were found on either FW yield or tuber number, despite the fact that two of the experiments were carried out in soils with P Index 0 and all experiments included treatments that had received no soil‐applied P fertilizers. Since the results from foliar‐ applied experiments seem to vary considerably more research is needed to understand the process of P acquisition through the leaves.
The effect of P on tuber quality The main focus of this report has not been on the influence of P on tuber quality, but some results found are stated below. Few scientific reports have been found which actually show that P fertilizer applications are positively correlated with tuber quality. Although, Hahlin & Johnsson (1973) found that P fertilization increased starch concentration and to some extent prevents discoloration of the tubers. Bodin (1983) state that starch concentration not is effected but that P has small negative effects on the boiling properties of the tubers. It also seems like P has positive effects on citric acid production and cell expansion, although the properties of the cell wall remains uneffected.
~ Introduction ~
19
The average tuber size and its variation are characters which can be seen as important quality factors. Since P sometimes affects tuber set, it may be seen as an element contributing tuber quality in this aspect. It seems clear that P effects tuber quality, but more information needs to be collected in order to predict when P deficiency will give negative quality affects.
Environmental aspects of P in potato production The environmental significance of P lies in its dominant role in the eutrophication of aquatic ecosystems and, in particular the Baltic Sea, where it is regarded as the limiting nutrient for primary production. The contribution of agriculture to the total loading of P to waters is estimated to be approximately 30‐50% in Sweden (10, 39). The P leaching potential of mineral soil is generally considered low due to its high retention capacity. However, P loss from agricultural soil is today a fact, and causes serious problems in certain areas (39). The main processes for P losses from agricultural soils to surface waters are erosion, surface runoff, and subsurface transfer. Erosion and surface runoff are mainly a problem in hilly areas where it can cause major P losses (35). There are two situations in particular in which subsurface P leaching occurs. The first is in soils in which water moves by mass flow due to crack formation in e.g. clay soils during dry periods. The second situation is in highly fertilized sandy soils (e.g. soils used for potato production) with low P sorption capacity and a shallow water table (10). The wide use of irrigation together with high P recommendations makes potato to one of our crops with the highest leaching potential.
~ Material and methods ~
20
Material and methods
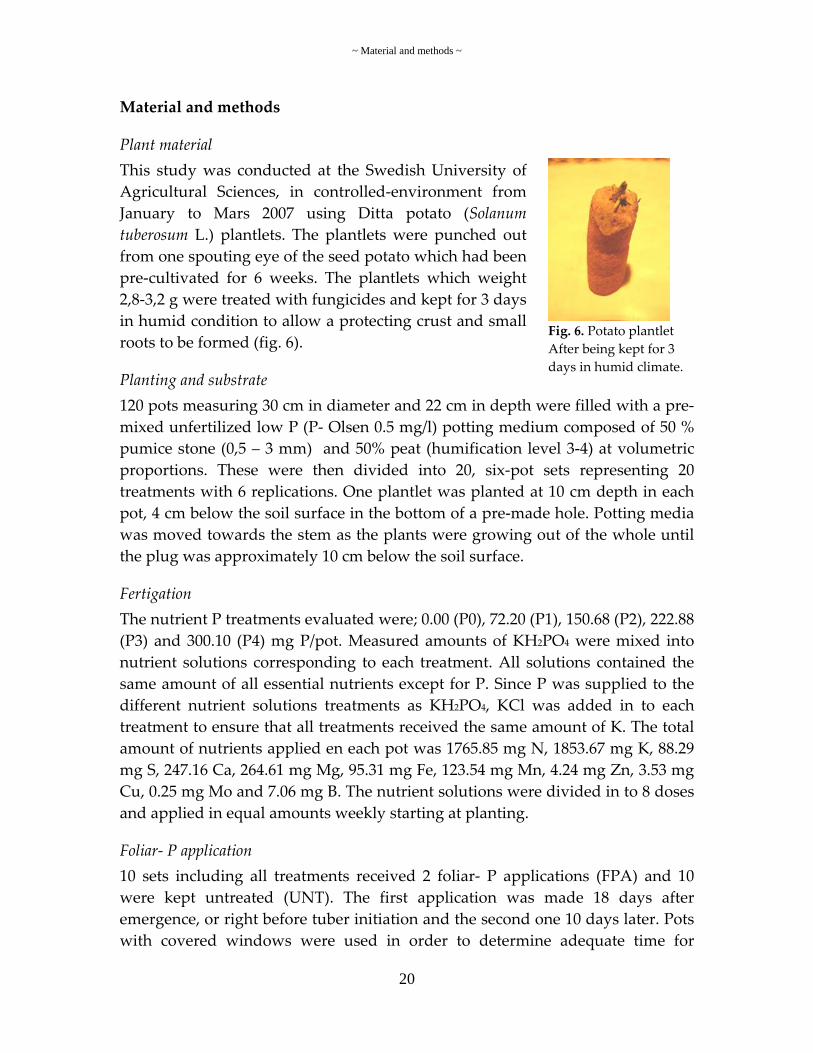
Plant material
Fig. 6. Potato plantlet After being kept for 3 days in humid climate.
This study was conducted at the Swedish University of Agricultural Sciences, in controlled‐environment from January to Mars 2007 using Ditta potato (Solanum tuberosum L.) plantlets. The plantlets were punched out from one spouting eye of the seed potato which had been pre‐cultivated for 6 weeks. The plantlets which weight 2,8‐3,2 g were treated with fungicides and kept for 3 days in humid condition to allow a protecting crust and small roots to be formed (fig. 6).
Planting and substrate 120 pots measuring 30 cm in diameter and 22 cm in depth were filled with a pre‐mixed unfertilized low P (P‐ Olsen 0.5 mg/l) potting medium composed of 50 % pumice stone (0,5 – 3 mm) and 50% peat (humification level 3‐4) at volumetric proportions. These were then divided into 20, six‐pot sets representing 20 treatments with 6 replications. One plantlet was planted at 10 cm depth in each pot, 4 cm below the soil surface in the bottom of a pre‐made hole. Potting media was moved towards the stem as the plants were growing out of the whole until the plug was approximately 10 cm below the soil surface.
Fertigation The nutrient P treatments evaluated were; 0.00 (P0), 72.20 (P1), 150.68 (P2), 222.88 (P3) and 300.10 (P4) mg P/pot. Measured amounts of KH2PO4 were mixed into nutrient solutions corresponding to each treatment. All solutions contained the same amount of all essential nutrients except for P. Since P was supplied to the different nutrient solutions treatments as KH2PO4, KCl was added in to each treatment to ensure that all treatments received the same amount of K. The total amount of nutrients applied en each pot was 1765.85 mg N, 1853.67 mg K, 88.29 mg S, 247.16 Ca, 264.61 mg Mg, 95.31 mg Fe, 123.54 mg Mn, 4.24 mg Zn, 3.53 mg Cu, 0.25 mg Mo and 7.06 mg B. The nutrient solutions were divided in to 8 doses and applied in equal amounts weekly starting at planting.
Foliar‐ P application 10 sets including all treatments received 2 foliar‐ P applications (FPA) and 10 were kept untreated (UNT). The first application was made 18 days after emergence, or right before tuber initiation and the second one 10 days later. Pots with covered windows were used in order to determine adequate time for
~ Material and methods ~
21
application. A dose corresponding to 2,7 kg P/ha (0,0109 g P/plant) was applied with monopotassiumphosphate (KH2PO4) in the first treatment and 2,0 kg P/ha (0,008 g P/plant) in the second. All foliar‐ applications were sprayed by hand until runoff almost occurred using a professional Hardy sprayer. Before spraying, the pots were covered with fabric to protect spraying liquid from reaching the soil. The humidity was brought up to 90% for 4 hours right after all foliar‐ P treatments to allow sufficient time for diffusion uptake to occur.
Irrigation 10 sets including all treatments were during the cultivation period kept at a volumetric soil water content between 0.25 and 0.35 g cm‐3 (dry treatment DT) and 10 sets were kept between 0.35 and 0.45 g cm‐3 (moist treatment MT), starting one week after emergence. Each pot was irrigated individually by weight and allowed to reach its lower limit before distilled water was applied until the upper limit was reached. The pots were standing on trays in order to avoid water and nutrients to flush through.
Climate The plantlets were grown for 10 weeks under 18h daylight with a daytime temperature of 20° C and a night time temperature of 18° C. The humidity was continuously adjusted to 65% and the fluorescent light intensity was 320μmol m‐2 s‐2. All 120 pots were randomly placed in 3 chambers which all were adjusted and controlled to have the same climate conditions.
Analysis The following data were collected from each pot; (1) Fresh weight of shoot and tubers, (2) tuber number, (3) total P taken up by the tubers and the shoot, (4) P concentration in the most recently matured petiole 25 d.a.e. and (5) P‐ level in the substrate after the cultivation period. Tuber number, soil sample and fresh weight of both tubers and shoot were collected at harvest from each individual pot. Tubers smaller than 10 mm were not included in the results. The whole canopy and a sub sample from each tuber was oven dried for 4 days. The samples were then grinded, combusted in nitric acid by means of microwave technique and analyzed for total P concentration.
Statistics Interaction plots and ANOVA General Linear Model with the confident interval set to 95% was used to evaluate the data from the experiment. The program MINITAB 14 was used to study the interactions between the treatments. Plants in the P0 treatment were suffering from severe P deficiency and hardly grew at all; therefore, these plants were excluded from the statistical analysis.
~ Results~
22
Results
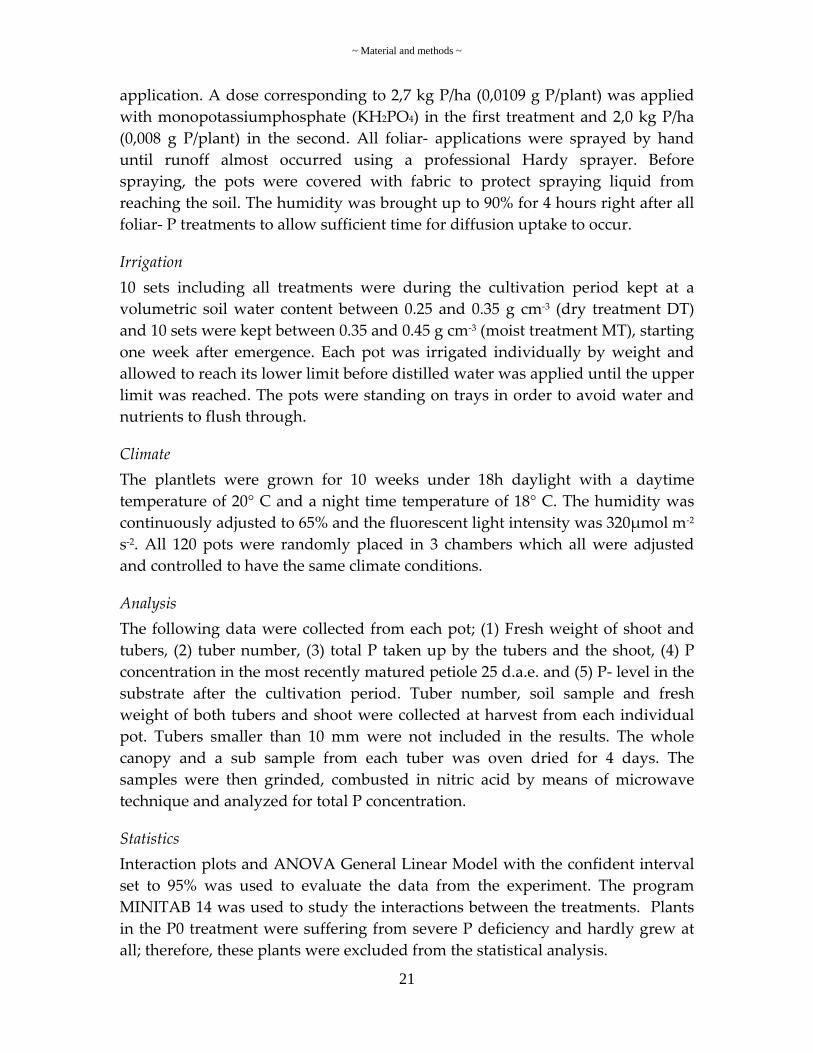
Fig. 7. Overview of plants from all treatments with rising P levels from left to right, starting with P0. The two closest rows are representing the dry treatment and the two rows in the back the moist treatment. The second and fourth row has been treated with foliar P applications.
Visual observations The picture to the right is taken the same day as the plants were harvested and shows one out of the 6 replicates from all 20 treatments. Distinct differences could be seen between P treatments already 3 days after emergence and they became even clearer as the plants were growing (fig. 7). Any effects of the foliar‐ applications or the moist treatments were hard to see. As can be seen on the picture the plants grown with no additional P (to the left) were starting to wilt at the time of harvest.
Vegetative weight All P treatments except for P3 and P4 showed significant effects on total fresh weight of both tubers and shoot (fig. 8 and 9). The moist treatment (MT) gave significant higher yield of both tubers and shoot in all P treatments except for P0 compared to the dry treatment (DT). Foliar‐ P applications (FPA) in average resulted in significantly higher yield of tubers, but only when it was applied to plants in the moist treatment (fig. 8). P1 in the moist treatment was the only one which resulted in significant higher tuber yield (17%) when looking at single treatments. Shoot weight did not increase as a result of foliar‐ P applications for either the dry or the moist soil treatment (fig. 9).

~ Results~
23
Total weight of the shoot at harvest
0,0
50,0
100,0
150,0
200,0
250,0
P0 P1 P2 P3 P4a b c d d
Phosphorus levels
Sho
ot w
eigh
t, g
DT, UNTMT, UNTDT, FPAMT, FPA
Total weight of tubers per pot
0,0
50,0
100,0
150,0
200,0
250,0
300,0
350,0
400,0
P0 P1 P2 P3 P4
a b c d d
Phosphorus levels
Tube
r wei
ght,
g
MT, FPA
MT, UNT
DT, FPA
DT, UNT
A A A A
B
bb
CC
cCc
b
D D
DD
DD
d
Dd
{ { { {d D d D
{ {
{ {
{ {
a a
b B
c C
Total weight of tubers per pot
0,0
50,0
100,0
150,0
200,0
250,0
300,0
350,0
400,0
P0 P1 P2 P3 P4
a b c d d
Phosphorus levels
Tube
r wei
ght,
g
MT, FPA
MT, UNT
DT, FPA
DT, UNT
A A A A
B
bb
CC
cCc
b
D D
DD
DD
d
Dd
{ { { {d D d D
{ {
{ {
{ {
a a
b B
c C
A A A A
B
bb
CC
cCc
b
D D
DD
DD
d
Dd
{ { { {d D d D
{ {
{ {
{ {
a a
b B
c C
Fig. 8. Relationship between P treatments (P0, P1, P2, P3, P4) and total tuber fresh weight per pot at different moisture conditions (DT = dry treatment, MT = moist treatment) and foliar‐ application treatments (FPA = foliar‐ P applications, UNT = untreated). Bars followed by the same letter are statistically similar at the 95% level of probability.
Fig.9. Relationship between P treatments (P0, P1, P2, P3, P4) and total shoot fresh weight per pot at different moisture conditions (DT = dry treatment, MT = moist treatment) and foliar‐ application treatments (FPA = foliar‐ P applications, UNT = untreated). Treatments followed by the same letter are statistically similar at the 95% level of probability.

~ Results~
24
Number of tubers Nutrient P treatments significantly affected the number of potato tubers harvested (table 5). Moist soil condition gave in average significantly more tubers than dry soil conditions. The foliar‐ P applications however, gave no significant effects on tuber number.
Table 5. Average number of tubers produced as a consequence of P application and substrate moist condition. (DT = dry treatment, MT = moist treatment) and foliar‐ application treatments (FPA = foliar‐ P applications, UNT = untreated). Treatment DT, UNT MT, UNT DT, FPA MT, FPA Total average P0 1.0 1.2 1.0 1.0 1.0 d* P1 4.3 4.2 4.8 4.4 4.4 c P2 4.7 6.0 4.5 5.5 5.2 bc P3 6.2 6.5 5.0 5.9 5.9 ab P4 5.5 6.3 6.2 7.0 6.3 a * Average followed by the same letter is statistically similar at the 95% level of probability.
P concentration in the plant Analysis of P concentration in the most recently matured petiole was made 22 d.a.e. in order to correlate petiole P level with yield. The different nutrient P treatments gave a linear response curve to the petiole P concentration and differed significantly from each other in all treatments except for P1 and P2 (fig. 10). P concentrations varied from 0.05% of dry matter in the P0 treatment to 0.45% in the P4 treatment. The different soil moisture conditions and the foliar‐ P applications did not result in any significant differences in the P concentration in the petioles 22 d.a.e..
P concentration in the petiole 22 d. a. E.
0,000
0,050
0,100
0,150
0,200
0,250
0,300
0,350
0,400
0,450
0,500
P0 P1 P2 P3 P4a b c d e
Phosphorus levels
P c
once
ntra
tion
in p
etio
le, %
DT, UNTMT, UNTDT, FPAMT, FPA

~ Results~
25
Fig. 10 Relationship between and P nutrient treatments (P0, P1, P2, P3, P4) and P concentration in the petioles 22 days after emergence at different moisture conditions (DT = dry treatment, MT = moist treatment) and foliar‐ application treatments (FPA = foliar‐ P applications, UNT = untreated). Treatments followed by the same letter are statistically similar at the 95% level of probability. Analysis of the P concentration in the shoot at harvest showed similar linear results as the petiole P analysis taken 22 d.a.e.. As expected these values were lower and ranged from 0.03% in the P0 treatment to 0.18% in the P4 treatment (fig. 11). All P nutrient treatments resulted in significant differences in the concentration of P in the shoots. The foliar‐ P applications gave in average significant higher levels of P. The soil moisture treatments had no significant effect on P uptake into the leaves.
P concentration in the shoot at harvest
0,000
0,020
0,040
0,060
0,080
0,100
0,120
0,140
0,160
0,180
0,200
P0 P1 P2 P3 P4a b c d e
Phosphorus levels
P c
once
ntra
tion
in th
e sh
oot,
%
DT, UNTMT, UNTDT, FPAMT, FPA
Fig. 11. Relationship between P nutrient treatments (P0, P1, P2, P3, P4) and P concentration in the shoots at harvest at different moisture conditions (DT = dry treatment, MT = moist treatment) and foliar‐ application treatments (FPA = foliar‐ P applications, UNT = untreated). treatments followed by the same letter are statistically similar at the 95% level of probability.

~ Results~
26
Analysis of the tubers at harvest shows that all P treatment except for P1 significantly increases the P concentration. Both the foliar‐ P applications and the moist treatment resulted in significantly increased P concentrations in the tubers when looking at all P treatments together. The effect seems to increase with increasing P levels.
P concentration in the tubers at harvest
0,050
0,070
0,090
0,110
0,130
0,150
0,170
0,190
0,210
0,230
0,250
P0 P1 P2 P3 P4a a b c d
Phosphorus levels
P co
ncen
tratio
n in
the
tube
rs, %
DT, UNTMT, UNTDT, FPAMT, FPA
Fig. 12. Relationship between P nutrient treatments (P0, P1, P2, P3, P4) and P concentration in the tubers at harvest at different moisture conditions (DT = dry treatment, MT = moist treatment) and foliar‐ application treatments (FPA = foliar‐ P applications, UNT = untreated). Treatments followed by the same letter are statistically similar at the 95% level of probability.
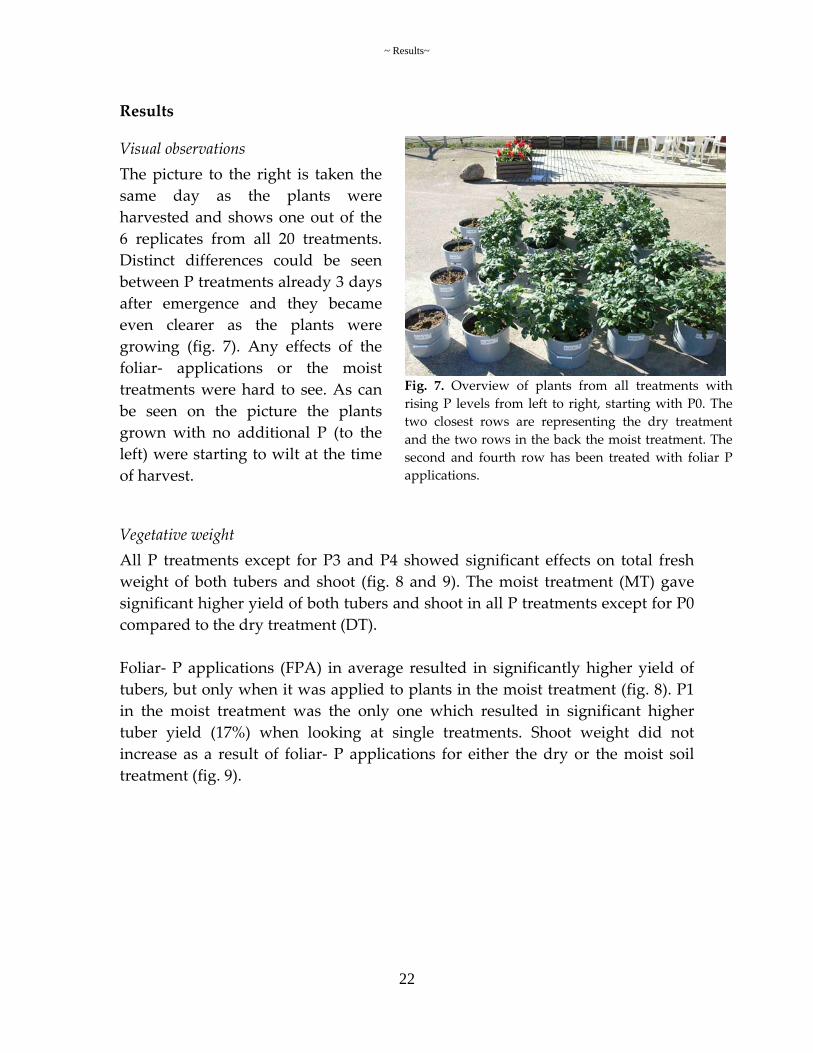
P budget Fig. 13 below shows the total amounts of P applied and were it ended up after the cultivation period. More P is taken up by the plants in both the moist and the foliar‐ P applied treatments. Significantly less P was left in the soil in the moist treatment than in the dry treatment when looking at all P treatments together. No difference in the accumulated soil P pool occurred between the FPA and UNT treatments.
~ Results~
27
P budget
0
0,05
0,1
0,15
0,2
0,25
0,3
DT,
UNT
MT,
UNT
DT,
FPA
MT,
FPA
DT,
UNT
MT,
UNT
DT,
FPA
MT,
FPA
DT,
UNT
MT,
UNT
DT,
FPA
MT,
FPA
DT,
UNT
MT,
UNT
DT,
FPA
MT,
FPA
DT,
UNT
MT,
UNT
DT,
FPA
MT,
FPA
P0 P1 P2 P3 P4 P treatment
Phos
phor
us, g
Total P uptakeFoliar applied PP accumulated in soilSoil applied P
Fig. 13. Relationship between applied P (P0, P1, P2, P3, P4) and P taken up by the plants and accumulated P in the soil at different moisture conditions (DT = dry treatment, MT = moist treatment) and foliar‐ application treatments (FPA = foliar‐ P applications, UNT = untreated) after the cultivation period.
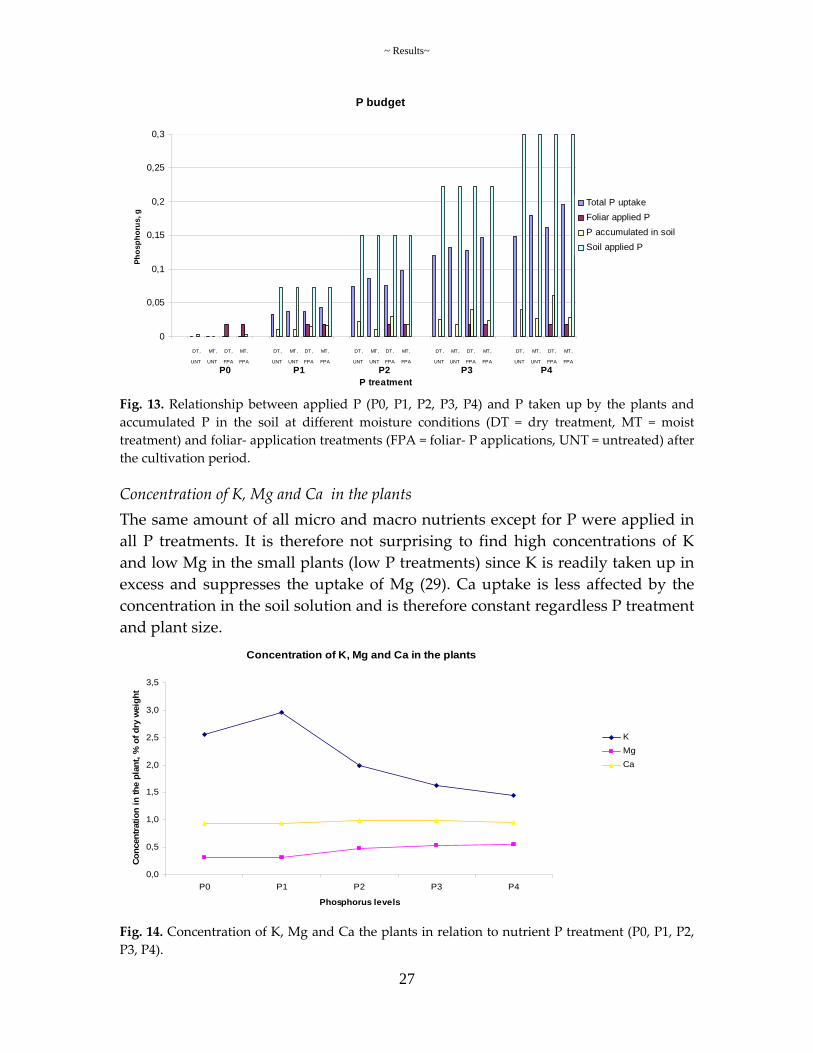
Concentration of K, Mg and Ca in the plants The same amount of all micro and macro nutrients except for P were applied in all P treatments. It is therefore not surprising to find high concentrations of K and low Mg in the small plants (low P treatments) since K is readily taken up in excess and suppresses the uptake of Mg (29). Ca uptake is less affected by the concentration in the soil solution and is therefore constant regardless P treatment and plant size.
Concentration of K, Mg and Ca in the plants
0,0
0,5
1,0
1,5
2,0
2,5
3,0
3,5
P0 P1 P2 P3 P4
Phosphorus levels
Conc
entra
tion
in th
e pl
ant,
% o
f dry
wei
ght
KMgCa
Fig. 14. Concentration of K, Mg and Ca the plants in relation to nutrient P treatment (P0, P1, P2, P3, P4).

~ Discussion~
28
Discussion
P nutrient treatments It is apparent that the growth of both tubers and shoots increased with increasing P treatment up to the P3 (0.223 g P/pot) level (fig. 8 and 9). Increasing the nutrient P treatment beyond 0.223 g P/pot did not increase the weight of tubers and shoots further. However, the P concentration in the shoot, in the tubers and in the most recently matured petiole 22 d.a.e. increased linear with increasing P treatment (fig. 10, 11, 12). The results shows that there is a correlation between P levels in the plant and nutrient P treatments and that increasing P concentration in the potato plant results in higher yields up to a certain level. According to table 5 no significant differences were found in number tubers between treatment P2 and P3, however, P2 significantly differed from P4. P concentration in the petiole 22 d.a.e. corresponding to treatment P3 can be regarded as optimum since no significant differences occurred between P3 and P4. This result indicates that the petiole P concentration needs to be kept higher for maximum tuber number than for maximum tuber yield. That is in contradiction to other experiments which indicates that relatively low concentrations of P will give maximum number of tubers and that optimum concentration for tuber set is lower than for yield (38). However, quite high variations were observed within each treatment which renders uncertainties to this result. Further on, the plants were harvested already 70 d.a.e when final tuber number may not have been set yet (31). Differences between varieties may be another reasonable explanation for the varying results. If recommendations based on this experiment should be given, petiole P concentration analyzed approximately 20 d.a.e should be kept between 0.25 and 0.30% to allow maximum tuber number and to avoid any yield loss. These results are well correlated with earlier findings from field experiments (41).
Soil moisture Moist soil conditions (0.35 to 0.45 g cm‐3) gave significant higher yield of tubers, shoots and number of tubers than the lower soil moisture treatment (0.25 to 0.35 g cm‐3) (fig. 8, 9 and table 5). Analysis of the tubers at harvest showed significantly higher concentrations of P in the moist treatment. The soil sample confirmed that more P had been taken up from the moist soil (fig. 13) than from the dry. These results show that high soil moisture conditions improve the P availability and suggest that increased P uptake might be one of the factors contributing to higher yields at high uniform soil moist conditions.

~ Discussion~
29
Earlier studies by Linnér (1984) have shown that P concentration in the plant can be increased from 0.18 to 0.25% by increasing soil moisture. The increased P uptake as a result of higher soil moisture, as discussed in a previous section of this report (page 9) has several possible explanations. Increased diffusion coefficient, root exploration, and enhanced activity of the microorganisms are probably the most important factors. Since we in this experiment used a substrate with low biological activity and low P content it is unlikely to believe that solubilization or mineralization caused by microorganisms has contributed to any major increases of P uptake in the moist treatment. The fact that a porous substrate was used which did not restrict root growth even though it is dry, leaves the increased diffusion coefficient as the most probable cause for the increased P uptake. It is likely to believe that the benefit of high soil moisture on P uptake is even greater when potatoes are grown under field conditions due to enhanced root exploration and micro biotic activity. It is therefore strongly recommended to sustain the soil moisture at an adequate level as described in earlier papers (13) not only to maximize yield but also to minimize the need for P fertilizers. More research is needed in this area to be able to give specific P fertilizer recommendations for irrigated versus unirrigated fields.
Foliar‐ P applications The only significant effect of the foliar‐ P applications was on tuber yield when applied to plants grown under moist conditions (fig. 8). The significant higher P level in the shoots and tubers at harvest indicates that the yield increase might be due to increased P uptake as an effect of foliar‐ application. This is an interesting result since it puts the soil moisture as an important factor for P uptake through leaves. Surprisingly, no significant differences in P concentration in the petioles were found in the analysis made 22 d.a.e.. One likely cause for that is the low petiole sampling number which caused large standard deviations. Another possible explanation is the fact that only a small part of the plant was harvested quite near the time of application. Further on, the amount of P applied through foliar‐ application were quite low (0.018 g P/plant or 2x2 kg P/ha) and might been translocated in to the roots (29), therefore, differences caused by this kind of treatments might be hard do detect by only sampling the petioles. The higher P concentration in the tubers of the plants treated with foliar‐ P applications compared to the untreated confirms that P has been taken up through the leaves and been translocated into the tubers.

~ Discussion~
30
Another unexpected result was that foliar‐ P applications seemed to increase yield (not significant) of tubers even in the high nutrient P treatments (fig. 8); although, significant yield increases of the tubers only occurred in the P1 treatment. These results indicate that P uptake rate at some point has exceeded the ability of soil to support the plant with P. Plants which received foliar‐ applications had at that point a higher internal P buffer and sub sequentially grew better. It is likely to believe that this occurred around 30‐45 d.a.e when P uptake rates generally are the highest (fig. 4). This demonstrates the dynamic picture of P uptake in plants and the importance of understanding the complexity of P cycling. Nutrient application and uptake is generally looked upon as quantitative; a certain amount is applied to support a specific yield. However, what actually is important is the P uptake rate of the plant and how well it is correlated with the soil capacity to support the crop. P exists in large amounts in the soil and is released through solubilization and mineralization in many cases in sufficient quantities to support normal crop production. However, under specific conditions or under a certain stage of development e.g. low soil P levels, dry or cold soil conditions or at development stage 30‐45 d.a.e when P uptake rate at its maximum; might greater quantities of fertilizers be needed in order to sustain normal plant growth. Since fertilizer P commonly is broadcasted and mixed into the soil almost 60 days before this event large quantities might, depending on soil properties be needed to avoid yield losses. Shoot weight was unaffected by the foliar‐ P application (fig. 9) which indicates, in a slight contradiction to what Allison et al., (2001) suggested that tuber yield could be positively affected without an increase of the leaf area. However, it is possible that the leaf area increased without effecting foliage weight or that a difference in leaf area has occurred during some part of the growing period (22). Tuber number was not significantly affected by the foliar‐ applications. High variations in tuber number within treatments and small concentration increases as affected by foliar‐applications are possible explanations for this result. Previous experiments with foliar‐ P applications show varying results. Our experiment explains some of that variation and shows that only small beneficial effects can be expected from such treatment. This experiment shows that it is possible to improve the P status of the potato plant by applying P to the leaves. However, only well watered plants with petiole P concentrations lower than 0.2% measured 22 d.a.e. showed any significant effect on tuber yield. Foliar‐ P application can therefore only be recommended as a supplementary treatment when petiole P levels are critically low. In those cases yield might increase with about 17 % but will still be significantly lower than if adequate levels were

~ Discussion~
31
supplied in time. Any significant increase in tuber number as a result of foliar‐ P applications are unlikely.
Swedish P fertilizer recommendations for potato The P fertilizer recommendations for potato crop production today are mainly based on experiments made by Hahlin in the years between the 1950ies and 1970ies. These experiments were well planned and gave a relative clear view of how P fertilizers are distributed in soil over time in different types of crops. However, the P trials regarding potatoes were somewhat limited since only three fertilizer levels were tested 0, 45 and 90 kg P/ha. The results from that study show similar pattern as my results and many others (both international and national); that the yield increases rapidly with small amounts of P added but flattens out rather quickly. Increasing fertilizer rates from 0 to 45 kg P/ha gave on average 2.5 metric tonnes higher yield per ha; further increases from 45 to 90 kg P/ha gave less than 1 metric ton yield increase per ha. The rather low yields (26.6 to 30 metric tonnes per ha) indicates that the trials were not irrigated. These trials were carried out on fields with P‐AL values of 8 to 10 mg P/100g soil (index between III and IV). Since the higher P fertilizer rate (90 kg/ha) paid for itself it was recommended; however, this dose was supposed to support the following two crops. Experiments made by Biärsjö (1988) showed almost the same pattern; yield increased with approximately 9 tonnes per ha when P fertilizer application was increased form 0 to 40 on the index III soil (table 6). Increasing the application rate further to 120 kg P per ha resulted in yield increases with less than one metric tone per ha. Results from the index 5 soil show only small yield increases when additional P is applied (table 6). These results shows that when P levels are at concentrations which adequately support plant health, large increases in phosphorus application rate to support increased yields and tuber set are unnecessary. Worth mentioning is that the author discussed a reduction in the P fertilizer recommendations but asked for more research results before such recommendation could be given. Results such as those presented in this report. Table 6. Shows the yield response of P fertilizer applications at soils with different P‐ AL values.
Tuber yield ton/ha at different soil P‐ AL values Kg P/ha 4.2 (index II) 7.8 (index III) 18.2 (index V)
0 41.4 48.8 46.6 40 46.9 57.9 48.3 80 48.9 55.1 49.9 120 53.0 58.8 48.8
~ Discussion~
32
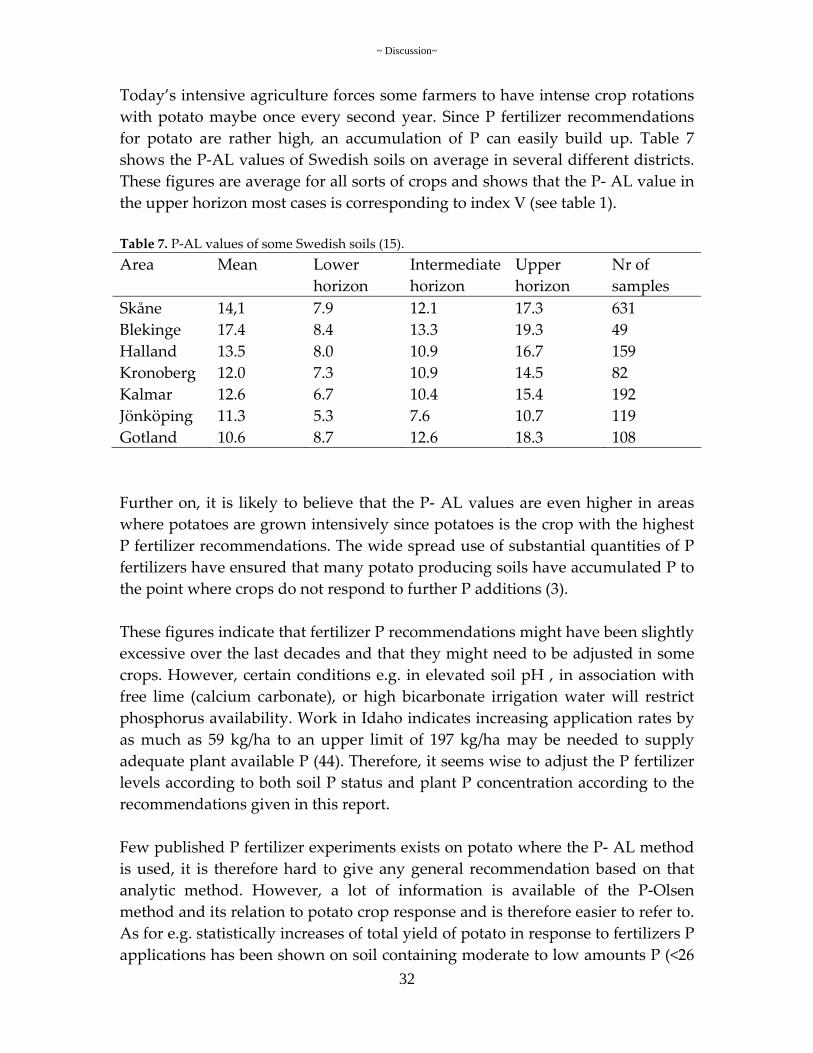
Today’s intensive agriculture forces some farmers to have intense crop rotations with potato maybe once every second year. Since P fertilizer recommendations for potato are rather high, an accumulation of P can easily build up. Table 7 shows the P‐AL values of Swedish soils on average in several different districts. These figures are average for all sorts of crops and shows that the P‐ AL value in the upper horizon most cases is corresponding to index V (see table 1). Table 7. P‐AL values of some Swedish soils (15). Area Mean Lower
horizon Intermediate horizon
Upper horizon
Nr of samples
Skåne 14,1 7.9 12.1 17.3 631 Blekinge 17.4 8.4 13.3 19.3 49 Halland 13.5 8.0 10.9 16.7 159 Kronoberg 12.0 7.3 10.9 14.5 82 Kalmar 12.6 6.7 10.4 15.4 192 Jönköping 11.3 5.3 7.6 10.7 119 Gotland 10.6 8.7 12.6 18.3 108 Further on, it is likely to believe that the P‐ AL values are even higher in areas where potatoes are grown intensively since potatoes is the crop with the highest P fertilizer recommendations. The wide spread use of substantial quantities of P fertilizers have ensured that many potato producing soils have accumulated P to the point where crops do not respond to further P additions (3). These figures indicate that fertilizer P recommendations might have been slightly excessive over the last decades and that they might need to be adjusted in some crops. However, certain conditions e.g. in elevated soil pH , in association with free lime (calcium carbonate), or high bicarbonate irrigation water will restrict phosphorus availability. Work in Idaho indicates increasing application rates by as much as 59 kg/ha to an upper limit of 197 kg/ha may be needed to supply adequate plant available P (44). Therefore, it seems wise to adjust the P fertilizer levels according to both soil P status and plant P concentration according to the recommendations given in this report. Few published P fertilizer experiments exists on potato where the P‐ AL method is used, it is therefore hard to give any general recommendation based on that analytic method. However, a lot of information is available of the P‐Olsen method and its relation to potato crop response and is therefore easier to refer to. As for e.g. statistically increases of total yield of potato in response to fertilizers P applications has been shown on soil containing moderate to low amounts P (<26

~ Discussion~
33
mg Olsen‐P/L). The response on index 2 and 3 soil however, seems to vary. Allison et al. 2001 concluded that this method not always is a reliable predictor of the P fertilizer requirement; e.g. when index 2 conditions occur. The Olsen‐P method of sampling may therefore be improved by including soil properties such as, pH, texture, carbonate content or P sorption capacity. Other factors such as rooting depth and irrigation may also be included to further improve fertilizer recommendation. Finally, phosphorus fertilizer costs are not decisive in the total budget of potato production but it is for obvious reasons unwise to create excessively high soil P statuses which only lead to higher leaching potential and no further increases in yield. Considering the risk of excessive P enrichment in the environment and the relative scarcity of P deficiency in cultivated crops throughout Europe, a reduction of the P fertilizer recommendations might be considered and justified by the fact that many soils actually contain more available P than plant needs.
Acknowledgements I would like thank all the people that helped and inspired me in this project. Special thanks to my supervisor Håkan Asp, external principal Harry Linnér and to my examiner Gunnar Svensson which all contributed with a lot of valuable information. I would also like to thank my sponsors, AnalyCen, Bara mineraler, Greppa Näringen, LRF, Partnerskap Alnarp and Stora Tollby Trädgård AB for making this project possible. Finally I would like to thank Johannes Albertsson and Alexandra Nikolic for practical assistance with maintenance of the plants and also thanks to the staff in the Biotron for skilful technical assistance.

~ Acknowledgements ~
34
References 1. Allison J. H., J. H. Flower, E. J. Allen, 2001. Effects of soil‐ and foliar‐ applied phosphorus fertilizers on the potato (Solanum tuberosum) crop. J agri sci. 137:379‐395. 2. Alvarez‐Sánches E., J. D. Etchevers, J. Ortiz, R. Núnez, V. Volke, L. Tijerina, A. Martinez, 1999. Boimass production and phosphorus accumilation of potato as affected by phosphorus nutrition. J. of plant nutr. 22:205‐217. 3. Arvid M., M. Singh, 1983. Effects of irrigation, nitrogen and phosphorus levels on the growth, development and yield of potato tuber. Indian J. agric. Res. 17:184‐188. 4. Bennett W. F., 1993. Nutrient deficiencies & toxicities in crop plants. APS Press USA. 202pp. 5. Bertilsson G., H. Rosenqvist L. Mattsson, 2005. Fosforgödsling och odlingsekonomi med perspektiv på miljömål. Naturvårdsverket, Rapport 5518. 58p 6. Bhadoria P., J Kaselowsky, N. Claassen, A. Junka, 1991. Soil Phosphate diffusion‐coefficients‐their dependence on posphorus concentration and buffer power. Soil Sci. Soc. of Am. J 55:56‐60. 7. Birch J. A., J. R. Devine, M. Holmes, R. J. M., J. D. Whitear, 1967. Field experiments on the fertilizer requirements of main crop potatoes. J. agri. Sci. Cambridge. 69:13‐24. 8. Biärsjö J., 1989. Fosfor och kaliumgödsling till potatis. Skånsk potatisodling. 4:66‐70. 9. Bodin, B. 1983. Utvecklingsförlopp och kvalitetsetablering hos potatis. Institutionen för växtodling, Sveriges Lantbruksuniversitet, Rapport 125, Uppsala. 10. Börling K., 2003. Phosphorus Sorption, Accumulation and Leaching. Acta Universitatis Agriculturae Sueciae. SLU, Agraria 428. 11. Cooke G. W., 1982. Fertilizing for maximum yield, Third Edition. London: Granda.

~ Acknowledgements ~
35
12. Covarrubias‐Ramírez J.M., S. Castillo‐Aguilar, J. A. Vera‐Núñez, 2005. Phosphorus uptake and use efficiency by potato cultivar Alpha using 32P. Agrociencia 39:127‐136. 13. Ekelöf E. J., A. T. Wiklund, 2006. Droppbevattningens inverkan på kvalitet och kvantitet hos Solanum tuberosum L, i jämförelse med konventionell spridarebevattning. Inst. Landskaps‐ och trädgårdsteknik. Rapport 2006:3 14. Grewal J. S., S. P. Trehan, 1993. Phosphorus and potassium nutrition of potato. (in) Advances in horticulture, Vol. 7. pp 261‐298. 15. Gustavsson K., M. Söderström, 2006. Fosfortillståndet I sydsvenska jordar. Rapport från växtodlings‐ och växtskyddsdagar i växsjö. Medelande från södra jordbruksförsöksdistriktet. No. 59 16. Hack H., H. Gall, Th. Klemke, R. Klose, U. Meier, R. Straul3 & A, Witzenberger, 1993. Phänologische Entwicklungsstadien der Kartoffel (Solanum tuberosum L.). Deutscher Pflanzenschutzdienst 45:11‐19. 17. Hahlin M., 1992. Fosfor till potatis och efterföljande grödor. Ingår i SpoR Potatisodlaren. v. 10(3) pp. 42‐43 18. Hahlin M., J. Ericsson, 1981. Fosfor och fosforgödsling. Aktuellt från lantbruksuniversitetet nr 294. 19. Hannapel D. J., H., Chen, F. M. Rosin, A. K. Banerjee, P. J. Davies, 2004. Molecular controls of tyberization. Amer. J. Of potato res. 81:263‐274. 20. Harris P.M. 1992. The Potato Crop: The scientific basis for improvement. Second edition. Chapman & Hall, London. 909pp. 21. Horneck D. A., 2005. P and K in potatoes. Western Nutrient Management Conference. Salt Lake City, UT. Vol. 6. pp 108‐113. 22. Jenkins P. D., H. Ali, 1999. Growth of potato cultivars in response to applications of phosphate fertilizer. Ann. Appl. Biol. 135:431‐438. 23. Jenkins P. D., H, Ali, 2000. Phosphate supply and progeny tuber numbers in potato crops. Ann. appl. Biol. 136:41‐46.

~ Acknowledgements ~
36
24. Khiari L., L. E. Parent, N. Trembley, 2001. The phosphorus Compositional Nutrient Diagnosis range for potato. Agron. j. 93:815‐819. 25. Kolbe H., S. Stephan‐Beckmann, 1997. Development, growth and chemical composition of the potato crop (Solanum tuberosum L.). I. leaf and stem. Pot. Res. 40:111‐129. 26. Kolbe H., S. Stephan‐Beckmann, 1997. Development, growth and chemical composition of the potato crop (Solanum tuberosum L.). Tuber and whole plant. Pot. Res. 40:135‐153. 27. Lennartsson N., 1988. Bladanalys – Gödslingsintensitet. Medd. Medelande från fabrikspotatiskommitén. Nr 25. 28. Linnér H., 1984. The influence of soil moisture on evapotranspiration, growth, nutrient uptake, yield and quality of the potato (Solanum tuberosum L.). Swedish University of Agricultural Sciences, Department of soil Sciences. Report 142. 29. Marchner H. 1995. Mineral Nutrition of Higher Plants, second edition. Academic press inc, Sand Diego. 889pp. 30. Neyroud J. A., P. Lischner, 2003. Do different methods used to estimate soil phosphorus availability across Europe give comparable results? J. Plant nutr. Soil sci. 166:422‐431. 31. O´Brien P. J., E. J Allen, D. M. Firman., 1998. A rewiew of some studies into tuber initiation in potato (Solanum tuberosum L.) crops. J. agri. Sci. Cambridge. 130:251‐270. 32. Prasad M., A. J. Brereton, 1970. A comparison of the effects of foliar‐ applied and soil‐applied phosphatic fertilizers on crop yields. Irish J. Agri. Res. 9:401‐414. 33. Rocha F. A. T., P. C. R. Fontes, R. L. F Fontes, F. P. Reis., 1997. Critical phosphorus concentrations in potato plant parts at two growth stages. J. of plant nutr. 20:573‐579. 34. Rowe R. C., 1993. Potato Health Management. The American Phytopathological Society, Minnesota ,USA. 178 ff 35. Sims J. T., A., N. Sharpley, 2005. Phosphorus: Agriculture and the environment. American Society of Agronomy, Inc, Wisconsin USA. 1121pp.
~ Acknowledgements ~
37
36. Singh H., N. K. Narda, J. K. Chawla, 2004. Efficiancy of phosphorus through trickle fertigation of potato (Solanum tuberosum). Indian J. Agric. Sci. 74:476‐8. 37. Sylvia D. M., J. J. Fuhrmann, P. G. Hartel, D. A. Zuberer, 2005. Principles and Applications of Soil Microbiology. Pearson Education Inc., Upper saddle River, New Jersey. 640pp. 38. Tukaki J. L., R. L. Mahler., 1990. Evaluation of nutrient solution phosphorus concentration in plantlet tuber production under greenhouse condition. J. of plant nutr. 13(1) 149‐168. 39. Tunney H., O. T. Carton, 1997. Phosphorus loss from soil to water. CAB INTERNATIONAL. New York. 467p. 40. Trehan S. P., R. C. Sharma, 2002. External phosphorus requirements of different potato (Solanum tuberosum) cultivars resulting from different internal requirements and uptake efficiencies. Indian J. Agric. Sci. 73:54‐56. 41. Walworth J. L., J. E. Muniz, 1993. A compendium of tissue nutrient concentrations for field‐grown potatoes. Amer. Pot. J. 70:579‐597. 42. Westermann D. T., G. E. Kleinkopf, 1985. Phosphorus Relationships in Potato Plants. Agron. J. 77:490‐494. 43. Westermann D. T., S. M. Bosma, M. A. Kay, 1994. Nutrient concentration relationships between the fourth petiole and upper‐stem of potato plants. Amer. Pot. J. 71:817‐829.
Electronic references 44. Hopkins B., Ellsworth J., 2005. Phosphorus Availability in Alkaline or Calcareous Soil. Idaho Grower News from the University of Idaho Extension System. [online] cited January 22th 2007, revised 2005. <URL Available at the internet http://isnap.oregonstate.edu/WCC103/2005_Proccedings/Hopkins%20Phosphorus%20pg88 pdf > 45. Lang N. S., R.G. Stevens, R. F. Thornton, W. L. Pan, S. Victory, 1999. Washington state university. 18 pp [online] cited January 24th 2007, revised

~ Acknowledgements ~
38
February 1999. <URL Available at the internet http://cru84.cahe.wsu.edu/cgi‐bin/pubs/EB1871.html> 46. Yara. Gödslingsrekommendationer för potatis. [online] cited Mars 20th 2007, revised 2006 Available at the internet <URL http://fert.yara.se/se/crop_fertilization/crop_advice/agriculture/potatoes/potatoes.html>
Personal contacts 47. Månsson I., 2007. AB Lennart Månsson International. personal com. E‐mail [email protected]