Analysis of Video Conferencing on LTE Network witˇOPNET...
36
Analysis of Video Conferencing on LTE Network with OPNET 16.0 School of Engineering Science Simon Fraser University ENSC 427, Spring 14, Team 08 http://www.sfu.ca/~kjavanma/ April 9 th , 2014 Petar Arnaut 301095130 Kamyar Javanmardi 301120403 Janine Li 301132839 1
Transcript of Analysis of Video Conferencing on LTE Network witˇOPNET...
Analysis of Video Conferencing on
LTE Network with OPNET 16.0
School of Engineering Science
Simon Fraser University
ENSC 427, Spring 14, Team 08
http://www.sfu.ca/~kjavanma/
April 9th , 2014
Petar Arnaut 301095130
Kamyar Javanmardi 301120403
Janine Li 301132839
1
Roadmap• Introduction• Scope of the Project• Simulation Design• Analysis• Conclusions, Challenges, and Future
Work• References
2

Introduction• Why LTE (Long-Term Evolution)?
� Definition [1]� Advantage [2]� Economic growth [3]
• Why ?
� More simulation features than other simulators� Ability to access with a wide range of available
standards and vendors� Used by large companies
3

4
Introduction• Video Conference
� Video frame inter-arrival rates range from 10 fps to 30 fps
� Sent bit rate is constant
� Classify the quality of video content by some factors such as frame inter-arrival rate and pixel color depth

Roadmap• Introduction• Scope of the Project• Simulation Design• Results Analysis• Conclusions, Challenges, and Future
Work• References
5
6
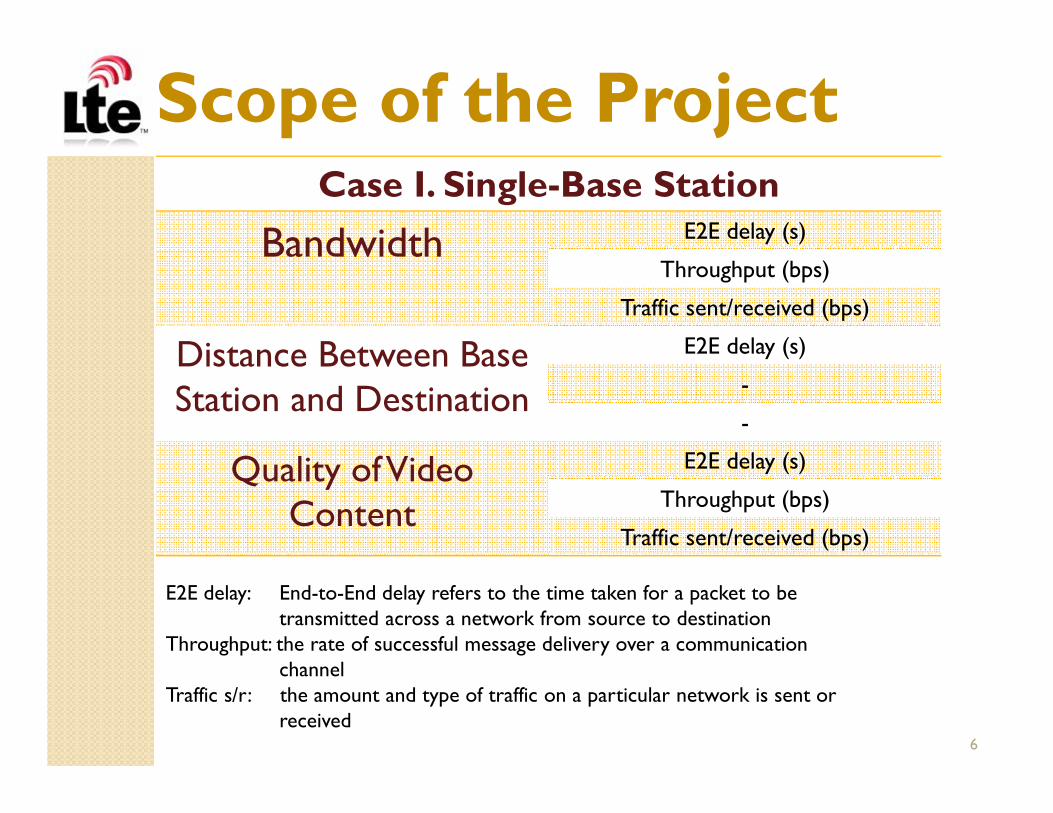
Scope of the ProjectCase I. Single-Base Station
Bandwidth E2E delay (s)
Throughput (bps)
Traffic sent/received (bps)
Distance Between Base Station and Destination
E2E delay (s)
-
-
Quality of Video Content
E2E delay (s)
Throughput (bps)
Traffic sent/received (bps)
E2E delay: End-to-End delay refers to the time taken for a packet to be transmitted across a network from source to destination
Throughput: the rate of successful message delivery over a communication channel
Traffic s/r: the amount and type of traffic on a particular network is sent or received

7
Scope of the Project
Case II. Multiple-Base Stations
vs. Single Base Station E2E delay (s)
Throughput (bps)
Traffic sent/received (bps)
Single User vs. Multiple Users
E2E delay (s)
Throughput (bps)
-
E2E delay: End-to-End delay refers to the time taken for a packet to be transmitted across a network from source to destination
Throughput: the rate of successful message delivery over a communication channel
Traffic s/r: the amount and type of traffic on a particular network is sent or received

Roadmap• Introduction• Scope of the Project• Simulation Design• Results Analysis• Conclusions, Challenges, and Future
Work• References
8

9
Simulation DesignCase I - Scenario 1 (Bandwidth)
1. Single Base-Station (eNodeB) with PHY efficient mode2.Traffic sent and received between user1 and user 23. Vary LTE bandwidth from 1.4MHz, 5MHz,10MHz and 20MHz
user1
user2eNodeB
EPC (Evolved Packet Core)
- Multi-Megabit BW
- Latency reduction
- Improved mobility

10
Simulation DesignCase I – Scenario 2 (Distance)
Distance between eNodeB and destinationrang from 0.5 km
Type A: corresponds to hilly terrain with moderate-to heavy tree densities

11
Simulation DesignCase I – Scenario 2 (Distance)
Distance between eNodeB and destinationrang from 0.75 km

12
Simulation DesignCase I – Scenario 2 (Distance)
Distance between eNodeB and destinationrang from 1 km

13
Simulation DesignCase I – Scenario 2 (Distance)
Distance between eNodeB and destinationrang from 1.5 km

14
Simulation DesignCase I – Scenario 3 (Video Quality)
Quality of Video Content Bandwidth(MHz)
Low 20
Low 10
High 20
High 10
15
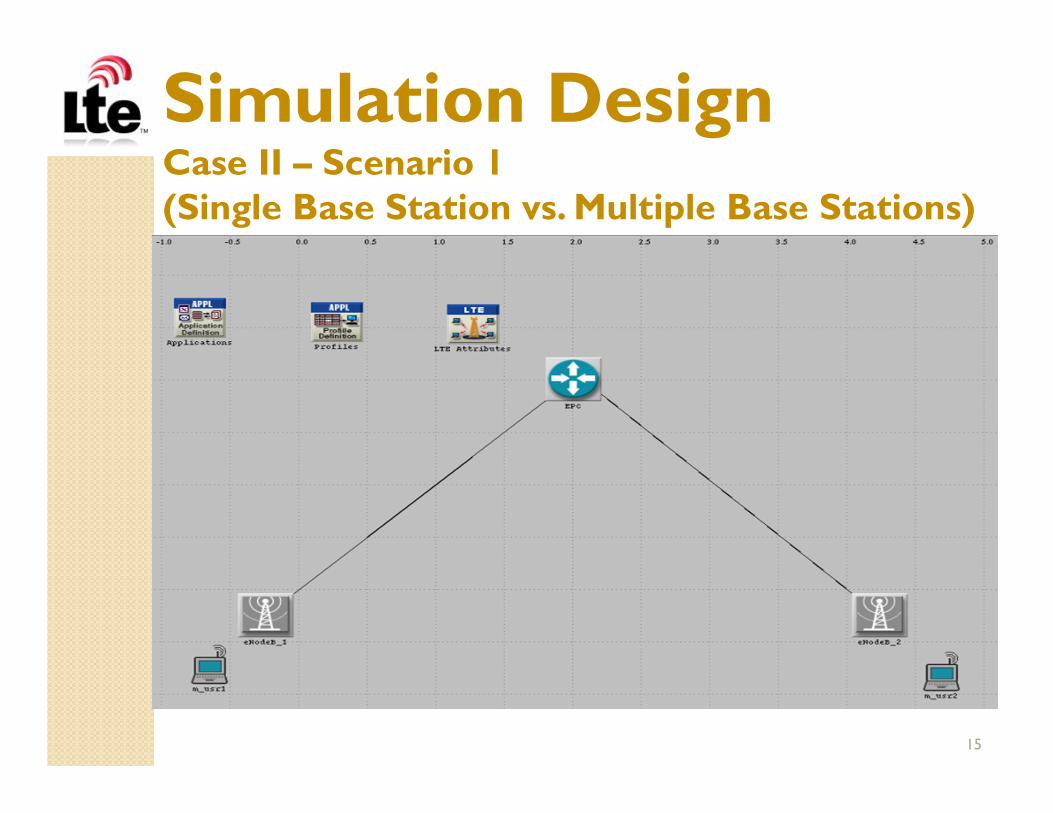
Simulation DesignCase II – Scenario 1(Single Base Station vs. Multiple Base Stations)

16
Simulation DesignCase II – Scenario 2 (Multiple Base Stations single user vs. multiple users)
2 BS with 1 user 2 BS with 3 users

Roadmap• Introduction• Scope of the Project• Simulation Design• Results Analysis• Conclusions, Challenges, and Future
Work• References
17

18
Results AnalysisCase I – Scenario 1– E2E delay
Bandwidth (MHz)
E2E delay at peak (s)
1.4 ≈ 22
5 ≈3.8
10 ≈3.4
20 ≈0.036
19
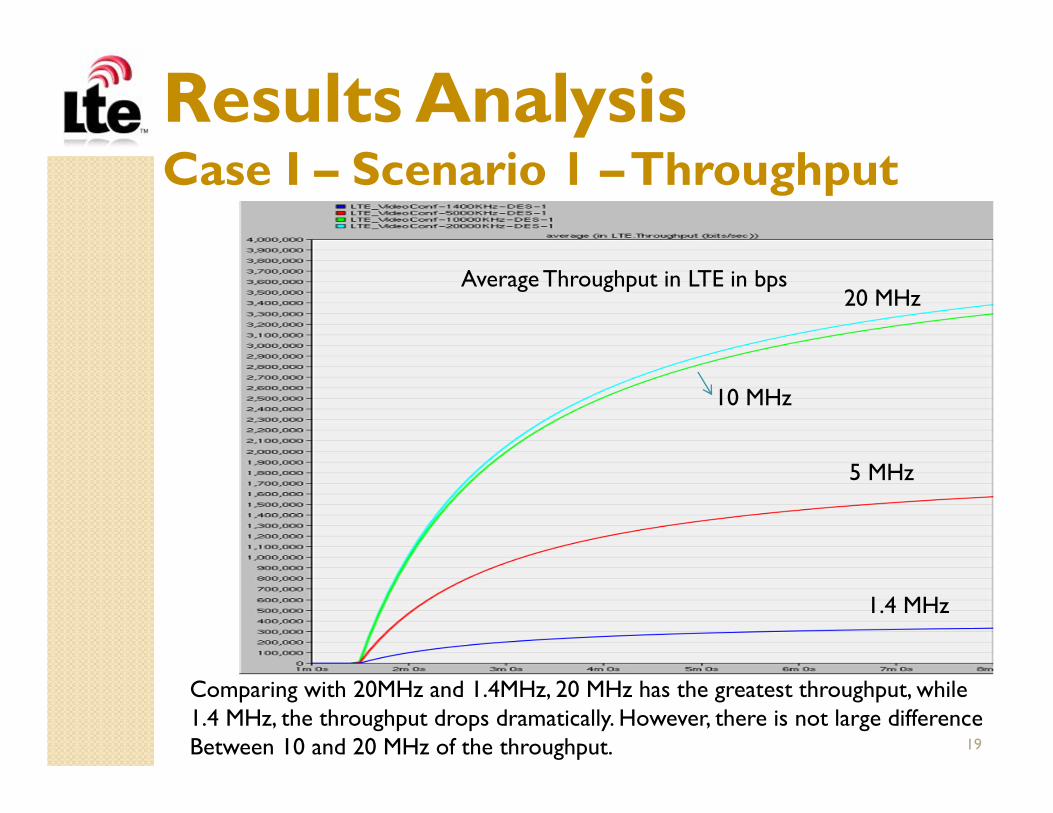
Results AnalysisCase I – Scenario 1 –Throughput
1.4 MHz
5 MHz
10 MHz
20 MHzAverage Throughput in LTE in bps
Comparing with 20MHz and 1.4MHz, 20 MHz has the greatest throughput, while 1.4 MHz, the throughput drops dramatically. However, there is not large difference Between 10 and 20 MHz of the throughput.

20
Results AnalysisCase I – Scenario 1 –Traffic Received
20 MHz
10 MHz
5 MHz 1.4 MHz
Comparing 20MHz and 10 MHz in traffic received, the traffic received (bps) of 10 MHzjust slightly differs with 20 MHz traffic received (bps).

21
Results AnalysisCase I – Scenario 2 – E2E delay
Distance (m)
Average E2E
delay (s)
At the Beginning
(s)
1500 0.071 0.075
1000 0.038 0.050
750 0.035 0.048
500 0.022 0.043
Distance at1500 m
Distance at1000 m
Distance at 750 m
Distance at 500 m
Under 20 MHz Condition

22
Results AnalysisCase I – Scenario 3 – E2E delay
Bandwidth (MHz)
Quality of Video
E2E delay (s)
10 HQ ≈0.0409
20 HQ ≈0.0318
10 LQ ≈0.0275
20 LQ ≈0.0248
10MHz HQ
20MHz HQ
10MHz LQ
20MHz LQ

23
Results AnalysisCase I –Scenario 3–Throughput (bps)
HQ
LQ
20 MHz HQ
10 MHz HQ
10 MHz LQ
20 MHz LQ

24
Results AnalysisCase I –Scenario 3– traffic received
HQ
LQ

25
Results AnalysisCase II–Scenario 1 – E2E Delay
Single Base Station
Under 20MHz
Two Base Stations
26
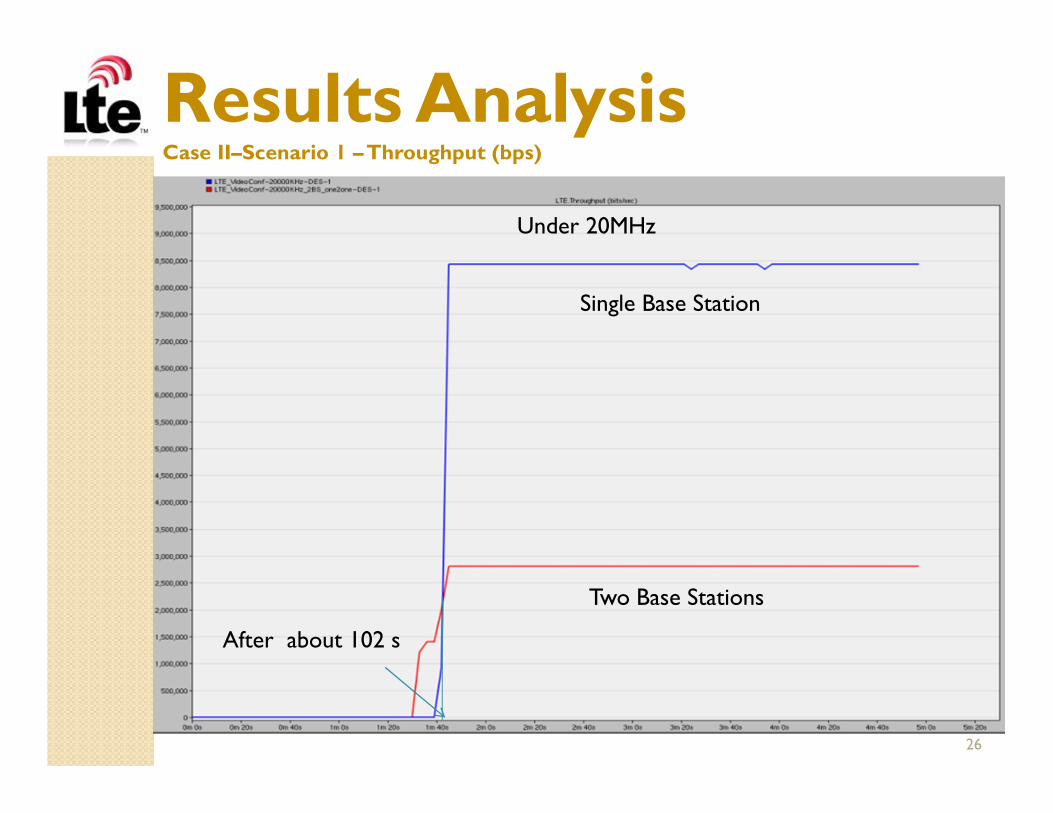
Results AnalysisCase II–Scenario 1 –Throughput (bps)
Under 20MHz
Single Base Station
Two Base Stations
After about 102 s

27
Results AnalysisCase II–Scenario 1–Traffic Received (bps)
Two Base Stations
Single Base Station
Under 20MHz
Around 100,000 bps

28
Results AnalysisCase II–Scenario 2– E2E delay
Single user
Multiple users
Single user
Multiple users
E2Edelay (s)
when stable
≈0.0180 ≈0.0210

29
Results AnalysisCase II–Scenario 2–Throughput (bps)
Single user (2,800,000 bps)
Multiple users ( 5,600,000 bps)
Roadmap• Introduction• Scope of the Project• Simulation Design• Results Analysis• Conclusions, Challenges, and Future
Work• References
30

31
Conclusions
The effects of:
• Signal bandwidth – more BW, lower delay and higher throughput
• Distance from eNodeB – closer, lower delay and higher throughput
• Video quality (load) – lower load, lower delay and higher throughput
• Number of users – more users, more BW needed
Challenges
• Understanding of LTE configuration within the new software tool
• No previous academic work to be used as a reference

32
Future Work• Analysis of LTE networks with different
applications
• Using all the LTE and network attributes
• Studying and comparing LTE against another wireless data technology (WiMAX)

Roadmap• Introduction• Scope of the Project• Simulation Design• Results Analysis• Conclusions, Challenges, and Future
Work• References
33

References
34
[1] F.Zivkovic, J.Priest, H.Haghshenas " Quantitative Analysis of Streaming Multimedia over WiMAX and LTE Networks Using OPNET v. 16.0 ".[Online] Available:http://www2.ensc.sfu.ca/~ljilja/ENSC427/Spring13/Projects/team9/ENSC_427_Group_9_Final_Report.pdf [Accessed: 01 March 2014].
[2] "LTE: Long Term Evolution". [Online] Available:http://www.sfu.ca/~srajara1/Index.html [Accessed: 14 Febuary 2014].
[3] M. Torad, A.E. Qassas and H.A. Henawi, "Comparison between LTE and WiMAX based on System Level Simulation Using OPNETmodeler" , 28th National Radio Science Conference, Apr. 2011, pp 1-9. [Online] Available:IEEE Xplore, http://ieeexplore.ieee.org/Xplore/guesthome.jsp [Accessed: 14 February 2014].
[4]E. Boyer and A. Chowdhury, “Analysis of Quality of Service (QoS) for Video Conferencing in WiMAX Networks” [Online]. Available: http://www.sfu.ca/~asc13/ensc427/afrin_eric_final_report_2010.pdf (Accessed: April 10 2014).
[5] X. Jiang, Z. Zhao, and F. Feng , " http://www.sfu.ca/~zza36/report-427.pdf†. [Online] Available:http://www.sfu.ca/~zza36/report-427.pdf [Accessed: 01 April 2014].

35

36