Analysis of Fragmented Green Spaces in Kuala Lumpur, Malaysia
6
CHEMICAL ENGINEERING TRANSACTIONS VOL. 72, 2019 A publication of The Italian Association of Chemical Engineering Online at www.aidic.it/cet Guest Editors: Jeng Shiun Lim, Azizul Azri Mustaffa, Nur Nabila Abdul Hamid, Jiří Jaromír Klemeš Copyright © 2019, AIDIC Servizi S.r.l. ISBN 978-88-95608-69-3; ISSN 2283-9216 Analysis of Fragmented Green Spaces in Kuala Lumpur, Malaysia Fateen Nabilla Rasli a , Kasturi Devi Kanniah a, *, Chin Siong Ho b a TropicalMap Research Group, Faculty of Built Environment and Surveying, Universiti Teknologi Malaysia, 81310 UTM Johor Bahru, Johor b Low Carbon Center, Faculty of Built Environment and Surveying, Universiti Teknologi Malaysia, 81310 UTM Johor Bahru, Johor [email protected] Issues concerning urban resilience have now become a great challenge to the world as a result of rapid urbanisation. Malaysia is ranked among East Asia's most urbanised countries and its urban population has continued to increase rapidly from 27 % in 1970 to 74 % in 2014. To cope with the issue of sustainability, urban planning has emerged at creating and managing network of green spaces. The establishment of green corridor has accelerated as a response to global concern about issues regarding the fragmentation, climate changes and loss of landscape connectivity resulted from the urbanisation. To ensure that network of green spaces can be established, the fragmented of green spaces must be first identified and located. An analysis of fragmented green spaces has been conducted by using Object Oriented procedure to the high-resolution satellite image of SPOT-6 dated June 2016. Results showed that big and small fragmented green spaces existed with the total area of 84 km 2 out of 243 km 2 total areas of Kuala Lumpur. The highest total area of green spaces was recorded to be in the Damansara Penchala zone which is 26 km 2 and the lowest record is in the Kuala Lumpur City Center area which is only 5 km 2 in area. It was concluded that urban green spaces are more fragmented where there are more built-up areas. In this paper, city center has the least ratio of area of green to the urban area compared to the other five zones because the green space in the area was smaller and fragmented. 1. Introduction To ensure a sustainable urban setting, one of the crucial factors is keeping environment at the best condition and reducing the environmental pollution. Sustainable approaches include important impact to the resolution of reusing and recycling materials, reducing emissions and saving energy to reduce the intimidating impacts on the environment (Mahdiyar et al., 2016). Sustainable development depends on conservation and the growth of ecosystem facilities (Askerlund and Almers, 2016). Southeast Asian countries including Malaysia have undergone rapid urbanisation. To realise the vision of becoming a developed country, the activities of industry, transportation and residential has led these countries to develop at the expense of large-scale land clearances. Unfortunately, these clearances have led to fragmentation of green spaces where open spaces, forest reserves, parks, cemeteries and water bodies (lakes and rivers) constitute as part of green infrastructure in cities. As green infrastructure provides various ecosystem functions and services to urban populations, they must be protected and conserved. Moreover, as the human population will grow in the future, the Earth needs enough green spaces for the people as it is important for the livability of the city. One of the effective strategies is to connect the fragmented patches providing enough green space by forming larger and connected spaces through green corridors. Such spaces are essential not only to provide a linked space for fauna to move freely but also to provide a green network for urban dwellers to walk from one place to another in the city. Accessibility is the most crucial issue for walkability. The equal chances for all in using public spaces makes the place accessible (Zakaria and Ujang, 2015). This will reduce the use of vehicles in the city center which will subsequently lower CO2 emission. On another note, United Nation (UN) Sustainable Development Goal (SDG), Goal 11 is making cities and human settlements comprehensive, harmless, sustainable and resilient where by the year 2030, the goal is to offer common access to safe, inclusive and DOI: 10.3303/CET1972077 Paper Received: 30 March 2018; Revised: 15 August 2018; Accepted: 04 December 2018 Please cite this article as: Rasli F.N., Kanniah K.D., Ho C.S., 2019, Analysis of fragmented green spaces in kuala lumpur, malaysia, Chemical Engineering Transactions, 72, 457-462 DOI:10.3303/CET1972077 457
Transcript of Analysis of Fragmented Green Spaces in Kuala Lumpur, Malaysia

CHEMICAL ENGINEERING TRANSACTIONS
VOL. 72, 2019
A publication of
The Italian Association of Chemical Engineering Online at www.aidic.it/cet
Guest Editors: Jeng Shiun Lim, Azizul Azri Mustaffa, Nur Nabila Abdul Hamid, Jiří Jaromír Klemeš Copyright © 2019, AIDIC Servizi S.r.l.
ISBN 978-88-95608-69-3; ISSN 2283-9216
Analysis of Fragmented Green Spaces in Kuala Lumpur,
Malaysia
Fateen Nabilla Raslia, Kasturi Devi Kanniaha,*, Chin Siong Hob aTropicalMap Research Group, Faculty of Built Environment and Surveying, Universiti Teknologi Malaysia, 81310 UTM
Johor Bahru, Johor bLow Carbon Center, Faculty of Built Environment and Surveying, Universiti Teknologi Malaysia, 81310 UTM Johor Bahru,
Johor
Issues concerning urban resilience have now become a great challenge to the world as a result of rapid
urbanisation. Malaysia is ranked among East Asia's most urbanised countries and its urban population has
continued to increase rapidly from 27 % in 1970 to 74 % in 2014. To cope with the issue of sustainability,
urban planning has emerged at creating and managing network of green spaces. The establishment of green
corridor has accelerated as a response to global concern about issues regarding the fragmentation, climate
changes and loss of landscape connectivity resulted from the urbanisation. To ensure that network of green
spaces can be established, the fragmented of green spaces must be first identified and located. An analysis of
fragmented green spaces has been conducted by using Object Oriented procedure to the high-resolution
satellite image of SPOT-6 dated June 2016. Results showed that big and small fragmented green spaces
existed with the total area of 84 km2 out of 243 km2 total areas of Kuala Lumpur. The highest total area of
green spaces was recorded to be in the Damansara Penchala zone which is 26 km2 and the lowest record is
in the Kuala Lumpur City Center area which is only 5 km2 in area. It was concluded that urban green spaces
are more fragmented where there are more built-up areas. In this paper, city center has the least ratio of area
of green to the urban area compared to the other five zones because the green space in the area was smaller
and fragmented.
1. Introduction
To ensure a sustainable urban setting, one of the crucial factors is keeping environment at the best condition
and reducing the environmental pollution. Sustainable approaches include important impact to the resolution
of reusing and recycling materials, reducing emissions and saving energy to reduce the intimidating impacts
on the environment (Mahdiyar et al., 2016). Sustainable development depends on conservation and the
growth of ecosystem facilities (Askerlund and Almers, 2016). Southeast Asian countries including Malaysia
have undergone rapid urbanisation. To realise the vision of becoming a developed country, the activities of
industry, transportation and residential has led these countries to develop at the expense of large-scale land
clearances. Unfortunately, these clearances have led to fragmentation of green spaces where open spaces,
forest reserves, parks, cemeteries and water bodies (lakes and rivers) constitute as part of green
infrastructure in cities. As green infrastructure provides various ecosystem functions and services to urban
populations, they must be protected and conserved. Moreover, as the human population will grow in the
future, the Earth needs enough green spaces for the people as it is important for the livability of the city. One
of the effective strategies is to connect the fragmented patches providing enough green space by forming
larger and connected spaces through green corridors. Such spaces are essential not only to provide a linked
space for fauna to move freely but also to provide a green network for urban dwellers to walk from one place
to another in the city. Accessibility is the most crucial issue for walkability. The equal chances for all in using
public spaces makes the place accessible (Zakaria and Ujang, 2015). This will reduce the use of vehicles in
the city center which will subsequently lower CO2 emission. On another note, United Nation (UN) Sustainable
Development Goal (SDG), Goal 11 is making cities and human settlements comprehensive, harmless,
sustainable and resilient where by the year 2030, the goal is to offer common access to safe, inclusive and
DOI: 10.3303/CET1972077
Paper Received: 30 March 2018; Revised: 15 August 2018; Accepted: 04 December 2018
Please cite this article as: Rasli F.N., Kanniah K.D., Ho C.S., 2019, Analysis of fragmented green spaces in kuala lumpur, malaysia, Chemical Engineering Transactions, 72, 457-462 DOI:10.3303/CET1972077
457
reachable green and public places, where the built- up area of cities is the open space for community use for
all, by sex, age and persons with disabilities. Most Southeast Asian countries have undergone rapid
urbanisation and global development (Daniels et al., 2018). It was reported that the green spaces have been
decreasing with time and many cities in Southeast Asia have low coverage of green spaces (Richard et al.,
2017). In Kuala Lumpur, Malaysia, the open space reduction and exceptional rise in the population density
caused the total green space per capita to decrease from 13 m2 in 2010 to 8.5 m2 in 2014 (Kanniah, 2017).
Ramakreshnan et al. (2018) have proved the decrease of KL land use changes from 1990 to 2016 where the
urbanisation is outstanding with a remarkable vanishing of green areas over the past decades.
2. Study area
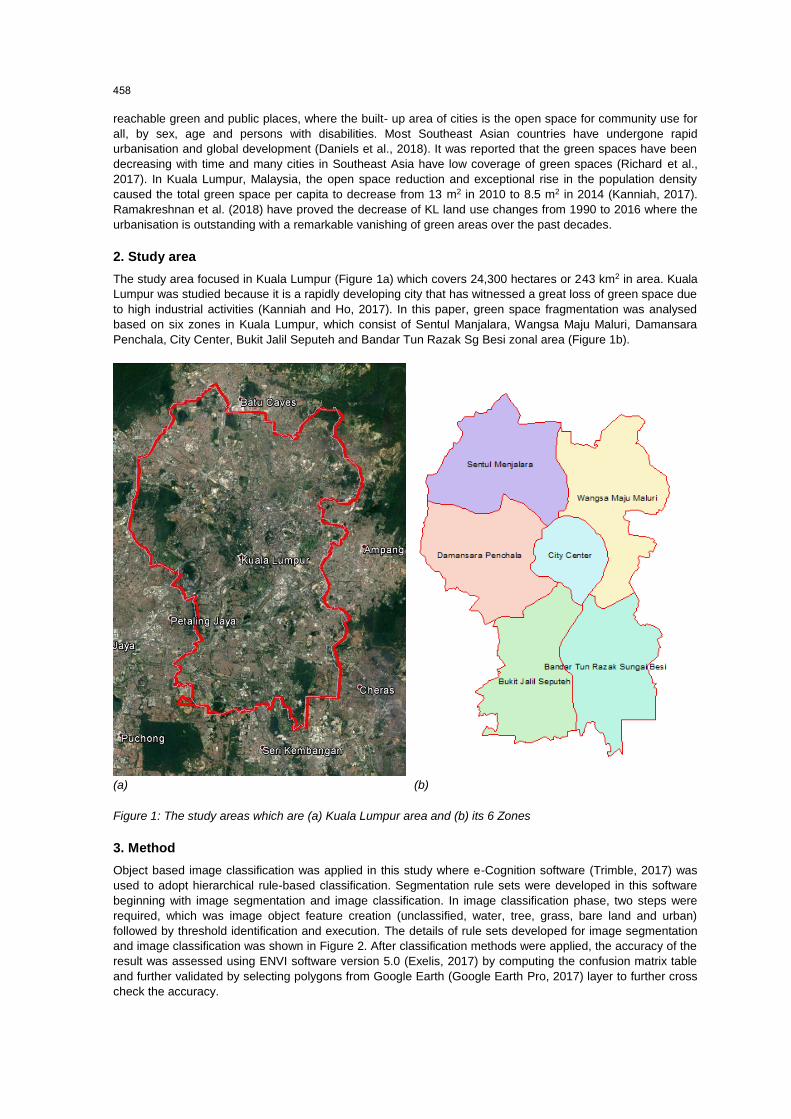
The study area focused in Kuala Lumpur (Figure 1a) which covers 24,300 hectares or 243 km2 in area. Kuala
Lumpur was studied because it is a rapidly developing city that has witnessed a great loss of green space due
to high industrial activities (Kanniah and Ho, 2017). In this paper, green space fragmentation was analysed
based on six zones in Kuala Lumpur, which consist of Sentul Manjalara, Wangsa Maju Maluri, Damansara
Penchala, City Center, Bukit Jalil Seputeh and Bandar Tun Razak Sg Besi zonal area (Figure 1b).
(a) (b)
Figure 1: The study areas which are (a) Kuala Lumpur area and (b) its 6 Zones
3. Method
Object based image classification was applied in this study where e-Cognition software (Trimble, 2017) was
used to adopt hierarchical rule-based classification. Segmentation rule sets were developed in this software
beginning with image segmentation and image classification. In image classification phase, two steps were
required, which was image object feature creation (unclassified, water, tree, grass, bare land and urban)
followed by threshold identification and execution. The details of rule sets developed for image segmentation
and image classification was shown in Figure 2. After classification methods were applied, the accuracy of the
result was assessed using ENVI software version 5.0 (Exelis, 2017) by computing the confusion matrix table
and further validated by selecting polygons from Google Earth (Google Earth Pro, 2017) layer to further cross
check the accuracy.
458
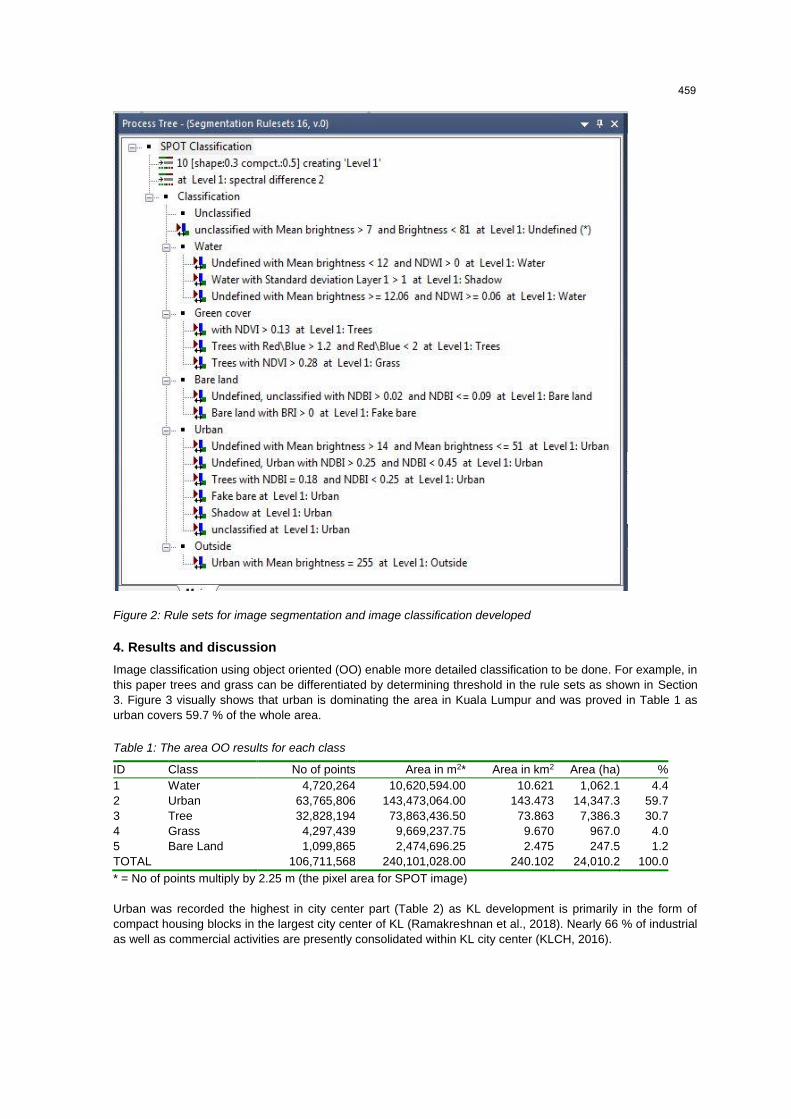
Figure 2: Rule sets for image segmentation and image classification developed
4. Results and discussion
Image classification using object oriented (OO) enable more detailed classification to be done. For example, in
this paper trees and grass can be differentiated by determining threshold in the rule sets as shown in Section
3. Figure 3 visually shows that urban is dominating the area in Kuala Lumpur and was proved in Table 1 as
urban covers 59.7 % of the whole area.
Table 1: The area OO results for each class
ID Class No of points Area in m2* Area in km2 Area (ha) %
1 Water 4,720,264 10,620,594.00 10.621 1,062.1 4.4
2 Urban 63,765,806 143,473,064.00 143.473 14,347.3 59.7
3 Tree 32,828,194 73,863,436.50 73.863 7,386.3 30.7
4 Grass 4,297,439 9,669,237.75 9.670 967.0 4.0
5 Bare Land 1,099,865 2,474,696.25 2.475 247.5 1.2
TOTAL 106,711,568 240,101,028.00 240.102 24,010.2 100.0
* = No of points multiply by 2.25 m (the pixel area for SPOT image)
Urban was recorded the highest in city center part (Table 2) as KL development is primarily in the form of
compact housing blocks in the largest city center of KL (Ramakreshnan et al., 2018). Nearly 66 % of industrial
as well as commercial activities are presently consolidated within KL city center (KLCH, 2016).
459

Figure 3: Classified image of Object-Oriented SPOT KL
Despite the rapid urbanisation of KL city and dominated by the urban area, there are still 34.7 % of green
areas covered, which has become the second largest area after urban, including three forest reserves and
nine main recreational parks. Within 4 km driving distance from KLCC, there are pocket parks such as KLCC
Park, Bukit Nanas Forest Reserve and Taman Tasik Titiwangsa (KL Calling, 2016). A study conducted by
Chan and Vu (2017) concluded that urban green spaces are generally more fragmented where there are more
built-up areas. City center has the least ratio of area of green to the urban area compared to the other five
zones because the green space in the area was smaller and fragmented as shown in Table 2. Figure 4 shows
the combined graph for OO zonal statistic SPOT- 6 of Kuala Lumpur.
460

Figure 4: The combined graph for OO zonal statistic SPOT- 6 of Kuala Lumpur
Kuala Lumpur shows variety of green space shape and the distance between patches had increased and it is
predicted that in the year 2030, Kuala Lumpur would experience green space reduction and built-up area
increment resulting in the green space disorder, scattering and remoteness which then led to green space
area with less connectivity and shape complication (Nor et al., 2017).
5. Conclusion
Results showed that big and small fragmented green spaces existed in Kuala Lumpur, occupying 84 km2 out
of a total area of 243 km2. The highest green spaces total area was recorded in Damansara Penchala zone,
which is 26 km2, while the lowest record is in the City Center area, which is only 5 km2 in area. The constant
green space decline in the master plan suggests that the presently inadequate policies caused urban
expansion to continue lacking green space. This is because in the Kuala Lumpur Structure Plan 2020, the
15
3.5
90
91
72
13
4.7
17
61
04
10
4.9
83
55
26
83
.18
91
32
05
31
7.9
40
68
17
15
1.5
45
91
4
2,4
72
.56
83
45
2,7
03
.89
82
47
1,3
87
.60
70
39
2,2
47
.02
95
86
3,3
81
.36
12
39
3,0
48
.32
73
36
1,6
37
.15
37
26
1,5
48
.20
97
18
43
4.7
46
51
8
2,4
64
.52
30
07
1,0
51
.54
67
32
1,2
87
.91
52
50
16
6.1
35
45
09
16
9.2
04
77
36
72
.99
95
98
81
26
3.1
11
67
61
17
0.0
38
27
36
19
1.3
68
24
35
55
.38
31
63
89
68
.01
03
23
9
11
.88
40
65
34
27
.43
54
40
54
51
.34
14
64
72
40
.01
12
52
64
0
500
1,000
1,500
2,000
2,500
3,000
3,500
4,000
Bandar TunRazak Sungai
Besi
Bukit JalilSeputeh
City Center DamansaraPenchala
SentulManjalara
Wangsa MajuMaluri
Are
a (h
a)
KL Zonal Areas (Name)
Water Urban Tree Grass Bare Land
461

conservation of green spaces looks uncoordinated and absences tenacious monitoring and this problem must
be solved so that the decline and decrease of the KL green spaces can be overcome.
Acknowledgments
The authors would like to thank the Malaysia Remote Sensing Agency (MRSA) for the data supply of Kuala
Lumpur SPOT-6.
References
Askerlund P., Almers E., 2016, Forest gardens - new opportunities for urban children to understand and
develop relationships with other organisms, Urban Forestry & Urban Greening, 20, 187-197.
Chan K.M., Vu T.T., 2017, A landscape ecological perspective of the impacts of urbanization on urban green
spaces in the Klang Valley, Applied Geography, 85, 89-100.
Daniels B., Zaunbrecher B.S., Paas B., Ottermanns R, Ziefle M., Roß-Nickoll M., 2018, Assessment of urban
green space structures and their quality from a multidimensional perspective, Science of Total
Environment, 615, 1364-1378.
Exelis 2017, Exelis Visual Information Solutions, Boulder, Colorado, USA.
Google Earth Pro, 2017, Keyhole, Inc., Mountain View, California, USA.
Kanniah K.D., 2017, Quantifying Green Cover Change for Sustainable Urban Planning: A case of Kuala
Lumpur, Malaysia, Urban Forestry & Urban Greening, 27, 287-304.
Kanniah K.D., Ho C.S., 2017, Urban forest cover changes and sustainability of Malaysian cities, Chemical
Engineering Transactions, 56, 673-678.
KL Calling, 2016, Investor’s Guide, 4th Edition, Kuala Lumpur, Asia’s Regional Headquarters Hub, Ernst &
Young Advisory Services Sdn. Bhd., Kuala Lumpur, Malaysia.
KLCH, 2016, Kuala Lumpur low carbon society blue print- inception Report Kuala Lumpur, Kuala Lumpur City
Hall, Kuala Lumpur, Malaysia.
Mahdiyar A., Tabatabaee S., Sadeghifam A.N., Mohandes S.R., Abdullah A., Meynagh, M.M., 2016,
Probabilistic private cost- benefit analysis for green roof installation: A Monte Carlo simulation approach,
Urban Forestry & Urban Greening, 20, 317-327.
Nor A.N., Corstanje R., Harris J.A., Brewer T., 2017, Impact of rapid urban expansion on green space
structure, Ecological Indicators, 81, 274-284.
Ramakreshnan L., Aghamohammadi N., Chng Saun F., Ghaffarianhoseini A., Ghaffarianhoseini A., Wong
L.P., Hassan N., Nik Sulaiman N.M., 2018, A critical review of Urban Heat Island phenomenon in the
context of Greater Kuala Lumpur, Malaysia, Sustainable Cities & Society, 39, 99-113.
Richard R.D., Passy P., Oh R.R.Y., 2017, Impacts of population density and wealth on the quantity and
structure of urban green space in tropical Southeast Asia, Landscape & Urban Planning, 157, 553–560.
Trimble, 2017, Trimble Inc. 10368 Westmoor Drive, Westminster, Colorado, USA.
Zakaria J., Ujang N., 2015, Comfort of Walking in the City Center of Kuala Lumpur, Procedia - Social &
Behavioral Sciences, 170, 642-652.
462