Analysis of Cost of Labrador Marine Services: A Study … · Analysis of Cost of Labrador Marine...
26
Analysis of Cost of Labrador Marine Services A Study of Base Freight Rates And Passenger Fares March 2005
Transcript of Analysis of Cost of Labrador Marine Services: A Study … · Analysis of Cost of Labrador Marine...
Analysis of Cost of Labrador Marine Services
A Study of Base Freight Rates And Passenger Fares
March 2005
Analysis of Cost of Labrador Marine Services
A Study of Base Freight Rates And Passenger Fares
March 2005
TABLE OF CONTENTS
EXECUTIVE SUMMARY ………………………………………………………… i INTRODUCTION…………………………………………………………………….. 1 TARIFFS AND RATE STRUCTURES ………………………………………… 1 WHY A NEW FREIGHT RATE AND FARE STRUCTURE……………………….. 2 CURRENT SERVICE ………………………………………………………… 3 DEVELOPMENT OF A COST BASED SYSTEM OF RATES AND FARES ……. 4 Cost Data ………………………………………………………………… 4 Reference Time Frame ………………………………………………… 5 Costs–Fixed vs Variable ………………………………………………… 5 Cost Allocation ………………………………………………………… 7 TRAFFIC OUTPUTS OF EACH VESSEL………………………………………….. 8 Calculations of Unit Costs Associated with Each Vessel ………………... 9 EQUATIONS TO DETERMINE FREIGHT CHARGES AND PASSENGER FARES ………………………………………………... 10 SENSITIVITY ANALYSIS ………………………………………………………… 12 COMPARATIVE RESULTS OF SENSITIVITY ANALYSIS …………………. 13 ANCILLARY CHARGES AND CHARGES RELATED TO METHOD OF SHIPPING ………………………………………………… 14 INCENTIVES AND DISCOUNTS FOR VARIOUS SHIPPING METHODS ……… 14 THE APPROPRIATENESS OF USING 2003 AS A BASE YEAR ………………… 15 INTER-COMMUNITY DISTANCES ………………………………………… 16 APPLICATION OF BASE RATES ………………………………………………… 17 CONCLUSIONS AND RECOMMENDATIONS ………………………………… 19
Executive Summary
During 2004 the public the Harris Centre (formerly the Public Policy Research Centre) completed an operational review of the Labrador Marine Service. The issue of rates and tariffs being used, while of concern, was not studied due to time and budgetary constraints. Since presentation of the operations study, Government provided funding to review the current rate and tariff structure. The present rate and tariff structure was developed some years ago and is largely an arbitrary one. As such, it does not reflect the cost of resources used, the distances travelled and recovers only approximately 20% of the total operating cost. The current study attempted to analyse the cost components of each vessel used in the system, with the objective of the development of a rate structure that would be tied to these costs. It was concluded by the study team that rates reflecting all or a pre-determined portion of the operating cost would be fair and equitable to all system users. Vessel and shore based cost data were provided by Government to the study team for the operating year 2003. Traffic and other vessel output data were provided by Labrador Marine Inc., the operator contracted by Government to manage the marine system. The total operations costs were divided into fixed and variable components for each vessel used in the service, namely, the Sir Robert Bond, the Northern Ranger and the Trans Gulf. Since two of these vessels are used to carry passengers, freight and vehicles and separate accounts isolating the associated costs are not maintained, a cost allocation procedure was used to establish the fixed and variable portions incurred by each service. Traffic outputs of each vessel in terms of passengers, passenger-miles (kilometres), tons, ton-miles (kilometres), and vehicles, vehicle-miles (kilometres) were determined from vessel activity reports as provided by the system management firm. The unit cost of each output for each vessel was calculated. Due to wide variations in the cost characteristics of vessels, system average costs of each traffic output were calculated and became the basis for all further analysis. Using these system averages three equations were identified to enable the calculation of freight, passenger and vehicle transportation cost between any ports being served.
The fares and rates charged by the service set out in a published document referred to as Schedule K. The current Schedule K has embedded in it a number of significant ancillary charges and incentive rates to allow for various methods of handling. For instance the charges for transporting containerized goods is less than those for transporting the same quantity over the same distance by palletized methods. Government had expressed its desire to maintain stability in the differentials that presently exist and that any new rate structure should not cause wide scale change over the present structure.
- i-

An attempt was made to incorporate the incentive differentials but it was deemed not possible due to the fact that neither the Government nor the current system manager maintain cost records from which reliable information concerning these handling charges might be extracted. It was therefore concluded that, while the equations, as developed, offer a reasonable method of calculating the cost of moving freight, passengers and vehicles from port to port in Labrador there is an information gap which needs to be addressed. If Government wishes to incorporate other ancillary and incentive charges it should, during the 2005 shipping season, begin a detailed accounting of the cost associated with all provided services and these costs should be incorporated in rates used in future years. Such accounting will be necessary to ensure that the charges derived therefrom reflect the costs both of handling and transporting freight. By so doing an incentive will be created for shippers to use appropriate containers and thereby minimize overall costs.
- ii -
Analysis of Cost of Labrador Marine Services 1 March 2005
ANALYSIS OF COST OF LABRADOR MARINE SERVICES AND PROPOSAL FOR BASE FREIGHT RATES AND PASSENGER FARES
Introduction
During 2004 the Public Policy Research Centre completed a review of the
operations of the Labrador Marine Services. That review was concerned with vessel
suitability, schedules and location of terminal ports. At that time the issue of rates being
charged for the services provided was also of concern but due to time and budget
constraints could not be investigated. Since then the Government of Newfoundland and
Labrador through the Department of Transportation and Works has provided
supplemental funding to allow the issue to be studied. The following sections of this
report provide some discussion regarding the problem, a detailed description of the
analysis that was completed and recommendations for a new rate and fare structure.
Tariffs and Rate Structures
Generally, freight tariffs and passenger rates are structured on the basis of one of
the following: (a ) fully cost based, (b) arbitrary based, or (c) a combination of cost basis
with some arbitrariness applied to certain aspects.
When establishing a cost based system of rates and fares an attempt is made to
recover from the system users the cost of providing the service. The recovered cost may
be the total cost including all capital and operating or it may be only the operating
component. In the case of services provided by the private sector such as trucking, rates
are set to recover all cost, both capital and operating, of the trucking firm plus the
provision of a margin of profit. Although the operating costs of trucking entities usually
include all fuel taxes and fees paid by the firms they do not include charges for the capital
cost of the highways themselves. In the case of publicly run services, rates may be cost
based but set to recover just the operating component with the capital component being
provided from the general revenues of the Government or they may be fully arbitrary
based and set on the basis of historical experience. In the case of arbitrary based rates
those used are often tied to other social development policies related to the region being
serviced. As indicated above, rate structures can be developed as a combination of both
cost based and arbitrary based.
Analysis of Cost of Labrador Marine Services 2 March 2005
Generally, systems that incorporate some measure of service cost are looked upon as
the most fair and equitable. Transportation of goods and people for fees that reflect the
cost of that service are more readily received by users than where fees are arbitrary.
Why a New Freight Rate and Fare Structure The rate and fare structure being used currently on the Labrador Marine Service,
is identified by Government as “Schedule K, Passenger and Freight Tariffs.” This tariff
has been in existence for several decades, although several minor modifications have
been made over the years. Application of the published tariffs to the traffic carried, has,
in recent years, seen approximately only 20% of operations cost recovered annually by
the Government. While Government could improve the cost recovery aspect by simply
invoking an across the board rate increase sufficient to recover all or a higher proportion
operating cost, to do so could have devastating impacts on the isolated communities of
Labrador that depend on the marine service for delivery of freight and for passenger
travel.
Currently the rate and passenger tariff system used does not appear to be fully
cost based. There is some perception on the part of the system users that the rates and
fares charged are not fair. This has led to some discontent. The government recognizes
that there is a degree of arbitrariness in the rates and that there are several anomalies. For
instance, there is a perception that the rates often do not reflect the distance travelled and
therefore in some instances the cost to transport freight over much longer distances is
only marginally different and in some cases the longer distances are reflected in lower
rates.
The current tariff was instituted when there were many more communities being
serviced by the marine mode than there are today. For instance, the current tariff structure
shows forty eight ports of call and the cumulative distance between these. Today there
are only ten communities serviced and the total distance travelled is considerably less
than when the rates were first used. Recognizing that the rate structure may be out-dated,
this analysis has attempted to develop a system of rates that bears at least some
relationship to the operations cost of providing the service. This is not to say that the
Government should invoke a system of rates that would recover all operations cost.
Analysis of Cost of Labrador Marine Services 3 March 2005
Rather, if Government is aware of a rational rate structure that has the potential to recover
all operating cost, it can by policy, elect to recover as much of that cost as it sees fit. If
the base rates are determined from an operational cost basis that is rational, the
assumption is made that an applied system of rates that recovers a fixed proportion or
percentage of these rates will of necessity be fair and equitable. Thus, the freight rates
and passenger fares as developed and described in this report are determined from the
service operating cost. No attempt has been made to incorporate any capital cost
associated with the service. In this context capital costs of vessels and port infrastructure
are analogous to the capital cost of highways that are generally not directly recovered
from users.
Current Service
Currently, service is provided to the isolated communities in Labrador through the
use of four vessels. These are; the Sir Robert Bond, the Northern Ranger, the Trans Gulf,
and the Challenge one. The Sir Robert Bond and the Northern Ranger are owned by the
Government of Newfoundland and Labrador while the Trans Gulf and the Challenge
One, which are under contract to the Government, are owned by private companies. The
Challenge One is a small vessel that provides service to two small southern Labrador
communities and was not considered in the conduct of this study. The three other vessels
provide distinctive service to the other isolated communities of Labrador. The Sir Robert
Bond provides for the transport of passengers, passenger related vehicles, commercial
vehicles, and freight in the form of containerised, palletised, and loose stow (break bulk).
The Northern Ranger provides mainly passenger service with a limited amount of
palletised freight service. The Trans Gulf provides freight only service in the form of
containerised, palletised and loose stow. Thus, the outputs from the service may be
classed as passenger-miles (passenger-kilometres), ton-miles (ton-kilometres), and
vehicle-miles(vehicle-kilometres). Because the Sir Robert Bond transports a variety of
vehicle types it has been necessary for the purposes of this study to convert a vehicle to a
standard unit hereinafter referred to as an AEU (auto equivalent unit). Thus the last
output identified above becomes AEU-miles (AEU-kilometres). The term AEU is more
fully defined in a later section of this report.
Analysis of Cost of Labrador Marine Services 4 March 2005
While the Government is responsible for provision of the marine services it does
not directly manage or supervise these. Overall management is provided by contract with
Labrador Marine Inc. which staffs the Sir Robert Bond and the Northern Ranger and
which is also responsible for all shore based operations involved in the service. Star Line
Incorporated provides and staffs the Trans Gulf. All fuel requirements are the
responsibility of the Department of Transportation of Works and are paid for by the
Department outside of the operating contracts.
Development of a Cost Based System of Rates and Fares The development of a cost based system of rates (tariffs) and fares requires
accurate cost data that can be logically related to the system outputs. For the purposes of
this study, traffic in terms of port to port freight volumes, vehicle movements, passenger
origin-destination statistics and distances travelled on each trip by each vessel was
provided by Labrador Marine Inc. The Department of Transportation and Works
provided cost data as well as the current “Schedule K, Passenger and Freight Tariffs”.
Cost Data
Normally, in order to develop a system of cost based rates detailed cost
accounting records would be used to accurately identify fixed and variable costs and the
magnitude of these costs associated with each system output. The management contract
between the Department and Labrador Marine Inc. as well as the contract between the
Department and Star Line Incorporated provides for payment on the basis of per diems
for each day the respective vessels are in operation, during lay up or undergoing refit.
The current contracts provide for payment for a minimum of 165 operating days and
approximately 30 days for refit, with the remaining days in a year classed as lay up days.
Conceivably under unforeseen circumstances the minimum number of operating days
could be exceeded, however in the absence of evidence to justify extended operating
seasons the stated minimums are assumed as the norm. These payments are not tied to
any measure of productivity such as the amount of freight or the number of passengers
carried and are paid whether the vessels carry one ton or one thousand tons. In effect all
the payments made to the vessel operators and managers are fixed costs and have been
Analysis of Cost of Labrador Marine Services 5 March 2005
assumed as such for the purposes of this study. While Government charges users varying
fees for varying aspects of the service such as distance travelled, volume of freight
transported or handling methods employed on the vessels, these variables cannot be
directly related to service costs as no separate accounting records are maintained. The
only cost items that may be considered as variable and directly associated with system
outputs are those of fuel and lubricants. Since the Department pays for all fuels and
lubricants directly, outside the above noted management contracts, the magnitude of
these items as consumed by each vessel was identified in separate Government accounts.
Reference Time Frame
Although Government has cost records available for several years of operation
circumstances precluded the use of many of these as reference periods to establish base
rates. Prior to 2003 the costs shown by vessel in Government accounts was that of net
costs that were paid to the contractors. Revenues received for the services provided were
retained by the contractor and while the Government was to some extent aware of the
magnitudes of these revenues, they were of no major concern. Therefore the true cost of
the operation of each vessel was not known. Also, prior to 2003 the ports utilized
particularly by the Northern Ranger were not as they are today. Therefore, the use of
traffic data for that vessel would not fairly represent today’s conditions. For these
reasons, 2003 was selected as the base reference year. Although 2003 is the most recent
year for which some reliable data are available it is pointed out that the 2003 operating
season must be considered as somewhat atypical because a number of changes were
made to the service during that year. Nevertheless complete vessel cost data were
available for 2003 as well as full traffic statistics showing the freight, number of
passengers, the number of vehicles carried and the distance travelled.
Costs-Fixed vs Variable
The fixed and variable costs for each vessel were determined from data supplied
by the Department of Transportation and Works. These are shown in Table 1. In addition
to vessel fixed and variable cost, Government pays the contractor for providing shore
based services at the various harbours. These costs are independent of the vessels used,
Analysis of Cost of Labrador Marine Services 6 March 2005
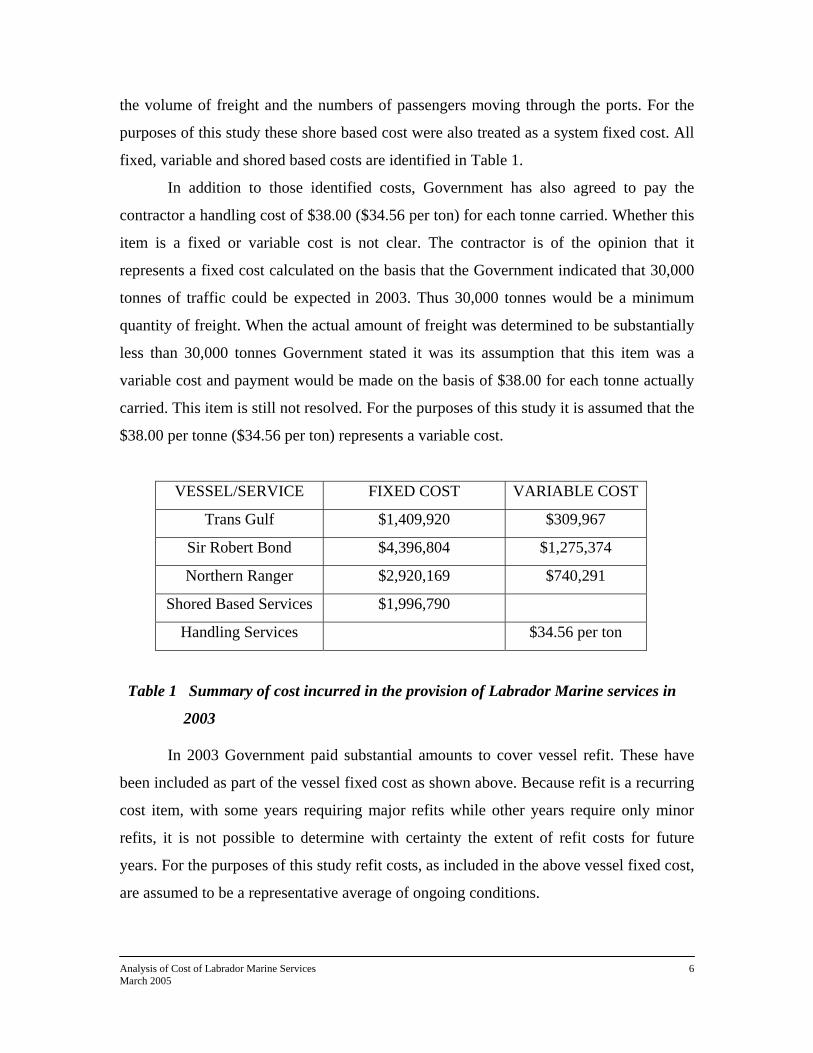
the volume of freight and the numbers of passengers moving through the ports. For the
purposes of this study these shore based cost were also treated as a system fixed cost. All
fixed, variable and shored based costs are identified in Table 1.
In addition to those identified costs, Government has also agreed to pay the
contractor a handling cost of $38.00 ($34.56 per ton) for each tonne carried. Whether this
item is a fixed or variable cost is not clear. The contractor is of the opinion that it
represents a fixed cost calculated on the basis that the Government indicated that 30,000
tonnes of traffic could be expected in 2003. Thus 30,000 tonnes would be a minimum
quantity of freight. When the actual amount of freight was determined to be substantially
less than 30,000 tonnes Government stated it was its assumption that this item was a
variable cost and payment would be made on the basis of $38.00 for each tonne actually
carried. This item is still not resolved. For the purposes of this study it is assumed that the
$38.00 per tonne ($34.56 per ton) represents a variable cost.
VESSEL/SERVICE FIXED COST VARIABLE COST
Trans Gulf $1,409,920 $309,967
Sir Robert Bond $4,396,804 $1,275,374
Northern Ranger $2,920,169 $740,291
Shored Based Services $1,996,790
Handling Services $34.56 per ton
Table 1 Summary of cost incurred in the provision of Labrador Marine services in
2003
In 2003 Government paid substantial amounts to cover vessel refit. These have
been included as part of the vessel fixed cost as shown above. Because refit is a recurring
cost item, with some years requiring major refits while other years require only minor
refits, it is not possible to determine with certainty the extent of refit costs for future
years. For the purposes of this study refit costs, as included in the above vessel fixed cost,
are assumed to be a representative average of ongoing conditions.
Analysis of Cost of Labrador Marine Services 7 March 2005
Cost Allocation
Since the financial accounts maintained by Government are detailed to provide
only gross costs incurred by specific vessels as specified in the operations contract, it was
necessary to complete a cost allocation procedure to allow for the determination of the
cost related to the provision of particular services outputs.
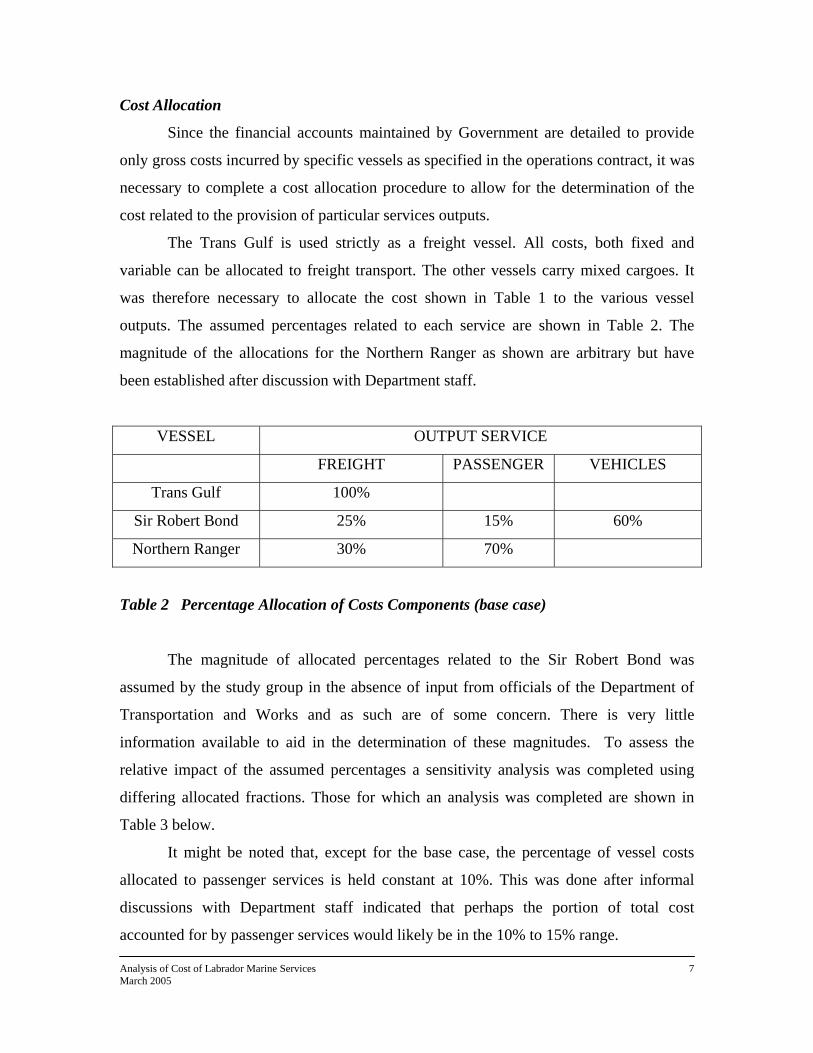
The Trans Gulf is used strictly as a freight vessel. All costs, both fixed and
variable can be allocated to freight transport. The other vessels carry mixed cargoes. It
was therefore necessary to allocate the cost shown in Table 1 to the various vessel
outputs. The assumed percentages related to each service are shown in Table 2. The
magnitude of the allocations for the Northern Ranger as shown are arbitrary but have
been established after discussion with Department staff.
VESSEL OUTPUT SERVICE
FREIGHT PASSENGER VEHICLES
Trans Gulf 100%
Sir Robert Bond 25% 15% 60%
Northern Ranger 30% 70%
Table 2 Percentage Allocation of Costs Components (base case)
The magnitude of allocated percentages related to the Sir Robert Bond was
assumed by the study group in the absence of input from officials of the Department of
Transportation and Works and as such are of some concern. There is very little
information available to aid in the determination of these magnitudes. To assess the
relative impact of the assumed percentages a sensitivity analysis was completed using
differing allocated fractions. Those for which an analysis was completed are shown in
Table 3 below.
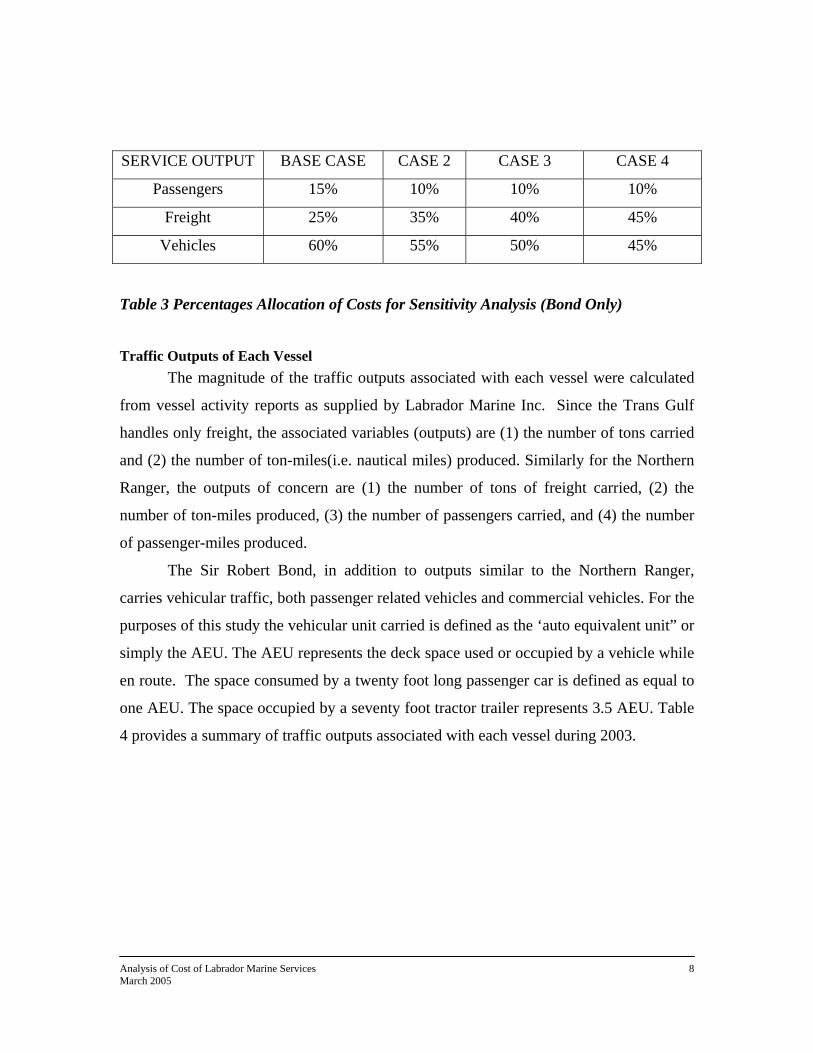
It might be noted that, except for the base case, the percentage of vessel costs
allocated to passenger services is held constant at 10%. This was done after informal
discussions with Department staff indicated that perhaps the portion of total cost
accounted for by passenger services would likely be in the 10% to 15% range.
Analysis of Cost of Labrador Marine Services 8 March 2005
SERVICE OUTPUT BASE CASE CASE 2 CASE 3 CASE 4
Passengers 15% 10% 10% 10%
Freight 25% 35% 40% 45%
Vehicles 60% 55% 50% 45%
Table 3 Percentages Allocation of Costs for Sensitivity Analysis (Bond Only)
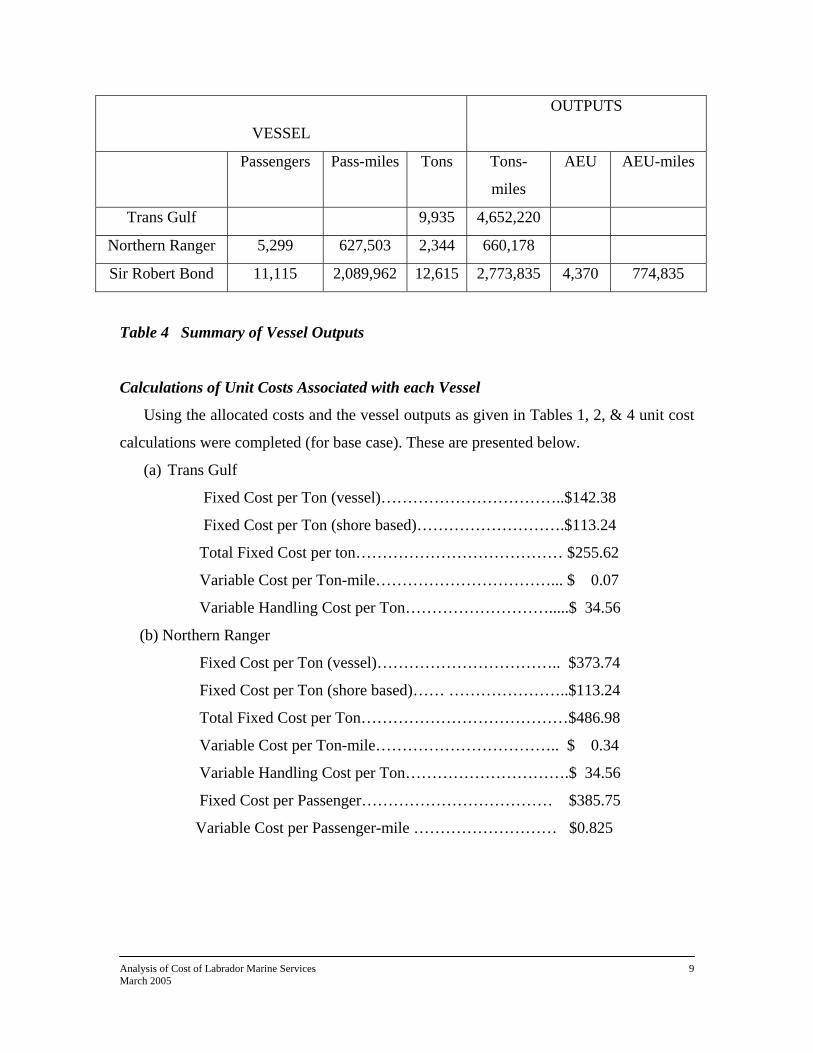
Traffic Outputs of Each Vessel The magnitude of the traffic outputs associated with each vessel were calculated
from vessel activity reports as supplied by Labrador Marine Inc. Since the Trans Gulf
handles only freight, the associated variables (outputs) are (1) the number of tons carried
and (2) the number of ton-miles(i.e. nautical miles) produced. Similarly for the Northern
Ranger, the outputs of concern are (1) the number of tons of freight carried, (2) the
number of ton-miles produced, (3) the number of passengers carried, and (4) the number
of passenger-miles produced.
The Sir Robert Bond, in addition to outputs similar to the Northern Ranger,
carries vehicular traffic, both passenger related vehicles and commercial vehicles. For the
purposes of this study the vehicular unit carried is defined as the ‘auto equivalent unit” or
simply the AEU. The AEU represents the deck space used or occupied by a vehicle while
en route. The space consumed by a twenty foot long passenger car is defined as equal to
one AEU. The space occupied by a seventy foot tractor trailer represents 3.5 AEU. Table
4 provides a summary of traffic outputs associated with each vessel during 2003.
Analysis of Cost of Labrador Marine Services 9 March 2005
VESSEL
OUTPUTS
Passengers Pass-miles Tons Tons-
miles
AEU AEU-miles
Trans Gulf 9,935 4,652,220
Northern Ranger 5,299 627,503 2,344 660,178
Sir Robert Bond 11,115 2,089,962 12,615 2,773,835 4,370 774,835
Table 4 Summary of Vessel Outputs
Calculations of Unit Costs Associated with each Vessel
Using the allocated costs and the vessel outputs as given in Tables 1, 2, & 4 unit cost
calculations were completed (for base case). These are presented below.
(a) Trans Gulf
Fixed Cost per Ton (vessel)……………………………..$142.38
Fixed Cost per Ton (shore based)……………………….$113.24
Total Fixed Cost per ton………………………………… $255.62
Variable Cost per Ton-mile……………………………... $ 0.07
Variable Handling Cost per Ton……………………….....$ 34.56
(b) Northern Ranger
Fixed Cost per Ton (vessel)…………………………….. $373.74
Fixed Cost per Ton (shore based)…… …………………..$113.24
Total Fixed Cost per Ton…………………………………$486.98
Variable Cost per Ton-mile…………………………….. $ 0.34
Variable Handling Cost per Ton………………………….$ 34.56
Fixed Cost per Passenger……………………………… $385.75
Variable Cost per Passenger-mile ……………………… $0.825
Analysis of Cost of Labrador Marine Services 10 March 2005
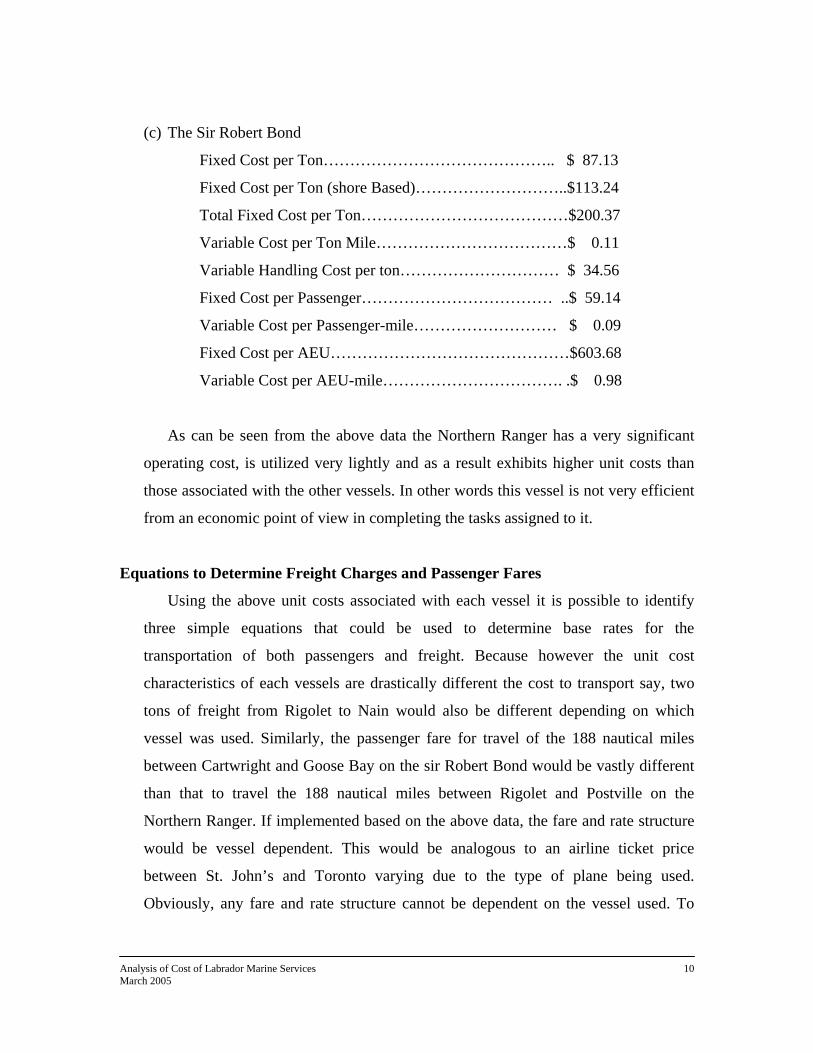
(c) The Sir Robert Bond
Fixed Cost per Ton…………………………………….. $ 87.13
Fixed Cost per Ton (shore Based)………………………..$113.24
Total Fixed Cost per Ton…………………………………$200.37
Variable Cost per Ton Mile………………………………$ 0.11
Variable Handling Cost per ton………………………… $ 34.56
Fixed Cost per Passenger……………………………… ..$ 59.14
Variable Cost per Passenger-mile……………………… $ 0.09
Fixed Cost per AEU………………………………………$603.68
Variable Cost per AEU-mile……………………………. .$ 0.98
As can be seen from the above data the Northern Ranger has a very significant
operating cost, is utilized very lightly and as a result exhibits higher unit costs than
those associated with the other vessels. In other words this vessel is not very efficient
from an economic point of view in completing the tasks assigned to it.
Equations to Determine Freight Charges and Passenger Fares
Using the above unit costs associated with each vessel it is possible to identify
three simple equations that could be used to determine base rates for the
transportation of both passengers and freight. Because however the unit cost
characteristics of each vessels are drastically different the cost to transport say, two
tons of freight from Rigolet to Nain would also be different depending on which
vessel was used. Similarly, the passenger fare for travel of the 188 nautical miles
between Cartwright and Goose Bay on the sir Robert Bond would be vastly different
than that to travel the 188 nautical miles between Rigolet and Postville on the
Northern Ranger. If implemented based on the above data, the fare and rate structure
would be vessel dependent. This would be analogous to an airline ticket price
between St. John’s and Toronto varying due to the type of plane being used.
Obviously, any fare and rate structure cannot be dependent on the vessel used. To
Analysis of Cost of Labrador Marine Services 11 March 2005
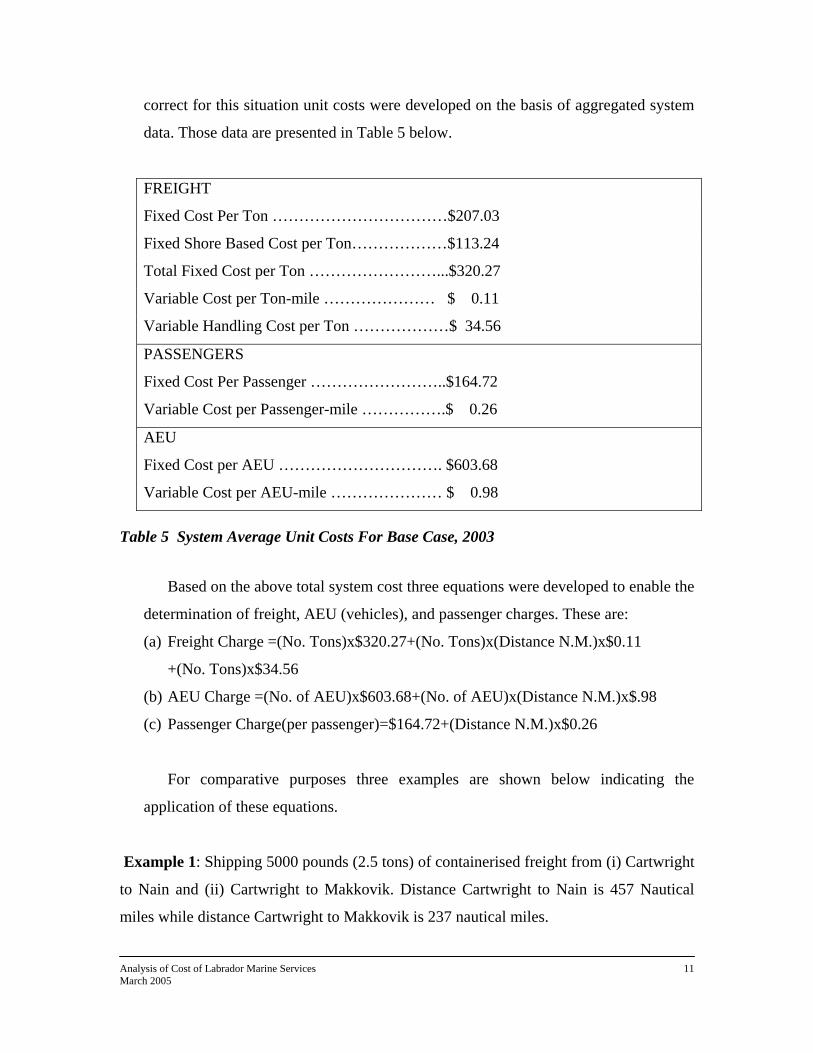
correct for this situation unit costs were developed on the basis of aggregated system
data. Those data are presented in Table 5 below.
FREIGHT
Fixed Cost Per Ton ……………………………$207.03
Fixed Shore Based Cost per Ton………………$113.24
Total Fixed Cost per Ton ……………………...$320.27
Variable Cost per Ton-mile ………………… $ 0.11
Variable Handling Cost per Ton ………………$ 34.56
PASSENGERS
Fixed Cost Per Passenger ……………………..$164.72
Variable Cost per Passenger-mile …………….$ 0.26
AEU
Fixed Cost per AEU …………………………. $603.68
Variable Cost per AEU-mile ………………… $ 0.98
Table 5 System Average Unit Costs For Base Case, 2003
Based on the above total system cost three equations were developed to enable the
determination of freight, AEU (vehicles), and passenger charges. These are:
(a) Freight Charge =(No. Tons)x$320.27+(No. Tons)x(Distance N.M.)x$0.11
+(No. Tons)x$34.56
(b) AEU Charge =(No. of AEU)x$603.68+(No. of AEU)x(Distance N.M.)x$.98
(c) Passenger Charge(per passenger)=$164.72+(Distance N.M.)x$0.26
For comparative purposes three examples are shown below indicating the
application of these equations.
Example 1: Shipping 5000 pounds (2.5 tons) of containerised freight from (i) Cartwright
to Nain and (ii) Cartwright to Makkovik. Distance Cartwright to Nain is 457 Nautical
miles while distance Cartwright to Makkovik is 237 nautical miles.
Analysis of Cost of Labrador Marine Services 12 March 2005
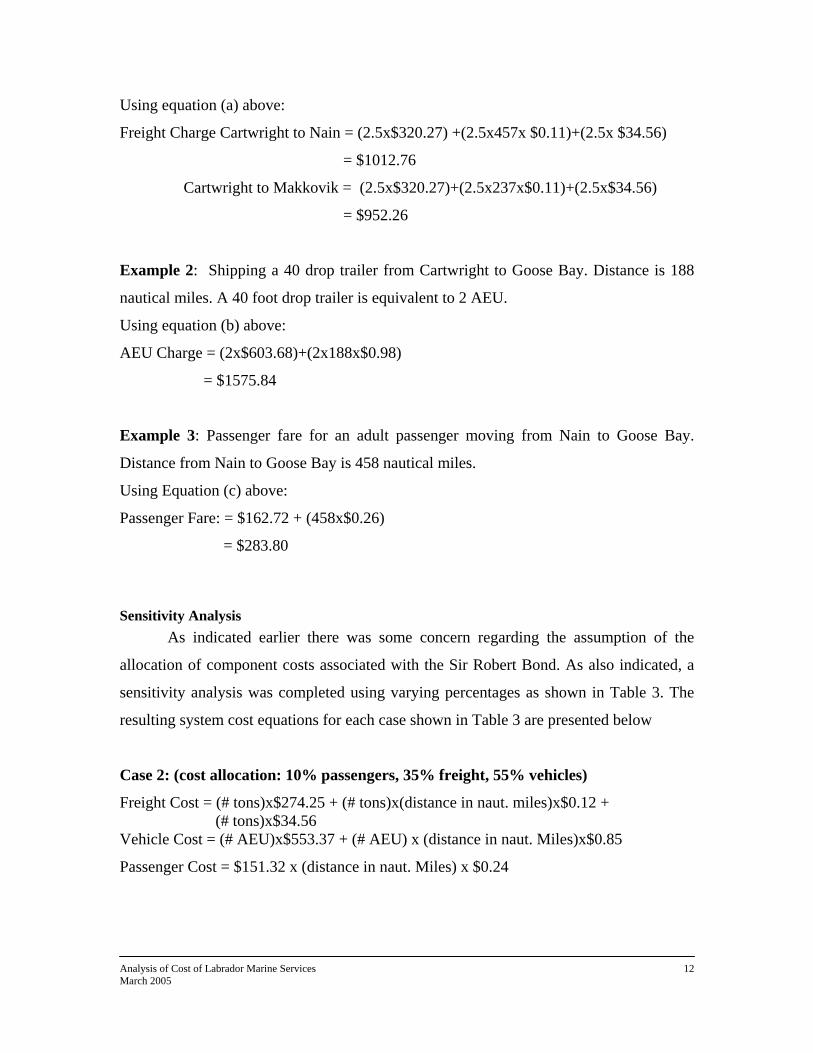
Using equation (a) above:
Freight Charge Cartwright to Nain = (2.5x$320.27) +(2.5x457x $0.11)+(2.5x $34.56)
= $1012.76
Cartwright to Makkovik = (2.5x$320.27)+(2.5x237x$0.11)+(2.5x$34.56)
= $952.26
Example 2: Shipping a 40 drop trailer from Cartwright to Goose Bay. Distance is 188
nautical miles. A 40 foot drop trailer is equivalent to 2 AEU.
Using equation (b) above:
AEU Charge = (2x$603.68)+(2x188x$0.98)
= $1575.84
Example 3: Passenger fare for an adult passenger moving from Nain to Goose Bay.
Distance from Nain to Goose Bay is 458 nautical miles.
Using Equation (c) above:
Passenger Fare: = $162.72 + (458x$0.26)
= $283.80
Sensitivity Analysis As indicated earlier there was some concern regarding the assumption of the
allocation of component costs associated with the Sir Robert Bond. As also indicated, a
sensitivity analysis was completed using varying percentages as shown in Table 3. The
resulting system cost equations for each case shown in Table 3 are presented below
Case 2: (cost allocation: 10% passengers, 35% freight, 55% vehicles)
Freight Cost = (# tons)x$274.25 + (# tons)x(distance in naut. miles)x$0.12 + (# tons)x$34.56 Vehicle Cost = (# AEU)x$553.37 + (# AEU) x (distance in naut. Miles)x$0.85
Passenger Cost = $151.32 x (distance in naut. Miles) x $0.24
Analysis of Cost of Labrador Marine Services 13 March 2005
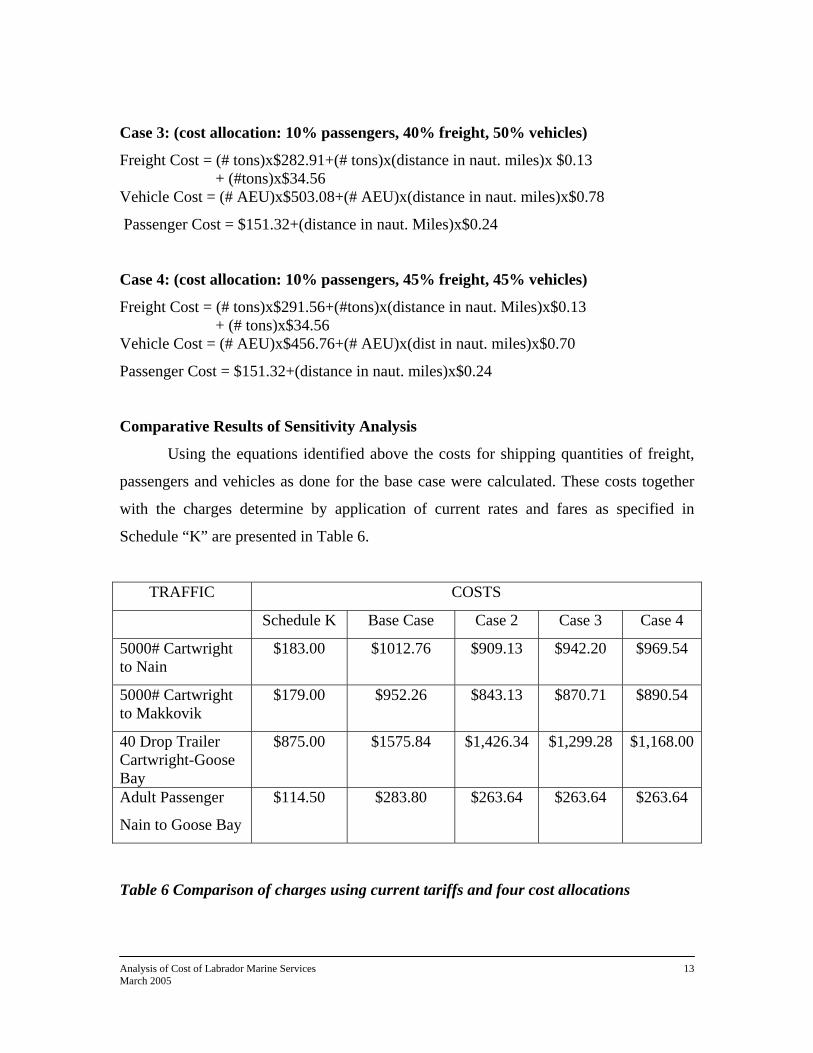
Case 3: (cost allocation: 10% passengers, 40% freight, 50% vehicles)
Freight Cost = (# tons)x$282.91+(# tons)x(distance in naut. miles)x $0.13 + (#tons)x$34.56 Vehicle Cost = (# AEU)x$503.08+(# AEU)x(distance in naut. miles)x$0.78
Passenger Cost = $151.32+(distance in naut. Miles)x$0.24
Case 4: (cost allocation: 10% passengers, 45% freight, 45% vehicles)
Freight Cost = (# tons)x$291.56+(#tons)x(distance in naut. Miles)x$0.13 + (# tons)x$34.56 Vehicle Cost = (# AEU)x$456.76+(# AEU)x(dist in naut. miles)x$0.70
Passenger Cost = $151.32+(distance in naut. miles)x$0.24
Comparative Results of Sensitivity Analysis
Using the equations identified above the costs for shipping quantities of freight,
passengers and vehicles as done for the base case were calculated. These costs together
with the charges determine by application of current rates and fares as specified in
Schedule “K” are presented in Table 6.
TRAFFIC COSTS
Schedule K Base Case Case 2 Case 3 Case 4
5000# Cartwright to Nain
$183.00 $1012.76 $909.13 $942.20 $969.54
5000# Cartwright to Makkovik
$179.00 $952.26 $843.13 $870.71 $890.54
40 Drop Trailer Cartwright-Goose Bay
$875.00 $1575.84 $1,426.34 $1,299.28 $1,168.00
Adult Passenger
Nain to Goose Bay
$114.50 $283.80 $263.64 $263.64 $263.64
Table 6 Comparison of charges using current tariffs and four cost allocations
Analysis of Cost of Labrador Marine Services 14 March 2005
Generally the rates and charges as calculated for the transport of freight illustrate
that these are not particularly sensitive to changes in the assumed portions of allocated
cost. For instance in the case of shipping 5000 pounds from Cartwright to Nain the
variance in charges is 4.2% for a differential of 20% in the allocated costs. In other
words, if the assumed proportion of costs allocated to freight changed from 25% to 45%
the actual freight charge would change by only 4.2%. On the other hand, the level of
charges applied to the transport of drop trailers is more sensitive to the assumed cost
allocations.
Subsequent discussions with Department personnel indicate that perhaps case 4 as
shown above closely represents the actual division of cost components. Thus further
analysis will be limited to that cost allocation.
Ancillary Charges and Charges related to Method of Shipping
The current tariff structure allows for a large number of ancillary charges to be
applied under given circumstances. The concept of these charges appears to be very
reasonable. For instance there is an additional charge for lo-lo service when specialized
equipment is used to load the vessels. There are also wharf surcharges and jockey charges
relating to loading and unloading trailers etc. There are however no cost account records
maintained by Government to indicate the cost being incurred in supplying the various
types and levels of services. Rather these ancillary costs are simply aggregated into the
service fixed costs, presumably the shore based costs and paid to the contractor as such.
The tariffs and rules presented in Schedule “K”, from a conceptual point of view
appear to be very reasonable, however, since all services are provided as part of a fixed
cost contract it is not possible to determine if the charges as indicated are reasonable or
how they are related to the system outputs.
Incentives and Discounts for Various Shipping Methods
The six rate bases identified in Schedule “K” allow for varying rates within each
rate base depending on the method of shipping used and the quantity being shipped. For
instance, if it is wished to ship 5000 pounds from Cartwright to Nain the cost could be as
little as $3.66 per hundredweight if moved in a Government owned container to $7.55 per
Analysis of Cost of Labrador Marine Services 15 March 2005
hundredweight if moved as break bulk in temperature control. As separate accounts
indicating the cost associated with each method of shipment employed are not
maintained, it is impossible to determine if the differentials are fair and justified. Also in
the absence of detailed cost data it is not possible to construct a series of discounts or
differentials that are related to the incurred costs. To utilize such a series of differentials,
some arbitrary system must be used.
The use of varying rates depending on the method of shipping employed is very
reasonable as it encourages the best use of equipment and generally reduces losses and
damages. For instance the effect of offering a lower rate for goods that are shipped in
containers as opposed to break bulk, is to encourage shippers to consolidate shipments,
provide ease of handling, allow for more efficient of space within the vessel, and
eliminate some of the causes of damages to goods. However, under the current
arrangement with the service management company, wherein a fixed cost is paid for
operation of the service, the contractor is paid the full tendered price regardless of the
method of shipping employed. If all of the freight was shipped as break bulk there would
be no impact on the Government, from a cost point of view.
The Appropriateness of Using 2003 as a Base Year
As indicated earlier, this analysis has been based on data reflecting the operating
season of 2003. As also indicated, 2003 was a year in which there was significant traffic
change. As a result base rates developed using such data may not reflect a more normal
operating season. Unfortunately, data from a more normal operating season are simply
not available. This however should not preclude the use of the rate and fare structure as
presented from being utilized.
While the traffic data as used may be somewhat suspect in that it may or may not
be representative of a normal operating season, the cost data are not. The cost data are
very heavily weighted toward the fixed cost component. By nature of the management
contracts, except for changes due to CPI increases, these fixed costs are not likely to
change before the end of the current contracts.
Although the traffic volumes to Cartwright and Goose Bay are likely to change
due to service changes implemented in 2004, traffic to/from the isolated communities is
Analysis of Cost of Labrador Marine Services 16 March 2005
very likely to remain as in 2003 and when rates are calculated on a basis of system
averages, the overall effect is not likely to be dramatic. Thus the use of these data is
judged as acceptable.
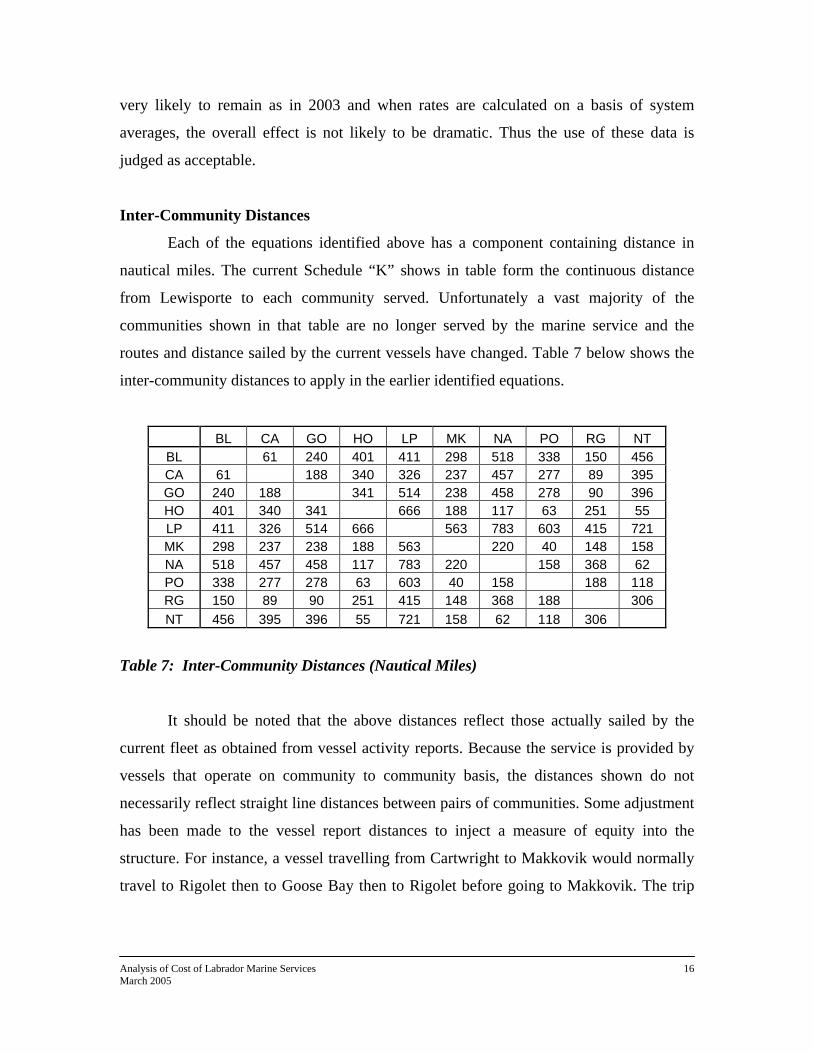
Inter-Community Distances
Each of the equations identified above has a component containing distance in
nautical miles. The current Schedule “K” shows in table form the continuous distance
from Lewisporte to each community served. Unfortunately a vast majority of the
communities shown in that table are no longer served by the marine service and the
routes and distance sailed by the current vessels have changed. Table 7 below shows the
inter-community distances to apply in the earlier identified equations.
BL CA GO HO LP MK NA PO RG NT BL 61 240 401 411 298 518 338 150 456 CA 61 188 340 326 237 457 277 89 395 GO 240 188 341 514 238 458 278 90 396 HO 401 340 341 666 188 117 63 251 55 LP 411 326 514 666 563 783 603 415 721 MK 298 237 238 188 563 220 40 148 158 NA 518 457 458 117 783 220 158 368 62 PO 338 277 278 63 603 40 158 188 118 RG 150 89 90 251 415 148 368 188 306 NT 456 395 396 55 721 158 62 118 306
Table 7: Inter-Community Distances (Nautical Miles)
It should be noted that the above distances reflect those actually sailed by the
current fleet as obtained from vessel activity reports. Because the service is provided by
vessels that operate on community to community basis, the distances shown do not
necessarily reflect straight line distances between pairs of communities. Some adjustment
has been made to the vessel report distances to inject a measure of equity into the
structure. For instance, a vessel travelling from Cartwright to Makkovik would normally
travel to Rigolet then to Goose Bay then to Rigolet before going to Makkovik. The trip
Analysis of Cost of Labrador Marine Services 17 March 2005
from Rigolet to Goose Bay and back to Rigolet adds approximately 180 nautical miles to
the journey. The above table omits the Rigolet-Goose Bay-Rigolet distance.
Application of Base Rates
This analysis has developed equations to enable the calculation of inter
community charges for freight and passenger movements which if implemented would
see revenues sufficient to cover all costs. Because detailed cost records are not
maintained by Government the analysis was conducted using system average costs.
While rates based on system average costs can provide an accurate and fair set of charges
to be applied to system users it can also present some unique problems. As pointed out it
is not the policy of Government to attempt to recover all operations costs from users of
the system. One fair way of implementing the proposed rate and fare structure based on
system average costs, is, for each freight shipment or passenger journey, to calculate the
base rate using the above proposed equations and then simply to charge the customer the
percentage of that rate that the Government wishes to recover. For instance, if the base
rate to ship a quantity of freight between two communities is, say $730.00, and by policy
the Government wishes to collect 22% of its cost, then the charge to the shipper would
simply be 22% of $730.00 or $160.60.
It may be somewhat simplistic to assume that a single percentage reflecting the
total percentage of cost that the Government wishes to recover should be applied to all
rates and fares. The equations as shown rely on system average cost, which may not be
indicative of actual cost which are incurred in the movement of freight and vehicles and
attempting to recover a pre-determined “across the board” fixed percentage could lead to
anomalies and perceived unfairness. To illustrate this point an analysis was completed
comparing current rates with the full rate if Case 4 equations were used and if pre-set
percentages of the Case 4 equations were used. Table 8 below demonstrates the resulting
variances.
As can be seen, if Government was to decide that it wished to recover 30% of its
costs as determined by the Case 4 equations, many of the current rates would increase
while others would decrease. For instance, 5,000 pounds moving as break bulk between
Goose Bay and Hopedale would see a slight decrease, from $284.00 to $277.83, while
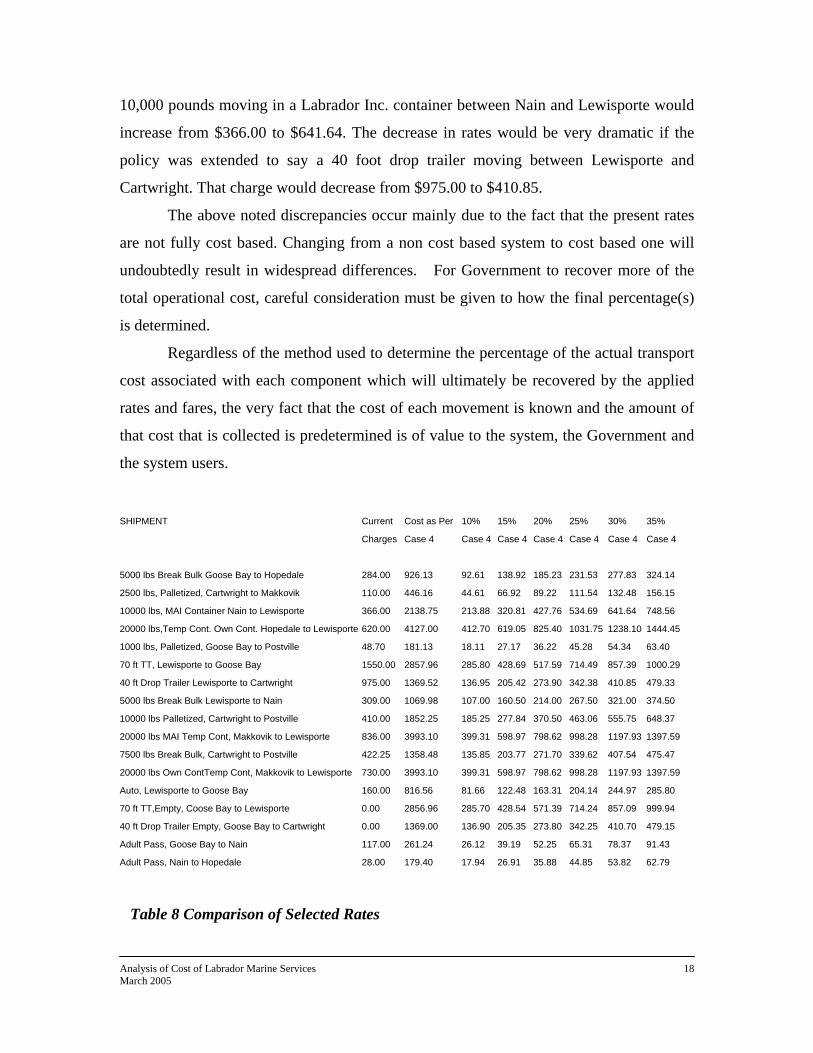
Analysis of Cost of Labrador Marine Services 18 March 2005
10,000 pounds moving in a Labrador Inc. container between Nain and Lewisporte would
increase from $366.00 to $641.64. The decrease in rates would be very dramatic if the
policy was extended to say a 40 foot drop trailer moving between Lewisporte and
Cartwright. That charge would decrease from $975.00 to $410.85.
The above noted discrepancies occur mainly due to the fact that the present rates
are not fully cost based. Changing from a non cost based system to cost based one will
undoubtedly result in widespread differences. For Government to recover more of the
total operational cost, careful consideration must be given to how the final percentage(s)
is determined.
Regardless of the method used to determine the percentage of the actual transport
cost associated with each component which will ultimately be recovered by the applied
rates and fares, the very fact that the cost of each movement is known and the amount of
that cost that is collected is predetermined is of value to the system, the Government and
the system users.
SHIPMENT Current Cost as Per 10% 15% 20% 25% 30% 35%
Charges Case 4 Case 4 Case 4 Case 4 Case 4 Case 4 Case 4
5000 lbs Break Bulk Goose Bay to Hopedale 284.00 926.13 92.61 138.92 185.23 231.53 277.83 324.14
2500 lbs, Palletized, Cartwright to Makkovik 110.00 446.16 44.61 66.92 89.22 111.54 132.48 156.15
10000 lbs, MAI Container Nain to Lewisporte 366.00 2138.75 213.88 320.81 427.76 534.69 641.64 748.56
20000 lbs,Temp Cont. Own Cont. Hopedale to Lewisporte 620.00 4127.00 412.70 619.05 825.40 1031.75 1238.10 1444.45
1000 lbs, Palletized, Goose Bay to Postville 48.70 181.13 18.11 27.17 36.22 45.28 54.34 63.40
70 ft TT, Lewisporte to Goose Bay 1550.00 2857.96 285.80 428.69 517.59 714.49 857.39 1000.29
40 ft Drop Trailer Lewisporte to Cartwright 975.00 1369.52 136.95 205.42 273.90 342.38 410.85 479.33
5000 lbs Break Bulk Lewisporte to Nain 309.00 1069.98 107.00 160.50 214.00 267.50 321.00 374.50
10000 lbs Palletized, Cartwright to Postville 410.00 1852.25 185.25 277.84 370.50 463.06 555.75 648.37
20000 lbs MAI Temp Cont, Makkovik to Lewisporte 836.00 3993.10 399.31 598.97 798.62 998.28 1197.93 1397.59
7500 lbs Break Bulk, Cartwright to Postville 422.25 1358.48 135.85 203.77 271.70 339.62 407.54 475.47
20000 lbs Own ContTemp Cont, Makkovik to Lewisporte 730.00 3993.10 399.31 598.97 798.62 998.28 1197.93 1397.59
Auto, Lewisporte to Goose Bay 160.00 816.56 81.66 122.48 163.31 204.14 244.97 285.80
70 ft TT,Empty, Coose Bay to Lewisporte 0.00 2856.96 285.70 428.54 571.39 714.24 857.09 999.94
40 ft Drop Trailer Empty, Goose Bay to Cartwright 0.00 1369.00 136.90 205.35 273.80 342.25 410.70 479.15
Adult Pass, Goose Bay to Nain 117.00 261.24 26.12 39.19 52.25 65.31 78.37 91.43
Adult Pass, Nain to Hopedale 28.00 179.40 17.94 26.91 35.88 44.85 53.82 62.79
Table 8 Comparison of Selected Rates
Analysis of Cost of Labrador Marine Services 19 March 2005
As was brought to the attention of the study group in earlier parts of the study of
the Labrador Marine service, many shippers are not aware of the extent to which
Government subsidizes this service. By showing on each waybill the actual cost of each
movement and the amount of subsidy thereon, the shipper would be more enlightened on
this matter.
Conclusions and Recommendations
The data available to the study group enabled the identification of user cost of
providing transportation to and from Labrador communities. The equations developed in
this analysis permit the calculation of the cost of moving freight, vehicles and passengers
from community to community. These equations account on a system basis for the full
operational cost, including all vessel and shore based fixed costs, variable handling costs
and variable vessel costs. The variable vessel costs accommodate distance over which
freight or passengers are moved. Thus the longer the distance, the greater the transport
charge although because the overwhelming component of cost is that attributed to the
fixed portion, the fixed part dominates the ultimate rate or fare. It is concluded that these
equations offer a fair and equitable method of determining rates and fares. The adoption
of the equations and the application of fixed percentages of subsidization is a complicated
issue and in light of the fact that detailed cost records are not available it is problematic
for the Government to invoke these equations to determine a series of tariffs for the 2005
operating season. More detailed cost information is required.
While it is concluded that the application of the equations referred to as Case 4
would yield very fair and equitable rates and fares it must be noted that there may be very
significant differences from existing rates and fares. In some cases rates would decrease
while in other cases rates would increase. In the absence of detailed cost records it is not
possible to determine the full extent of these variances. If Government wishes to
implement a system of rates that is less arbitrary than the current rates and is related to
the operational cost of the provision of service, the identified equations can be used to
set rates and fares. It must be strongly pointed out however that because these
equations have been developed on the basis of system average cost and not exact cost
Analysis of Cost of Labrador Marine Services 20 March 2005
related to particular movements( ie the exact cost of palletised vs containerised vs
break bulk etc.) there is likely to be dramatic variances from existing rates. This will
undoubtedly encourage widespread discontent among the system users.
As indicated in an earlier section it was noted that the current Schedule “K” lists
several ancillary charges that are applied to freight and vehicle transport, depending on
the type of effort required to load, off load, or handle these. It is concluded that these
charges are relatively minor and account for only a small portion of system revenues.
These can be utilized without modification in any system of rates and tariffs.
It was also noted that the present rates are structured to account for the method of
shipping employed. There are eight distinct methods of shipping identified in Schedule
“K”. ie palletised, containerised, temperature controlled etc. Presumably these rate
differentials encourage the shipper to use the most appropriate mode of shipping, they
also aid in the handling and storage of cargo and reduce loss and damages. These charges
are highly significant. Currently approximately 40% of freight is moved as palletised
with the other categories accounting for the remaining 60%. The lowest rate is offered for
freight moved in private containers while break bulk freight is charged approximately
78% more than the container rate. Although the Government applies these charges and
price differentials there is no record of the cost incurred by Government in respect of
supplying these types of services. Rather, all the unit or component costs are embedded in
the fixed contract price paid to the service contractor. It is not known if the level of
charges and prices indicated in Schedule “K”are sufficient to fully recover the associated
costs incurred by the contractor. Conceivably, the charges could be ample in which case
the contractor would make a profit or the charges could be deficient which would then
require the contractor to subsidize these from some other aspect of the service. Without
detailed cost records it is impossible to determine the appropriateness of the magnitudes
of these charges and price differentials. Regardless of this, there is some merit in having a
component of the rates which encourages the shipper to use the most efficient method of
shipping.
If Government wishes to charge ancillary cost which reflect particular discrete
efforts expended in completing the transport services, in the absence of reliable cost data
it may arbitrarily use the charges as identified in the current Schedule “K” rate book.
Analysis of Cost of Labrador Marine Services 21 March 2005
Similarly if it is wished that charges reflect the method of shipping employed eg
containerised etc., Government might institute a series of arbitrary surcharges to
accommodate these. If these charges are instituted some estimate of these should be made
and that amount subtracted from the system fixed cost. In order to arrive at a more
equitable set of ancillary charges Government should, beginning with the 2005 operating
season maintain good cost data and records which could be used to properly develop such
schedule of charges.
Finally, an analysis of output costs associated with the Northern Ranger presented
in this report clearly illustrates that the vessel is under-utilised and a result very costly for
the service provided. An earlier report completed by the Public Policy Research Centre
(Labrador Marine Service, Phase 2) recommended that when the Trans Labrador highway
is completed both the Sir Robert Bond and The Northern Ranger might be retired and a
single vessel with freight and passenger capabilities be obtained in order to service the
isolated northern communities of Labrador from Goose Bay. The cost analysis as
presented in this report further substantiates that recommendation.