AN INVESTIGATION INTO THE SOLID STATE PROPERTIES … of... · An Investigation into the Solid State...
324
Maria de Fátima Gomes Pina AN INVESTIGATION INTO THE SOLID STATE PROPERTIES OF OLANZAPINE AND PAROXETINE HCl AND THEIR SOLID DISPERSION SYSTEMS Tese de Doutoramento em Farmácia, especialidade de Tecnologia Farmacêutica, orientada pelo Professor Doutor João Fernandes de Abreu Pinto e pelo Professor Doutor João José Martins Simões de Sousa e apresentada à Faculdade de Farmácia da Universidade de Coimbra Fevereiro de 2014
-
Upload
phungxuyen -
Category
Documents
-
view
263 -
download
1
Transcript of AN INVESTIGATION INTO THE SOLID STATE PROPERTIES … of... · An Investigation into the Solid State...

i
Maria de Fátima Gomes Pina
AN INVESTIGATION INTO THE SOLID STATE PROPERTIES OF OLANZAPINE
AND PAROXETINE HCl AND THEIR SOLID DISPERSION SYSTEMS
Tese de Doutoramento em Farmácia, especialidade de Tecnologia Farmacêutica, orientada pelo
Professor Doutor João Fernandes de Abreu Pinto e pelo Professor Doutor João José Martins Simões de Sousa e
apresentada à Faculdade de Farmácia da Universidade de Coimbra
Fevereiro de 2014

An Investigation into the Solid State Properties of Olanzapine
and Paroxetine HCl and their Solid Dispersion Systems
Maria de Fátima Gomes Pina
Tese apresentada à Universidade de Coimbra para apreciação nas provas de
Doutoramento em Farmácia, especialidade de Tecnologia Farmacêutica
Faculdade de Farmácia
Universidade de Coimbra
2014
The work presented in this thesis has been carried out under the supervision
of Professor João Fernandes de Abreu Pinto from the Faculty of Pharmacy,
University of Lisbon and Professor João José Martins Simões de Sousa from
the Faculty of Pharmacy, University of Coimbra.


To my Loving Parents and Sister

Acknowledgments
My gratitude goes out to everyone who devoted time, knowledge and heart to this project.
I do not have room to name all of you here, but I could not have done it without you!
First and foremost, important references are to the people by whom I have been taught,
challenged and supervised. I owe endless thanks to Professor Duncan Craig and Dr Min Zhao
for their constant guidance, scientific expertise and patience. I feel deeply honoured to have
been part of their research group. I thank Professor João Pinto and Professor João Sousa for
embracing me into this project, without their initiation this thesis would not have been
possible. Thanks also for their encouragement, advices and useful discussions.
My indebted thanks are extended to Dr László Fábián for his time, forward thinking and
meaningful comments. I also thank Dr Susan Barker and Dr Jonathan Moffat for their helpful
suggestions. The ‘Pharmorphix Team’ and Dr Tomislav Friščić are gratefully acknowledged in
this thesis for the VT-XRPD and VH-XRPD experiments, respectively, and also technical
assistance. I also thank Professor João Canotilho and Professor Ricardo Castro for their
advices and guidance in the very beginning of this project.
I am thankful to all my friends who have helped and supported me along this long but
fulfilling road. I feel very lucky to have such a good ones! In particular, I am thankful to Chan
Siok Yee for the fuzzy discussions and intellectual companionship. To the best housemates
ever, Lorina Bisharat, Doroty Codoni, Alberto Berardi and Giulia Pergolizzi, I will be always
grateful for their sincere friendship and cheerful support. Many thanks also extended to
Claudia Pigliacelli, Kai-Hui Leong, Ziyi Yang, Israa Al-Barahmieh, Germeen Girgis,
Abdulrahman Saeed, Dereck Xolani Gondongwe, Bahijja Raimi-Abraham, Awis Sabere, Goh
Choon Fu, Pratchaya Tipduangta, Liu Yang, Yanhong Wang, Stefania Marano, present and past
members of ‘The Thermal Underground’, the best Research Group ever!
I would like to thank also all my friends back in Portugal. I thank all the team from the
Department of Technology FFUC namely Susana Simões, ‘Nanomeninas’, Carla Vitorino,
Raquel Teixeira and Ivo Alexandre for their support and friendship. From the ‘FFUL team’ I
would like to thank Abhinav Joseph, Gonçalo Oliveira, Andreia Cordeiro, Maria Paisana, and
Iris Duarte for their care and good humour.
Thanks are also extended to my University friends, Lenita, Janete and Lilia, although spending
little time with them lately, I knew that I could always count with their cheerful support and

friendship. The sisters Pinhal and the little Martuxa, are also acknowledge here for all their
help and for making me believe that I could finish this task! Finally, very special thanks go to
Amélia Vieira, Carla Varela, Liliana Ribeiro and Sílvia Carvalho for their unwavering
friendship and intense encouragement through this pathway.
Above all, I would like to express my deepest gratitude to my family. Thanks to Rui Gaita for
his cheerful humour and support. To my dear Mother Maria, Father Mário and Sister
Elisabete, I am deeply grateful for their unconditional love, support and encouragement.
Without them always by my side, this thesis would not have been possible.
The mere expression of thanks does not suffice!

The work presented in this thesis was supported by Fundação para a Ciência e Tecnologia,
Portugal (SFRH/BD/46697/2008) through the POPH/FSE (QREN) program.


Nothing in life is to be feared, it is only to be understood.
Now is the time to understand more, so that we may fear less.
Marie Curie

xiii
Abstract
Physical characterisation of pharmaceutical solids is an integral aspect of the drug
development process and has attracted increased attention over the past decades. Each
active pharmaceutical ingredient (API), may exist in different crystalline forms
(polymorphs), incorporate water in their structure (pseudopolymorphs) or be converted,
intentionally or not, to an amorphous state. As consequence of all this variety of forms, a
full toolbox of characterisation techniques is nowadays available, combining high
resolution thermoanalytical techniques with highly precise diffraction methods and
advanced computational resources.
The work presented in this thesis aimed to provide an in-depth understanding of the
physicochemical properties of single drug molecules (olanzapine and paroxetine HCl) and
final formulated systems in varying physical states including different crystalline entities
and amorphous systems. In this work, a combination of thermal (standard differential
scanning calorimetry (DSC), modulated temperature DSC (MTDSC), thermogravimetric
analysis (TGA) and hot stage microscopy (HSM)), diffraction (X-ray powder diffraction
(XRPD) combined, in some studies, with variable humidity (VH) or temperature (VT)) and
spectroscopic techniques (attenuated total reflectance–Fourier transform infrared
(ATR-FTIR)) were extensively used. Dynamic vapour sorption (DVS), Karl Fischer
titration (KFT) and scanning electron microscopy (SEM) were as well of great importance.
Dissolution performance and physical stability studies were also evaluated.
At first, a thorough investigation into the solid state of paroxetine HCl was performed.
Aspects such as the interaction with water and the interconversion between the two
crystalline forms, Form I and II, were fully explored. This enabled to successfully
clarifying the nature, location and bonding strength of the water molecules in the
crystalline structure of paroxetine HCl Form II (Chapter 3). These findings allowed proper
recognition of Form II as a non-stoichiometric hydrate with unusual behaviour, and
challenges the previous designation as an anhydrous form with a hygroscopic nature. On
the other hand, the specific conditions that led to the dehydration of Form I were fully
investigated (Chapter 4). The dehydration of Form I was found to require both ultra-dry

xiv
environment and high temperatures. As a consequence of this process a new anhydrous
form of paroxetine HCl has been identified.
After this structural characterisation, studies were conducted on the conversion of
paroxetine HCl to an amorphous state, either alone (Chapter 5) or molecularly dispersed in
polyvinylpyrrolidone vinyl-acetate (PVPVA, Chapter 6). Chapter 5 provided a detailed
thermal characterisation using thermodynamic and kinetic parameters of amorphous
paroxetine HCl prepared via melt quenching method. The results obtained were then
correlated with the stability of this form over storage. In Chapter 6, parameters such as the
initial hydration state of the drug (paroxetine Forms I and II) and the methodology used
(spray drying (SD) and hot melt extrusion (HME)) were found not only to influence the
dissolution rate of the prepared systems but also its physical stability. Finally, the acquired
knowledge in the preparation of solid dispersion systems was applied to a
Biopharmaceutical Classification System (BCS) Class 2 drug (olanzapine, OLZ) using
HME as the selected technology and considering the influence of different polymeric
carriers (Chapter 7). This study showed an interesting interplay between the extrusion
temperature, drug loading, drug physical state and polymer chemistry that can be further
applied to other poorly soluble APIs.
To conclude, the research carried out and detailed within this thesis aims to contribute to a
better understanding of the complex solid state characterisation of pharmaceutical drugs
and formulated systems prepared via solid dispersion methods. To the end, this work has
identified several issues and possible areas for future research in the pharmaceutical field.
Keywords: amorphous, anhydrous, hydrate, olanzapine, paroxetine HCl, polymorphism,
pseudopolymorphism, solid dispersion, solid state, structural analysis, thermal analysis

xv
Resumo
A caracterização física de fármacos e excipientes é um aspecto integrante do processo de
desenvolvimento de medicamentos e tem atraído crescente atenção ao longo das últimas
décadas. Cada fármaco (active pharmaceutical ingredient (API)) ou mesmo excipiente,
pode existir em diferentes formas cristalinas (polimorfos), incorporar água na sua estrutura
(pseudopolimorfos) ou ser convertido, de forma intencional ou não, num estado amorfo.
Em consequência desta variedade possível de formas, um conjunto de técnicas de
caracterização encontra-se hoje em dia disponível, combinando técnicas termoanalíticas de
alta resolução com métodos de difração de alta precisão e recursos computacionais
avançados.
O trabalho apresentado nesta tese teve como objetivo proporcionar uma compreensão
profunda das propriedades físico-químicas de fármacos (olanzapina e cloridrato de
paroxetina) e produtos finais em vários estados físicos, incluindo diferentes entidades
cristalinas e sistemas amorfos. Neste trabalho, uma combinação de técnicas térmicas
(calorimetria de varrimento diferencial (DSC), com ou sem modelação de temperatura
(MTDSC)), análise termogravimétrica (TGA) e microscopia de platina aquecida (HSM)),
difração (difração de raios X de pó (XRPD) combinada, em alguns estudos, com variação
de humidade (VH) ou temperatura (VT)) e técnicas espectroscópicas (espectroscopia de
infravermelho (ATR-FTIR)) foram amplamente utilizadas. Dynamic vapour sorption
(DVS), Karl Fischer (KFT) e microscopia eletrónica de varrimento (SEM) foram também
de grande importância. Finalmente, ensaios de dissolução e estudos de estabilidade física
foram ainda conduzidos em casos específicos.
Numa primeira fase, foi desenvolvido um estudo pormenorizado sobre o estado sólido do
cloridrato de paroxetina. Aspectos tais como a interação com a água e a interconversão
entre as duas formas cristalinas do cloridrato de paroxetina, Formas I e II, foram
cuidadosamente exploradas. Este estudo permitiu clarificar a natureza, localização e força
de ligação das moléculas de água na estrutura cristalina da Forma II do cloridrato de
paroxetina (Capítulo 3). Estes resultados permitiram assim identificar a Forma II como um
hidrato não estequiométrico com um comportamento peculiar e excluir a sua prévia
designação enquanto forma anidra com uma natureza higroscópica. Por outro lado, as
xvi
condições específicas capazes de promover a desidratação da Forma I foram também
estudadas (Capítulo 4). Verificou-se que a desidratação desta forma exige um ambiente
extremamente seco e altas temperaturas. Em consequência deste processo uma nova forma
anidra do cloridrato de paroxetina foi identificada.
Após a caracterização estrutural das duas formas cristalinas do cloridrato de paroxetina,
foram ainda realizados estudos sobre a conversão deste fármaco num estado amorfo, quer
individualmente (Capítulo 5) ou disperso a nível molecular em polivinilpirrolidona
vinil-acetato (PVPVA, Capítulo 6). O Capítulo 5 apresenta uma caracterização detalhada,
com recurso a parâmetros termodinâmicos e cinéticos, da forma amorfa do cloridrato de
paroxetina preparada por fusão e rápido arrefecimento. Os resultados obtidos foram em
seguida correlacionados com a estabilidade física observada experimentalmente. Em
continuação, o trabalho apresentado no Capítulo 6 concluiu que parâmetros, tais como o
estado inicial de hidratação das duas formas da paroxetina e a metodologia usada para
preparar as dispersões sólidas (spray drying (SD) e extrusão a quente (HME)), influenciam
não só a velocidade de dissolução dos sistemas preparados, mas também a sua estabilidade
e tendência para recristalização. Finalmente, o conhecimento adquirido na preparação de
sistemas de dispersão sólida foi aplicado a um fármaco (olanzapina, OLZ) pertencente à
Classe 2 do Sistema de Classificação Biofarmacêutico (BCS) usando HME como
tecnologia selecionada e considerando a influência de diferentes polímeros (Capítulo 7).
Este estudo revelou uma interessante relação entre a temperatura de extrusão, dosagem e
estado físico do fármaco e ainda estrutura química do polímero. Os resultados obtidos
neste estudo visam contribuir para um melhor entendimento das estratégias possíveis
usadas no melhoramento da velocidade de dissolução de outros fármacos pouco solúveis.
A título de conclusão, o estudo conduzido e apresentado detalhadamente nesta tese
pretende contribuir para uma melhor compreensão da caracterização complexa do estado
sólido de fármacos e sistemas farmacêuticos preparados através de métodos de dispersão
sólida. Finalmente, este trabalho identificou vários problemas e possíveis áreas de
investigação futura no domínio farmacêutico.
Palavras-chave: amorfo, análise estrutural, análise térmica, anidro, cloridrato de
paroxetina, dispersão sólida, estado sólido, hidrato, olanzapina, polimorfismo,
pseudopolimorfismo
xvii
Table of Contents
LIST OF FIGURES ................................................................................................................... XXV
LIST OF TABLES .................................................................................................................. XXXII
LIST OF ABBREVIATIONS & SYMBOLS ...................................................................... XXXIV
SCOPE AND OVERVIEW ......................................................................................................... 36
Motivation and Contextual Objectives ......................................................................................... 37
Organisation of the Thesis and Main Objectives ........................................................................ 37
Scientific Publications and Conferences ...................................................................................... 39
1 INTRODUCTION ................................................................................................................ 41
1.1 General Introduction ........................................................................................................ 43
1.2 States of Matter ................................................................................................................. 43
1.2.1 Structural Aspects of Crystalline Solids ......................................................................... 46
1.2.2 Cambridge Structural Database ...................................................................................... 47
1.3 Polymorphism ................................................................................................................... 47
1.3.1 Structural Aspects of Polymorphism .............................................................................. 50
1.3.1.1 Packing and Conformational Polymorphism ......................................................... 50
1.3.1.2 Monotropism and Enantiotropism ......................................................................... 51
1.3.2 Thermodynamics of Polymorphic Systems .................................................................... 52
1.4 Hydrates in the Pharmaceutical Industry ....................................................................... 54
1.4.1 Classification of Hydrates ............................................................................................... 56
1.4.2 Insights on the Characterisation of Hydrates .................................................................. 57
1.4.3 Stability and Performance of Hydrates ........................................................................... 61
1.5 Polymorphism and Patents .............................................................................................. 63
xviii
1.6 Amorphous Systems .......................................................................................................... 65
1.6.1 Amorphous Solids: Formation and Properties ................................................................ 65
1.6.1.1 Generation of Amorphous Materials by Cooling from the Melt ............................ 66
1.6.1.2 The Glass Transition Temperature ......................................................................... 67
1.6.1.3 Molecular Mobility and Enthalpy Relaxation ........................................................ 68
1.6.1.4 Physical and Chemical Stability ............................................................................ 70
1.7 Solid Dispersion Technology ............................................................................................ 71
1.7.1 Preparation Methods for Solid Dispersions .................................................................... 74
1.7.1.1 Melting Methods .................................................................................................... 74
1.7.1.1.1. Traditional Melting Methods ............................................................................ 74
Hot Melt Extrusion ............................................................................................ 74 1.7.1.1.2
1.7.1.2 Solvent Methods .................................................................................................... 75
Solvent Evaporation Methods............................................................................ 75 1.7.1.2.1
Freeze Drying .................................................................................................... 75 1.7.1.2.2
Spray Drying...................................................................................................... 76 1.7.1.2.3
Electrospinning .................................................................................................. 76 1.7.1.2.4
1.7.2 Advantages, Disadvantages and Concerns of Solid Dispersions .................................... 77
1.8 Phase Transformations during Processing ..................................................................... 78
1.8.1 Milling ............................................................................................................................ 81
1.8.2 Wet Granulation.............................................................................................................. 81
1.8.3 Compression ................................................................................................................... 82
1.8.4 Freeze Drying ................................................................................................................. 82
1.9 Research Objectives .......................................................................................................... 83
2 MATERIALS AND METHODS ........................................................................................ 84
2.1 Materials ............................................................................................................................ 85
2.1.1 Paroxetine Hydrochloride ............................................................................................... 85
2.1.2 Olanzapine ...................................................................................................................... 87
2.1.3 Polyvinylpyrrolidone ...................................................................................................... 92
2.1.4 Polyvinylpyrrolidone Vinyl-Acetate............................................................................... 93
2.1.5 Soluplus® ........................................................................................................................ 95
2.1.6 Raw Materials Sourcing ................................................................................................. 96
xix
2.2 Preparation of Solid Dispersions ..................................................................................... 98
2.2.1 Spray Drying ................................................................................................................... 98
2.2.2 Hot Melt Extrusion ....................................................................................................... 100
2.3 Characterisation Techniques ......................................................................................... 102
2.3.1 Differential Scanning Calorimetry................................................................................ 102
2.3.1.1 Principles of Operation ........................................................................................ 102
2.3.1.2 Experimental Variables ........................................................................................ 103
2.3.1.3 Modulated Temperature Differential Scanning Calorimetry ............................... 105
Principles of Operation .................................................................................... 105 2.3.1.3.1
Experimental Variables ................................................................................... 105 2.3.1.3.2
2.3.2 Hot Stage Microscopy .................................................................................................. 106
2.3.3 Thermogravimetric Analysis ........................................................................................ 107
2.3.4 Dynamic Vapour Sorption ............................................................................................ 108
2.3.5 Attenuated Total Reflection–Fourier Transform Infrared ............................................ 108
2.3.6 X-Ray Powder Diffraction ............................................................................................ 109
2.3.7 Scanning Electron Microscopy ..................................................................................... 111
2.3.8 Karl Fischer Titration ................................................................................................... 111
2.3.9 Dissolution Studies ....................................................................................................... 112
3 IDENTIFICATION AND CHARACTERISATION OF STOICHIOMETRIC AND
NON-STOICHIOMETRIC HYDRATE FORMS OF PAROXETINE HCL:
REVERSIBLE CHANGES IN CRYSTAL DIMENSIONS AS A FUNCTION OF WATER
ABSORPTION ............................................................................................................................ 114
3.1 Introduction ..................................................................................................................... 116
3.2 Materials and Methods ................................................................................................... 118
3.2.1 Materials ....................................................................................................................... 118
3.2.2 Methods ........................................................................................................................ 118
3.2.2.1 Thermal Analysis ................................................................................................. 118
3.2.2.2 Karl Fischer Titration (KFT)................................................................................ 119
3.2.2.3 Attenuated Total Reflection-Fourier Transform Infrared (ATR-FTIR) ............... 119
3.2.2.4 Dynamic Vapour Sorption (DVS) ........................................................................ 119
3.2.2.5 X-Ray Power Diffraction (XRPD) and Variable Humidity XRPD (VH-XRPD) 120
3.2.2.6 Computational Modeling of Crystal Structures ................................................... 120

xx
3.3 Results and Discussion .................................................................................................... 121
3.3.1 Differential Scanning Calorimetry (DSC) .................................................................... 121
3.3.2 Thermogravimetric Analysis (TGA) ............................................................................ 125
3.3.3 Karl Fischer Titration (KFT) ........................................................................................ 127
3.3.4 Attenuated Total Reflection-Fourier Transformer Infrared (ATR-FTIR) .................... 127
3.3.5 Dynamic Vapour Sorption (DVS) ................................................................................ 130
3.3.6 Variable Humidity X-Ray Powder Diffraction (VH-XRPD) ....................................... 131
3.3.7 Crystal Structure Models .............................................................................................. 135
3.4 Conclusions ...................................................................................................................... 138
4 AN INVESTIGATION INTO THE DEHYDRATION BEHAVIOUR OF
PAROXETINE HCL FORM I USING A COMBINATION OF THERMAL AND
DIFFRACTION METHODS: THE IDENTIFICATION AND CHARACTERISATION
OF A NEW ANHYDROUS FORM .......................................................................................... 140
4.1 Introduction ..................................................................................................................... 142
4.2 Materials and Methods ................................................................................................... 145
4.2.1 Materials ....................................................................................................................... 145
4.2.2 Methods ........................................................................................................................ 146
4.2.2.1 Thermal Analysis ................................................................................................. 146
4.2.2.2 Karl Fischer Titration (KFT)................................................................................ 146
4.2.2.3 Scanning Electron Microscopy (SEM) ................................................................ 146
4.2.2.4 High Performance Liquid Chromatography (HPLC) ........................................... 147
4.2.2.5 Variable Temperature X-Ray Power Diffraction (VT-XRPD) ............................ 147
4.3 Results and Discussion .................................................................................................... 148
4.3.1 Thermoanalytical Investigation of the Dehydration Process ........................................ 148
4.3.2 Dehydration Kinetics .................................................................................................... 156
4.3.3 Structural Studies using VT-XRPD .............................................................................. 159
4.4 Conclusions ...................................................................................................................... 166

xxi
5 AMORPHOUS PAROXETINE HCL: THE RELATIONSHIP BETWEEN
THERMODYNAMIC/KINETIC PARAMETERS, DRUG PERFORMANCE AND
STABILITY ................................................................................................................................. 168
5.1 Introduction ..................................................................................................................... 170
5.2 Materials and Methods ................................................................................................... 177
5.2.1 Materials ....................................................................................................................... 177
5.2.2 Methods ........................................................................................................................ 177
5.2.2.1 Preparation of Amorphous Paroxetine HCl ......................................................... 177
5.2.2.2 Thermal Analysis ................................................................................................. 177
5.2.2.3 X-Ray Powder Diffraction (XRPD) ..................................................................... 178
5.2.2.4 Attenuated Total Reflection-Fourier Transform Infrared (ATR-FTIR) ............... 178
5.2.2.5 Solubility Measurements...................................................................................... 178
5.2.2.6 Dissolution Studies .............................................................................................. 178
5.2.2.7 Physical Stability ................................................................................................. 179
5.3 Results and Discussion .................................................................................................... 179
5.3.1 Thermodynamic and Kinetic Parameters on the Classification of Paroxetine HCl as a
Glass Former .............................................................................................................................. 179
5.3.2 Characterisation of Freshly Prepared Amorphous Paroxetine HCl .............................. 185
5.3.2.1 Thermal Response of Amorphous Paroxetine HCl .............................................. 185
5.3.2.2 ATR-FTIR and XRPD Characterisation of Amorphous Paroxetine HCl ............ 185
5.3.3 Drug Performance Assessment ..................................................................................... 186
5.3.3.1 Solubility Measurements...................................................................................... 186
5.3.3.2 Dissolution Studies .............................................................................................. 189
5.3.4 Response of Amorphous Paroxetine HCl Below Tg and Under Different Humidity
Conditions .................................................................................................................................. 190
5.3.4.1 Recrystallisation Behaviour of Paroxetine HCl from the Amorphous State ........ 190
5.3.4.2 Water Content ...................................................................................................... 191
5.3.4.3 Glass Transition Temperature .............................................................................. 192
5.3.4.4 Recrystallisation Temperature ............................................................................. 193
5.3.4.5 Enthalpy of Recrystallisation ............................................................................... 194
5.3.4.6 ATR-FTIR Analysis ............................................................................................. 196
5.3.4.7 XRPD Analysis .................................................................................................... 198
5.4 Conclusions ...................................................................................................................... 200

xxii
6 MISCIBILITY PREDICTION AND THE INFLUENCE OF PREPARATION
METHODS ON THE PROCESSING OF PSEUDOPOLYMORPHS OF PAROXETINE
HCL ............................................................................................................................................... 201
6.1 Introduction ..................................................................................................................... 203
6.2 Materials and Methods ................................................................................................... 208
6.2.1 Materials ....................................................................................................................... 208
6.2.2 Methods ........................................................................................................................ 208
6.2.2.1 Preparation of the Physical Mixtures ................................................................... 208
6.2.2.2 Calculation of Fragility Parameters ..................................................................... 209
6.2.2.3 Melting Point Depression (MPD) ........................................................................ 210
6.2.2.4 Preparation of Solid Dispersions .......................................................................... 210
6.2.2.5 Thermal Analysis ................................................................................................. 210
6.2.2.6 X-Ray Powder Diffraction (XRPD) ..................................................................... 211
6.2.2.7 Attenuated Total Reflection-Fourier Transform Infrared (ATR-FTIR) ............... 211
6.2.2.8 Dynamic Vapour Sorption (DVS) ........................................................................ 211
6.2.2.9 Dissolution Studies .............................................................................................. 212
6.2.2.10 Physical Stability ................................................................................................. 213
6.3 Results and Discussion .................................................................................................... 213
6.3.1 Characterisation of Paroxetine HCl as a Glass Former ................................................ 213
6.3.2 Estimation of Drug-Polymer Miscibility ...................................................................... 214
6.3.3 Thermal Characterisation of the Raw Materials ........................................................... 218
6.3.4 Characterisation of the Freshly Prepared Solid Dispersion Systems ............................ 220
6.3.4.1 Thermal Characterisation ..................................................................................... 220
6.3.4.2 Structural Characterisation of the Solid Dispersion Systems............................... 224
6.3.4.3 Moisture Uptake Studies ...................................................................................... 228
6.3.4.4 Dissolution Studies .............................................................................................. 229
6.3.5 Physical Stability of Solid Dispersions over Storage ................................................... 232
6.3.5.1 DSC Studies ......................................................................................................... 232
6.3.5.2 TGA ..................................................................................................................... 236
6.3.5.3 ATR-FTIR............................................................................................................ 237
6.3.5.4 XRPD ................................................................................................................... 238
6.4 Conclusions ...................................................................................................................... 240

xxiii
7 OLANZAPINE SOLID DISPERSIONS PREPARED VIA HME: IMPACT OF THE
DRUG PHYSICAL STATE AND DIFFERENT POLYMERS ON THE DISSOLUTION
ENHANCEMENT AND STORAGE STABILITY ................................................................ 242
7.1 Introduction ..................................................................................................................... 244
7.2 Materials and Methods ................................................................................................... 247
7.2.1 Materials ....................................................................................................................... 247
7.2.2 Methods ........................................................................................................................ 247
7.2.2.1 Preparation of Hot Melt Extrudates ..................................................................... 247
7.2.2.2 Drug-Polymer Miscibility Prediction ................................................................... 248
(a) Melting Point Depression (MPD) ............................................................................. 248
(b) Hansen Solubility Parameter .................................................................................... 248
7.2.2.3 Crystallinity Quantification.................................................................................. 249
7.2.2.4 Thermal Analysis ................................................................................................. 249
7.2.2.5 Attenuated Total Reflection-Fourier Transform Infrared (ATR-FTIR) ............... 250
7.2.2.6 Dynamic Vapour Sorption (DVS) ........................................................................ 250
7.2.2.7 X-Ray Powder Diffraction (XRPD) ..................................................................... 250
7.2.2.8 Scanning Electron Microscopy (SEM) ................................................................ 250
7.2.2.9 Dissolution Studies .............................................................................................. 250
7.2.2.10 Physical Stability ................................................................................................. 251
7.3 Results and Discussion .................................................................................................... 251
7.3.1 Estimation of Drug-Polymer Miscibility ...................................................................... 251
7.3.2 Properties of the Raw Materials ................................................................................... 256
7.3.3 Physical Characterisation of HME Systems ................................................................. 257
7.3.4 Dissolution Studies ....................................................................................................... 264
7.3.5 Polymer Effect on the Inhibition of OLZ Crystallisation in HME Solid Dispersions .. 270
7.4 Conclusions ...................................................................................................................... 275
8 CONCLUSIONS AND FUTURE WORK ...................................................................... 277
8.1 Summary and Concluding Remarks ............................................................................. 279
8.2 Recommendations for Future Work ............................................................................. 283
9 APPENDICES .................................................................................................................... 285

xxiv
9.1 Appendix A – Chapter 3 ................................................................................................. 286
9.2 Appendix B – Chapter 4 ................................................................................................. 288
10 REFERENCES ................................................................................................................... 295

xxv
List of Figures
Chapter I
Figure 1.1: Schematic depiction of the various types of solids: amorphous (a) and crystalline (b-f).
Crystalline solids can be further classified as polymorphs (b and c), solvates/hydrates (d),
pharmaceutical co-crystals (e) and salts (f). ............................................................................ 44
Figure 1.2: The seven crystal systems, their unit cells and the constraints on the unit cell
dimensions (Florence and Attwood, 2006). ............................................................................ 46
Figure 1.3: Relationship between the selection/optimisation of a drug candidate and the
development stages (Chow et al., 2008). ................................................................................. 49
Figure 1.4: A timeline of events concerning solid state issues with
polymorphism/pseudopolymorphism of pharmaceutical drugs (adapted from (Lee et al.,
2011)). ..................................................................................................................................... 50
Figure 1.5: Free energy (G) as a function of temperature for enantiotropic (left) and monotropic
(right) systems (adapted from (Craig and Reading, 2007)). .................................................... 51
Figure 1.6: Effect of hydration on the physical properties of a pharmaceutical API (Khankari and
Grant, 1995)............................................................................................................................. 55
Figure 1.7: Schematic illustration of how the enthalpy, entropy and volume of a system changes as
a function of temperature. Upper line denotes the pathway of an amorphous material while the
lower line denotes the behaviour of a crystalline material (Bruno and George, 1997). .......... 67
Figure 1.8: Classification of solid dispersions according to the nature of the carrier selected
(adapted from (Vasconcelos et al., 2007)). .............................................................................. 73
Figure 1.9: Illustration of the electrospinning procedure (Bikiaris, 2011). ..................................... 77
Figure 1.10: Schematic representation of possible phase transformations induced during
processing (adapted from reference (Hilfiker, 2006)). ............................................................ 80
Chapter II
Figure 2.1: Mechanism of action of specific serotonin (5-HT) reuptake inhibitors (SSRI)
(www.cnsforum.com). ............................................................................................................. 85
Figure 2.2: Chemical structure of paroxetine HCl. ......................................................................... 86
Figure 2.3: Chemical structure of olanzapine. ................................................................................ 87
Figure 2.4: Chemical structure of PVP. .......................................................................................... 92
Figure 2.5: Chemical structure of PVPVA 6:4. .............................................................................. 93
xxvi
Figure 2.6: Chemical structure of Soluplus®. .................................................................................. 95
Figure 2.7: Buchi Mini Spray Dryer B-290, a laboratory-size model (Buchi brochure). ............... 99
Figure 2.8: Illustration of a typical HME equipment (www.particlesciences.com)...................... 101
Figure 2.9: Schematic representation of a heat flux DSC showing the sample (S) and the reference
(R) pan location within the same furnace (www.anasys.co.uk). ........................................... 103
Chapter III
Figure 3.1: Standard DSC analysis (10 °C/min) of paroxetine HCl Form II in pinhole pans and
open pans. .............................................................................................................................. 122
Figure 3.2: MTDSC analysis (total heat flow, 2 oC/min) of paroxetine HCl Form II in hermetically
sealed pans. ............................................................................................................................ 123
Figure 3.3: XRPD data comparing the form obtained after the recrystallisation of paroxetine HCl
Form II when heated in hermetic sealed pans in the DSC furnace (top) and paroxetine HCl
Form I (bottom). .................................................................................................................... 124
Figure 3.4: Influence of the heating rate on the transformation between Form II and Form I of
paroxetine HCl. Standard DSC runs at 5, 10, 20 and 50 oC/min (downwards) were performed
in hermetically sealed pans. ................................................................................................... 125
Figure 3.5: TGA curve of paroxetine HCl Form II, showing the weight loss and associated
derivative loss curve. ............................................................................................................. 126
Figure 3.6: ATR-FTIR spectra of paroxetine HCl Form II (top) and Form I (bottom). ............... 128
Figure 3.7: Variable temperature ATR-FTIR spectra of paroxetine HCl Form II, measured using a
constant heating rate of 2 oC/min. ......................................................................................... 129
Figure 3.8: Dynamic vapour sorption data for paroxetine HCl Form II. Sorption and desorption
cycles are superimposable. .................................................................................................... 131
Figure 3.9: Crystal structure of Form II with the water-containing voids highlighted in brown.
Generated from data presented in (Howard et al., 2003)....................................................... 132
Figure 3.10: Shifts in the diffractogram peaks upon increasing RH. Only a part of the full XRPD
diffractogram (5.0 to 40.0°) is shown to make the peak shifts visible. ................................. 133
Figure 3.11: XRPD patterns of paroxetine HCl Form II during desorption of water. .................. 133
Figure 3.12: Changes in the unit cell volume of paroxetine HCl Form II according to variation in
relative humidity (RH). ......................................................................................................... 134
Figure 3.13: Comparison of the hydrate (left) and anhydrate (right) models of Form II. The
anhydrate model is presented as a space-filling model to show the lack of unoccupied space in
the structure. .......................................................................................................................... 136
Figure 3.14: Hydrogen-bonding environment of the water molecule in paroxetine HCl Form II. 136
xxvii
Figure 3.15: Hydrogen-bonding environment of the water molecule in Form I. .......................... 137
Chapter IV
Figure 4.1: Chemical structure of paroxetine HCl Form I. ........................................................... 144
Figure 4.2: DSC traces of paroxetine HCl Form I at 10 °C/min in hermetic, pinhole and open
pans. ....................................................................................................................................... 148
Figure 4.3: Standard DSC traces of paroxetine HCl Form I and II when heated in open pans at
2 ºC/min. ................................................................................................................................ 150
Figure 4.4: Dehydration of paroxetine HCl Form I inside DSC through heat-cool-heat cycling
procedure in open pans. MTDSC was used with a HR of 2 oC/min, modulation amplitude of
0.318 oC and a period of 60 sec. ............................................................................................ 152
Figure 4.5: Microphotographs of paroxetine HCl Form I heated at 2 oC/min. Scale bar represents
150 µm................................................................................................................................... 153
Figure 4.6: DSC (____
) and TGA (_ _ _
) thermographs for paroxetine HCl Form I in open pans at
2 oC/min. The derivative weight curve (-
.-
.-) is presented for clarity. ................................... 154
Figure 4.7: Representation of the conversion fraction (α) versus time obtained from TGA
isothermal data at the different temperatures. ....................................................................... 155
Figure 4.8: Activation energy, Ea, plotted as a function of the extent of conversion, α, for the
dehydration of paroxetine HCl Form I under non-isothermal conditions. ............................ 158
Figure 4.9: VT-XRPD diffractograms collected on paroxetine HCl Form I at 25, 50, 75, 100 and
110 oC (upwards). Peaks identified with (*) correspond to the new anhydrous form and those
identified with (#) are related to the initial Form I. ................................................................ 160
Figure 4.10: VT-XRPD patterns of paroxetine HCl Form I collected during cooling from 110 oC to
25 oC (upwards). At 25
oC, the diffractograms were collected after 1, 2 and 6 h isothermal at
that temperature. .................................................................................................................... 161
Figure 4.11: Changes in the unit cell volume of paroxetine HCl Form I during heating at 25, 50, 75
and 100 oC (♦); during cooling of the anhydrous form (●) at the same temperatures as during
heating; and after cooling at 25 oC for 6 h (□). Note that the refinement at 100
oC on heating
and after 1 h at 25 oC on cooling gave a poor fitting, thus these results are less reliable. ..... 162
Figure 4.12: SEM pictures of raw paroxetine HCl Form I (a), isothermal for 1 h at 90 oC (b) and
isothermal for 1 h at 110 oC (c) in TGA. ............................................................................... 163
Figure 4.13: VT-XRPD pattern of the dehydrated Form I at 50 oC on cooling (bottom) and
VH-XRPD pattern of the dehydrated Form II (top) collected at 30 oC/1% RH (data presented
in Chapter 3). ......................................................................................................................... 164

xxviii
Figure 4.14: Representative scheme of the relationship between the two forms of paroxetine
HCl. ....................................................................................................................................... 165
Chapter V
Figure 5.1: Heat capacity data as a function of temperature for crystalline Form II and amorphous
paroxetine HCl. ..................................................................................................................... 181
Figure 5.2: Plot of ln (q) (where q is heating/cooling rate) against the inverse glass transition (K)
of amorphous paroxetine HCl. .............................................................................................. 184
Figure 5.3: Solubility in water of two crystalline (Form I and II) and quench cooled (QC) forms of
paroxetine HCl. ..................................................................................................................... 187
Figure 5.4: XRPD data of paroxetine HCl Form I and the solubility residues, collected after
centrifugation from the solubility measurements of Form II and quench cooled (QC). ....... 188
Figure 5.5: ATR-FTIR spectra of the solubility residues (amorphous QC paroxetine HCl, Form II
and Form I) collected after the solubility experiments (72 h stirring at 25 oC) and paroxetine
HCl Form I (upwards). .......................................................................................................... 188
Figure 5.6: Dissolution profiles of Form I, Form II and quench cooled (QC) paroxetine HCl in
0.1M HCl. .............................................................................................................................. 189
Figure 5.7: MTDSC heating cycle traces of amorphous quench cooled paroxetine HCl aged at
25 oC under different RHs, as stated, for 48 h; hermetic pans were used. ............................ 191
Figure 5.8: Water content of the amorphous paroxetine HCl, over time and under different storage
conditions at 25 oC. ............................................................................................................... 192
Figure 5.9: Changes in the Tg of quench cooled paroxetine HCl over time and under different RHs
conditions. ............................................................................................................................. 193
Figure 5.10: Recrystallisation temperature (onset values) profiles for the samples stored under 22,
33 and 53% RH for 60 days. ................................................................................................. 194
Figure 5.11: Enthalpy of recrystallisation at different storage conditions up to 60 days. ............. 195
Figure 5.12: ATR-FTIR spectra of amorphous paroxetine HCl at different time points upon storage
at 75% RH/25 oC: prior storage, 1, 3 and 7 days (upwards). ................................................. 197
Figure 5.13: ATR-FTIR spectra of amorphous paroxetine HCl at different time points upon
storage at 53% RH/25 oC: prior storage, 7, 14, and 30 days (upwards). ............................... 198
Figure 5.14: X-ray diffractograms of paroxetine HCl Form I and II, as received. ....................... 199
Figure 5.15: XRPD diffraction data collect at different time points (in day) for the quench cooled
paroxetine HCl sample stored under 75% RH. ..................................................................... 199

xxix
Chapter VI
Figure 6.1: Heating rate dependence of the Tg for paroxetine Forms I and II (measurements were
performed at least in triplicate).............................................................................................. 214
Figure 6.2: Changes in the onset melting point of paroxetine HCl Form I and Form II in the
presence of PVPVA, as a function of drug loading. .............................................................. 215
Figure 6.3: Influence of the heating rate on the onset melting point of paroxetine Form II when
physically mixed with PVPVA in a 50:50 w/w ratio. ........................................................... 216
Figure 6.4: Melting point depression results for the paroxetine HCl, Forms I and II, with PVPVA.
Slope of each curve included for subsequent calculation of the Flory-Huggins interaction
parameter (χ).......................................................................................................................... 217
Figure 6.5: Gibbs free energy of mixing (ΔGmix) versus polymer volume fraction (ϕPVPVA) for
Form II:PVPVA and Form I:PVPVA. ................................................................................... 218
Figure 6.6: MTDSC analysis of 50% HME and SD of Form II:PVPVA in pinhole pans. Note that
the extrudates were analysed without any preliminary treatment (non-milled). ................... 221
Figure 6.7: MTDSC traces of 50% HME Form II:PVPVA after milling and control of the particle
size (63-106 μm) in pinhole pans. ......................................................................................... 222
Figure 6.8: MTDSC analysis of the solid dispersions of 50% Form I:PVPVA prepared by HME
(non-milled) and SD. Analyses were done in pinhole pans. ................................................. 223
Figure 6.9: ATR-FTIR spectra of PVPVA, pure crystalline paroxetine HCl Form II and Form I
(upwards) and respective PMs (theoretical and experimental). ............................................ 225
Figure 6.10: FTIR spectra of the freshly HME and SD solid dispersions of paroxetine HCl Form I
and Form II with PVPVA. ..................................................................................................... 227
Figure 6.11: DVS results of the freshly prepared HME and SD systems kept under 98% RH/25 oC
for a period of 16 h. ............................................................................................................... 229
Figure 6.12: Dissolution profiles of pure paroxetine HCl Form I, binary mixture with PVPVA and
respective solid dispersions prepared by SD and HME. ....................................................... 230
Figure 6.13: Dissolution profiles of pure paroxetine HCl Form II, binary mixture with PVPVA and
respective solid dispersions prepared by SD and HME. ....................................................... 231
Figure 6.14: DSC curves for HME and SD systems after 30 days storage under 75% RH/25 oC and
analysed in hermetic pans at 10 oC/min................................................................................. 233
Figure 6.15: Recrystallisation profiles of the HME and SD systems stored at 75% RH/25 oC. ... 235
Figure 6.16: Water content of each solid dispersion system overtime stored at 75% RH/25 oC. . 236
Figure 6.17: ATR-FTIR spectra of HME Form II:PVPVA (a), pure Form I and its 2nd
derivative
(b) and second derivative of the same system (c). Please note that each spectrum was
collected at each sampling point (0, 7, 14, 30, 60, 90 and 120 days) downwards. ................ 237
xxx
Figure 6.18: XRPD traces of SD and HME samples of Form I and Form II with PVPVA (50:50
w/w) aged at 75% RH/25 oC for four months. ...................................................................... 238
Chapter VII
Figure 7.1: Melting point depression results obtained for each olanzapine (OLZ):polymer system
(PVP, PVPVA and Soluplus® (SLP)). Slope of each curve included for subsequent calculation
of the Flory-Huggins interaction parameter (χ). ................................................................... 252
Figure 7.2: Free energy-composition phase diagrams of olanzapine (OLZ) and each polymer
system (PVP, PVPVA and Soluplus® (SLP)). ....................................................................... 253
Figure 7.3: Chemical structure of olanzapine. .............................................................................. 254
Figure 7.4: DSC curves of 50% drug-loaded systems with Soluplus® (SLP), PVPVA and PVP
(downwards) extruded at 160 oC and run at 10
oC/min in standard crimped pans. ............... 258
Figure 7.5: Calibration curves of the enthalpy of melting of olanzapine (OLZ) in the presence of
PVPVA (left) or SLP (right) versus the ratio of crystalline OLZ in the physical mixtures.
Measurements were carried out at 10 oC/min in crimped pans. ............................................ 259
Figure 7.6: Measured Tg values for all the freshly prepared formulations using DSC (total heat
flow) at 10 oC/min in crimped pans. Blue and red bars represent systems extruded at 160
oC
and 180 oC, respectively. ....................................................................................................... 260
Figure 7.7: XRPD spectra of (a) pure OLZ and (b) 50% drug-loaded formulations from top to
bottom: SLP, PVPVA and PVP extruded at 160 oC and SLP and PVPVA extruded at
180 oC. ................................................................................................................................... 262
Figure 7.8: Photographs of 50% drug-loaded extrudates. ............................................................. 263
Figure 7.9: Dissolution profiles of pure OLZ and HME systems with PVP, PVPVA and Soluplus®
(SLP) with 50% drug loading extruded at 160 and 180 oC (FAS – fully amorphous systems
and PAS – partially amorphous systems). The legend on the right hand side follows the same
order as the curves in the plot (downwards). ......................................................................... 265
Figure 7.10: Dissolution profiles of 20% drug-loaded HME extrudates with PVPVA and SLP
extruded at 160 and 180 oC (all systems were characterised as fully amorphous systems). The
legend on the right hand side follows the same order as the curves in the plot
(downwards). ......................................................................................................................... 266
Figure 7.11: Dissolution profiles of OLZ and PM with PVP, PVPVA and SLP in 1:1 drug-polymer
ratio. ....................................................................................................................................... 267
Figure 7.12: SEM microphotographs of pure OLZ, PMs of OLZ with each polymer and finally the
particles collected from the dissolution vessel of 50% PM OLZ:SLP after 120 min of
testing. ................................................................................................................................... 269

xxxi
Figure 7.13: XRPD data collected for the 50% formulations (both extrusion temperatures) after
three months of storage at 75% RH/40 oC. For simplicity, the legend on the plot follows the
same order as the presented curves. ...................................................................................... 271
Figure 7.14: SEM microphotographs of 1:1 fresh solid dispersion systems (surface and cross-
section) and after storage at 75% RH/40 oC for three months (cross-section and surface). The
extrusion temperature for the PVPVA and SLP systems is also stated. ................................ 274
xxxii
List of Tables
Chapter I
Table 1.1: Hygroscopicity classification scheme according to Callahan. ....................................... 59
Chapter II
Table 2.1: General physicochemical properties of paroxetine HCl Forms I and II......................... 86
Table 2.2: Physicochemical properties of olanzapine Form I. ........................................................ 88
Table 2.3: Principal characteristics and properties of other forms of olanzapine. .......................... 89
Table 2.4: Physicochemical properties of PVP K30. ...................................................................... 93
Table 2.5: Physicochemical properties of PVPVA 6:4. .................................................................. 94
Table 2.6: Physicochemical properties of Soluplus®. ..................................................................... 96
Table 2.7: Sources of chemicals used in this study. ........................................................................ 97
Chapter IV
Table 4.1: Dehydration studies of paroxetine HCl Form I and Form II performed at different
drying conditions. .................................................................................................................. 151
Chapter V
Table 5.1: Thermal and kinetic parameters obtained for amorphous paroxetine HCl. ................. 180
Table 5.2: Thermal properties and water content of the freshly prepared amorphous paroxetine
HCl. ....................................................................................................................................... 185
Chapter VI
Table 6.1: Kinetic parameters obtained from the heating rate dependence of the Tg for the two
pseudopolymorphic forms of paroxetine HCl. ...................................................................... 214
Table 6.2: Thermal properties of the raw materials. ..................................................................... 219
Table 6.3: Measurements of Tg, ΔCp and moisture content obtained by MTDSC and TGA,
respectively, for the milled and non-milled HME and SD samples. ..................................... 224
xxxiii
Chapter VII
Table 7.1: Solubility parameter component group contribution using van Krevelen-Hoftyzer
method. .................................................................................................................................. 254
Table 7.2: Calculated solubility parameters and interaction parameters using Hansen group
contribution theory for OLZ and each polymer..................................................................... 255
Table 7.3: Experimental thermal properties of OLZ and polymers. ............................................. 257
Table 7.4: Shifts on the carbonyl groups for each polymer and respective HME system (cm-1
). . 261

xxxiv
List of Abbreviations & Symbols
API Active pharmaceutical ingredient
ATR-FTIR Attenuated total reflectance-Fourier transform infrared
BCS Biopharmaceutical classification system
Cp Heat capacity
DSC Differential scanning calorimetry
Ea Activation energy
FH Flory-Huggins
GT Gordon-Taylor
HCl Hydrochloride acid
HME Hot melt extrusion
HR Heating rate
HSM Hot stage microscopy
LTA Local thermal analysis
MTDSC Modulated temperature DSC
MW Molecular weight
OLZ Olanzapine
PM Physical mixture
PVP Polyvinylpyrrolidone
PVPVA Polyvinylpyrrolidone vinyl-acetate
RH Relative humidity
rpm Rotation per minute
SD Spray drying
SEM Scanning electron microscope
SLP Soluplus®
STDEV Standard deviation
Tg Glass transition temperature
TGA Thermogravimetric analysis
Tm Melting temperature

xxxv
UV Ultraviolet
VH Variable humidity
VT Variable temperature
XRPD X-ray powder diffraction
χ Flory-Huggins interaction parameter
δ Solubility parameter
ρ Density

SCOPE AND OVERVIEW
Scope and Overview
37
Motivation and Contextual Objectives
Solid state characterisation represents, nowadays, a well-established program in the
pharmaceutical industry since an incomplete characterisation of a drug substance can
jeopardize the development and commercialisation of a final product.
In the present work, a range of analytical techniques were used to obtain a more accurate
and thorough understanding of the solid state of two well-known drugs: paroxetine HCl
and olanzapine. These drugs were selected due to their complex nature and not yet fully
understood solid state properties. Moreover, the preparation of solid dispersion systems of
these two drugs using different technologies was evaluated as a way to explore the
parameters that can influence the dissolution behaviour and physical stability of such
systems.
Organisation of the Thesis and Main Objectives
This thesis is divided into 8 chapters. The contents and objectives of each chapter are
briefly summarised as follows,
Chapter 1 provides a broad overview on the topics explored in the subsequent chapters.
Chapter 2 presents the chemical structure and main physicochemical properties of all
APIs and polymers used throughout this dissertation. A brief theoretical background to the
techniques used to prepare solid dispersions and all the analytical methods is also
presented. Moreover, a paragraph describing the instruments characteristics is added at the
end of each technique.
Chapter 3 provides a thorough investigation of paroxetine HCl Form II. Differentiation
between surface water and hydrate formation was critically accessed as a function of
relative humidity and temperature.
Scope and Overview
38
Chapter 4 explores the conditions that could lead to the dehydration of paroxetine HCl
Form I. The possibility of any structural relationship between the dehydrated From II and
Form I was investigated.
Chapter 5 provides the calculation of several thermodynamic and kinetic parameters as
possible predicting tools of the physical stability of amorphous paroxetine HCl. Correlation
between those predictions and the experimental stability over storage was evaluated.
Chapter 6 provides an evaluation of the theoretical predictions used to describe miscibility
between drug and polymer and the effect of different preparation methods on the
processing of the pseudopolymorphs of paroxetine HCl, dissolution rates and stability over
storage.
Chapter 7 presents an investigation on the effect of drug loading and physical state,
extrusion temperature and physicochemical properties of the selected polymers on the
dissolution enhancement and stability of solid dispersions of a poorly soluble drug
(olanzapine) prepared via hot melt extrusion.
Chapter 8 presents the main conclusions and future work.
It is worth mentioning that the author of this thesis was not directly involved in the
molecular modeling simulations (Chapter 3), Pawley refinement, unit cell parameters
determinations and high performance liquid chromatography (HPLC) analysis (Chapter 4).
Scope and Overview
39
Scientific Publications and Conferences
International Peer-Reviewed Publications:
M. F. Pina et al. 2012. Identification and Characterisation of Stoichiometric and
Non-Stoichiometric Hydrate Forms of Paroxetine HCl: Reversible Changes in Crystal
Dimensions as a Function of Water Absorption. Molecular Pharmaceutics, 9, 3515-3525.
M. F. Pina et al. 2014. The Influence of Drug Physical State on the Dissolution
Enhancement of Solid Dispersions Prepared via Hot Melt Extrusion: A Case Study using
Olanzapine. Journal of Pharmaceutical Sciences (Accepted for Publication).
M. F. Pina et al. An Investigation into the Dehydration Behaviour of Paroxetine HCl Form I
using a Combination of Thermal and Diffraction Methods: The Identification and
Characterisation of a New Anhydrous Form (Submitted to Crystal Growth and Design).
Oral Communications:
An Investigation into the Dehydration Behaviour of Paroxetine HCl Form I using a
Combination of Thermal and Structural Analysis – Pharmaceutical Solid State Research
Cluster, Lille, 4th July 2013
Identification and Characterisation of a Non-Stoichiometric Hydrate Form of Paroxetine
HCl: Reversible Changes in Crystal Dimensions as a Function of Water Absorption –
Pharmaceutical Solis State Research Cluster, Lisbon, 27th August 2012

Scope and Overview
40
Theoretical and Practical Approaches in Drug-Polymer Miscibility/Solubility and the
Influence of Preparation Methods – 8th World Meeting on Pharmaceutics, Biopharmaceutics
and Pharmaceutical Technology, Istanbul, 21st March 2012

1 INTRODUCTION

. . . a major deficiency in our current knowledge and understanding concerns the relationship
among the members of a polymorph cluster—what is their relative mutual stability,
how do they transform, one into another, what are the thermodynamic factors
governing their mutual stability, what are the kinetics of the transitions.
Answers to the last of these questions are very important to users of, and sufferers from,
polymorphism.
Herbstein

Chapter I
43
1.1 General Introduction
Interest in the solid state properties of pharmaceutical compounds has grown greatly in
recent decades. Firstly, an insufficient understanding of solid state properties can lead to
serious complications in the development of a final pharmaceutical product, including their
physical and chemical stability. Secondly, a thorough characterisation of any new, or even
existent, molecule can create new opportunities and uncover important properties that can
enhance its bioavailability. This is extremely important from the patient perspective. In
addition, from a commercial point of view, companies can see their patents extended with
economic benefits.
This section provides a background on the concepts and principles related to the solid state
of pharmaceutical compounds. Additionally, some relevant topics on formulation
strategies, new preparation techniques and principal obstacles frequently encountered
during the manufacturing process are also explored.
1.2 States of Matter
Matter is broadly classified as being either a solid, liquid or a gas. At normal room
temperature and pressure the majority of active pharmaceutical ingredients (APIs) and
excipients exist as solids. In the solid state, molecules are held in close proximity to each
other by intermolecular forces such as hydrogen bonding and van der Waals interactions.
In the liquid state, there are still molecular interactions but the molecules are more mobile
and lack long-range order. Finally, in the gas phase the molecules only interact weakly
with each other and travel large distances without colliding.
The solid phase can be classified into two major types of sub-phases based upon the order
of molecular packing. The most common type of state is the crystalline state where the
structural units, called unit cells, are regularly repeated in a three dimension (3D) lattice,
presenting both short and long-ranges order. In this context, ‘short-range order’ refers to
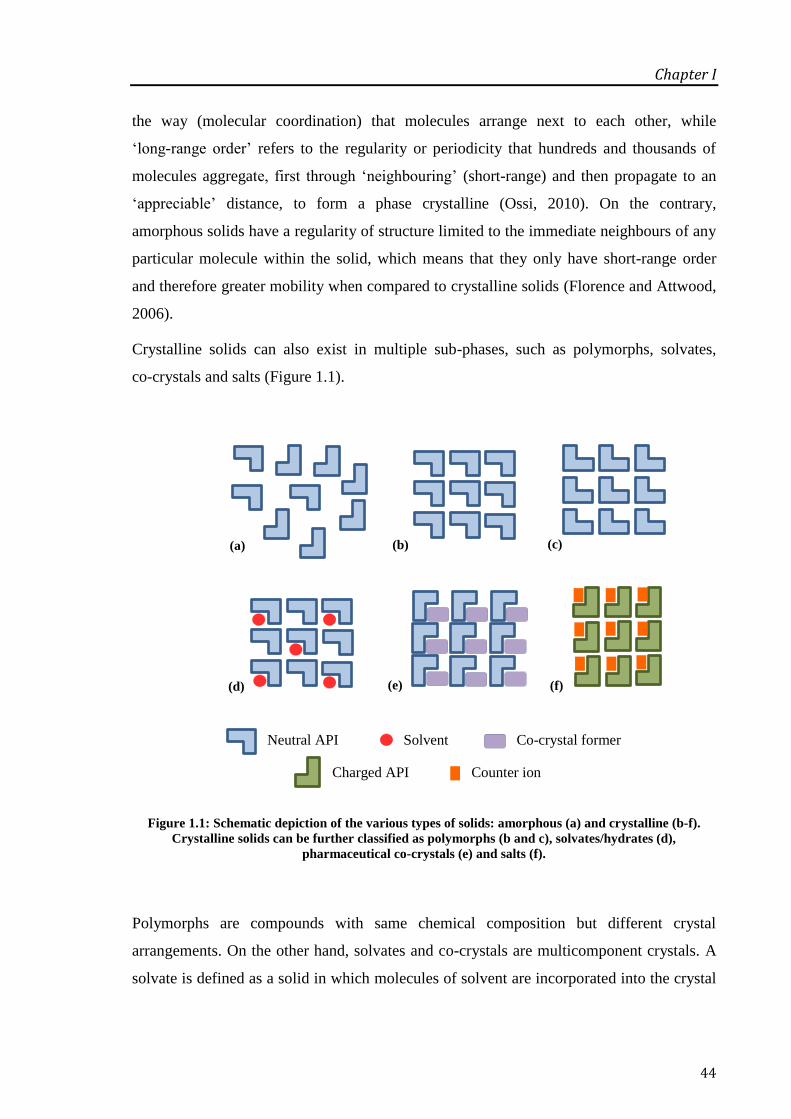
Chapter I
44
the way (molecular coordination) that molecules arrange next to each other, while
‘long-range order’ refers to the regularity or periodicity that hundreds and thousands of
molecules aggregate, first through ‘neighbouring’ (short-range) and then propagate to an
‘appreciable’ distance, to form a phase crystalline (Ossi, 2010). On the contrary,
amorphous solids have a regularity of structure limited to the immediate neighbours of any
particular molecule within the solid, which means that they only have short-range order
and therefore greater mobility when compared to crystalline solids (Florence and Attwood,
2006).
Crystalline solids can also exist in multiple sub-phases, such as polymorphs, solvates,
co-crystals and salts (Figure 1.1).
Figure 1.1: Schematic depiction of the various types of solids: amorphous (a) and crystalline (b-f).
Crystalline solids can be further classified as polymorphs (b and c), solvates/hydrates (d),
pharmaceutical co-crystals (e) and salts (f).
Polymorphs are compounds with same chemical composition but different crystal
arrangements. On the other hand, solvates and co-crystals are multicomponent crystals. A
solvate is defined as a solid in which molecules of solvent are incorporated into the crystal
(a) (b) (c)
(d) (e) (f)
Neutral API
Charged API
Solvent Co-crystal former
Counter ion
Chapter I
45
lattice (Hosokawa et al., 2004). The incorporated solvent is often termed the guest and the
major component is termed the host (Herbstein, 2004). When the solvent is water, the
solvate is called hydrate. The terminology of hydrates is related to the amount of molecular
water compared to one molecule of host and is denoted by terms such as ‘hemihydrate’,
‘monohydrate’, ‘dihydrate’, etc. ‘Anhydrate’ is actually a redundant term but is used to
emphasise that water (or solvent) is not incorporated in the crystal structure. The suggested
nomenclature of this particular group as pseudopolymorphs generated a polemic discussion
and it was recently replaced by solvatomorphs (Seddon, 2004; Desiraju, 2004; Nangia,
2005).
Several APIs are commercialised in a hydrate phase (Lee et al., 2011), such as alendronate
sodium trihydrate (Fosamax®), amoxicillin trihydrate (Amoxil
®) and atorvastatin calcium
trihydrate (Lipitor®). Solvates other than hydrates are usually not selected for development
owing to risk of desolvation and toxicity concerns with organic solvents that are not
Class III. Class III solvents are considered to be less toxic and with lower risk to Human
health. This is the outcome of acute and short-term safety studies, although there are no
long-term toxicity or carcinogenicity studies for many of the solvents belonging to this
class. Nonetheless, there are some drug products marketed in the solvate form such as
darunavir ethanolate (Prezista®), indinavir sulfate ethanolate (Crixivan
®) and warfarin
sodium isopropanol solvate (Coumadin®
) (Lee et al., 2011).
Co-crystals are multiple component crystals in which all components are solid under
ambient conditions when in their pure form (Shan and Zaworotko, 2008).
Co-crystallisation has gained more and more interest in pharmaceutical research, since the
complexation of an API with another molecule can produce a solid form with different
physical properties (Trask et al., 2006; McNamara et al., 2006).
Salts represent a considerable enlargement of the portfolio of solid forms of
pharmaceutical molecules. Salts are stable and highly soluble in water. A necessary
prerequisite for the formation of salts is the presence of ionisable groups in the molecule.
Salts may also form hydrates such as atorvastatin calcium trihydrate and paroxetine
hydrochloride hemihydrate.
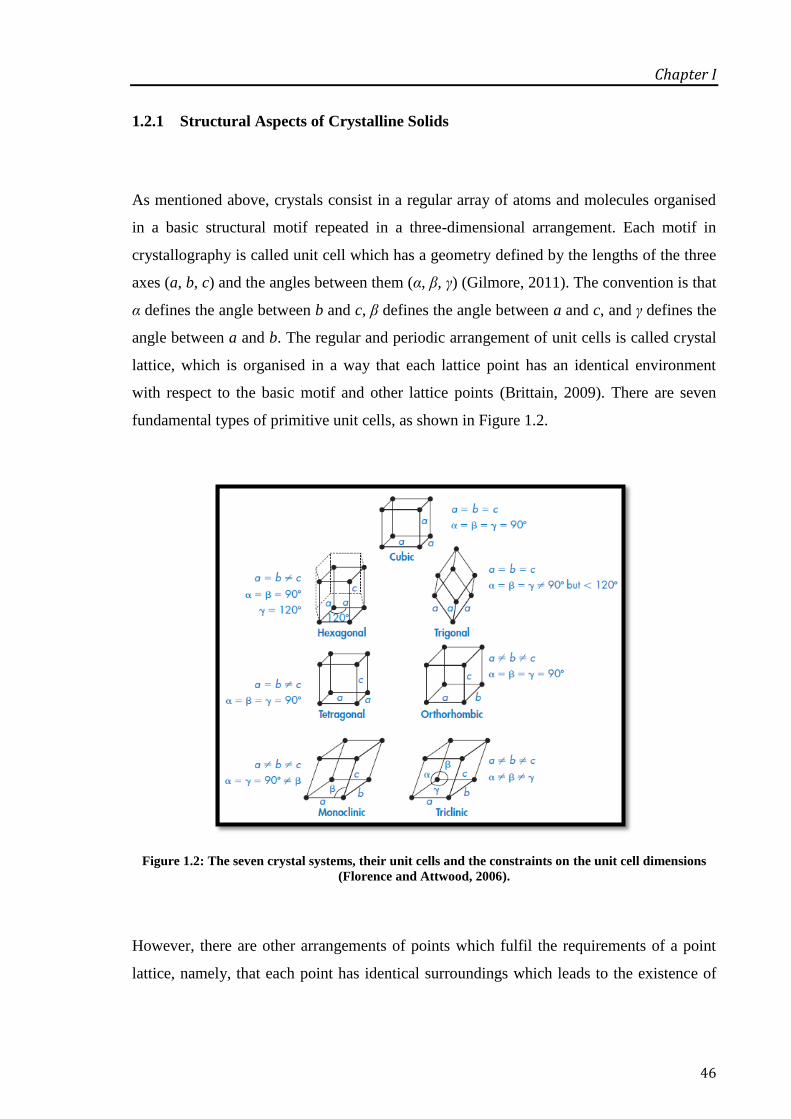
Chapter I
46
1.2.1 Structural Aspects of Crystalline Solids
As mentioned above, crystals consist in a regular array of atoms and molecules organised
in a basic structural motif repeated in a three-dimensional arrangement. Each motif in
crystallography is called unit cell which has a geometry defined by the lengths of the three
axes (a, b, c) and the angles between them (α, β, γ) (Gilmore, 2011). The convention is that
α defines the angle between b and c, β defines the angle between a and c, and γ defines the
angle between a and b. The regular and periodic arrangement of unit cells is called crystal
lattice, which is organised in a way that each lattice point has an identical environment
with respect to the basic motif and other lattice points (Brittain, 2009). There are seven
fundamental types of primitive unit cells, as shown in Figure 1.2.
Figure 1.2: The seven crystal systems, their unit cells and the constraints on the unit cell dimensions
(Florence and Attwood, 2006).
However, there are other arrangements of points which fulfil the requirements of a point
lattice, namely, that each point has identical surroundings which leads to the existence of
Chapter I
47
fourteen possible point lattices and no more. This work was carried out by the French
crystallographer Bravais in 1848 and therefore they are called the 14 Bravais lattices
(Cullity, 1956).
1.2.2 Cambridge Structural Database
The Cambridge Structural Database (CSD) is the world’s repository for the results
obtained from the X-ray crystal structure analysis of small organic molecules and
organometallic compounds. It contains the results of over half-a-million X-ray and neutron
diffraction analyses. The CSD is compiled and distributed by the Cambridge
Crystallographic Data Centre (CCDC), a fully independent institution based in Cambridge
(England) since 1987.
Each entry in the CSD contains 1D, 2D and 3D information. The 1D data contains
bibliographical and chemical information (name and empirical formula). The 2D
information is used to generate the structural formula and chemical connectivity, which
obviously is the same for polymorphs. And finally, the 3D information contains all the
results obtained from X-ray structure determination, namely cell constants, space group,
atomic coordinates and atomic attributes needed to generate the three-dimensional
molecular and crystal structures (Bernstein, 2002).
This unique database of accurate 3D structures has become an essential resource to
scientists around the world providing high quality information, software and services.
1.3 Polymorphism
Polymorphism, is a term originally derived from Greek (poly = many; morph = form) and
according to McCrone’s definition (Haleblian and McCrone, 1969): “Polymorphism is the
ability of any element or compound to crystallize as more than one distinct crystal

Chapter I
48
species”. This author also states that “every compound has different polymorphic forms
and that, in general, the number of forms known for a given compound is proportional to
the time and money spent in research on that compound”. Earlier in 1788, Klaproth found
that calcium carbonate crystallises both as calcite and aragonite, giving the first insight on
polymorphism. A few years later, Humphrey Davy in 1809 presented that diamond and
graphite are both carbon, but they differ on the way carbon atoms are arranged in the solid
state. This became the classical and most famous example of polymorphism.
Different polymorphs exhibit different properties, favourable or not in a particular context,
which became the subject of considerable practical, and hence financial, importance,
especially in the pharmaceutical arena (Herbstein, 2004). Polymorphs of a drug substance
can have different chemical and physical properties, including melting point, chemical
reactivity, apparent solubility, dissolution rate, optical and mechanical properties, vapour
pressure, and density. These properties can have a direct effect on the ability to process
and/or manufacture the drug substance and the drug product, as well as, on drug product
stability, dissolution, and bioavailability. Thus, polymorphism can affect the quality,
safety, and efficacy of the drug product.
From an industrial perspective, the drug development program is a highly interdisciplinary
field connecting chemistry, technology, pharmacology and toxicology, at the last instance.
At first it involves solid state knowledge covering crystal chemistry and materials
properties with a goal to select the appropriate crystal form with the desired physical and
chemical properties. The following step then embraces formulation development and
process design. The general program of a drug product development is illustrated in
Figure 1.3.

Chapter I
49
Figure 1.3: Relationship between the selection/optimisation of a drug candidate and
the development stages (Chow et al., 2008).
In the case of a new drug substance, it is crucial to perform a thorough polymorphic
screening prior to the initiation of pivotal clinical studies and primary stability batches. The
importance and difficulties related to polymorphism in the pharmaceutical industry can be
exemplified by examining the history of a number of well-known drug products as shown
in Figure 1.4.
In most of the cases, the products are recalled owing to ambiguous product performance
and quality as a result of unpredicted changes in the polymorphic form which resulted in
problematic quality release and stability testing (i.e. dissolution) of the finished dosage
form. As a consequence, companies have experienced market shortages due to
manufacturing troubleshooting, batch rework, and delays in project or clinical trials
timelines.

Chapter I
50
Figure 1.4: A timeline of events concerning solid state issues with polymorphism/pseudopolymorphism
of pharmaceutical drugs (adapted from (Lee et al., 2011)).
1.3.1 Structural Aspects of Polymorphism
1.3.1.1 Packing and Conformational Polymorphism
Polymorphism in molecular crystals can be divided into two categories: packing and
conformational polymorphism. In the former, molecules exhibit as rigid grouping of atoms
that may be stacked in different motifs to occupy the points of different lattices. On the
other hand, conformationally flexible molecules adopt more than one conformation in the
solid state (Bernstein, 2002; Yu et al., 2000). The differentiation between packing
polymorphism and conformational polymorphism is not always obvious. Several examples
of drugs that exhibit conformational polymorphism can be scattered from literature such as
the antidepressant venlafaxine hydrochloride (Kavitha et al., 2005), the antipsychotic
olanzapine (Reutzel-Edens et al., 2003a) and the non-steroidal anti-inflammatory drug
nimesulide (Sanphui et al., 2011).
Conformers have very similar conformational energies which makes possible the existence
of different molecular conformations in a single crystal structure. This energy is enough to
provoke changes in molecular torsional parameters about single bonds, but it is generally
1998 – Withdrawal of
Norvir®
(ritonavir) due to
the conversion to a more
thermodynamic stable and
less soluble polymorph.
1999– Examination of the raw
material of Velmox®
(mebendazole) confirmed a
mixture of Forms A and B, found
to be inactive/less effective than
the intended Form C.
2008 – Batch recall of
Neupro® (rotigotine)
patches due to
crystallisation of a new
polymorph.
2010 – Recall of
Coumadin® (warfarin
sodium 2-propanol) as a
result of variability in the
content of 2-propanol.
1988 – Clinical failure of
Tegretol® (carbamazepine)
due to the conversion of the
anhydrate form to the
dihydrate.

Chapter I
51
not sufficient to significantly perturb bond lengths and bond angles. Differences in the
torsion angles are usually the first focus to identify conformational polymorphism, though
this is not a rigid and straight rule (Bernstein, 2002).
1.3.1.2 Monotropism and Enantiotropism
Thermodynamically, polymorphs can be classified as monotropics or enantiotropics,
depending upon whether one can reversibly transform to another or not. In an enantiotropic
system, there is a transition temperature (Ttrans) before melting (Tm), at which the stability
order between two polymorphic forms is reversed. On the contrary, in a monotropic
system, one form is more stable than the other at any temperature before melting
(Vippagunta et al., 2001). Figure 1.5 shows phase diagrams representing each system.
In an enantiotropic system, Form I has a lower free energy over the lower temperature
range, while Form II is shown to have a lower free energy over a higher temperature range.
At the Ttrans, the free energy curves cross and the forms are isoenergetic. For a monotropic
system, one polymorph has the lowest free energy at any given temperature and therefore
is the most thermodynamically stable form. The free energy curves do not cross, so no
reversible transition can be observed below the melting point (Brittain, 2009).
Figure 1.5: Free energy (G) as a function of temperature for enantiotropic (left) and monotropic (right)
systems (adapted from (Craig and Reading, 2007)).
II
Liquid
I
G
Tm II Ttrans
G
II
I
Tm II
Liquid
Tm I
Tm I
Chapter I
52
To understand if a polymorphic system is monotropic or enantiotropic is of considerable
relevance from the stability perspective. Such knowledge can help to determine whether a
compound will be stable at a certain temperature during manufacture and storage
conditions. There are a series of rules that have been developed to help differentiating and
characterising these two systems, as presented next.
1.3.2 Thermodynamics of Polymorphic Systems
In a polymorphic system, the relative stability of polymorphs depends on their free
energies, with the most stable form having the lowest free energy under determined
experimental conditions. In those circumstances, the other forms are thermodynamically
unstable and therefore considered metastable with a rate of conversion to the most stable
form that can vary from seconds to years.
An example is the well reported case of ritonavir. Ritonavir is a protease inhibitor for
Human Immunodeficiency Virus (HIV), discovered in late 1992 and introduced to the
market in 1996 as a semisolid capsule formulation and as a liquid formulation. The final
product, Norvir®, was withdrawn two years later because some lots of capsules failed the
dissolution tests specification. It was found that a large portion of the drug substance was
precipitating out of the final (semisolid) formulated product. Further investigation into this
matter revealed that a new, previously unknown, thermodynamically more stable and much
less soluble crystalline form had emerged (Chemburkar et al., 2000).
The main approaches used to assess thermodynamic stability relationships of polymorphs
are based on the Burger and Ramberger rules established in 1979 (Burger and Ramberger,
1979a;b). Three particularly important rules proposed by these authors are the heat of
transition, the heat of fusion, and the density rule, described below.
Heat of Transition Rule
This rule states that if, at some temperature, an endothermic transition between two crystal
forms is observed, then there is a transition point below this temperature and the two
polymorphs are enantiotropically related. On the contrary, if an exothermic transition is
Chapter I
53
observed at some temperature, there is no thermodynamic transition point below this
temperature. As a result, this could be an indication of a monotropic system, but also of an
enantiotropic system with the thermodynamic transition temperature happening at a higher
temperature (Hilfiker, 2006).
Heat of Fusion Rule
The heat of fusion rule states that the polymorph with higher melting point has the lower
heat of fusion thus the two polymorphs are enantiotropic, otherwise they are monotropic.
Frequently, the rate of polymorphic transition is too slow to allow for an accurate
measurement of the heat of transition, in which case the heat of fusion rule may be applied
(Hilfiker, 2006).
Density Rule
True density is a physical property of both fundamental and practical importance to the
study of pharmaceutical powders. The density rule states that for a system at absolute zero,
the most stable polymorph will have the highest density, as a result of the closer packing of
the molecules. This is the case of nabumetone, for example, with the stable Form I having
a density of 1.26 g/cm3 while the metastable Form II possesses a density of 1.21 g/cm
3
(Price et al., 2002). However, if crystal packing is dominated by energetically more
favourable directional or electrostatic interactions, such as hydrogen bonding, crystals with
a closer packing may not always exhibit a lower lattice energy and free energy even at 0 K
(Sun, 2007). An example of this situation, is the case of oxybuprocaine hydrochloride, a
local anaesthetic drug, with the metastable Form III having a higher density (1.21 g/cm3)
than the stable Form II (1.20 g/cm3) (Griesser et al., 2008).
The thermodynamic stability between polymorphs represents one of the most important
points of concern in the pharmaceutical industry. It is crucial to ensure that the final
product contains the desired polymorph, which was previously selected due to its physical
properties combined with a suitable stability. The well-known expression of disappearing
polymorphs perfectly exposes the numerous cases of crystals being observed over a period
of time but not thereafter. Over the past decades, the combination of new crystallisation
techniques and more accurate and precise screening approaches have significantly reduced
the tendency for this phenomenon to happen.
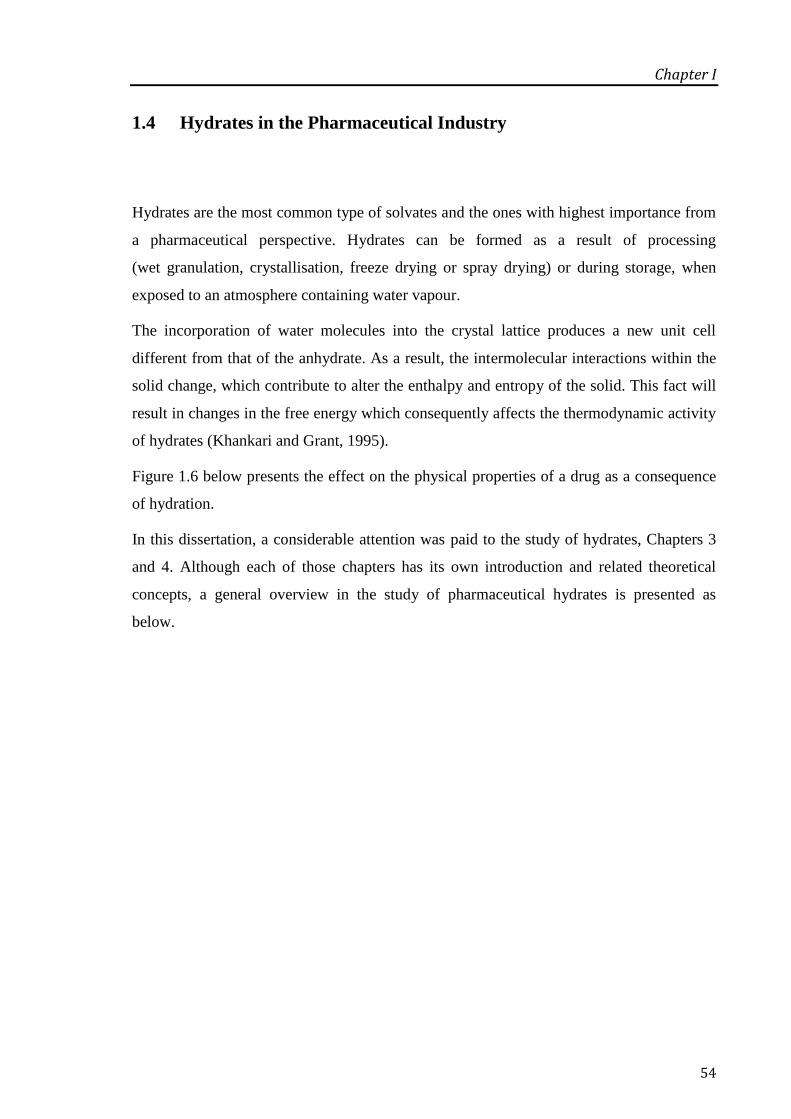
Chapter I
54
1.4 Hydrates in the Pharmaceutical Industry
Hydrates are the most common type of solvates and the ones with highest importance from
a pharmaceutical perspective. Hydrates can be formed as a result of processing
(wet granulation, crystallisation, freeze drying or spray drying) or during storage, when
exposed to an atmosphere containing water vapour.
The incorporation of water molecules into the crystal lattice produces a new unit cell
different from that of the anhydrate. As a result, the intermolecular interactions within the
solid change, which contribute to alter the enthalpy and entropy of the solid. This fact will
result in changes in the free energy which consequently affects the thermodynamic activity
of hydrates (Khankari and Grant, 1995).
Figure 1.6 below presents the effect on the physical properties of a drug as a consequence
of hydration.
In this dissertation, a considerable attention was paid to the study of hydrates, Chapters 3
and 4. Although each of those chapters has its own introduction and related theoretical
concepts, a general overview in the study of pharmaceutical hydrates is presented as
below.
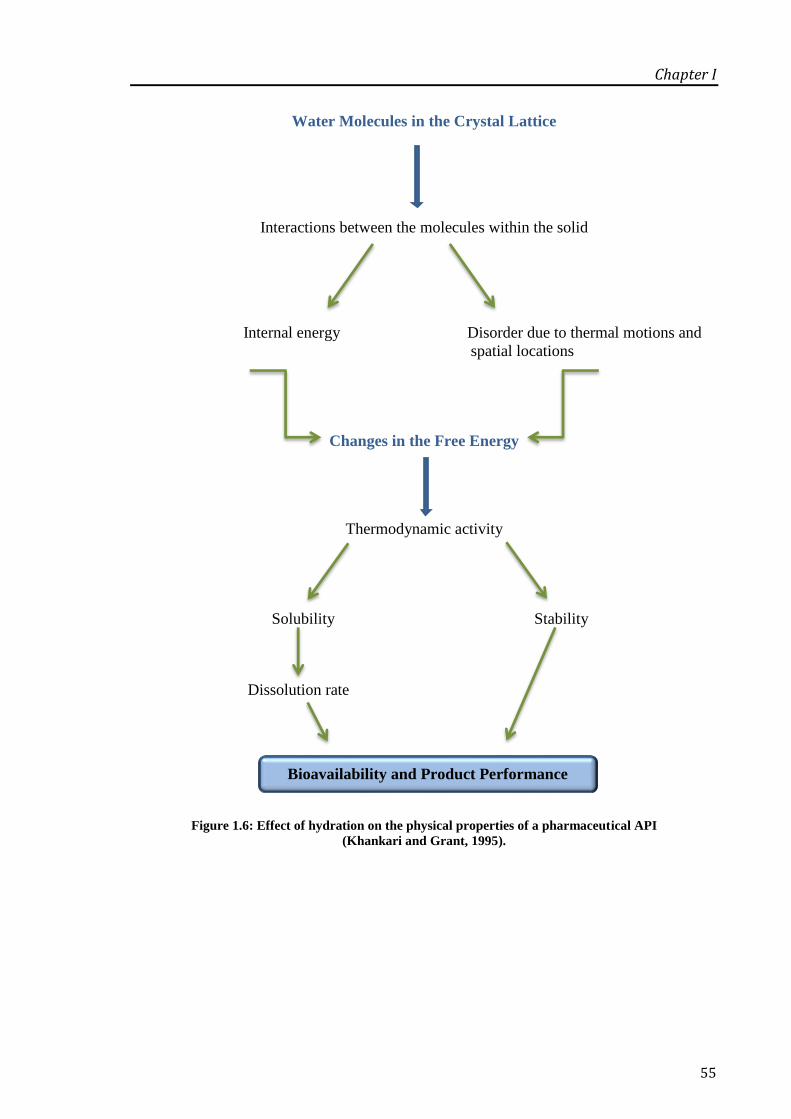
Chapter I
55
Water Molecules in the Crystal Lattice
Interactions between the molecules within the solid
Internal energy Disorder due to thermal motions and
spatial locations
Changes in the Free Energy
Thermodynamic activity
Solubility Stability
Dissolution rate
Figure 1.6: Effect of hydration on the physical properties of a pharmaceutical API
(Khankari and Grant, 1995).
Bioavailability and Product Performance

Chapter I
56
1.4.1 Classification of Hydrates
As referred earlier, hydrates incorporate water molecules in their crystal lattice, which can
happen in a stoichiometric or non-stoichiometric manner.
Stoichiometric hydrates have a fixed, although not strictly integral, ratio of water to the
compound (Hilfiker, 2006; Vippagunta et al., 2001). Generally, in this type of hydrates,
water plays a structural role in the whole crystalline network and its dehydration frequently
can lead to a disordered or amorphous state.
Non-stoichiometric hydrates have their water content dependent on the surrounding water
vapour pressure and temperature. The water acts as a space filler of structural voids or
channels and it is usually present in uncommon, yet well-defined, solvent/compound ratios
(Rodríguez-Spong et al., 2004). Though, it is common practice in the pharmaceutical
literature to wrongly round odd numbered water ratios to integer values. For example,
caffeine 0.8 hydrate (Griesser and Burger, 1995) is still quoted as monohydrate.
Non-stoichiometric hydrates can lose their water without changing the main structural
characteristics and therefore, in this case, are called isomorphic dehydrates (Pfeiffer et al.,
1970; Stephenson et al., 1998).
Hydrates in general and, non-stoichiometric hydrates in particular, represent a challenge
for development due to its instability. The characterisation of hydrates doubtlessly needs
more effort and time when compared to the characterisation of polymorphs and can be a
real challenge. In the next section, specific points are presented to be considered in the
characterisation of hydrated systems.

Chapter I
57
1.4.2 Insights on the Characterisation of Hydrates
Thermal Analysis
Dynamic scanning calorimetry (DSC) in combination with thermogravimetric analysis
(TGA) and hot stage microscopy (HSM) are the most common techniques used in the
study of hydrates. The use of DSC alone may not be very elucidative as endothermic
transitions due to dehydration can be easily seen as melting, or the other way around.
Furthermore, the distinction between true hydrates and sorbed water is not always
straightforward (Craig and Reading, 2007). Different scenarios can be observed when
carrying on a study of a hydrate compound in DSC (Giron, 1995). The dehydration and
melting of the anhydrous phase can be observed in separate and therefore two endotherms
are observed. On the contrary, if these two phenomena cannot be isolated and dehydration
happens at the melting temperature, an exotherm might be seen as the new anhydrous
phase recrystallises from the melt. The picture can become even more complex when a
change in the hydration level is observed (see Chapter 3). The pan configuration, closed or
open, can also influence the outcome of a DSC experiment, as well as the heating rate,
crystal size and sample mass.
TGA measurements give information about the thermal stability of the hydrate form
depending on the onset of the water loss. Less stable forms will show dehydration starting
from low temperatures. More stable hydrated forms, usually the case of stoichiometric
hydrates, show a water loss signal at well-defined temperatures. TGA has recently been
used in combination with infrared spectroscopy to understand the thermal behaviour of
other solvates and at the same time to confirm the nature of the vapour (Rastogi et al.,
1999).
Moreover, TGA experiments performed under isothermal and/or non-isothermal conditions
can be used to quantify the kinetic parameters of dehydration, such as activation energy
(Ea) (Vyazovkin et al., 2011). Both methods have advantages/disadvantages and the hard
decision is to know which one can give results with more accuracy. The biggest
disadvantage of isothermal methods is the unavoidable non-isothermal heat-up time in the
beginning of the experiment. As a result, if lower temperatures cannot allow the complete

Chapter I
58
dehydration in a reasonable time, higher temperatures can lead to a significant extent of
conversion during that heating-up period. With regard to non-isothermal experiments, the
biggest disadvantage is the difficulty in differentiating between the different kinetic models
(Vyazovkin et al., 2011).
HSM is also a very helpful technique in the characterisation of hydrates. A widely used
procedure when studying hydrates under HSM is by dispersing the sample in silicone oil in
order to aid the visualisation of the thermally induced release of any included solvent.
As dehydration occurs it is supposed to observe the formation of bubbles in the oil (Zhu
and Grant, 2001; Zhu, 2006). Thus, attention must be paid during the data interpretation
since this observation could be potentially complicated by the release of entrapped air from
the solids or by the simple presence of air bubbles in the dispersion medium (Brittain,
2009).
The use of HSM often provides unique insights not afforded by other techniques and the
combination with the results obtained from DSC and TGA, constitute an optimal routine
approach.
Dynamic Vapour Sorption
Dynamic vapour sorption (DVS) experiments give information on the equilibrium water
content as a function of relative humidity (RH) at a constant temperature. In the case of
stoichiometric hydrates the water content at equilibrium may experience stepwise jumps
whereas for non-stoichiometric a continuous increase in the water content until complete
saturation of the structure might be observed (Hilfiker, 2006). Commonly,
non-stoichiometric hydrates show identical profiles during sorption and desorption and
hysteresis is not observed.
Attention should be paid to the kinetic stability observed during moisture sorption isotherm
experiments. One would expect that at higher RH, a hydrated crystal form is more stable
than the anhydrous form, however this cannot be readily transported when solubility
experiments are performed. In fact, cases are reported of the opposite stability relationship,
such as the example of LY334370 HCl used for the treatment of acute migraine, where the
Chapter I
59
anhydrous form is more stable in water than the dihydrate crystal (Reutzel-Edens et al.,
2003b). Mannitol is an example of a metastable hydrate that converts to the anhydrous
form when exposed to moisture (Yu et al., 1999).
Another important piece of information that can be derived when performing DVS
experiments is related to the hygroscopic behaviour of the dehydrated phase. The
definition of hygroscopicity combines thermodynamic driving forces and kinetic rates and
can be broadly described by the amount and the rate of moisture uptake at a certain RH.
Among all the classification systems that can be found in the literature, the one commonly
followed was proposed by Callahan and it is based on data obtained from sorption isotherm
experiments (Callahan et al., 1982), as presented in Table 1.1.
Table 1.1: Hygroscopicity classification scheme according to Callahan.
Class Classification Features
I Non-hygroscopic
Essentially there is no moisture uptake at RHs below 90%.
Furthermore, the increase in moisture content after storage for
one week above 90% RH is less than 20%.
II Slightly hygroscopic
There is no significant moisture uptake at RHs below 80%. The
increase in moisture content after storage for one week above
80% RH is less than 40%.
III Moderately
hygroscopic
The moisture content does not increase more than 5% after
storage at RHs below 60%. The increase in moisture content
after storage for one week above 80% RH is less than 50%.
IV Very hygroscopic
The increase in the moisture content may increase at RHs as low
as 40 to 50%. The increase in moisture content after storage for
one week above 90% RH may exceed 30%.
Adapted from (Callahan et al., 1982).
Chapter I
60
Crystallographic Studies
X-ray crystallography is a powerful technique for characterising water-solid interactions in
crystalline hydrates, providing information about their structural behaviour and stability.
The dehydration of non-stoichiometric hydrates lead to the formation of isomorphic
dehydrates that tend to retain the three-dimensional structures of the parent compound.
Dehydration resulted in shifts in the X-ray peak positions, as a function of lattice
expansion or contraction. This is the behaviour of paroxetine HCl Form II described in
Chapter 3 of this thesis. The use of variable temperature (VT) and variable humidity (VH)
X-ray powder diffraction (XRPD) is sometimes imperative to monitor dehydration in situ
or to investigate potentially complex solid state transformations (Rastogi et al., 2001).
Recently, significant developments in crystallographic computing systems have allowed to
solve the structure of compounds by powder diffraction methods that have not been
possible to be solved by single crystal methods (David et al., 1998; Stephenson, 2000).
This represents a great achievement as many crystalline substances are complex or beyond
the capability of single crystal techniques.
Nuclear Magnetic Resonance
In the past decade, nuclear magnetic resonance (NMR) relaxometry has been widely used
to study water-solid interactions. Water absorption generally has a strong influence on
molecular dynamics in solids and therefore 1H and
13C spin lattice relaxation is affected.
Hydrogen bonding interactions between thiamine HCl and water were studied using NMR
and the results showed a reduced molecular mobility for the hydrate phase in comparison
with the isomorphic dehydrate (Te et al., 2003). In addition, the non-stoichiometric
behaviour of LY297802 tartrate, a muscarinic agonist, was studied using solid state NMR
in combination with X-ray crystallography (Reutzel, 1998).

Chapter I
61
1.4.3 Stability and Performance of Hydrates
When dealing with hydrates, their physical and chemical stabilities are important
parameters to consider. Hydrates might dehydrate or change their hydration level during
processing or storage, especially if they are in a metastable thermodynamic state. It is
therefore crucial to understand their dehydration behaviour from both kinetic and
thermodynamic standpoints before including a hydrated API in a final drug product
formulation.
The physical stability of hydrates depends on the temperature and water vapour pressure in
the surroundings of the solid. Dehydration can be described in a simplistic manner by the
reaction below,
Please note the above reaction can be, from a thermodynamic point of view, reversible or
irreversible.
Dehydration of crystalline solids represents an important group of heterogeneous reactions.
Galwey proposed a classification for solid state dehydrations entitled ‘Water Evolution
Type’ (WET) based on a structural, observational and kinetic criteria (Galwey, 2000). This
complex classification system was developed with the primary objective to reconcile the
differences and inconsistencies related to the dehydration reactions.
In this classification, the author divided dehydration reactions into six main groups as
briefly described below:
WET 1: Crystal structure is maintained. This class includes hydrates that lose their
intracrystalline water without significant modification of the host (original)
structure.
WET 2: Diffusion across an adherent and coherent barrier layer of product. In this
group, the rate of dehydration is controlled by the diffusion of the water across the
crystalline barrier formed by the dehydrated layer.

Chapter I
62
WET 3: Interface advance, nucleation, growth and contracting envelope. In
general, the nucleation step determines the subsequent geometric development and
starts at the crystal imperfections.
WET 4: Homogeneous dehydration reactions in crystals. The chemical change
occurs with equal probability throughout the crystalline reactant.
WET 5: Melting and the formation of poorly permeable outer layers. Melting can
be complete or partial, leading to difficulties in interpretation and development of
kinetic equations to describe the process.
WET 6: Comprehensive melting. When the water is liberated during the complete
melting of the solid.
Parameters such as particle size, morphology and the existence of crystal defects can
strongly affect the dehydration behaviour of hydrates. Generally, the smaller the particle
size, the faster is the dehydration process. Also, the presence of crystal defects, usually as a
result of high-energy particle size reduction processes, can enable dehydration to start at
that imperfection points and thus accelerating the whole process. The impact on the crystal
morphology is normally more subtle (Brittain, 2009).
Apart from the physical stability, it is also important to consider the chemical stability of
hydrates, namely pharmaceutical hydrates. An intriguing example of chemical stability is
the case of cefixime trihydrate (Kitamura et al., 1990). When partially dehydrated,
cefixime trihydrate was found to be unstable due to a highly disordered crystal structure
caused by loss of its water of crystallisation, which enables a hydrolytic reaction. Although
the anhydrous form is chemically stable it cannot be used because it readily picks up water
and rehydrates on storage. Therefore a careful control of temperature and humidity
conditions is needed upon storage in order to maintain the hydration state of this drug.
In terms of bioavailability and performance, anhydrous forms are, in general, more soluble
in aqueous media than the corresponding hydrate forms (Pudipeddi and Serajuddin, 2005).
This could be explained by the lower release of free energy when the hydrated form
interacts with water in comparison with the anhydrate form. Nevertheless, some examples
can be scattered from the literature showing hydrates to be more soluble than the
Chapter I
63
anhydrous form. An example is the case of norfloxacin, a broad spectrum fluoroquinolone
antibacterial agent, where its hydrates are more soluble than the anhydrate form (Roy et al.,
2008).
These differences in the hydration level of an API will be translated into distinct aqueous
solubility/dissolution rates and, as a consequence, bioavailability. An example is the study
carried out with ampicillin administrated to humans as anhydrous and trihydrate forms
(Poole et al., 1968). This study showed higher blood serum concentrations for the
formulations containing anhydrous ampicillin when compared to the concentrations
produced by the trihydrate. Another aspect to be carefully considered as well is the phase
transitions occurring during storage or dissolution experiments, as observed with
nitrofurantoin (Wafik Gouda et al., 1984) and theophylline (Herman et al., 1989),
respectively.
The determination of the aqueous solubility of metastable forms can in some cases be a
challenge. This is the case of carbamazepine that can crystallise as an anhydrate and as a
dihydrate form. The anhydrous form is reported to be practically insoluble in water,
however this observation is difficult to be confirmed due to the transformation to the
dihydrate, once it makes contact with water (Young and Suryanarayanan, 1991).
Above all, solid state hydrates represent a great slice in the pharmaceutical industry and
their erratic behaviour hitherto still provides significant manufacturing and processing
challenges. Nowadays, and taking advantage of characterisation methods, such as, dynamic
vapour sorption, thermoanalytical, spectroscopic and X-ray diffraction techniques can be
implemented to evaluate the kinetics, solid state properties and the nature of both tightly
bound and disordered hydration water.
1.5 Polymorphism and Patents
Finally, a brief overview on the patent systems and legal aspects related to polymorphism
is presented. Since crystal modifications of a compound represent different crystal entities
with potentially different physical properties, pharmaceutical companies have all the
Chapter I
64
interest to claim the new discovery to be potentially recognised in the awarding of a patent.
This will confer the inventor exclusive rights regarding the preparation, sale and use of the
patented subject matter, which can be used to restrain competition and set prices higher
than those that would have existed if competitive products were available (Hilfiker, 2006).
Several disputes in Court have been recorded over the past decades involving drugs with a
strong position in the market. It is the case of ranitidine HCl, cefradoxil and paroxetine
HCl. For the relevance to this study, the latter case will be presented in more detail.
Paroxetine HCl is a selective inhibitor of serotonin and it was firstly prepared as a maleate
salt by Ferrosan, a Danish company in the 1970s. In 1980, Beecham (now Glaxo
SmithKline – GSK) started scaling up the preparation of the hydrochloride salt of
paroxetine and a hemihydrate crystal (Form I) was found (Barnes et al., 1988). GSK was
able to start marketing paroxetine HCl hemihydrate since 1993 as Paxil®.
Two years later, a Canadian generic company Apotex submitted an Abbreviated New Drug
Application (ANDA) to the US FDA to market a formulation based on the anhydrate form
of paroxetine HCl (Form II), and filed a certification that its proposed product would not
infringe GSK’s patent for the paroxetine HCl hemihydrate product. However, GSK
claimed that Apotex’s Form II naturally converts into the Form I, making it likely that
there would be some Form I in Apotex’s product, therefore infringing GSK’s patent.
Although the district court interpreted the claim as requiring the presence of commercially
significant amounts of the hemihydrate for infringement to take place and found no reason
to limit the scope in such a way.
The above case demonstrates the value of fully understanding the relationship between all
the physical forms of an API. That information can therefore be used to develop the most
effective and stable product in order to maintain the intellectual property protection for the
innovator.
Chapter I
65
1.6 Amorphous Systems
Amorphous materials, also known as glasses, can be defined by the lack of long-range
order between the molecules when compared to the crystalline structure, as described
earlier. However, they do possess short-range order and each molecule can establish
interactions with the neighbour molecules through hydrogen bonding, van der Waals or
electrostatic interactions (Brittain, 2009).
In considering the importance of the amorphous state in pharmaceutical systems, they can
be a result of three main circumstances. Firstly, a material may exist intrinsically in a fully
or partially amorphous state, examples of which include mainly polymers such as
polyvinylpyrrolidone (PVP), polyethylene glycol (PEG) and microcrystalline cellulose.
Secondly, glassy drugs can be prepared intentionally to enhance aqueous solubility and
dissolution behaviour. Common routes that can be used to prepare amorphous solids
include quench cooling, solvent precipitation, mechanical activation, freeze drying and
spray drying. Thirdly, crystalline materials can be inadvertently converted to amorphous
during processing, some examples are milling, granulation and compression (Craig et al.,
1999; Bruno and George, 1997).
1.6.1 Amorphous Solids: Formation and Properties
Familiar routes used to prepare amorphous solids include quench cooling, solvent
precipitation, mechanical activation, freeze drying and spray drying. However, the most
common technique to generate glasses is by the rapid cooling from the melt. The latter two
technologies (freeze drying and spray drying) will be explained in more detail in further
sections.

Chapter I
66
1.6.1.1 Generation of Amorphous Materials by Cooling from the Melt
Crystals have lower potential energies than glasses and therefore their formation should be
more thermodynamically favourable. However, glasses are formed due to kinetic reasons.
More specifically, crystallisation of supercooled liquids often ‘needs some time’ and may
fail if ‘insufficient’ time is given. If this happens, a supercooled liquid may form a glass
upon cooling.
When a liquid is rapidly cooled below its melting point (Tm) no discontinuity in enthalpy or
volume is observed and the system forms a supercooled liquid, as shown in Figure 1.7. As
the material is cooled further, there is a stage where the rate of cooling exceeds the rate of
molecular rearrangement. At this point, the thermodynamic properties deviate from those
of the supercooled liquid and a glass is formed (Taylor and Shamblin, 1999; Bruno and
George, 1997). At this temperature, all the translational and rotational motions of the
‘frozen’ system are dramatically reduced and a change in heat capacity, Cp (which is the
derivative of enthalpy with respect to temperature, ∂H/∂T) is detected. This is known as the
glass transition temperature (Tg).
When the thermodynamic properties (enthalpy, entropy and volume) of a supercooled
liquid are extrapolated to temperatures below Tg, they converge with those of the
crystalline materials, shown by the dashed line in Figure 1.7. This hypothetical point is
known as the Kauzmann temperature (TK) (Kauzmann, 1948). The TK is considered to
mark the lower limit of the experimental Tg and to be the point at which the configurational
entropy of the system reaches zero (see Chapter 5). As a result, TK can be a valuable
indicator for the long-term storage stability of amorphous solids (Bruno and George,
1997).
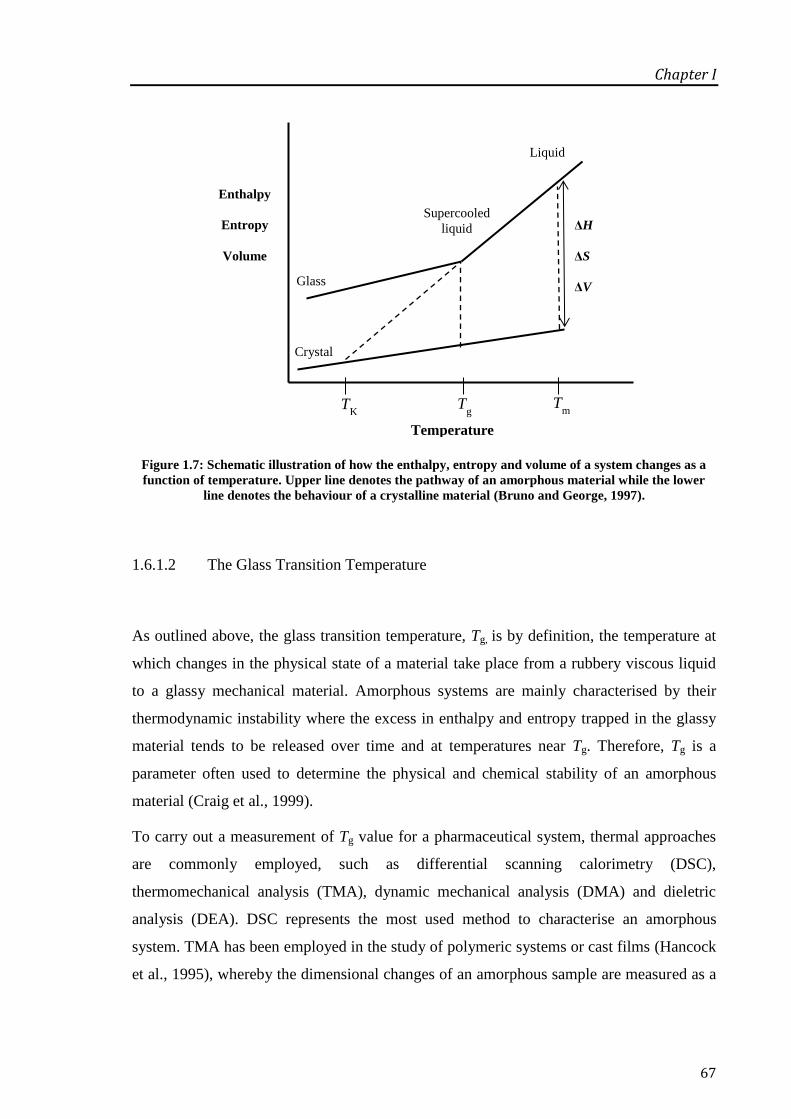
Chapter I
67
Figure 1.7: Schematic illustration of how the enthalpy, entropy and volume of a system changes as a
function of temperature. Upper line denotes the pathway of an amorphous material while the lower
line denotes the behaviour of a crystalline material (Bruno and George, 1997).
1.6.1.2 The Glass Transition Temperature
As outlined above, the glass transition temperature, Tg, is by definition, the temperature at
which changes in the physical state of a material take place from a rubbery viscous liquid
to a glassy mechanical material. Amorphous systems are mainly characterised by their
thermodynamic instability where the excess in enthalpy and entropy trapped in the glassy
material tends to be released over time and at temperatures near Tg. Therefore, Tg is a
parameter often used to determine the physical and chemical stability of an amorphous
material (Craig et al., 1999).
To carry out a measurement of Tg value for a pharmaceutical system, thermal approaches
are commonly employed, such as differential scanning calorimetry (DSC),
thermomechanical analysis (TMA), dynamic mechanical analysis (DMA) and dieletric
analysis (DEA). DSC represents the most used method to characterise an amorphous
system. TMA has been employed in the study of polymeric systems or cast films (Hancock
et al., 1995), whereby the dimensional changes of an amorphous sample are measured as a
Tg
Enthalpy
Entropy
Volume
ΔH
ΔS
ΔV
Supercooled liquid
Liquid
Crystal
Temperature
Glass
Tm
TK
Chapter I
68
function of temperature. By using DMA, the changes in the viscoelastic properties of an
amorphous material with temperature can be measured (Craig and Johnson, 1995). In the
case of DEA, a sinusoidal oscillatory electric field is applied to the sample and the
dielectric permittivity is measured as a function of temperature, showing an abrupt change
through the Tg (Stickel et al., 1995).
1.6.1.3 Molecular Mobility and Enthalpy Relaxation
Molecular mobility of amorphous systems can be defined as the molecular motions
associated with glass transition and represents one of the most important aspects for a
comprehensive approach of the amorphous state (Bhattacharya and Suryanarayanan,
2009).
Since the molecular volume within an amorphous solid is larger than that in the
corresponding crystalline phase, the enhanced molecular mobility in disordered solids
affects their chemical and physical reactivity. Molecular motions are temperature
dependent and, as a result minimal in the glassy state (in the sense of a system being below
Tg) and greater above the glass transition. Another point of concern is the fact that
amorphous materials are not static solids, but rather dynamic systems. As a consequence,
their stability is determined by kinetic aspects which governs their transformation towards
a more stable form (Byrn et al., 1994). For instance, recently numerous studies have been
devoted to the characterisation of molecular mobility of pharmaceutical amorphous
systems in order to predict their physical stability. These studies rely largely on the
measurement of bulk properties, such as relaxation enthalpy or heat capacity (Shamblin et
al., 2000).
One means of measuring mobility is to introduce a perturbation to the system (heat) and to
see how the system returns to the initial state, a process known as relaxation. As the initial
state is of higher enthalpy, heat is given off during the relaxation process, and this process
is also known as enthalpy relaxation (Liu et al., 2002). Relaxation can be divided into α
and β relaxation. The β-relaxation also called Johari-Goldstein relaxation is normally
correlated to the motion of some constitutional parts of the molecules (i.e., groups of
atoms), which is not coupled with the motion of the entire molecule. On the other hand,

Chapter I
69
α-relaxation or commonly known as structural relaxation reflects the motion of the whole
molecule, i.e., changes in atomic/molecular arrangements that happen during the
spontaneous conversion from the amorphous to crystalline state, in a scale of time and
temperature influence (Kawakami and Pikal, 2005; Hilden and Morris, 2004).
The Kohlraush-William-Watts (KWW) equation is generally used to determine relaxation
constants, which can be used to describe structural relaxation and correlate molecular
mobility between different systems. First of all, it is necessary to estimate the maximum
enthalpy recovery at that particular storage temperature, ΔHmax,T (also called enthalpy
relaxation at time infinity ΔH∞,T), according to Equation 1.1 (Hancock et al., 1995;
Hancock and Shamblin, 2001),
Equation 1.1
where, ΔCpTg
is the heat capacity change between the glass and the liquid at Tg and T is the
temperature at which isothermal relaxation is carried out.
From the maximum enthalpy recovery, it is possible to calculate the relaxation function (φ)
at a given time (t) and under a defined temperature T, according to Equation 1.2,
Equation 1.2
where, ΔHt is the measured enthalpy recovery under those defined conditions.
This expression can then be used to calculate the molecular relaxation time (τ) as a
meaningful and direct approach for quantifying molecular mobility as shown by
Equation 1.3 known as the KWW equation,
Equation 1.3
where, β is the relaxation time distribution parameter, with a value between 0 and 1.
β is an indication of the homogeneity of the relaxation process. Values near to the unit
correspond to an exponential function and are an indication of a narrow distribution of
Chapter I
70
states; values close to zero represent a broad distribution of states, and therefore, wide
distribution of relaxation times. During the ageing experiments, τ increases with time and β
decreases with time, therefore some authors recommend to use τβ as a stability indicator,
since it remains more or less invariant and it is less sensitive to experimental error
(Kawakami and Pikal, 2005; Liu et al., 2002).
1.6.1.4 Physical and Chemical Stability
Amorphous solids are characterised by their intrinsic thermodynamic instability and
irreversible tendency towards a most stable state. This phenomenon is known as
recrystallisation and implies the release of the excess of energy stored by the amorphous
material. The recrystallisation mechanism involves nucleation followed by crystal growth
and is influenced by the storage conditions such as temperature and relative humidity.
Molecular aggregation results in the formation of nuclei, followed by a nucleation phase
that initiates growth, leading consequently to an actual growth phase (Bruno and George,
1997).
The molecular mobility in amorphous systems is low at temperatures below the glass
transition but increases rapidly above it. It has been suggested that in order to reduce
molecular mobility and therefore extent the physical stability, amorphous materials should
be stored at a temperature at least 50 oC below its Tg (Hancock et al., 1995). However, this
fact cannot be taken as a guarantee of stability; firstly, molecular mobility exists even
below the glass transition temperature; secondly, it is not always possible to keep the
amorphous samples 50 oC below the Tg value; thirdly, the stability of amorphous materials
is system dependent. An example is the study carried out with glassy indomethacin and
phenobarbital, both of which have similar Tg values and were stored below their Tg
(Fukuoka et al., 1989). Phenobarbital was found to recrystallise within one week whereas
indomethacin was stable for several years. Dissimilarities in their structure and the
hydrogen bonding might be behind the differences observed. The relationship between Tg
and the physical stability is therefore complex and certainly not straightforward.
Another aspect to consider on the stability of amorphous materials is the presence of
residual amounts of water. Water has a very low Tg value around -135 oC (Hallbrucker et

Chapter I
71
al., 1989) and can act as plasticiser of amorphous solids by increasing the free volume of
these materials, hence increasing its molecular mobility and leading to a decrease in Tg
(Ahlneck and Zografi, 1990). On the contrary, some excipients can act as stabilisers in
amorphous pharmaceutical formulations and consequently have an antiplasticising effect
increasing the overall glass transition of the mixed system (Bruno and George, 1997).
In terms of chemical reactivity, amorphous solids show, in general, greater chemical
reactivity when compared to crystals. This is due to the enhanced degree of molecular
mobility and therefore higher potential for intramolecular and intermolecular chemical
reactions (Brittain, 2009). A well-documented example is the case of cefoxitin sodium
(Oberholtzer and Brenner, 1979). Amorphous cefoxitin sodium showed a considerably
higher rate of thermal degradation and colour change compared to its corresponding
crystalline form.
One plausible reason for the increased reactivity of amorphous compounds could be related
to their tendency in absorbing high amounts of water. According to Shalaev and Zografi,
water can promote chemical reactivity in amorphous systems acting in four different
possible ways: a reactant, a product, plasticiser or as a reaction medium (Shalaev and
Zografi, 1996). The versatility of water alone makes it a critical participant in many types
of reactions. In addition, the ubiquitous nature of water, in combination with its plasticising
effect, makes water a culprit in the chemical degradation of many amorphous drugs.
1.7 Solid Dispersion Technology
The use of solid dispersions was firstly introduced in the pharmaceutical field in the early
1960s by Sekiguchi and Obi (Sekiguchi and Obi, 1961). The authors found that the
formation of eutectic mixtures of drugs with water soluble carriers by the melting of their
physical mixtures resulted in a significant bioavailability enhancement. An eutectic
mixture simply consists of two compounds which are completely miscible in the liquid
state but only to a very limited extent in the solid state (Goldberg et al., 1965). As a result,

Chapter I
72
the faster dissolution rate and thereby improved bioavailability is a consequence of the
reduced particle size and better wettability of the API in the polymer matrix.
Currently, the definition of solid dispersion refers to the dispersion of the drug in a
biologically inert matrix at a solid state prepared by fusion or solvent methods (Chiou and
Riegelman, 1971). This formulation strategy has been explored for decades in order to
improve bioavailability of poorly soluble compounds. Figure 1.8 is a schematic timeline
representation of the different carriers used to prepare solid dispersions. In the early
beginning crystalline carriers were used such as urea (Goldberg et al., 1966) and sugars
(Kanig, 1964). These systems have the disadvantage of forming crystalline solid
dispersions, which did not release the drug as quickly as the amorphous ones, though they
were thermodynamically more stable.
Therefore, a second generation of solid dispersions emerged, containing amorphous
carriers instead of crystalline. Commonly, the amorphous carrier is a synthetic polymer
such as polyvinylpyrrolidone based polymers (PVP) (Simonelli et al., 1969; Weuts et al.,
2005), polyethyleneglycols (PEG) (Urbanetz, 2006; Bley et al., 2010) or polymethacrylates
(Huang et al., 2006); natural product based polymers can also be used to prepare solid
dispersions and are mainly composed by cellulose derivatives, such as
hydroxypropylmethylcellulose (HPMC) (Konno and Taylor, 2006), ethylcellulose (Desai
et al., 2006), hydroxypropylcellulose (Repka et al., 1999) or starch derivate, like
cyclodextrins (Mura et al., 1999b).
Recently, the third generation of solid dispersions appeared taking advantage of the surface
activity or self-emulsifying properties of certain carriers or specific materials. These
systems are designed to achieve the highest degree of bioavailability for poorly soluble
drugs and to maximise the stability of the prepared solid dispersion system. Examples of
surfactants selected for this purpose are inulin (Van Drooge et al., 2006), Gelucire 44/14TM
(Yüksel et al., 2003) and poloxamer 407 (Majerik et al., 2007). The association of
amorphous polymers and surfactants is also a common approach (Ghebremeskel et al.,
2007). The inclusion of surfactants in the formulation containing a polymeric carrier may
help to prevent precipitation and agglomeration of fine crystalline particles. On the other
hand, lipid-based formulations have been shown to enhance oral absorption of lipophilic
drugs, although the exact mechanism is complex and not yet fully understood (Pouton,

Chapter I
73
2000). Finally, the combination of polymers with different physicochemical properties can
represent a good strategy in increasing the physical stability of solid dispersions when
compared with single polymer based systems (Yang et al., 2013; Sakurai et al., 2012).
Figure 1.8: Classification of solid dispersions according to the nature of the carrier selected
(adapted from (Vasconcelos et al., 2007)).
Solid Dispersions
First
generation
Crystalline carriers
Second
generation
Amorphous carriers
Third
generation
Surfactants
Mixture of surfactants and
polymers
Lipids
Combination of polymers
Chapter I
74
1.7.1 Preparation Methods for Solid Dispersions
1.7.1.1 Melting Methods
1.7.1.1.1. Traditional Melting Methods
The melting method is the oldest and the easiest way to prepare solid dispersions, provided
the drug and the carrier are miscible in the molten state. This method consists of melting
the drug within the carrier followed by cooling and pulverisation of the obtained product
(Lloyd et al., 1997). The time allowed for the formation of the glass in the supercooled
melt is considered a critical parameter for the stability of the resulting amorphous material.
The cooling rate of the melt should be chosen depending on the spontaneous tendency of
each compound to recrystallise, and can be slow at room temperature or fast in an ice bath
or by immersion in nitrogen liquid. Generally, faster cooling rates lead to the preparation
of more stable amorphous systems, as the time scale available for molecular reorganisation
is lower.
Limitations of this method include the thermal stability of both drug and polymer at the
melting temperature and the existence of miscibility gaps in the phase diagram that can
lead to the formation of a product not homogeneously dispersed. Moreover, this method is
not suitable to a scale-up preparation of solid dispersions.
Hot Melt Extrusion 1.7.1.1.2
Hot melt extrusion (HME) method consists of the extrusion of the drug and carrier,
previously mixed, at an elevated temperature for a short period of time. The resulting
product is then collected after cooling at room temperature (Shah et al., 2012). Since this
technique was used in this work to prepare solid dispersions it will be described in more
detail in Chapter 2.

Chapter I
75
1.7.1.2 Solvent Methods
Solvent Evaporation Methods 1.7.1.2.1
Solvent evaporation methods were firstly introduced in the 1960s and since then many
workers have taken up this method for the preparation of solid dispersions (Tachibana and
Nakamura, 1965). The solvent evaporation method consists of the dissolution of the drug
and carrier in a volatile solvent that is later evaporated. In this method, the thermal
decomposition of drugs or carriers can be prevented, since the evaporation of the organic
solvent occurs at low temperatures. However, it is a prerequisite that both the drug and
polymer are soluble in the solvent, usually ethanol, chloroform or dichloromethane.
Freeze Drying 1.7.1.2.2
The basic freeze drying process consists in three main steps: freezing, primary drying
(by sublimation) and secondary drying (by desorption). The drug and carrier are dissolved
in a common solvent (usually water), which can be immersed in liquid nitrogen until it
becomes completely frozen (Tang and Pikal, 2004).
In this first step, two phases are formed: one is the frozen solvent and the other is the
highly concentrated solute termed as ‘freeze concentrate’. The next step is the primary
drying which involves the sublimation of the frozen solvent under vacuum and with
relatively low temperature in order to enhance the sublimation of the solvent. After this
step, the product still contains a certain amount of water, ranging from 5 to 20%,
depending on the nature of the formulation. Therefore, in the secondary drying the shelf
temperature is raised at much higher temperature than in the primary drying step so that
desorption of the residual solvent occurs at a high rate (Tang and Pikal, 2004; Craig et al.,
1999).
Besides of its use to prepare rapidly dissolving oral dosage forms, freeze drying has also
gained considerable application in the processing of pharmaceutical products of biological
origin including vaccines, peptides and liposomes (Craig et al., 1999).
Chapter I
76
Spray Drying 1.7.1.2.3
Spray drying is a well-established method for processing solutions, emulsions and
suspensions into powders, efficiently controlling the size, density and morphology of the
particles. Spray drying is one of the most commonly used solvent evaporation techniques
in the preparation of solid dispersions. It consists of dissolving or suspending the drug and
carrier, then spraying it into a stream of heated air flow to remove the solvent.
Similarly to HME, spray drying will be discussed in more detail in Chapter 2 of this
dissertation.
Electrospinning 1.7.1.2.4
Electrospinning has gained particular interest in the last five years due to its simple and
versatile ability to produce nanofibers suitable for the delivery of poorly water soluble
drugs. During the electrospinning process a solution containing the polymer and API is
pumped through a thin nozzle with an inner diameter on the order of 100 mm. The nozzle
simultaneously serves as an electrode, to which a high electric field of
100–500 kVm is applied. This results in charge being induced within the solution, which
causes the initiation of a jet. As this jet travels the solvent’s evaporation is accelerated and
the electrospun fibers can be collected (Greiner and Wendorff, 2007). This process is
schematically represented in Figure 1.9. As the solvent evaporates, the drug molecules are
dispersed in the polymer fibers matrix, producing electrospun fibers that can enhance drug
solubility (Bikiaris, 2011; Ignatious et al., 2010).
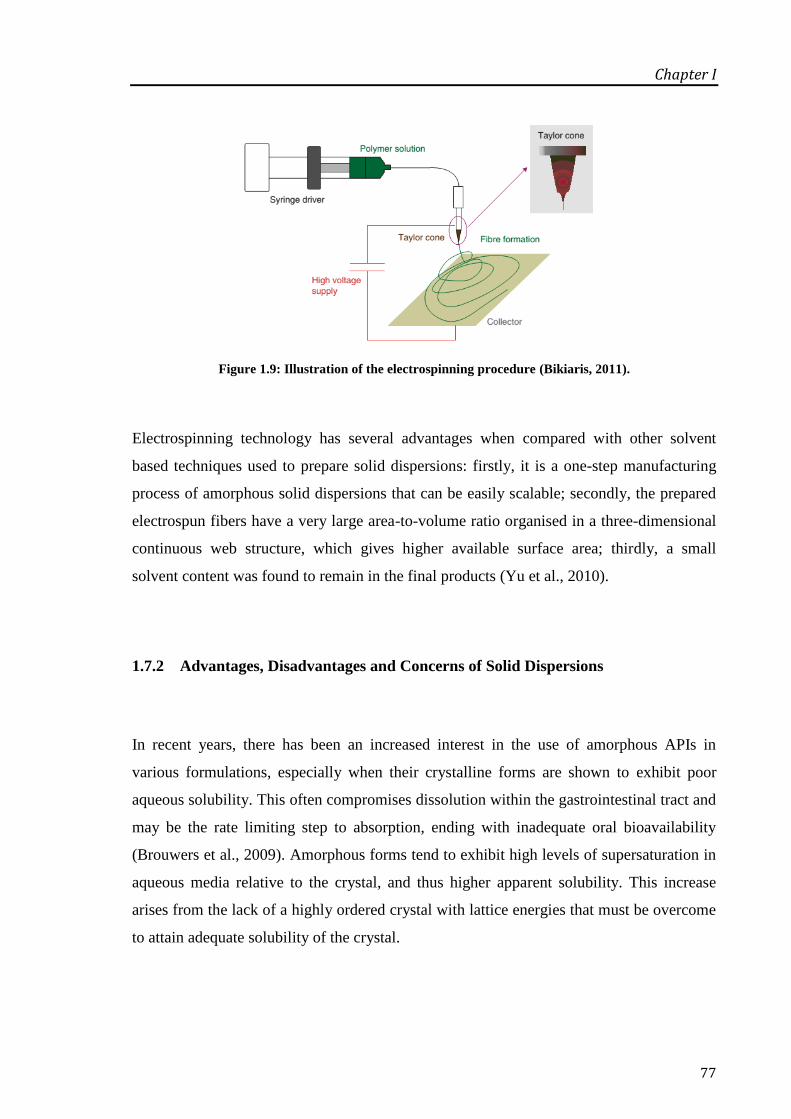
Chapter I
77
Figure 1.9: Illustration of the electrospinning procedure (Bikiaris, 2011).
Electrospinning technology has several advantages when compared with other solvent
based techniques used to prepare solid dispersions: firstly, it is a one-step manufacturing
process of amorphous solid dispersions that can be easily scalable; secondly, the prepared
electrospun fibers have a very large area-to-volume ratio organised in a three-dimensional
continuous web structure, which gives higher available surface area; thirdly, a small
solvent content was found to remain in the final products (Yu et al., 2010).
1.7.2 Advantages, Disadvantages and Concerns of Solid Dispersions
In recent years, there has been an increased interest in the use of amorphous APIs in
various formulations, especially when their crystalline forms are shown to exhibit poor
aqueous solubility. This often compromises dissolution within the gastrointestinal tract and
may be the rate limiting step to absorption, ending with inadequate oral bioavailability
(Brouwers et al., 2009). Amorphous forms tend to exhibit high levels of supersaturation in
aqueous media relative to the crystal, and thus higher apparent solubility. This increase
arises from the lack of a highly ordered crystal with lattice energies that must be overcome
to attain adequate solubility of the crystal.

Chapter I
78
As compared to single component amorphous APIs, the presence of a hydrophilic carrier in
amorphous solid dispersions can contribute to increase the wettability of the drug and at
the same time act as crystallisation inhibitor improving their physical stability.
However, despite the advantages of solid dispersion formulations they are not broadly used
in commercial products, mainly because there is the possibility that during processing
(mechanical stress) or storage (temperature and humidity stress) the amorphous state may
undergo crystallisation. Moreover, phase separation between the drug and the polymer can
also promote crystal growth. This may result in decreased solubility and dissolution rate
(Pokharkar et al., 2006; Vasconcelos et al., 2007). Therefore, exploitation of the full
potential of amorphous solids implies a suitable stabilisation in solid state, as well as
during in vivo performance.
The first concern when intending to prepare solid dispersions with an API and a polymer is
to evaluate their degree of miscibility. Approaches such as melting point depression
(MPD) and solubility parameter (δ) are often used to infer on the miscibility of a system;
these two methods will be discussed in Chapters 6 and 7. It is also well-recognised that the
addition of polymers with a high Tg can increase the Tg of the miscible mixture, thereby
reducing the molecular mobility at regular storage temperatures (Weuts et al., 2005).
Additionally, drug-polymer specific interactions between functional groups, in general
through hydrogen bonds, tend to increase the energy barrier against recrystallisation
(Matsumoto and Zografi, 1999). Finally, specific properties of the polymer such as the
degree of hygroscopicity can represent a considerable advantage in the stabilisation of
these systems. The influence of the polymer type in the preparation of amorphous solid
dispersions of olanzapine, a poorly water soluble antipsychotic drug, will be explored in
Chapter 7 of this thesis.
1.8 Phase Transformations during Processing
After the identification and thorough characterisation of the most appropriate physical
form of an API, it is important to ensure that the selected crystal form is retained in the
Chapter I
79
final pharmaceutical product. Stresses induced during production and interactions with
formulation components can lead to phase transformations. Understanding the effect of
each processing step on the API physical form is therefore very important in ensuring the
phase purity of the drug substance used throughout the product development stream
(Brittain, 2009).
Generally, the transformations of the materials can be simply classified as solid-solid
(phase transition, deformation), solid-liquid (melting, crystallisation) or solid-gas
(sublimation, condensation) (Morris et al., 2001). More specifically in the pharmaceutical
field, scenarios of amorphisation, crystallisation, polymorphic transitions and incorporation
or removal of solvents from the crystal lattice are the most relevant physical solid state
transitions (Figure 1.10). As a result, properties such as stability, solubility, dissolution,
bioavailability, density, hardness, etc., might be influenced by phase transformations. A
brief description of the impact of pharmaceutical processes on solid phase transformations
is presented.
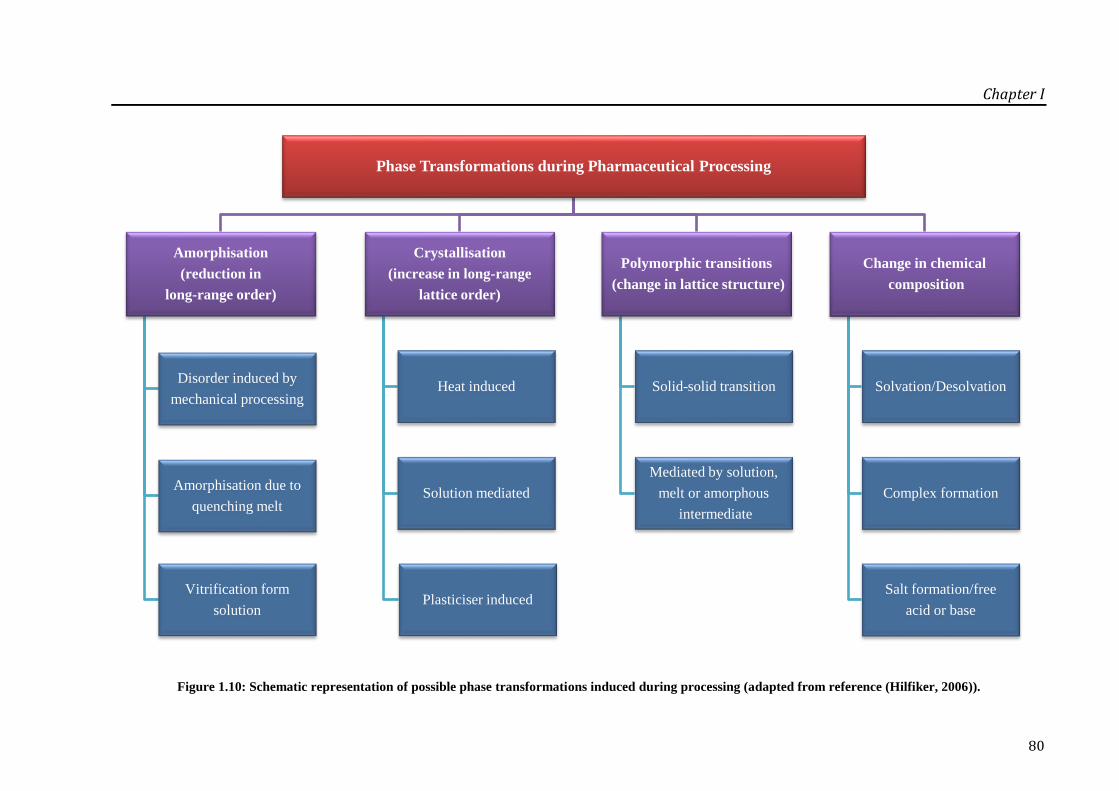
Chapter I
80
Figure 1.10: Schematic representation of possible phase transformations induced during processing (adapted from reference (Hilfiker, 2006)).
Phase Transformations during Pharmaceutical Processing
Amorphisation
(reduction in
long-range order)
Disorder induced by
mechanical processing
Amorphisation due to
quenching melt
Vitrification form
solution
Crystallisation
(increase in long-range
lattice order)
Heat induced
Solution mediated
Plasticiser induced
Polymorphic transitions
(change in lattice structure)
Solid-solid transition
Mediated by solution,
melt or amorphous
intermediate
Change in chemical
composition
Solvation/Desolvation
Complex formation
Salt formation/free
acid or base

Chapter I
81
1.8.1 Milling
Milling is one of the first steps during solid product processing that leads to particle’s
fracture and size reduction. This might facilitate subsequent processing and enhance
product performance. Nevertheless, it is important to account that milling normally imparts
mechanical stress and generates heat and vibrational energy that can induce phase
transitions such as polymorphic transitions and vitrification via solid state (amorphisation)
(Zhang et al., 2004).
Several cases can be found in the literature reporting solid phase transformations during
milling. One example is the case of ranitidine HCl (Chieng et al., 2006). The authors
studied the effect of the milling conditions on the polymorphic stability of ranitidine HCl
Form I. Ranitidine HCl Form I was found to convert to Form II or an amorphous form
depending on the temperature at which the milling process was carried out. Additionally, it
is important to bear in mind that crystalline materials can also be converted to amorphous
solids by continuous grinding via dehydration/desolvation. Carbamazepine dihydrate was
milled at different environmental humidity conditions and it converted to an amorphous
phase after the removal of the first mol of water. The amorphous form then transformed
into the anhydrate after dehydration of the second mol of water (Otsuka et al., 1999). A
direct polymorphic transition was observed with caffeine metastable Form I that rapidly
converted to the stable Form II after 3 min of milling time (Pirttimaki et al., 1993).
1.8.2 Wet Granulation
In general, a granulation step may be required in order to improve the flow and
consolidation properties of a blend as it proceeds into tableting. Commonly, two methods
are used to prepare suitable granules: (1) wet granulation, that involves an aqueous or
hydro-alcoholic binder solution (alone or with a polymer) is added to a dynamic powder
bed and a drying step is followed; (2) dry granulation on the other hand is typically used
Chapter I
82
when the formulation ingredients are sensitive to moisture or elevated drying temperatures
(Zhang et al., 2004). As a result, wet granulation is more likely to induce phase transitions,
especially with compounds that tend to form stable hydrates at ambient conditions.
Therefore, depending on the exposure time to the granulation liquid and drying conditions,
the final product can be a mixture of an anhydrous, a metastable or even partially or total
amorphous forms.
Anhydrous forms of theophylline and carbamazepine were found to be transformed into
their respective hydrates during aqueous wet granulation (Otsuka et al., 1997; Debnath and
Suryanarayanan, 2004). Another example is the case of thiamine HCl, a relatively water
soluble nutritional factor (vitamin B1) that was found to dissolve in the granulation fluid
(Wostheinrich and Schmidt, 2001). As a consequence, multiple phase changes were
detected during processing, with conversion into the most stable hemihydrate form during
storage.
1.8.3 Compression
As with milling, the compression of powders to prepare tablets involves the application of
significant force, which may cause solid phase transformations in either the API or the
excipients. Compression can induce dissolution of crystals in adsorbed water or conversion
to stable/unstable or even amorphous forms. Polymorphic transformations of caffeine,
sulfabenzamide and maprotiline HCl were studied as function of powder particle size and
compression forces (Chan and Doelker, 1985).
1.8.4 Freeze Drying
Another process that can result in phase transitions is freeze drying. Lyophilised products
are often unstable and may also undergo phase conversions during processing. A complex
Chapter I
83
example is mannitol that has a tendency to freeze dry as a combination of crystalline and
amorphous solids. Therefore, slight variations in the lyophilisation process can result in the
generation of different solids (Haikala et al., 1997).
Overall, APIs and excipients are exposed to different kinds of stresses during manufacture
which can result in phase transformations. The most commonly observed transitions are
amorphous ↔ crystalline, anhydrate ↔ hydrate and polymorphic conversions.
The characterisation and identification of such transitions is not always straightforward due
to the presence of multiple components in the formulation. Therefore it is important to
perform a thorough physical characterisation of the API throughout the manufacturing line
as a way to detect and control possible phase transformations during processing.
1.9 Research Objectives
In this thesis, structural characterisation from basic structure of two APIs (olanzapine and
paroxetine HCl) was carried out and extended through the formulation into solid dispersion
systems. Furthermore, the structure-property relationship was linked to the experimental
performance and physical stability. The main objectives of each individual chapter are
presented in more detail in the preceding Scope and Overview section.

2 MATERIALS AND METHODS

Chapter II
85
2.1 Materials
2.1.1 Paroxetine Hydrochloride
Paroxetine hydrochloride (HCl) is functionally classified as a selective serotonin re-uptake
inhibitor (SSRI) that enhances serotonergic transmission by blocking the pre-synaptic
active membrane transport mechanism and therefore increases the serotonergic activity at
the post-synaptic receptor, as illustrated in Figure 2.1. Paroxetine HCl has been used for
the treatment of depression, obsessive-compulsive disorder, panic disorder and social
phobia (Bourin et al., 2001; Johnson, 1992).
Paroxetine HCl can exist in two different crystal forms, Form I and II. Form I is a
hemihydrate and the most stable form of paroxetine HCl. Paroxetine HCl Form II had been
previously classified up to this study as a very hygroscopic anhydrous form (Buxton et al.,
1988). This form was thoroughly studied in this work and results are presented in Chapter
3 of this dissertation.
Figure 2.1: Mechanism of action of specific serotonin (5-HT) reuptake inhibitors (SSRI)
(www.cnsforum.com).
Figure 2.2 presents the chemical structure of paroxetine HCl.

Chapter II
86
Figure 2.2: Chemical structure of paroxetine HCl.
Table 2.1 presents a list of general physicochemical properties of the two forms of
paroxetine HCl, Forms I and II, which will be studied further in the following chapters.
Table 2.1: General physicochemical properties of paroxetine HCl Forms I and II.
Properties Form I Reference Form II Reference
IUPAC
Name
(3S,4R)-3-[(1,3-
Benzodioxol-5-
yloxy)methyl]-4-(4-
fluorophenyl)piperidine
(3S,4R)-3-[(1,3-
Benzodioxol-5-
yloxy)methyl]-4-(4-
fluorophenyl)piperidine
Chemical
Formula C19H20FNO3.HCl.
1/2H2O C19H20FNO3.HCl
General
Designation
Stoichiometric hydrate
(Hemihydrate)
(Barnes et
al., 1988)
Non-stoichiometric
hydrate* Chapter 3
Molecular
weight
(MW)
374.83 g/mol 365.83 g/mol
Density (ρ) 1.35 g/cm3
(Yokota et
al., 1999) 1.36 g/cm
3
(Howard et
al., 2003)
Entries in
the CSD**
GODVAW
GODVAW01 EHOXEE
*Note that this is a finding of the current work and the evidence for this assertion is outlined in Chapter 3
**Cambridge Structural Database
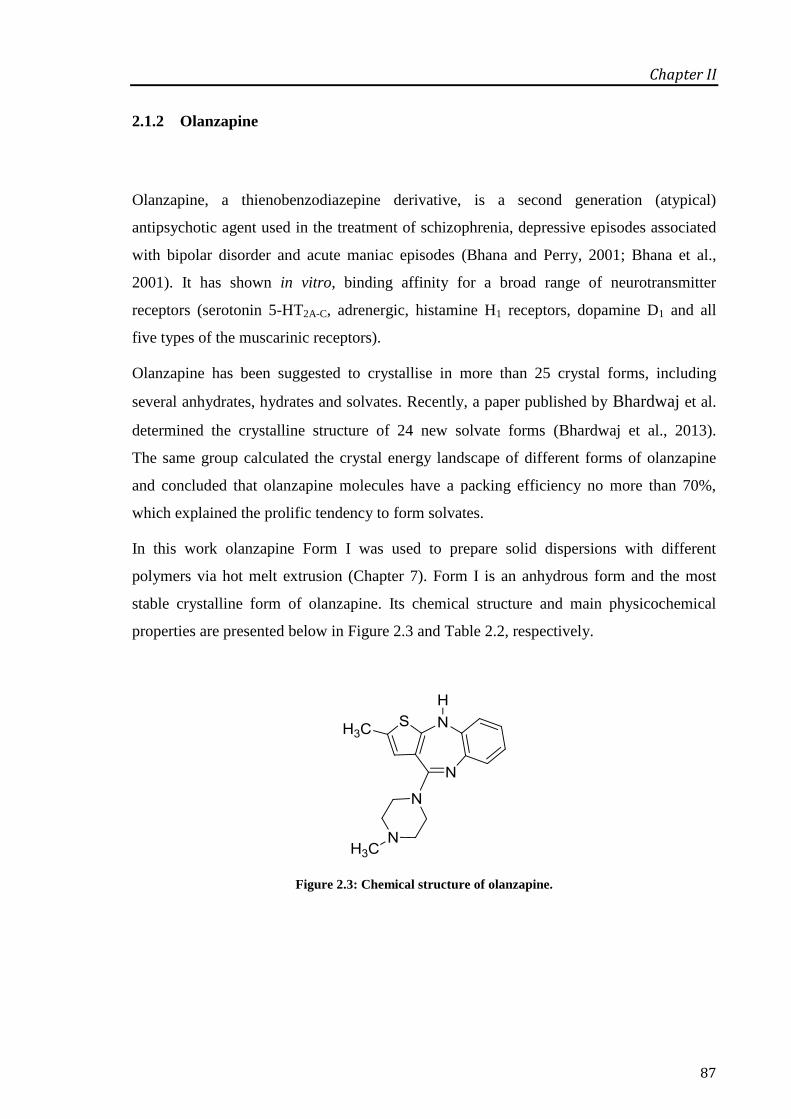
Chapter II
87
2.1.2 Olanzapine
Olanzapine, a thienobenzodiazepine derivative, is a second generation (atypical)
antipsychotic agent used in the treatment of schizophrenia, depressive episodes associated
with bipolar disorder and acute maniac episodes (Bhana and Perry, 2001; Bhana et al.,
2001). It has shown in vitro, binding affinity for a broad range of neurotransmitter
receptors (serotonin 5-HT2A-C, adrenergic, histamine H1 receptors, dopamine D1 and all
five types of the muscarinic receptors).
Olanzapine has been suggested to crystallise in more than 25 crystal forms, including
several anhydrates, hydrates and solvates. Recently, a paper published by Bhardwaj et al.
determined the crystalline structure of 24 new solvate forms (Bhardwaj et al., 2013).
The same group calculated the crystal energy landscape of different forms of olanzapine
and concluded that olanzapine molecules have a packing efficiency no more than 70%,
which explained the prolific tendency to form solvates.
In this work olanzapine Form I was used to prepare solid dispersions with different
polymers via hot melt extrusion (Chapter 7). Form I is an anhydrous form and the most
stable crystalline form of olanzapine. Its chemical structure and main physicochemical
properties are presented below in Figure 2.3 and Table 2.2, respectively.
Figure 2.3: Chemical structure of olanzapine.

Chapter II
88
Table 2.2: Physicochemical properties of olanzapine Form I.
Properties Olanzapine Form I Reference
IUPAC Name 2-methyl-4-(4-methylpiperazin-1-yl)-5H-thieno
[3,2-c][1,5]benzodiazepine
Chemical Formula C17H20N4S
General Designation Anhydrate Form I (Reutzel-Edens et al.,
2003)
Molecular weight
(MW) 312.43 g/mol
Density (ρ) 1.30 g/cm3
(Reutzel-Edens et al.,
2003)
Entries in the CSD UNOGIN
UNOGIN01
(Reutzel-Edens et al.,
2003, (Wawrzycka-
Gorczyca et al.,
2004a)
Recrystallisation
from solvents
Can be recrystallised from anhydrous solvents
such as ethyl acetate, toluene, propyl acetate,
isopropyl acetate, butyl acetate, tetrahydrofuran
and acetone. As well as from desolvation of
several low alcohol solvates viz., methanol,
ethanol and propanol and from dihydrates
B, D and E
(Bunnell et al., 1996,
1998; Wawrzycka-
Gorczyca et al.,
2004a; Bunnell et al.,
2001; Reutzel-Edens
et al., 2003a)
Entries in the CSD UNOGIN
UNOGIN01
(Reutzel-Edens et al.,
2003, (Wawrzycka-
Gorczyca et al.,
2004a)
Others Adopts mirror-related conformation (conformer
A and B)
(Reutzel-Edens et al.,
2003)
Table 2.3 below presents a resume of several polymorphic and pseudopolymorphic forms
of olanzapine described in the literature, their properties and preparation methods.

Chapter II
89
Table 2.3: Principal characteristics and properties of other forms of olanzapine.
Solid State
Classification Designation Principal Features
Anhydrates
Form II
Considered to be metastable and not well suited for commercial use in pharmaceutical formulations;
Prepared from desolvation of methanol solvate and crystallised from acetonitrile and dichloromethane
(Reutzel-Edens et al., 2003a; Bunnell et al., 1997);
Single crystals of this form were isolated in a recent work (Bhardwaj et al., 2013), which allowed to finally
obtain its crystal structure;
Form III
Prepared by dissolving Form I or II in aqueous acid solution (HCl, H2SO4, CH3COOH) followed by a
precipitation of olanzapine from the resultant salt using a methanolic solution (Hamied et al., 2002);
Reutzel-Edens et al. (2003) stated in their work that the attempts to prepare pure Form III were not
successful. However the desolvation in mild conditions of CH2Cl2 and CHCl3 solvates result in Form III free
of Form II, but still not yield to a pure Form III;
Hydrates
Dihydrates B, D
and E
The structure of three dihydrates (B, D and E) and its relative stability has been reported by
Reutzel-Edens et al. (2003). In their work, the dihydrates B and E showed a lower dehydration temperature
(≈ 25 oC) in comparison to the dihydrate D (≈ 50
oC);
The hydrates B and E are considered to be channel hydrates;
Dihydrate D is considered to be the most stable, having a more organised crystal packing and therefore a
higher dehydration temperature;
Refcodes of the dihydrates of olanzapine deposited in the CSD: AQOMAU (dihydrate D), AQOMAU01
(dihydrate B) and AQOMAU02 (dihydrate E);

Chapter II
90
Higher hydrate
Crystallise from EtOAc-toluene-water mixtures at temperatures lower than 55 oC and dichloromethane-
water mixtures;
It is a metastable form containing 2-2.5 mol of water;
It converts to the dihydrate E within few minutes after being isolated from the crystallisation solution;
Two hydrate forms are reported in the CSD: AQOMEY (Reutzel-Edens et al. 2003) and AQOMEY01; the
last entry, is described to be submitted into CSD by (Wawrzycka-Gorczyca et al. 2007), however no
information is available in the published paper;
Two
components
(solvent-
olanzapine)
solvates
Ethanol and
1-propanol solvate
Its desolvation leads to Form I (Bunnell et al. 1997);
Methanol solvate
The desolvation of this solvate lead to Form I (Bunnell et al., 1997);
Its structure has been reported (Wawrzycka-Gorczyca et al., 2004b) and deposit into the CSD (UNOGOT);
Accordingly to the solved structure, the methanol molecules are localised in channels;
Dichloromethane
solvate
It has been firstly prepared (Larsen, 1997) by dissolving olanzapine in CH2Cl2 at 30 oC and keeping the
mixture isothermal for 30 min, followed by a rapid cooling in an ice-bath;
The structure of this form solved later in 2007 and submitted to the CSD with the refcode WEXQAS
(Wawrzycka-Gorczyca et al., 2007);
It is described to crystallise in a ratio of 1:2 solvent-drug molecules;
The intermolecular hydrogen bonds N-H…
N found in Form I, were also reported for this structure;
It is an unstable form and its desolvation results in olanzapine Form I;

Chapter II
91
Three
components
(water-
solvent-
olanzapine)
solvates
Methanol solvate
monohydrate
The structure of this solvate was solved (Capuano et al., 2003) and submitted to the CSD
(refcode: ELEVOG);
The piperazine ring adopts a chair conformation with the methyl group in a equatorial position;
Dimethylsulfoxide
solvate monohydrate
The solved structure (Polla et al., 2005) showed a water:DMSO proportion of 1:0.40 and to be isostructural
to others solvates, viz., methanol solvate and methanol solvate monohydrate;
Refcode in CSD: CAYTUS;
It completely desolvates upon heating (weight loss = 13%) and melts as olanzapine Form I;
Methanol solvate
dihydrate
Its structure has been solved (Wawrzycka-Gorczyca et al., 2007);
It is described to crystallise in a ratio of 2:1:2 olanzapine:ethanol:water, respectively;
As previously mentioned, olanzapine molecules are arranged into dimers which are hydrogen bonded to
water and ethanol molecules;
Refcode in the CSD: WEXQEW;
Butan-2-ol solvate
monohydrate
The crystalline structure showed that the olanzapine dimers are linked through bridges established by the
water molecules (Wawrzycka-Gorczyca et al., 2007);
The stoichiometry of this three component solvate is 1:1:1 (olanzapine:butan-2-ol:water) and its refecode in
CSD is WEXPUL;
Isopropanol solvate
dihydrate
It is described to crystallise with a stoichiometry 2:1:2, olanzapine:isopropanol:water, respectively
(Kotar-Jordan et al., 2011);
It can be converted into to a methylene chloride solvate and then to olanzapine Form I;

Chapter II
92
2.1.3 Polyvinylpyrrolidone
Soluble polyvinylpyrrolidone (PVP), also known as Povidone, is obtained by free-radical
polymerisation of vinylpyrrolidone in water or 2-propanol (Bühler, 2005), yielding the
chain structure shown in Figure 2.4.
Figure 2.4: Chemical structure of PVP.
PVP is classified as an extremely hygroscopic substance, which is attributed to the
electronegative groups of the carbonyl group in the pyrrolidone structure able to establish
hydrogen bonding with water (Callahan et al., 1982).
Differentiation between the different grades of PVP homopolymers is made based on their
molecular weights and relative viscosity in water. Therefore, it is possible to calculate a
K-value for each grade according to the Ph. Eur. and USP monographs. Within the PVP
homopolymers family, higher K-values are related to higher molecular weight and
therefore higher viscosity (Bühler, 2005).
In terms of pharmaceutical applications, PVP is commonly used as adhesive and binder,
particularly important in tableting and also incorporated in the film-coating of tablets, in
transdermal systems and in medicinal sprays (Bühler, 2005). PVP has been extensively
reported in the literature to have good stabilising effects on amorphous APIs (Khougaz and
Clas, 2000; Tantishaiyakul et al., 1999, 1996). Therefore, in this work, PVP K30 was used
as a carrier in solid dispersion formulations, as a means of stabilising amorphous
olanzapine prepared via hot melt extrusion. The physicochemical and general properties of
PVP K30 are described in Table 2.4.

Chapter II
93
Table 2.4: Physicochemical properties of PVP K30.
Properties PVP K30 Reference
IUPAC Name Polyvinylpyrrolidone
Chemical Formula (C6H9NO)n
General Designation Povidone
Molecular weight (MW) 31 700 – 51 400 g/mol (Bühler, 2005)
Glass transition
temperature (Tg) ≈ 160
oC (Bühler, 2005)
Density (ρ) 1.16 g/cm3 (Chokshi et al., 2005)
2.1.4 Polyvinylpyrrolidone Vinyl-Acetate
Polyvinylpyrrolidone vinyl-acetate (PVPVA), also known as Copovidone, is manufactured
by free-radical polymerisation of 6 parts of vinylpyrrolidone and 4 parts of vinyl-acetate in
2-propanol. Figure 2.5 below shows the chemical structure of the repeating units of
PVPVA 6:4.
Figure 2.5: Chemical structure of PVPVA 6:4.

Chapter II
94
Table 2.5 lists the main physicochemical properties of PVPVA 6:4.
Table 2.5: Physicochemical properties of PVPVA 6:4.
Properties PVPVA 6:4 Reference
IUPAC Name Polyvinylpyrrolidone
vinyl-acetate
Chemical Formula (C6H9NO)6(C4H6O2)4
General Designation Copovidone
Molecular weight (MW) 45 000 – 70 000 g/mol (Bühler, 2005)
Glass transition
temperature (Tg) ≈ 105
oC (Bühler, 2005)
Density (ρ) 1.17 g/cm3 (Chokshi et al., 2005)
The applications of PVPVA, in line with PVP, rely mainly on its good binding and
film-forming properties, its affinity to hydrophilic and hydrophobic surfaces. Because of
these properties, it is commonly used as a processing aid in the production of granules and
tablets, as a binder in direct compression, in film coatings on tablets, as a protective layer
and sub-coat for tablet cores and as a film-forming agent in sprays. In addition, the 40%
replacement with the lipophilic vinyl-acetate functional groups makes this co-polymer to
be relatively less hygroscopic which has resolved some processing and handling issues of
the homopolymer system (Bühler, 2005).
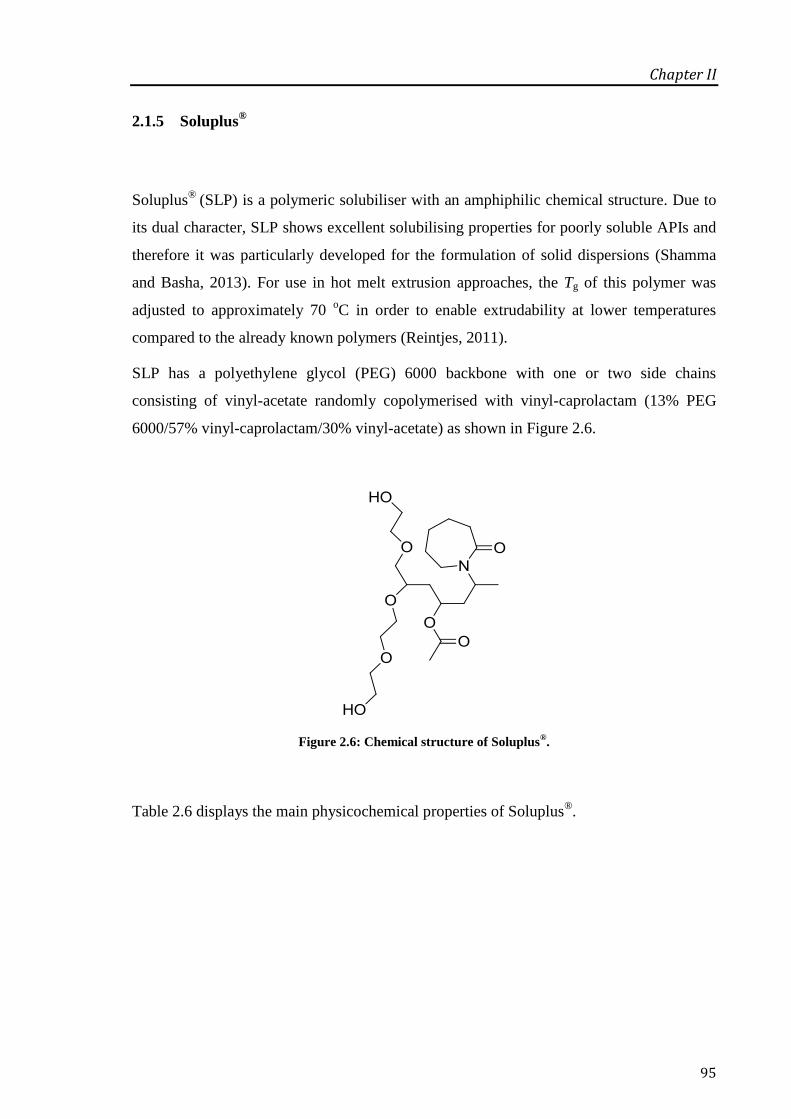
Chapter II
95
2.1.5 Soluplus®
Soluplus®
(SLP) is a polymeric solubiliser with an amphiphilic chemical structure. Due to
its dual character, SLP shows excellent solubilising properties for poorly soluble APIs and
therefore it was particularly developed for the formulation of solid dispersions (Shamma
and Basha, 2013). For use in hot melt extrusion approaches, the Tg of this polymer was
adjusted to approximately 70 oC in order to enable extrudability at lower temperatures
compared to the already known polymers (Reintjes, 2011).
SLP has a polyethylene glycol (PEG) 6000 backbone with one or two side chains
consisting of vinyl-acetate randomly copolymerised with vinyl-caprolactam (13% PEG
6000/57% vinyl-caprolactam/30% vinyl-acetate) as shown in Figure 2.6.
Figure 2.6: Chemical structure of Soluplus®.
Table 2.6 displays the main physicochemical properties of Soluplus®.
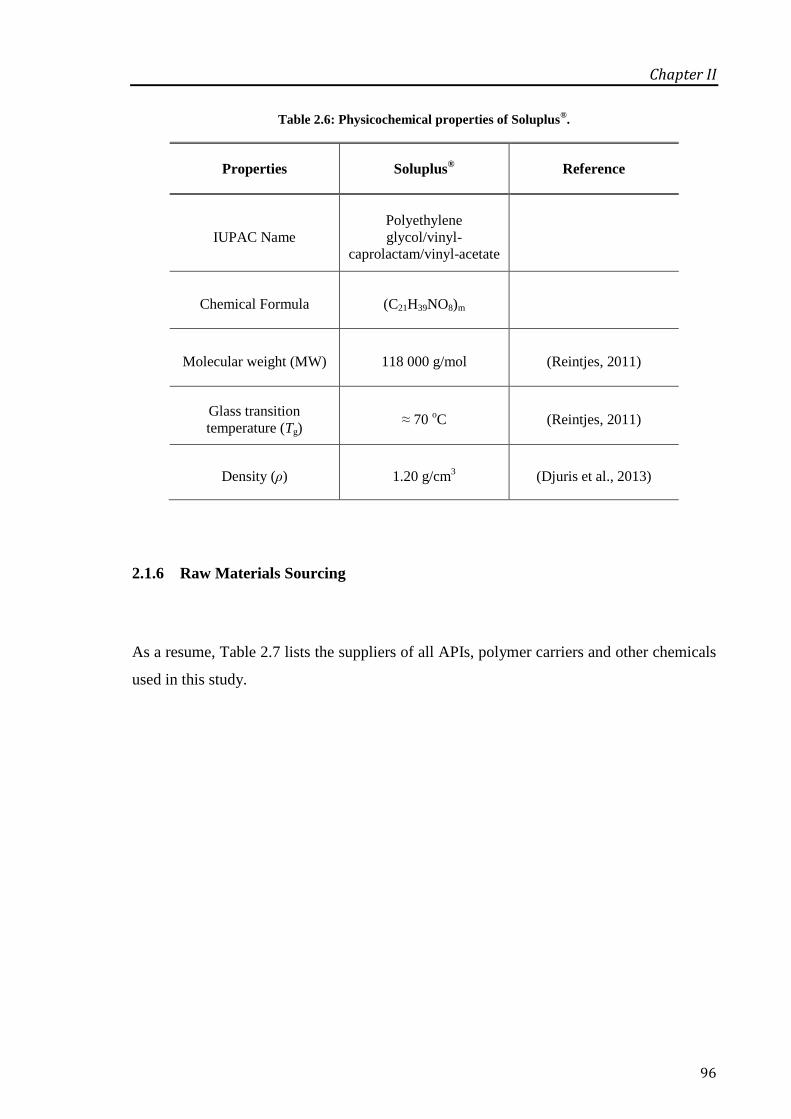
Chapter II
96
Table 2.6: Physicochemical properties of Soluplus®.
Properties Soluplus® Reference
IUPAC Name
Polyethylene
glycol/vinyl-
caprolactam/vinyl-acetate
Chemical Formula (C21H39NO8)m
Molecular weight (MW) 118 000 g/mol (Reintjes, 2011)
Glass transition
temperature (Tg) ≈ 70
oC (Reintjes, 2011)
Density (ρ) 1.20 g/cm3 (Djuris et al., 2013)
2.1.6 Raw Materials Sourcing
As a resume, Table 2.7 lists the suppliers of all APIs, polymer carriers and other chemicals
used in this study.

Chapter II
97
Table 2.7: Sources of chemicals used in this study.
Category Substance Supplier
APIs and
Polymers
Paroxetine HCl Form I Afine (China)
Paroxetine HCl Form II Huahai Pharmaceuticals (China)
Olanzapine Form I Myjoy Ltd. (India)
PVP K30 BASF (Germany)
PVPVA 6:4 BASF (Germany)
Soluplus® BASF (Germany)
DSC Standards
n-Octedacane Sigma Aldrich (UK)
Benzoic acid Sigma Aldrich (UK)
Indium Sigma Aldrich (UK)
Tin Sigma Aldrich (UK)
Sapphire disc TA Instruments (US)
DVS Standard Sodium Bromide Sigma Aldrich (UK)
Salts used for
Stability Test
Sodium Chloride Fischer Scientific (UK)
Magnesium Nitrate Hexahydrate Fluka (Germany)
Calcium Chloride BDH Laboratory (UK)
Potassium Acetate Alfar Aesar (UK)
Phosphorus Pentoxide Alfar Aesar (UK)
Solvents Methanol Sigma Aldrich (UK)
Karl Fischer
Reagents
Hydranal® Solvent Fluka Analytical (US)
Hydranal® Titrant Fluka Analytical (US)
Hydranal®
Standard Fluka Analytical (US)
Materials used to
Prepare
Dissolution Media
Hydrochloride Acid Sigma Aldrich (UK)
Potassium Dihydrogen Orthophosphate Fischer Scientific (UK)
Sodium Phosphate Dibasic Sigma Aldrich (UK)

Chapter II
98
2.2 Preparation of Solid Dispersions
2.2.1 Spray Drying
Spray drying (SD) is a technique used to dry aqueous or organic solutions, suspensions or
pastes into a dry particle form. The use of drying of products from an atomised liquid
stream was firstly reported by Percy in 1872 (Percy, 1872). Since that time, and due to
significant equipment development, SD became a versatile technique with application in
several different areas, ranging from food, ceramics and fertilisers to the pharmaceutical
industry.
In the pharmaceutical industry, SD has been used from simple drying operations to the
process of peptides and vitamins and has particular importance for the production of
particles with optimal properties for inhalation therapy (Vidgren et al., 1987). In this work,
SD was selected to prepare amorphous solid dispersions due to the main advantage of the
very fast solvent evaporation that leads to rapid viscosity increase and permits kinetic
trapping of the API in the carrier matrix (Paudel et al., 2012).
A typical spray drying process consists of four basic steps ( u chi, 2003):
1. Atomisation of the liquid feed
2. Mixing of the liquid with the drying gas
3. Evaporation of the liquid
4. Separation of the dried particles from the gas
Atomisation transforms the liquid stream into fine droplets by applying a force. The more
energy supplied during this step, the smaller the droplets and consequently the smaller the
spray dried particles produced.
The liquid spray is subsequently mixed with the drying gas. Normally, compressed air is
the medium of choice; however, if organic solvents are being used then an inert gas such as
nitrogen should be used to minimise the risk of explosion. The drying gas needs to have

Chapter II
99
the right temperature and humidity, which must be adjusted accordingly to the nature of
the sample. For instance, if the solvent is water, higher temperatures would be required
compared to organic solvents.
The contact between the droplet and the heated gas resulted in the evaporation of the
solvent from the saturated vapour film at the droplet surface. The design of the drying
chamber and the gas flow allows the droplets to reside in the chamber until the desired
moisture content is achieved and then the product is immediately discharged from the
chamber. The last step in the SD process is the collection of the particles, which requires
the separation of the dried droplets from the drying gas stream, most commonly via a
cyclone.
Reviews have been published in recent years concerning the fundamentals of spray drying
(Cal and Sollohub, 2010; Sollohub and Cal, 2010; Vehring et al., 2007) and exploring the
influence of process and formulation parameters on the quality of the resulting spray dried
products (Corrigan, 1995; Paudel et al., 2012).
The main steps involved in the spray drying process and referred above are identified in
Figure 2.7. In this study a Bu chi Mini Spray Dryer B-290 ( u chi, Switzerland) was
used.
Figure 2.7: Bu chi Mini Spray Dryer B-290, a laboratory-size model (Bu chi brochure).

Chapter II
100
2.2.2 Hot Melt Extrusion
Hot melt extrusion (HME) is a processing technique widely applied in the plastic, rubber
and food industry. In the past few years, an extensive number of studies have shown the
potential of this technology in the pharmaceutical field for manufacturing a variety of
dosage forms and formulations such as granules, pellets, tablets, implants, transdermal
systems and ophthalmic inserts (Breitenbach, 2002). HME is a continuous manufacturing
process in which a blend of API, thermoplastic polymeric carrier and other processing aids,
including plasticisers and antioxidants, is heated and softened inside the extruder barrel
and then pressurised through a die into granules, cylinders or films (Crowley et al., 2007;
Repka et al., 2007).
The extrusion process can be categorised as either ram extrusion or screw extrusion. Screw
extrusion consists of one or two rotating screws inside a heated barrel, while ram extrusion
operates with a positive displacement ram capable of generating high pressures to push
materials through the die. Ram extrusion has limited melting capacity that causes poor
temperature uniformity in the extrudate compared to screw extrusion and for that reason is
not used for HME (Crowley et al., 2007). Screw extruders used for pharmaceutical
applications typically consist of two screws (twin screw) and can be categorised,
depending on the direction of rotation of the screw, as co-rotating or counter-rotating.
Figure 2.8 displays a schematic representation of a typical lab scale extruder. An extruder
can be divided into three main zones: the feeding, the melting or compression and the
metering zone. The different zones of the barrel are pre-set to specific temperatures prior
the extrusion process. The API and polymer are premixed and fed into the extruder via a
hopper. The feedstock is further transported along the length of the barrel, where it is
melted, plasticised, mixed and compressed. The material transfer should be efficient in
order to maintain an increase in pressure in the compression zone and the metering zone.
The primary function of the metering zone is to ensure thickness, consistent flow and
steady delivery rate through the die (Breitenbach, 2002).
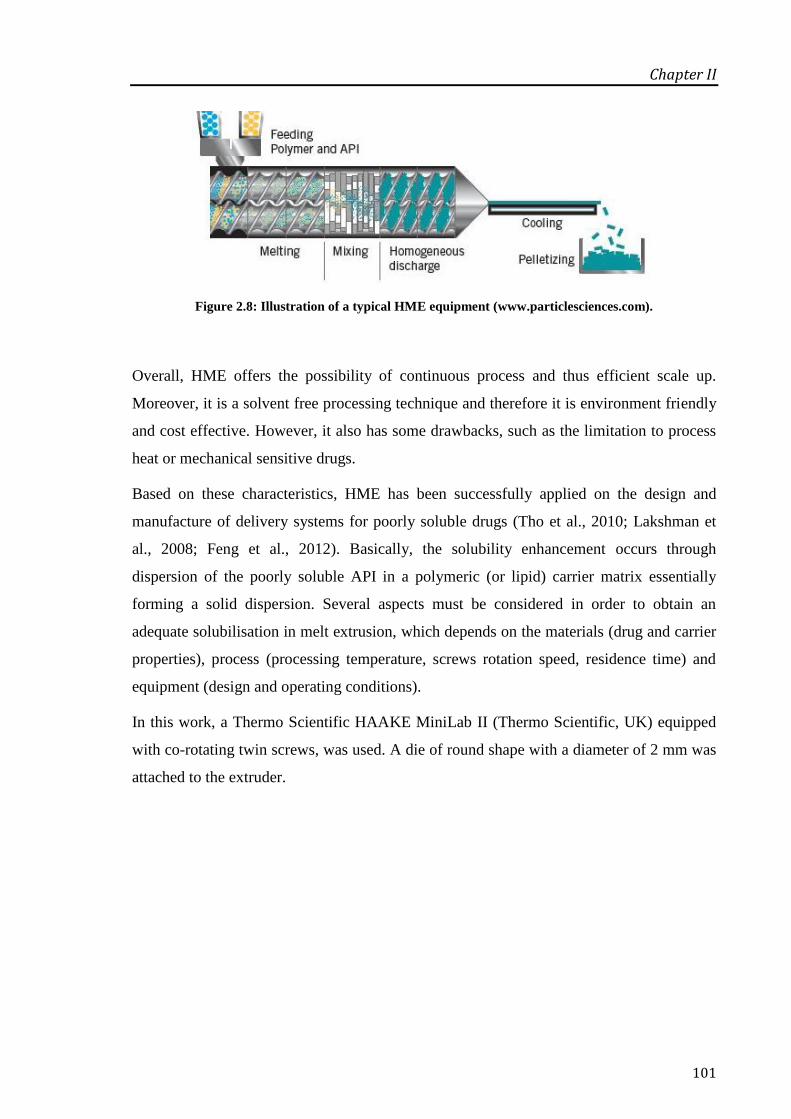
Chapter II
101
Figure 2.8: Illustration of a typical HME equipment (www.particlesciences.com).
Overall, HME offers the possibility of continuous process and thus efficient scale up.
Moreover, it is a solvent free processing technique and therefore it is environment friendly
and cost effective. However, it also has some drawbacks, such as the limitation to process
heat or mechanical sensitive drugs.
Based on these characteristics, HME has been successfully applied on the design and
manufacture of delivery systems for poorly soluble drugs (Tho et al., 2010; Lakshman et
al., 2008; Feng et al., 2012). Basically, the solubility enhancement occurs through
dispersion of the poorly soluble API in a polymeric (or lipid) carrier matrix essentially
forming a solid dispersion. Several aspects must be considered in order to obtain an
adequate solubilisation in melt extrusion, which depends on the materials (drug and carrier
properties), process (processing temperature, screws rotation speed, residence time) and
equipment (design and operating conditions).
In this work, a Thermo Scientific HAAKE MiniLab II (Thermo Scientific, UK) equipped
with co-rotating twin screws, was used. A die of round shape with a diameter of 2 mm was
attached to the extruder.

Chapter II
102
2.3 Characterisation Techniques
2.3.1 Differential Scanning Calorimetry
2.3.1.1 Principles of Operation
Differential scanning calorimetry (DSC) is a well-established method of thermal analysis
within the pharmaceutical sciences. DSC technique consists in applying a heat signal to a
sample and consequently measuring the response in terms of the energy and temperature
associated with the relative events, such as melting, crystallisation, glass transition and
decomposition reactions of the materials. The temperature profile may be a heating,
cooling or an isothermal program (Craig and Reading, 2007).
There are two different types of DSC instruments according to the operating principles:
heat flux and power compensation. The two types differ on the design of the DSC cell and
the algorithms used to convert the measured temperature difference into differential power
(heat flow). Power compensation DSC involves two separated furnaces, one for the sample
and a second for the reference. The temperature difference between the two furnaces is
kept similar by supplying an electric power to the sample furnace. In heat flux DSC, the
sample and the reference are placed symmetrically inside the furnace and share a common
heat source. As a result, the heat flow signal is derived from the temperature difference
between the sample and the reference and is measured by the thermocouples which are
connected in a back-to-back arrangement.
The DSC used in the experiments carried out in this thesis (TA Instruments, US) operates
by heat flux and the above descriptions are schematically represented in Figure 2.9.
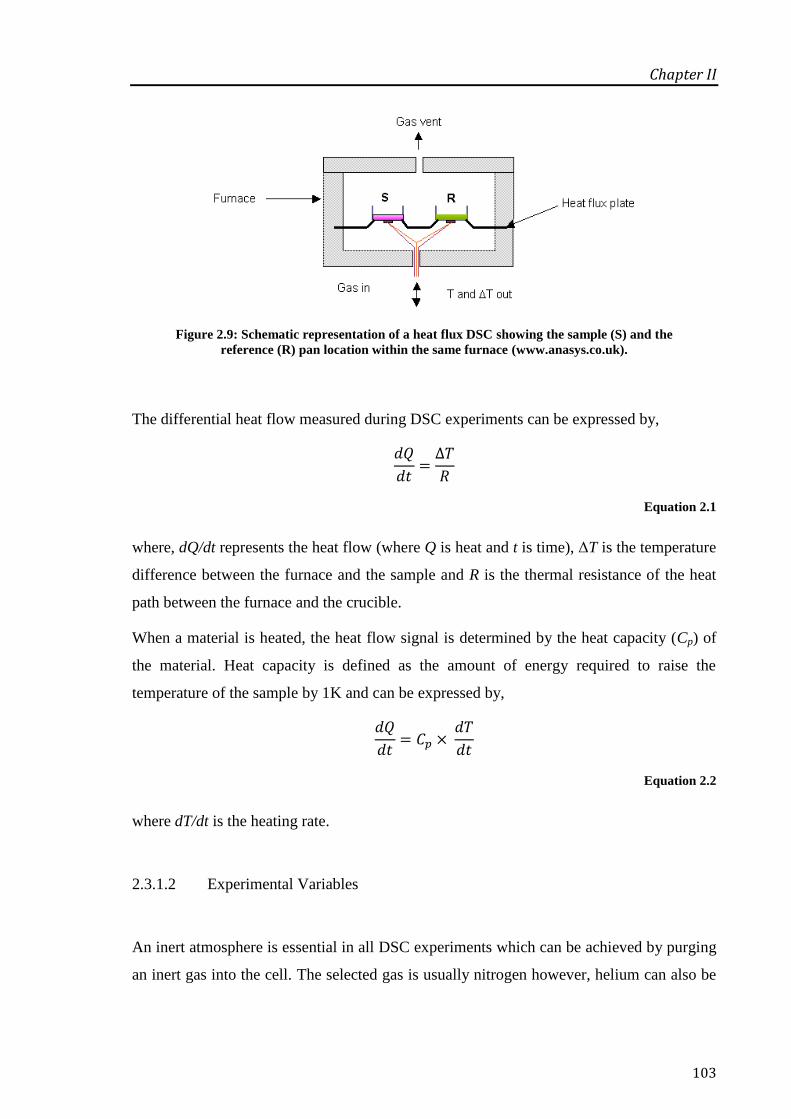
Chapter II
103
Figure 2.9: Schematic representation of a heat flux DSC showing the sample (S) and the
reference (R) pan location within the same furnace (www.anasys.co.uk).
The differential heat flow measured during DSC experiments can be expressed by,
Equation 2.1
where, dQ/dt represents the heat flow (where Q is heat and t is time), ΔT is the temperature
difference between the furnace and the sample and R is the thermal resistance of the heat
path between the furnace and the crucible.
When a material is heated, the heat flow signal is determined by the heat capacity (Cp) of
the material. Heat capacity is defined as the amount of energy required to raise the
temperature of the sample by 1K and can be expressed by,
Equation 2.2
where dT/dt is the heating rate.
2.3.1.2 Experimental Variables
An inert atmosphere is essential in all DSC experiments which can be achieved by purging
an inert gas into the cell. The selected gas is usually nitrogen however, helium can also be
Chapter II
104
used. A constant purge gas, in general with a flow rate of 50 mL/min, enhances the heat
transfer between the cell and the sample pan. Moreover, ensures that any volatile
compounds, including water vapour, are removed from the contact with the measuring
sensor and, at the same time, minimise long term damage of the DSC cell.
To ensure an accurate performance of the instrument, routine calibrations processes must
be carried out each time any experimental parameter changes (heating rate, pan type). The
cell constant calibration (enthalpy calibration) is conducted by heating indium through its
melting transition (Tm = 156.6 oC) and the temperature calibration is performed by using
high purity materials, such as n-octadecane (Tm = 28.2 oC), benzoic acid (Tm = 122.4
oC)
and tin (Tm = 231.9 oC).
Another important factor to consider is the sample size. As the sample mass increases there
is an increase in the thermal gradient across the sample. With conventional DSC, large
sample masses are recommended if precise heat capacity data is required as this increases
the ΔT and heat flow signals. However, a sample size between 3-5 mg is generally
recommended.
Finally, the type of pan selected is of great importance and should be carefully chosen
depending on the properties of the sample and on the type of data extrapolated from the
DSC run. For example, when analysing solid dispersions the presence of water influences
the measured Tg and therefore as a way to dry the sample upon heating, pans with a hole in
the lid (pinhole pans) are often used. Open pans (pans without lids) can also be used for
this purpose, though the linearity of the baseline might be compromised. In contrast, when
dealing with suspensions, liquid formulations or samples that must be kept in their
hydrated state, hermetically sealed pans must be used. In the present Thesis, these three
different types of pans (pinhole, open and hermetic) were used depending on the desired
experimental measurements in each case.
Chapter II
105
2.3.1.3 Modulated Temperature Differential Scanning Calorimetry
Principles of Operation 2.3.1.3.1
Modulated temperature differential scanning calorimetry (MTDSC) is an extension of the
conventional DSC technique in which a sinusoidal modulation is superimposed on the
linear temperature ramp combined with a mathematical procedure designed to separate
different types of sample behaviour (deconvolution) (Coleman and Craig, 1996; Craig and
Reading, 2007; Gill et al., 1993). This allows the direct measurement of heat flow and
changes in heat capacity simultaneously, as expressed by Equation 2.3,
Equation 2.3
where, f (t,T) is a function of time and temperature and it is used to express the response
associated with the physical or chemical transformation.
The first term on the right hand side of the Equation 2.3 describes the heat flow associated
with the heat capacity of the sample and represents reversing processes. On the other hand,
the second term is related to the enthalpy of the reaction and it is often identified as an
irreversible event. As a result, events such as glass transition are accurately measured in
the reversing heat flow signal whereas irreversible processes which are kinetically
hindered, for example relaxation and crystallisation, are observed in the non-reversing heat
flow signal.
Overall, MTDSC technique gives three signals in a single heating run, allowing the heat
capacity, kinetic and total heat flow components to be delineated. This technique has been
of undoubted use for the study of amorphous systems.
Experimental Variables 2.3.1.3.2
MTDSC experiments depend on three parameters: the underlying heating rate, the
temperature modulation amplitude and the reciprocal period. In general, MTDSC implies
Chapter II
106
the use of much slower heating rates, typically varying from 1-5 oC/min, compared with
the 10-20 oC/min heating rates employed in conventional DSC. The combination of low
underlying heating rates with large modulation amplitudes, generally selected from the
range ± 0.1 to ± 1 oC, enables an increase in sensitivity without any compromise of
resolution. The modulation period is normally selected within 30-80 sec. However, an
important requirement is to have at least six modulation cycles throughout the duration of
each thermal event in order to enable the complete separation of cycle and underlying
processes (Coleman and Craig, 1996).
The baseline and temperature calibration of the MTDSC cell does not differ from that of
the conventional DSC although an additional step for the calibration of the heat capacity is
needed. This will allow a correct measurement of the sample heat capacities and an
adequate separation of the total, reversing and non-reversing heat flow signals. The heat
capacity calibration is performed by scanning a material with known heat capacity, such as
sapphire.
DSC and MTDSC studies were carried out on a DSC Q1000 and Q2000 series TA
Instruments (US) with an integrated cooling system (RCS) attached. The purge gas used
was nitrogen with a flow rate of 50 mL/min.
2.3.2 Hot Stage Microscopy
Hot stage microscopy (HSM) consists in an optical microscope fitted with a hot stage
accessory, and therefore combines the best properties of microscopy and thermal analysis.
This analytical technique enables the characterisation of the physical properties of
materials as a function of temperature such as melting, solid state transformations,
recrystallisations, etc.
High resolution colour cameras and image manipulation software are nowadays powerful
accessories of HSM, which enable to record thermal events happening during the
heating/cooling cycle of the sample (Vitez et al., 1998).

Chapter II
107
In this thesis, HSM studies were performed using a microscope Leica DM L52 (Germany)
with a 20x lens connected to a hot stage plate Mettler Toledo FP82HT (UK) and a FP90
central processor.
2.3.3 Thermogravimetric Analysis
Thermogravimetric analysis (TGA) is a technique where the change in weight of the
sample is measured as a function of temperature (non-isothermal experiments) or time
(isothermal experiments).
Water content and chemical decomposition of solid drugs and pharmaceutical excipients
are the two main applications of this technique in the pharmaceutical arena. Moreover, it
can be used to determine the stoichiometry of solvates (calculated from the weight loss per
known amount of original sample) and at the same time give an indication on the strengths
of the water binding on the basis of the temperature at which the solvent is lost. Finally and
in the same field of the study of solvates, vital information can be obtained when
combining DSC and TGA techniques with a view to differentiating between solvent loss
and melting.
TGA instruments are generally equipped with high precision balances that allow accurate
measurements of the sample weight during heating. A purge gas with an optimised flow is
also required to establish a stable environment around the sample and the furnace.
In this work, experiments were carried out using a Hi-Res TGA 2950 TA Instruments (US)
equipment. Nitrogen gas was used at a flow rate 60 mL/min and 40 mL/min through the
furnace and TGA head, respectively. A more modern equipment Q5000 series also from
TA Instruments equipped with an autosampler device was also used in some of the
experiments. In this case, the furnace was also blanketed with dry nitrogen but with a flow
rate of 10 mL/min and 25 mL/min to the balance and furnace/sample areas, respectively.
Chapter II
108
2.3.4 Dynamic Vapour Sorption
Dynamic vapour sorption (DVS) analysis is a technique in which a sample is subjected to
varying conditions of humidity and temperature, and the response of the sample is
measured gravimetrically.
Measurements of the equilibrium water content of a solid as a function of RH (constant or
variable) at a certain temperature are commonly used to assess the hygroscopicity of
pharmaceutical solids. More specifically, DVS experiments are also helpful in
differentiating different types of hydrates. Therefore, compounds that have the tendency to
form stoichiometric hydrates show stepwise jumps in their weight whereas
non-stoichiometric hydrates present a gradual increase in weight as the water is
continuously incorporated into the structure, as it is presented in Chapter 3. Apart from
this, the DVS technique has also been used to study and quantify amorphous systems
(Buckton and Darcy, 1995; Mackin et al., 2002). Overall, from a pharmaceutical
perspective, a thorough understanding of the effects of water (bonded or adsorbed onto the
surface) on the structure of APIs and excipients is essential for its formulation and
development.
DVS instruments operate in a closed system at a controlled temperature and either ambient
or controlled pressure. The sample is placed on a sensitive microbalance inside the
humidity chamber and exposed to a continuous flow of air or nitrogen.
In this work, DVS experiments were performed on a Sorption Analyzer Q5000, TA
Instruments (US). All samples were tested using quartz pans and at a constant nitrogen
flow of 10 mL/min. The instrument was calibrated according to the deliquescence point of
sodium bromide (57.6% RH).
2.3.5 Attenuated Total Reflection–Fourier Transform Infrared
Fourier transform infrared (FTIR) is a spectroscopic non–destructive, non–invasive
technique that provides information about the molecular composition, structure and

Chapter II
109
interactions within a sample based on its chemical bonds. Infrared (IR) spectroscopy is
used for identification, characterisation, quantification, structure elucidation, reaction
monitoring, quality control and quality assurance.
With IR spectroscopy, the sample is irradiated with a polychromatic light in the IR region
(4000 to 400 cm-1
) and a photon of light is absorbed when the frequency (energy) of the
absorbed light matches the energy required for a particular bond to vibrate within the
sample. In order for a vibration to be IR active, the molecular dipole moment must change
during the vibration. Any IR light that has not been absorbed is transmitted to the sample
to a detector. The fraction of transmitted light allows the absorbed frequencies to be
determined.
The difficulties associated with the analysis of solid samples in the conventional IR
spectroscopy that involved the preparation of KBr disks was overcome by the use of
attenuated total reflection (ATR) mechanism applied to the FTIR. ATR is based on the
principle of the reflection of radiation when it passes from a denser to a less dense
medium. During this process the beam acts as if it has penetrated a small distance into the
less dense medium. Samples are generally placed on opposite sides of a transparent
crystalline material of high refractive index, generally diamond. The penetration depth into
the sample is usually just a few microns (0.5-5 μm) thus a good contact between the
sample and the crystal surface must be ensured (O'Neil and Edwards, 2011).
The FTIR studies presented throughout this thesis were carried out using a Bruker Optics
IFS 66/S (UK) spectrometer with an ATR accessory fitted to a heating system (SPECAC,
UK). Spectra were collected from 4000 to 550 cm-1
with a total of 64 scans at a resolution
of 2 cm-1
, unless otherwise stated.
2.3.6 X-Ray Powder Diffraction
X-ray powder diffraction (XRPD) is a gold standard technique in the characterisation of
pharmaceutical materials in the solid state. It is mainly used for fingerprinting and
quantification analysis due to its high sensitivity to small chemical changes.

Chapter II
110
Basically, X-rays are generated by heating a filament (the cathode) which works as a
source of electrons. These electrons are then accelerated and strike a target (the anode) that
is usually Cu, Mo, Cr or Ag and produces a characteristic X-ray spectrum (Gilmore, 2011).
When X-rays pass through the sample they interact with the electron cloud of atoms in the
molecules and the intensity and position of the emergent X-rays are recorded by a detector.
Additional equipment can be fitted to the conventional XRPD in order to proportionate
analyses under the effect of temperature or humidity. This is of great importance when
studying polymorphic and pseudopolymorphic transitions.
Variable humidity XRPD (VH-XRPD) is commonly used to investigate the structure of
variable hydrates. The amount of water present in a variable hydrate is typically a function
of the RH environment of the sample. Since the XRPD peak positions are directly related
to the dimensions of the unit cell, subtle changes in the size of the unit cell due to the
presence of water may be evaluated by comparison of XRPD patterns collected for the
species under different RH environments.
Variable temperature XRPD (VT-XRPD) on the other hand permits the direct
identification of a crystalline phase as a function of temperature, especially important in
the study of thermal stability of pharmaceutical hydrates.
In this thesis, general XRPD analysis of solid dispersion systems and polymers were
performed using a Thermo ARL Xtra (Thermo Scientific, UK) model equipped with a
copper X-ray Tube (1.540563 Å). The samples were exposed to an X-ray beam with a
voltage of 45 kV and a current of 40 mA. All XRPD experiments were performed at 2θ
and step scan of 0.01o. The scanning range was based on the characteristics peaks of each
sample.
The changes in the crystal structure of paroxetine HCl Form II as a function of humidity
(Chapter 3) were evaluated using a XRPD, Philips XPERT Pro (Netherlands) equipped
with a relative humidity generator (RH-200, L&C, Germany) and a temperature control
unit (TUC 50, Anton Paar, Austria). Patterns were collected from scans in the range of 2θ
from 5.0o to 50.0
o with a step size of 0.0010°, at different RHs.
The dehydration study of paroxetine HCl Form I (Chapter 4) was studied in situ using a
VT-XRPD Bruker D8 Advance (Bruker, UK) fitted with a TTK450 (Anton Paar, Austria)
chamber. The temperature was controlled by a Temperature Control Unit TCU 100
Chapter II
111
(Anton Paar, Austria) and the applied heating rate was set by default to 0.167 K/s. Spectra
were collected from 4.0° to 30.0° at 2θ under nitrogen purge with a flow rate of
approximately 50 mL/min.
2.3.7 Scanning Electron Microscopy
Scanning electron microscopy (SEM) enables specimens to be examined at much higher
magnification and resolution than it is possible using a light microscope. In SEM, a beam
of electrons is produced at the top of the microscope by an electron gun. The electron beam
follows a vertical path through the microscope, which is held within a vacuum. The beam
travels through electromagnetic fields and lenses, which focus the beam down toward the
sample. Once the beam hits the sample, electrons are ejected from the sample. Detectors
collect these backscattered electrons and secondary electrons and convert them into a
signal that is sent to a screen similar to a television screen. This produces the final image.
SEM photographs were taken using a JSM 4900LV SEM (JOEL, Japan) mounted with a
tungsten filament with an acceleration voltage of 5-20 kV. To improve conductivity prior
to examination, samples were coated with gold using a Polaron SC7640 sputter gold coater
(Quorum Technologies, UK).
2.3.8 Karl Fischer Titration
Karl Fischer titration (KFT) is a classic titration method that determines the water content
in a sample.
KFT is based on a quantitative reaction of water with iodine (I2) and sulfur dioxide (SO2)
in the presence of a lower alcohol (ROH) such as methanol and an organic base (RN) such
as pyridine, as shown in the following reactions:
Chapter II
112
There are two types of Karl Fischer titrators: volumetric and coulometric. The main
difference between the two is that with the volumetric method, the titrant is added directly
to the sample by a burette. Conversely, with the coulometric method, the titrant is
generated electrochemically in the titration cell.
When performing KFT several aspects must be taken into consideration to prevent
misleading results. First of all, the choice of the reagents is of great importance especially
when dealing with aldehydes and ketones. These compounds can react with the standard
methanol reagents and form water. Therefore, methanol-free reagents must be used in these
particular cases. Another aspect is regarding the time and the speed of stirring the sample
inside the titration vessel. Too low a stirring speed can lead to irregular titration and over
titration may occur whereas a speed too high can generate bubbles in the solution and
falsify the measured values. Moreover, the influence of atmospheric moisture in the
titration process must also be accounted. Moisture can enter not only the titration vessel
but also the titrant bottle leading to a decrease in the titrant concentration.
KFT was performed using a DL38 (Mettler Toledo, UK) volumetric titrator with
Hydranal® solvent and Titrant
® 5. The titrant concentration was determined daily by using
di-sodium tartrate dihydrate, which has a water content of 15.66%.
2.3.9 Dissolution Studies
Dissolution testing of pharmaceutical solids is one of the most important tests in drug
product development and manufacturing as well as in regulatory assessment of the drug
product quality. It provides information on the rate and extent of drug absorption and at the
same time assesses the effect of drug substance properties and formulation principles on
the release profile of the drug substance (Lee et al., 2008).

Chapter II
113
The dissolution process of solids consists of two main steps. At first, the molecules at the
solid-liquid interface are wetted and solvated and detached from the solid surface.
Secondly, the solvated molecules diffuse away from the interface to the bulk solution. It is
described that it is the diffusion rate of the molecules in the media and/or the wetting and
solvation of the surface molecules that defines the dissolution profile of a certain
compound (Hörter and Dressman, 2001).
The dissolution rate (δM/δt) of a solid in a liquid can be described by the well-known
Noyes-Whitney equation as presented below.
Equation 2.4
where M is the mass, t is the time, A is the surface are of the undissolved solid in contact
with the solvent, D is the diffusion coefficient (m2/s), h is the thickness of diffusion layer,
Cs is the solubility, Cb is the concentration in the bulk solution and Cs-Cb is the
concentration gradient. The above Equation 2.4 assumes that the surface area and thickness
of the hydrodynamic diffusion layer remain constant.
Dissolution experiments were carried out using a BP Apparatus I, Copley CIS 8000
dissolution bath (Copley Scientific, UK) paddle method. Each vessel was filled with
900 mL of dissolution medium, the temperature was set at 37.0 oC and a rotation speed of
50 rpm was used. The concentration of each API through the dissolution tests was assessed
spectrophotometrically at the respective wavelength of maximum absorbance, λmax, using a
Perkin-Elmer Lambda XLS (Perkin Elmer, US) spectrophotometer. Calibration curves
were constructed for each API in the respective dissolution media.
3 IDENTIFICATION AND CHARACTERISATION OF
STOICHIOMETRIC AND NON-STOICHIOMETRIC HYDRATE
FORMS OF PAROXETINE HCL: REVERSIBLE CHANGES IN
CRYSTAL DIMENSIONS AS A FUNCTION
OF WATER ABSORPTION

Chapter III
115
Abstract
Paroxetine hydrochloride (HCl) is an anti-depressant drug, reported to exist in the
anhydrous form (Form II) and as a stable hemihydrate (Form I). In this study, the hydration
behaviour of paroxetine HCl Form II was investigated with a view to understanding both
the nature of the interaction with water and the interchange between the Forms II and I as a
function of both temperature and water content. In particular, new evidence is presented
for both the structure and the interconversion process to be more complex than previously
recognised.
A combination of characterisation techniques was used, including thermal (differential
scanning calorimetry (DSC) and thermogravimetric analysis (TGA)), spectroscopic
(attenuated total reflectance-Fourier transform infrared (ATR-FTIR)), dynamic vapour
sorption (DVS) and X-ray powder diffraction (XRPD) with variable humidity, along with
computational molecular modeling of the crystal structures.
The total amount of water present in Form II was surprisingly high (3.8% w/w, 0.8 mol of
water/mol of drug), with conversion to the hemihydrate noted on heating in hermetically
sealed DSC pans. XRPD, supported by ATR-FTIR and DVS, indicated changes in the unit
cell dimensions as a function of water content, with clear evidence for reversible expansion
and contraction as a function of relative humidity (RH). This data suggested that
paroxetine HCl Form II is not an anhydrate but rather a non-stoichiometric hydrate.
However, no continuous channels are present and, according to molecular modeling
simulation, the water is moderately bonded to the crystal, which is in itself an uncommon
feature when referring to non-stoichiometric hydrates. Overall, therefore, it is suggested
that the anhydrous form of paroxetine HCl is not only a non-stoichiometric hydrate, but
also one that shows highly unusual characteristics in terms of gradual unit cell expansion
and contraction despite the absence of continuous channels. These structural features in
turn influence the tendency of this drug to convert to the more stable hemihydrate. The
study has implications for the recognition and understanding of the behaviour of
pharmaceutical non-stoichiometric hydrates.

Chapter III
116
3.1 Introduction
Polymorphism and pseudopolymorphism are well studied phenomena within the
pharmaceutical arena, with the most widely studied manifestation of the latter being
hydrate formation. Indeed, the possible interaction with water during certain processing
steps (freeze drying, spray drying or wet granulation) as well as contact with atmospheric
humidity upon storage renders hydrate formation extremely common (Koradia et al., 2011;
Giron et al., 2002). Typically, such materials are considered to be stoichiometric, with a
precise and defined molecular ratio between the water and host in the crystal lattice,
although undefined incorporation is also possible, these being known as non-stoichiometric
or variable hydrates (Griesser, 2006; Khankari and Grant, 1995). For stoichiometric
hydrates, the water may play a crucial role in the stabilisation of the molecular network and
therefore dehydration may result in a disordered or amorphous state (Kobayashi et al.,
2009; Vogt et al., 2006; Guguta et al., 2006). In contrast, non-stoichiometric hydrates may
reversibly gain or lose water while retaining the same crystalline structure (isomorphic
dehydrates), with the water molecules entering and leaving the crystal lattice in a manner
determined by the environmental relative humidity (RH) (Stephenson et al., 1998). This
therefore presents issues for the formulator in that differentiation from simple surface
adsorption may be challenging, with the well-known indicators of hydrate formation (e.g.
powder X-ray diffraction and thermogravimetric analysis) not yielding the same
unequivocal identification of lattice alteration as is usual for stoichiometric hydrates. On
this basis the possible existence of non-stoichiometric hydrates is not fully appreciated
within the pharmaceutical field, with an accompanying lack of the development of
characterisation tools for their identification and structural elucidation.
Hydrates can also be classified based on their crystal structures (Vippagunta et al., 2001).
In Class I, or isolated site hydrates, water has a well-defined isolated location and therefore
hydrates of this class are often stoichiometric. In Class II, channel or planar hydrates, water
is packed inside the crystalline structure so as to form continuous channels or planes. Class
III refers to ion coordinated hydrates, in which water molecules are coordinated to metal
ions. Class II hydrates are, in general, non-stoichiometric, while Class III hydrates can be
either stoichiometric or non-stoichiometric.

Chapter III
117
Differentiation between hydrate formation and non-specific hygroscopicity may be
challenging. Water can interact with crystalline materials in several ways (adsorption,
absorption, deliquescence and hydrate formation), all of which may have a large impact on
the solid state properties, processing and handling of drugs (Ahlneck and Zografi, 1990).
This difficulty is exemplified by the study of Reutzel (Reutzel, 1998) on the muscarinic
agonist, LY297802 tartrate. The considerable hygroscopicity for this material was found to
be, in fact, due to non-stoichiometric hydrate formation whereby, rather than simple
surface sorption, water migrates between hydrogen-bonding sites located in crystal lattice
channels.
In this work, the hydration behaviour of paroxetine HCl was investigated. Paroxetine HCl
is a potent and selective inhibitor of the neuronal re-uptake of serotonin
(5-hydroxytryptamine, 5-HT) and is currently clinically approved for the treatment of
depression, social phobia, obsessive-compulsive, post-traumatic stress and general anxiety
(Bourin et al., 2001). This molecule is of particular interest due to the confusion associated
with its physical forms with three nomenclature systems being used to describe them.
Initially, Barnes et al. (Barnes et al., 1988) described in their patent the preparation of
paroxetine HCl hemihydrate and, in Example 8 of the same document, the preparation of
paroxetine HCl anhydrate. Less than one year later, Buxton et al. (Buxton et al., 1988)
further investigated the above forms and named the hemihydrate as Form I and the
anhydrate as Form II. Form I is described as a non-hygroscopic hemihydrate with a
melting point (m.p.) of 143 °C, which represents the most stable form and is currently
included in commercially available pharmaceutical formulations, while Form II is
described as a hygroscopic anhydrate with a m.p. of 118 °C and a moisture content
controlled by environmental humidity. More recently, Ward and Jacewicz (Ward and
Jacewicz, 2000) described the preparation of three new anhydrate forms of paroxetine HCl,
named as A, B and C. They suggest that paroxetine HCl Form A (m.p. 123-125 °C) can be
distinguished from the anhydrate Form II by the crystal shape, as reported by Buxton et al.
(Buxton et al., 1988). However, the data available (infrared and thermal analysis) suggests
that in terms of internal structure these two forms (A and II) are probably, but not
definitely, equivalent. The reported characteristics of the other two forms, B (m.p. at
137 °C) and C (m.p. at 161 °C) do not comply with those of the form investigated here and
Chapter III
118
no such transitions were seen in the present study, hence these forms do not impinge on the
present study.
This therefore leads to an immediate issue of nomenclature, as three classifications are
currently in use (anhydrate/hemihydrate, I and II, A, B and C). In this work, the
nomenclature Form I (hemihydrate) and II (anhydrate) was chosen for the sake of
simplicity. However, as it will be demonstrated, the notion of Form II as being a true
anhydrate is challenged in this work, hence it is avoided the use of this term other than to
point out its nominal description so as to avoid confusion.
In this investigation a combination of thermal analysis, variable humidity powder XRD
with associated modeling, attenuated reflection FTIR and dynamic water sorption studies
was used to examine the interplay between the Form II and hydrated forms, with a view to
clarifying the physical structures and transformation processes associated with exposure of
Form II to water.
3.2 Materials and Methods
3.2.1 Materials
Paroxetine HCl Form II was purchased from Huahai Pharmaceuticals (China) and was
used as received as well as, pre-dried over phosphorus pentoxide (P2O5), Alfa Aesar (UK),
as stated. The correspondence to the nominally anhydrous form was confirmed using
thermal and spectroscopic analysis, as outlined below.
3.2.2 Methods
3.2.2.1 Thermal Analysis
Standard differential scanning calorimetry (DSC, Q1000 TA Instruments) was performed
at heating rates of 5, 10, 20 and 50 oC/min. Modulated temperature DSC (MTDSC, Q1000

Chapter III
119
DSC TA Instruments) analysis was performed using a heating rate of 2 oC/min, amplitude
± 0.318 oC and a period of 60 seconds. Scans were carried out within the temperature range
0 °C to160 °C except for the collection of the Form I prepared in situ DSC whereby the
runs were stopped at 125 oC. Pinhole, hermetically sealed and open pans (pinhole pans
without lid) were used as stated.
Thermogravimetric analysis (TGA, Hi-Res 2950 TA Instruments) was performed in open
aluminium pans with a heating rate of 10 oC/min, from 30
oC to 300
oC.
3.2.2.2 Karl Fischer Titration (KFT)
KFT (Mettler Toledo DL38) were carried out by accurately weighing between 40 to 41 mg
of bulk and pre-dried samples. The bulk sample was kept under ambient conditions and the
dried sample was stored at P2O5 for 7 days prior to testing. The reagents used were Titrant®
5 and Hydranal® solvent. Each determination was repeated five times (n = 5).
3.2.2.3 Attenuated Total Reflection-Fourier Transform Infrared (ATR-FTIR)
The infrared spectra of the samples were collected using a Bruker Optics IFS 66/S
spectrometer, with 64 scans being acquired for each sample from 4000 cm-1
to 550 cm-1
with a resolution of 2 cm-1
. Variable temperature ATR-FTIR experiments were carried out
by connecting a temperature controller to the diamond ATR top-plate. A constant heating
rate of 2 oC/min was employed.
3.2.2.4 Dynamic Vapour Sorption (DVS)
DVS (SA Q5000 TA Instruments) experiments were performed at a constant temperature
set at 30 oC. The sample previously stored over P2O5 for 7 days was equilibrated at 0% RH
for 2h inside the DVS chamber before starting the sorption/desorption experiments. The
starting relative humidity was 10% RH, which was firstly increased to 30% RH, and then
at 10% RH/step to 90% RH. Desorption was studied by reducing the relative humidity
from 90% to 25% RH, then to 15%, 5% and 1% RH. At each target RH, the isothermal

Chapter III
120
sorption procedure was performed for 40 minutes (min). Note that for RHs higher than
10%, no mass change was detected after 40 min in any of the steps.
3.2.2.5 X-Ray Power Diffraction (XRPD) and Variable Humidity XRPD (VH-XRPD)
Spectra of raw and prepared Form I in situ DSC were collected using XRPD (Thermo-
ARL Xtra, Thermo Scientific) from 5.0o to 40.0
o at 2θ.
VH-XRPD (Philips XPERT Pro) patterns were collected from scans in the range of 2θ
from 5.0o to 40.0
o with a step size of 0.0010°, at different RH using a relative humidity
generator (RH200). The temperature was controlled by using temperature control unit
(TUC 50, Anton Paar). The RH steps and equilibration time were the same as in the DVS
experiment. Unit cell parameters were determined by Pawley refinement of the collected
patterns using the program TOPAS-Academic (Coelho, 2007). A specimen displacement
parameter was included in the refinement to account for the macroscopic expansion or
displacement of the sample in response to environmental changes. The value of the
displacement parameter varied between 0.63 and 0.67 mm, which would, in itself, cause
very little change in the powder pattern (≈ 0.02o shift of peak positions around 2θ = 20
o).
3.2.2.6 Computational Modeling of Crystal Structures
Lattice energy minimisations were performed using the rational function optimisation
method implemented in the GULP package (Gale, 2005). The force field used comprised
of the Dreiding parameter set (Mayo et al., 1990) and AM1-BCC charges (Jakalian et al.,
2002). The initial (P21) symmetry of the crystal structure was maintained during the
minimisations. The starting configurations were generated from the experimental structure
by assuming either full or zero occupancy for the water molecule.
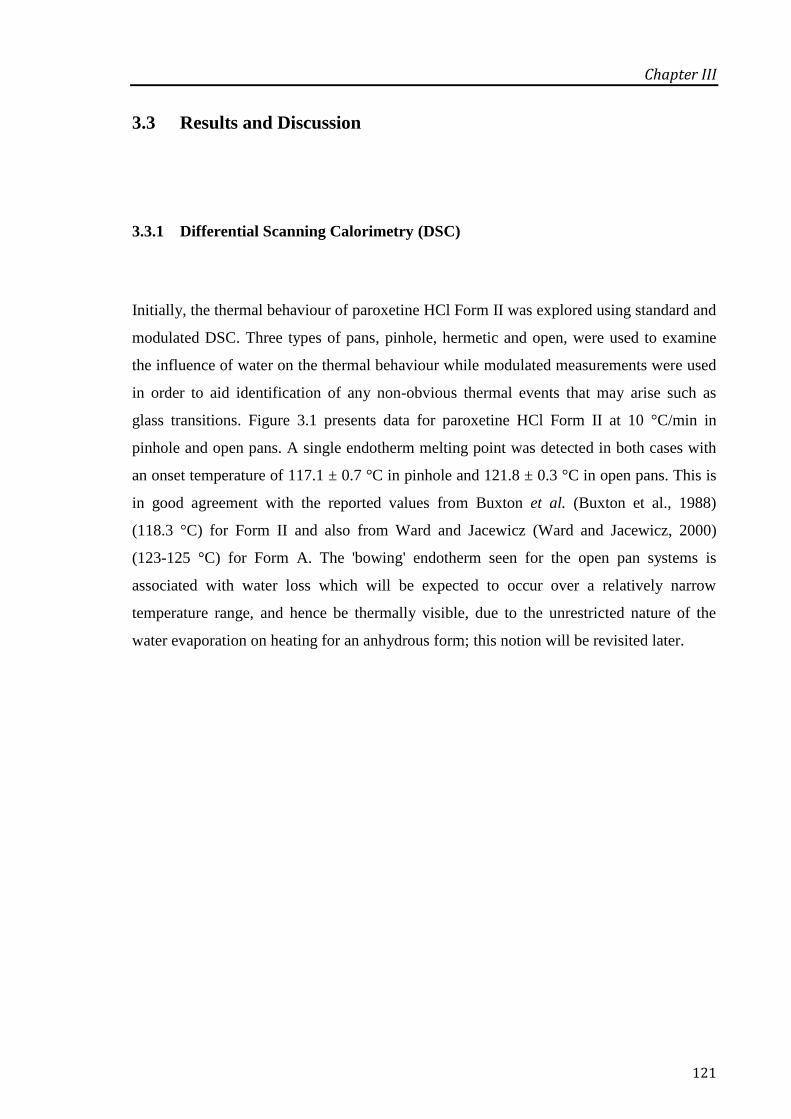
Chapter III
121
3.3 Results and Discussion
3.3.1 Differential Scanning Calorimetry (DSC)
Initially, the thermal behaviour of paroxetine HCl Form II was explored using standard and
modulated DSC. Three types of pans, pinhole, hermetic and open, were used to examine
the influence of water on the thermal behaviour while modulated measurements were used
in order to aid identification of any non-obvious thermal events that may arise such as
glass transitions. Figure 3.1 presents data for paroxetine HCl Form II at 10 °C/min in
pinhole and open pans. A single endotherm melting point was detected in both cases with
an onset temperature of 117.1 ± 0.7 °C in pinhole and 121.8 ± 0.3 °C in open pans. This is
in good agreement with the reported values from Buxton et al. (Buxton et al., 1988)
(118.3 °C) for Form II and also from Ward and Jacewicz (Ward and Jacewicz, 2000)
(123-125 °C) for Form A. The 'bowing' endotherm seen for the open pan systems is
associated with water loss which will be expected to occur over a relatively narrow
temperature range, and hence be thermally visible, due to the unrestricted nature of the
water evaporation on heating for an anhydrous form; this notion will be revisited later.

Chapter III
122
Figure 3.1: Standard DSC analysis (10 °C/min) of paroxetine HCl Form II
in pinhole pans and open pans.
It is apparent that the melting event of paroxetine HCl Form II is influenced by the
experimental conditions, with a difference of almost 5 °C in the onset melting temperature
seen using different pan types. This indicates the inherent difficulties in establishing the
‘correct’ value for the melting point of this form; again an explanation for this difference
will be shown later.
When using hermetically sealed pans, a distinct thermal profile was obtained (Figure 3.2).
The melting response was detected at 111.8 ± 0.6 oC, followed by an exotherm (possibly
associated with recrystallisation, Trec) at 118.1 ± 0.6 °C and finally an endotherm at
139.8 ± 0.5 °C corresponding to the reported melting of the Form I, as per previous studies
(Barnes et al., 1988). It is therefore reasonable to conclude that the Form II is forming the
hydrate form on heating, using the associated water to form the stoichiometric hydrate.
This is a highly unusual behaviour pattern and, up to this study, there are no previous
reports to this effect.
129.2°C
121.4°C54.2J/g
Open
123.8°C
118.0°C66.1J/g Pinhole
-1.5
-1.0
-0.5
0.0
0.5
He
at
Flo
w (
W/g
)
0 20 40 60 80 100 120 140 160
Temperature (°C)Exo Up Universal V4.5A TA Instruments
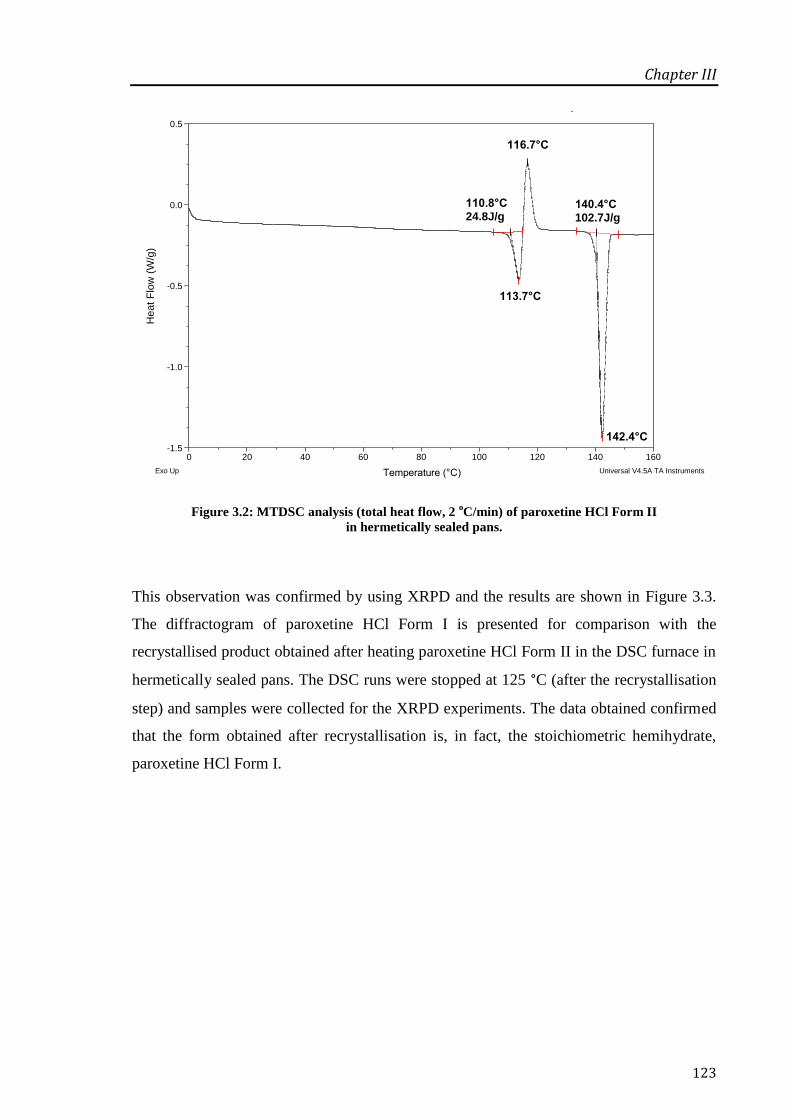
Chapter III
123
Figure 3.2: MTDSC analysis (total heat flow, 2 oC/min) of paroxetine HCl Form II
in hermetically sealed pans.
This observation was confirmed by using XRPD and the results are shown in Figure 3.3.
The diffractogram of paroxetine HCl Form I is presented for comparison with the
recrystallised product obtained after heating paroxetine HCl Form II in the DSC furnace in
hermetically sealed pans. The DSC runs were stopped at 125 °C (after the recrystallisation
step) and samples were collected for the XRPD experiments. The data obtained confirmed
that the form obtained after recrystallisation is, in fact, the stoichiometric hemihydrate,
paroxetine HCl Form I.
113.7°C
110.8°C24.8J/g
116.7°C
142.4°C
140.4°C102.7J/g
-1.5
-1.0
-0.5
0.0
0.5
Heat F
low
(W
/g)
0 20 40 60 80 100 120 140 160
Temperature (°C)
Size: 1.2400 mg DSCFile: E:...\Herm_pxt bul_60sec\bulk herm.004Operator: FatimaRun Date: 19-Nov-2010 08:13Instrument: DSC Q2000 V24.4 Build 116
Exo Up Universal V4.5A TA Instruments

Chapter III
124
Figure 3.3: XRPD data comparing the form obtained after the recrystallisation of paroxetine HCl
Form II when heated in hermetic sealed pans in the DSC furnace (top) and
paroxetine HCl Form I (bottom).
Furthermore, when using higher heating rates (HRs) the recrystallisation signal
disappeared and, at 50 oC/min, no melting of the Form I was detected (Figure 3.4).
The melting peak of Form II showed a broader appearance, as is usual when increasing
heating rate due to thermal lag effects. However it is also suggested that the
recrystallisation to Form I is kinetically hindered and hence does not take place at higher
heating rates. Moreover, samples run in hermetically sealed pans at 2 oC/min but pre-dried
over P2O5 also showed no evidence of transformation to the Form I (data not shown),
further supporting the hypothesis that the conversion involved sorbed water becoming
stoichiometrically bound on heating.
15 16 17 18 19 20 21 22 23 24 25 26 27 28 29 30
Inte
nsi
ty
2θ (degree)
Paroxetine HCl Form I
Paroxetine HCl Form II after
recrystallization in situ DSC

Chapter III
125
Figure 3.4: Influence of the heating rate on the transformation between Form II and Form I of
paroxetine HCl. Standard DSC runs at 5, 10, 20 and 50 oC/min (downwards) were performed in
hermetically sealed pans.
3.3.2 Thermogravimetric Analysis (TGA)
Given the role of sorbed water (using the term loosely) that has been identified above, it
was clearly essential to have some measurements of both the quantity and binding
characteristics of the water present. The TGA signal (Figure 3.5) showed a water weight
loss process completed by approximately 140 oC. A continuous weight loss was observed
from the starting temperature until approximately 90 oC and after that an evident sharper
drop in the weight was noticed, between 100 oC and 130
oC, which corresponds, in total, to
a weight loss of 4.45 ± 0.26%. The last and higher drop in the weight around 260 oC is due
to the decomposition of the sample. These processes are shown in the derivative signal for
clarity.
5°C/min
20°C/min
10°C/min
50°C/min
-20
-15
-10
-5
0
5
Heat F
low
(W
/g)
20
40
60
80
100
120
140
160
Temperature (°C)
Exo Up
Universal V4.5A TA Instruments

Chapter III
126
Figure 3.5: TGA curve of paroxetine HCl Form II, showing the weight loss and
associated derivative loss curve.
In general, when a stoichiometric hydrate is present, the water molecules are incorporated
in the crystal lattice and the water loss signal shows a sharp discontinuity, typically
between 80 and 140 oC. Alternatively, when the water molecules are simply present on the
crystal surfaces (adsorbed water), the water loss signal tends to be broader and appears
over a wider and lower temperature range, frequently between 60 to 90 oC (Craig and
Reading, 2007). The behaviour shown here appears to demonstrate a steady water loss,
typically associated with sorbed water, followed by a sharper loss corresponding to the
melting of Form II, indicating release of any remaining water on breakdown of the crystal
structure.
On the other hand, the TGA trace of Form I at the same heating rate (data not shown) did
not show a continuous weight loss, but rather a sharp drop in weight in a narrow
temperature range between 100 and 130 oC. This is in good agreement with the typical
dehydration behaviour of stoichiometric hydrates. The weight loss at this temperature
corresponds to 2.60 ± 0.15% (0.55 ± 0.02 mol of water per mol of drug), which matches
well the designation of Form I as a hemihydrate.
0.0
0.1
0.2
[ ] D
eriv. W
eig
ht (%
/°C
) –
– –
–
85
90
95
100
Weig
ht (%
)
30 50 70 90 110 130 150 170 190 210 230 250 270 290
Temperature (°C)
Sample: Paroxet HCL anhyd repeat 5Size: 6.5660 mg TGA
File: L:...\Paroxet HCL anhyd repeat 5Operator: FatimaRun Date: 24-May-2010 16:46Instrument: 2950 TGA HR V5.3C
Universal V4.5A TA Instruments

Chapter III
127
3.3.3 Karl Fischer Titration (KFT)
The water content of untreated and dried samples was determined by Karl Fischer titration
under ambient humidity (53% RH) and temperature (25.5 oC). The untreated sample was
found to have a water content of 3.83 ± 0.05% w/w, which corresponds to 0.80 ± 0.01 mol
of water per mol of paroxetine HCl. The water content of the sample previously dried over
P2O5 for 7 days was calculated as 1.65 ± 0.17% w/w, 0.33 ± 0.03 mol of water per mol of
paroxetine HCl.
These results are surprising in that they are high for such a relatively non-polar low
molecular weight material; indeed, the amount of water in the dry sample is quite high for
a material stored for 7 days at 0% RH. However, as the measurements were performed
under atmospheric conditions, the time between weighing and measurement may have
been sufficient for some moisture sorption. Even so, this implies quite considerable
hygroscopicity. This may be a result of high surface adsorption or, alternatively, molecular
internalisation of water, i.e. non-stoichiometric hydrate formation. On this basis a series of
spectroscopic and water sorption studies were performed in order to investigate the
possibility of such hydrate formation.
3.3.4 Attenuated Total Reflection-Fourier Transformer Infrared (ATR-FTIR)
Infrared spectroscopy is a potentially useful tool to distinguish between the two forms of
paroxetine HCl (Form II and Form I) by analysing the spectrum between 3700-3200 cm-1
corresponding to the OH stretching region. This area is also useful to monitor temperature-
dependent transitions between those forms. The spectrum of Form II, as shown in
Figure 3.6, has two main bands at 3633 cm-1
and 3395 cm-1
, which can be assigned to
stretching vibrations involving weakly and strongly H-bonded water H atoms, respectively.
If paroxetine HCl Form II was a true anhydrate, it should not show any OH vibration at
high wavenumbers, as no water would be present in the crystal lattice. In contrast, Form I

Chapter III
128
shows a double band at 3401 cm-1
and 3339 cm-1
, which correspond to two strong H-bonds
in different chemical environments.
Some misinterpretations can be easily made in this region due to the presence of a
secondary amine, as it was shown in Figure 2.2. The NH stretching in secondary amines
usually appears as a single band in the range between 3380-3205 cm-1
. However the HCl
salt formation can cause a considerable attenuation of the normal NH stretching band and
displace it towards lower frequencies (2760 and 2690 cm-1
) (Nakamoto et al., 1955;
Heacock and Marion, 1956). Owing to the complexity of the spectra in this region,
especially due to the overlapping of the aromatic ring vibrations, a clear and precise
assignment of the NH band is hard to make.
Figure 3.6: ATR-FTIR spectra of paroxetine HCl Form II (top) and Form I (bottom).
The assignment of the OH stretching bands presented in this section for paroxetine HCl
Forms I and II is consistent with their respective structural models and H-bonding.
Since these will be described in more detail in the molecular modeling section, only a brief
discussion, relevant to differences in the ATR-FTIR spectra, will be presented here.
The water molecules in Form II can establish two different types of hydrogen bonding: a
very weak one to an oxygen from the dioxole ring, which appears as a free OH band with a
sharp appearance at a high wavenumber (3633 cm-1
); and a strong one to a chloride ion,
G:\Fátima\RESEARCH 17082013\RESULTS\FTIR-ATR\FTIR- TV\03112010 bulk TV\pxt bulk 30C isothermal 5min.0 pxt bulk DLaTGS, KBr-BMS, Globar, IFS 66
G:\Fátima\RESEARCH 17082013\RESULTS\FTIR-ATR\FTIR- TV\Pxt hemihydrate TV\pxt hemyhydrate 30C isothermal 5min.0 pxt hemihydrate DLaTGS, KBr-BMS, Globar, IFS 66
03-11-2010
03-11-2010
3401.9123 3339.1169
3633.26383395.3023
1000150020002500300035004000
Wavenumber cm-1
0.1
0.2
0.3
0.4
0.5
0.6
0.7
0.8
Absorb
ance U
nits
Page 1/1
Ab
sorb
an
ce u
nit
s
Wavenumber (cm-1
)

Chapter III
129
which appears as a broad band at a lower wavenumber (3395 cm-1
), an indication of
stronger hydrogen bond formation (Tang et al., 2002). In Form I the water molecules can
establish three strong hydrogen bonds. In two of them the water molecules donate their
hydrogen atoms to chloride ions, giving the double band observed at 3401 and 3339 cm-1
.
The third hydrogen bond is formed with the protonated ammonium nitrogen as the donor
and water as the acceptor.
By using variable temperature ATR-FTIR spectroscopy with a constant heating rate of
2 oC/min, it was possible to observe the pseudopolymorphic transformation between the
Form II and the Form I (Figure 3.7). It should be noted that the sample holder is such that,
while the sample is not sealed hermetically, water movement is nevertheless partially
restricted rendering these results only partially comparable to the DSC data. Nevertheless,
the data set provides a useful corroborative perspective by which the transformation may
be further studied.
Figure 3.7: Variable temperature ATR-FTIR spectra of paroxetine HCl Form II, measured using a
constant heating rate of 2 oC/min.
G:\Fátima\RESEARCH 17082013\RESULTS\FTIR-ATR\FTIR- TV\03112010 bulk TV\pxt bulk 30C isothermal 5min.0 pxt bulk DLaTGS, KBr-BMS, Globar, IFS 66 G:\Fátima\RESEARCH 17082013\RESULTS\FTIR-ATR\FTIR- TV\03112010 bulk TV\pxt bulk 40C isothermal 5min.0 pxt bulk DLaTGS, KBr-BMS, Globar, IFS 66 G:\Fátima\RESEARCH 17082013\RESULTS\FTIR-ATR\FTIR- TV\03112010 bulk TV\pxt bulk 50C isothermal 5min.0 pxt bulk DLaTGS, KBr-BMS, Globar, IFS 66 G:\Fátima\RESEARCH 17082013\RESULTS\FTIR-ATR\FTIR- TV\03112010 bulk TV\pxt bulk 60C isothermal 5min.0 pxt bulk DLaTGS, KBr-BMS, Globar, IFS 66 G:\Fátima\RESEARCH 17082013\RESULTS\FTIR-ATR\FTIR- TV\03112010 bulk TV\pxt bulk 70C isothermal 5min.0 pxt bulk DLaTGS, KBr-BMS, Globar, IFS 66 G:\Fátima\RESEARCH 17082013\RESULTS\FTIR-ATR\FTIR- TV\03112010 bulk TV\pxt bulk 80C isothermal 5min.0 pxt bulk DLaTGS, KBr-BMS, Globar, IFS 66 G:\Fátima\RESEARCH 17082013\RESULTS\FTIR-ATR\FTIR- TV\03112010 bulk TV\pxt bulk 90C isothermal 5min.0 pxt bulk DLaTGS, KBr-BMS, Globar, IFS 66 G:\Fátima\RESEARCH 17082013\RESULTS\FTIR-ATR\FTIR- TV\03112010 bulk TV\pxt bulk 100C isothermal 5min.0 pxt bulk DLaTGS, KBr-BMS, Globar, IFS 66 G:\Fátima\RESEARCH 17082013\RESULTS\FTIR-ATR\FTIR- TV\03112010 bulk TV\pxt bulk 120C isothermal 5min.0 pxt bulk DLaTGS, KBr-BMS, Globar, IFS 66 G:\Fátima\RESEARCH 17082013\RESULTS\FTIR-ATR\FTIR- TV\03112010 bulk TV\pxt bulk 140C isothermal 5min.0 pxt bulk DLaTGS, KBr-BMS, Globar, IFS 66
03-11-201003-11-201003-11-201003-11-201003-11-201003-11-201003-11-201003-11-201003-11-201003-11-2010
15002000250030003500
Wavenumber cm-1
0.0
0.1
0.2
0.3
0.4
0.5
Absorb
ance U
nits
Page 1/1
30 oC
120 oC
60 oC
50 oC
40 oC
90 oC
80 oC
70 oC
130 oC
150 oC
Ab
sorb
an
ce u
nit
s
Wavenumber (cm-1
)

Chapter III
130
Initially, the spectra show the response associated with the Form II (from top to bottom).
However, when the temperature reached 50 oC, a small shoulder started to appear in the
region of the hydrogen-bonded OH (3339 cm-1
) and the intensity of the free OH stretching
band started to decrease. These observations, together with the initial description of those
bands, suggest that a new intermolecular hydrogen bond between the OH group from the
water molecules and the chloride ion starts to become established, which results in a split
of this band characteristic of the Form I. Changes in the spectrum can also be observed in
the region at 2500-3000 cm-1
.
Overall, not only does Figure 3.7 clearly show transformation between the Form II and the
Form I but also indicates that, at temperatures as low as 50 oC, the interaction between the
drug and water is specific and intrinsic to the crystalline lattice structure, rather than being
a simple surface adsorption process. While the highest temperatures clearly indicate Form I
formation, the intermediate temperatures indicate a mixture between Form II and the
Form I, which again is supportive of the suggestion of non-stoichiometric hydrate
formation.
3.3.5 Dynamic Vapour Sorption (DVS)
The hydration behaviour of paroxetine HCl Form II under defined humidity and
temperature conditions was investigated. Pre-treatment of the sample included drying over
P2O5 for 7 days, plus an additional drying step of 2 h at 30 oC and 0% RH inside the DVS
chamber to ensure that any residual water was dried off prior to starting, as confirmed by
the achievement of a constant weight. Figure 3.8 shows the DVS data for paroxetine HCl
Form II. During the sorption cycle a weight gain of 3.53% was observed from 10 to
90% RH, which corresponds to 0.73 mol of water per mol of drug, with 81% of the total
water uptake taking place between 10 and 30% RH. From 40 to 90% RH the change in
weight is significantly smaller.
The high absolute amounts of water gained, together with the reversibility of the uptake
and desorption, again supporting the existence of a non-stoichiometric hydrate. More
specifically, the reversibility of the sorption process and the relatively rapid time scales
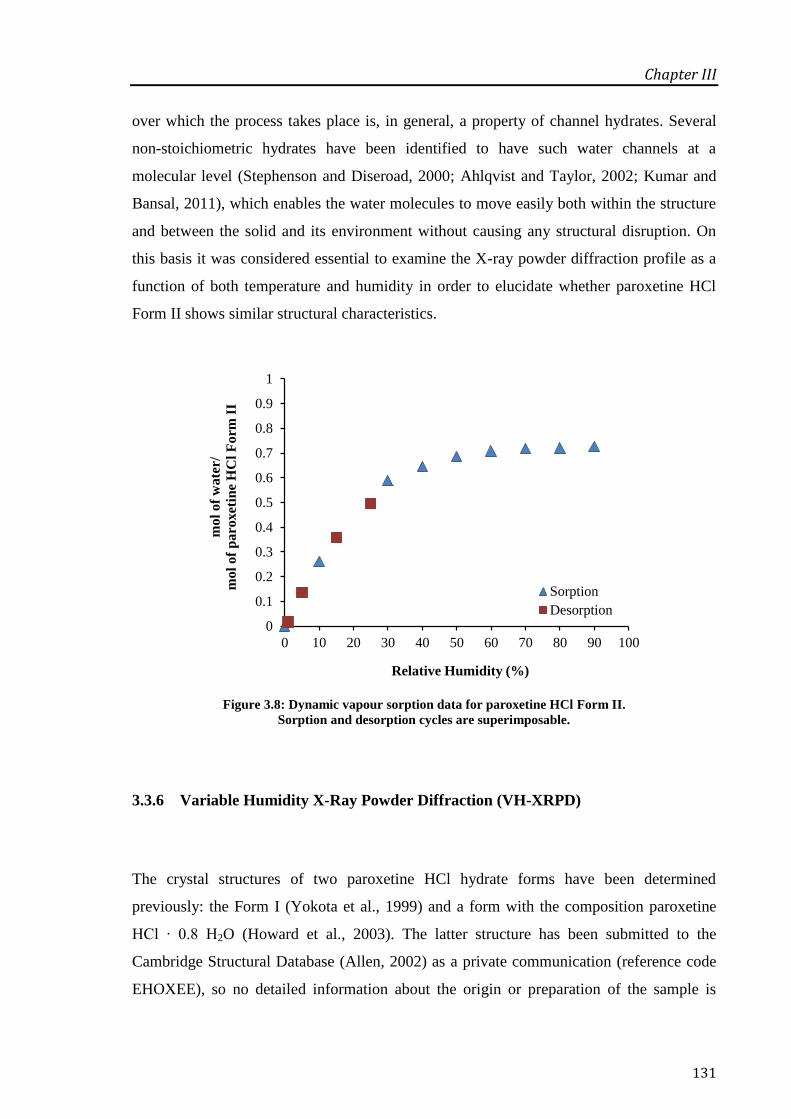
Chapter III
131
over which the process takes place is, in general, a property of channel hydrates. Several
non-stoichiometric hydrates have been identified to have such water channels at a
molecular level (Stephenson and Diseroad, 2000; Ahlqvist and Taylor, 2002; Kumar and
Bansal, 2011), which enables the water molecules to move easily both within the structure
and between the solid and its environment without causing any structural disruption. On
this basis it was considered essential to examine the X-ray powder diffraction profile as a
function of both temperature and humidity in order to elucidate whether paroxetine HCl
Form II shows similar structural characteristics.
Figure 3.8: Dynamic vapour sorption data for paroxetine HCl Form II.
Sorption and desorption cycles are superimposable.
3.3.6 Variable Humidity X-Ray Powder Diffraction (VH-XRPD)
The crystal structures of two paroxetine HCl hydrate forms have been determined
previously: the Form I (Yokota et al., 1999) and a form with the composition paroxetine
HCl ∙ 0.8 H2O (Howard et al., 2003). The latter structure has been submitted to the
Cambridge Structural Database (Allen, 2002) as a private communication (reference code
EHOXEE), so no detailed information about the origin or preparation of the sample is
0
0.1
0.2
0.3
0.4
0.5
0.6
0.7
0.8
0.9
1
0 10 20 30 40 50 60 70 80 90 100
mol
of
wate
r/
mol
of
paroxet
ine
HC
l F
orm
II
Relative Humidity (%)
Sorption
Desorption
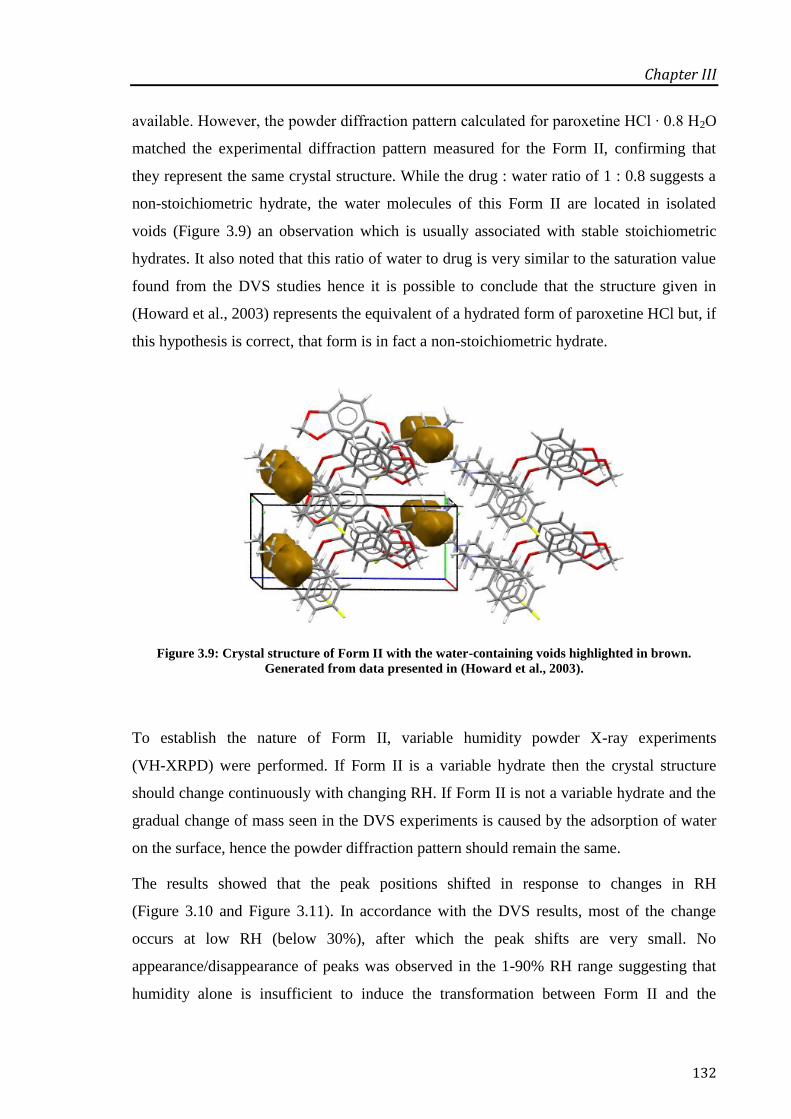
Chapter III
132
available. However, the powder diffraction pattern calculated for paroxetine HCl ∙ 0.8 H2O
matched the experimental diffraction pattern measured for the Form II, confirming that
they represent the same crystal structure. While the drug : water ratio of 1 : 0.8 suggests a
non-stoichiometric hydrate, the water molecules of this Form II are located in isolated
voids (Figure 3.9) an observation which is usually associated with stable stoichiometric
hydrates. It also noted that this ratio of water to drug is very similar to the saturation value
found from the DVS studies hence it is possible to conclude that the structure given in
(Howard et al., 2003) represents the equivalent of a hydrated form of paroxetine HCl but, if
this hypothesis is correct, that form is in fact a non-stoichiometric hydrate.
Figure 3.9: Crystal structure of Form II with the water-containing voids highlighted in brown.
Generated from data presented in (Howard et al., 2003).
To establish the nature of Form II, variable humidity powder X-ray experiments
(VH-XRPD) were performed. If Form II is a variable hydrate then the crystal structure
should change continuously with changing RH. If Form II is not a variable hydrate and the
gradual change of mass seen in the DVS experiments is caused by the adsorption of water
on the surface, hence the powder diffraction pattern should remain the same.
The results showed that the peak positions shifted in response to changes in RH
(Figure 3.10 and Figure 3.11). In accordance with the DVS results, most of the change
occurs at low RH (below 30%), after which the peak shifts are very small. No
appearance/disappearance of peaks was observed in the 1-90% RH range suggesting that
humidity alone is insufficient to induce the transformation between Form II and the

Chapter III
133
Form I; however changes in humidity are capable of causing changes in the lattice
spacings, indicating that the lattice is expanding to allow entry of the water.
Figure 3.10: Shifts in the diffractogram peaks upon increasing RH.
Only a part of the full XRPD diffractogram (5.0 to 40.0°) is shown to make the peak shifts visible.
Figure 3.11: XRPD patterns of paroxetine HCl Form II during desorption of water.
The peak shifts indicate changes in the dimensions of the unit cell, namely expansion upon
sorption and contraction during desorption (Figure 3.12). The cell volumes determined
0
1000
2000
3000
4000
5000
6000
7000
8000
9000
20 21 22 23 24 25
Inte
nsi
ty
2θ (degree)
10% RH
30% RH
40% RH
90% RH
0
1000
2000
3000
4000
5000
6000
7000
8000
9000
20 21 22 23 24 25
Inte
nsi
ty
2θ (degree)
90% RH
15% RH
1% RH
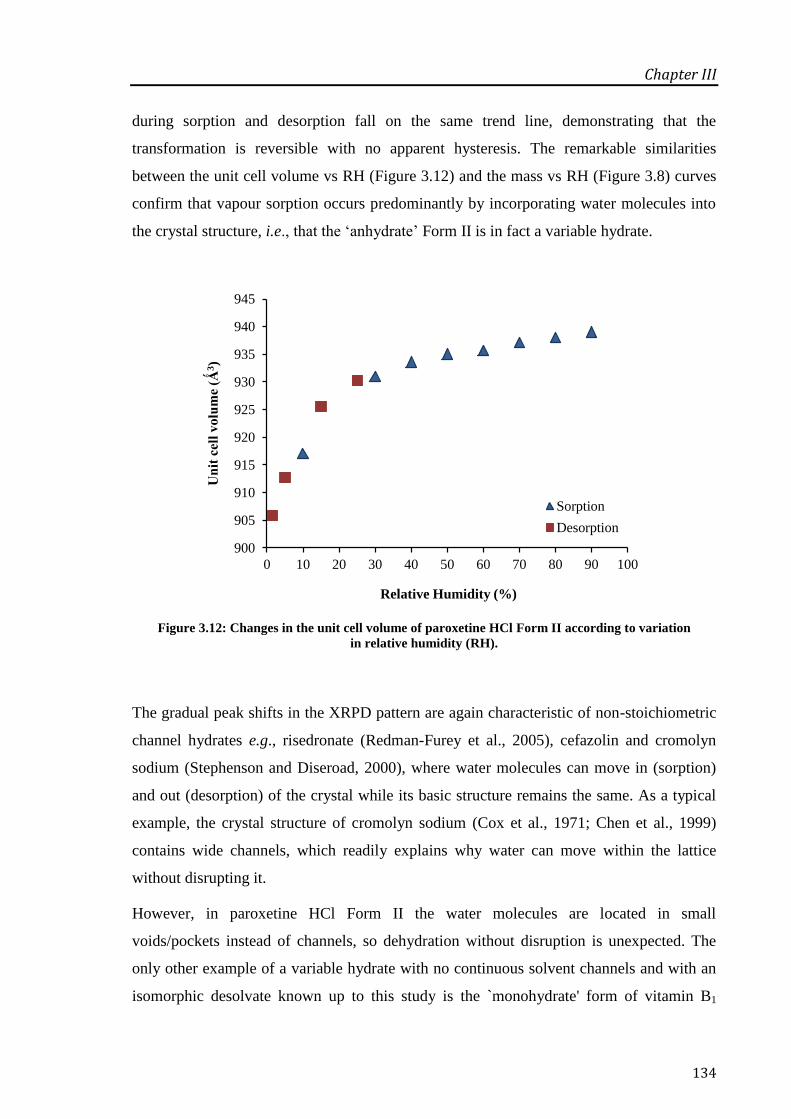
Chapter III
134
during sorption and desorption fall on the same trend line, demonstrating that the
transformation is reversible with no apparent hysteresis. The remarkable similarities
between the unit cell volume vs RH (Figure 3.12) and the mass vs RH (Figure 3.8) curves
confirm that vapour sorption occurs predominantly by incorporating water molecules into
the crystal structure, i.e., that the ‘anhydrate’ Form II is in fact a variable hydrate.
Figure 3.12: Changes in the unit cell volume of paroxetine HCl Form II according to variation
in relative humidity (RH).
The gradual peak shifts in the XRPD pattern are again characteristic of non-stoichiometric
channel hydrates e.g., risedronate (Redman-Furey et al., 2005), cefazolin and cromolyn
sodium (Stephenson and Diseroad, 2000), where water molecules can move in (sorption)
and out (desorption) of the crystal while its basic structure remains the same. As a typical
example, the crystal structure of cromolyn sodium (Cox et al., 1971; Chen et al., 1999)
contains wide channels, which readily explains why water can move within the lattice
without disrupting it.
However, in paroxetine HCl Form II the water molecules are located in small
voids/pockets instead of channels, so dehydration without disruption is unexpected. The
only other example of a variable hydrate with no continuous solvent channels and with an
isomorphic desolvate known up to this study is the `monohydrate' form of vitamin B1
900
905
910
915
920
925
930
935
940
945
0 10 20 30 40 50 60 70 80 90 100
Un
it c
ell
vo
lum
e (Ǻ
3)
Relative Humidity (%)
Sorption
Desorption
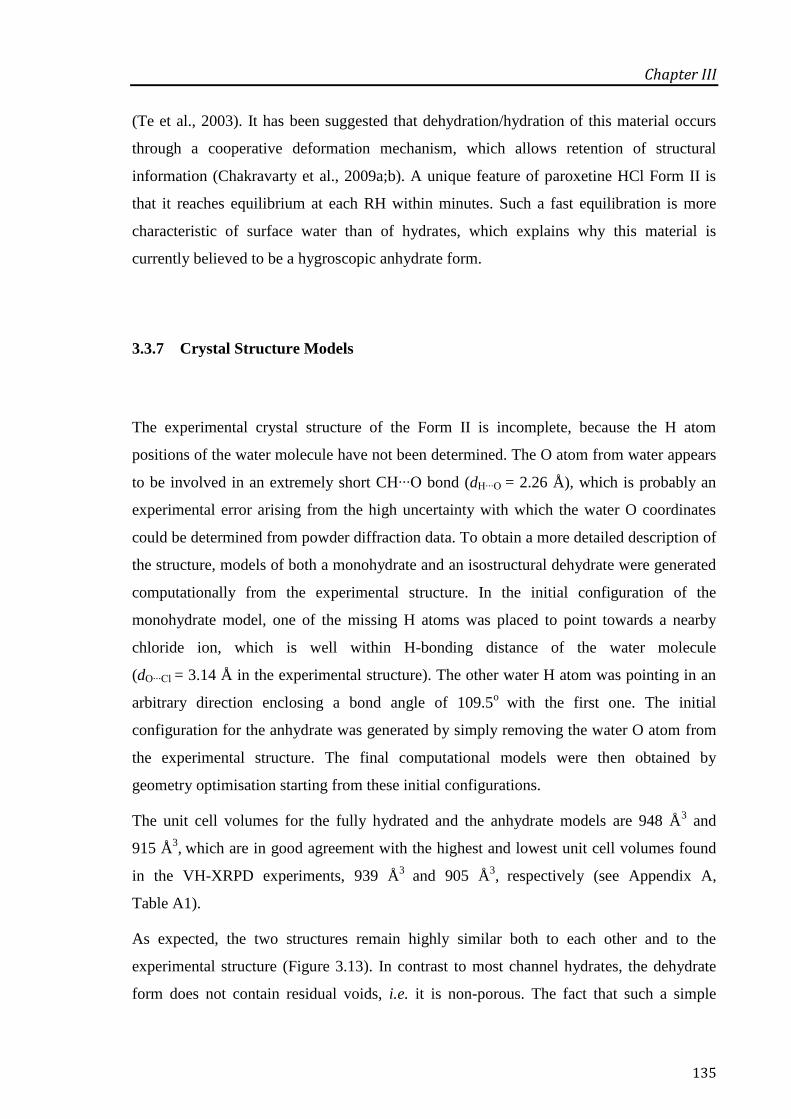
Chapter III
135
(Te et al., 2003). It has been suggested that dehydration/hydration of this material occurs
through a cooperative deformation mechanism, which allows retention of structural
information (Chakravarty et al., 2009a;b). A unique feature of paroxetine HCl Form II is
that it reaches equilibrium at each RH within minutes. Such a fast equilibration is more
characteristic of surface water than of hydrates, which explains why this material is
currently believed to be a hygroscopic anhydrate form.
3.3.7 Crystal Structure Models
The experimental crystal structure of the Form II is incomplete, because the H atom
positions of the water molecule have not been determined. The O atom from water appears
to be involved in an extremely short CH∙∙∙O bond (dH∙∙∙O = 2.26 Å), which is probably an
experimental error arising from the high uncertainty with which the water O coordinates
could be determined from powder diffraction data. To obtain a more detailed description of
the structure, models of both a monohydrate and an isostructural dehydrate were generated
computationally from the experimental structure. In the initial configuration of the
monohydrate model, one of the missing H atoms was placed to point towards a nearby
chloride ion, which is well within H-bonding distance of the water molecule
(dO∙∙∙Cl = 3.14 Å in the experimental structure). The other water H atom was pointing in an
arbitrary direction enclosing a bond angle of 109.5o
with the first one. The initial
configuration for the anhydrate was generated by simply removing the water O atom from
the experimental structure. The final computational models were then obtained by
geometry optimisation starting from these initial configurations.
The unit cell volumes for the fully hydrated and the anhydrate models are 948 Å3 and
915 Å3, which are in good agreement with the highest and lowest unit cell volumes found
in the VH-XRPD experiments, 939 Å3
and 905 Å3, respectively (see Appendix A,
Table A1).
As expected, the two structures remain highly similar both to each other and to the
experimental structure (Figure 3.13). In contrast to most channel hydrates, the dehydrate
form does not contain residual voids, i.e. it is non-porous. The fact that such a simple
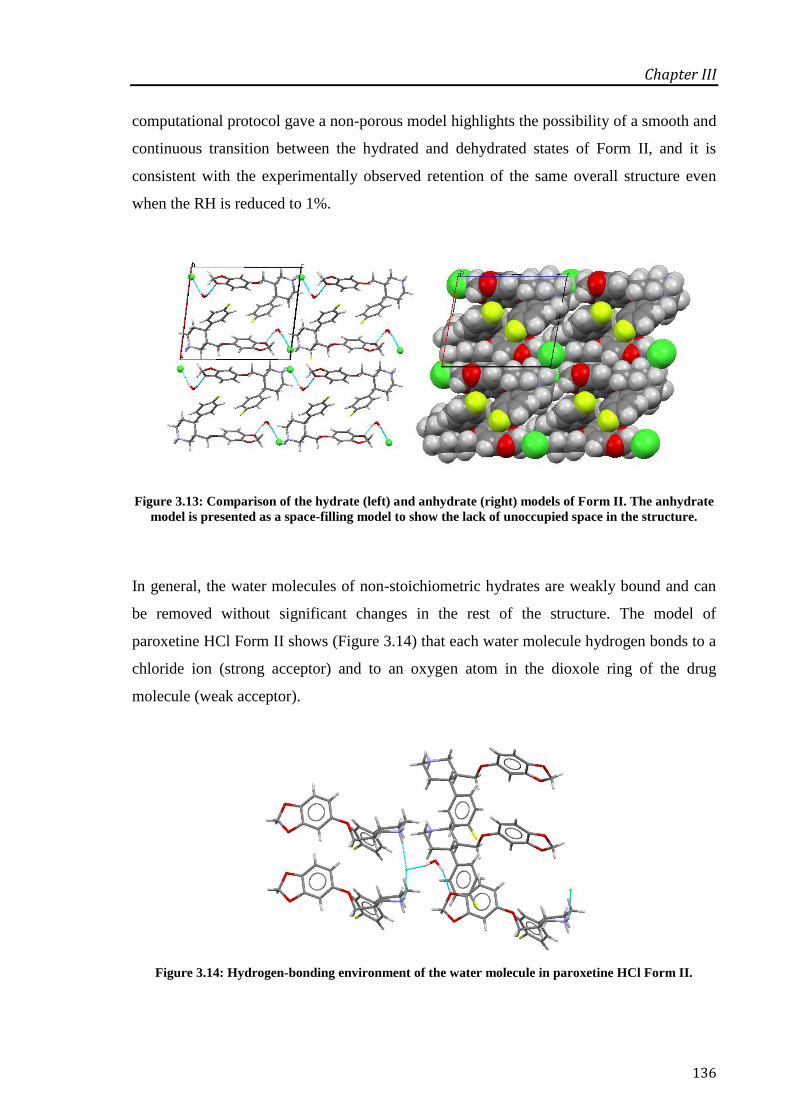
Chapter III
136
computational protocol gave a non-porous model highlights the possibility of a smooth and
continuous transition between the hydrated and dehydrated states of Form II, and it is
consistent with the experimentally observed retention of the same overall structure even
when the RH is reduced to 1%.
Figure 3.13: Comparison of the hydrate (left) and anhydrate (right) models of Form II. The anhydrate
model is presented as a space-filling model to show the lack of unoccupied space in the structure.
In general, the water molecules of non-stoichiometric hydrates are weakly bound and can
be removed without significant changes in the rest of the structure. The model of
paroxetine HCl Form II shows (Figure 3.14) that each water molecule hydrogen bonds to a
chloride ion (strong acceptor) and to an oxygen atom in the dioxole ring of the drug
molecule (weak acceptor).
Figure 3.14: Hydrogen-bonding environment of the water molecule in paroxetine HCl Form II.
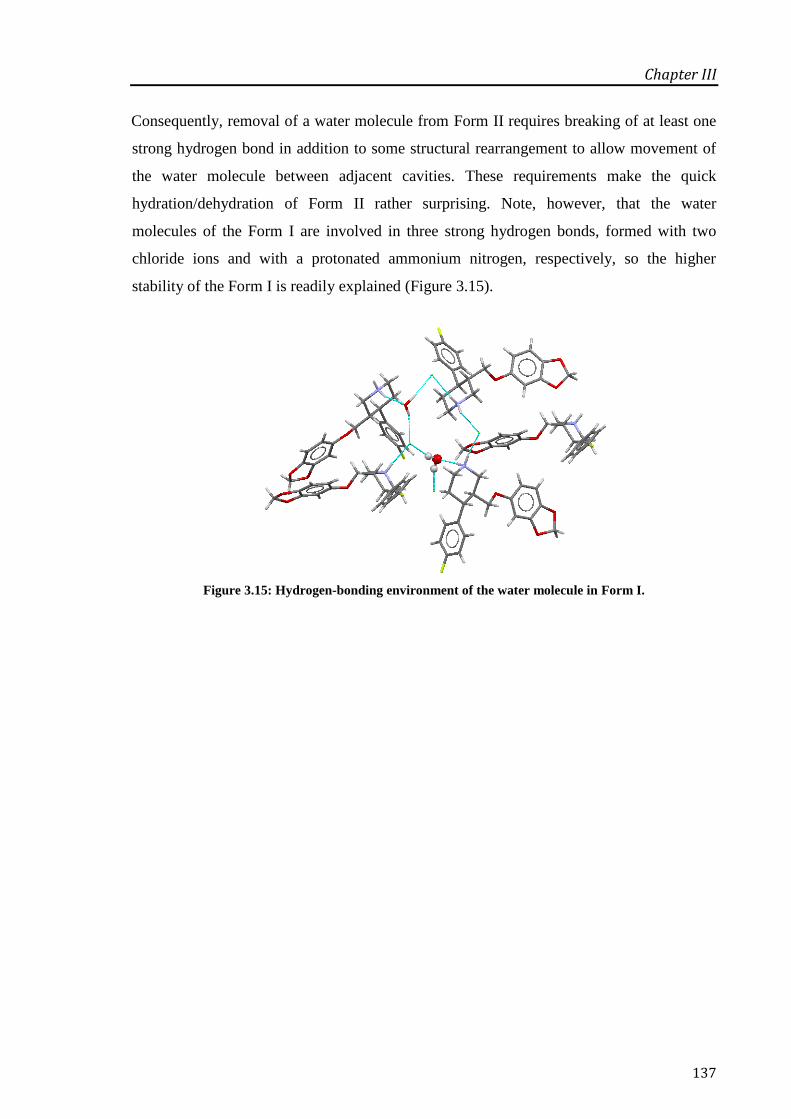
Chapter III
137
Consequently, removal of a water molecule from Form II requires breaking of at least one
strong hydrogen bond in addition to some structural rearrangement to allow movement of
the water molecule between adjacent cavities. These requirements make the quick
hydration/dehydration of Form II rather surprising. Note, however, that the water
molecules of the Form I are involved in three strong hydrogen bonds, formed with two
chloride ions and with a protonated ammonium nitrogen, respectively, so the higher
stability of the Form I is readily explained (Figure 3.15).
Figure 3.15: Hydrogen-bonding environment of the water molecule in Form I.

Chapter III
138
3.4 Conclusions
The distinction between strong hygroscopic behaviour and hydrate formation is sometimes
very opaque and can lead to misinterpretations. In this study, it was shown that the
hygroscopic nature of paroxetine HCl has led to incorrect classification of this material as
an anhydrate. The evidence for this is as follows. First, the large amount of water content
determined by using TGA, KF titration and DVS raise doubts regarding the anhydrate
classification of this drug. In general, the water adsorbed on the surface of an API is
around 1%, but paroxetine HCl Form II has a water uptake more than three times higher
than this. The rapid and extensive water uptake into the structure at low RH (≈ 30%) in
itself indicates that paroxetine HCl Form II is likely to be a non-stoichiometric hydrate.
This is also supported by the thermal analysis (DSC) data that indicated that the sorbed
water associated with this form, on heating slowly under hermetic conditions, become
incorporated into the crystal structure of the drug to form the Form I. This is in itself very
unusual behaviour, but is consistent with the notion of the water being incorporated into
the structure rather than simply sorbed onto the surface.
Secondly, to support the non-stoichiometric hydrate hypothesis, variable humidity XRPD
studies were performed. It was observed that on increasing the RH, shifts in the peak
positions of the XRPD diffractogram were evident until 30% RH, which is in accordance
with the observations in DVS. During desorption, the shifts in the peaks followed the
decrease in the RH. In both cases there were no changes to the crystalline pattern, showing
that the water sorption process led to changes in lattice spacing but no fundamental change
to the lattice arrangement.
In most recorded cases, this water sorption behaviour is characteristic of a specific
subgroup of non-stoichiometric hydrates, the channel hydrates, where the existence of
connecting pathways allows the smooth departure of the water without any structural
deformation. However, the analysis of the structure of Form II indicates that the water in
not located in channels but in small voids and also is not weakly bonded to the crystalline
structure, as expected, which makes the hydration/dehydration of this material an
uncommon feature. The location of the water within the structure together with the energy
supply, explains the pseudopolymorphic transformation observed either in the MTDSC,
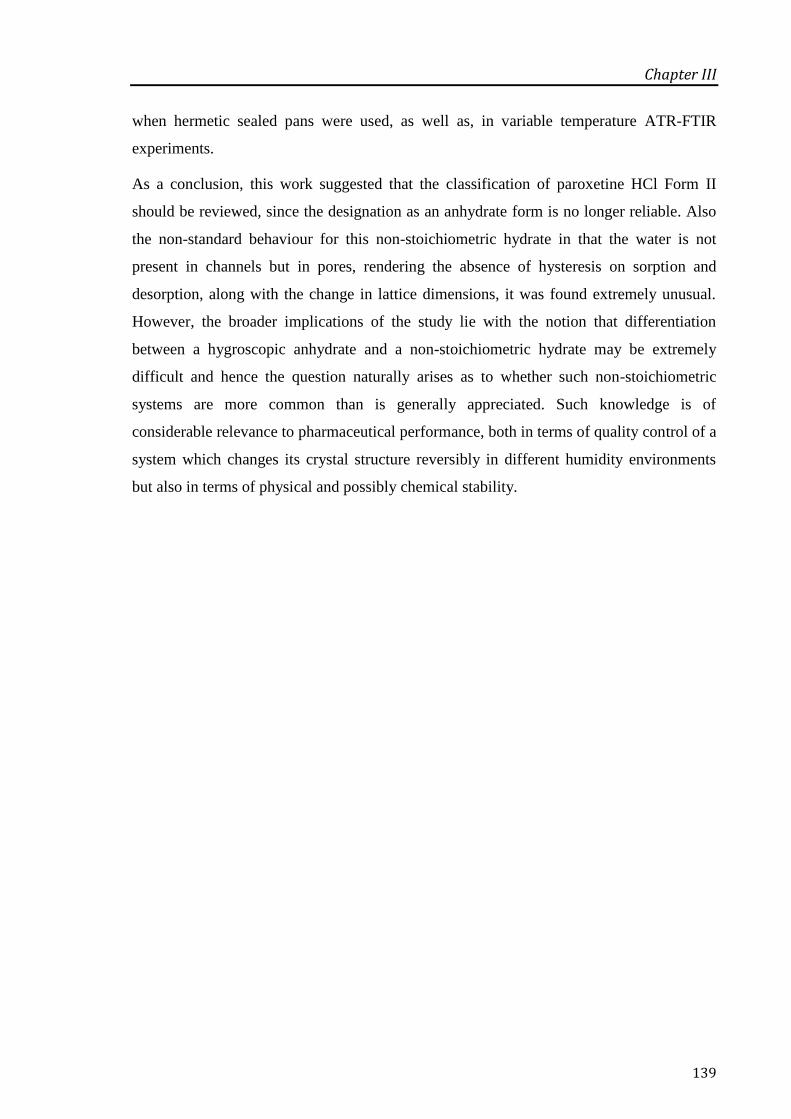
Chapter III
139
when hermetic sealed pans were used, as well as, in variable temperature ATR-FTIR
experiments.
As a conclusion, this work suggested that the classification of paroxetine HCl Form II
should be reviewed, since the designation as an anhydrate form is no longer reliable. Also
the non-standard behaviour for this non-stoichiometric hydrate in that the water is not
present in channels but in pores, rendering the absence of hysteresis on sorption and
desorption, along with the change in lattice dimensions, it was found extremely unusual.
However, the broader implications of the study lie with the notion that differentiation
between a hygroscopic anhydrate and a non-stoichiometric hydrate may be extremely
difficult and hence the question naturally arises as to whether such non-stoichiometric
systems are more common than is generally appreciated. Such knowledge is of
considerable relevance to pharmaceutical performance, both in terms of quality control of a
system which changes its crystal structure reversibly in different humidity environments
but also in terms of physical and possibly chemical stability.

4 AN INVESTIGATION INTO THE DEHYDRATION BEHAVIOUR OF
PAROXETINE HCL FORM I USING A COMBINATION OF
THERMAL AND DIFFRACTION METHODS:
THE IDENTIFICATION AND CHARACTERISATION
OF A NEW ANHYDROUS FORM
Chapter IV
141
Abstract
As already described in Chapter 3, paroxetine HCl can exist as a non-stoichiometric
hydrate (Form II) or as a stoichiometric hemihydrate (Form I); the latter is considered to be
the stable form and its structure is well-known. However, little work has been performed to
investigate its dehydration behaviour, hence the generation of the anhydrous form via
dehydration of paroxetine HCl Form I was investigated. A combination of thermal
(standard differential scanning calorimetry (DSC) and modulated temperature DSC
(MTDSC), thermogravimetric analysis (TGA) and hot stage microscopy (HSM)) and
diffraction (variable temperature X-ray diffraction, VT-XRPD) techniques were used. Karl
Fischer titration (KFT) and scanning electronic microscopy (SEM) were used to determine
the water content and collect microphotographs of the crystals, respectively. Dehydrated
Form I was prepared using ultra-dry conditions and the resulting product compared to
dehydrated Form II. DSC indicated that the two dehydrated forms of Form I and II had
distinct melting points. TGA experiments allowed the calculation of the activation energy
for the dehydration of Form I, which varies between 86–114 kJ/mol. Pawley refinement of
the VT-XRPD data suggested that Form I dehydrates to an isostructural anhydrate, since
the unit cell parameters of this new form were very similar to those of Form I with only a
smaller volume as consequence of dehydration. Comparison with dehydrated Form II
indicated that these two forms represent different crystal entities, hence a new anhydrous
form of paroxetine HCl has been identified.

Chapter IV
142
4.1 Introduction
Hydrates are often the most physically stable form of an active pharmaceutical ingredient
(API) under conditions of relative humidity (RH) typically found on storage, hence their
use remains extremely widespread. Nevertheless, their dehydration and rehydration
behaviour is often complex, with multiple forms possible which render thorough
investigation of such interchanges necessary for both practical and regulatory reasons. The
dehydration process occurs when the water activity of the surrounding environment is
lower than the water activity in the solid compound (Cui and Yao, 2008). Once the water is
removed from the crystal structure packing, different structural consequences may occur
(Petit and Coquerel, 1996):
(a) breakage of the crystal lattice, followed by a rearrangement into a new anhydrous
form (Leung et al., 1998);
(b) the crystal structure remains the same after dehydration forming an
isomorphic/isostructural dehydrate (Hirayama et al., 2000; Suzuki et al., 2012; Te
et al., 2003; Stephenson et al., 1998);
(c) partially or totally disordered state followed by a collapse into an amorphous phase
(Chen et al., 1999; Vogt et al., 2006).
Isostructural dehydrates (b) are associated with high free energy, which may be reduced by
re-incorporation of solvent molecules into the lattice, rendering this type of compounds
highly hygroscopic (Hilfiker, 2006). Dehydration is not always a straightforward process
and a mix of phases can be obtained with a combination of more than one of the
aforementioned mechanisms taking place. An example is the case of eprosartan mesylate
dihydrate (Sheng et al., 1999) whereby after losing the first water molecule, the
monohydrate dehydrates and collapses into an amorphous state, followed by
recrystallisation into an anhydrate form of eprosartan mesylate. Another case is the
dehydration of trehalose dihydrate whereby the product obtained is highly dependent on
the dehydration conditions employed (Willart et al., 2002). More specifically, fast
dehydration produces an amorphous phase, whereas a slow dehydration produces a
crystalline phase (α-polymorph) of anhydrous trehalose.
Chapter IV
143
Thermal analysis techniques such as differential scanning calorimetry (DSC) and
thermogravimetric analysis (TGA) are widely used to evaluate the dehydration behaviour
and the solid state stability of pharmaceutical hydrates. Two main approaches can be used
to evaluate solid state kinetics (Khawam and Flanagan, 2006a): the sample is held at a
constant temperature for a specified period of time (isothermal methods), or heated at a
constant heating rate (non-isothermal methods). For both methods, it is possible to
calculate the conversion fraction (α) where isothermal methods produce α-time data
(Equation 4.1) and non-isothermal methods produce α-temperature data (Equation 4.2),
Equation 4.1
where, m0 is the initial sample weight, mt is the sample weight at the time, t, and m∞ is the
final sample weight.
Equation 4.2
where, mT is the sample weight at temperature, T. The extent of conversion, α, increases
from 0 to 1 as the process progresses and kinetic analysis (isothermal or non-isothermal)
can be performed either by model-fitting or model-free methods (Khawam and Flanagan,
2006a).
Model-fitting approaches involve expressions (Appendix B, Table B3) to which the
experimental data (isothermal or non-isothermal) is fitted. The model that gives the best
fitting (R2 closer to 1) is selected to calculate the kinetic triplet which involves: the
activation energy, Ea (kJ/mol), as the energy barrier to overcome dehydration (for the
present study), the pre-exponential factor, A (min-1
) and the kinetic model (Khawam and
Flanagan, 2006a). Model-fitting methods assume a single value of Ea for the overall
reaction process, thereby implying a single reaction mechanism and do not provide an
adequate interpretation of complex kinetic reactions (Vyazovkin et al., 2011). Another
approach used to calculate the kinetic parameters of a dehydration reaction is by using
model-free methods. As the designation implies, model-free methods are applied without
any modelistic assumptions and therefore irrespectively of the underlying reaction model.

Chapter IV
144
As a result, they are capable to quantify the dependence of the Ea at each conversion
fraction, α, and thus are also known as isoconversional methods. Model-free methods
enable to highlight the complexity of the kinetic reactions, which allows a more accurate
determination of the Arrhenius parameters (Khawam and Flanagan, 2006a).
Paroxetine HCl Form I is a stoichiometric hydrate with half mol of water per mol of drug,
as shown by its chemical structure in Figure 4.1.
Figure 4.1: Chemical structure of paroxetine HCl Form I.
Barnes et al. (Barnes et al., 1988) reported the preparation of paroxetine HCl Form I and
described this form as being extremely stable, with the removal of the water from the
crystalline structure being possible under extreme desiccant conditions, with a quick
rehydration to the hemihydrate form. A decade later, Ibers (Ibers, 1999) published the
crystal structure of paroxetine HCl Form I, which indicated that the water molecules are
linked to a N-H...
O via a hydrogen bond 2.772(6) Ǻ in length. The author suggested that
this was the bond associated with dehydration and should be easily cleaved, hence
theoretically dehydration should occur readily. It is now believed that the water molecules
of the Form I are involved in three strong hydrogen bonds, formed with two chloride ions
and with a protonated ammonium nitrogen, respectively, explaining the observed stability
of Form I (shown in Chapter 3). Though the crystal structure of paroxetine HCl Form I is
now well-known, an important gap in the understanding of this form is related to its
dehydration behaviour (Farjas et al., 2010).
Paroxetine HCl can also exist in Form II, as shown in Chapter 3, identified as being a
non-stoichiometric hydrate. Form II retains the same crystal structure when dehydrated

Chapter IV
145
forming an isostructural dehydrate with only expansion and contraction on the crystal
lattice volume, respectively.
In an effort to better understand the interplay between hydrated and anhydrous forms, a
thorough investigation into the dehydration behaviour of paroxetine HCl Form I was
carried out using a combination of thermoanalytical techniques (standard differential
scanning calorimetry (DSC) and modulated temperature DSC (MTDSC),
thermogravimetric analysis (TGA) and hot stage microscopy (HSM)) and high resolution
variable temperature X-ray powder diffraction (VT-XRPD). The water content of the
sample was determined by Karl Fischer titration (KFT) and the morphology of crystals was
observed under scanning electron microscopy (SEM). The purity of the sample obtained
after the dehydration of Form I was determined using high performance liquid
chromatography (HPLC). Additionally, the activation energy, Ea, needed to dehydrate
Form I was calculated using non-isothermal model-free (Ozawa-Flynn-Wall) approaches;
isothermal model-fitting (Standard) methods were used in order to identify the best kinetic
model as a means of describing this dehydration process. The work presented in this
chapter aims to examine whether dehydration from two significantly distinct hydrate forms
leads to the same anhydrate for this material. This question is particularly pertinent given
the unusual nature of the non-stoichiometric Form II and, as will be shown, the very
unstable nature of the Form I anhydrate, hence little precedent exists to determine whether
the Form I (hemihydrate) will yield the same dehydrated form.
4.2 Materials and Methods
4.2.1 Materials
Paroxetine HCl Form I was purchased from Afine (China) and was used as received or
after being kept over phosphorus pentoxide (P2O5), Alfa Aesar (UK) or in a static oven, as
stated. For HSM observations, Form I was recrystallised from methanol by solvent
evaporation method.

Chapter IV
146
4.2.2 Methods
4.2.2.1 Thermal Analysis
Standard differential scanning calorimetry (DSC, Q2000 TA Instruments) analysis was
performed at heating rates of 2, 5, 10, 20 and 50 oC/min. Modulated temperature DSC
(MTDSC, Q2000 TA Instruments) analysis was conducted using a heating rate of
2 oC/min, amplitude ± 0.318
oC and a period of 60 seconds. Scans were carried out within
the temperature range 0 °C to 170 °C. Pinhole, hermetically sealed and open pans (pinhole
pans without lid) were used as stated.
Thermogravimetric analysis (TGA, Q5000 TA Instruments) of paroxetine HCl Form I was
performed in aluminium open pans by weighing approximately 5 mg of sample with
controlled particle size between 63-106 μm. Nitrogen purge at a constant rate, 25 mL/min,
was maintained during each run. Non-isothermal experiments were performed at heating
rates of 1, 2, 3, 4 and 5 °C/min from 30 °C until 300 °C. Isothermal studies were carried
out at 75, 80, 85, 90 and 95 °C with each sample been rapidly heated to the set temperature
at a 50 °C/min and kept isothermal until a constant weight change was achieved.
Hot stage microscopy (HSM, Leica DM L52) studies were conducted by placing Form I
between a slide and a cover slip inside a hot stage chamber (FP82HT, Mettler Toledo)
connected to a FP90 central processor. The sample was heated up at 2 oC/min from 30 to
150 oC and the observed thermal events were digitally captured (Studio 86 Design Capture
Software).
4.2.2.2 Karl Fischer Titration (KFT)
KFT (Mettler Toledo DL38) for water determination of Form I was carried out by
weighing between 40 to 50 mg of the untreated bulk sample.
4.2.2.3 Scanning Electron Microscopy (SEM)
SEM (JSM5900 LV) was used to acquire microphotographs on the untreated Form I and
after being kept isothermal in TGA for 1 h at 90 and 110 oC. To improve conductivity prior
Chapter IV
147
examination, samples were coated with gold using a Polaron SC7640 sputter gold coater
(Quorum Technologies).
4.2.2.4 High Performance Liquid Chromatography (HPLC)
HPLC (Agilent HP 1100 Series System) was carried out using a Supelco Ascentis Express
C18 (Sigma). Mobile phase consisted of 0.1% TFA in water and 0.085% TFA in
acetonitrile and a flow rate of 2.0 mL/min was used. The samples were analysed at
255.9 nm.
4.2.2.5 Variable Temperature X-Ray Power Diffraction (VT-XRPD)
VT-XRPD experiments (Bruker D8 Advance, Bruker) data sets were collected from 5.0° to
30.0° at 2θ under nitrogen purge with a flow rate of approximately 50 mL/min and 99.9%
purity. The sample was placed in an Anton-Paar TTK450 (Anton-Paar) chamber at 25 oC.
The temperature was controlled by a Temperature Control Unit TCU 100 (Anton-Paar) and
the applied heating rate was set by default to 0.167 K/s. Diffractograms were recorded
during heating at 25, 50, 75, 100 and 110 oC, and cooling at the same temperatures as
during heating. The sample was maintained under isothermal conditions for different
periods of time at each temperature, according to the knowledge provided by preliminary
studies.
Unit cell parameters were determined by Pawley refinement of the collected patterns using
the software TOPAS-Academic (Coelho, 2007). The initial values of the cell parameters
for the refinement at 25 oC were taken from the single crystal structure of Form I.
Refinements of powder patterns at higher temperatures were initiated from cell parameters
refined in the previous heating or cooling step. The pattern recorded at 100 °C during
cooling was indexed in TOPAS-Academic and the refinement was based on the cell
parameters from indexing.
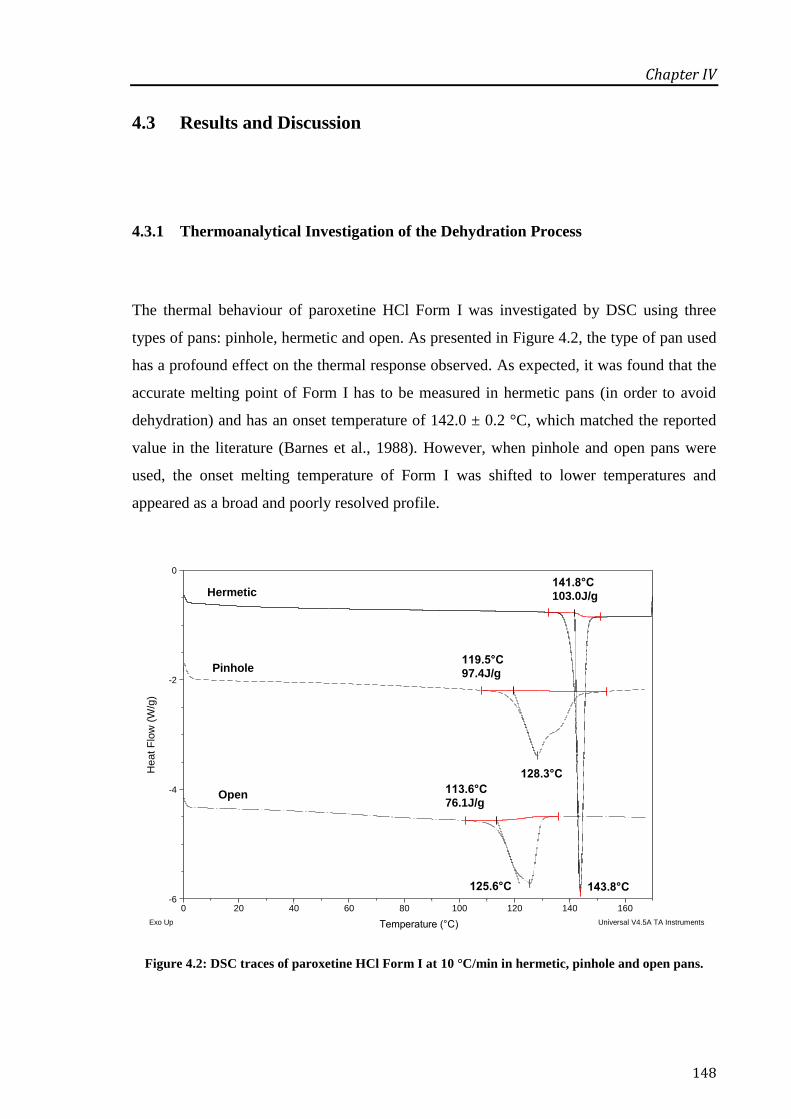
Chapter IV
148
4.3 Results and Discussion
4.3.1 Thermoanalytical Investigation of the Dehydration Process
The thermal behaviour of paroxetine HCl Form I was investigated by DSC using three
types of pans: pinhole, hermetic and open. As presented in Figure 4.2, the type of pan used
has a profound effect on the thermal response observed. As expected, it was found that the
accurate melting point of Form I has to be measured in hermetic pans (in order to avoid
dehydration) and has an onset temperature of 142.0 ± 0.2 °C, which matched the reported
value in the literature (Barnes et al., 1988). However, when pinhole and open pans were
used, the onset melting temperature of Form I was shifted to lower temperatures and
appeared as a broad and poorly resolved profile.
Figure 4.2: DSC traces of paroxetine HCl Form I at 10 °C/min in hermetic, pinhole and open pans.
125.6°C
113.6°C76.1J/g
Open
128.3°C
119.5°C97.4J/gPinhole
143.8°C
141.8°C103.0J/gHermetic
-6
-4
-2
0
Heat F
low
(W
/g)
0 20 40 60 80 100 120 140 160
Temperature (°C)Exo Up Universal V4.5A TA Instruments

Chapter IV
149
The effect of the heating rate (HR) (2, 5, 10, 20 and 50 oC/min) was tested using the three
types of pans (data not shown). In pinhole pans, as the heating rate increased, the peaks
became broader and at 50 °C/min the melting event was shifted closer to the melting of the
hydrate Form I. The results obtained at different HRs with hermetic pans were the same at
all the heating programs used. With open pans, a significant dependence on heating rate
was observed, with slower rates indicating a distinct endotherm which we associate with a
dehydration process (supported by TGA studies as discussed later).
Figure 4.3 shows the DSC responses of paroxetine HCl Form I and II in open pans
(2 oC/min) so as to highlight the differences in behaviour between the two forms studied
under identical conditions. First of all, the water loss was detected at different temperature
ranges for the two forms. In the case of Form II, the water loss started from the beginning
of the run, while for Form I the loss occurred roughly between 50 and 100 ºC. The onset
melting temperature was detected at 111.9 ± 0.4 ºC for Form I and at 117.5 ± 0.4 ºC for the
Form II, resulting in a difference of almost 6 ºC between the onset melting points of these
two forms, while the peak melting temperatures differed by almost 3 oC. At this early stage
of the investigation these results, while not conclusive, indicated that there may be
differences in the anhydrate forms generated from the dehydration of the two hydrate
forms.
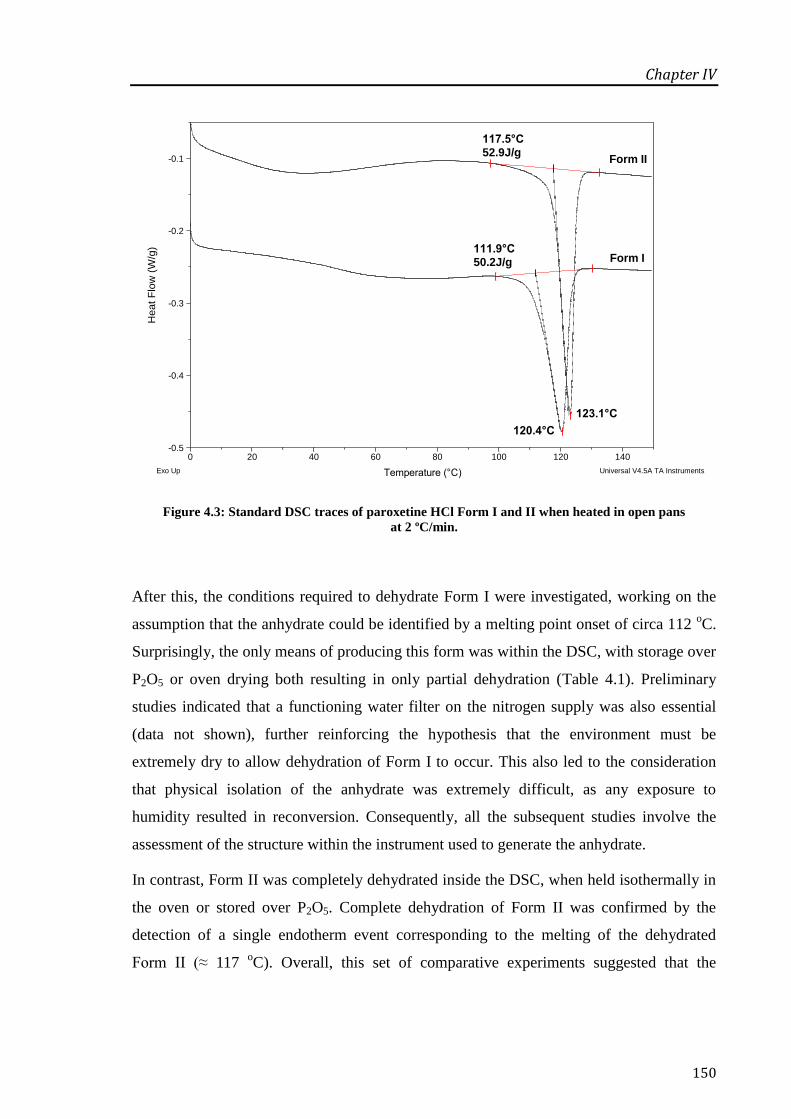
Chapter IV
150
Figure 4.3: Standard DSC traces of paroxetine HCl Form I and II when heated in open pans
at 2 ºC/min.
After this, the conditions required to dehydrate Form I were investigated, working on the
assumption that the anhydrate could be identified by a melting point onset of circa 112 oC.
Surprisingly, the only means of producing this form was within the DSC, with storage over
P2O5 or oven drying both resulting in only partial dehydration (Table 4.1). Preliminary
studies indicated that a functioning water filter on the nitrogen supply was also essential
(data not shown), further reinforcing the hypothesis that the environment must be
extremely dry to allow dehydration of Form I to occur. This also led to the consideration
that physical isolation of the anhydrate was extremely difficult, as any exposure to
humidity resulted in reconversion. Consequently, all the subsequent studies involve the
assessment of the structure within the instrument used to generate the anhydrate.
In contrast, Form II was completely dehydrated inside the DSC, when held isothermally in
the oven or stored over P2O5. Complete dehydration of Form II was confirmed by the
detection of a single endotherm event corresponding to the melting of the dehydrated
Form II (≈ 117 oC). Overall, this set of comparative experiments suggested that the
120.4°C
111.9°C50.2J/g Form I
123.1°C
117.5°C52.9J/g
Form II
-0.5
-0.4
-0.3
-0.2
-0.1H
eat F
low
(W
/g)
0 20 40 60 80 100 120 140
Temperature (°C)Exo Up Universal V4.5A TA Instruments

Chapter IV
151
dehydration of Form II is a much simpler process than the dehydration of Form I, able to
happen over a wider range of conditions with a more stable product being generated.
Table 4.1: Dehydration studies of paroxetine HCl Form I and Form II performed at
different drying conditions.
* Measurements were made in hermetic pans. All the experiments were performed at 2
oC/min.
Another important aspect in this study was to ensure that the complete dehydration of
paroxetine HCl Form I was not associated with any amorphisation of the sample.
Therefore, a heat-cool-heat procedure was set up at 2 oC/min using open pans; MTDSC
was used to identify particular transitions such as Tg in case the sample becomes
amorphous after dehydration. As presented in Figure 4.4 it is possible to observe a typical
water loss signal for Form I in the 1st heating cycle. On cooling, no thermal events were
detected either in total or reversing heat flow. Surprisingly however, on the 2nd
heating
cycle a broad endothermic transition between 40 and 60 oC was noticed. The first
assumption made was that this transition could be a glass transition event as consequence
of amorphisation after dehydration. However, the transition was not observed on the
reversing heat flow signal, which then excluded this hypothesis. The possibility of this
transition being an artefact was eliminated, with the same results being obtained either
Sample Experimental drying
procedure T
m onset (°C) ΔH
melting (J/g) T
m peak
(°C)
Form I
DSC open pans 111.9 ± 0.4 50.4 ± 1.4 120.4 ± 0.1
*Oven 100 ºC/24 h 136.7 ± 0.8 85.2 ± 0.2 140.9 ± 0.1
*P2O5/48 h 138.9 ± 0.9 91.5 ± 2.4 141.1 ± 1.5
Form II
DSC open pans 117.5 ± 0.4 53.1 ± 1.0 123.1 ± 0.1
*Oven 100 ºC/1 h 116.6 ± 0.2 56.2 ± 2.0 120.1 ± 0.3
*P2O5/48 h 117.2 ± 0.9 53.2 ± 0.2 120.5 ± 1.7
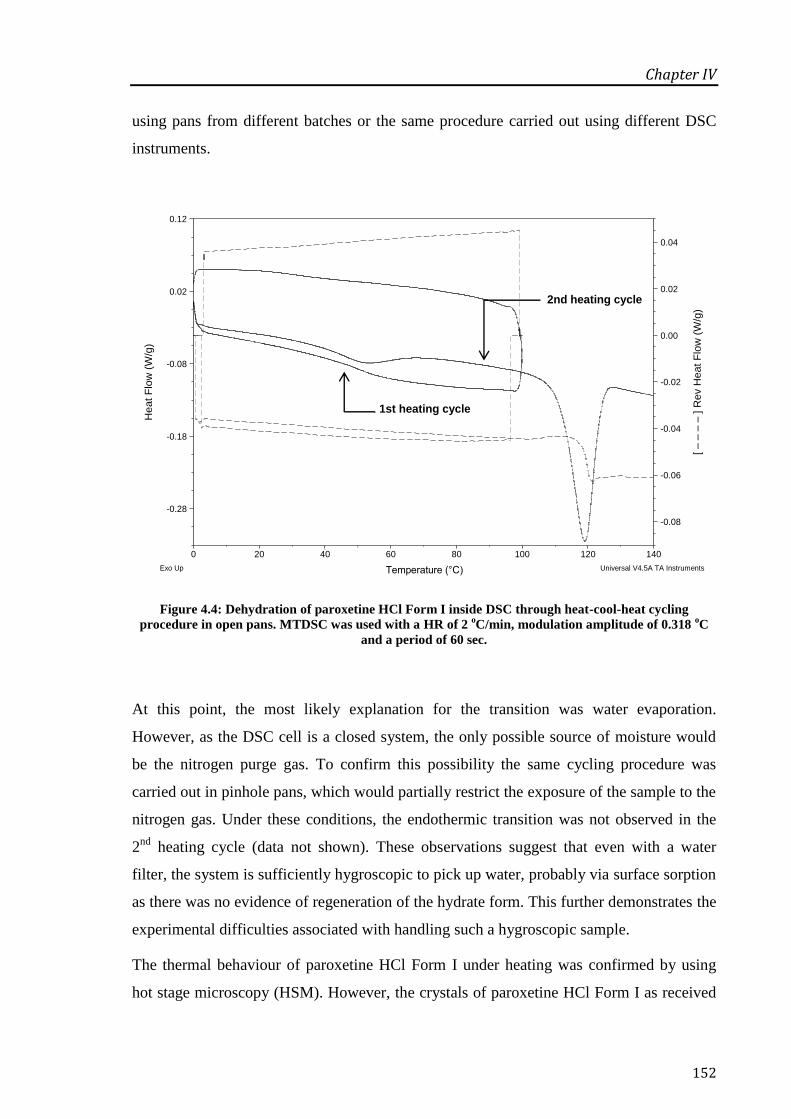
Chapter IV
152
using pans from different batches or the same procedure carried out using different DSC
instruments.
Figure 4.4: Dehydration of paroxetine HCl Form I inside DSC through heat-cool-heat cycling
procedure in open pans. MTDSC was used with a HR of 2 oC/min, modulation amplitude of 0.318
oC
and a period of 60 sec.
At this point, the most likely explanation for the transition was water evaporation.
However, as the DSC cell is a closed system, the only possible source of moisture would
be the nitrogen purge gas. To confirm this possibility the same cycling procedure was
carried out in pinhole pans, which would partially restrict the exposure of the sample to the
nitrogen gas. Under these conditions, the endothermic transition was not observed in the
2nd
heating cycle (data not shown). These observations suggest that even with a water
filter, the system is sufficiently hygroscopic to pick up water, probably via surface sorption
as there was no evidence of regeneration of the hydrate form. This further demonstrates the
experimental difficulties associated with handling such a hygroscopic sample.
The thermal behaviour of paroxetine HCl Form I under heating was confirmed by using
hot stage microscopy (HSM). However, the crystals of paroxetine HCl Form I as received
1st heating cycle
2nd heating cycle
-0.08
-0.06
-0.04
-0.02
0.00
0.02
0.04
[ ] R
ev H
eat F
low
(W
/g)
– –
– –
-0.28
-0.18
-0.08
0.02
0.12
Heat F
low
(W
/g)
0 20 40 60 80 100 120 140
Temperature (°C)
Size: 3.1800 mg DSCFile: Paroxetine HCl Form I open pans 5cycl...Operator: fatimaRun Date: 25-Jul-2012 19:19Instrument: DSC Q2000 V24.4 Build 116
Exo Up Universal V4.5A TA Instruments

Chapter IV
153
120 oC 121 oC
124 oC 133 oC
were not big enough for a clear observation under HSM, therefore paroxetine HCl Form I
was recrystallised in methanol (solvent evaporation method) and crystals with a greater
size were obtained. The DSC traces and the water content measured by TGA confirmed the
recrystallised form to be Form I.
From the microphotographs collected at different temperatures, as shown in Figure 4.5,
paroxetine HCl Form I dehydrated upon heating and at around 120 oC some surface
melting of the crystal can be observed. The overall melting process happened over a broad
range of temperature (≈ 13 oC) with the offset melting temperature being detected at
around 133 oC. It should be noted that the environment inside the hot stage furnace is
obviously different from the DSC cell and as a result, the complete dehydration of the
sample was not achieved. These facts are fairly understood, firstly due to the non-
hermetically conditions provided by the HSM furnace and secondly the inexistence of
nitrogen purge which makes the dehydration of this form harder to happen. In a broader
view, however, these results support the DSC data and the idea of the dehydration of
Form I followed by the melting of the anhydrous form.
Figure 4.5: Microphotographs of paroxetine HCl Form I heated at 2 oC/min.
Scale bar represents 150 µm.

Chapter IV
154
Given the above results, it was considered important to evaluate the strength of the
interactions between the water and the drug within the hydrate, which may be achieved
using TGA. In Figure 4.6, the DSC and TGA thermograms of paroxetine HCl Form I have
been overlaid. For a particular slow HR of 2 oC/min, the water loss commenced at around
50 oC and occurred continuously until approximately 115
oC; the loss can be divided in
two main temperature regions. The first one between 50-95 oC covered the majority of the
water loss and the second one near the endothermic melting event, as observed from the
DSC curve.
Figure 4.6: DSC (____
) and TGA (_ _ _
) thermographs for paroxetine HCl Form I in open pans at
2 oC/min. The derivative weight curve (-
.-
.-) is presented for clarity.
The water content of the raw Form I was determined by KFT to be 2.71 ± 0.25% w/w. This
value was in a good agreement with the designation of this form as hemihydrate,
0.56 ± 0.05 mol of water per mol of drug and matched the total weight lost measured by
TGA. In addition, HPLC was used to confirm that dehydration and subsequent melting
process did not yield to any degradation of the sample. Analyses were performed on the
0.2
0.4
De
riv. W
eig
ht (%
/°C
)
75
80
85
90
95
100
105
We
igh
t (%
)
-0.4
-0.3
-0.2
-0.1
He
at
Flo
w (
W/g
)
30
50
70
90
110
130
150
170
190
210
230
250
270
290
Temperature (°C)
Exo Up
Universal V4.5A TA Instruments
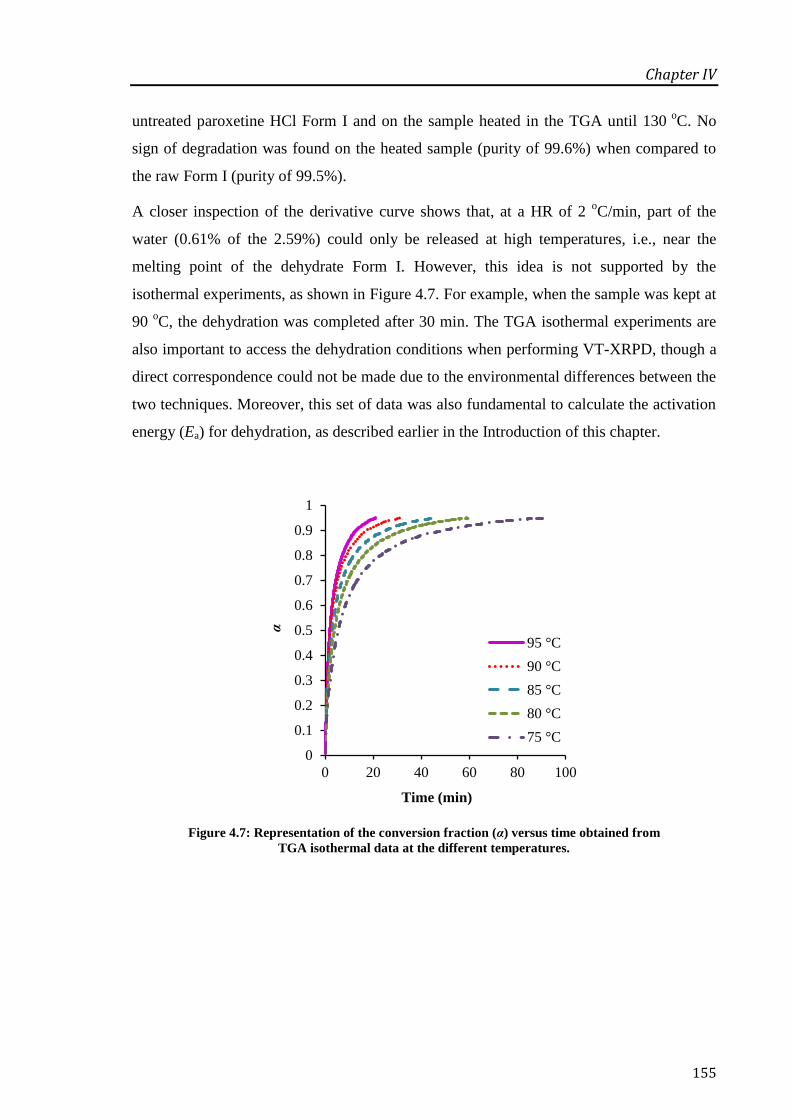
Chapter IV
155
untreated paroxetine HCl Form I and on the sample heated in the TGA until 130 o
C. No
sign of degradation was found on the heated sample (purity of 99.6%) when compared to
the raw Form I (purity of 99.5%).
A closer inspection of the derivative curve shows that, at a HR of 2 oC/min, part of the
water (0.61% of the 2.59%) could only be released at high temperatures, i.e., near the
melting point of the dehydrate Form I. However, this idea is not supported by the
isothermal experiments, as shown in Figure 4.7. For example, when the sample was kept at
90 oC, the dehydration was completed after 30 min. The TGA isothermal experiments are
also important to access the dehydration conditions when performing VT-XRPD, though a
direct correspondence could not be made due to the environmental differences between the
two techniques. Moreover, this set of data was also fundamental to calculate the activation
energy (Ea) for dehydration, as described earlier in the Introduction of this chapter.
Figure 4.7: Representation of the conversion fraction (α) versus time obtained from
TGA isothermal data at the different temperatures.
0
0.1
0.2
0.3
0.4
0.5
0.6
0.7
0.8
0.9
1
0 20 40 60 80 100
α
Time (min)
95 °C
90 °C
85 °C
80 °C
75 °C

Chapter IV
156
4.3.2 Dehydration Kinetics
The dehydration kinetics of paroxetine HCl Form I was studied using
model-free and model-fitting approaches. Model-free analysis were performed using
non-isothermal data, allowing the calculation of the Arrhenius parameters as a function of
the conversion fraction, α. Model-fitting approaches were carried out using isothermal data
that yields to the evaluation of a suitable kinetic model that better defines the overall
reaction.
Based on the graphical shape of the isothermal curves, as shown previously in Figure 4.7,
the dehydration rate decreases as the reaction proceeds and thereby the kinetic model for
this reaction is known as decelerating. There are three other major groups of kinetic
models described in the literature as accelerating, linear and sigmoidal (Vyazovkin et al.,
2011). Non-isothermally, plots of α vs. temperature are not distinctive in their shapes as
they are isothermally and thereby not used to preclude on the kinetic model of the solid
state reaction (Khawam and Flanagan, 2006b).
Model-Free Analysis
The activation energy for the dehydration of paroxetine HCl Form I was calculated using a
non-isothermal isoconversional method developed by Ozawa, Flynn-Wall (Ozawa, 1965;
Flynn and Wall, 1966) and therefore commonly referred to as the OFW method, which can
be expressed by the Equation 4.3
Equation 4.3
where, β is the heating rate, g(α) is the integral reaction model and R the gas constant.
Plotting log β versus 1000/T at each α yields Ea from the slope and from the intercept of
the linear equation, the frequency factor, A, can be obtained. However the determination of
A requires modelistic assumptions and as consequence, model-free methods usually only
focus on the calculation of Ea at each value of α (Khawam and Flanagan, 2006a). An
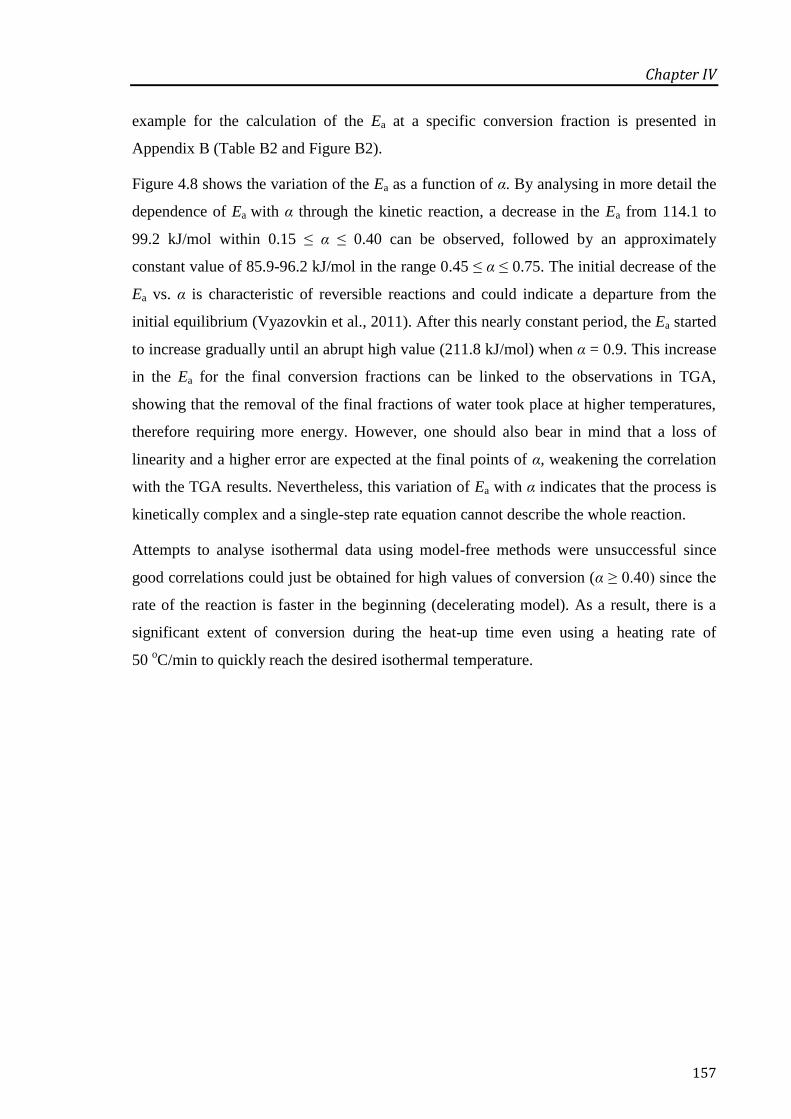
Chapter IV
157
example for the calculation of the Ea at a specific conversion fraction is presented in
Appendix B (Table B2 and Figure B2).
Figure 4.8 shows the variation of the Ea as a function of α. By analysing in more detail the
dependence of Ea with α through the kinetic reaction, a decrease in the Ea from 114.1 to
99.2 kJ/mol within 0.15 ≤ α ≤ 0.40 can be observed, followed by an approximately
constant value of 85.9-96.2 kJ/mol in the range 0.45 ≤ α ≤ 0.75. The initial decrease of the
Ea vs. α is characteristic of reversible reactions and could indicate a departure from the
initial equilibrium (Vyazovkin et al., 2011). After this nearly constant period, the Ea started
to increase gradually until an abrupt high value (211.8 kJ/mol) when α = 0.9. This increase
in the Ea for the final conversion fractions can be linked to the observations in TGA,
showing that the removal of the final fractions of water took place at higher temperatures,
therefore requiring more energy. However, one should also bear in mind that a loss of
linearity and a higher error are expected at the final points of α, weakening the correlation
with the TGA results. Nevertheless, this variation of Ea with α indicates that the process is
kinetically complex and a single-step rate equation cannot describe the whole reaction.
Attempts to analyse isothermal data using model-free methods were unsuccessful since
good correlations could just be obtained for high values of conversion (α ≥ 0.40) since the
rate of the reaction is faster in the beginning (decelerating model). As a result, there is a
significant extent of conversion during the heat-up time even using a heating rate of
50 oC/min to quickly reach the desired isothermal temperature.

Chapter IV
158
Figure 4.8: Activation energy, Ea, plotted as a function of the extent of conversion, α, for the
dehydration of paroxetine HCl Form I under non-isothermal conditions.
Model-Fitting Analysis
Model-fitting methods of isothermal data were performed within the conversion region
where Ea is approximately constant (0.45 ≤ α ≤ 0.75), as determined previously by
model-free analysis. The data was fitted to the integral form, g(α), of 17 models listed in
Appendix B Table B3.
Two different models were found to have the best fit for the dehydration kinetics of
paroxetine HCl Form I: F2 (Ea = 71.8 ± 2.4 kJ/mol, R2 = 0.9968) and D3 (Ea = 74.3 ± 2.2
kJ/mol; R2 = 0.9974). Each model affords a similar value of Ea, however from the shape of
the isothermal curves, the reaction follows a deceleratory model, as mentioned above.
Therefore, D3 (three dimensional diffusion model) provides a good description of the
dehydration kinetics over this range of conversion.
The acquired knowledge up to this stage allowed to understand the thermal behaviour of
Form I when exposed to different dehydration conditions and carefully set up the XRPD
experiments, as follow, which are essential to provide information on the structure of the
dehydrated form.
60
100
140
180
220
260
0 0.2 0.4 0.6 0.8 1
Ea(k
J/m
ol)
α
Chapter IV
159
4.3.3 Structural Studies using VT-XRPD
VT-XRPD experiments were performed in a closed system constantly purged with dry
nitrogen gas in order to mimic the conditions inside the DSC and TGA furnace. A change
in the XRPD pattern started to be apparent after 1 h at 75 oC, with some of the diffraction
peaks becoming broader. The changes were clearly observed as the temperature increased
(Figure 4.9). After 5 h isothermal treatment at 100 oC, the existing peaks became less sharp
and new peaks appeared which may be associated with the departure of the water
molecules and the concomitant appearance of a new phase. This phenomenon was more
evident when the temperature increased to 110 oC and the sample was kept isothermal for
12 h. After that time, and analysing the spectrum at lower angles, it is possible to
distinguish the new peaks that appeared (*) and the peaks from the hydrated Form I that
started to disappear (#). However, at higher angles the discrimination between the two
phases is more difficult due to the overlap between some of the peaks. Pawley refinement
(Coelho, 2007) using the unit cell parameters of Form I gave a good fit to the experimental
patterns at temperatures below 75 °C, but at 100 and 110 oC the fit was very poor due to
the presence of more than one form (Appendix B, Figure B1 and Table B1).

Chapter IV
160
Figure 4.9: VT-XRPD diffractograms collected on paroxetine HCl Form I at 25, 50, 75, 100 and 110 oC
(upwards). Peaks identified with (*) correspond to the new anhydrous form and those identified with
(#) are related to the initial Form I.
On cooling, it was possible to index the pattern collected after 1 h at 100 oC. Pawley
refinement with the new unit cell parameters gave a good fit to the diffraction pattern. The
refined cell parameters (a = 14.400(2) Å, b = 10.5362(15) Å and c = 12.7706(13) Å) were
found to be very similar to those of the hemihydrate Form I at 75 °C (a = 14.655(5) Å,
b = 10.191(3) Å and c = 13.039(5) Å), but with a smaller unit cell volume. The space
group of the new anhydrous form was found to be P21, the same as Form I. A similar
pattern to the one collected at 100 oC was maintained on further cooling down to 50
oC
(Figure 4.10). When the temperature dropped to 25 oC the pattern changed significantly,
which might be ascribed to the re-entry of water molecules into the crystal structure. At
this stage, the fitting using the anhydrous unit cell parameters became very poor, as the
pattern started gradually to revert to the initial Form I.
5 10 15 20 25 30
Inte
ns
ity
2θ (degree)
110 oC heating/12h
100 oC heating/5h
75 oC heating/1h
50 oC heating/1h
25 oC heating/1h
**
*
*
####
#
#
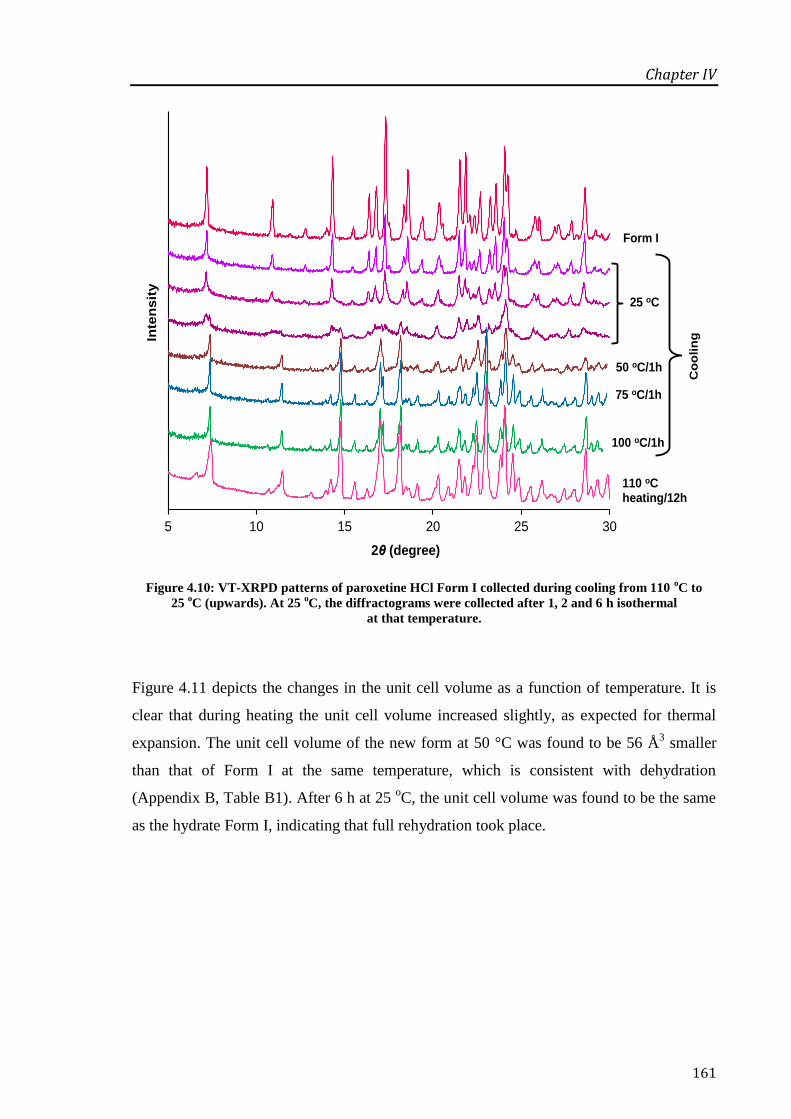
Chapter IV
161
Figure 4.10: VT-XRPD patterns of paroxetine HCl Form I collected during cooling from 110 oC to
25 oC (upwards). At 25
oC, the diffractograms were collected after 1, 2 and 6 h isothermal
at that temperature.
Figure 4.11 depicts the changes in the unit cell volume as a function of temperature. It is
clear that during heating the unit cell volume increased slightly, as expected for thermal
expansion. The unit cell volume of the new form at 50 °C was found to be 56 Å3 smaller
than that of Form I at the same temperature, which is consistent with dehydration
(Appendix B, Table B1). After 6 h at 25 oC, the unit cell volume was found to be the same
as the hydrate Form I, indicating that full rehydration took place.
5 10 15 20 25 30
Inte
nsit
y
2θ (degree)
110 oC heating/12h
25 oC
50 oC/1h
75 oC/1h
100 oC/1h
Form I
Co
olin
g

Chapter IV
162
Figure 4.11: Changes in the unit cell volume of paroxetine HCl Form I during heating at 25, 50, 75 and
100 oC (♦); during cooling of the anhydrous form (●) at the same temperatures as during heating; and
after cooling at 25 oC for 6 h (□). Note that the refinement at 100
oC on heating and after 1 h at 25
oC
on cooling gave a poor fitting, thus these results are less reliable.
From these observations, Form I is likely to dehydrate to an isostructural anhydrous form,
which explains its extremely high instability and propensity to interact with water, as no
major changes in the structure were needed for the rehydration to occur.
Furthermore, SEM microphotographs (Figure 4.12) taken on the raw Form I (a) and
compared with Form I (b) held isothermal for 1 h at 90 oC in TGA, did not show any
differences in their crystal appearance. This fact is not surprising and can be readily
explained by the higher hygroscopic behaviour of this new anhydrous form able to
rehydrate using the residual moisture present in the nitrogen gas (XRPD experiments
during cooling). Therefore, differences related to dehydration would be hard to observe
under SEM. A sample held at 110 oC for 1 h (c) had a partially glassy appearance under
SEM. This is due to surface melting of the dehydrated sample kept under these isothermal
conditions and subsequent cooling. Thermogravimetric analysis is primarily designed for
dynamic heating rates and the offset is not affected by heating rate but the actual
temperature may be different in the isothermal experiment. As a result, these observations
are expected since the onset melting point of the dehydrated Form I
1740
1760
1780
1800
1820
1840
1860
1880
1900
20 30 40 50 60 70 80 90 100 110
Un
it c
ell
vo
lum
e (
Ǻ3)
Temperature (oC)
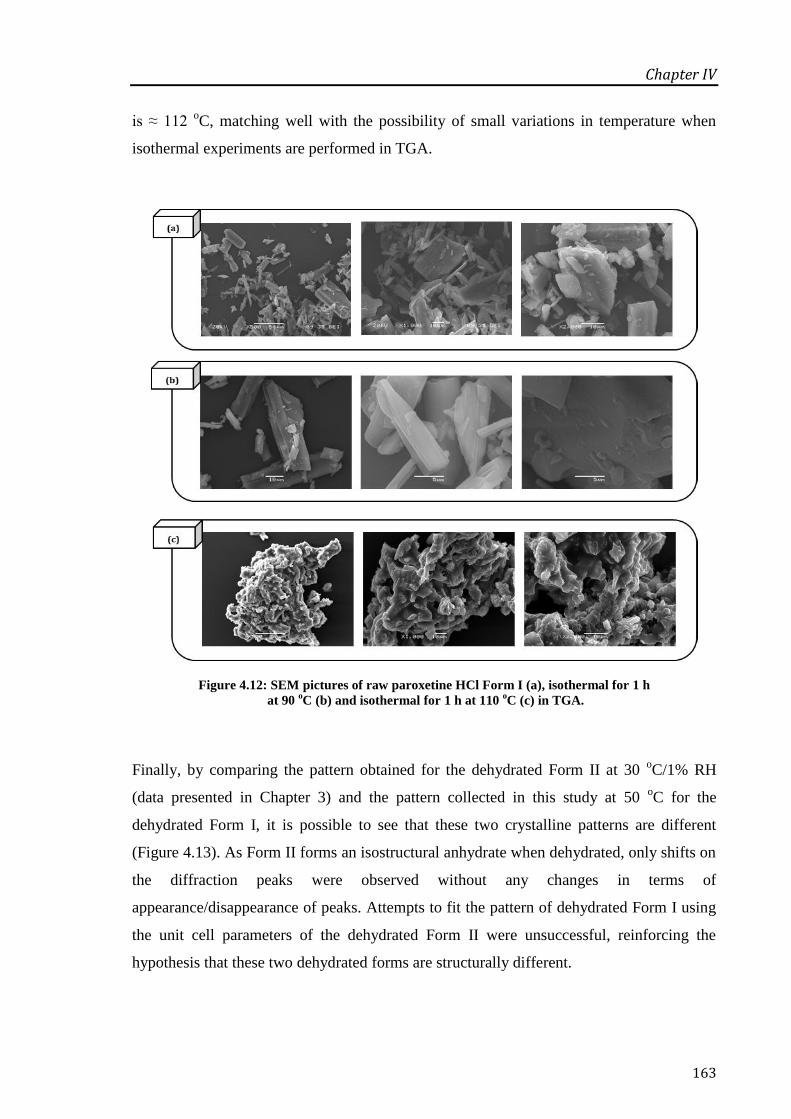
Chapter IV
163
is ≈ 112 oC, matching well with the possibility of small variations in temperature when
isothermal experiments are performed in TGA.
Figure 4.12: SEM pictures of raw paroxetine HCl Form I (a), isothermal for 1 h
at 90 oC (b) and isothermal for 1 h at 110
oC (c) in TGA.
Finally, by comparing the pattern obtained for the dehydrated Form II at 30 oC/1% RH
(data presented in Chapter 3) and the pattern collected in this study at 50 oC for the
dehydrated Form I, it is possible to see that these two crystalline patterns are different
(Figure 4.13). As Form II forms an isostructural anhydrate when dehydrated, only shifts on
the diffraction peaks were observed without any changes in terms of
appearance/disappearance of peaks. Attempts to fit the pattern of dehydrated Form I using
the unit cell parameters of the dehydrated Form II were unsuccessful, reinforcing the
hypothesis that these two dehydrated forms are structurally different.

Chapter IV
164
Figure 4.13: VT-XRPD pattern of the dehydrated Form I at 50 oC on cooling (bottom) and VH-XRPD
pattern of the dehydrated Form II (top) collected at 30 oC/1% RH (data presented in Chapter 3).
Figure 4.14 is a schematic representation of the relationships between hydrated and
dehydrated forms of paroxetine HCl. Form II dehydrated to an isostructural anhydrous
form that rehydrated back at 10-30% RH (Chapter 3). The dehydration of Form I was a
more complex process implying a completely dry environment and high temperatures. The
dehydrated Form I was found to be very unstable with quickly reconversion to the hydrate
Form I when RH ≈ 1%. The two dehydrated forms of Form I and II were structurally
different and therefore a new form of paroxetine HCl has been found.
5 10 15 20 25 30
Inte
nsit
y
2θ (degree)

Chapter IV
165
Figure 4.14: Representative scheme of the relationship between the two forms of paroxetine HCl.
Dehydrate
Form II
Temp.
P2O5
RH ≈
0%
RH ≈ 10 - 30%
Form II
Paroxetine HCl
Dehydrate
Form I
Temp.
RH = 0%
N2 atmos.
RH ≈ 1%
Temp. 25-30 o
C
Form I
X

Chapter IV
166
4.4 Conclusions
The combination of thermal and diffraction techniques allowed investigation of the
dehydration behaviour of paroxetine HCl Form I and, consequently, suggested the
existence of a new anhydrous form as a result of this process. Dehydration was firstly
observed when Form I was heated in pinhole or open pans in the DSC. However, the
melting peak temperature observed for the dehydrated Form I (120 ºC) was fairly close to
the melting of the isostructural dehydrate Form II (123 ºC), which made the differentiation
between these two dehydrated forms difficult using thermal techniques.
Therefore, VT-XRPD experiments were performed in a closed system blanket with dry
nitrogen gas (99.9% purity) in similar conditions as those observed in the DSC and TGA
furnace. The changes in the XRPD pattern started to be observed as the temperature
increased, with the appearance of new diffraction peaks after the sample being kept
isothermal for 5 h at 100 oC. The Pawley refinement showed that the unit cell parameters
of the new anhydrous form were very similar to the hydrate Form I, the main difference
being a smaller unit cell volume, as a result of dehydration. Therefore, it is possible to
conclude that Form I dehydrates to an isostructural dehydrate form.
During cooling, as a result of the temperature drop, residual moisture in the N2 source (in
theory nearly 1%) and probably not completely hermetically sealed VT chamber, the
pattern started gradually to revert to the initial Form I after 1 h at 25 oC. Pawley refinement
using the pattern collected after 6 h at 25 oC showed that the unit cell had the same volume
as the hydrate Form I confirming that the new anhydrous form fully rehydrated to Form I.
The structural rehydration observed during cooling in the VT-XRPD experiments was
supported by the results obtained when the sample was cycled inside the DSC in open
pans, with the dehydrate Form I picking up moisture from the nitrogen gas.
The dehydration kinetic studies of Form I were conducted using non-isothermal TGA data
with a view to estimate the Ea required to dehydrate Form I. Model-free analysis were used
to calculate the Ea for dehydration of Form I, which varies between 86-114 kJ/mol. This
value of Ea is much higher than the reported value (60 kJ/mol) for stable hydrates under
ambient conditions, supporting again the great stability observed for the hydrate Form I
(Shimanovich et al., 2012).

Chapter IV
167
The significance of these findings lies not only in the identification of a new structure for
an important drug molecule, but also in highlighting the complexity of dehydration and
rehydration behaviour of low molecular weight molecules. The Form I anhydrate was
extremely difficult to produce and isolate due to the high resistance to dehydration and
extreme affinity for water. The anhydrate is extremely unstable and hence is not a viable
candidate for commercial use. However, taken in the context of the unusual hydration
behavior of Form II highlighted in Chapter 3, this drug also serves as a potentially highly
important model for understanding the relationship between chemical structure and
hydration behaviour. In particular, the current study has highlighted the extreme affinity of
the Form I dehydrate for water, which is in itself of interest in understanding hydrate
formation and stability.
Overall, the work presented in this chapter have shown that the dehydration of paroxetine
HCl Form I is a complex and uncommon process for a stoichiometric hydrate. The
prepared anhydrous form is structurally different from the dehydrated Form II, thereby a
new anhydrous form of paroxetine HCl has been identified. Moreover, the structure of the
new anhydrous form was found to be very similar to the hydrate Form I, which supported
its high instability and tendency to quickly rehydrate. These findings are of considerable
relevance on the understanding of the solid state relationships of paroxetine HCl.
Furthermore, the study presents new insights into the behaviour of hydrates with high
resistance to dehydration, with the possibility of new forms being identified and enhanced
understanding of the driving factors determining hydrate formation and stability.

5 AMORPHOUS PAROXETINE HCL: THE RELATIONSHIP
BETWEEN THERMODYNAMIC/KINETIC PARAMETERS,
DRUG PERFORMANCE AND STABILITY

Chapter V
169
Abstract
Increased interest in molecular time scales below the glass transition temperature, Tg, has
arisen from the need to identify the conditions at which the stability of glassy materials is
maximum and unwanted changes, such as recrystallisation, are improbable. In this study, a
series of well-known kinetic and thermodynamic parameters have been used to
characterise amorphous paroxetine HCl and predict its physical stability. These predictions
were asserted with the experimental results obtained after the amorphous sample was
stored under different relative humidity (RH) environments at room temperature.
A combination of thermal (standard differential scanning calorimetry (DSC), modulated
temperature DSC (MTDSC) and thermogravimetric analysis (TGA)), spectroscopic
(attenuated total reflection-Fourier transform infrared (ATR-FTIR)) and diffraction (X-ray
powder diffraction (XRPD)) techniques were used to characterise the freshly prepared and
aged amorphous samples. Aqueous solubility and dissolution studies were also performed.
Parameters such as heat capacity, configurational thermodynamic quantities and fragility
parameters classified amorphous paroxetine HCl as a moderate fragile glass with a
considerable degree of molecular mobility associated. The calculated relaxation time using
Adam-Gibbs-Vogel approach was found to be a reasonably good predictor of the stability
of amorphous paroxetine HCl. These observations were reflected in the stability of this
form. Firstly, amorphous paroxetine HCl recrystallised to the most stable Form I during the
solubility experiments. Secondly, the stability studies showed that the recrystallisation of
this form was greatly influenced by the presence of humidity. High RH environments
(75% RH) led to a full recrystallisation within 1 to 3 days, while the same observation was
detected after 30 days under 53% RH. The storage conditions were also found to affect the
pathway of recrystallisation of amorphous paroxetine HCl, which happened directly to
Form I at 53% RH or via metastable Form II at 75% RH, as confirmed by FTIR. This study
elucidated the importance of taking advantage of the theoretical predictors in the study of
amorphous systems, although the complete understanding of its physical stability and
recrystallisation behaviour remains beyond these predictions.

Chapter V
170
5.1 Introduction
Thermodynamic properties such as excess of free energy, enthalpy and entropy are
responsible for the advantageous uses of amorphous materials, namely the enhancement of
aqueous solubility and dissolution rate of poorly soluble drugs. Amorphous compounds are
highly disordered systems, thus the energy barrier to be overcome for dissolution is lower
than that associated with the equivalent crystalline materials. However, due to high
reactivity and instability to mechanical and thermal stresses above their glass transition, the
incorporation of amorphous materials in formulated products is restricted; some examples
of amorphous drugs marketed are: Kaletra®
(ritonavir and lopinavir), Sporanox®
(itraconazol) and Prograf® (tracolimus). There are many routes to transform a crystal into
an amorphous phase being the most representative the mechanical activation (e.g. milling),
via solution (e.g. spray drying, freeze drying, and precipitation by the addition of
anti-solvents) and quench cooling after melting.
A crucial decisive factor regarding whether an active pharmaceutical ingredient (API) can
be formulated as an amorphous material is its physical stability during the processing
operation, dissolution testing as well as during its self-life. Therefore, several kinetic and
thermodynamic parameters were used in this study to predict the stability of amorphous
paroxetine HCl, as presented next.
The fundamental characterisation of an amorphous material implies the measurement of
the glass transition temperature, Tg, at which the material changes on cooling from a liquid
or rubbery state to a brittle or glassy state (Craig et al., 1999). This phenomenon is known
as vitrification. By contrast, devitrification describes the process of conversion from the
metastable amorphous state to the more stable crystalline state, as a consequence of
mechanical stress and/or effect of temperature and humidity (Ambike et al., 2004). The
determination of the Tg is essential to evaluate the physical and chemical stability of
amorphous compounds.
Another important concept to take into consideration is known as relaxation and reflects
the changes in atomic/molecular arrangements that happen during the spontaneous
conversion from the amorphous to crystalline state, in a scale of time and temperature

Chapter V
171
influence (Kawakami and Pikal, 2005; Hilden and Morris, 2004). In amorphous drug
studies, the structural relaxation is often referred to as enthalpy of relaxation which is a
common parameter used to measure the extent of stability. Normally, in the pharmaceutical
field, the bulk enthalpy relaxation is measured using calorimetric methods, such as
differential scanning calorimetry (DSC) and recently MTDSC. Lately, attempts have been
made in order to measure surface relaxation by using inverse gas chromatography, with a
view to understanding molecular mobility at the surface (Ke et al., 2012). The enthalpy lost
during a certain time and at a determined temperature below Tg is regained during the
heating run in the DSC and is shown as an endothermic peak at Tg. As a result, the
enthalpy relaxation is also known as enthalpy recovery. The increase in enthalpy recovery
over the ageing time can be used as a direct measure of molecular mobility, which is the
main aspect governing the physical stability of glassy systems (Surana et al., 2004).
Kauzmann Temperature
The Kauzmann temperature, TK, is the temperature at which the configurational entropy of
the glassy material vanishes (often called as entropy crisis); the degree of mobility at this
point is reduced and can be considered to be similar to the most ordered crystalline state
(Shamblin et al., 1999). TK is considered as the theoretically lowest glass transition
temperature possible, where the molecular mobility of the amorphous materials becomes
negligible. TK is an important parameter to inform the researcher regarding the likely
stability of a pharmaceutical compound, since at this temperature or below, the metastable
amorphous materials are expected to have the maximum stability. In practice, however, the
storage at T < TK is often not possible from an industrial perspective.
The estimation of TK can be made either using entropy, TKS (Equation 5.1) or enthalpy, TKH
(Equation 5.2) of fusion. However, the entropy-based calculation is considered to be the
most accurate approach to calculate the correct TK value (Shamblin et al., 1999),
(
)
Equation 5.1

Chapter V
172
(
)
Equation 5.2
where, ΔHm is the enthalpy change at melting, Tm is the melting temperature and Cp conf
is a the configurational heat capacity.
The Cp conf is controlled by the temperature dependence of the configurational entropy,
which is consequently a measure of the temperature dependence of non-vibrational
molecular mobility. It can be calculated from the heat capacity of the supercooled liquid
(Cpl) and the crystal (Cp
c) by using the following expression,
Equation 5.3
Fragile glasses are expected to have large Cp conf values due to their rapid configurational
entropy change with the temperature, whereas strong glass formers have small
configurational heat capacities, because their configurational entropy changes slowly with
temperature (Angell, 1991).
Zero Mobility Temperature
The zero mobility temperature, T0, is defined as the temperature where extrapolated
thermodynamic properties of a supercooled liquid are equal to those of the crystal and can
be expressed by the Equation 5.4,
(
)
Equation 5.4
where, m represents the index of fragility and mmin the minimum value possible for that
index, these parameters will be discussed in detail later.
T0 is often reported to have the same meaning as TK, as it represents the temperature where
the configurational entropy is zero (Shamblin et al., 1999). There are however some
exceptions, as reported previously for sucrose and sorbitol, where the entropy TK was
considerably higher than T0 (Shamblin et al., 1999; Zhou et al., 2002).

Chapter V
173
Relaxation time
The relaxation time, τ, can be calculated by using the Vogel-Tamman-Fulcher (VTF)
equation, in case the storage temperature, T, is higher than the Tg, following the
Equation 5.5,
Equation 5.5
where, τ0 denotes a constant taken as the time scale of atomic vibrations, 10-14
seconds, and
D is Angells strength parameter, as further described.
On the other hand, it is also possible to describe the relaxation time of an amorphous
material below its Tg by introducing a new parameter into the Equation 5.5 called the
fictive temperature, Tf. The new expression is referred as Adam-Gibbs-Vogel (AGV)
equation and appears as shown in Equation 5.6,
Equation 5.6
Tf establishes a relationship between the glass and the supercooled liquid and it is defined
as the temperature at which the glassy system has the same thermodynamic properties as
the equilibrium system (Shamblin et al., 1999). Tf can be calculated from the heat
capacities and the Tg of the glass, (Graeser et al., 2009a; Graeser et al., 2009b), using the
following Equation 5.7 and Equation 5.8,
Equation 5.7
Equation 5.8

Chapter V
174
γCp is a thermodynamic parameter used to characterise fragility of pharmaceutical glass
formers, with values between 0 (for fragile systems) and 1 (for strong materials)
(Hodge, 1996).
Fragility
The viscosity of a supercooled liquid changes with temperature (more drastically at the Tg)
and this relationship can be described by the well-known Arrhenius equation (Macedo and
Litovitz, 1965),
Equation 5.9
where, η is the viscosity, A is the pre-exponential factor, Ea the activation energy, R is the
universal gas constant and T is the absolute temperature.
Fragility indicates how fast structural relaxation increases as a glass becomes closer to the
glass transition region (Yu, 2001). According to Angell (Angell, 1988, 1991), fragility can
be portrayed plotting the log viscosity (η) against Tg/T. From this plot, strong liquids show
a linear relationship (Arrhenius behaviour), whereas fragile glasses have a behaviour that
deviates from linearity (non-Arrhenius behaviour). Therefore, weak glasses having
non-Arrhenius behaviour can undergo structural rearrangements as a function of
temperature, showing higher mobility through the Tg. Based on this property, strong
systems feature m < 40 and fragile systems m > 75.
The fragility index can be calculated using the activation energy of the structural relaxation
at the glass transition (Wang et al., 2002; Crowley and Zografi, 2001), as described by
Equation 5.10,
Equation 5.10
where, ΔETg is the activation energy for structural relaxation at temperatures around Tg.
Significant changes in ΔETg with temperature are characteristic of fragile systems and their
viscosity deviates from the Arrhenius behaviour; on the opposite, for strong systems, the
Chapter V
175
ΔETg changes slightly with the temperature, which follows Arrhenius behaviour
(Angell, 1988).
Due to the scanning rate dependence of the Tg, it is possible to determine the ΔETg from a
plot of ln (q) against 1/Tg, as represented by Equation 5.11,
Equation 5.11
where, q represents the cooling/heating rate and (- ΔETg/R) is the slope of the plot ln (q)
versus 1/Tg.
The minimum possible fragility value, mmin, has been calculated to be 16 and corresponds
to the relaxation of the unrestricted material at Tg, which exactly conforms to the Arrhenius
behaviour (Mao et al., 2006).
Strength Parameter
The fragility of a material can be connected to the strength parameter, D, by the
Equation 5.12 (Graeser et al., 2009b),
Equation 5.12
For strong glass formers, D values are larger (> 30) whilst for fragile glass formers D
values are quite small (< 10).
Glass Forming Ability
Some other parameters can be used to deduce on the physical stability of glassy materials.
The Glass Forming Ability (GFA) is defined as the ease of vitrification of a liquid on
cooling. The minimum cooling rate required to vitrify a material is known as the critical
cooling rate, Rcrit, and it is a widely used factor to measure GFA (Baird et al., 2010).

Chapter V
176
The same authors investigated the crystallisation tendency of 51 organic molecules, by
using DSC, from the undercooled melt state. In the end of their study, they managed to
divide them into three different groups:
Class I – crystallisation observed upon cooling from the supercooled liquid;
Class II – crystallisation detected during reheating above Tg;
Class III – no crystallisation detected either during cooling or reheating.
An additional parameter to assess the GFA is the reduced glass transition temperature Trg
defined in Equation 5.13,
Equation 5.13
Presuming that the viscosity has a constant value at the Tg, materials with higher Trg values
would be expected to have higher viscosity between Tg and Tm and therefore be more
resistant to crystallisation. The increase in viscosity enlarges the timescale for molecularly
rotational and translational motions. As a result, the closer Trg value to 1, the higher is the
GFA of the material.
The aim of this chapter is to characterise amorphous paroxetine HCl using the
aforementioned glassy parameters and establish a possible relationship with the physical
stability observed experimentally for this material. Amorphous paroxetine was prepared
via quench cooling from its hydrochloride (HCl) Form II. Stability studies were carried out
under different relative humidities (RHs) at room temperature for 60 days and evaluated
using modulated temperature DSC (MTDSC), thermogravimetric analysis (TGA), infrared
spectroscopy (ATR-FTIR) and X-ray powder diffraction (XRPD).

Chapter V
177
5.2 Materials and Methods
5.2.1 Materials
Crystalline paroxetine HCl Form II was purchased from Huahai Pharmaceuticals (China)
and was used as received or after being dried over P2O5 as stated. Form II is described to
be a non-stoichiometric hydrate with a melting point of circa 120 oC (as shown in
Chapter 3). Storage environments with different relative humidities (RHs) were prepared
using salt solutions of sodium chloride (75% RH, Fischer Scientific, UK); magnesium
nitrate hexahydrate (53% RH, Fluka, Germany); calcium chloride (33% RH, BDH
Laboratory, UK) and potassium acetate (22% RH, Alfar Aesar, UK). Phosphorus
pentoxide (P2O5) was used as desiccant and was purchased from Alfar Aesar (UK).
5.2.2 Methods
5.2.2.1 Preparation of Amorphous Paroxetine HCl
Quench cooled paroxetine HCl was prepared by melting the crystalline paroxetine HCl
Form II in an aluminium foil placed over a hot plate. The molten sample was kept
isothermal at that temperature for 2 min to ensure a complete melting. After that, the
sample was cooled down rapidly by immersion in nitrogen liquid. For the determination of
Cp, the amorphous paroxetine HCl was prepared in situ the DSC.
5.2.2.2 Thermal Analysis
Differential scanning calorimetry (DSC, Q1000 TA Instruments) analysis was done at
different heating rates (HRs): 2, 5, 10, 20 and 50 oC/min in pinhole pans. Modulated
temperature DSC, (MTDSC, Q1000 TA Instruments) analysis was performed with a HR of
2 oC/min and a modulation of ± 0.318
oC every 60 seconds. Hermetic pans were used for
Chapter V
178
the analyses of fresh and aged samples while standard crimped pans were used for the Cp
measurements.
Thermogravimetric analysis, (TGA, Hi-Res 2950 TA Instruments) with a HR of 10 oC/min
from room temperature to 300 oC was used to determine the water content of the samples.
5.2.2.3 X-Ray Powder Diffraction (XRPD)
XRPD (Thermo-ARL Xtra, Thermo Scientific) spectra were collected from 5.0o to 40.0
o at
2θ.
5.2.2.4 Attenuated Total Reflection-Fourier Transform Infrared (ATR-FTIR)
The infrared spectra of the samples were collected using a Bruker IFS 66/S
spectrophotometer (Bruker Optics Ltd.), with 64 scans being acquired for each sample
from 4000 cm-1
to 550 cm-1
with a resolution of 2 cm-1
.
5.2.2.5 Solubility Measurements
Solubility measurements were performed by adding an excess of drug to distilled water
and stirring for 24 and 72 h at 25 oC. After each time period, the samples were centrifuged
and filtered through a 0.45 μm filter (Henwood et al., 2001; Sugano et al., 2007). The
solutions were then suitably diluted with distilled water and assayed
spectrophotometrically (Lambda XLS UV/VIS, Perkin-Elmer) at 293 nm.
5.2.2.6 Dissolution Studies
Dissolution studies were carried out in 900 mL of 0.1M HCl at 37.0 ± 0.5 oC on a Copley
CIS 8000 dissolution bath (Copley Scientific) with a rotation speed of 50 rpm using the BP
paddle method. Sixty milligrams (60 mg) of each sample were used. At predetermined
intervals, 10 mL of solution was withdrawn and filtered through a 0.45 μm filter.
Subsequently, the filtrate was analysed spectrophotometrically (Lambda XLS UV/VIS,
Perkin-Elmer) at 293 nm. All the dissolution experiments were done under sink conditions.

Chapter V
179
5.2.2.7 Physical Stability
Stability experiments were carried out at 25 oC under different RHs, 0, 22, 33, 53 and 75%.
The range of humidity atmospheres were obtained by using saturated salt solutions, then
stored in proper desiccators and left to equilibrate for a minimum of 24 h prior to storage
of the samples.
5.3 Results and Discussion
5.3.1 Thermodynamic and Kinetic Parameters on the Classification of Paroxetine
HCl as a Glass Former
In the first instance, several thermodynamic and kinetic parameters were obtained for the
amorphous paroxetine HCl prepared in situ the DSC. The values presented in Table 5.1
were obtained directly from the MTDSC measurements or calculated using the expressions
presented in the Introduction section. Standard crimped pans were used to ensure a good
contact between the material and the bottom of the pans. The heat capacities of
supercooled liquid, glass and crystalline paroxetine HCl Form II were obtained by
deconvolution of the total heat flow curve into the non-reversing and reversing (heat
capacity) signals; the Tg value was estimated at the midpoint of half-height of the stepwise
change in the Cp, in the reversing signal. Each calculated parameter is to be described in
more detail in later context.

Chapter V
180
Table 5.1: Thermal and kinetic parameters obtained for amorphous paroxetine HCl.
Heat Capacity Change (ΔCp) and Configurational Heat Capacity (Cp conf)
The changes in the heat capacity at Tg provides a way to infer information on the physical
stability of glassy materials. In general, high ΔCp is characteristic of fragile glasses and this
is due to high molecular motions at Tg, while strong glasses have small ΔCp changes at
glass transition temperature. The increase in the configurational heat capacity, Cp conf can
also be used to classify the materials between strong and fragile liquids. Amorphous
paroxetine HCl showed a ΔCp and Cp conf of 0.31 and 0.47 J/g oC, respectively.
Parameter Value
Tg ± s.d. (oC) 71.1 ± 0.6
ΔCp ± s.d. (J/g oC) 0.31 ± 0.10
Cp conf (J/g oC) 0.47
TKS (oC) 48.8
Tg - TKS 22.2
T0 (oC) 19.7
Trg 0.6
m 107.3
D 6.5
γCp (J/g oC) 0.66
Tf 67.9
τ (AGV) (seconds) 3.26 x 10⁶

Chapter V
181
Figure 5.1 shows the measurement of ΔCp and Cp conf for amorphous paroxetine HCl using
the reversing heat capacity against temperature. Clearly, the higher molecular mobility of
the supercooled liquid is reflected in the higher heat capacities at all temperatures, whereas
the crystalline heat capacities vary almost linearly with temperature.
Figure 5.1: Heat capacity data as a function of temperature for crystalline Form II and
amorphous paroxetine HCl.
Kauzmann Temperature (TK), Zero Mobility Temperature (T0) and Fictive
Temperature (Tf)
The Kauzmann temperature was calculated from an entropy (TKS) base instead of enthalpy
(TKH) base, since the Adam-Gibbs model states that is the configurational entropy that
mostly influences the molecular mobility. As consequence, the TKS is considered to be the
closest to the entropy crisis temperature and therefore all further calculations involving TK
referrers to TKS instead of TKH (Andronis and Zografi, 1998). TK for amorphous paroxetine
Glass
Crystal
Supercooled liquid
0.5
1.0
1.5
2.0
Rev C
p (
J/(
g·°
C))
40 50 60 70 80 90 100 110
Temperature (°C)
Sample: heat capacity TA stand pansSize: 2.4700 mg DSC
File: E:...\heat capacity TA stand pans.003Operator: fatimaRun Date: 11-Jul-2011 10:58Instrument: DSC Q1000 V9.9 Build 303
Universal V4.5A TA Instruments
ΔCp Cp conf

Chapter V
182
HCl was calculated according to Equation 5.1 and had a value of 48.8 oC which was just
≈ 22 oC below its Tg.
The fact that TK gets closer to Tg in fragile liquids leads to a relationship between these two
parameters, TK/Tg which is determinant of the deviation of glass from Arrhenius behaviour.
The ratio lies between 0 (strong) and 1 (fragile). For amorphous paroxetine HCl,
TK/Tg = 0.7 categorising it into a moderate fragile system which is also supported by the
fact that Tg - TKS < 50 oC (Kaushal and Bansal, 2008).
Another aspect is related to the equivalence between TK and T0. Even though both
parameters refer to the temperature where the mobility of glassy materials is minimal and
therefore the stability is maximum, T0 unlike TK has a viscosity base from the VTF
equation. While a majority of organic molecules, have an identical value between T0 and
TK, amorphous paroxetine HCl has a T0 lower (19.7 oC) than TKS (48.8
oC), which implies
that glassy state of paroxetine HCl is greatly influenced by the effect of configurational
entropy.
The fictive temperature, Tf, corresponds to the temperature when the glass and the
equilibrium-supercooled liquid have the same configurational entropy, in other words, it
makes possible the description of the glassy state in comparison to a reference state. Tf can
be used as an alternative approach to predict molecular mobility, with a temperature
dependence bounded by the two extremes of γCp, within the range 0 < γCp < 1. In the
present work, the γCp was calculated as 0.66 J/g oC and Tf is just 3.2
oC below Tg,, which
shows the excess of entropy trapped in the glass formation below its Tg and is a
characteristic of fragile glasses/non-Arrhenius behaviour. For glassy paroxetine HCl, Tf is
mathematically bound to the limits TK < Tf < Tg.
Reduced Glass Transition Temperature, Trg
Assuming that the viscosity at Tg is constant, higher Trg values reflect higher viscosity
between the glass transition temperature and the melting temperature. Therefore, the closer
value of Trg to 1, the more resistant is the material to recrystallisation and higher the glass
forming ability. Amorphous paroxetine HCl has a value of 0.6, and its behaviour during
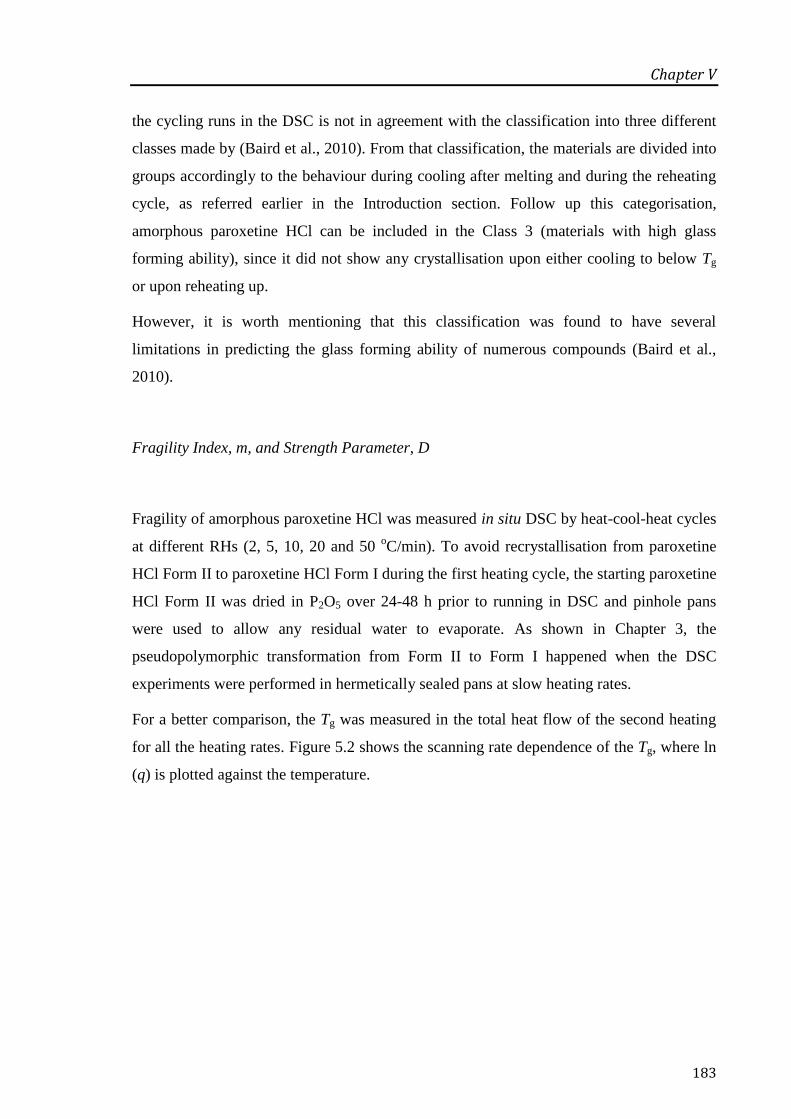
Chapter V
183
the cycling runs in the DSC is not in agreement with the classification into three different
classes made by (Baird et al., 2010). From that classification, the materials are divided into
groups accordingly to the behaviour during cooling after melting and during the reheating
cycle, as referred earlier in the Introduction section. Follow up this categorisation,
amorphous paroxetine HCl can be included in the Class 3 (materials with high glass
forming ability), since it did not show any crystallisation upon either cooling to below Tg
or upon reheating up.
However, it is worth mentioning that this classification was found to have several
limitations in predicting the glass forming ability of numerous compounds (Baird et al.,
2010).
Fragility Index, m, and Strength Parameter, D
Fragility of amorphous paroxetine HCl was measured in situ DSC by heat-cool-heat cycles
at different RHs (2, 5, 10, 20 and 50 oC/min). To avoid recrystallisation from paroxetine
HCl Form II to paroxetine HCl Form I during the first heating cycle, the starting paroxetine
HCl Form II was dried in P2O5 over 24-48 h prior to running in DSC and pinhole pans
were used to allow any residual water to evaporate. As shown in Chapter 3, the
pseudopolymorphic transformation from Form II to Form I happened when the DSC
experiments were performed in hermetically sealed pans at slow heating rates.
For a better comparison, the Tg was measured in the total heat flow of the second heating
for all the heating rates. Figure 5.2 shows the scanning rate dependence of the Tg, where ln
(q) is plotted against the temperature.
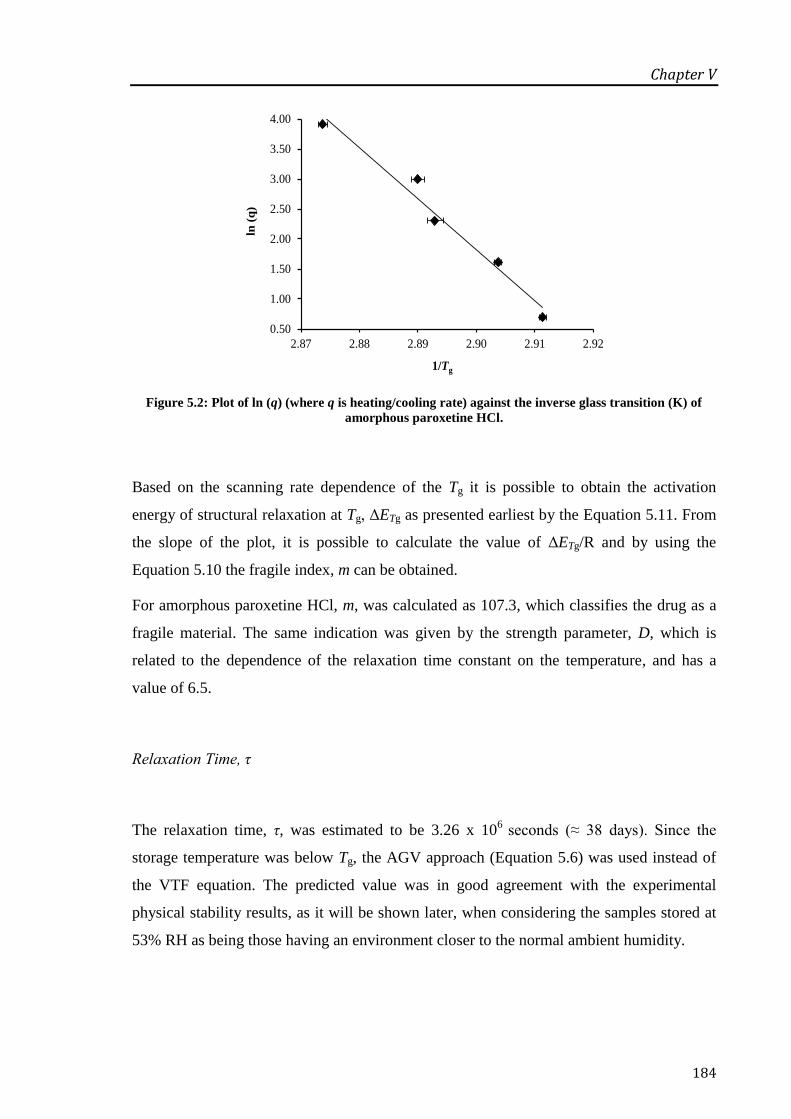
Chapter V
184
Figure 5.2: Plot of ln (q) (where q is heating/cooling rate) against the inverse glass transition (K) of
amorphous paroxetine HCl.
Based on the scanning rate dependence of the Tg it is possible to obtain the activation
energy of structural relaxation at Tg, ΔETg as presented earliest by the Equation 5.11. From
the slope of the plot, it is possible to calculate the value of ΔETg/R and by using the
Equation 5.10 the fragile index, m can be obtained.
For amorphous paroxetine HCl, m, was calculated as 107.3, which classifies the drug as a
fragile material. The same indication was given by the strength parameter, D, which is
related to the dependence of the relaxation time constant on the temperature, and has a
value of 6.5.
Relaxation Time, τ
The relaxation time, τ, was estimated to be 3.26 x 10⁶ seconds (≈ 38 days). Since the
storage temperature was below Tg, the AGV approach (Equation 5.6) was used instead of
the VTF equation. The predicted value was in good agreement with the experimental
physical stability results, as it will be shown later, when considering the samples stored at
53% RH as being those having an environment closer to the normal ambient humidity.
0.50
1.00
1.50
2.00
2.50
3.00
3.50
4.00
2.87 2.88 2.89 2.90 2.91 2.92
ln (
q)
1/Tg
Chapter V
185
5.3.2 Characterisation of Freshly Prepared Amorphous Paroxetine HCl
5.3.2.1 Thermal Response of Amorphous Paroxetine HCl
For the solubility, dissolution and stability studies, amorphous (quench cooled, QC)
paroxetine HCl was prepared by cooling from the melt in nitrogen liquid. The freshly
prepared sample was analysed with MTDSC in hermetic pans. It showed a single glass
transition event at 51.2 oC and no signal of recrystallisation or melting was observed, the
results presented in Table 5.2. The differences in the Tg and ΔCp between the sample
prepared in situ the DSC and the sample prepared by quench cooling method in nitrogen
liquid, were probably due to the exposure to atmospheric humidity conditions which led to
the adsorption of water molecules and thus lowered the Tg. The enthalpy of relaxation
(ΔHrelax) was measured in the non-reversing signal.
Table 5.2: Thermal properties and water content of the freshly prepared amorphous
paroxetine HCl.
5.3.2.2 ATR-FTIR and XRPD Characterisation of Amorphous Paroxetine HCl
Paroxetine HCl Form II has two bands in the 3700-3200 cm-1
range that can be assigned to
O-H groups in different chemical environments (as shown in Chapter 3). In the fully
Parameter Value
Tg ± s.d. (oC) 51.2 ± 0.6
ΔCp ± s.d. (J/g oC) 0.28 ± 0.06
ΔHrelax ± s.d. (J/g) 2.5 ± 0.7
Water content ± s.d. (%) 0.87 ± 0.13

Chapter V
186
amorphous QC sample, these two bands were missed and in the rest of the spectrum some
peaks appeared broadened or simply disappeared, which is characteristic of this kind of
state (data not shown). These results were confirmed by the XRPD data that showed the
absence of crystalline peaks from the starting paroxetine HCl Form II within the range 5o to
40o, 2θ and the appearance as halo pattern (data not shown).
5.3.3 Drug Performance Assessment
5.3.3.1 Solubility Measurements
Assessing the aqueous solubility of amorphous materials can represent a challenge and a
practical problem to the formulator. The primary and most frequent obstacle is the high
tendency for amorphous materials to suffer phase transformation towards a thermodynamic
more stable form during the experimental measurement process (Murdande et al., 2011).
In this work, as presented in Figure 5.3, the aqueous solubility of amorphous paroxetine
HCl was determined after 24 and 72 h isothermal stirring time. The measured apparent
solubility of the glassy paroxetine showed, in both sampling times, a lower value than the
crystalline starting material paroxetine HCl Form II, but still higher than the aqueous
solubility of paroxetine HCl Form I. This low apparent solubility can be ascribed to the
recrystallisation, in the media, to the more stable and less soluble crystalline hydrate form,
paroxetine HCl Form I.
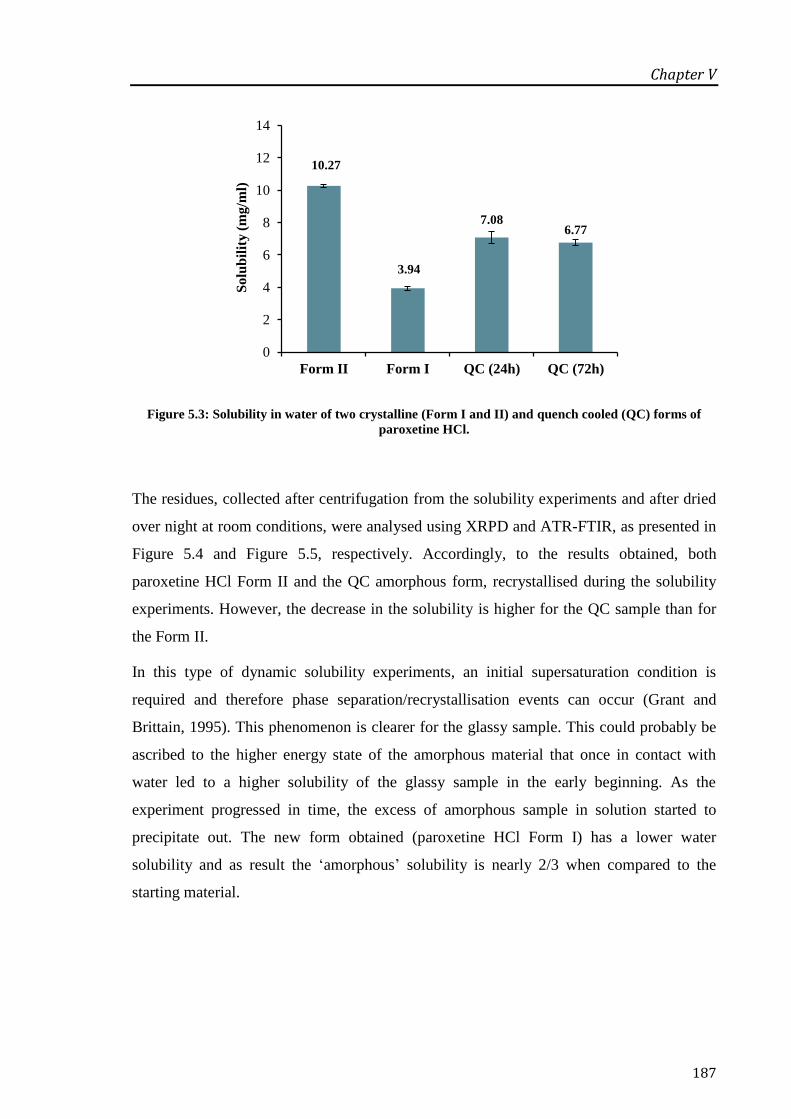
Chapter V
187
Figure 5.3: Solubility in water of two crystalline (Form I and II) and quench cooled (QC) forms of
paroxetine HCl.
The residues, collected after centrifugation from the solubility experiments and after dried
over night at room conditions, were analysed using XRPD and ATR-FTIR, as presented in
Figure 5.4 and Figure 5.5, respectively. Accordingly, to the results obtained, both
paroxetine HCl Form II and the QC amorphous form, recrystallised during the solubility
experiments. However, the decrease in the solubility is higher for the QC sample than for
the Form II.
In this type of dynamic solubility experiments, an initial supersaturation condition is
required and therefore phase separation/recrystallisation events can occur (Grant and
Brittain, 1995). This phenomenon is clearer for the glassy sample. This could probably be
ascribed to the higher energy state of the amorphous material that once in contact with
water led to a higher solubility of the glassy sample in the early beginning. As the
experiment progressed in time, the excess of amorphous sample in solution started to
precipitate out. The new form obtained (paroxetine HCl Form I) has a lower water
solubility and as result the ‘amorphous’ solubility is nearly 2/3 when compared to the
starting material.
10.27
3.94
7.086.77
0
2
4
6
8
10
12
14
Form II Form I QC (24h) QC (72h)
Solu
bil
ity (
mg/m
l)

Chapter V
188
350 300 2500 1500 1000
Ab
sorb
an
ce u
nit
s
G:\Fátima\RESEARCH 12122012\RESULTS\FTIR-ATR\Solub residue\0710211\SOLB HEMI RESIDUE.sp
G:\Fátima\RESEARCH 12122012\RESULTS\FTIR-ATR\Solub residue\0710211\SOLB POL A RESIDUE.sp
G:\Fátima\RESEARCH 12122012\RESULTS\FTIR-ATR\Solub residue\0710211\SOLB QC RESIDUE.sp
G:\Fátima\RESEARCH 12122012\RESULTS\FTIR-ATR\CALIB CURV paroxetine I in II\1 Form I.0 GELUCIRE DLaTGS, KBr-BMS, Globar, IFS 66
07-10-2011
07-10-2011
07-10-2011
02-07-2012
15002000250030003500
cm-1
0.0
0.2
0.4
0.6
0.8
1.0
1.2
1.4
A
Page 1/1
G:\Fátima\RESEARCH 12122012\RESULTS\FTIR-ATR\Solub residue\0710211\SOLB HEMI RESIDUE.sp
G:\Fátima\RESEARCH 12122012\RESULTS\FTIR-ATR\Solub residue\0710211\SOLB POL A RESIDUE.sp
G:\Fátima\RESEARCH 12122012\RESULTS\FTIR-ATR\Solub residue\0710211\SOLB QC RESIDUE.sp
G:\Fátima\RESEARCH 12122012\RESULTS\FTIR-ATR\CALIB CURV paroxetine I in II\1 Form I.0 GELUCIRE DLaTGS, KBr-BMS, Globar, IFS 66
07-10-2011
07-10-2011
07-10-2011
02-07-2012
100015002000
cm-1
0.0
0.2
0.4
0.6
0.8
1.0
1.2
1.4
A
Page 1/1
Wavenumber (cm-1
)
Figure 5.4: XRPD data of paroxetine HCl Form I and the solubility residues,
collected after centrifugation from the solubility measurements of Form II and quench cooled (QC).
Figure 5.5: ATR-FTIR spectra of the solubility residues (amorphous QC paroxetine HCl, Form II and
Form I) collected after the solubility experiments (72 h stirring at 25 oC) and
paroxetine HCl Form I (upwards).
5 10 15 20 25 30 35 40
Inte
nsi
ty
2θ (degree)
Form I
Form II residue
QC residue

Chapter V
189
Even though the residue obtained from the paroxetine HCl Form II solubility experiments
corresponded as well to the stable Form I, the solubility of this form still being higher
when compared to the Form I. This can be readily explained because the recrystallisation
just took place in the excess of sample added to prepare a saturated solution. Therefore, the
lower solubility of paroxetine HCl Form II in comparison with the amorphous sample
made the amount of Form II required to create a supersaturation solution lower than in the
case of the amorphous sample.
5.3.3.2 Dissolution Studies
In contrast to the aqueous solubility results, the dissolution studies showed a clear
enhancement on the extent of the dissolution rate of the drug, when the amorphous form
was compared to the crystalline forms (Figure 5.6). The difference can be explained by the
immediate dissolution of the amorphous form once it contacts the dissolution medium and
there is no time for recrystallisation to occur.
Figure 5.6: Dissolution profiles of Form I, Form II and quench cooled (QC) paroxetine HCl
in 0.1M HCl.
0
10
20
30
40
50
60
70
80
90
100
110
0 10 20 30 40 50 60
Dru
g r
elea
se (
%)
Time (min)
QC
Form I
Form II

Chapter V
190
5.3.4 Response of Amorphous Paroxetine HCl Below Tg and Under Different
Humidity Conditions
Ageing experiments represent a crucial step during the development of any amorphous
API, establishing a physical and chemical stability profile. Even though, below Tg,
translational molecular motions are slower than above Tg, they still occur and can
obviously influence the life time of these materials.
In this study, since the Tg of QC paroxetine HCl was found to be 51.2 oC, its stability
behaviour was studied at room temperature (≈ 25 oC), so well below Tg and under the
influence of different RHs environments.
5.3.4.1 Recrystallisation Behaviour of Paroxetine HCl from the Amorphous State
The samples stored in 0% RH did not show, during all the experimental time (2 months),
any signal of recrystallisation, being only possible to identify during the heating cycle in
the DSC, a glass transition phenomena. On the opposite, the samples stored at 75% RH
were completely recrystallised after 24 h, accordingly to DSC data, into the most stable
paroxetine HCl Form I, with an onset melting temperature around 140 oC.
Apart from the samples stored under these two extreme humidity conditions (0 and
75% RH), all the others showed a glass transition event, which reduces as the relative
humidity increases, followed by a recrystallisation exotherm and in the end a fusion
endotherm, as can be observed below in Figure 5.7. It was also noticed that the shape of
the recrystallisation peaks and the temperature at which the recrystallisation occurred,
changed with the storage humidity. As the humidity increased the exotherm peak became
sharper and appeared at lower temperatures, in contrast to what happened with the
22% RH samples that showed a broad appearance at much higher range of temperatures.

Chapter V
191
Figure 5.7: MTDSC heating cycle traces of amorphous quench cooled paroxetine HCl aged at 25 oC
under different RHs, as stated, for 48 h; hermetic pans were used.
5.3.4.2 Water Content
The water content was measured by TGA and the results are presented in Figure 5.8. For
the samples stored under 0, 22 and 33% RH the amount of water remained nearly constant
for all samples. The water content can also be used as a measure of the recrystallisation
extent, as shown by the samples stored at 53% RH. These samples showed higher water
content until 14 days of storage with a decrease afterwards, indicating that most of the
sample was recrystallised after that period. These results are in agreement with the DSC
experiments where the ΔHrec decreased significantly after 30 days of storage as a meaning
of isothermal recrystallisation prior the DSC test, as shown later in this study. In fact, the
amorphous-crystalline transition reveals a great reduction in the water sorption capacity of
the crystalline material when compared with the amorphous state.
For the samples stored at 75% RH, the amount of water remained constant since the first
day of storage (2.19–2.87% w/w) due to its nearly complete recrystallisation. In addition,
22%RH
33%RH
53%RH
-1.5
-1.0
-0.5
0.0
0.5
Heat F
low
(W
/g)
-20
0
20
40
60
80
100
120
140
160
Temperature (°C)
Exo Up
Universal V4.5A TA Instruments
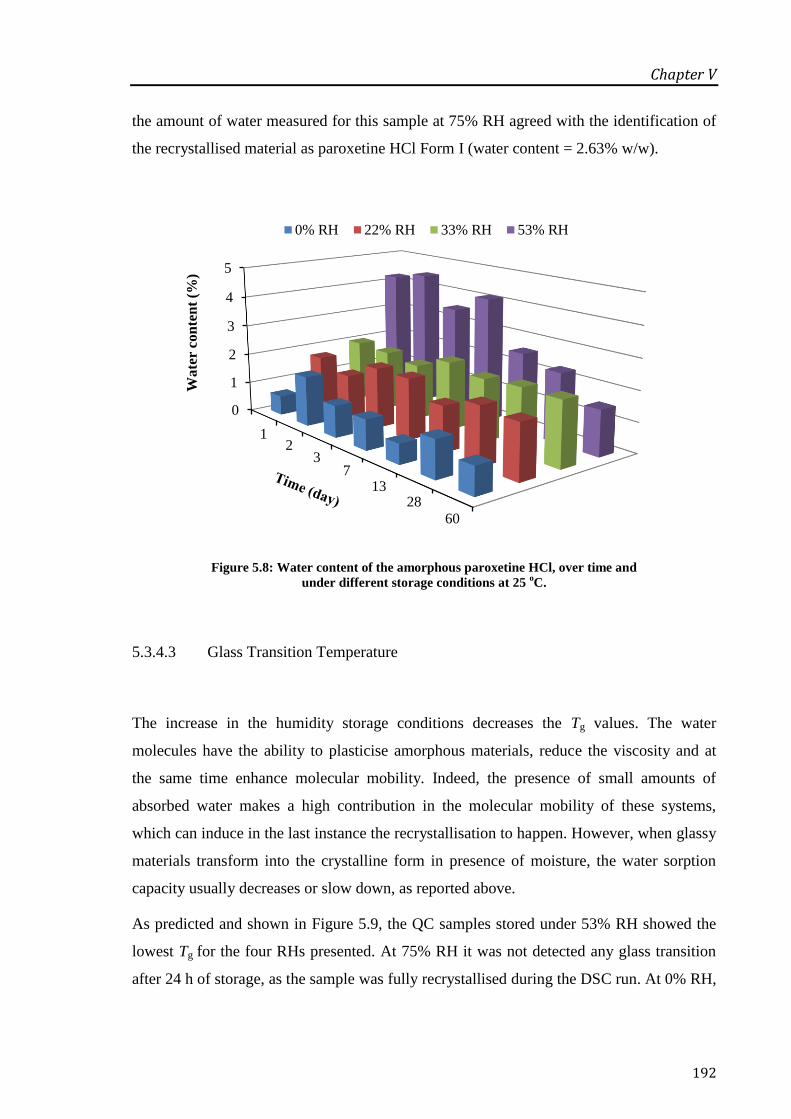
Chapter V
192
the amount of water measured for this sample at 75% RH agreed with the identification of
the recrystallised material as paroxetine HCl Form I (water content = 2.63% w/w).
Figure 5.8: Water content of the amorphous paroxetine HCl, over time and
under different storage conditions at 25 oC.
5.3.4.3 Glass Transition Temperature
The increase in the humidity storage conditions decreases the Tg values. The water
molecules have the ability to plasticise amorphous materials, reduce the viscosity and at
the same time enhance molecular mobility. Indeed, the presence of small amounts of
absorbed water makes a high contribution in the molecular mobility of these systems,
which can induce in the last instance the recrystallisation to happen. However, when glassy
materials transform into the crystalline form in presence of moisture, the water sorption
capacity usually decreases or slow down, as reported above.
As predicted and shown in Figure 5.9, the QC samples stored under 53% RH showed the
lowest Tg for the four RHs presented. At 75% RH it was not detected any glass transition
after 24 h of storage, as the sample was fully recrystallised during the DSC run. At 0% RH,
0
1
2
3
4
5
12
37
1328
60
Wa
ter
con
ten
t (%
)
0% RH 22% RH 33% RH 53% RH

Chapter V
193
there is a slight increase in the Tg, certainly due to the dry of small quantities of water
eventually present prior to storage.
Figure 5.9: Changes in the Tg of quench cooled paroxetine HCl over time and
under different RHs conditions.
5.3.4.4 Recrystallisation Temperature
The increase in the humidity, lead the amorphous materials to devitrify and promote the
nucleation to happen. The transformation from glass to rubber, facilitate the crystal seeds
to grow, what can be observed by the decrease in the recrystallisation temperature, Trec at
higher humidity. Indeed, as shown in Figure 5.10 the samples at 53% RH, showed the
lowest recrystallisation temperature. This can be explained by the presence of higher
nucleation seeds what facilitates the recrystallisation process and thereby lower
temperature is needed for the crystal formation.
0 10 20 30 40 50 60 700
10
20
30
40
50
60
70
Tg(o
C)
Time (day)
0% RH
22% RH
33% RH
53% RH

Chapter V
194
Figure 5.10: Recrystallisation temperature (onset values) profiles
for the samples stored under 22, 33 and 53% RH for 60 days.
5.3.4.5 Enthalpy of Recrystallisation
In Figure 5.11 is presented the variation on the enthalpy of recrystallisation, ΔHrec, for the
different samples stored under different humidity environments.
McGarvey et al. (McGarvey et al., 2003) studied the non-isothermal behaviour of
amorphous α-trehalose with a particular emphasis on the effects of the DSC pan type used
and initial water content of the samples. They observed that samples with higher water
content showed lower enthalpy and recrystallisation temperatures. These results are
partially in agreement with the findings in this study. In fact, the recrystallisation
temperature decreased as the RH increased, although the ΔHrec did not follow the same
trend.
The QC samples stored at 33% RH have the higher ΔHrec whereas the ones at 22% RH
have the lowest. Surprisingly the 53% RH samples have an enthalpy of recrystallisation in
between the other two. Considering that a lower value of ΔHrec is a meaning of lower
amorphous content ‘ready’ to recrystallise, this is true for the samples at 22% RH. The
0 10 20 30 40 50 60 7030
40
50
60
70
80
90
100
110
120
Tre
c (0C
)
Time (day)
22% RH
33% RH
53% RH

Chapter V
195
water vapour at this humidity was not high enough to devitrify large amounts of glass and
therefore low ΔHrec upon heating. The explanation for what happen with the samples at
33% and 53% RH, has probably to be with different disorder stages of the glass under
these conditions.
Figure 5.11: Enthalpy of recrystallisation at different storage conditions up to 60 days.
The 53% RH samples overcome through a rubbery state after a short time of storage, the
molecular mobility is then reduced and the energy barrier created by the enhancement in
the viscosity reduces the tendency for the crystals to growth even though the initial amount
of crystal seeds is high, thus, lower value of ΔHrec. This was just observed during the first
13 days of storage. After that the ΔHrec of the 53% RH samples showed a big drop, even
below the 22% RH ones, since most of the sample completely recrystallised.
For the samples at 33% RH, the higher ΔHrec by comparison with the 53% RH samples,
could possibly be explained by the higher degree of disorder together with the fact that
these samples have not yet been converted into a rubbery state. This could, therefore,
generate a high exothermic enthalpy upon recrystallisation. A similar interpretation was
0 10 20 30 40 50 60 700
10
20
30
40
50
60
70
80
90
100
H
rec (
J/g
)
Time (day)
22% RH
33% RH
53% RH

Chapter V
196
obtained by Graeser et. al (Graeser et al., 2008), when they compared amorphous
simvastatin prepared by two different techniques (cryomilling and quench cooling).
5.3.4.6 ATR-FTIR Analysis
ATR-FTIR was used to monitorise the isothermal recrystallisation of QC paroxetine HCl.
The samples stored at low RH (0, 22 and 33%) remained amorphous during the total
experimental time without any characteristic crystalline peak being observed. Though, an
interesting observation was detected for the samples under 53 and 75% RH.
For the samples stored at 75% RH (Figure 5.12) the process of recrystallisation did not
progress in one-step from the amorphous to the most stable crystalline form (Form I),
being observed an intermediate state between these two forms, as explained next. At these
conditions, the process of recrystallisation undergoes from the amorphous material to a
mixture between paroxetine HCl Form II and Form I, which took place in the first 3 days
of storage and after that, only Form I was detected. The evidences that Form II is present
are related to the following peaks characteristics of that form: the single sharp peak at high
wavenumber 3630 cm-1
and the peak at 665 cm-1
. Gradually, the peak at a high
wavenumber disappeared
and a peak at 3334 cm-1
started to appear until the
recrystallisation to Form I was completed. The same happened with two peaks at lower
wavenumber, disappearance of the peak at 665 cm-1
and appearance of the peak at
675 cm-1
, characteristic of Form I. In addition, the appearance of the peak around
1550 cm-1
after the 1st day and its disappearance on the 7
th day of storage, assigned to the
O-H bending vibration from the weakly bound water, indicates that the process of
recrystallisation happened via the formation of the non-stoichiometric hydrate Form II.
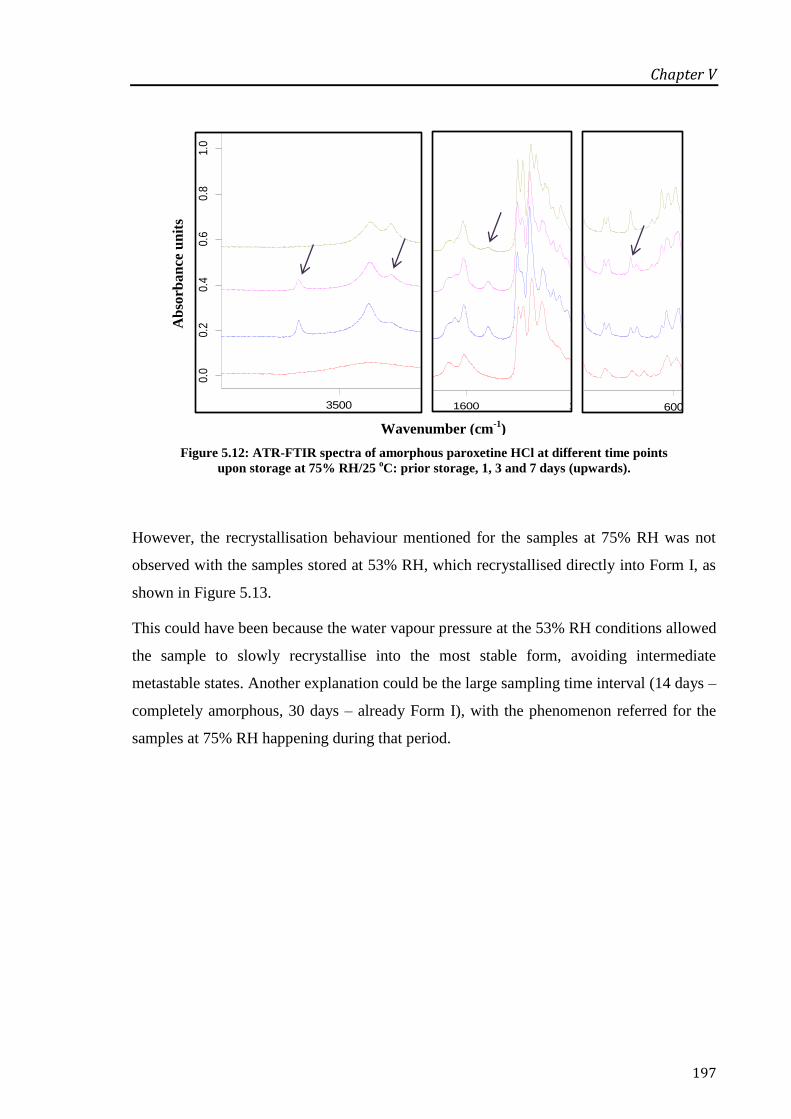
Chapter V
197
G:\Fátima\RESEARCH 12122012\Thesis_14012013\Chapter 5\Results\ATR-FTIR\QC\QC Stability\24h\QC_24H_75%RH.0
G:\Fátima\RESEARCH 12122012\Thesis_14012013\Chapter 5\Results\ATR-FTIR\QC\QC\AMORPHOUS PXT BY QUENCH COOLING DRY SAMPLE2.0 DLaTGS, KBr-BMS, Globar, IFS 66
G:\Fátima\RESEARCH 12122012\Thesis_14012013\Chapter 5\Results\ATR-FTIR\QC\QC Stability\72h\QC 72h_75%RH.0
G:\Fátima\RESEARCH 12122012\Thesis_14012013\Chapter 5\Results\ATR-FTIR\QC\QC Stability\7 days\QC@75%RH_7D.0 DLaTGS, KBr-BMS, Globar, IFS 66
24-11-2010
26-08-2011
22-11-2010
22-06-2011
6008001000120014001600
Wavenumber cm-1
0.0
0.2
0.4
0.6
0.8
1.0
1.2
Abs
orba
nce
Uni
ts
Page 1/1
G:\Fátima\RESEARCH 12122012\Thesis_14012013\Chapter 5\Results\ATR-FTIR\QC\QC Stability\24h\QC_24H_75%RH.0
G:\Fátima\RESEARCH 12122012\Thesis_14012013\Chapter 5\Results\ATR-FTIR\QC\QC\AMORPHOUS PXT BY QUENCH COOLING DRY SAMPLE2.0 DLaTGS, KBr-BMS, Globar, IFS 66
G:\Fátima\RESEARCH 12122012\Thesis_14012013\Chapter 5\Results\ATR-FTIR\QC\QC Stability\72h\QC 72h_75%RH.0
G:\Fátima\RESEARCH 12122012\Thesis_14012013\Chapter 5\Results\ATR-FTIR\QC\QC Stability\7 days\QC@75%RH_7D.0 DLaTGS, KBr-BMS, Globar, IFS 66
24-11-2010
26-08-2011
22-11-2010
22-06-2011
2000250030003500
Wavenumber cm-1
0.0
0.2
0.4
0.6
0.8
1.0
1.2
Abs
orba
nce
Uni
ts
Page 1/1
Figure 5.12: ATR-FTIR spectra of amorphous paroxetine HCl at different time points
upon storage at 75% RH/25 oC: prior storage, 1, 3 and 7 days (upwards).
However, the recrystallisation behaviour mentioned for the samples at 75% RH was not
observed with the samples stored at 53% RH, which recrystallised directly into Form I, as
shown in Figure 5.13.
This could have been because the water vapour pressure at the 53% RH conditions allowed
the sample to slowly recrystallise into the most stable form, avoiding intermediate
metastable states. Another explanation could be the large sampling time interval (14 days –
completely amorphous, 30 days – already Form I), with the phenomenon referred for the
samples at 75% RH happening during that period.
Wavenumber (cm-1
)
Ab
sorb
an
ce u
nit
s
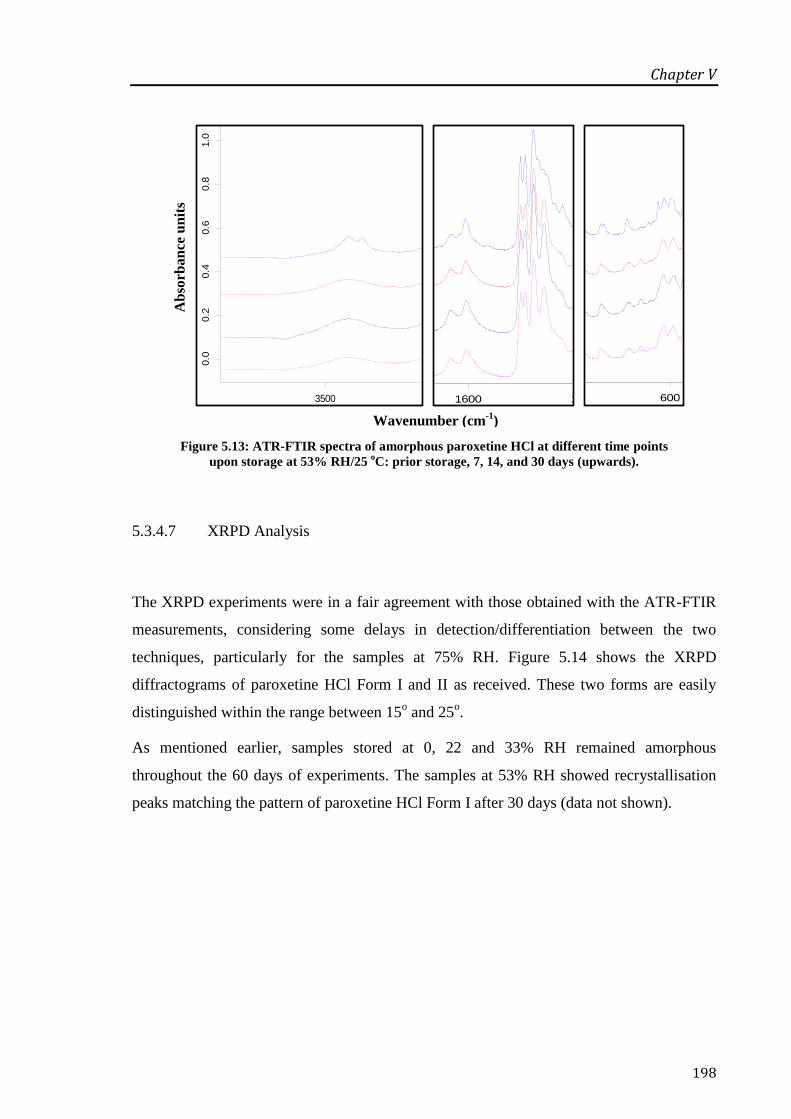
Chapter V
198
Figure 5.13: ATR-FTIR spectra of amorphous paroxetine HCl at different time points
upon storage at 53% RH/25 oC: prior storage, 7, 14, and 30 days (upwards).
5.3.4.7 XRPD Analysis
The XRPD experiments were in a fair agreement with those obtained with the ATR-FTIR
measurements, considering some delays in detection/differentiation between the two
techniques, particularly for the samples at 75% RH. Figure 5.14 shows the XRPD
diffractograms of paroxetine HCl Form I and II as received. These two forms are easily
distinguished within the range between 15o and 25
o.
As mentioned earlier, samples stored at 0, 22 and 33% RH remained amorphous
throughout the 60 days of experiments. The samples at 53% RH showed recrystallisation
peaks matching the pattern of paroxetine HCl Form I after 30 days (data not shown).
G:\Fátima\RESEARCH 12122012\Thesis_14012013\Chapter 5\Results\ATR-FTIR\QC\QC Stability\48h\QC_48h_53%RH.0
G:\Fátima\RESEARCH 12122012\Thesis_14012013\Chapter 5\Results\ATR-FTIR\QC\QC Stability\13Days\QC_13days_53%RH.0
G:\Fátima\RESEARCH 12122012\Thesis_14012013\Chapter 5\Results\ATR-FTIR\QC\QC Stability\28D\QC@53%RH_28D.0 DLaTGS, KBr-BMS, Globar, IFS 66
G:\Fátima\RESEARCH 12122012\Thesis_14012013\Chapter 5\Results\ATR-FTIR\QC\QC\AMORPHOUS PXT BY QUENCH COOLING DRY SAMPLE2.0 DLaTGS, KBr-BMS, Globar, IFS 66
13-12-2010
07-12-2010
13-07-2011
26-08-2011
2000250030003500
Wavenumber cm-1
0.0
0.2
0.4
0.6
0.8
1.0
1.2
Absorb
ance U
nits
Page 1/1
G:\Fátima\RESEARCH 12122012\Thesis_14012013\Chapter 5\Results\ATR-FTIR\QC\QC Stability\48h\QC_48h_53%RH.0
G:\Fátima\RESEARCH 12122012\Thesis_14012013\Chapter 5\Results\ATR-FTIR\QC\QC Stability\13Days\QC_13days_53%RH.0
G:\Fátima\RESEARCH 12122012\Thesis_14012013\Chapter 5\Results\ATR-FTIR\QC\QC Stability\28D\QC@53%RH_28D.0 DLaTGS, KBr-BMS, Globar, IFS 66
G:\Fátima\RESEARCH 12122012\Thesis_14012013\Chapter 5\Results\ATR-FTIR\QC\QC\AMORPHOUS PXT BY QUENCH COOLING DRY SAMPLE2.0 DLaTGS, KBr-BMS, Globar, IFS 66
13-12-2010
07-12-2010
13-07-2011
26-08-2011
6008001000120014001600
Wavenumber cm-10.
00.
20.
40.
60.
81.
01.
2
Abs
orba
nce
Uni
ts
Page 1/1
G:\Fátima\RESEARCH 12122012\Thesis_14012013\Chapter 5\Results\ATR-FTIR\QC\QC Stability\48h\QC_48h_53%RH.0
G:\Fátima\RESEARCH 12122012\Thesis_14012013\Chapter 5\Results\ATR-FTIR\QC\QC Stability\13Days\QC_13days_53%RH.0
G:\Fátima\RESEARCH 12122012\Thesis_14012013\Chapter 5\Results\ATR-FTIR\QC\QC Stability\28D\QC@53%RH_28D.0 DLaTGS, KBr-BMS, Globar, IFS 66
G:\Fátima\RESEARCH 12122012\Thesis_14012013\Chapter 5\Results\ATR-FTIR\QC\QC\AMORPHOUS PXT BY QUENCH COOLING DRY SAMPLE2.0 DLaTGS, KBr-BMS, Globar, IFS 66
13-12-2010
07-12-2010
13-07-2011
26-08-2011
6008001000120014001600
Wavenumber cm-1
0.0
0.2
0.4
0.6
0.8
1.0
1.2
Abs
orba
nce
Uni
ts
Page 1/1
Wavenumber (cm-1
)
Ab
sorb
an
ce
un
its

Chapter V
199
Figure 5.14: X-ray diffractograms of paroxetine HCl Form I and II, as received.
The samples under 75% RH (Figure 5.15) showed after 7 days a pattern, which revealed a
mixture of Forms I and II. After 60 days, the XRPD diffractogram was to the pattern of
Form I, especially considering the range between 20-25o. The poor quality of the spectra
was related to the hardness of the sample and the difficulty in obtaining a complete flat
surface, ideal for X-ray measurements.
Figure 5.15: XRPD diffraction data collect at different time points (in day)
for the quench cooled paroxetine HCl sample stored under 75% RH.
5 10 15 20 25 30 35 40
Inte
nsi
ty
2θ (degree)
Form I
Form II
5 10 15 20 25 30 35 40
Inte
nsi
ty
2θ (degree)
60
7
3
2
1
Chapter V
200
5.4 Conclusions
The use of thermal methods has demonstrated to be a powerful approach to predict the
physical stability of amorphous compounds. In this chapter, a range of thermodynamic and
kinetic parameters were used to characterise amorphous paroxetine HCl prepared via
quench cooling. Overall, parameters determined by using DSC such as configurational heat
capacity, fragility index and strength parameter classified amorphous paroxetine HCl as a
fragile glass former. Moreover, the close value of TK to Tg, and the non-equivalence to T0,
indicated that glassy paroxetine HCl is greatly influenced by the effect of configuration
entropy. This finding was also supported by the fact that at a storage temperature of 25 oC,
the Tf was only 3.2 oC below Tg indicating that under these storage conditions the glass still
has a considerable degree of configurational entropy, which can be linked to a significant
molecular mobility and therefore instability.
Although all the above parameters constitute a source of valuable information when
dealing with amorphous materials they must be considered carefully as they do not account
the influence of humidity, which has a crucial influence on the stability of this kind of
compounds. In the present work, storage under different humidity environments proved not
only to influence the rate, but also, the pathway of recrystallisation. The non-isothermal
recrystallisation studies observed in DSC showed that the samples stored at 53% RH
started to recrystallise at a lower temperature and over a narrow temperature range.
Moreover, according to the ATR-FTIR results, these samples were found to recrystallise
directly to the stable Form I, whereas the samples under 75% RH recrystallised via a
metastable Form II.
The instability of the glassy paroxetine HCl was also noticed upon prolonged exposure to
water during the solubility measurements. The measured solubility of amorphous
paroxetine HCl was lower than the starting crystalline Form II, which was ascribed to the
recrystallisation to the most stable Form I. This behaviour was not observed during the
dissolution tests. Although it is important to bear in mind that in vivo the recrystallisation
to the stable hydrate can occur.

6 MISCIBILITY PREDICTION AND THE INFLUENCE OF
PREPARATION METHODS ON THE PROCESSING
OF PSEUDOPOLYMORPHS OF PAROXETINE HCL

Chapter VI
202
Abstract
This chapter presents a theoretical and practical perspective of processing two
pseudopolymorphs (Form I and II) of the same drug (paroxetine HCl) using different
preparation techniques, with particular attention being paid to the performance and stability
of each system. A non-solvent process, hot melt extrusion (HME), and a solvent method,
spray drying (SD), were used to convert the two crystalline hydrates into an amorphous
solid dispersion, using polyvinylpyrrolidone vinyl-acetate (PVPVA) as a carrier. Standard
differential scanning calorimetry (DSC) and modulated temperature DSC (MTDSC) were
used to characterise physical mixtures (PMs), fresh and aged solid dispersions, in
combination with thermogravimetric analysis (TGA), dynamic vapour sorption (DVS),
X-ray powder diffraction (XRPD) and attenuated total reflection-Fourier transform
infrared (ATR-FTIR) techniques. Theoretical predictions of drug-polymer miscibility were
carried out using melting point depression (MPD) approach. MPD method suggested that
Form I of paroxetine HCl favours a miscible system with PVPVA while Form II is inclined
to generate an immiscible system with the same polymer as no depression on the onset
melting point of this form was observed in the presence of the polymer. However, the
corresponding experimental data showed a single Tg in DSC and a halo pattern in XRPD
for both samples prepared from SD and HME, indicating the formation of a molecular
dispersion. Although fully amorphous dispersions were prepared by both SD and HME
methods, the Form I and Form II systems showed different dissolution and long term
stability profiles. More specifically, in the case of Form I, HME formulations showed a
lower release rate in the beginning of the test when compared to the SD, PMs and pure
crystalline drug. In the case of Form II systems, HME showed the same release profile as
the pure crystalline form, but also lower than SD and PMs. The lower release observed for
the HME over the SD samples might be related to the differences in the diffusion of the
dissolution media into the microparticles (63-106 μm). Regarding stability under storage,
all the samples kept at 75% RH/25 oC recrystallised into the sable Form I, confirmed by
FTIR, though they exhibit different crystallisation rates, with spray dried samples showing
a higher tendency to recrystallise. The recrystallisation profile of the HME samples was
different for the Form I and Form II systems, with the former presenting a slower rate.

Chapter VI
203
6.1 Introduction
Pharmaceutical formulations of a drug product should be physically and chemically stable,
manufacturable, and the drug entity made bioavailable. Although, active pharmaceutical
ingredients (APIs), and also excipients, exhibit polymorphism or pseudopolymorphism, the
thermodynamically most stable form is, in general, selected for development. However,
there are several situations in which the development of a metastable form is desirable,
namely to achieve rapid absorption and efficacy, or acceptable systemic exposure for a
low-solubility drug. The term polymorphism, describes the ability of a compound to
crystallise in more than one form (Haleblian and McCrone, 1969). On the other hand,
pseudopolymorphism is used to avoid confusion with ‘true polymorphs’ and describes
crystalline compounds that have a heterogeneous unit cell with solvent molecules within it,
such as the case of hydrates, when the solvent is water (Brittain, 2009).
Recently, particular attention has being paid to the transformation of crystalline APIs into
amorphous phase by the manufacture of solid dispersions by different methods. In solid
dispersion technologies, the drug is incorporated into a hydrophilic carrier, theoretically at
molecular level, leading to a loss of crystal lattice energy, thereby increasing dissolution
rate of the drug. Several parameters are of great importance when designing an amorphous
solid dispersion formulation such as, the method of preparation used, the physicochemical
properties of the selected polymer and, with less focus in the available literature, the
intellectual properties of the starting material, namely water content and crystalline form.
In this study, two pseudopolymorphs (Forms I and II) of the same drug, paroxetine HCl,
were chosen as model drug, which allowed to evaluate the influence of the initial
crystalline state on the prepared system. Paroxetine HCl Form I is a stable hemihydrate
whereas Form II is a non-stoichiometric hydrate and considered metastable to Form I. The
polymer selected was polyvinylpyrrolidone vinyl-acetate 6:4 (PVPVA) due to its vast use
in pharmaceutical research, especially in the preparation of solid dispersions, and relatively
low hygroscopic behaviour compared to the homopolymer polyvinylpyrrolidone based
polymers.
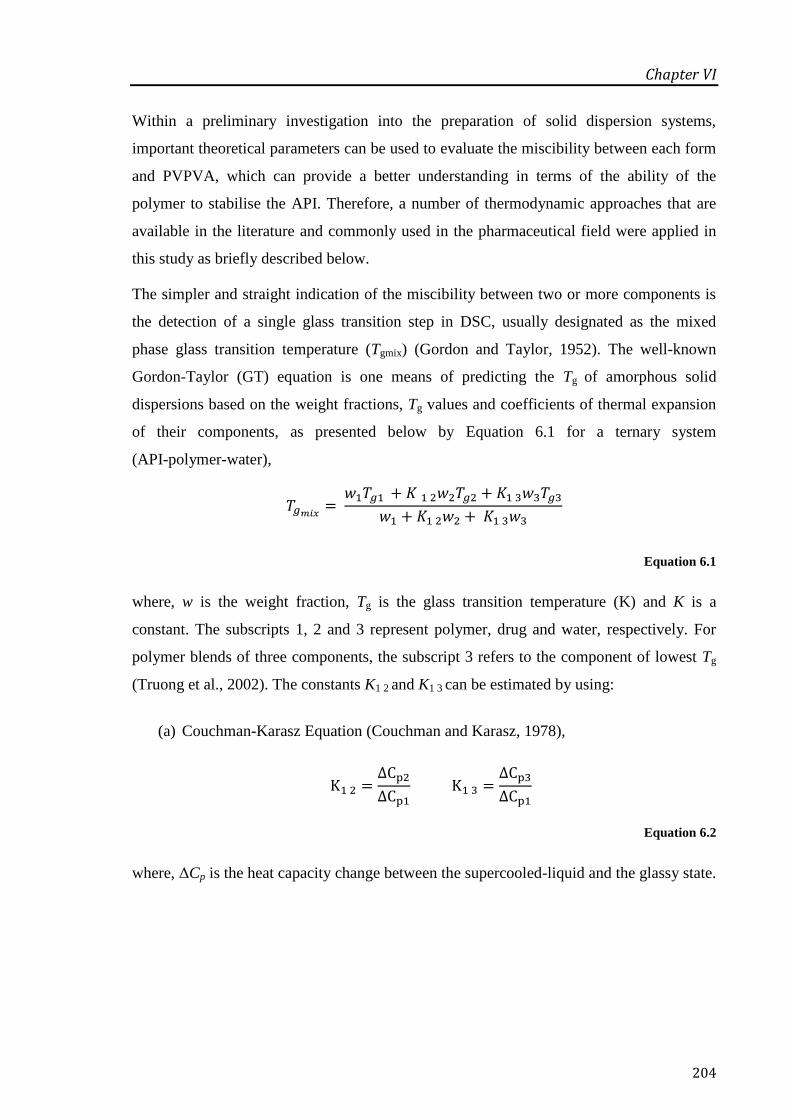
Chapter VI
204
Within a preliminary investigation into the preparation of solid dispersion systems,
important theoretical parameters can be used to evaluate the miscibility between each form
and PVPVA, which can provide a better understanding in terms of the ability of the
polymer to stabilise the API. Therefore, a number of thermodynamic approaches that are
available in the literature and commonly used in the pharmaceutical field were applied in
this study as briefly described below.
The simpler and straight indication of the miscibility between two or more components is
the detection of a single glass transition step in DSC, usually designated as the mixed
phase glass transition temperature (Tgmix) (Gordon and Taylor, 1952). The well-known
Gordon-Taylor (GT) equation is one means of predicting the Tg of amorphous solid
dispersions based on the weight fractions, Tg values and coefficients of thermal expansion
of their components, as presented below by Equation 6.1 for a ternary system
(API-polymer-water),
Equation 6.1
where, w is the weight fraction, Tg is the glass transition temperature (K) and K is a
constant. The subscripts 1, 2 and 3 represent polymer, drug and water, respectively. For
polymer blends of three components, the subscript 3 refers to the component of lowest Tg
(Truong et al., 2002). The constants K1 2 and K1 3 can be estimated by using:
(a) Couchman-Karasz Equation (Couchman and Karasz, 1978),
Equation 6.2
where, ΔCp is the heat capacity change between the supercooled-liquid and the glassy state.

Chapter VI
205
(b) Simha-Boyer Rule (Simha and Boyer, 1962),
Equation 6.3
where, ρ is the density of each component.
In theory, if a system is miscible it will exhibit a single Tgmix, which is intermediate to the
Tg values of the individual components with a relationship to the mixture composition. It
should be noted that the GT approach only works for ideal systems, i.e., systems with an
ideal volume additivity and negligible tendency to interact (Schneider and Di Marzio,
1992). As a result, when an additive lowers the Tg of a substance it has a plasticising effect,
such as the case of water, whereas if it raises the Tg it has an antiplasticising effect
(Hancock and Zografi, 1994). In this study, the Tgmix was calculated using
Gordon-Taylor/Couchman-Karasz Equation.
Another parameter used in the theoretical framework to correlate miscibility and
thermodynamic stability of API-polymer systems, is the well-known Flory-Huggins
interaction parameter, χ (Huggins, 1942; Flory, 1942). Flory-Huggins (FH) theory is based
on the free enthalpy of mixing which has entropy and enthalpy components. χ is
independent of composition, but it varies with concentration and temperature allowing a
possible correlation between theoretical and experimental results (Kontogeorgis, 2007).
Commonly, the FH interaction parameter can be obtained by using two methods: solubility
parameter approach and melting point depression method (MPD). However, in this study
the APIs are in their salt form, thus the solubility parameter cannot be calculated as it does
not apply to compounds having specific strong intermolecular interactions, such as ionic in
the case of salts (Zhao et al., 2011).
The interaction parameter has been extensively determined from melting point approach
for both polymer-polymer blends (Jo and Kwon, 1991) and for polymer-solvent systems
(Meaurio et al., 2005). With particular importance on the pharmaceutical area, few years
ago Marsac and his collaborators developed an approach to estimate the interaction
parameters between APIs and polymeric systems (Marsac et al., 2006), as shown by the
relation in Equation 6.4,
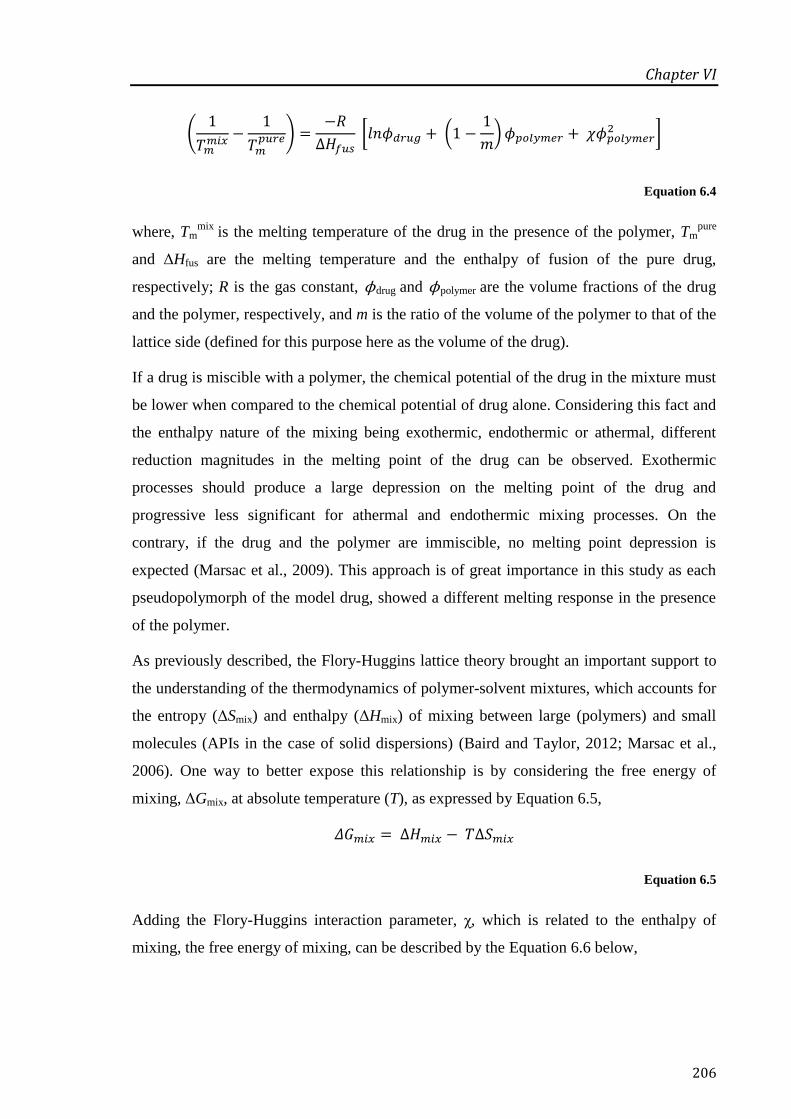
Chapter VI
206
(
)
[ (
)
]
Equation 6.4
where, Tmmix
is the melting temperature of the drug in the presence of the polymer, Tmpure
and ΔHfus are the melting temperature and the enthalpy of fusion of the pure drug,
respectively; R is the gas constant, ϕdrug and ϕpolymer are the volume fractions of the drug
and the polymer, respectively, and m is the ratio of the volume of the polymer to that of the
lattice side (defined for this purpose here as the volume of the drug).
If a drug is miscible with a polymer, the chemical potential of the drug in the mixture must
be lower when compared to the chemical potential of drug alone. Considering this fact and
the enthalpy nature of the mixing being exothermic, endothermic or athermal, different
reduction magnitudes in the melting point of the drug can be observed. Exothermic
processes should produce a large depression on the melting point of the drug and
progressive less significant for athermal and endothermic mixing processes. On the
contrary, if the drug and the polymer are immiscible, no melting point depression is
expected (Marsac et al., 2009). This approach is of great importance in this study as each
pseudopolymorph of the model drug, showed a different melting response in the presence
of the polymer.
As previously described, the Flory-Huggins lattice theory brought an important support to
the understanding of the thermodynamics of polymer-solvent mixtures, which accounts for
the entropy (ΔSmix) and enthalpy (ΔHmix) of mixing between large (polymers) and small
molecules (APIs in the case of solid dispersions) (Baird and Taylor, 2012; Marsac et al.,
2006). One way to better expose this relationship is by considering the free energy of
mixing, ΔGmix, at absolute temperature (T), as expressed by Equation 6.5,
Equation 6.5
Adding the Flory-Huggins interaction parameter, χ, which is related to the enthalpy of
mixing, the free energy of mixing, can be described by the Equation 6.6 below,

Chapter VI
207
Equation 6.6
where, ndrug and npolymer is the number of moles of drug and polymer, respectively. The first
two terms on the right hand side of the equation represent the entropy of mixing, while the
third term stands for the enthalpy of mixing. The entropy contribution always favours
mixing whereby the enthalpy contribution, which depends on the type and intensity of the
interactions between the components, can either facilitate or prevent mixing.
After the brief exposition of some of the theoretical parameters that are commonly used to
study miscibility and investigate the formation of a single phase amorphous systems,
another point of concern is the processing conditions. Indeed, it is widely accepted that the
properties of amorphous materials are highly dependent on their thermal history and hence,
on the preparation method (Zhang et al., 2009; Janssens et al., 2010; Karmwar et al., 2011,
2012). Therefore, in this study two different preparative techniques, spray drying (SD) and
hot melt extrusion (HME) were used. SD is a solvent method that involves the rapid
transformation of an API-carrier solution/suspension to solid API-carrier particles due to
the fast evaporation of the solvent. As referred in Chapter 2, the SD process consists of
four basic stages: atomisation of the solution containing the API and carrier, mixing with
the drying gas, evaporation of the liquid and finally the separation of the dried particles
from the gas (Ré, 2006). HME consists in the dispersion of the API in a polymeric or lipid
carrier matrix using the effect of heat. Several advantages are attributed to this technique.
Firstly, it is solvent free method and therefore with great economical and safety benefits,
secondly the new design of the extruders allow a good mixing and homogenising of the
formulation and finally it is industrially favourable for scaling-up (Miller et al., 2007).
Later in this work, it is investigated whether the samples prepared by these two methods
exhibit different structural and thermodynamic characteristics and whether these
differences can be correlated to their dissolution behaviour and physical stability.
Moreover, the influence of the pseudopolymorphic form on the prepared system was also
evaluated, as referred to, earlier in this chapter.
Thermal analysis, such as differential scanning calorimetry (DSC) and modulated
temperature DSC (MTDSC), were used to predict drug-polymer miscibility and fully

Chapter VI
208
characterise the prepared solid dispersion systems as well as to investigate their physical
stability under storage. Thermogravimetric analysis (TGA) and dynamic vapour sorption
(DVS) were used to measure water content and water uptake, respectively. Structural
techniques were carried out using X-ray powder diffraction (XRPD) and infrared analysis
(FTIR).
6.2 Materials and Methods
6.2.1 Materials
Crystalline paroxetine HCl Form I is a stoichiometric hydrate with 0.5 mol of water per
mol of drug (molecular weight (MW) = 374.83 g/mol, density (ρ) = 1.35 g/cm3) and it was
purchased from Afine (China). Paroxetine HCl Form II is a non-stoichiometric hydrate
with 0.8 mol of water per mol of drug (MW = 365.83 g/mol, ρ = 1.36 g/cm3) and it was
obtained from Huahai Pharmaceuticals (China). Polyvinylpyrrolidone vinyl-acetate 6:4
(PVPVA, MW ≈ 47 000 g/mol, ρ = 1.17 g/cm3) was kindly donated by BASF (Germany).
Methanol (analytical grade) was obtained from Sigma Aldrich (UK). Storage environments
with different relative humidities (RHs) were prepared using salt solutions of sodium
chloride (75% RH, Fischer Scientific, UK) and magnesium nitrate hexahydrate (53% RH,
Fluka, Germany). Phosphorus pentoxide (P2O5) was used as desiccant (Alfar Aesar, UK).
6.2.2 Methods
6.2.2.1 Preparation of the Physical Mixtures
Physical mixtures (PMs) between each API and PVPVA were prepared by gentle mixing
using a mortar and pestle.
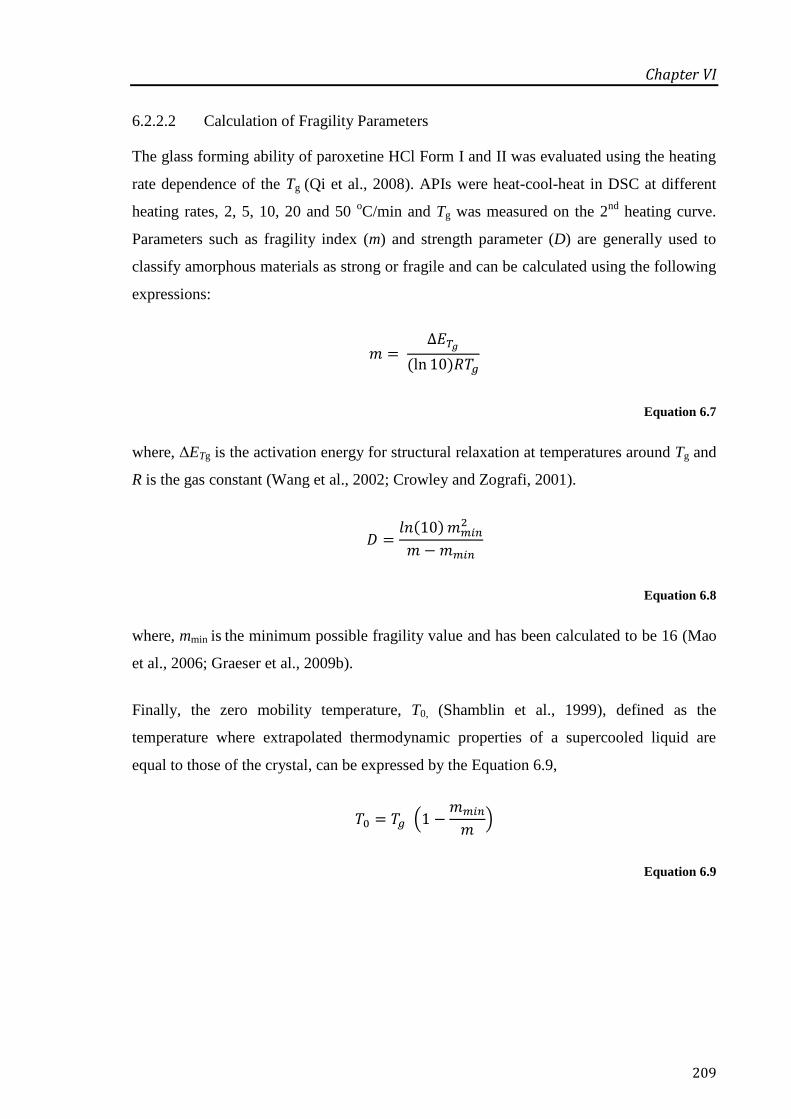
Chapter VI
209
6.2.2.2 Calculation of Fragility Parameters
The glass forming ability of paroxetine HCl Form I and II was evaluated using the heating
rate dependence of the Tg (Qi et al., 2008). APIs were heat-cool-heat in DSC at different
heating rates, 2, 5, 10, 20 and 50 oC/min and Tg was measured on the 2
nd heating curve.
Parameters such as fragility index (m) and strength parameter (D) are generally used to
classify amorphous materials as strong or fragile and can be calculated using the following
expressions:
Equation 6.7
where, ΔETg is the activation energy for structural relaxation at temperatures around Tg and
R is the gas constant (Wang et al., 2002; Crowley and Zografi, 2001).
Equation 6.8
where, mmin is the minimum possible fragility value and has been calculated to be 16 (Mao
et al., 2006; Graeser et al., 2009b).
Finally, the zero mobility temperature, T0, (Shamblin et al., 1999), defined as the
temperature where extrapolated thermodynamic properties of a supercooled liquid are
equal to those of the crystal, can be expressed by the Equation 6.9,
(
)
Equation 6.9

Chapter VI
210
6.2.2.3 Melting Point Depression (MPD)
The APIs and the polymer were passed through a combination of sieves and the fraction
between 63-106 μm was used in all melting point depression experiments. PVPVA was
dried over P2O5 for 48 h prior usage. PMs with a drug ratio of 70, 75, 80, 85, 90 and
100% w/w were prepared at least in triplicate.
The melting temperature of paroxetine HCl Form I and II in the presence and in the
absence of PVPVA was measured using DSC at a scan rate of 2 oC/min. Experiments at
slower heating rates of 1 and 0.1 oC/min were also performed for the PMs of Form II with
PVPVA.
6.2.2.4 Preparation of Solid Dispersions
Spray drying
Spray dried solid dispersions of paroxetine HCl Form I and II with PVPVA were prepared
in a 50% (w/w) drug-polymer ratio. The API and the polymer were dissolved in 200 mL
mixture of methanol-water (50:50 v/v). The solutions were spray dried using a mini spray
dryer B-290 (Büchi) with an aspirator flow of 100%, solution pump rate of 5.0 mL/min
and an inlet temperature of 85 oC and an outlet temperature of about 50
oC.
Hot Melt Extrusion
Hot melt extruded solid dispersions were prepared using a co-rotating twin screw extruder
Thermo Scientific HAAKE MiniLab II (Thermo Scientific). Each system was prepared
using a total weight of 5 g, in the same drug loading as mentioned above, at a speed of
100 rpm with a residence time inside the extruder of 10 min. The extrusion temperature
was 130 and 150 oC for the Form II:PVPVA and Form I:PVPVA system, respectively.
6.2.2.5 Thermal Analysis
Differential scanning calorimetry (DSC, Q1000 TA Instruments) analysis was done at
different heating rates of 2, 5, 10, 20 and 50 oC/min to calculate the heating rate
dependence of the Tg of Form I. Values for Form II were calculated in Chapter 5. A
heating rate (HR) of 10 oC/min was used for the stability studies, from -10 to 160
oC.

Chapter VI
211
Form I was analysed in hermetic pans while Form II was analysed in pinhole pans; all the
stability studies were performed using hermetically sealed pans.
Modulated temperature DSC (MTDSC, Q1000 TA Instruments) analysis was performed
with a HR of 2 oC/min (modulation of ± 0.318
oC every 60 seconds) in pinhole pans for the
characterisation of the freshly prepared solid dispersions.
Thermogravimetric analysis (TGA, Hi-Res 2950 TA Instruments) was used to measure the
water content of the raw materials and solid dispersion formulations. Samples were kept
isothermal at 110 oC for 30 min. The determination of the degradation temperatures (Tdeg)
of the raw materials was conducted at 10 oC/min from room temperature to 300
oC.
Aluminium open pans were used in both measurements.
6.2.2.6 X-Ray Powder Diffraction (XRPD)
XRPD (Thermo-ARL Xtra, Thermo Scientific) spectra were collected from 5.0o to 40.0
o at
2θ. Extrudates were scanned in powder form after gentle grinding with a mortar and pestle.
6.2.2.7 Attenuated Total Reflection-Fourier Transform Infrared (ATR-FTIR)
The infrared spectra of the samples were collected using a Bruker IFS 66/S (Bruker Optics
Ltd.), spectrophotometer, with 64 scans being acquired for each sample from 4000 cm-1
to
550 cm-1
with a resolution of 2 cm-1
. Extrudates were pre-milled by mortar and pestle
before the tests.
6.2.2.8 Dynamic Vapour Sorption (DVS)
DVS (Q5000 SA, TA Instruments) was used to study the water uptake behaviour of all
solid dispersions formulations immediately after preparation and without any pre-treatment
of the samples. Isothermal (25 oC) and isohumic (98% RH) conditions were used for a
period of 16 h.

Chapter VI
212
6.2.2.9 Dissolution Studies
The drug content of each formulation was assayed spectrophotometrically (Lambda XLS
UV/VIS, Perkin-Elmer) at 293 nm. Samples were dissolved in methanol and suitable
diluted with the same solvent.
Dissolution studies were performed in 900 mL of 0.1 M HCl at 37.0 ± 0.5 oC, with a
rotation speed of 50 rpm using the BP paddle method. Sixty milligrams (60 mg) of each
sample within 63-106 μm particle size, were used. At predetermined intervals, 10 mL of
solution was withdrawn and filtered through a 0.45 μm filter. Subsequently, the filtrate was
analysed spectrophotometrically at 293 nm. All the dissolution experiments were done
under sink conditions (see Chapter 5).
To compare the dissolution performances between the SD and HME systems a similarity
factor (f2) was used. This is an independent model that measures the similarity in
percentage between two dissolution profiles (FDA, 1997). The similarity factor (f2) is a
logarithmic reciprocal square root transformation of the square error, which can be
expressed by Equation 6.10,
{[ (
) ∑
]
}
Equation 6.10
where n is the number of time points, Rt is the percentage of drug release of a reference
batch at the time t and Tt is the percentage of drug release of the comparison batch at time t.
When f2 is greater than 50 (i.e. 50-100), this indicates the sameness or equivalence of the
both compared profiles. Conversely, when f2 is less than 50 then it is taken as which both
the profiles are different. In this study, the similarity factor was used to assess differences
in the dissolution profiles of SD and HME samples acquired over the first 20 min, since the
dissimilarities were more evident in the beginning of the test.

Chapter VI
213
6.2.2.10 Physical Stability
The stability of the formulations was assessed over time under the effect of humidity. The
samples were stored in desiccators under 53% RH and 75% RH at 25 oC for 4 months. The
humidity environments were obtained by using saturated salt solutions of magnesium
nitrate (53% RH) and sodium chloride (75% RH). Sampling at different time points and
respective characterisation was done for each system using DSC, TGA, FTIR and XRPD
techniques.
6.3 Results and Discussion
6.3.1 Characterisation of Paroxetine HCl as a Glass Former
Figure 6.1 presents the scanning rate dependence of the Tg, where ln (q) (q is heating or
cooling rate) is plotted against the temperature. From the slope of the curve, the glass
formed from Form II showed higher activation energy of structural relaxation at Tg, ΔETg,
compared to the Form I. This fact is associated with a fragile glass nature and it is an
indication that the two forms of paroxetine HCl differ in their theoretical stability/ability as
glass formers (Angell, 1991). Table 6.1 presents the measured Tg (obtained from a heat-
cool-heat cycle of the crystalline materials) and the calculated parameters for fragility
index, m, strength parameter, D, and the temperature at which the stability is maximum, T0.
Considering the theoretical descriptions in Chapter 5, Form I is classified as a strong glass
former (m < 75, D > 10 and higher value of T0) and Form II as a fragile glass. These results
can suggest greater stability of amorphous materials prepared from Form I when compared
to those obtained from Form II; this was critically assessed through this study.
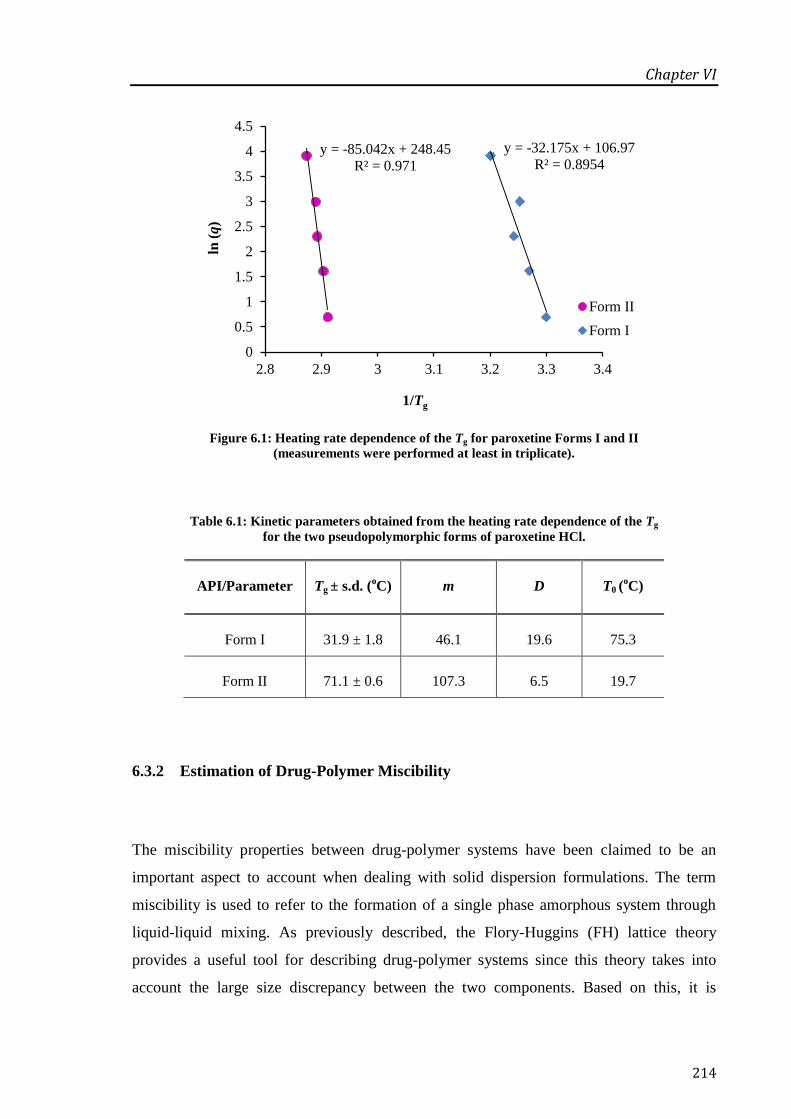
Chapter VI
214
Figure 6.1: Heating rate dependence of the Tg for paroxetine Forms I and II
(measurements were performed at least in triplicate).
Table 6.1: Kinetic parameters obtained from the heating rate dependence of the Tg
for the two pseudopolymorphic forms of paroxetine HCl.
API/Parameter Tg ± s.d. (oC) m D T0 (
oC)
Form I 31.9 ± 1.8 46.1 19.6 75.3
Form II 71.1 ± 0.6 107.3 6.5 19.7
6.3.2 Estimation of Drug-Polymer Miscibility
The miscibility properties between drug-polymer systems have been claimed to be an
important aspect to account when dealing with solid dispersion formulations. The term
miscibility is used to refer to the formation of a single phase amorphous system through
liquid-liquid mixing. As previously described, the Flory-Huggins (FH) lattice theory
provides a useful tool for describing drug-polymer systems since this theory takes into
account the large size discrepancy between the two components. Based on this, it is
y = -85.042x + 248.45
R² = 0.971
y = -32.175x + 106.97
R² = 0.8954
0
0.5
1
1.5
2
2.5
3
3.5
4
4.5
2.8 2.9 3 3.1 3.2 3.3 3.4
ln (
q)
1/Tg
Form II
Form I

Chapter VI
215
possible to estimate the FH interaction parameter, χ, and the Gibbs free energy of mixing
(ΔGmix).
The FH interaction parameter was calculated using melting point depression approach
(MPD) with the relationship shown by Equation 6.4. Physical mixtures between each API
and PVPVA were prepared in drug rich compositions (70-90% w/w drug loading) and the
onset melting temperature was measured.
Figure 6.2 presents the changes in the melting point of each API, at different drug loadings
in the presence of PVPVA when compared to the melting temperature of the pure drug,
ΔTm.
Figure 6.2: Changes in the onset melting point of paroxetine HCl Form I and Form II
in the presence of PVPVA, as a function of drug loading.
Form I showed a depression of the onset melting temperature in presence of PVPVA,
which indicates a degree of mixing at the melting temperature. The onset of the melting
point of paroxetine HCl Form I decreased with the increase of polymer fraction, as
expected. For low drug content (70 and 75% w/w) the accurate determination of the onset
melting temperature can be difficult due to the broadening of the fusion peak. In contrast,
the melting point of Form II remained totally unchanged in the presence of the polymer.
0
1
2
3
4
5
6
7
8
9
10
65 70 75 80 85 90 95 100
ΔT
m(o
nse
t)
Drug loading (%)
Form I
Form II

Chapter VI
216
The first attempt to explain this observation was the small temperature interval between the
Tg of PVPVA (≈ 105 oC) and the melting point of Form II (117
oC). As a result, a proper
drug-polymer mixing might not be achieved when a heating rate of 2 oC/min was used,
since it is well-known that melting point depression is heating-rate dependent (Nishi and
Wang, 1975; Marsac et al., 2006). Therefore, slower heating rates of 1 and 0.1 oC/min
were used in order to induce a complete molecular mixing. The results are presented in
Figure 6.3 and confirmed that even at slower heating rates (0.1 oC/min) the onset melting
temperature of Form II remained unchanged. These findings allowed to conclude that
according to melting point depression experiments, the system Form II:PVPVA is
immiscible at temperatures close to the melting.
Figure 6.3: Influence of the heating rate on the onset melting point of paroxetine Form II
when physically mixed with PVPVA in a 50:50 w/w ratio.
This is an interesting point to further investigate by using molecular modelling dynamics,
since the difference between the two pseudopolymorphic forms is the arrangement and
hydrogen bonding between the water molecules and the crystalline structure. This
117.0°C28.9J/g1 °C/min
115.8°C25.4J/g
0.1 °C/min
117.7°C25.0J/g2 °C/min
-0.4
-0.3
-0.2
-0.1
0.0
0.1
He
at
Flo
w (
W/g
)
100 110 120 130
Temperature (°C)Exo Up Universal V4.5A TA Instruments
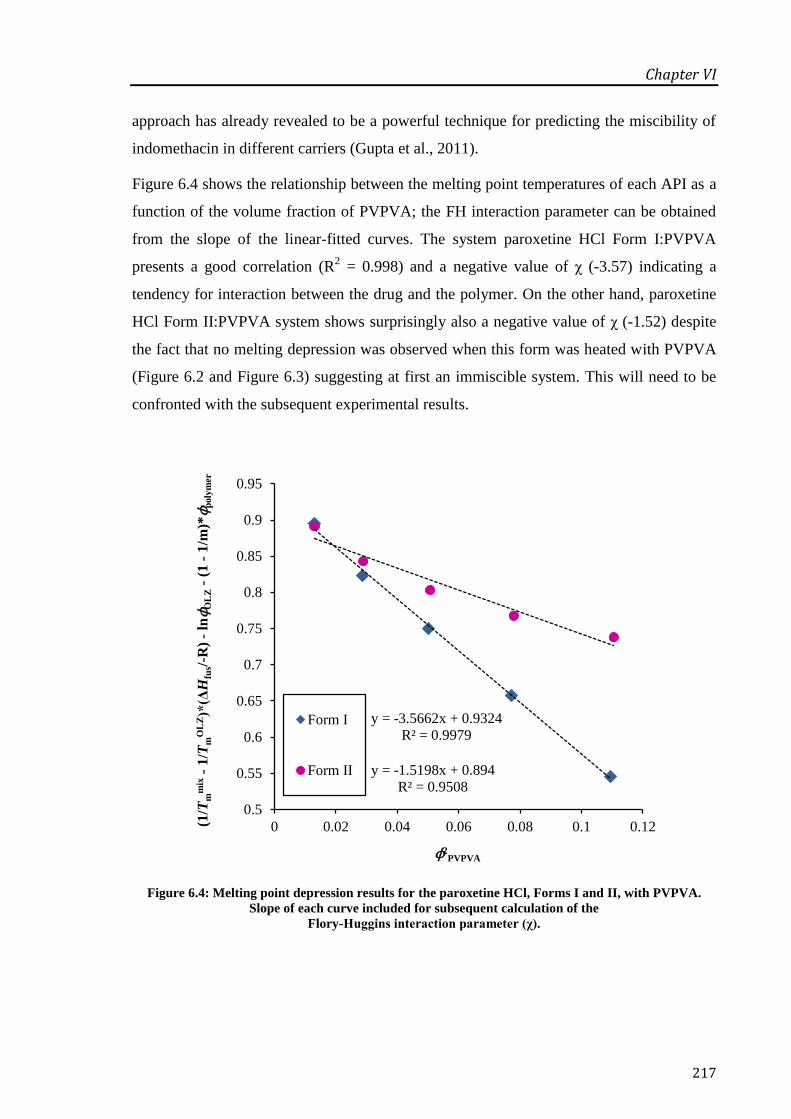
Chapter VI
217
approach has already revealed to be a powerful technique for predicting the miscibility of
indomethacin in different carriers (Gupta et al., 2011).
Figure 6.4 shows the relationship between the melting point temperatures of each API as a
function of the volume fraction of PVPVA; the FH interaction parameter can be obtained
from the slope of the linear-fitted curves. The system paroxetine HCl Form I:PVPVA
presents a good correlation (R2 = 0.998) and a negative value of χ (-3.57) indicating a
tendency for interaction between the drug and the polymer. On the other hand, paroxetine
HCl Form II:PVPVA system shows surprisingly also a negative value of χ (-1.52) despite
the fact that no melting depression was observed when this form was heated with PVPVA
(Figure 6.2 and Figure 6.3) suggesting at first an immiscible system. This will need to be
confronted with the subsequent experimental results.
Figure 6.4: Melting point depression results for the paroxetine HCl, Forms I and II, with PVPVA.
Slope of each curve included for subsequent calculation of the
Flory-Huggins interaction parameter (χ).
y = -3.5662x + 0.9324
R² = 0.9979
y = -1.5198x + 0.894
R² = 0.9508
0.5
0.55
0.6
0.65
0.7
0.75
0.8
0.85
0.9
0.95
0 0.02 0.04 0.06 0.08 0.1 0.12
ϕ2PVPVA
Form I
Form II
(1/T
mm
ix-
1/T
mO
LZ)*
(ΔH
fus/
-R)
-ln
ϕO
LZ
-(1
-1
/m)*
ϕp
oly
mer
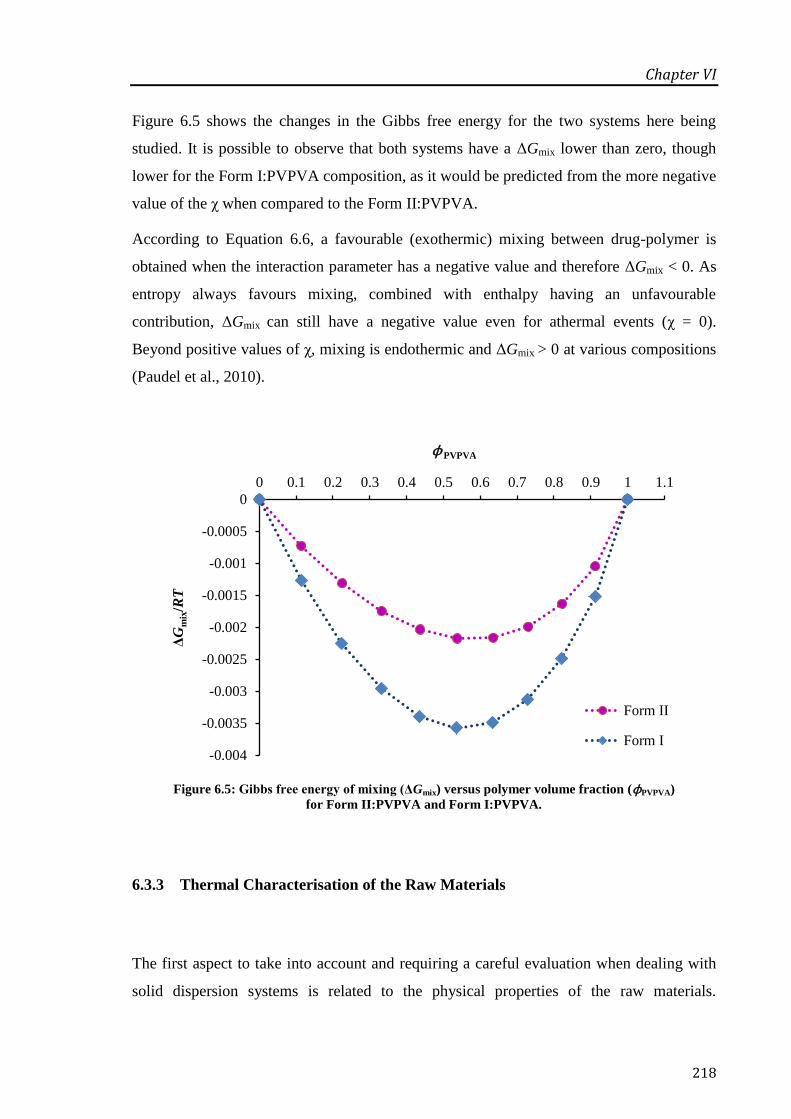
Chapter VI
218
Figure 6.5 shows the changes in the Gibbs free energy for the two systems here being
studied. It is possible to observe that both systems have a ΔGmix lower than zero, though
lower for the Form I:PVPVA composition, as it would be predicted from the more negative
value of the χ when compared to the Form II:PVPVA.
According to Equation 6.6, a favourable (exothermic) mixing between drug-polymer is
obtained when the interaction parameter has a negative value and therefore ΔGmix < 0. As
entropy always favours mixing, combined with enthalpy having an unfavourable
contribution, ΔGmix can still have a negative value even for athermal events (χ = 0).
Beyond positive values of χ, mixing is endothermic and ΔGmix > 0 at various compositions
(Paudel et al., 2010).
Figure 6.5: Gibbs free energy of mixing (ΔGmix) versus polymer volume fraction (ϕPVPVA)
for Form II:PVPVA and Form I:PVPVA.
6.3.3 Thermal Characterisation of the Raw Materials
The first aspect to take into account and requiring a careful evaluation when dealing with
solid dispersion systems is related to the physical properties of the raw materials.
-0.004
-0.0035
-0.003
-0.0025
-0.002
-0.0015
-0.001
-0.0005
0
0 0.1 0.2 0.3 0.4 0.5 0.6 0.7 0.8 0.9 1 1.1
ΔG
mix/R
T
ϕPVPVA
Form II
Form I

Chapter VI
219
Therefore, properties such as melting, glass transition and degradation temperatures of
each API and PVPVA were determined in the first instance and are presented in Table 6.2.
The melting temperature of the two forms of paroxetine HCl differs of about 20 oC and
therefore different extrusion temperatures were used to enable a better mixing via
liquid-state phase between drug and polymer prior extrusion. The degradation temperature
(Tdeg), was calculated by using TGA as the extrapolated onset temperature that denotes the
temperature at which the weight loss begins. Tdeg was found to be higher than 250 oC for
all the materials, which allowed an extrusion temperature of 10 oC higher than the melting
point of each API. In terms of the water content, drugs are hydrates under normal ambient
conditions hence contain a relatively high level of water while PVPVA, due to its slightly
hygroscopic behaviour, also showed a relatively high water content. As further presented
in this work, the presence of water in these solid dispersions systems has a strong effect on
their physical properties.
Table 6.2: Thermal properties of the raw materials.
Material Tm onset ± s.d.
(oC)
Tg ± s.d.
(oC)
Tdeg ± s.d .
(oC)
Water content
± s.d. (%)
Paroxetine HCl
Form I 142.0 ± 0.2 31.9 ± 1.8
* 264.6 ± 4.0 2.59 ± 0.04
Paroxetine HCl
Form II 117.5 ± 0.4 71.1 ± 0.6
* 269.7 ± 3.9 4.45 ± 0.26
PVPVA n.a. 105.6 ± 1.4 283.3 ± 1.0 3.51 ± 1.20
*
Tg value obtained from heat-cool-heat cycle inside the DSC at 2 oC/min.
n.a. – not applicable
The values of Tg (-135.0 oC) and ΔCp (1.94 J/g
oC) for water, needed for the calculation of
Tgmix using Gordon-Taylor/Couchman-Karasz Equation (Equation 6.1 and Equation 6.2),
were taken from literature (Hallbrucker et al., 1989).

Chapter VI
220
6.3.4 Characterisation of the Freshly Prepared Solid Dispersion Systems
6.3.4.1 Thermal Characterisation
After preparation, all solid dispersion systems were immediately characterised. An
important aspect to recall and correlate to the experimental results obtained is related to the
previous studies on the miscibility between each API and PVPVA. From the MPD
approach, Form I showed to be miscible with the polymer at a temperature near to the
melting point of the drug. On the other hand, Form II showed to be completely immiscible
with PVPVA, even at heating rate of 0.1 oC/min, although the calculations of the FH
interaction parameter gave a negative result suggesting, somehow, a certain miscibility
extent for this system. Therefore, it is important to link those predictions with the actual
results and infer on the validity of the MPD approach in these systems.
Figure 6.6 shows the results for the Form II:PVPVA systems prepared by HME and SD.
As it is possible to observe, both techniques were able to produce fully amorphous systems
without any evidence of phase separation (two individual glass transitions),
recrystallisation or melting of the drug. However, a marked difference was detected in their
glass transition temperatures with the spray dried sample having a higher Tg value when
compared with the melt extruded sample. In addition, an evident broad water loss signal
(corresponding to a weight loss of 4.29 ± 0.32% w/w in TGA), between 20-60 oC was
noticed in the total heat flow of the spray dried formulation, contrarily to the HME system,
even though pinhole pans were used for both samples.

Chapter VI
221
Figure 6.6: MTDSC analysis of 50% HME and SD of Form II:PVPVA in pinhole pans.
Note that the extrudates were analysed without any preliminary treatment (non-milled).
In fact, the most obvious indication of the miscibility between two components is the
presence of a single glass transition temperature, already described as Tgmix. In this
particular case, it is essential to take into account the contribution of water and include it in
the calculations of the theoretical Tgmix. Therefore, Tgmix for a ternary system of
Form II/PVPVA/water, based on Equation 6.1, was calculated to be about 55 oC, which is
in agreement with the value obtained for the non-milled HME sample (61.0 oC). However,
the Tg measured for the spray dried Form II:PVPVA system had a much higher value
(95.9 oC). These results could, in the first instance, indicate miscibility issues between the
drug and the polymer, as previously suggested by melting point depression approach for
this particular system and only evident in the case of the HME sample, due to the absence
of any miscibility promoter, such as a solvent. However, a simpler explanation is obtained
if the effect of trapped water inside the HME samples is considered.
Considering that the HME sample was analysed as it was obtained after extrusion, compact
extrudates in a cylindrical shape, which largely reduces the ability for the water to
evaporate when compared with the microparticles obtained from SD, differences in their
50% HME Form II:PVPVA
50% SD Form II:PVPVA
-0.10
-0.08
-0.06
-0.04
-0.02
0.00
[ ] R
ev H
eat F
low
(W
/g)
– –
– –
-0.08
-0.06
-0.04
-0.02
0.00
0.02
0.04
[ ] H
eat F
low
(W
/g)
–––––––
0 20 40 60 80 100 120 140 160
Temperature (°C)Exo Up Universal V4.5A TA Instruments
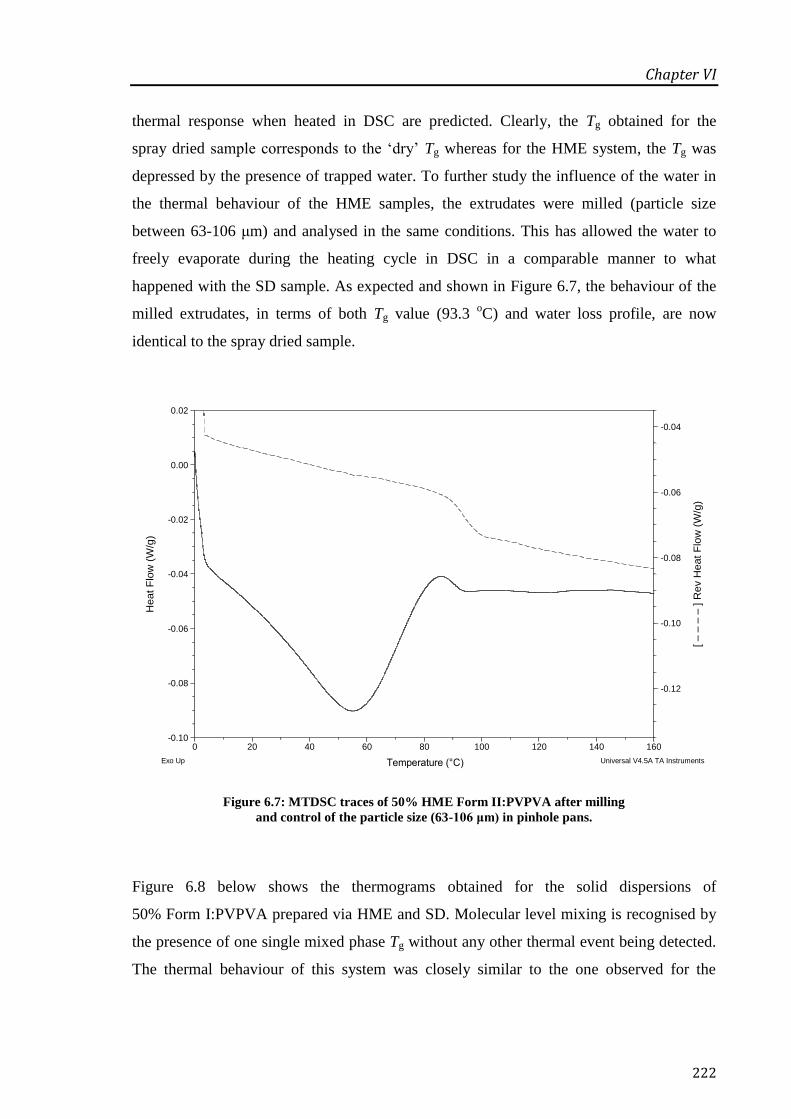
Chapter VI
222
thermal response when heated in DSC are predicted. Clearly, the Tg obtained for the
spray dried sample corresponds to the ‘dry’ Tg whereas for the HME system, the Tg was
depressed by the presence of trapped water. To further study the influence of the water in
the thermal behaviour of the HME samples, the extrudates were milled (particle size
between 63-106 μm) and analysed in the same conditions. This has allowed the water to
freely evaporate during the heating cycle in DSC in a comparable manner to what
happened with the SD sample. As expected and shown in Figure 6.7, the behaviour of the
milled extrudates, in terms of both Tg value (93.3 oC) and water loss profile, are now
identical to the spray dried sample.
Figure 6.7: MTDSC traces of 50% HME Form II:PVPVA after milling
and control of the particle size (63-106 μm) in pinhole pans.
Figure 6.8 below shows the thermograms obtained for the solid dispersions of
50% Form I:PVPVA prepared via HME and SD. Molecular level mixing is recognised by
the presence of one single mixed phase Tg without any other thermal event being detected.
The thermal behaviour of this system was closely similar to the one observed for the
-0.12
-0.10
-0.08
-0.06
-0.04
[ ] R
ev H
eat F
low
(W
/g)
– –
– –
-0.10
-0.08
-0.06
-0.04
-0.02
0.00
0.02
Heat F
low
(W
/g)
0 20 40 60 80 100 120 140 160
Temperature (°C)
Size: 2.9900 mg
Comment: R = 60.03
DSCFile: ...\50HME A_PVPVA FRESH GROUND DISS.001Operator: FATIMARun Date: 10-Apr-2012 13:53Instrument: DSC Q1000 V9.9 Build 303
Exo Up Universal V4.5A TA Instruments

Chapter VI
223
Form II:PVPVA system. More specifically, the water plasticisation effect on the non-
milled HME samples was observed when compared to the milled HME (data not shown) or
SD samples. However, the measured Tg for the non-milled HME sample (74.6 oC) showed
a positive deviation from the predicted Tgmix (42.6 oC).
Figure 6.8: MTDSC analysis of the solid dispersions of 50% Form I:PVPVA prepared by HME
(non-milled) and SD. Analyses were done in pinhole pans.
Deviations of experimental Tg values for solid dispersions from those predicted by the GT
are often explained by considering the nature of the interactions between the two
components (Lu and Zografi, 1998). This fact can be supported by the melting depression
observed for Form I when physically mixed with PVPVA, indicating some degree of
interaction.
All the Tg values were measured in the reversing heat flow signal and are presented in
Table 6.3 for clarity. TGA measurements of the water content in non-milled and milled
extrudates are also presented. The milled samples showed a higher water content value
(nearly double) compared to the non-milled ones, as it would be expected since the water
50% SD Form I:PVPVA
50% HME Form I:PVPVA
-0.10
-0.08
-0.06
-0.04
-0.02
0.00
0.02
0.04
0.06
0.08
0.10
Re
v H
ea
t F
low
(W
/g)
-0.08
-0.06
-0.04
-0.02
0.00
0.02
0.04
He
at
Flo
w (
W/g
)
0 20 40 60 80 100 120 140 160
Temperature (°C)Exo Up Universal V4.5A TA Instruments
Chapter VI
224
can be released easier. This fact also supports the results observed in DSC. For the spray
dried products, the water content was considerably higher for the Form II system in
comparison with the Form I formulation, which will have influence in the FTIR results, as
it will be shown later.
Table 6.3: Measurements of Tg, ΔCp and moisture content obtained by MTDSC and TGA, respectively,
for the milled and non-milled HME and SD samples.
System
Non-milled Milled
DSC TGA DSC TGA
Tg ± s.d. (oC)
ΔCp ± s.d.
(J/g oC)
Water loss
± s.d. (%) Tg ± s.d. (
oC)
ΔCp ± s.d.
(J/g oC)
Water loss
± s.d. (%)
50% HME
Form I:PVPVA 74.6 ± 1.4 0.18 ± 0.03 1.52 ± 0.40 95.9 ± 0.3 0.36 ± 0.05 2.50 ± 0.16
50% HME
Form II:PVPVA 61.0 ± 4.9 0.25 ± 0.03 1.47 ± 0.19 93.3 ± 0.6 0.38 ± 0.04 2.57 ± 0.27
50% SD
Form I:PVPVA 97.2 ± 0.2 0.34 ± 0.06 2.62 ± 0.20 n.a. n.a. n.a.
50% SD
Form II:PVPVA 95.9 ± 0.8 0.34 ± 0.02 4.29 ± 0.32 n.a. n.a. n.a.
n.a. – not applicable
6.3.4.2 Structural Characterisation of the Solid Dispersion Systems
The DSC findings outlined above were supported by XRPD studies which revealed that all
the formulations prepared via HME and SD were amorphous with a characteristic halo
pattern (data not shown).
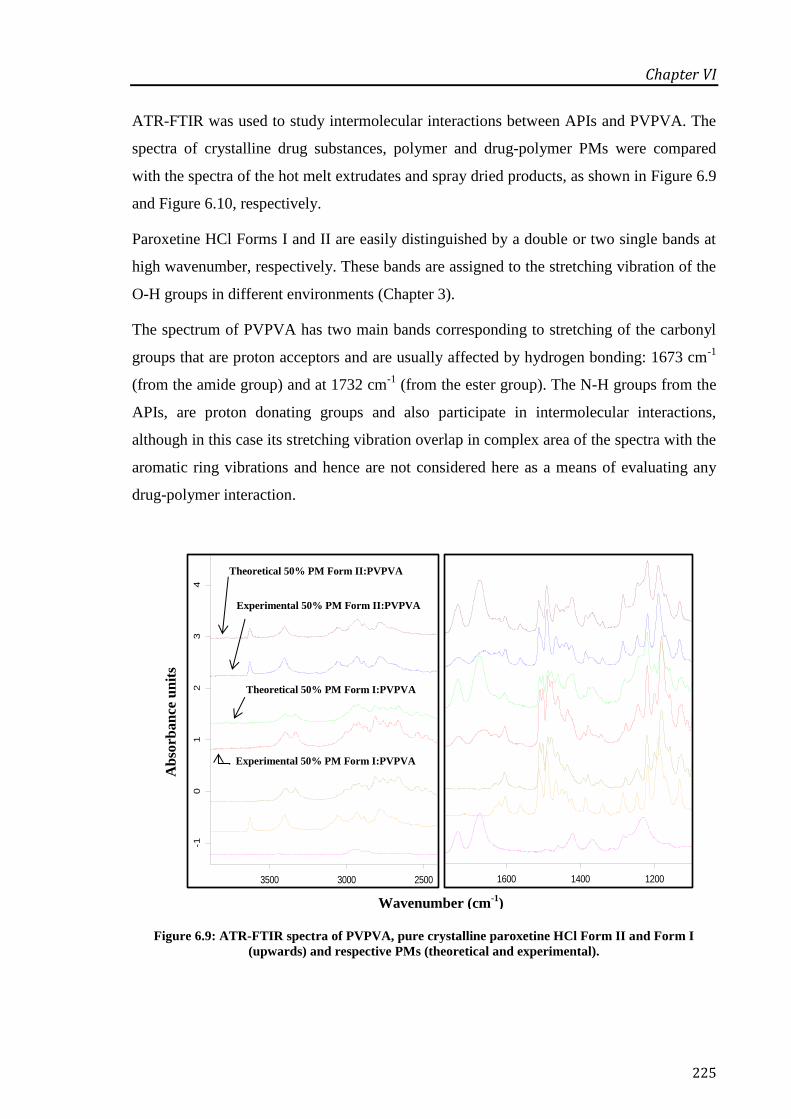
Chapter VI
225
ATR-FTIR was used to study intermolecular interactions between APIs and PVPVA. The
spectra of crystalline drug substances, polymer and drug-polymer PMs were compared
with the spectra of the hot melt extrudates and spray dried products, as shown in Figure 6.9
and Figure 6.10, respectively.
Paroxetine HCl Forms I and II are easily distinguished by a double or two single bands at
high wavenumber, respectively. These bands are assigned to the stretching vibration of the
O-H groups in different environments (Chapter 3).
The spectrum of PVPVA has two main bands corresponding to stretching of the carbonyl
groups that are proton acceptors and are usually affected by hydrogen bonding: 1673 cm-1
(from the amide group) and at 1732 cm-1
(from the ester group). The N-H groups from the
APIs, are proton donating groups and also participate in intermolecular interactions,
although in this case its stretching vibration overlap in complex area of the spectra with the
aromatic ring vibrations and hence are not considered here as a means of evaluating any
drug-polymer interaction.
Figure 6.9: ATR-FTIR spectra of PVPVA, pure crystalline paroxetine HCl Form II and Form I
(upwards) and respective PMs (theoretical and experimental).
G:\Fátima\RESEARCH 13072013\RESULTS\FTIR-ATR\Solid Dispersions\PM & PVPVA\PM50%PXT_PVPVA.0 DLaTGS, KBr-BMS, Globar, IFS 66 G:\Fátima\RESEARCH 13072013\RESULTS\FTIR-ATR\Solid Dispersions\PM & PVPVA\PM50HEMIPVPVA2.sp G:\Fátima\RESEARCH 13072013\RESULTS\FTIR-ATR\Polymers\PVPVA_DRIED OVER P2O5.0 DLaTGS, KBr-BMS, Globar, IFS 66 G:\Fátima\RESEARCH 13072013\RESULTS\FTIR-ATR\CALIB CURV paroxetine I in II\1 Form I.0 GELUCIRE DLaTGS, KBr-BMS, Globar, IFS 66 G:\Fátima\RESEARCH 13072013\RESULTS\FTIR-ATR\CALIB CURV paroxetine I in II\1 Form II.0 GELUCIRE DLaTGS, KBr-BMS, Globar, IFS 66 G:\Data\FatimaFTIR\CALIB CURVE I in II\1 Form I.0 GELUCIRE DLaTGS, KBr-BMS, Globar, IFS 66 G:\Data\FatimaFTIR\CALIB CURVE I in II\1 Form II.0 GELUCIRE DLaTGS, KBr-BMS, Globar, IFS 66
19-07-201107-10-201115-04-201202-07-201202-07-201202-07-201202-07-2012
60080010001200140016001800
Wavenumber cm-1
-2-1
01
23
45
Absorb
ance U
nits
Page 1/1
G:\Fátima\RESEARCH 13072013\RESULTS\FTIR-ATR\Solid Dispersions\PM & PVPVA\PM50%PXT_PVPVA.0 DLaTGS, KBr-BMS, Globar, IFS 66 G:\Fátima\RESEARCH 13072013\RESULTS\FTIR-ATR\Solid Dispersions\PM & PVPVA\PM50HEMIPVPVA2.sp G:\Fátima\RESEARCH 13072013\RESULTS\FTIR-ATR\Polymers\PVPVA_DRIED OVER P2O5.0 DLaTGS, KBr-BMS, Globar, IFS 66 G:\Fátima\RESEARCH 13072013\RESULTS\FTIR-ATR\CALIB CURV paroxetine I in II\1 Form I.0 GELUCIRE DLaTGS, KBr-BMS, Globar, IFS 66 G:\Fátima\RESEARCH 13072013\RESULTS\FTIR-ATR\CALIB CURV paroxetine I in II\1 Form II.0 GELUCIRE DLaTGS, KBr-BMS, Globar, IFS 66 G:\Data\FatimaFTIR\CALIB CURVE I in II\1 Form I.0 GELUCIRE DLaTGS, KBr-BMS, Globar, IFS 66 G:\Data\FatimaFTIR\CALIB CURVE I in II\1 Form II.0 GELUCIRE DLaTGS, KBr-BMS, Globar, IFS 66
19-07-201107-10-201115-04-201202-07-201202-07-201202-07-201202-07-2012
100015002000250030003500
Wavenumber cm-1
-10
12
34
Absorb
ance U
nits
Page 1/1
Experimental 50% PM Form II:PVPVA
Theoretical 50% PM Form II:PVPVA
Theoretical 50% PM Form I:PVPVA
Experimental 50% PM Form I:PVPVA
Wavenumber (cm-1
)
Ab
sorb
an
ce u
nit
s
Chapter VI
226
In theory, a 50:50 w/w PM between each API and PVPVA would be expected to result in a
combination of the FTIR spectrum of the individual components. However, by comparing
the predicted spectra with the one obtained experimentally an evident difference in the
main region of PVPVA was observed. The two main bands previously referred
(1673 and 1732 cm-1
) became broader and significantly reduced in intensity, which was
identical in both Form I and Form II systems. A reasonable explanation for this feature is
probably related to the high water content of the individual raw materials. In fact, the
interaction between water and hydrophilic polymers, such as PVP and PVPVA, was
described to influence not only the position of the C=O but also its shape (Weuts et al.,
2004).
In the case of the FTIR spectra for the freshly prepared solid dispersions (Figure 6.10) it is
clear that the O-H stretching vibrations associated with the isolated APIs (located at a high
wavenumber) disappeared and meanwhile a broad band at around 3400 cm-1
was identified
in all the solid dispersions. This is an indication of the formation of an amorphous phase
between the drug and polymer, which was also supported by the broadening of the peaks in
the whole spectra. Additionally, the position of the C=O stretch vibration corresponding to
the ester function of the polymer is practically unchanged, whereas the band corresponding
to the C=O stretch of the amide function showed a shift towards lower wavenumbers. This
is due to the different basic nature of the two groups, being the C=O of the pyrrolidone
group a stronger proton acceptor as compared to the C=O of the vinyl-acetate (Shamblin et
al., 1998).
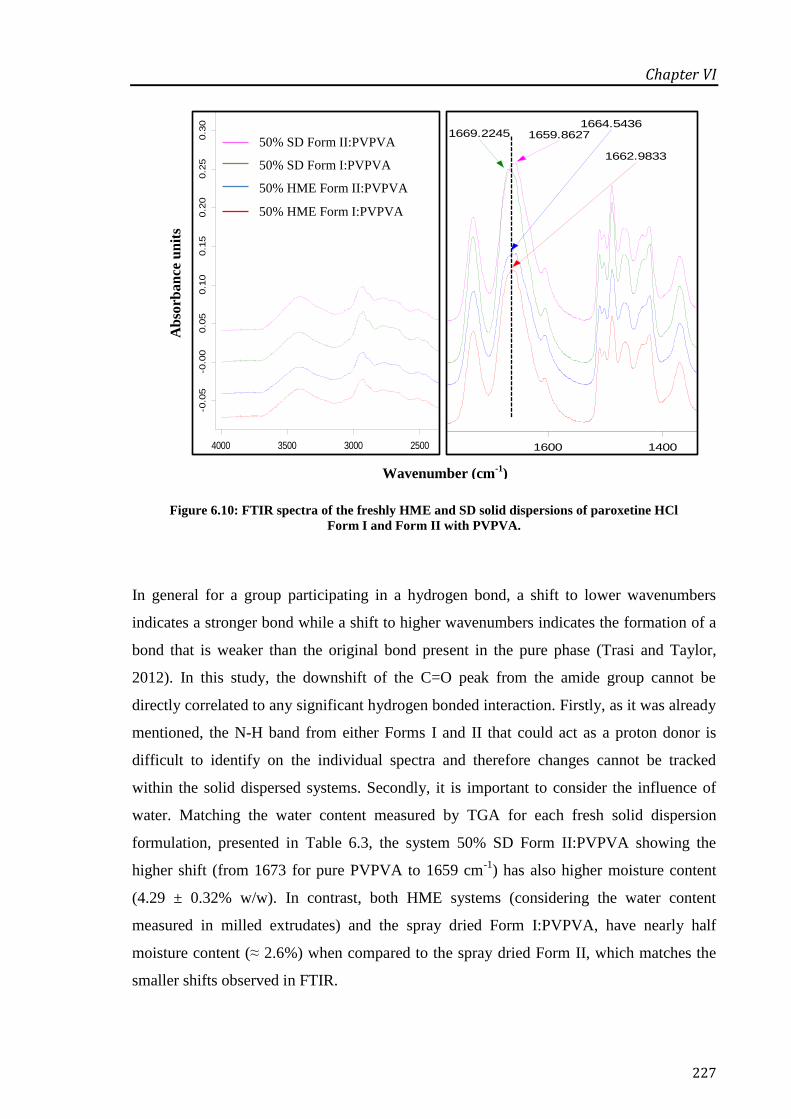
Chapter VI
227
Figure 6.10: FTIR spectra of the freshly HME and SD solid dispersions of paroxetine HCl
Form I and Form II with PVPVA.
In general for a group participating in a hydrogen bond, a shift to lower wavenumbers
indicates a stronger bond while a shift to higher wavenumbers indicates the formation of a
bond that is weaker than the original bond present in the pure phase (Trasi and Taylor,
2012). In this study, the downshift of the C=O peak from the amide group cannot be
directly correlated to any significant hydrogen bonded interaction. Firstly, as it was already
mentioned, the N-H band from either Forms I and II that could act as a proton donor is
difficult to identify on the individual spectra and therefore changes cannot be tracked
within the solid dispersed systems. Secondly, it is important to consider the influence of
water. Matching the water content measured by TGA for each fresh solid dispersion
formulation, presented in Table 6.3, the system 50% SD Form II:PVPVA showing the
higher shift (from 1673 for pure PVPVA to 1659 cm-1
) has also higher moisture content
(4.29 ± 0.32% w/w). In contrast, both HME systems (considering the water content
measured in milled extrudates) and the spray dried Form I:PVPVA, have nearly half
moisture content (≈ 2.6%) when compared to the spray dried Form II, which matches the
smaller shifts observed in FTIR.
G:\Fátima\RESEARCH 13072013\RESULTS\FTIR-ATR\Solid Dispersions\SD_31072012\HME\50HME A_PVPVA fresh.0 SLP_30_10 DLaTGS, KBr-BMS, Globar, IFS 66
G:\Fátima\RESEARCH 13072013\RESULTS\FTIR-ATR\Solid Dispersions\SD_31072012\HME\50HME Hemi_PVPVA fresh.0 SLP_30_10 DLaTGS, KBr-BMS, Globar, IFS 66
G:\Fátima\RESEARCH 13072013\RESULTS\FTIR-ATR\Solid Dispersions\SD_31072012\SD\50SD A_PVPVA fresh.0 SLP_30_10 DLaTGS, KBr-BMS, Globar, IFS 66
G:\Fátima\RESEARCH 13072013\RESULTS\FTIR-ATR\Solid Dispersions\SD_31072012\SD\50SD Hemi_PVPVA fresh.0 SLP_30_10 DLaTGS, KBr-BMS, Globar, IFS 66
31-07-2012
31-07-2012
31-07-2012
31-07-2012
1669.2245 1659.8627
1662.9833
1664.5436
6008001000120014001600
Wavenumber cm-1
-0.0
5-0
.00
0.05
0.10
0.15
0.20
0.25
0.30
Abs
orba
nce
Uni
ts
Page 1/1
G:\Fátima\RESEARCH 13072013\RESULTS\FTIR-ATR\Solid Dispersions\SD_31072012\HME\50HME A_PVPVA fresh.0 SLP_30_10 DLaTGS, KBr-BMS, Globar, IFS 66
G:\Fátima\RESEARCH 13072013\RESULTS\FTIR-ATR\Solid Dispersions\SD_31072012\HME\50HME Hemi_PVPVA fresh.0 SLP_30_10 DLaTGS, KBr-BMS, Globar, IFS 66
G:\Fátima\RESEARCH 13072013\RESULTS\FTIR-ATR\Solid Dispersions\SD_31072012\SD\50SD A_PVPVA fresh.0 SLP_30_10 DLaTGS, KBr-BMS, Globar, IFS 66
G:\Fátima\RESEARCH 13072013\RESULTS\FTIR-ATR\Solid Dispersions\SD_31072012\SD\50SD Hemi_PVPVA fresh.0 SLP_30_10 DLaTGS, KBr-BMS, Globar, IFS 66
31-07-2012
31-07-2012
31-07-2012
31-07-2012
1000150020002500300035004000
Wavenumber cm-1
-0.0
5-0
.00
0.0
50.1
00.1
50.2
00.2
50.3
0
Absorb
ance U
nits
Page 1/1
50% SD Form II:PVPVA
50% SD Form I:PVPVA
50% HME Form II:PVPVA
50% HME Form I:PVPVA
Wavenumber (cm-1
)
Ab
sorb
an
ce u
nit
s
Chapter VI
228
6.3.4.3 Moisture Uptake Studies
In the previous section, the effect of trapped water inside the extrudates was discussed and
showed to have a great influence on the measured Tg when compared to the spray dried
samples. Indeed, the presence of water lowers the Tg of amorphous systems and therefore
increases the molecular mobility, which can also alter the chemical and physical stability
of amorphous solid dispersions.
The moisture uptake capabilities of all systems were tested using DVS isohumic and
isothermal tests (the DVS sample chamber was kept at a constant humidity and
temperature during the tested period) at 98% RH/25 oC for a period of 16 h, when a
constant weight for all the systems was achieved. This provides a rapid insight on the
hygroscopic behaviour and water uptake rates of each system since an extremely high
water vapour was used, which gives some insights prior the stability tests being performed.
The results are presented in Figure 6.11 and as expected, the spray dried products absorbed
water at higher rate when compared to the HME ones, which were tested in its rod-shape,
as milling could increase molecular mobility and give misleading results when submitted
to high RH environments. After nearly 3 h of testing both SD samples and HME
Form II:PVPVA showed a similar increase in weight nearly 40% w/w whereas
HME Form I:PVPVA showed a slightly lower absorption of nearly 32% w/w. However, in
the end of the experiments (after 16 h) all systems showed a similar water uptake
(≈ 45% w/w).

Chapter VI
229
Figure 6.11: DVS results of the freshly prepared HME and SD systems
kept under 98% RH/25 oC for a period of 16 h.
Another important information that can be exploit from DVS experiments is related to the
crystallisation of amorphous materials when exposed to changes in humidity. Amorphous
samples are described to absorb large amounts of water and as they crystallise the water is
expelled and a weight loss is observed (Grisedale et al.). In this study none of the products
showed a decrease in weight during the experimental time in DVS suggesting a great
stability of these systems, which will be further studied during the storage stability.
6.3.4.4 Dissolution Studies
The drug content was determined spectrophotometrically, as described in the Methods
section, and was within the range 98.4–101.6% for all the systems prepared.
It is well-known that the dissolution behaviour of pharmaceutical drugs is a complex
process and depends on several factors such as particle size, surface area, degree of
80
100
120
140
160
Weig
ht (%
)
0 100 200 300 400 500 600
Time (min)
50%SD Form II_PVPVA––––––– 50%SD From I_PVPVA– – – – 50%HME Form I_PVPVA––––– · 50%HME Form II_PVPVA––– – –
Universal V4.5A TA Instruments

Chapter VI
230
crystallinity and solvation state of the drug. Also, some examples can be scattered from the
literature showing the influence of the preparative techniques on the dissolution process of
amorphous solids (Patterson et al., 2007; Dong et al., 2008; Mura et al., 1999c; Mura et al.,
1999a; Karmwar et al., 2012).
In this section the dissolution profiles of each solid dispersion system prepared via HME
and SD were investigated and compared with the pure crystalline drugs and binary
mixtures with PVPVA. Sink conditions were used and the particle size was controlled for
all the experiments (63-106 μm).
Figure 6.12: Dissolution profiles of pure paroxetine HCl Form I, binary mixture with PVPVA and
respective solid dispersions prepared by SD and HME.
Form I has a dissolution rate similar to the PMs and SD samples, as shown in
Figure 6.12. This is not completely surprising since paroxetine HCl is described to be a
slightly water soluble drug (Kasim et al., 2004). However, a lower dissolution rate was
observed for the HME product. These differences in the release rates were quantitatively
compared by using the magnitude of similarity factor f2, as described in the Methods
section. The SD and HME systems of Form I have a similarity factor f2 of 29.10 suggesting
0
10
20
30
40
50
60
70
80
90
100
110
0 10 20 30 40 50 60 70 80 90
Dru
g r
elea
se (
%)
Time (min)
Form I
50% PM Form I:PVPVA
50% HME Form I:PVPVA
50% SD Form I:PVPVA

Chapter VI
231
that the release profile of Form I from the SD and HME formulations were different
(f2 < 50). Although, SD and HME solid dispersions were prepared as fully amorphous
forms, which was confirmed by DSC and XRPD, other parameters seemed to influence the
dissolution of these solid dispersions systems.
A similar visual behaviour of the solid dispersions during dissolution testing was observed,
with all the samples dispersing well in the media without any evidence of material floating
or forming a solid plug at the bottom of the dissolution vessel. However, the diffusion
coefficient of the dissolution medium into the micrometer spray dried and hot melt
extrudated particles is expected to be different with a slower rate for the latter one. This
fact could explain the initial slower release of the HME system in comparison with the PM
and SD samples. Additionally, the slower wetting properties of the compact HME particles
could contribute for these observations.
Figure 6.13: Dissolution profiles of pure paroxetine HCl Form II, binary mixture with PVPVA and
respective solid dispersions prepared by SD and HME.
The SD and PMs with Form II had a similar dissolution profiles to the ones observed for
Form I, though the pure crystalline Form II showed a dissolution behaviour close to the
0
10
20
30
40
50
60
70
80
90
100
110
0 10 20 30 40 50 60 70 80 90
Dru
g r
elea
se (
%)
Time (min)
Form II
50% PM Form II:PVPVA
50% HME Form II:PVPVA
50% SD Form II:PVPVA
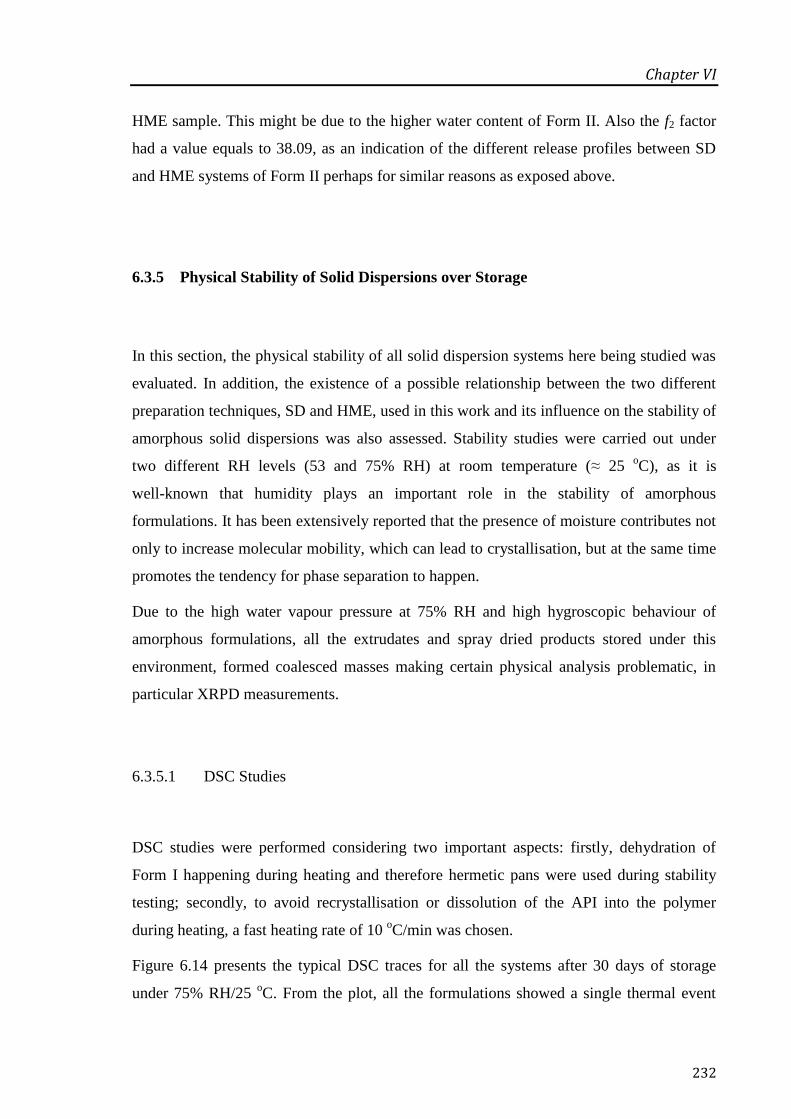
Chapter VI
232
HME sample. This might be due to the higher water content of Form II. Also the f2 factor
had a value equals to 38.09, as an indication of the different release profiles between SD
and HME systems of Form II perhaps for similar reasons as exposed above.
6.3.5 Physical Stability of Solid Dispersions over Storage
In this section, the physical stability of all solid dispersion systems here being studied was
evaluated. In addition, the existence of a possible relationship between the two different
preparation techniques, SD and HME, used in this work and its influence on the stability of
amorphous solid dispersions was also assessed. Stability studies were carried out under
two different RH levels (53 and 75% RH) at room temperature (≈ 25 oC), as it is
well-known that humidity plays an important role in the stability of amorphous
formulations. It has been extensively reported that the presence of moisture contributes not
only to increase molecular mobility, which can lead to crystallisation, but at the same time
promotes the tendency for phase separation to happen.
Due to the high water vapour pressure at 75% RH and high hygroscopic behaviour of
amorphous formulations, all the extrudates and spray dried products stored under this
environment, formed coalesced masses making certain physical analysis problematic, in
particular XRPD measurements.
6.3.5.1 DSC Studies
DSC studies were performed considering two important aspects: firstly, dehydration of
Form I happening during heating and therefore hermetic pans were used during stability
testing; secondly, to avoid recrystallisation or dissolution of the API into the polymer
during heating, a fast heating rate of 10 oC/min was chosen.
Figure 6.14 presents the typical DSC traces for all the systems after 30 days of storage
under 75% RH/25 oC. From the plot, all the formulations showed a single thermal event
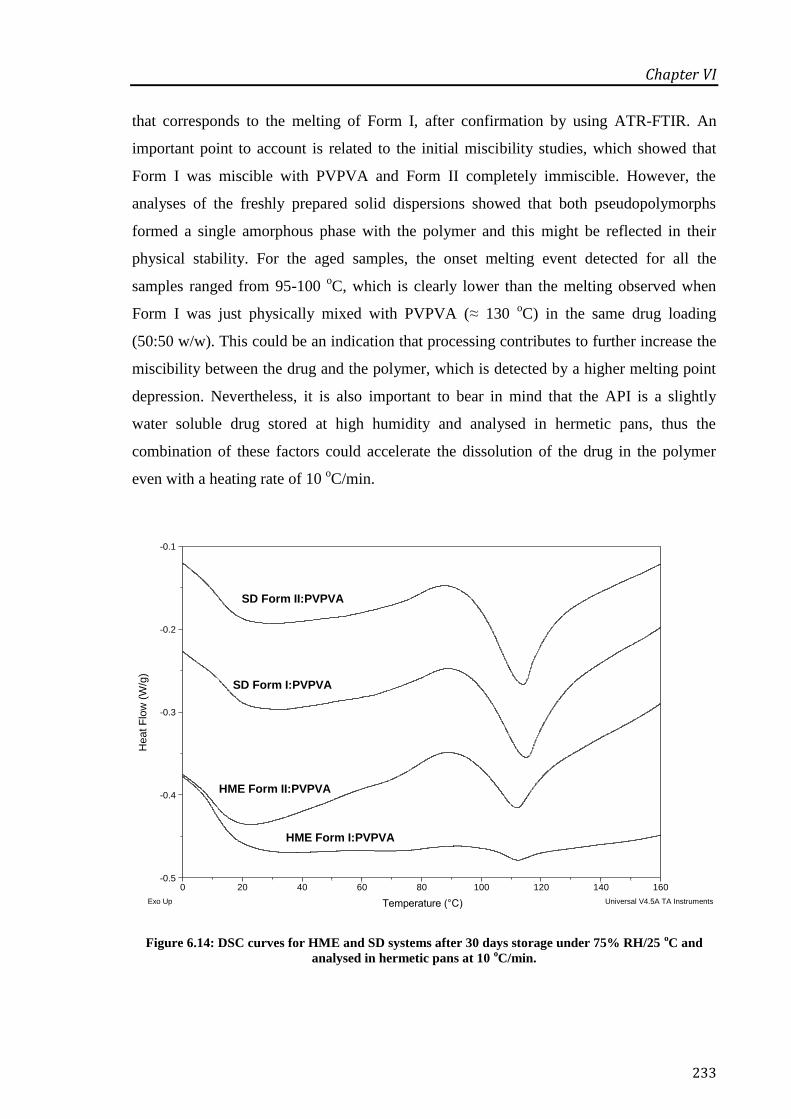
Chapter VI
233
that corresponds to the melting of Form I, after confirmation by using ATR-FTIR. An
important point to account is related to the initial miscibility studies, which showed that
Form I was miscible with PVPVA and Form II completely immiscible. However, the
analyses of the freshly prepared solid dispersions showed that both pseudopolymorphs
formed a single amorphous phase with the polymer and this might be reflected in their
physical stability. For the aged samples, the onset melting event detected for all the
samples ranged from 95-100 oC, which is clearly lower than the melting observed when
Form I was just physically mixed with PVPVA (≈ 130 oC) in the same drug loading
(50:50 w/w). This could be an indication that processing contributes to further increase the
miscibility between the drug and the polymer, which is detected by a higher melting point
depression. Nevertheless, it is also important to bear in mind that the API is a slightly
water soluble drug stored at high humidity and analysed in hermetic pans, thus the
combination of these factors could accelerate the dissolution of the drug in the polymer
even with a heating rate of 10 oC/min.
Figure 6.14: DSC curves for HME and SD systems after 30 days storage under 75% RH/25 oC and
analysed in hermetic pans at 10 oC/min.
SD Form I:PVPVA
HME Form II:PVPVA
SD Form II:PVPVA
HME Form I:PVPVA
-0.5
-0.4
-0.3
-0.2
-0.1
Heat F
low
(W
/g)
0 20 40 60 80 100 120 140 160
Temperature (°C)Exo Up Universal V4.5A TA Instruments

Chapter VI
234
All the samples stored at 53% RH/25 oC remained fully amorphous during the whole
experimental time (four months), with a single Tg ranging from 29-32 oC being observed.
The percentage of crystallised drug in each formulation was estimated by using the ratio
between the enthalpy of fusion of the pure API (ΔHm (0)) and enthalpy of fusion measured
in the DSC for the aged systems (ΔHm (t) ) multiplied by the drug loading (50% w/w for all
the formulations in this case) (Shah et al., 2006), as shown in Equation 6.11,
(
)
Equation 6.11
Figure 6.15 shows the recrystallisation profiles of all formulations calculated from DSC
data using Equation 6.11 during four months of storage under 75% RH/25 oC. Significant
differences were observed in the stability behaviour of the different systems, especially
regarding the initial time point when recrystallisation was firstly detected by DSC, but also
the overall profile of recrystallisation. Both spray dried products of Form I and II showed a
high recrystallisation tendency, reaching its maximum amount of crystals detected after
30 days, which remained nearly constant during the remain experimental period. The
sample HME Form II:PVPVA showed a continuous increase in its crystal content over
time, achieving its maximum after 90-120 days.
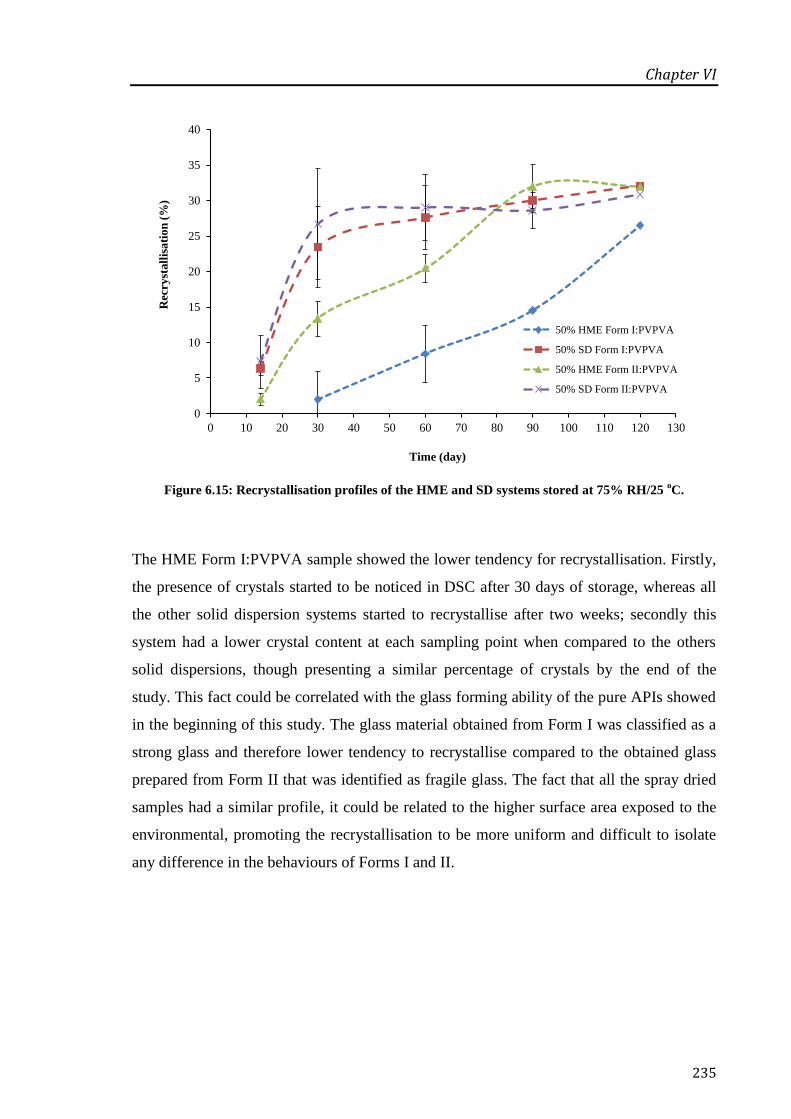
Chapter VI
235
Figure 6.15: Recrystallisation profiles of the HME and SD systems stored at 75% RH/25 oC.
The HME Form I:PVPVA sample showed the lower tendency for recrystallisation. Firstly,
the presence of crystals started to be noticed in DSC after 30 days of storage, whereas all
the other solid dispersion systems started to recrystallise after two weeks; secondly this
system had a lower crystal content at each sampling point when compared to the others
solid dispersions, though presenting a similar percentage of crystals by the end of the
study. This fact could be correlated with the glass forming ability of the pure APIs showed
in the beginning of this study. The glass material obtained from Form I was classified as a
strong glass and therefore lower tendency to recrystallise compared to the obtained glass
prepared from Form II that was identified as fragile glass. The fact that all the spray dried
samples had a similar profile, it could be related to the higher surface area exposed to the
environmental, promoting the recrystallisation to be more uniform and difficult to isolate
any difference in the behaviours of Forms I and II.
0
5
10
15
20
25
30
35
40
0 10 20 30 40 50 60 70 80 90 100 110 120 130
Rec
ryst
all
isa
tio
n (
%)
Time (day)
50% HME Form I:PVPVA
50% SD Form I:PVPVA
50% HME Form II:PVPVA
50% SD Form II:PVPVA
Chapter VI
236
6.3.5.2 TGA
The water content of each system during the experimental time was measured by using
TGA. The results obtained for the samples stored under 75% RH/25 oC are presented in
Figure 6.16. All the systems showed to have a very similar water behaviour uptake when
stored at these conditions, being observed a slight decrease over time, probably as an
indication of API recrystallisation and therefore less hygroscopicity when compared with
the amorphous state.
Figure 6.16: Water content of each solid dispersion system overtime stored at 75% RH/25 oC.
All the samples stored under 53% RH/25 oC showed a slight increase in their moisture
content, varying from 6-8% for the HME samples and from 4-7% for the spray dried
samples. However, these differences did not significantly influence the measured Tg of
these systems when run in DSC.
0
2
4
6
8
10
12
14
16
18
0 20 40 60 80 100 120 140
Wa
ter
(%)
Time (day)
SD Form I:PVPVA
75% RH/25 °C
SD Form II:PVPVA
75% RH/25 °C
HME Form I:PVPVA
75% RH/25 °C
HME Form II:PVPVA
75% RH/25 °C
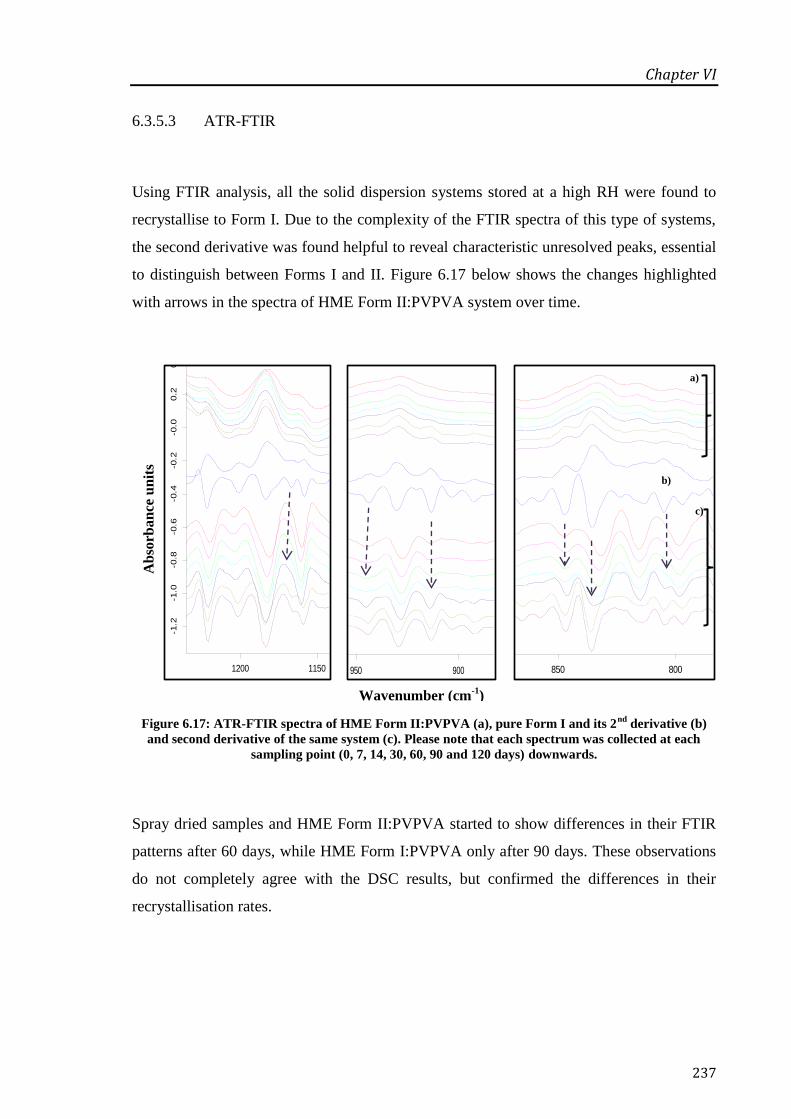
Chapter VI
237
b)
c)
a)
6.3.5.3 ATR-FTIR
Using FTIR analysis, all the solid dispersion systems stored at a high RH were found to
recrystallise to Form I. Due to the complexity of the FTIR spectra of this type of systems,
the second derivative was found helpful to reveal characteristic unresolved peaks, essential
to distinguish between Forms I and II. Figure 6.17 below shows the changes highlighted
with arrows in the spectra of HME Form II:PVPVA system over time.
Figure 6.17: ATR-FTIR spectra of HME Form II:PVPVA (a), pure Form I and its 2nd
derivative (b)
and second derivative of the same system (c). Please note that each spectrum was collected at each
sampling point (0, 7, 14, 30, 60, 90 and 120 days) downwards.
Spray dried samples and HME Form II:PVPVA started to show differences in their FTIR
patterns after 60 days, while HME Form I:PVPVA only after 90 days. These observations
do not completely agree with the DSC results, but confirmed the differences in their
recrystallisation rates.
G:\Fátima\RESEARCH 13072013\RESULTS\FTIR-ATR\CALIB CURV paroxetine I in II\1 Form I.0 GELUCIRE DLaTGS, KBr-BMS, Globar, IFS 66 G:\Fátima\RESEARCH 13072013\RESULTS\FTIR-ATR\Solid Dispersions\SD_31072012\HME\50HME A_PVPVA fresh.0 SLP_30_10 DLaTGS, KBr-BMS, Globar, IFS 66 G:\Fátima\RESEARCH 13072013\RESULTS\FTIR-ATR\Solid Dispersions\SD_31072012\Stability\7D_STABILITY\50HME A_PVPVA 75RH_25C 7DAYS.0 DLaTGS, KBr-BMS, Globar, IFS 66 G:\Fátima\RESEARCH 13072013\RESULTS\FTIR-ATR\Solid Dispersions\SD_31072012\Stability\14D_STABILITY\50HME A_PVPVA 75RH_25C_14D.0 DLaTGS, KBr-BMS, Globar, IFS 66 G:\Fátima\RESEARCH 13072013\RESULTS\FTIR-ATR\Solid Dispersions\SD_31072012\Stability\28D_STABILITY\50HME HH_PVPVA 75RH_25C.0 DLaTGS, KBr-BMS, Globar, IFS 66 G:\Fátima\RESEARCH 13072013\RESULTS\FTIR-ATR\Solid Dispersions\SD_31072012\Stability\52D_STABILITY\HME A_PVPVA 75RH25C.0 DLaTGS, KBr-BMS, Globar, IFS 66 G:\Fátima\RESEARCH 13072013\RESULTS\FTIR-ATR\Solid Dispersions\SD_31072012\Stability\PXT SD 93D\50HME A-PVPVA 75RH25C 93D.sp 50HME A-PVPVA 75RH25C 93D G:\Fátima\RESEARCH 13072013\RESULTS\FTIR-ATR\Solid Dispersions\SD_31072012\Stability\120D SD PXT\50HME HH_PVPVA 75RH 25C.sp 50HME HH_PVPVA 75RH 25C G:\Fátima\RESEARCH 13072013\RESULTS\FTIR-ATR\CALIB CURV paroxetine I in II\1 Form I.0 GELUCIRE DLaTGS, KBr-BMS, Globar, IFS 66 G:\Fátima\RESEARCH 13072013\RESULTS\FTIR-ATR\Solid Dispersions\SD_31072012\HME\50HME A_PVPVA fresh.0 SLP_30_10 DLaTGS, KBr-BMS, Globar, IFS 66 G:\Fátima\RESEARCH 13072013\RESULTS\FTIR-ATR\Solid Dispersions\SD_31072012\Stability\7D_STABILITY\50HME A_PVPVA 75RH_25C 7DAYS.0 DLaTGS, KBr-BMS, Globar, IFS 66 G:\Fátima\RESEARCH 13072013\RESULTS\FTIR-ATR\Solid Dispersions\SD_31072012\Stability\14D_STABILITY\50HME A_PVPVA 75RH_25C_14D.0 DLaTGS, KBr-BMS, Globar, IFS 66 G:\Fátima\RESEARCH 13072013\RESULTS\FTIR-ATR\Solid Dispersions\SD_31072012\Stability\28D_STABILITY\50HME HH_PVPVA 75RH_25C.0 DLaTGS, KBr-BMS, Globar, IFS 66 G:\Fátima\RESEARCH 13072013\RESULTS\FTIR-ATR\Solid Dispersions\SD_31072012\Stability\52D_STABILITY\HME A_PVPVA 75RH25C.0 DLaTGS, KBr-BMS, Globar, IFS 66 G:\Fátima\RESEARCH 13072013\RESULTS\FTIR-ATR\Solid Dispersions\SD_31072012\Stability\PXT SD 93D\50HME A-PVPVA 75RH25C 93D.sp 50HME A-PVPVA 75RH25C 93D G:\Fátima\RESEARCH 13072013\RESULTS\FTIR-ATR\Solid Dispersions\SD_31072012\Stability\120D SD PXT\50HME HH_PVPVA 75RH 25C.sp 50HME HH_PVPVA 75RH 25C
02-07-201231-07-201207-08-201214-08-201231-08-201220-09-201201-11-201221-11-201202-07-201231-07-201207-08-201214-08-201231-08-201220-09-201201-11-201221-11-2012
700750800850
Wavenumber cm-1
-1.4
-1.2
-1.0
-0.8
-0.6
-0.4
-0.2
-0.0
0.2
Absorb
ance U
nits
Page 1/1
G:\Fátima\RESEARCH 13072013\RESULTS\FTIR-ATR\CALIB CURV paroxetine I in II\1 Form I.0 GELUCIRE DLaTGS, KBr-BMS, Globar, IFS 66 G:\Fátima\RESEARCH 13072013\RESULTS\FTIR-ATR\Solid Dispersions\SD_31072012\HME\50HME A_PVPVA fresh.0 SLP_30_10 DLaTGS, KBr-BMS, Globar, IFS 66 G:\Fátima\RESEARCH 13072013\RESULTS\FTIR-ATR\Solid Dispersions\SD_31072012\Stability\7D_STABILITY\50HME A_PVPVA 75RH_25C 7DAYS.0 DLaTGS, KBr-BMS, Globar, IFS 66 G:\Fátima\RESEARCH 13072013\RESULTS\FTIR-ATR\Solid Dispersions\SD_31072012\Stability\14D_STABILITY\50HME A_PVPVA 75RH_25C_14D.0 DLaTGS, KBr-BMS, Globar, IFS 66 G:\Fátima\RESEARCH 13072013\RESULTS\FTIR-ATR\Solid Dispersions\SD_31072012\Stability\28D_STABILITY\50HME HH_PVPVA 75RH_25C.0 DLaTGS, KBr-BMS, Globar, IFS 66 G:\Fátima\RESEARCH 13072013\RESULTS\FTIR-ATR\Solid Dispersions\SD_31072012\Stability\52D_STABILITY\HME A_PVPVA 75RH25C.0 DLaTGS, KBr-BMS, Globar, IFS 66 G:\Fátima\RESEARCH 13072013\RESULTS\FTIR-ATR\Solid Dispersions\SD_31072012\Stability\PXT SD 93D\50HME A-PVPVA 75RH25C 93D.sp 50HME A-PVPVA 75RH25C 93D G:\Fátima\RESEARCH 13072013\RESULTS\FTIR-ATR\Solid Dispersions\SD_31072012\Stability\120D SD PXT\50HME HH_PVPVA 75RH 25C.sp 50HME HH_PVPVA 75RH 25C G:\Fátima\RESEARCH 13072013\RESULTS\FTIR-ATR\CALIB CURV paroxetine I in II\1 Form I.0 GELUCIRE DLaTGS, KBr-BMS, Globar, IFS 66 G:\Fátima\RESEARCH 13072013\RESULTS\FTIR-ATR\Solid Dispersions\SD_31072012\HME\50HME A_PVPVA fresh.0 SLP_30_10 DLaTGS, KBr-BMS, Globar, IFS 66 G:\Fátima\RESEARCH 13072013\RESULTS\FTIR-ATR\Solid Dispersions\SD_31072012\Stability\7D_STABILITY\50HME A_PVPVA 75RH_25C 7DAYS.0 DLaTGS, KBr-BMS, Globar, IFS 66 G:\Fátima\RESEARCH 13072013\RESULTS\FTIR-ATR\Solid Dispersions\SD_31072012\Stability\14D_STABILITY\50HME A_PVPVA 75RH_25C_14D.0 DLaTGS, KBr-BMS, Globar, IFS 66 G:\Fátima\RESEARCH 13072013\RESULTS\FTIR-ATR\Solid Dispersions\SD_31072012\Stability\28D_STABILITY\50HME HH_PVPVA 75RH_25C.0 DLaTGS, KBr-BMS, Globar, IFS 66 G:\Fátima\RESEARCH 13072013\RESULTS\FTIR-ATR\Solid Dispersions\SD_31072012\Stability\52D_STABILITY\HME A_PVPVA 75RH25C.0 DLaTGS, KBr-BMS, Globar, IFS 66 G:\Fátima\RESEARCH 13072013\RESULTS\FTIR-ATR\Solid Dispersions\SD_31072012\Stability\PXT SD 93D\50HME A-PVPVA 75RH25C 93D.sp 50HME A-PVPVA 75RH25C 93D G:\Fátima\RESEARCH 13072013\RESULTS\FTIR-ATR\Solid Dispersions\SD_31072012\Stability\120D SD PXT\50HME HH_PVPVA 75RH 25C.sp 50HME HH_PVPVA 75RH 25C
02-07-201231-07-201207-08-201214-08-201231-08-201220-09-201201-11-201221-11-201202-07-201231-07-201207-08-201214-08-201231-08-201220-09-201201-11-201221-11-2012
800850900950
Wavenumber cm-1
-1.4
-1.2
-1.0
-0.8
-0.6
-0.4
-0.2
-0.0
0.2
Absorbance U
nits
Page 1/1
G:\Fátima\RESEARCH 13072013\RESULTS\FTIR-ATR\CALIB CURV paroxetine I in II\1 Form I.0 GELUCIRE DLaTGS, KBr-BMS, Globar, IFS 66 G:\Fátima\RESEARCH 13072013\RESULTS\FTIR-ATR\Solid Dispersions\SD_31072012\HME\50HME A_PVPVA fresh.0 SLP_30_10 DLaTGS, KBr-BMS, Globar, IFS 66 G:\Fátima\RESEARCH 13072013\RESULTS\FTIR-ATR\Solid Dispersions\SD_31072012\Stability\7D_STABILITY\50HME A_PVPVA 75RH_25C 7DAYS.0 DLaTGS, KBr-BMS, Globar, IFS 66 G:\Fátima\RESEARCH 13072013\RESULTS\FTIR-ATR\Solid Dispersions\SD_31072012\Stability\14D_STABILITY\50HME A_PVPVA 75RH_25C_14D.0 DLaTGS, KBr-BMS, Globar, IFS 66 G:\Fátima\RESEARCH 13072013\RESULTS\FTIR-ATR\Solid Dispersions\SD_31072012\Stability\28D_STABILITY\50HME HH_PVPVA 75RH_25C.0 DLaTGS, KBr-BMS, Globar, IFS 66 G:\Fátima\RESEARCH 13072013\RESULTS\FTIR-ATR\Solid Dispersions\SD_31072012\Stability\52D_STABILITY\HME A_PVPVA 75RH25C.0 DLaTGS, KBr-BMS, Globar, IFS 66 G:\Fátima\RESEARCH 13072013\RESULTS\FTIR-ATR\Solid Dispersions\SD_31072012\Stability\PXT SD 93D\50HME A-PVPVA 75RH25C 93D.sp 50HME A-PVPVA 75RH25C 93D G:\Fátima\RESEARCH 13072013\RESULTS\FTIR-ATR\Solid Dispersions\SD_31072012\Stability\120D SD PXT\50HME HH_PVPVA 75RH 25C.sp 50HME HH_PVPVA 75RH 25C G:\Fátima\RESEARCH 13072013\RESULTS\FTIR-ATR\CALIB CURV paroxetine I in II\1 Form I.0 GELUCIRE DLaTGS, KBr-BMS, Globar, IFS 66 G:\Fátima\RESEARCH 13072013\RESULTS\FTIR-ATR\Solid Dispersions\SD_31072012\HME\50HME A_PVPVA fresh.0 SLP_30_10 DLaTGS, KBr-BMS, Globar, IFS 66 G:\Fátima\RESEARCH 13072013\RESULTS\FTIR-ATR\Solid Dispersions\SD_31072012\Stability\7D_STABILITY\50HME A_PVPVA 75RH_25C 7DAYS.0 DLaTGS, KBr-BMS, Globar, IFS 66 G:\Fátima\RESEARCH 13072013\RESULTS\FTIR-ATR\Solid Dispersions\SD_31072012\Stability\14D_STABILITY\50HME A_PVPVA 75RH_25C_14D.0 DLaTGS, KBr-BMS, Globar, IFS 66 G:\Fátima\RESEARCH 13072013\RESULTS\FTIR-ATR\Solid Dispersions\SD_31072012\Stability\28D_STABILITY\50HME HH_PVPVA 75RH_25C.0 DLaTGS, KBr-BMS, Globar, IFS 66 G:\Fátima\RESEARCH 13072013\RESULTS\FTIR-ATR\Solid Dispersions\SD_31072012\Stability\52D_STABILITY\HME A_PVPVA 75RH25C.0 DLaTGS, KBr-BMS, Globar, IFS 66 G:\Fátima\RESEARCH 13072013\RESULTS\FTIR-ATR\Solid Dispersions\SD_31072012\Stability\PXT SD 93D\50HME A-PVPVA 75RH25C 93D.sp 50HME A-PVPVA 75RH25C 93D G:\Fátima\RESEARCH 13072013\RESULTS\FTIR-ATR\Solid Dispersions\SD_31072012\Stability\120D SD PXT\50HME HH_PVPVA 75RH 25C.sp 50HME HH_PVPVA 75RH 25C
02-07-201231-07-201207-08-201214-08-201231-08-201220-09-201201-11-201221-11-201202-07-201231-07-201207-08-201214-08-201231-08-201220-09-201201-11-201221-11-2012
10001050110011501200
Wavenumber cm-1
-1.2
-1.0
-0.8
-0.6
-0.4
-0.2
-0.0
0.2
0.4
Absorb
ance U
nits
Page 1/1
Wavenumber (cm-1
)
Ab
sorb
an
ce u
nit
s
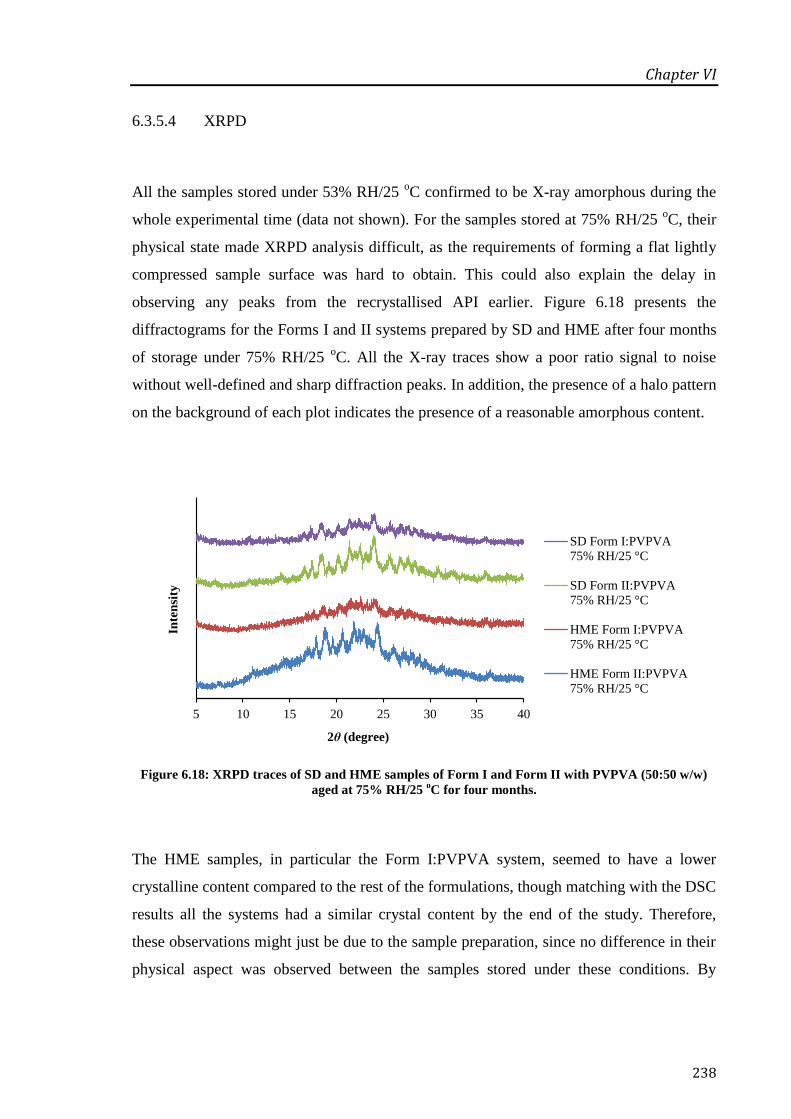
Chapter VI
238
6.3.5.4 XRPD
All the samples stored under 53% RH/25 oC confirmed to be X-ray amorphous during the
whole experimental time (data not shown). For the samples stored at 75% RH/25 oC, their
physical state made XRPD analysis difficult, as the requirements of forming a flat lightly
compressed sample surface was hard to obtain. This could also explain the delay in
observing any peaks from the recrystallised API earlier. Figure 6.18 presents the
diffractograms for the Forms I and II systems prepared by SD and HME after four months
of storage under 75% RH/25 oC. All the X-ray traces show a poor ratio signal to noise
without well-defined and sharp diffraction peaks. In addition, the presence of a halo pattern
on the background of each plot indicates the presence of a reasonable amorphous content.
Figure 6.18: XRPD traces of SD and HME samples of Form I and Form II with PVPVA (50:50 w/w)
aged at 75% RH/25 oC for four months.
The HME samples, in particular the Form I:PVPVA system, seemed to have a lower
crystalline content compared to the rest of the formulations, though matching with the DSC
results all the systems had a similar crystal content by the end of the study. Therefore,
these observations might just be due to the sample preparation, since no difference in their
physical aspect was observed between the samples stored under these conditions. By
5 10 15 20 25 30 35 40
Inte
nsi
ty
2θ (degree)
SD Form I:PVPVA
75% RH/25 °C
SD Form II:PVPVA
75% RH/25 °C
HME Form I:PVPVA
75% RH/25 °C
HME Form II:PVPVA
75% RH/25 °C

Chapter VI
239
comparing the peak lists collected for each system with the corresponding peak lists for
Form I and II, all the samples recrystallised into Form I, which was also suggested by
FTIR analysis and it is not surprising since Form I is the most stable form.

Chapter VI
240
6.4 Conclusions
Currently, the development of solid dispersions in the industry remains largely a trial and
error procedure, with the final performance and physical stability the key features to be
achieved.
Several theoretical predictions have been developed over the past few years to aid the
successful preparation of such systems. In this study, MPD was selected to predict the
miscibility and interaction between two pseudopolymorphs, Form I and Form II, of
paroxetine HCl and PVPVA. Accordingly to these predictions only paroxetine HCl Form I
was miscible with the polymer. The MPD approaches for Form II, did not give any
conclusive results. However experimentally, both forms were able to be molecularly
dispersed within the polymer matrix, thus forming one-phase system. These results
supported the limitations of the melting point depression applications and reliability on
predicting the drug-polymer miscibility.
The work presented here also demonstrated that the use of different preparation techniques,
HME and SD, resulted in products with different physical properties. SD produced porous
particulate samples while HME yielded to denser (as a result of high intensity of mixing
and pressure during extrusion) products with lower porosity. These differences can
therefore influence not only the dissolution profile of the prepared system but also its
physical stability under storage. Moreover, special awareness must be taken when
characterising hot melt extruded systems due to the effect of trapped water that can lead to
misinterpretations, namely with respect to the measured Tg. This can be particularly
important when comparing with dispersions obtained in a powder form, such as spray dried
systems. In this case, a gentle milling of the extrudates is recommended in order to
establish more reasonable comparisons.
In terms of the dissolution performance, the HME systems showed, in both cases of Forms
I and II, lower dissolution rate when compared to SD samples. This behaviour was
ascribed to the compact state of the HME microparticules and therefore slower diffusion
rate in the dissolution media. However, considering pure Form I and Form II individually,
the dissolution profile of Form I was similar to the PMs and SD samples whereas pure

Chapter VI
241
Form II, in contrast, had a dissolution rate similar to the HME sample. This fact might be
related to the higher water content of Form II compared to Form I.
Finally, in terms of the physical stability of the formulated systems HME systems showed,
overall, higher stability than the SD samples. More specifically, HME Form I:PVPVA was
found to be the most stable system with the lowest recrystallisation rate. This could be
attributed with the higher glass forming ability of Form I compared to Form II.
7 OLANZAPINE SOLID DISPERSIONS PREPARED VIA HME:
IMPACT OF THE DRUG PHYSICAL STATE AND DIFFERENT
POLYMERS ON THE DISSOLUTION ENHANCEMENT AND
STORAGE STABILITY
Chapter VII
243
Abstract
In this chapter, particular attention was paid to the physicochemical properties of different
polymeric carriers and their influence on the manufacturing process and capability of
inhibiting crystal growth over storage. In addition, the relationship between the physical
structure of the prepared systems and the dissolution behaviour was also assessed
critically, with a view to examine whether full amorphicity is necessary to achieve a
favourable dissolution profile. Solid dispersions of olanzapine (OLZ) were prepared via
hot melt extrusion (HME) in three polymers (PVP, PVPVA and Soluplus® (SLP)). The
influence of the drug loading and extrusion temperature on the processability by HME was
also investigated. Drug-polymer miscibility was estimated using melting point depression
(MPD) and Hansen solubility parameters (δ). Solid dispersions were characterised using
differential scanning calorimetry (DSC), thermogravimetric analysis (TGA), Fourier
transform infrared (FTIR), X-ray powder diffraction (XRPD) and scanning electron
microscopy (SEM).
All the polymers were found to be miscible with OLZ (interaction parameter, χ < 0 and
Δδ < 7 MPa1/2
), in a decreasing order of PVP > PVPVA > SLP. At a lower extrusion
temperature (160 o
C), PVP generated fully amorphous dispersions with OLZ, while the
formulations with PVPVA and SLP contained 14-16% crystalline OLZ. Increasing the
extrusion temperature to 180 oC allowed the preparation of fully amorphous systems with
PVPVA and SLP. Despite these differences, the dissolution rates of these preparations
were comparable, with PVP showing a lower release rate despite being fully amorphous.
These findings suggested that, at least in the particular case of OLZ, the absence of
crystalline material may not be critical to the dissolution performance. Regarding the
storage stability under 75% RH/40 oC, the extrudates prepared with SLP and extruded at
180 oC were found to have the greatest stability. Properties such as low hygroscopicity and
high viscosity (high molecular weight) of SLP might have a strong effect in decreasing
molecular mobility and thus impairing crystallisation. These two properties seemed to
control the stability of amorphous OLZ, rather than the stabilisation via hydrogen bonding
between OLZ and the different polymers.

Chapter VII
244
7.1 Introduction
The oral bioavailability enhancement of poorly soluble active pharmaceutical ingredients
(APIs) continues to represent a significant issue in drug development. One strategy to
overcome this obstacle is the development of amorphous solid dispersion systems using
hydrophilic polymers. The term ‘solid dispersion’ was described by Chiou and Riegelman
as “the dispersion of one or more active ingredients in an inert carrier matrix at
solid-state prepared by melting (fusion), solvent or melting-solvent method” (Chiou and
Riegelman, 1971). This definition is still applicable despite the field having developed
considerably to include a wider range of manufacturing techniques (e.g. hot melt extrusion
(HME)) and new concepts in structural characteristics, particularly involving the
recognition of complexities of molecular dispersion of drugs in polymers.
The mechanisms underpinning the dissolution increase of these formulations are still not
yet clearly understood. Currently, there is a belief that the fundamental critical factor is the
molecular dispersion of the drug in the polymer, thereby representing the ultimate in
particle size reduction and lattice energy negation. A number of papers have addressed
these and associated issues such as wetting and reduction in agglomeration (Janssens and
Van den Mooter, 2009; Vasconcelos et al., 2007). In addition, earlier work in the pre-HME
solid dispersion field suggested that the drug dissolution may be controlled by the
behaviour of the carrier (so-called ‘carrier controlled dissolution’), by implication
suggesting that the physical state of the drug may not be important in such systems
(Corrigan, 1985; Craig, 2002). The specific issue of whether full amorphisation (in terms
of either molecular dispersion or amorphous phase generation) is actually necessary to
achieve fast and complete dissolution has been addressed by previous authors. For
example, Verheyen et al. observed that the dissolution rate of diazepam and temazepam
could be enhanced when prepared into solid dispersions with polyethylene glycol (PEG)
6000, although both drugs remained in a highly crystalline state (Verheyen et al., 2002).
The reason for this behaviour was attributed to the existence of a micro-environment
created by the polymer at the surface of the drug particles leading to a better wetting and
solubilisation properties.

Chapter VII
245
Another point of concern when dealing with amorphous solid dispersions is their physical
stability over storage. It is generally accepted that the recrystallisation of these systems is
dependent on the molecular mobility and the degree of supersaturation of the solute in the
matrix (Weuts et al., 2005). As the molecular mobility increases, the risk of crystallisation
also increases. In general, the addition of polymers exerts a protective effect, which can be
a result of two main factors: an antiplasticising effect of the polymer or interactions
between the drug and the polymer, or a combination of both. An antiplasticising effect of
the polymer may contribute significantly by increasing the temperature at which the
molecular mobility become significant (Van den Mooter et al., 2000). However, several
studies have shown that crystallisation occurs well below the Tg and hydrogen bonding
between the drug and the polymer is not always a prerequisite in the stabilisation of
amorphous compounds (Van den Mooter et al., 2000; Zhu et al., 2010). Based on the
preceding discussion, it is clear that the physiochemical properties of polymers and their
role during dissolution and as inhibitors of crystallisation from the amorphous state are not
yet fully understood.
In this study, olanzapine (OLZ) was selected as the model drug and formulated with three
hydrophilic polymers, polyvinylpyrrolidone K30 (PVP), polyvinylpyrrolidone vinyl-
acetate 6:4 (PVPVA) and polyvinyl-caprolactam polyvinyl-acetate polyethylene glycol
graft copolymer (Soluplus®, SLP) via hot melt extrusion (HME). HME is a widely used
technology in which API and carrier are converted into a product of uniform shape and
density by the effect of heat and mechanical stress (Crowley et al., 2007; Repka et al.,
2007). HME represents a continuous solvent-free manufacturing method and is relatively
easy to scale-up, hence presenting a commercially viable approach to dosage form
development.
OLZ is an atypical antipsychotic agent used to treat both negative and positive symptoms
of schizophrenia, acute mania with bipolar disorder, agitation, and psychotic symptoms in
dementia (Burns, 2001). According to Biopharmaceutical Classification System (BCS),
OLZ is classified as a Class II drug (low solubility, high permeability) with water
solubility around 43 mg/L (Thakuria and Nangia, 2011). OLZ has been suggested to
crystallise in more than 50 different crystalline forms, including anhydrates, hydrates and
solvates (Reutzel-Edens et al., 2003a; Bhardwaj et al., 2013). In this study, anhydrous OLZ
Form I, the most stable form and currently used in pharmaceutical formulations, was
Chapter VII
246
chosen as the model form. Regarding the polymers used in this work, numerous studies
have been conducted on the solubility enhancement of water insoluble compounds, in
particular using PVP and its derivatives as carriers (Moneghini et al., 1998; Hülsmann et
al., 2000; Tantishaiyakul et al., 1996, 1999). High solubilisation effect and the ability of
establishing hydrogen bonding with APIs are well recognised properties of PVP based
polymers (Konno and Taylor, 2006; Trasi and Taylor, 2012). PVP K30 has a higher glass
transition temperature (Tg) and a relatively low degradation temperature (Tdeg) when
compared with PVPVA 6:4 what can represent an issue during processing via HME.
Moreover, PVP is classified as an extremely hygroscopic substance, which is attributed to
the electronegative groups (C=O) in the pyrrolidone structure being able to establish
hydrogen bonding with water (Callahan et al., 1982). The co-polymer PVPVA 6:4 has a
40% replacement with lipophilic vinyl-acetate functional groups and therefore it is less
hygroscopic than the homopolymer system ( u hler, 2005). SLP on the other hand is a
synthetic polymer that combines both hydrophilic and hydrophobic components in its
structure which facilitates increased solubilisation of drugs and thus the preparation of
fully amorphous solid dispersions. Moreover, its low Tg (≈ 70 oC) compared to the PVP
based polymers permits easier processing of thermolabile APIs, while its low
hygroscopicity can have an important stabilising effect during storage. Lately, polymer
blends have also gained considerable attention as they can offer several physicochemical
attributes to the dosage form as opposed to the use of a single polymer (Six et al., 2004;
Sakurai et al., 2012; Bley et al., 2010; Yang et al., 2013).
In this study, the effect of different polymers on the manufacturing process and
stabilisation over storage was critically assessed. Moreover, attention was paid to the
physical state of the prepared extrudates and its influence during the dissolution
performance. At first, the optimal extrusion temperatures for the OLZ-polymer systems
based on the properties of each material (i.e. Tg, Tm and Tdeg) was evaluated. In addition,
the thermodynamic solubility/miscibility and interaction of OLZ in each polymer were
assessed using melting point depression (Marsac et al., 2009; Marsac et al., 2006) and
solubility parameter approaches (Kontogeorgis, 2007; Hansen, 2007; Krevelen and
Nijenhuis, 2009). The physicochemical properties and the morphology of the fresh and
aged extrudates were evaluated using differential scanning calorimetry (DSC), Fourier

Chapter VII
247
transform infrared (FTIR), X-ray powder diffraction (XRPD) and scanning electron
microscopy (SEM). Dissolution experiments and stability studies were as well carried out.
7.2 Materials and Methods
7.2.1 Materials
Olanzapine (OLZ, molecular weight (MW) = 312.43 g/mol, density (ρ) = 1.30 g/cm3) was
purchased from Myjoy Ltd. (India), PVP K30 (MW ≈ 41 550 g/mol, ρ = 1.16 g/cm3),
PVPVA 6:4 (MW = 57 500 g/mol, ρ = 1.17 g/cm3) and Soluplus
® (SLP, MW = 118 000
g/mol, ρ = 1.20 g/cm3) were kindly donated by BASF Chemicals (Germany). Methanol
(analytical grade) was obtained from Sigma Aldrich (UK). Phosphate buffer, pH = 6.8
(BP), used for the dissolution studies was prepared with potassium dihydrogen
orthophosphate (Fischer Scientific, UK) and sodium phosphate dibasic (Sigma Aldrich,
UK). Storage environment with 75% RH was prepared using a salt solution of sodium
chloride (Fischer Scientific, UK).
7.2.2 Methods
7.2.2.1 Preparation of Hot Melt Extrudates
Hot melt extrudates were prepared using a co-rotating twin screw extruder Thermo
Scientific HAAKE MiniLab II (Thermo Scientific). Extrudates of OLZ with PVPVA and
SLP were prepared with ratios of 20:80 and 50:50 (w/w) and extruded at 160 and 180 oC;
OLZ:PVP extrudates were only successfully prepared at 50:50 (w/w) and extruded at
160 oC. Each system was prepared using a total weight of 5 g at a speed of 100 rpm and
mixed inside the barrel for 10 min.
Chapter VII
248
7.2.2.2 Drug-Polymer Miscibility Prediction
(a) Melting Point Depression (MPD)
OLZ and polymers were passed through a combination of sieves and a fraction between
63-106 μm was used in all melting point depression experiments. Polymers were dried
over P2O5 for 48 h prior to usage. Physical mixtures (PMs) with a drug ratio of 70, 75, 80,
85, 90 and 100% w/w were prepared at least in triplicate. The melting temperature of OLZ
both in the absence and presence of polymers was measured using DSC at a scanning rate
of 10 oC/min in standard crimped pans.
(b) Hansen Solubility Parameter
The Hansen solubility parameters, δ, of the drug and the polymers were calculated from
their chemical structures using the van Krevelen and Hoftyzer method according to the
Equation 7.1 and Equation 7.2 (Krevelen and Nijenhuis, 2009). The total solubility
parameter (δt) was determined from the interactions between dispersion forces (δd), polar
interactions (δp) and hydrogen bonding (δh) of the functional groups in the parent molecule
divide by the molar volume, V. The units of the solubility parameters are MPa1/2
.
Equation 7.1
√(∑
)
(
√∑
)
(√∑
)
Equation 7.2
where, Fdi, Fpi and Ehi are the group contributions for different components (dispersion
forces, polar interactions and hydrogen bonding, respectively) of structural groups which
are reported in the literature at 25 oC (Krevelen and Nijenhuis, 2009).
The drug-polymer interaction parameter, χ, using the solubility parameters difference
between the drug and the polymer, can be estimated as follow (Krevelen and Nijenhuis,
2009),
Chapter VII
249
Equation 7.3
where, V0 is the volume of the lattice site, R is the gas constant and T is the absolute
temperature.
7.2.2.3 Crystallinity Quantification
The amount of crystalline OLZ present in the fresh extrudates was estimated by
constructing a calibration curve using the enthalpy of melting of OLZ in the presence of
the polymer versus the ratio of the drug in the mixture. This was performed in order to
account for changes in the melting behaviour and enthalpy caused by the presence of the
polymer. Physical mixtures (PMs) were prepared by mixing OLZ and each polymer with a
mortar and pestle in ratios of 10:90, 20:80, 30:70, 50:50, 70:30 and 90:10 w/w and
analysed in DSC. All the PMs were used with a 63−106 μm particle size range.
Measurements were made at least in triplicate.
7.2.2.4 Thermal Analysis
Standard differential scanning calorimetry (DSC, Q2000 TA Instruments) analysis was
performed at a heating rate of 10 oC/min. Modulated temperature DSC (MTDSC, Q2000
TA Instruments) analysis was conducted using a heating rate of 2 oC/min,
amplitude ± 0.318 oC and a period of 60 seconds. Scans were carried out within the
temperature range 0 °C to 220 °C and standard crimped pans were used in all experiments.
Thermogravimetric analysis (TGA, Q5000 TA Instruments) was used to measure the
degradation temperature (Tdeg) of the raw materials and the water content of the fresh
extrudates. Studies were conducted at 10 oC/min from room temperature to 300
oC.
Aluminium open pans were used.
Chapter VII
250
7.2.2.5 Attenuated Total Reflection-Fourier Transform Infrared (ATR-FTIR)
FTIR (IFS 66/S, Bruker Optics Ltd.) equipped with a Golden Gate attenuated total
reflection (ATR) accessory was used. Sixty-four scans, from 4000 cm-1
to 550 cm-1
, were
acquired for each sample with a resolution of 2 cm-1
. Extrudates were scanned in powder
form after gentle grinding with a mortar and pestle.
7.2.2.6 Dynamic Vapour Sorption (DVS)
DVS (Q5000 SA, TA Instruments) was used to study the water uptake behaviour of all
solid dispersions systems immediately after preparation and without any pre-treatment of
the samples. Isothermal (25 oC) and isohumic (98% RH) conditions were used for a period
of 16 h.
7.2.2.7 X-Ray Powder Diffraction (XRPD)
XRPD (Thermo-ARL Xtra, Thermo Scientific) spectra were collected from scans within
the range 5.0o to 40.0
o at 2θ. Extrudates were pre-milled by mortar and pestle before the
tests.
7.2.2.8 Scanning Electron Microscopy (SEM)
SEM (JSM 4900 LV, JOEL) was used to acquire microphotographs on the surface and
cross-section of the freshly prepared extrudates. To improve conductivity prior
examination, samples were coated with gold using a Polaron SC7640 sputter gold coater
(Quorum Technologies).
7.2.2.9 Dissolution Studies
The drug content of each system was determined by UV detection (Lambda XLS UV/VIS,
Perkin Elmer) at 253 nm. Samples were dissolved in methanol and diluted with the same
solvent as appropriate.

Chapter VII
251
Dissolution studies were carried out on a Copley CIS 8000 dissolution bath
(Copley Scientific). The BP paddle method with a rotation speed of 50 rpm was employed
and 900 mL of phosphate buffer pH = 6.8 (BP) at the temperature of 37.0 ± 0.5 oC was
used. Samples (pure OLZ, PMs and HME) equivalent to 12 mg of OLZ (based on the drug
loading of each formulation) were used with a 63-106 μm sieve fraction. At predetermined
intervals, 10 mL of solution was withdrawn and filtered through a 0.45 μm filter.
Subsequently, the filtrate was analysed spectrophotometrically at 253 nm. All the
dissolution experiments were performed under sink conditions.
To compare the dissolution performances between the different systems, a similarity factor
(f2) was used (see Chapter 6 for the theoretical background).
7.2.2.10 Physical Stability
The stability of the extrudates was assessed using accelerated conditions according to ICH
Topic Q 1 A (R2) Stability Testing of new Drug Substances and Products (EMA, 2003).
The samples were stored in desiccators at 75% ± 5% RH/40 ± 2 °C for three months. The
humidity environment was obtained by using saturated salt solution of sodium chloride
(75% RH). Sampling at different time points and respective characterisation was done for
each system using DSC, XRPD and SEM.
7.3 Results and Discussion
7.3.1 Estimation of Drug-Polymer Miscibility
The thermodynamic miscibility between OLZ and each polymer was investigated by using
two different approaches (described earlier in the Methods section): melting point
depression (MPD) and Hansen solubility parameter. The former method describes the
drug-polymer miscibility based on the Flory-Huggins theory (Flory, 1942), which
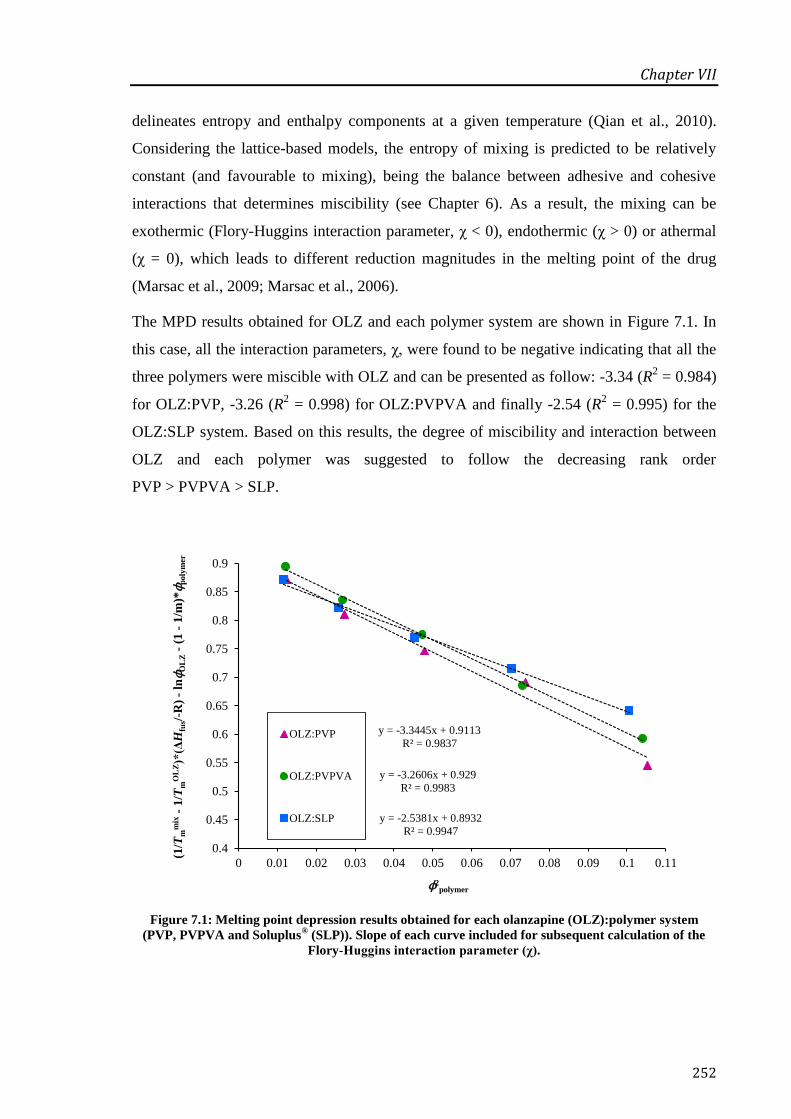
Chapter VII
252
delineates entropy and enthalpy components at a given temperature (Qian et al., 2010).
Considering the lattice-based models, the entropy of mixing is predicted to be relatively
constant (and favourable to mixing), being the balance between adhesive and cohesive
interactions that determines miscibility (see Chapter 6). As a result, the mixing can be
exothermic (Flory-Huggins interaction parameter, χ < 0), endothermic (χ > 0) or athermal
(χ = 0), which leads to different reduction magnitudes in the melting point of the drug
(Marsac et al., 2009; Marsac et al., 2006).
The MPD results obtained for OLZ and each polymer system are shown in Figure 7.1. In
this case, all the interaction parameters, χ, were found to be negative indicating that all the
three polymers were miscible with OLZ and can be presented as follow: -3.34 (R2 = 0.984)
for OLZ:PVP, -3.26 (R2 = 0.998) for OLZ:PVPVA and finally -2.54 (R
2 = 0.995) for the
OLZ:SLP system. Based on this results, the degree of miscibility and interaction between
OLZ and each polymer was suggested to follow the decreasing rank order
PVP > PVPVA > SLP.
Figure 7.1: Melting point depression results obtained for each olanzapine (OLZ):polymer system
(PVP, PVPVA and Soluplus® (SLP)). Slope of each curve included for subsequent calculation of the
Flory-Huggins interaction parameter (χ).
y = -3.3445x + 0.9113
R² = 0.9837
y = -3.2606x + 0.929
R² = 0.9983
y = -2.5381x + 0.8932
R² = 0.9947
0.4
0.45
0.5
0.55
0.6
0.65
0.7
0.75
0.8
0.85
0.9
0 0.01 0.02 0.03 0.04 0.05 0.06 0.07 0.08 0.09 0.1 0.11
ϕ2polymer
OLZ:PVP
OLZ:PVPVA
OLZ:SLP
(1/T
mm
ix-
1/T
mO
LZ)*
(ΔH
fus/
-R)
-ln
ϕO
LZ
-(1
-1/m
)*ϕ
poly
mer

Chapter VII
253
Figure 7.2 shows the changes in the Gibbs free energy (see Chapter 6 for the background
theory) for the three systems. For small values of the interaction parameter, the free energy
of mixing is negative and shows a concave dependence on composition indicating
miscibility. As expected and according to Equation 6.6 in Chapter 6, the ΔGmix is negative
for all the OLZ:polymer systems, though presenting lower values for the OLZ:PVP and
OLZ:PVPVA systems when compared to the OLZ:SLP and therefore indicating greater
miscibility for these systems.
Figure 7.2: Free energy-composition phase diagrams of olanzapine (OLZ) and each polymer system
(PVP, PVPVA and Soluplus® (SLP)).
The second approach in analysing OLZ:polymer system miscibility was by using Hansen
solubility parameters (δ), which were calculated based on van Krevelen and Hoftyzer
group contribution (Equation 7.2). Figure 7.3 shows the chemical structure of OLZ. As an
example, the calculations of the Hansen solubility parameter carried out for OLZ are given
in Table 7.1. The van Krevelen and Hoftyzer group contribution method used to calculate
the total interaction forces for OLZ and each polymer was based on literature values
(Krevelen and Nijenhuis, 2009).
-0.005
-0.004
-0.003
-0.002
-0.001
0
0 0.1 0.2 0.3 0.4 0.5 0.6 0.7 0.8 0.9 1 1.1
ΔG
mix
/RT
ϕpolymer
OLZ:PVPVA
OLZ:SLP
OLZ:PVP
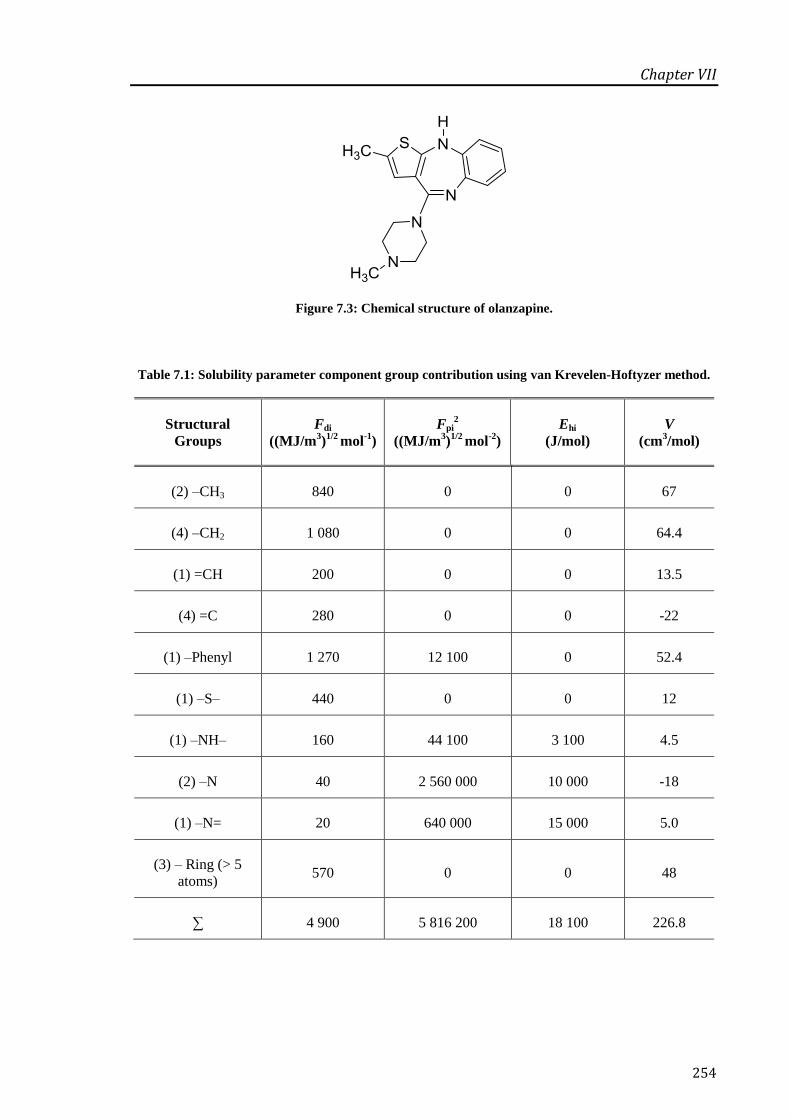
Chapter VII
254
Figure 7.3: Chemical structure of olanzapine.
Table 7.1: Solubility parameter component group contribution using van Krevelen-Hoftyzer method.
Structural
Groups
Fdi
((MJ/m3)
1/2 mol
-1)
Fpi2
((MJ/m3)
1/2 mol
-2)
Ehi
(J/mol)
V
(cm3/mol)
(2) –CH3 840 0 0 67
(4) –CH2 1 080 0 0 64.4
(1) =CH 200 0 0 13.5
(4) =C 280 0 0 -22
(1) –Phenyl 1 270 12 100 0 52.4
(1) –S– 440 0 0 12
(1) –NH– 160 44 100 3 100 4.5
(2) –N 40 2 560 000 10 000 -18
(1) –N= 20 640 000 15 000 5.0
(3) – Ring (> 5
atoms) 570 0 0 48
∑ 4 900 5 816 200 18 100 226.8
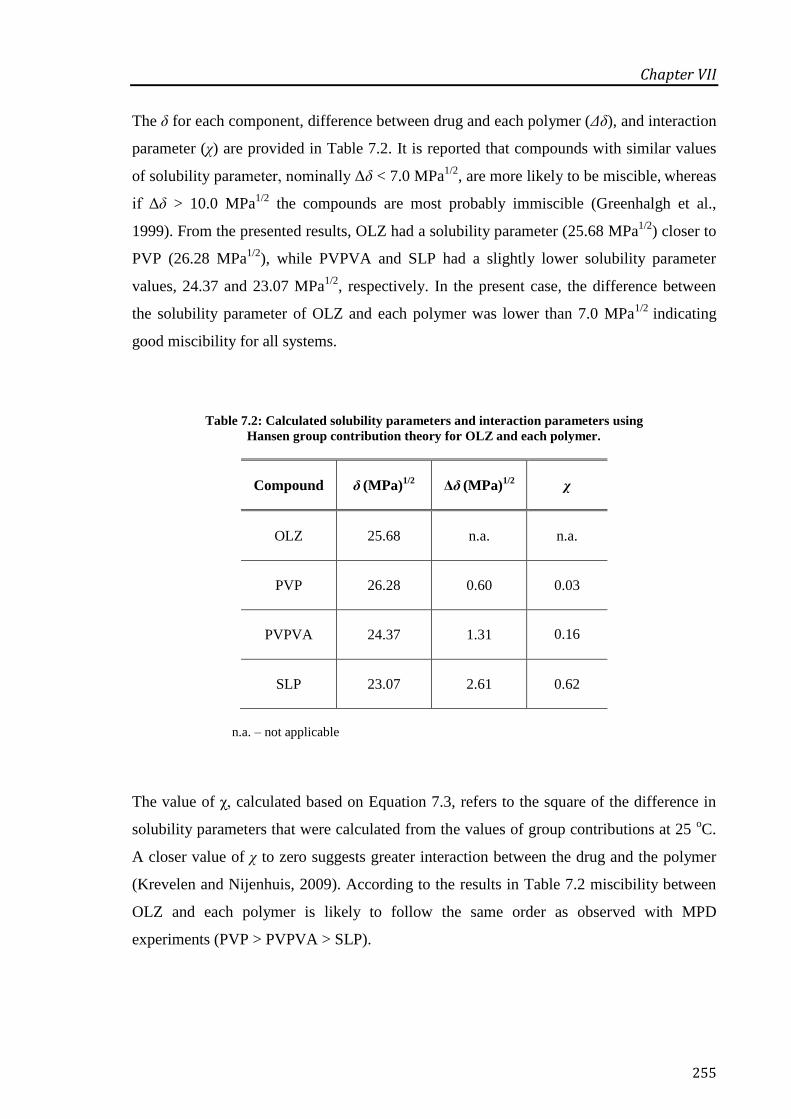
Chapter VII
255
The δ for each component, difference between drug and each polymer (Δδ), and interaction
parameter (χ) are provided in Table 7.2. It is reported that compounds with similar values
of solubility parameter, nominally Δδ < 7.0 MPa1/2
, are more likely to be miscible, whereas
if Δδ > 10.0 MPa1/2
the compounds are most probably immiscible (Greenhalgh et al.,
1999). From the presented results, OLZ had a solubility parameter (25.68 MPa1/2
) closer to
PVP (26.28 MPa1/2
), while PVPVA and SLP had a slightly lower solubility parameter
values, 24.37 and 23.07 MPa1/2
, respectively. In the present case, the difference between
the solubility parameter of OLZ and each polymer was lower than 7.0 MPa1/2
indicating
good miscibility for all systems.
Table 7.2: Calculated solubility parameters and interaction parameters using
Hansen group contribution theory for OLZ and each polymer.
Compound δ (MPa)1/2
Δδ (MPa)1/2
χ
OLZ 25.68 n.a. n.a.
PVP 26.28 0.60 0.03
PVPVA 24.37 1.31 0.16
SLP 23.07 2.61 0.62
n.a. – not applicable
The value of χ, calculated based on Equation 7.3, refers to the square of the difference in
solubility parameters that were calculated from the values of group contributions at 25 oC.
A closer value of χ to zero suggests greater interaction between the drug and the polymer
(Krevelen and Nijenhuis, 2009). According to the results in Table 7.2 miscibility between
OLZ and each polymer is likely to follow the same order as observed with MPD
experiments (PVP > PVPVA > SLP).

Chapter VII
256
These two methods used here to predict drug-polymer miscibility have concomitant
strengths and limitations, as has been discussed extensively in the literature. In brief, the
MPD approach is temperature and composition dependent whereas the calculation of
solubility parameters allows the estimation of the degree of miscibility based on the
chemical structure of the drug and polymer at room temperature (Forster et al., 2001b;
Hancock et al., 1997). Moreover, MPD methods may not be performed properly if the drug
degrades at the melting temperature, while the group contribution method for the
calculation of Hansen solubility is not applicable for drug-polymer systems presenting
strong intermolecular interactions (Zhao et al., 2011). In this work, the two approaches
used to predict the miscibility between OLZ and each polymer were in good agreement,
with PVP being identified by both as the polymer presenting the greatest degree of
miscibility with OLZ, followed by PVPVA and finally SLP. The agreement between the
two approaches lends weight to the applicability of the theoretical approaches used,
although clearly experimental measurements, as performed below, are ultimately the most
reliable means of testing miscibility.
7.3.2 Properties of the Raw Materials
In general, for HME processing the temperature should be higher than the glass transition
temperature (Tg) of the carrier in order to decrease its viscosity and promote an adequate
mixing with the drug and an ideal flow through the extruder. The optimal extrusion
temperature has to be carefully determined based on the melting temperature (Tm) of the
drug, the Tg of the amorphous carrier and the thermoplastic properties of the carrier
(Srinarong et al., 2011). Therefore, it is imperative that the thermal properties of drug
substances and excipients are well understood prior to extrusion.
Table 7.3 shows the main thermal properties of OLZ and each polymer. PVP has the
highest Tg and the lowest degradation temperature (Tdeg, measured by using TGA as the
onset temperature) when compared to PVPVA and SLP. According to the presented
results, neither OLZ nor the polymers appeared to degrade at the extrusion temperatures
used in this study (160 oC for all the three systems and 180
oC for PVPVA and SLP as PVP

Chapter VII
257
degraded at this temperature). Particular attention was paid to PVP due to the smaller
temperature interval between its Tg, Tdeg and the processing temperature. However, holding
PVP isothermally in the TGA at 160 oC for 30 min resulted in a 0.81 ± 0.10% loss of mass,
suggesting that 160 oC might be a suitable temperature for the extrusion of the OLZ:PVP
formulation.
Table 7.3: Experimental thermal properties of OLZ and polymers.
Material Tm onset ± s.d. (oC) Tg ± s.d. (
oC) Tdeg ± s.d. (
oC)
Water content
± s.d. (%)
OLZ 193.6 ± 0.3 71.4 ± 0.4* 265.3 ± 4.0 0.36 ± 0.06
PVP n.a 161.6 ± 0.2 179.8 ± 1.6 5.53 ± 0.94
PVPVA n.a. 105.6 ± 1.4 282.3 ± 1.0 3.48 ± 1.15
SLP n.a. 72.9 ± 0.3 309.1 ± 1.3 2.36 ± 0.14
n.a. – not applicable
*Tg value obtained from heat-cool-heat cycle inside the DSC at 2 oC/min in crimped pans
7.3.3 Physical Characterisation of HME Systems
Attempts to extrude PVP with a low drug loading of 20% were unsuccessful. It is well
known that the use of PVP in HME formulations is limited due to its high Tg (≈ 160 oC)
and low Tdeg which is below 180 °C. Therefore, the incorporation of small molecules of
API allow the polymer segments to have greater mobility due to plasticisation effects and
hence be extruded at lower temperatures (Lakshman et al., 2008). Studies with ibuprofen
and ethyl cellulose showed that higher drug loadings of ibuprofen not only eased the
extrusion behaviour of ethyl cellulose by decreasing its Tg but also improved the physical
properties of the prepared films (De Brabander et al., 2003; De Brabander et al., 2002). In
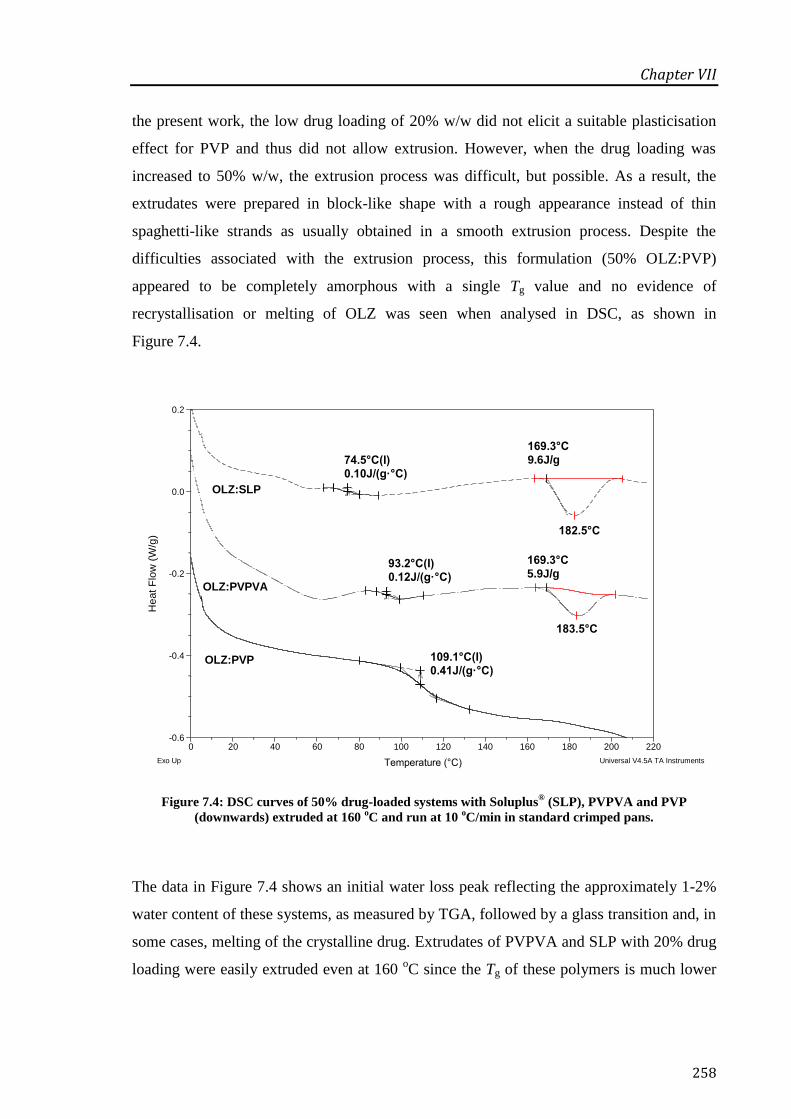
Chapter VII
258
the present work, the low drug loading of 20% w/w did not elicit a suitable plasticisation
effect for PVP and thus did not allow extrusion. However, when the drug loading was
increased to 50% w/w, the extrusion process was difficult, but possible. As a result, the
extrudates were prepared in block-like shape with a rough appearance instead of thin
spaghetti-like strands as usually obtained in a smooth extrusion process. Despite the
difficulties associated with the extrusion process, this formulation (50% OLZ:PVP)
appeared to be completely amorphous with a single Tg value and no evidence of
recrystallisation or melting of OLZ was seen when analysed in DSC, as shown in
Figure 7.4.
Figure 7.4: DSC curves of 50% drug-loaded systems with Soluplus® (SLP), PVPVA and PVP
(downwards) extruded at 160 oC and run at 10
oC/min in standard crimped pans.
The data in Figure 7.4 shows an initial water loss peak reflecting the approximately 1-2%
water content of these systems, as measured by TGA, followed by a glass transition and, in
some cases, melting of the crystalline drug. Extrudates of PVPVA and SLP with 20% drug
loading were easily extruded even at 160 oC since the Tg of these polymers is much lower
109.1°C(I)0.41J/(g·°C)
OLZ:PVP
74.5°C(I)0.10J/(g·°C)
182.5°C
169.3°C9.6J/g
OLZ:SLP
93.2°C(I)0.12J/(g·°C)
183.5°C
169.3°C5.9J/g
OLZ:PVPVA
-0.6
-0.4
-0.2
0.0
0.2
He
at
Flo
w (
W/g
)
0 20 40 60 80 100 120 140 160 180 200 220
Temperature (°C)Exo Up Universal V4.5A TA Instruments
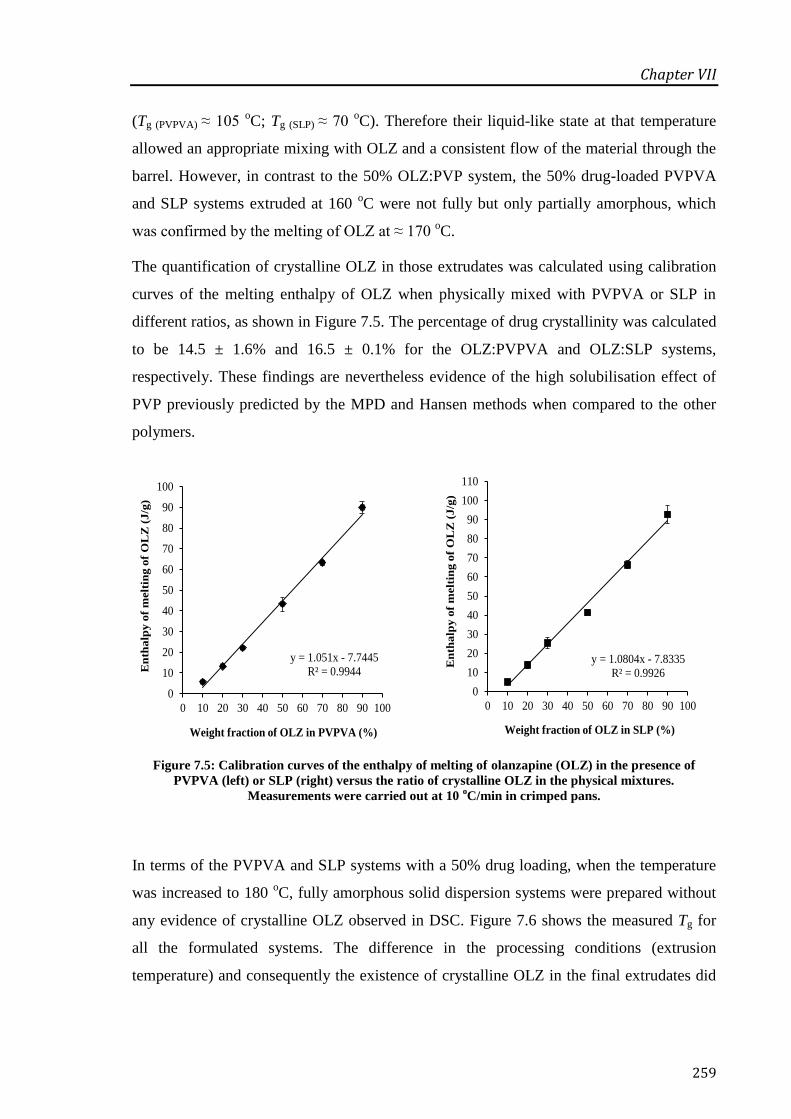
Chapter VII
259
y = 1.051x - 7.7445
R² = 0.9944
0
10
20
30
40
50
60
70
80
90
100
0 10 20 30 40 50 60 70 80 90 100
En
thalp
y o
f m
elt
ing o
f O
LZ
(J/g
)
Weight fraction of OLZ in PVPVA (%)
y = 1.0804x - 7.8335
R² = 0.9926
0
10
20
30
40
50
60
70
80
90
100
110
0 10 20 30 40 50 60 70 80 90 100
En
thalp
y o
f m
elt
ing o
f O
LZ
(J/g
)
Weight fraction of OLZ in SLP (%)
(Tg (PVPVA) ≈ 105 oC; Tg (SLP) ≈ 70
oC). Therefore their liquid-like state at that temperature
allowed an appropriate mixing with OLZ and a consistent flow of the material through the
barrel. However, in contrast to the 50% OLZ:PVP system, the 50% drug-loaded PVPVA
and SLP systems extruded at 160 oC were not fully but only partially amorphous, which
was confirmed by the melting of OLZ at ≈ 170 oC.
The quantification of crystalline OLZ in those extrudates was calculated using calibration
curves of the melting enthalpy of OLZ when physically mixed with PVPVA or SLP in
different ratios, as shown in Figure 7.5. The percentage of drug crystallinity was calculated
to be 14.5 ± 1.6% and 16.5 ± 0.1% for the OLZ:PVPVA and OLZ:SLP systems,
respectively. These findings are nevertheless evidence of the high solubilisation effect of
PVP previously predicted by the MPD and Hansen methods when compared to the other
polymers.
Figure 7.5: Calibration curves of the enthalpy of melting of olanzapine (OLZ) in the presence of
PVPVA (left) or SLP (right) versus the ratio of crystalline OLZ in the physical mixtures.
Measurements were carried out at 10 oC/min in crimped pans.
In terms of the PVPVA and SLP systems with a 50% drug loading, when the temperature
was increased to 180 oC, fully amorphous solid dispersion systems were prepared without
any evidence of crystalline OLZ observed in DSC. Figure 7.6 shows the measured Tg for
all the formulated systems. The difference in the processing conditions (extrusion
temperature) and consequently the existence of crystalline OLZ in the final extrudates did

Chapter VII
260
not have a great influence on the measured Tg of the PVPVA and SLP systems. As
expected, 50% OLZ:PVP showed the highest Tg (≈ 108 oC), followed by the formulations
with PVPVA (≈ 90 oC) and finally SLP (≈ 74
oC).
Figure 7.6: Measured Tg values for all the freshly prepared formulations using DSC (total heat flow) at
10 oC/min in crimped pans. Blue and red bars represent systems extruded at
160 oC and 180
oC, respectively.
FTIR spectroscopy was employed to study the interactions in solid dispersions between
OLZ and the three polymers. The FTIR spectra of all PMs were only the summation of the
OLZ and each polymer isolated spectrum, giving no evidence of any interaction between
the drug and polymers in PMs (data not shown). OLZ has a single hydrogen bond donor
(N-H) and all the polymers have in common at least one proton acceptor (C=O) able to
participate in hydrogen bonding. In the case of PVPVA and SLP, a second group (C=O)
from the vinyl-acetate component is present, however it is stereo chemically hindered and
it does not participate in hydrogen bonding. Typically, the formation of hydrogen bonds
within a given system may be readily identified through either, a downshift in the
absorption band, band broadening, and/or peak intensification (Konno and Taylor, 2006).
As shown in Table 7.4 a greater level of interaction between OLZ:PVP and OLZ:PVPVA
systems was observed with downshifts higher than 4 cm-1
. In contrast, no interaction
between OLZ and SLP seemed to take place as no shifts to lower wavenumber were
20%
OLZ:PVPVA50%
OLZ:PVPVA
20%
OLZ:SLP
50%
OLZ:PVP
50%
OLZ:SLP
0
10
20
30
40
50
60
70
80
90
100
110
120
Tg
(oC
)

Chapter VII
261
detected. The N-H stretching vibration of OLZ was not detected in all the three systems as
an indication of the conversion to an amorphous phase.
Table 7.4: Shifts on the carbonyl groups for each polymer and respective HME system (cm-1).
Polymers and HME systems
PVP 1667
50% OLZ:PVP (160 oC) 1655
PVPVA 1731 1673
20% OLZ:PVPVA (160 oC) 1731 1664
20% OLZ:PVPVA (180 oC) 1732 1666
50% OLZ:PVPVA (160 oC) 1733 1664
50% OLZ:PVPVA (180 oC) 1733 1663
SLP 1731 1632
20% OLZ:SLP (160 oC) 1732 1632
20% OLZ:SLP (180 oC) 1732 1632
50% OLZ:SLP (160 oC) 1734 1633
50% OLZ:SLP (180 oC) 1734 1634

Chapter VII
262
The DSC findings outlined above were supported by the XRPD studies which showed a
considerable presence of crystalline OLZ (Figure 7.7a) for the 50% drug-loaded PVPVA
and SLP extruded at 160 oC (Figure 7.7b).
Figure 7.7: XRPD spectra of (a) pure OLZ and (b) 50% drug-loaded formulations from top to bottom:
SLP, PVPVA and PVP extruded at 160 oC and SLP and PVPVA extruded at 180
oC.
Although the XRPD peaks in those systems were relatively broad and with significant
background noise associated it is still possible to confirm that the diffraction peaks did
0
1000
2000
3000
4000
5000
5 10 15 20 25 30 35 40
Inte
nsi
ty
2θ (degree)
a)
5 10 15 20 25 30 35 40
Inte
nsi
ty
2θ (degree)
b)
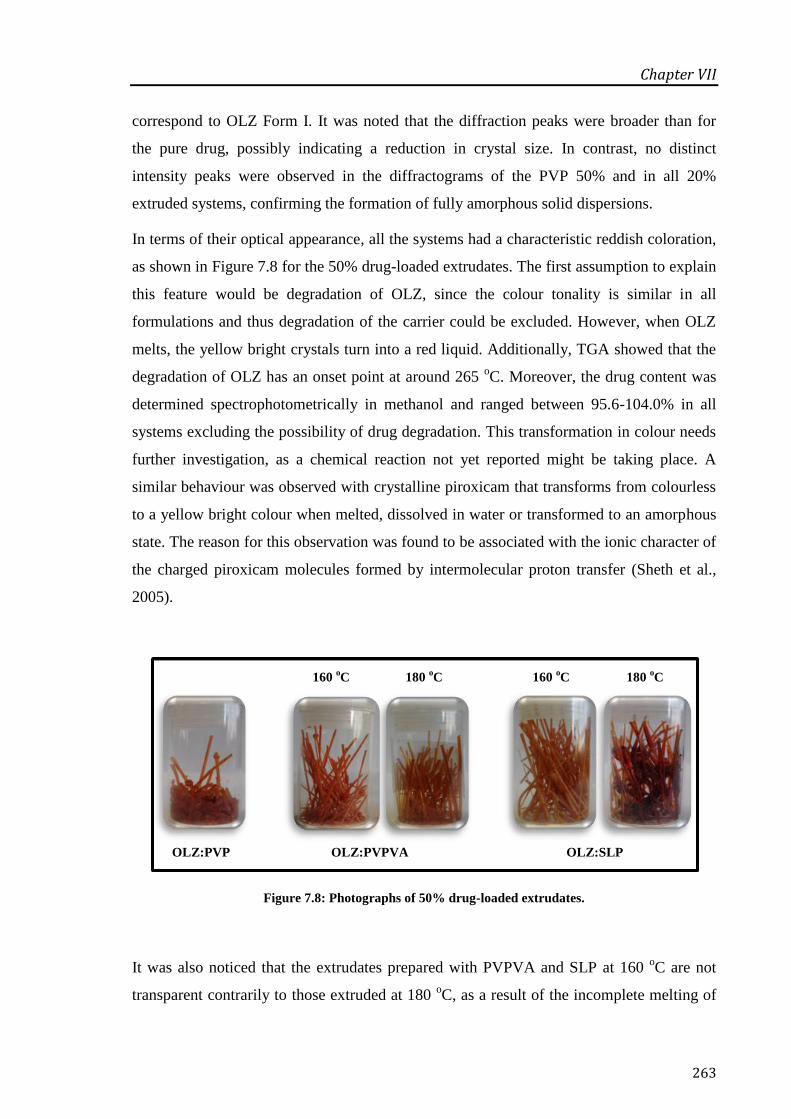
Chapter VII
263
correspond to OLZ Form I. It was noted that the diffraction peaks were broader than for
the pure drug, possibly indicating a reduction in crystal size. In contrast, no distinct
intensity peaks were observed in the diffractograms of the PVP 50% and in all 20%
extruded systems, confirming the formation of fully amorphous solid dispersions.
In terms of their optical appearance, all the systems had a characteristic reddish coloration,
as shown in Figure 7.8 for the 50% drug-loaded extrudates. The first assumption to explain
this feature would be degradation of OLZ, since the colour tonality is similar in all
formulations and thus degradation of the carrier could be excluded. However, when OLZ
melts, the yellow bright crystals turn into a red liquid. Additionally, TGA showed that the
degradation of OLZ has an onset point at around 265 oC. Moreover, the drug content was
determined spectrophotometrically in methanol and ranged between 95.6-104.0% in all
systems excluding the possibility of drug degradation. This transformation in colour needs
further investigation, as a chemical reaction not yet reported might be taking place. A
similar behaviour was observed with crystalline piroxicam that transforms from colourless
to a yellow bright colour when melted, dissolved in water or transformed to an amorphous
state. The reason for this observation was found to be associated with the ionic character of
the charged piroxicam molecules formed by intermolecular proton transfer (Sheth et al.,
2005).
Figure 7.8: Photographs of 50% drug-loaded extrudates.
It was also noticed that the extrudates prepared with PVPVA and SLP at 160 oC are not
transparent contrarily to those extruded at 180 oC, as a result of the incomplete melting of
OLZ:PVP OLZ:SLP OLZ:PVPVA
160 oC 180
oC 160
oC 180
oC

Chapter VII
264
OLZ. Also the OLZ:PVP extrudates did not have the typical rod-shape appearance due to
its difficult extrusion. All the 20% drug-loaded extrudates had a transparent appearance
and a lighter colour as less amount of OLZ was present.
Overall, following the physical characterisation of the different solid dispersion systems
prepared with OLZ, they can be mainly divided into two major groups:
(a) Fully amorphous solid dispersions: 50% OLZ:PVP extruded at 160 °C, 50% OLZ
with PVPVA and SLP extruded at 180 oC and all the 20% drug-loaded
formulations prepared with PVPVA and SLP;
(b) Partially amorphous solid dispersions: 50% OLZ with PVPVA and SLP extruded
at 160 oC.
It was noted that the greater miscibility of OLZ with PVP, suggested by the MPD and
solubility parameter calculations, was supported by these findings. The question then arises
as to whether the variability in the degree of crystallinity will have an influence on the
associated drug release behaviour.
7.3.4 Dissolution Studies
The drug content of all formulations was at 95.6–104.0% of the theoretical values.
Figure 7.9 and Figure 7.10 show the dissolution curves of pure OLZ and freshly prepared
HME systems at 50% and 20% drug loading, respectively. A significant enhancement in
the dissolution rate was observed for all solid dispersion systems prepared by HME
compared to the pure crystalline OLZ. More specifically, in the case of the 50% drug-
loaded extrudates, the T50 values were circa 3 min for the dispersions with PVPVA and
SLP (either extruded at 160 or 180 oC) compared to 10 min for the OLZ:PVP and finally
30 min for the drug alone. The systems containing 20% OLZ extruded with PVPVA and
SLP showed an even faster dissolution rate with T50 values between 1 and 2 min at both
processing temperatures. It was interesting to observe in Figure 7.9 that with a constant
drug loading (50%) and processing temperature (160 °C), the decreasing order of drug
release rate from different polymer based systems was PVPVA (partially amorphous) >
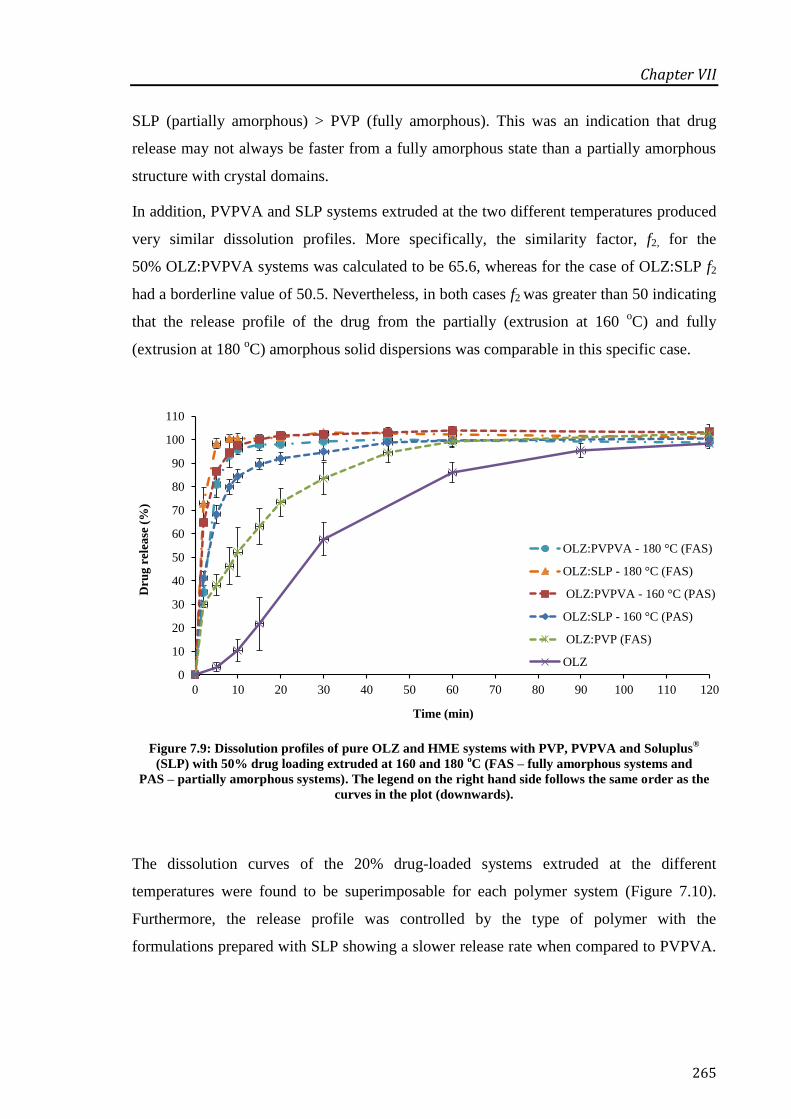
Chapter VII
265
SLP (partially amorphous) > PVP (fully amorphous). This was an indication that drug
release may not always be faster from a fully amorphous state than a partially amorphous
structure with crystal domains.
In addition, PVPVA and SLP systems extruded at the two different temperatures produced
very similar dissolution profiles. More specifically, the similarity factor, f2, for the
50% OLZ:PVPVA systems was calculated to be 65.6, whereas for the case of OLZ:SLP f2
had a borderline value of 50.5. Nevertheless, in both cases f2 was greater than 50 indicating
that the release profile of the drug from the partially (extrusion at 160 oC) and fully
(extrusion at 180 oC) amorphous solid dispersions was comparable in this specific case.
Figure 7.9: Dissolution profiles of pure OLZ and HME systems with PVP, PVPVA and Soluplus®
(SLP) with 50% drug loading extruded at 160 and 180 oC (FAS – fully amorphous systems and
PAS – partially amorphous systems). The legend on the right hand side follows the same order as the
curves in the plot (downwards).
The dissolution curves of the 20% drug-loaded systems extruded at the different
temperatures were found to be superimposable for each polymer system (Figure 7.10).
Furthermore, the release profile was controlled by the type of polymer with the
formulations prepared with SLP showing a slower release rate when compared to PVPVA.
0
10
20
30
40
50
60
70
80
90
100
110
0 10 20 30 40 50 60 70 80 90 100 110 120
Dru
g r
elea
se (
%)
Time (min)
OLZ:PVPVA - 180 °C (FAS)
OLZ:SLP - 180 °C (FAS)
OLZ:PVPVA - 160 °C (PAS)
OLZ:SLP - 160 °C (PAS)
OLZ:PVP (FAS)
OLZ

Chapter VII
266
However, at this drug loading fully amorphous solid solutions were obtained with both
processing temperatures and therefore these results are not surprising.
Figure 7.10: Dissolution profiles of 20% drug-loaded HME extrudates with PVPVA and SLP extruded
at 160 and 180 oC (all systems were characterised as fully amorphous systems). The legend on the right
hand side follows the same order as the curves in the plot (downwards).
From the above results, clearly, the nature of the polymer is an important determinant of
dissolution as well as the degree of crystallinity. However what is particularly interesting is
that the two 50% dispersions in PVPVA and SLP at 160 oC and 180
oC also showed no
differences, despite these being the same polymers but with differing degrees of drug
crystallinity. Earlier work in the solid dispersion literature (Corrigan, 1985; Craig, 2002)
has suggested that dissolution rate of some or many binary systems may be determined by
the dissolution of the carrier polymer and not the drug at all. More specifically it has been
suggested that the polymer may form a concentrated layer adjacent to the solid surface into
which the drug may dissolve rapidly, hence it is the dissolution of the polymer-rich layer
that determines drug release and not the actual dissolution of the drug itself. The results
presented here are consistent with this approach, suggesting that it is the polymer and not
the drug that determines the dissolution profile. Therefore, it may in fact be the
0
10
20
30
40
50
60
70
80
90
100
110
0 5 10 15 20 25 30
Dru
g r
elea
se (
%)
Time (min)
OLZ:PVPVA - 180 °C
OLZ:PVPVA - 160 °C
OLZ:SLP - 180 °C
OLZ:SLP - 160 °C

Chapter VII
267
characteristics of the polymer that are changing and the drug structure may, in some cases
at least, be incidental and irrelevant to performance.
In contrast, the release rate of the drug from the physical mixtures as shown in Figure 7.11
is slightly reduced for the PVP and PVPVA systems in comparison to the drug alone and
this effect is much more obvious for the PM of OLZ:SLP resulting in only less than 60%
drug release at the last sampling point of 120 min with visible particles remaining in the
medium. The reason for this feature it is not yet clearly understood, but apparently the
incomplete dissolution of the polymer at this pH influenced somehow the dissolution
behaviour of the drug. This was more evident when the polymer ratio increased in the 20%
OLZ formulations with a drug release of about ≈ 36% in the end of the test (data not
shown).
Figure 7.11: Dissolution profiles of OLZ and PM with PVP, PVPVA and SLP in
1:1 drug-polymer ratio.
These particles were collected from the dissolution vessel and examined under SEM, as
shown in Figure 7.12. Considering that SLP showed in FTIR no degree of interaction with
OLZ when compared to the other polymers, the assumption that the formation of strong
hydrogen bonds between OLZ and SLP was the reason for the incomplete dissolution
profile may not be correct. One explanation could be entrapment of the drug on the porous
0
10
20
30
40
50
60
70
80
90
100
110
0 10 20 30 40 50 60 70 80 90 100 110 120
Dru
g r
elea
se (
%)
Time (min)
OLZ
OLZ:PVP
OLZ:PVPVA
OLZ:SLP

Chapter VII
268
structure of SLP leading to kind of ‘insoluble complex’ and therefore incomplete release of
the drug.
Figure 7.12 shows also microphotographs of pure OLZ with an irregular shape; PVP and
PVPVA as round microspheres due to the fact that these two polymers are industrially
prepared via spray drying and finally SLP appearing as irregular particulates. The
cylindrical shape of PVP and PVPVA is probably favourable for the dissolution of OLZ
from the PMs in comparison to SLP.

Chapter VII
269
Figure 7.12: SEM microphotographs of pure OLZ, PMs of OLZ with each polymer and finally the
particles collected from the dissolution vessel of 50% PM OLZ:SLP after 120 min of testing.
PM OLZ:SLP
PM OLZ:SLP
from dissolution
PM OLZ:PVPVA
PM OLZ:PVP
OLZ

Chapter VII
270
7.3.5 Polymer Effect on the Inhibition of OLZ Crystallisation in HME Solid
Dispersions
In this study, the physical stability of all prepared solid dispersion systems was
investigated under storage at accelerated conditions, testing at the same time the influence
of high humidity (75% RH) and temperature (40 oC) on the recrystallisation of OLZ.
The stability of OLZ-polymer systems as a function of time was found to depend greatly
on the polymer physicochemical properties. Overall, OLZ:SLP system extruded at 180 oC
showed the greatest stability of all solid dispersion systems studied with only the first signs
of drug recrystallisation observed in DSC and under SEM after the three months of
storage, although no crystals were detected in XRPD.
During the stability studies, the 50% drug-loading systems with PVPVA and SLP extruded
at 160 oC, even though not fully amorphous after its preparation, did not show an increase
in their crystal content during storage. This was confirmed by the enthalpy of melting of
OLZ Form I that remained nearly constant during the entire period of study and by the
OLZ crystallinity in XRPD. The sample 50% OLZ:PVP was prepared fully amorphous at
the same extrusion temperature, and it was proved amorphous until two months of storage,
when the first evidence of recrystallised OLZ started to be noticed. The 50% OLZ:PVPVA
prepared at 180 oC showed a similar stability profile to the 50% OLZ:SLP extruded at the
same temperature, although some evidence of crystalline OLZ was possible to be detected
in XRPD after the three months of storage, contrarily to the SLP system. Figure 7.13
shows the XRPD data for all the 50% systems after being stored for three months under
75% RH/40 oC. All the 20% drug-loaded extrudates with PVPVA and SLP remained
amorphous during the whole study according to the DSC analysis, however due to the high
percentage of polymer they formed a coalescence masses which complicates XRPD and
SEM analysis.
Generally, greater stability of solid dispersion systems is often linked to the high Tg of the
polymer. In the present case however, the polymer Tg does not appear to be the key factor
influencing and predicting the recrystallisation tendency of OLZ. In fact, in this study SLP
has the lowest Tg compared to PVP and PVPVA but showed the greatest stability. Also the
formation of specific interactions, such as hydrogen bonding, between the drug and the
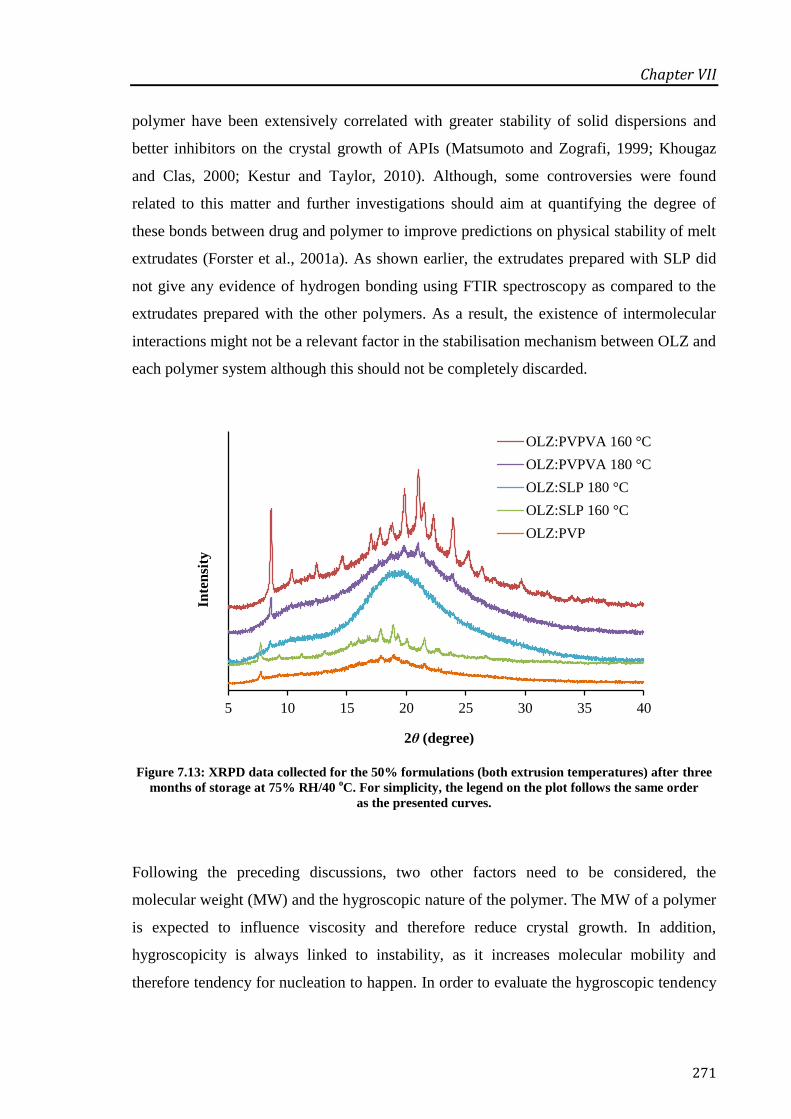
Chapter VII
271
polymer have been extensively correlated with greater stability of solid dispersions and
better inhibitors on the crystal growth of APIs (Matsumoto and Zografi, 1999; Khougaz
and Clas, 2000; Kestur and Taylor, 2010). Although, some controversies were found
related to this matter and further investigations should aim at quantifying the degree of
these bonds between drug and polymer to improve predictions on physical stability of melt
extrudates (Forster et al., 2001a). As shown earlier, the extrudates prepared with SLP did
not give any evidence of hydrogen bonding using FTIR spectroscopy as compared to the
extrudates prepared with the other polymers. As a result, the existence of intermolecular
interactions might not be a relevant factor in the stabilisation mechanism between OLZ and
each polymer system although this should not be completely discarded.
Figure 7.13: XRPD data collected for the 50% formulations (both extrusion temperatures) after three
months of storage at 75% RH/40 oC. For simplicity, the legend on the plot follows the same order
as the presented curves.
Following the preceding discussions, two other factors need to be considered, the
molecular weight (MW) and the hygroscopic nature of the polymer. The MW of a polymer
is expected to influence viscosity and therefore reduce crystal growth. In addition,
hygroscopicity is always linked to instability, as it increases molecular mobility and
therefore tendency for nucleation to happen. In order to evaluate the hygroscopic tendency
5 10 15 20 25 30 35 40
Inte
nsi
ty
2θ (degree)
OLZ:PVPVA 160 °C
OLZ:PVPVA 180 °C
OLZ:SLP 180 °C
OLZ:SLP 160 °C
OLZ:PVP

Chapter VII
272
of each fully amorphous system, DVS studies were conducted. The results obtained
showed that after 16 h at 98% RH/25 oC, PVP solid dispersion had a water uptake of
around 58%, followed by PVPVA system with 44% and finally SLP samples with only an
increase in weight of 20%. Therefore, it seems likely that the stabilisation of OLZ solid
dispersions during storage is highly dependent on the high MW and lower hygroscopic
nature of SLP, when compared with the other polymers.
Absorption of high amounts of water can lead to the formation of drug-rich and
polymer-rich amorphous phase as a result of moisture-induced drug-polymer immiscibility
(Rumondor et al., 2009; Konno and Taylor, 2008; Van Eerdenbrugh and Taylor, 2010). In
this study, the use of standard DSC with a heating rate of 10 oC/min in order to avoid
dissolution of OLZ in the polymer matrix upon heating, did not allow the identification of
any phase separation in the PVP and PVPVA systems, which can be considered in further
studies.
Figure 7.14 depicts the scanning electron micrographs of the surface and internal
(cross-section surface) appearance of the 50% drug-loaded extrudates, fresh and after three
months of storage. The fresh extrudates prepared with PVPVA and SLP at 160 oC showed
a distribution of OLZ crystals, either on the surface and cross-section, confirming the
incomplete melting of the drug during extrusion. In contrast, the formulations extruded at
180 oC showed a complete smooth surface without any evidence of crystalline OLZ. For
the system prepared with PVP, although no crystals were identified, the surface of these
extrudates was not completely smooth as a consequence of the difficult extrusion process
of this system. For all the 20% drug-loaded extrudates no signal of crystallinity was
observed (data not shown). After three months of storage, the PVP systems showed
evidence of recrystallised OLZ either on the surface and cross-section of the extrudates.
Similar observations to the fresh samples were obtained for the PVPVA and SLP systems
extruded at 160 oC. The samples extruded at 180
oC showed clearly recrystallisation of
OLZ on the surface of the extrudates, but no sign on the internal cross-section.
Chapter VII
273
OLZ:PVPVA
160 oC
Fresh samples Aged samples after being stored for three months at 75% RH/40 oC
OLZ:PVP
OLZ:SLP
160 oC

Chapter VII
274
Figure 7.14: SEM microphotographs of 1:1 fresh solid dispersion systems (surface and cross-section) and after storage at 75% RH/40 oC for three months
(cross-section and surface). The extrusion temperature for the PVPVA and SLP systems is also stated.
OLZ:PVPVA
180 oC
OLZ:SLP
180 oC

Chapter VII
275
7.4 Conclusions
Overall, the predicted miscibility and interaction between OLZ and each polymer
calculated based on MPD and Hansen solubility parameters agreed with the experimental
results in that at the same extrusion temperature (160 oC) and drug loading (50%), PVP
was found to have the greatest miscibility with OLZ leading to the molecular dispersion of
OLZ. In contrast, the extrudates prepared with PVPVA and SLP, under the same
conditions, crystalline OLZ was detected via DSC, XRPD and SEM observations. At a
higher extrusion temperature, both systems with PVPVA and SLP were characterised as
one-phase systems with a single Tg value observed in DSC. This therefore demonstrates the
complex interplay between miscibility and processing but also demonstrates that there is a
role for solubility parameter and MPD predictions in anticipating experimental findings.
In terms of the dissolution performance, the general assumption that a higher dissolution
rate is obtained when the drug is completely converted to an amorphous form is not
consistent with the findings presented in this chapter. In this specific case, it was noted that
at 50% loading and 160 oC processing, PVP showed the slowest release despite being the
only fully amorphous system. It was interesting to note that no clear relationship was found
between dissolution and drug crystallinity or indeed with processing temperature, with the
release rates being much more dependent on the choice of polymer. Therefore, in this case
at least, it may be the behaviour of the polymer that determines dissolution performance
rather than the physical state of the drug.
The chemistry of the polymer was also found to determine the stability of the OLZ solid
dispersion systems. The extrudates prepared with SLP were found to have the greatest
stability, despite the lower Tg of this polymer and the inexistence of any specific
interactions detectable by FTIR between OLZ and SLP. Properties such as the high MW
and low hygroscopicity of this polymer might be responsible for the greatest stability
observed.
Another interesting finding is related to the SEM observations of the aged HME samples.
The 50% drug loaded formulations showed that the recrystallised crystals of OLZ differed
on their shape and arrangement on the surface of the extrudates. This observation is system
dependent as expected due to the different polymer chemistry. Local thermal analysis

Chapter VII
276
(LTA) might be a helpful technique to be used in further studies, enabling, if present, the
identification of different polymorphic forms of OLZ. This might be significantly
important in the case of SLP which showed a limited crystal growth after three months of
storage.
8 CONCLUSIONS AND FUTURE WORK

Learn from yesterday, live for today, hope for tomorrow.
The important thing is not to stop questioning.
Curiosity has its own reason for existing.
Albert Einstein

Chapter VIII
279
8.1 Summary and Concluding Remarks
Polymorphism and pseudopolymorphism are nowadays recognised as an important
phenomenon during the early research screening and throughout development. This has
been a result of successful scientific improvements, strong regulatory and economic
demand. Although methods for polymorph control and characterisation are still imperfect,
more sophisticated and sensitive characterisation techniques are now available to control
this important and challenging problem. The work presented in this thesis has reiterated the
importance of having integrated characterisation strategies, as a way to achieve an in-depth
understanding of the structure-property relationship in organic solids. This scientific
approach was applied throughout this thesis for the solid state characterisation of
olanzapine and paroxetine HCl, and the respective prepared systems.
Paroxetine HCl has been in the market for more than two decades and it has been
extensively used for the treatment of depression, general anxiety and social phobia. Despite
its widespread use, the physicochemical properties of the two crystalline forms of this
drug, Form I and Form II, have not been fully investigated. Paroxetine HCl Form II was
assigned in previous works to be an unstable anhydrate form with a very hygroscopic
behaviour and paroxetine HCl Form I is a stoichiometric hemihydrate and the most stable
form (Buxton et al., 1988; Barnes et al., 1988).
In Chapter 3, a broad range of physical characterisation techniques were used in order to
obtain a detailed view of the effect and interaction of water with the structure of Form II.
High water content (≈ 3.83%, 0.80 mol of water/mol of paroxetine HCl) and an unusual
thermal behaviour, presented the first doubt on the designation of Form II as an anhydrous
form. It was then crucial to clarify the relationship between water and Form II. VH-XRPD
was the key technique in this study since it provided enough evidence of hydrate formation
as only changes in lattice spacings were observed accompanying the uptake of water. This
fact indicated that Form II exists as a non-stoichiometric hydrate and its designation as an
anhydrous form is no longer valid.
Overall, this work has highlighted the importance of distinguishing between water
adsorption, as a consequence of a hygroscopic nature, and hydrate formation. Also

Chapter VIII
280
important to emphasise that Form II was a non-stoichiometric hydrate with characteristics
and behaviour similar to channel hydrates, although these channels were not found in the
structure at a molecular level. Furthermore, these results reiterate the importance of using a
combination of several techniques and taking advantage of the available computational
tools in the characterisation of pharmaceutical materials, particular with non-stoichiometric
hydrates as they often produce a further level of complexity.
Continuing within the solid state characterisation of paroxetine HCl, the conditions that led
to the dehydration of Form I were investigated and a new anhydrous form, structurally
different than the dehydrated Form II, was identified as a consequence of this process
(Chapter 4). The dehydration process of Form I was far more complex than initially
expected and the dehydrated product was found to be very unstable and quickly rehydrated
to the initial hydrate Form I. With these challenges, structural investigation of the
dehydrated Form I was performed using VT-XRPD which allowed the dehydration process
to be carried out in situ. These results showed that the patterns obtained at high
temperatures were different than those of the dehydrated Form II, indicating that the two
forms were structurally different. In addition, the pattern of the dehydrated Form I was
highly similar to the hydrate Form I, with the unit cell parameters remaining the same, just
smaller in volume as a consequence of dehydration.
From the work presented in this chapter, a new anhydrous form of paroxetine HCl has been
identified. This new form is, however, extremely unstable and difficult to handle under
normal environment conditions. The structure solution of the new anhydrate from powder
diffraction data was not possible. In addition, the use of single crystal X-ray technique was
unsuccessful as the crystal broke during heating. Nevertheless, important insights and
understanding on the dehydration of pharmaceutical compounds can be further applied in
the particular case of stoichiometric hydrates with a peculiar behaviour of dehydration.
After the fundamental characterisation studies, paroxetine HCl Form II was converted into
an amorphous state via a melt quench method. From a pharmaceutical perspective,
amorphous materials can improve solubility and therefore bioavailability of APIs.
However, any potential benefits of amorphous systems are counterbalanced by their
metastable nature and intrinsic tendency to recrystallise when submitted to stress
conditions. In this work thermodynamic and kinetic parameters were investigated and

Chapter VIII
281
applied to the characterisation of the prepared amorphous form. Although theoretical
approaches have been extensively used on the prediction of amorphous compounds as
glass formers, limited work has been carried out in order to correlate those approaches with
the experimental physical stability. Parameters such as Kauzmann temperature (TK),
fragility (m) and relaxation time (τ) classified the amorphous paroxetine HCl prepared
from Form II as a fragile glass. The predicted fragility of this form was in agreement with
the experimental results obtained during physical stability studies and also after prolonged
exposure to water during the solubility experiments. In addition, the storage conditions,
more specifically the water vapour pressure, was found to influence the pathway of
recrystallisation from the amorphous state. This might be of practical importance during
the stability studies of APIs converted into an amorphous state.
Later in this thesis (Chapters 6 and 7), attention was paid to the parameters involved in the
formulation of drug products into solid dispersions. As referred, single amorphous phase
compounds are usually tempered by a number of potential drawbacks, mainly physical and
chemical instability. The preparation of amorphous solid dispersions represents, nowadays,
the ultimate strategy to stabilise those systems. Numerous parameters must be accounted
when intending to prepare amorphous solid dispersions.
A thorough investigation on the preparation, performance and stability of solid dispersion
systems prepared with paroxetine HCl Form I and II was carried out. PVPVA was selected
as the carrier and the influence of preparation techniques (spray drying (SD) and hot melt
extrusion (HME)) was also evaluated. Melting point depression approach was used to
predict the miscibility between each pseudopolymorphic form of paroxetine HCl and
PVPVA. Interestingly, Form I was found to be miscible with PVPVA whereas Form II did
not show any depression on the onset melting in the presence of the polymer. Regardless
the theoretical predictions, the experimental results showed that both forms were able to be
molecularly dispersed within the polymer carrier, with a single Tg value observed in DSC
and a halo pattern in XRPD. This was an interesting finding and shed some light on the
validity of the use of melting point depression method in the prediction of miscibility and
interaction in drug-polymer blends. The influence of the preparation method was observed
on the thermal behaviour of the fresh samples and on the propensity for recrystallisation
during the stability studies. Differences concerning the dissolution performance and
stability of the SD and HME systems were also encountered. Higher dissolution rates were
Chapter VIII
282
observed for the spray dried samples, either containing Form I or Form II, relative to the
HME samples. However, the situation was reversed in terms of stability.
The work on the formulation into solid dispersions was endeavoured to further study the
impact of different polymers on the processing, dissolution behaviour and physical stability
of a BCS Class II drug (olanzapine, OLZ) using HME. Chapter 7 addressed the different
parameters that should be taken into consideration when preparing solid dispersions in
particular using HME. Miscibility between the drug (OLZ) and each polymer system
(PVP, PVPVA and Soluplus® (SLP)), drug loading, extrusion temperatures and the
chemical structure of the polymer were found to be of great importance in determining the
solid state of the prepared systems (fully or partially amorphous systems). Interestingly in
the particular case of OLZ, the physical solid state of the final products did not have any
significant influence on their dissolution performance. These findings suggested that it was
the nature of the polymer rather than the physical state of the drug in the dispersed system
that determined the dissolution profiles. Despite the plethora of reports suggesting that
high dissolution rates can be achieved when the drug is dispersed in the polymer carrier at
a molecular lever, further investigation in this field with more care is required.
Furthermore, the physicochemical properties of the selected polymers also play an
important role in the stabilisation of these kinds of systems. In particular, parameters such
as high Tg and the ability to establish hydrogen bonding with the drug are not always
strictly necessary, at least in this case, to achieve great stabilisation. Indeed, the systems
prepared with SLP were found to be more stable than those prepared with PVP or PVPVA,
despite its lower Tg and its inability of establishing hydrogen bonding with OLZ.
Therefore, more attention should be paid to properties such as molecular weight and lower
hygroscopic nature when developing solid dispersion systems.
Overall this work provided important insights into formulating poorly soluble APIs into
solid dispersions. The mechanisms behind the dissolution enhancement are complex and
formulation dependent. The selection of a suitable polymer in order to maximise the
potential advantages associated to solid dispersions should be done carefully. In addition,
the formulation of solid dispersions containing the API in a highly crystalline state might
be a promising strategy, at least in certain cases, to improve both dissolution and stability
of solid dispersions.
Chapter VIII
283
8.2 Recommendations for Future Work
Whilst carrying out this Project, a number of possible areas were identified and can be
further investigated. However, due to the limited time available or because they were
outside the scope of this research, they were not considered in this thesis.
The first two chapters of this thesis focused on the solid state characterisation of two
pseudopolymorphic forms of paroxetine HCl. The knowledge acquired here could benefit
the characterisation and/or identification of non-stoichiometric hydrates as
misinterpretations are likely to happen with this particular class of compounds.
In terms of the dehydration studies carried out with paroxetine HCl Form I, although the
new anhydrate form was found to be highly unstable, the determination of its crystal
structure could perhaps give important insights in correlating the determined crystalline
arrangement with its extremely high hygroscopic behaviour and thereby instability. Since
the use of single crystal X-ray could not be used due to the breakdown of the crystal of
Form I during the heating up process, the use of synchrotron radiation (high resolution
XRPD) might be a feasible possibility.
Concerning the formulation studies carried out in this thesis, a few aspects could be further
investigated. Starting with the solid dispersions systems prepared with paroxetine HCl. The
understanding, at a molecular level, of the interactions between PVPVA and paroxetine
HCl, could help to improve molecular modeling dynamics techniques that allow to predict,
in a more reliable manner, drug-polymer miscibility.
Finally, with the studies carried out in the last chapter, two possible areas can be taken
further. The first one would include the use nano-thermal analysis (nano-TA) to analyse in
more detail the spatial distribution of crystalline/amorphous material on the surface of the
extrudates. In addition, this technique would provide important information in
distinguishing between the different crystalline forms of OLZ, in case more than one form
was present, since this was not possible by using bulk characterisation techniques (e.g.
DSC). Secondly, the development of solid dispersion systems containing more than one
carrier (concept of polymer blend), in particular combining Soluplus® (low hygroscopicity)
with PVP based system polymers (higher solubilisation properties) could be a way to

Chapter VIII
284
improve both dissolution and stability. In addition, the generation of crystalline nano-
suspensions of OLZ within that polymer matrix might be a fruitful strategy to formulate
this drug.

9 APPENDICES
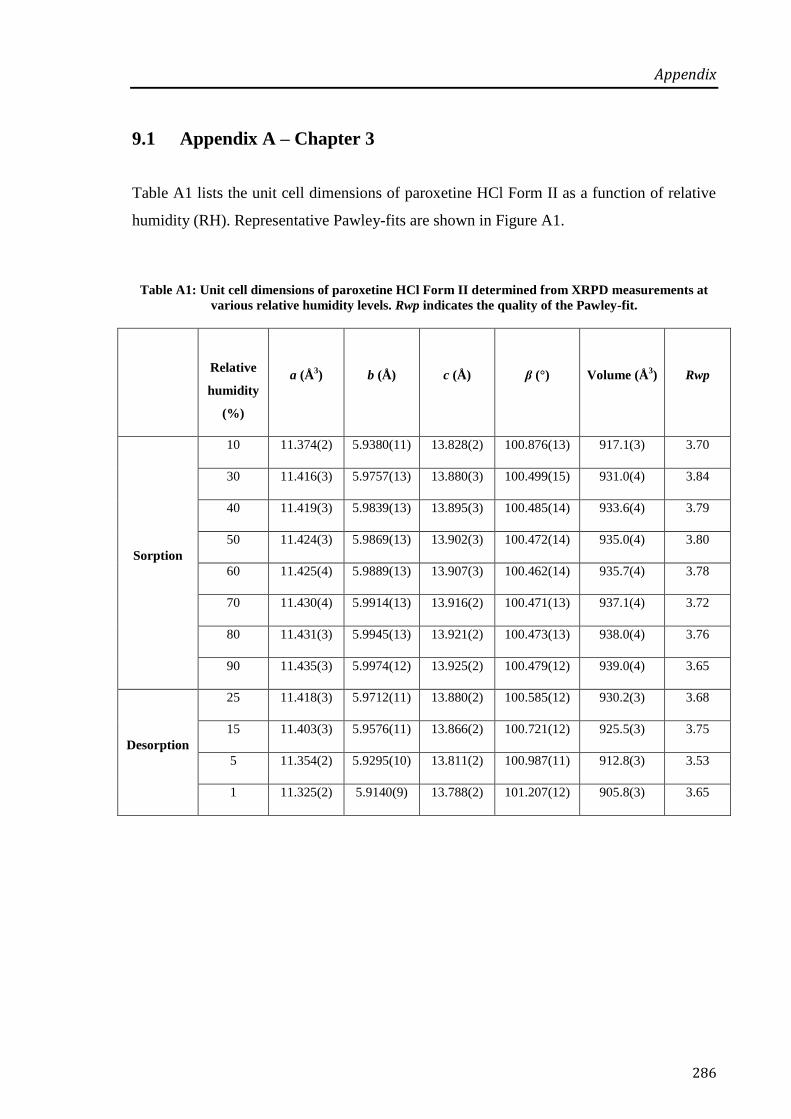
Appendix
286
9.1 Appendix A – Chapter 3
Table A1 lists the unit cell dimensions of paroxetine HCl Form II as a function of relative
humidity (RH). Representative Pawley-fits are shown in Figure A1.
Table A1: Unit cell dimensions of paroxetine HCl Form II determined from XRPD measurements at
various relative humidity levels. Rwp indicates the quality of the Pawley-fit.
Relative
humidity
(%)
a (Å3) b (Å) c (Å) β (°) Volume (Å
3) Rwp
Sorption
10 11.374(2) 5.9380(11) 13.828(2) 100.876(13) 917.1(3) 3.70
30 11.416(3) 5.9757(13) 13.880(3) 100.499(15) 931.0(4) 3.84
40 11.419(3) 5.9839(13) 13.895(3) 100.485(14) 933.6(4) 3.79
50 11.424(3) 5.9869(13) 13.902(3) 100.472(14) 935.0(4) 3.80
60 11.425(4) 5.9889(13) 13.907(3) 100.462(14) 935.7(4) 3.78
70 11.430(4) 5.9914(13) 13.916(2) 100.471(13) 937.1(4) 3.72
80 11.431(3) 5.9945(13) 13.921(2) 100.473(13) 938.0(4) 3.76
90 11.435(3) 5.9974(12) 13.925(2) 100.479(12) 939.0(4) 3.65
Desorption
25 11.418(3) 5.9712(11) 13.880(2) 100.585(12) 930.2(3) 3.68
15 11.403(3) 5.9576(11) 13.866(2) 100.721(12) 925.5(3) 3.75
5 11.354(2) 5.9295(10) 13.811(2) 100.987(11) 912.8(3) 3.53
1 11.325(2) 5.9140(9) 13.788(2) 101.207(12) 905.8(3) 3.65

Appendix
287
Figure A1: Experimental XRPD pattern (blue), fitted curve (red) and difference (grey) obtained in the
Pawley fit for data measured at 1% RH (top), 50% RH (middle) and 90% RH (bottom).
40353025201510
7,000
6,000
5,000
4,000
3,000
2,000
1,000
0
hkl_Phase 0.00 %
40353025201510
7,000
6,500
6,000
5,500
5,000
4,500
4,000
3,500
3,000
2,500
2,000
1,500
1,000
500
0
-500
hkl_Phase 0.00 %
40353025201510
7,000
6,500
6,000
5,500
5,000
4,500
4,000
3,500
3,000
2,500
2,000
1,500
1,000
500
0
-500
hkl_Phase 0.00 %
2 / °
2 / °
2 / °
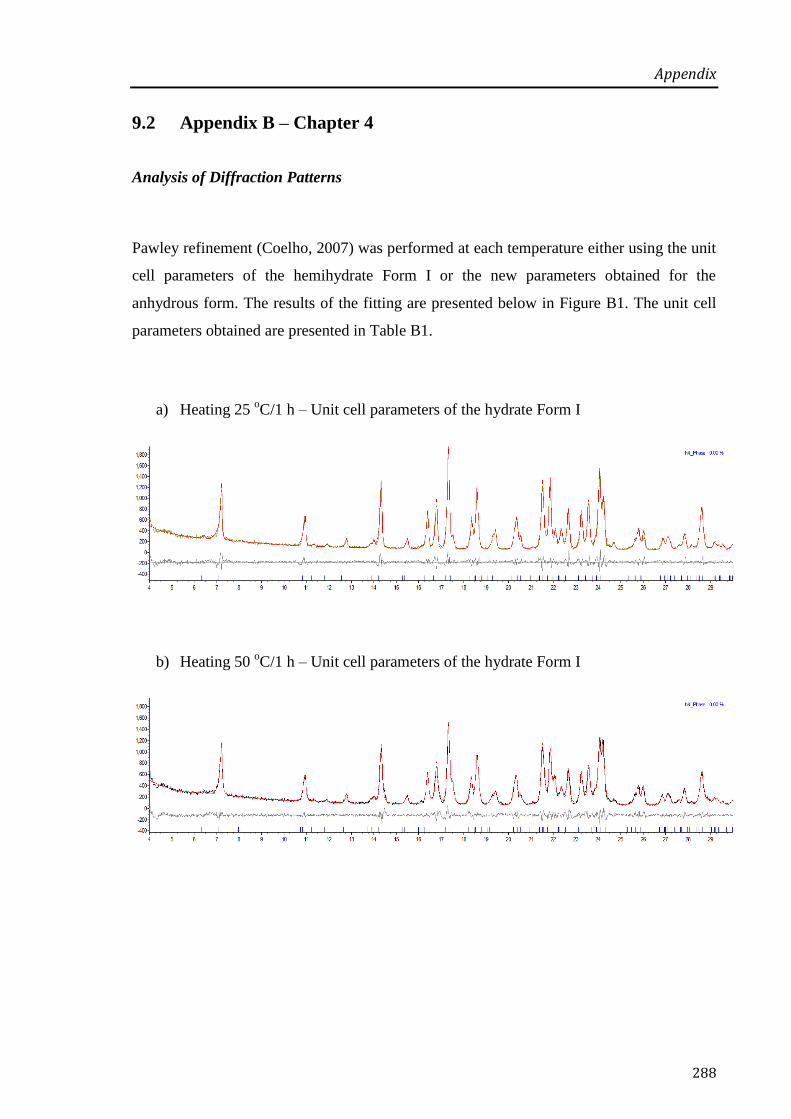
Appendix
288
9.2 Appendix B – Chapter 4
Analysis of Diffraction Patterns
Pawley refinement (Coelho, 2007) was performed at each temperature either using the unit
cell parameters of the hemihydrate Form I or the new parameters obtained for the
anhydrous form. The results of the fitting are presented below in Figure B1. The unit cell
parameters obtained are presented in Table B1.
a) Heating 25 oC/1 h – Unit cell parameters of the hydrate Form I
b) Heating 50 oC/1 h – Unit cell parameters of the hydrate Form I

Appendix
289
c) Heating 75 oC/1 h – Unit cell parameters of the hydrate Form I
d) Heating 100 oC/5 h – Unit cell parameters of the hydrate Form I
e) Cooling 100 oC/1 h – Unit cell parameters of the new anhydrous form
f) Cooling 75 oC/1 h – Unit cell parameters of the new anhydrous form
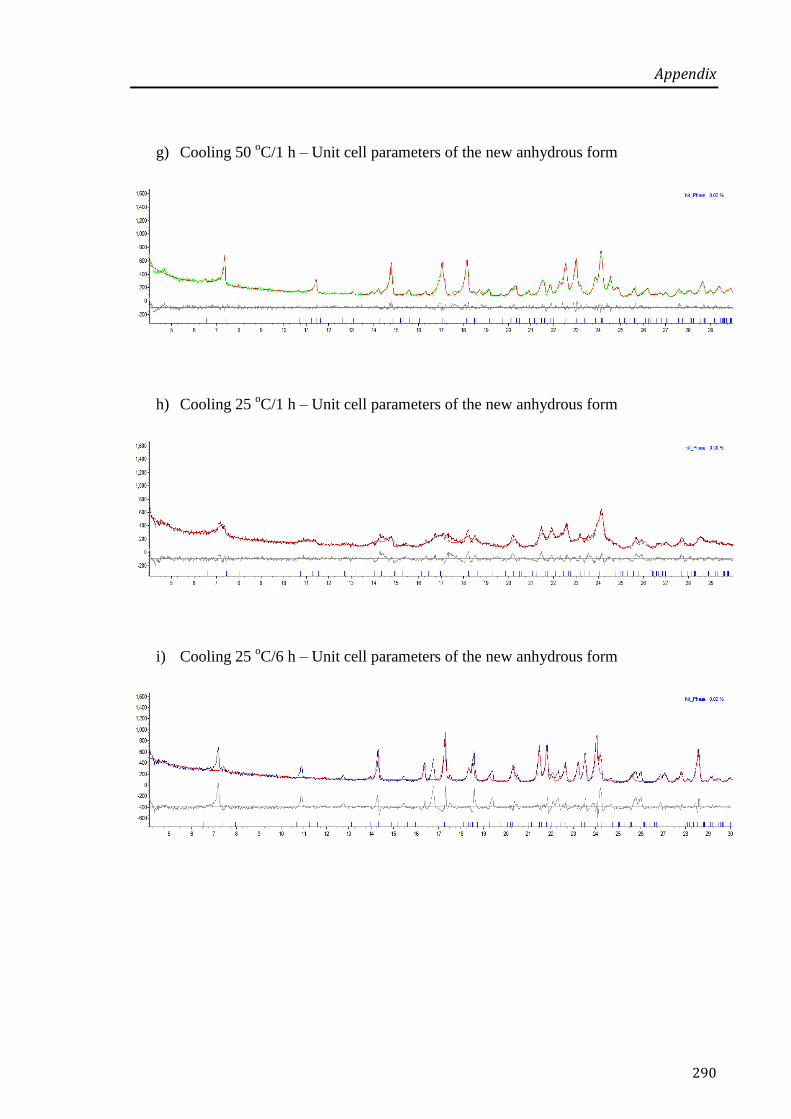
Appendix
290
g) Cooling 50 oC/1 h – Unit cell parameters of the new anhydrous form
h) Cooling 25 oC/1 h – Unit cell parameters of the new anhydrous form
i) Cooling 25 oC/6 h – Unit cell parameters of the new anhydrous form

Appendix
291
j) Cooling 25 oC/6 h – Unit cell parameters of the hydrate Form I
Figure B1: Experimental XRPD pattern, fitted curve (red) and difference (grey) obtained
in the Pawley fit.
Table B1 presents the unit cell parameters obtained at each temperature. The rows in red are less
reliable due to the poor fit. During heating the unit cell parameters of the hydrate Form I (hyd) were
used and during cooling the unit cell parameters of the new anhydrous form (anh), except for the last
measurement at 25 oC/6 h, where the parameters of the hydrate cell were used.
Temperature
(oC)
a (Å) b (Å) c (Å) β (o) V (Å
3)
Heating
25 oC/1 h (hyd) 14.615(2) 10.1819(11) 13.0419(17) 107.194(5) 1854.0(4)
50 oC/1 h (hyd) 14.632(2) 10.1864(14) 13.044(2) 107.273(7) 1856.5(5)
75 oC/1 h (hyd) 14.655(5) 10.191(3) 13.039(5) 107.411(13) 1858.2(12)
100 oC/5 h (hyd) 14.75(3) 10.227(18) 13.09(3) 107.44(9) 1884(7)
Cooling
100 oC/1 h (anh) 14.400(2) 10.5362(15) 12.7706(13) 110.490(5) 1814.9(4)
75 oC/1 h (anh) 14.392(2) 10.5184(14) 12.7572(13) 110.396(5) 1810.1(4)
50 oC/1 h (anh) 14.385(2) 10.473(2) 12.738(2) 110.297(7) 1799.8(6)
25 oC/1 h (anh) 14.291(16) 10.439(12) 12.662(13) 110.37(7) 1771(4)
25 oC/6 h (anh) 14.427(5) 10.464(3) 12.711(5) 110.866(14) 1793.1(11)
25 oC/6 h (hyd) 14.6253(16) 10.1862(13) 13.0620(16) 107.150(5) 1859.4(4)

Appendix
292
Dehydration Kinetics
Table B2 and Figure B2 represent an example of the Ea calculation for a single value of
conversion fraction, (α) by using OFW method with non-isothermal data. The procedure is
repeated for the all the conversion values.
Table B2: Calculations using OFW method for an individual value of α.
β (K/min) 1 2 3 4 5
Temperature (K) 344 352 354 357 361
log (β) 0 0.69 1.10 1.39 1.61
1000/T (K-1
) 2.91 2.84 2.82 2.80 2.77
Figure B2: Plot of the OFW method, for a single value of conversion at the different heating rates
1, 2, 3, 4 and 5 K/min.
Table B3 lists the reaction models considered in this work, to which the isothermal data
was fitted.
y = -11.987x + 34.858
R² = 0.9819
0
0.2
0.4
0.6
0.8
1
1.2
1.4
1.6
1.8
2.75 2.8 2.85 2.9 2.95
Log β
1000/T (K-1)
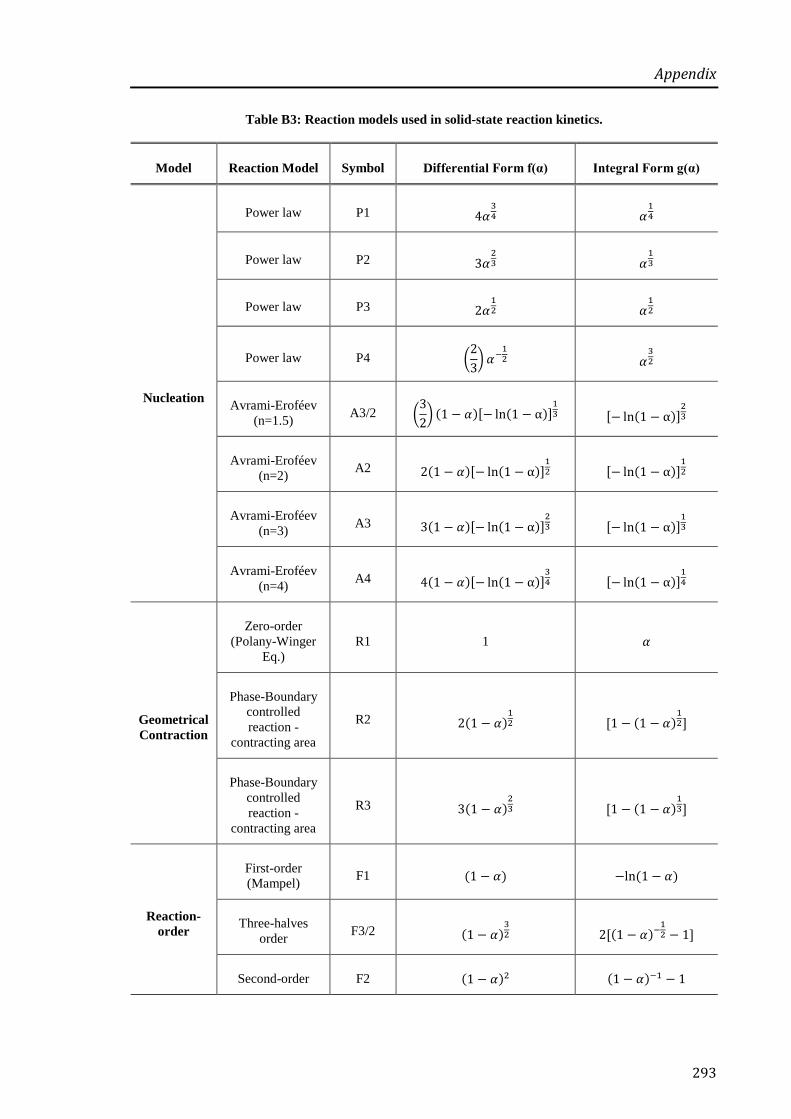
Appendix
293
Table B3: Reaction models used in solid-state reaction kinetics.
Model Reaction Model Symbol Differential Form f(α) Integral Form g(α)
Nucleation
Power law P1
Power law P2
Power law P3
Power law P4 (
)
Avrami-Eroféev
(n=1.5) A3/2 (
) [ ]
[ ]
Avrami-Eroféev
(n=2) A2 [ ]
[ ]
Avrami-Eroféev
(n=3) A3 [ ]
[ ]
Avrami-Eroféev
(n=4) A4 [ ]
[ ]
Geometrical
Contraction
Zero-order
(Polany-Winger
Eq.)
R1 1
Phase-Boundary
controlled
reaction -
contracting area
R2 [
]
Phase-Boundary
controlled
reaction -
contracting area
R3 [
]
Reaction-
order
First-order
(Mampel) F1
Three-halves
order F3/2
[
]
Second-order F2

Appendix
294
Third-order F3
[ ]
Diffusion
One-dimensional
diffusion D1 (
)
Two-dimensional
diffusion
(Valensi Eq.)
D2 [ ]
Three-
dimensional
diffusion
(Jander Eq.)
D3 [
] [ ]
Three-
dimensional
diffusion
(Ginstling-
Brousnshtein Eq.)
D4 (
) [
]
10 REFERENCES

296
AHLNECK, C. and ZOGRAFI, G. 1990. The molecular basis of moisture effects on the
physical and chemical stability of drugs in the solid state. International Journal of
Pharmaceutics, 62, 87-95.
AHLQVIST, M. U. A. and TAYLOR, L. S. 2002. Water dynamics in channel hydrates
investigated using H/D exchange. International Journal of Pharmaceutics, 241,
253-261.
ALLEN, F. 2002. The Cambridge Structural Database: a quarter of a million crystal
structures and rising. Acta Crystallographica Section B, 58, 380-388.
AMBIKE, A. A., MAHADIK, K. R. and PARADKAR, A. 2004. Stability study of
amorphous valdecoxib. International Journal of Pharmaceutics, 282, 151-162.
ANDRONIS, V. and ZOGRAFI, G. 1998. The Molecular Mobility of Supercooled
Amorphous Indomethacin as a Function of Temperature and Relative Humidity.
Pharmaceutical Research, 15, 835-842.
ANGELL, C. A. 1988. Perspective on the glass transition. Journal of Physics and
Chemistry of Solids, 49, 863-871.
ANGELL, C. A. 1991. Relaxation in liquids, polymers and plastic crystals - strong/fragile
patterns and problems. Journal of Non-Crystalline Solids, 131-133, 13-31.
BAIRD, J. A. and TAYLOR, L. S. 2012. Evaluation of amorphous solid dispersion
properties using thermal analysis techniques. Advanced Drug Delivery Reviews, 64,
396-421.
BAIRD, J. A., VAN EERDENBRUGH, B. and TAYLOR, L. S. 2010. A classification
system to assess the crystallization tendency of organic molecules from
undercooled melts. Journal of Pharmaceutical Sciences, 99, 3787-3806.
BARNES, R. D., WOOD-KACZMAR, M. W., CURZONS, A. D., LYNCH, I. R.,
RICHARDSON, J. E. and BUXTON, P. C. 1988. Anti-depressant crystalline
paroxetine hydrochloride hemihydrate. US4,721,723.
BERNSTEIN, J. 2002. Polymorphism in Molecular Crystals, Oxford [England]; New
York, Clarendon Press; Oxford University Press.
BHANA, N., FOSTER, R. H., OLNEY, R. and PLOSKER, G. L. 2001. Olanzapine: An
Updated Review of its Use in the Management of Schizophrenia. Drugs, 61, 111-
161.
BHANA, N. and PERRY, C. M. 2001. Olanzapine: A Review of its Use in the Treatment
of Bipolar I Disorder. CNS Drugs, 15, 871-904.

297
BHARDWAJ, R. M., PRICE, L. S., PRICE, S. L., REUTZEL-EDENS, S. M., MILLER,
G. J., OSWALD, I. D. H., JOHNSTON, B. F. and FLORENCE, A. J. 2013.
Exploring the Experimental and Computed Crystal Energy Landscape of
Olanzapine. Crystal Growth & Design, 13, 1602-1617.
BHATTACHARYA, S. and SURYANARAYANAN, R. 2009. Local mobility in
amorphous pharmaceuticals—characterization and implications on stability.
Journal of Pharmaceutical Sciences, 98, 2935-2953.
BIKIARIS, D. N. 2011. Solid dispersions, Part II: New strategies in manufacturing
methods for dissolution rate enhancement of poorly water-soluble drugs. Expert
Opinion on Drug Delivery, 8, 1663-1680.
BLEY, H., FUSSNEGGER, B. and BODMEIER, R. 2010. Characterization and stability
of solid dispersions based on PEG/polymer blends. International Journal of
Pharmaceutics, 390, 165-173.
BOURIN, M., CHUE, P. and GUILLON, Y. 2001. Paroxetine: A Review. CNS Drug
Reviews, 7, 25-47.
BREITENBACH, J. 2002. Melt extrusion: from process to drug delivery technology.
European Journal of Pharmaceutics and Biopharmaceutics, 54, 107-117.
BRITTAIN, H. G. 2009. Polymorphism in Pharmaceutical Solids, New Jersey, Informa
Healthcare.
BROUWERS, J., BREWSTER, M. E. and AUGUSTIJNS, P. 2009. Supersaturating drug
delivery systems: The answer to solubility-limited oral bioavailability? Journal of
Pharmaceutical Sciences, 98, 2549-2572.
BRUNO, C. H. and GEORGE, Z. 1997. Characteristics and significance of the amorphous
state in pharmaceutical systems. Journal of Pharmaceutical Sciences, 86, 1-12.
CHI 2003. u chi Mini Spray Dryer B-290 Instructions.
BUCKTON, G. and DARCY, P. 1995. The use of gravimetric studies to assess the degree
of crystallinity of predominantly crystalline powders. International Journal of
Pharmaceutics, 123, 265-271.
BÜHLER, V. 2005. Polyvinylpyrrolidone excipients for pharmaceuticals povidone,
crospovidone, and copovidone. New York: Springer.
HLER, V. 2005. Polyvinylpyrrolidone Excipients for Pharmaceuticals: Povidone,
Crospovidone, and Copovidone, Berlin, Springer.

298
BUNNELL, C. A., HENDRIKSEN, B. A. and LARSEN, S. D. 1996. Crystal forms of a
thieno(2,3-B)(1,5) benzodiazepine derivative and process for their preparation.
BUNNELL, C. A., HENDRIKSEN, B. A. and LARSEN, S. D. 1998. Olanzapine
Polymorph Crystal Form. U.S. patent application.
BUNNELL, C. A., LARSEN, S. D., NICHOLS, J. R., REUTZEL, S. M. and
STEPHENSON, G. A. 2001. Intermediates and process for preparing olanzapine.
BUNNELL, C. A., LARSEN, S. D. and TUPPER, D. E. 1997. Process and solvate of 2-
methyl-thieno-benzodiazepine. U.S. patent application.
BURGER, A. and RAMBERGER, R. 1979a. On the polymorphism of pharmaceuticals and
other molecular crystals. I. Theory of thermodynamic rules. Mikrochimica Acta, II,
259-271.
BURGER, A. and RAMBERGER, R. 1979b. On the polymorphism of pharmaceuticals
and other molecular crystals. II. Applicability of thermodynamic rules.
Mikrochimica Acta, II, 273-316.
BURNS, M. J. 2001. The pharmacology and toxicology of atypical antipsychotic agents.
Journal of Toxicology - Clinical Toxicology, 39, 1-14.
BUXTON, P. C., LYNCH, I. R. and ROE, J. M. 1988. Solid-state forms of paroxetine
hydrochloride. International Journal of Pharmaceutics, 42, 135-143.
BYRN, S. R., PFEIFFER, R. R., STEPHENSON, G., GRANT, D. J. W. and GLEASON,
W. B. 1994. Solid-state pharmaceutical chemistry. Chemistry of Materials, 6, 1148-
1158.
CAL, K. and SOLLOHUB, K. 2010. Spray drying technique. I: Hardware and process
parameters. Journal of Pharmaceutical Sciences, 99, 575-586.
CALLAHAN, J. C., CLEARY, G. W., ELEFANT, M., KAPLAN, G., KENSLER, T. and
NASH, R. A. 1982. EQUILIBRIUM MOISTURE-CONTENT OF
PHARMACEUTICAL EXCIPIENTS. Drug Development and Industrial
Pharmacy, 8, 355-369.
CAPUANO, B., CROSBY, I. T., FALLON, G. D., LLOYD, E. J., YURIEV, E. and
EGAN, S. J. 2003. 2-methyl-4-(4-methylpiperazin-1-yl)-10H-thieno 2,3-b 1,5
benzodiazepine methanol solvate monohydrate. Acta Crystallographica Section E-
Structure Reports Online, 59, O1367-O1369.

299
CHAKRAVARTY, P., BERENDT, R. T., MUNSON, E. J., YOUNG, V. G.,
GOVINDARAJAN, R. and SURYANARAYANAN, R. 2009a. Insights into the
Dehydration Behavior of Thiamine Hydrochloride (Vitamin B(1)) Hydrates: Part I.
Journal of Pharmaceutical Sciences, 99, 816-827.
CHAKRAVARTY, P., BERENDT, R. T., MUNSON, E. J., YOUNG, V. G.,
GOVINDARAJAN, R. and SURYANARAYANAN, R. 2009b. Insights Into the
Dehydration Behavior of Thiamine Hydrochloride (vitamin B(1)) Hydrates: Part II.
Journal of Pharmaceutical Sciences, 99, 1882-1895.
CHAN, H. K. and DOELKER, E. 1985. Polymorphic transformation of some drugs under
compression. Drug Development and Industrial Pharmacy, 11, 315-332.
CHEMBURKAR, S. R., BAUER, J., DEMING, K., SPIWEK, H., PATEL, K., MORRIS,
J., HENRY, R., SPANTON, S., DZIKI, W., PORTER, W., QUICK, J., BAUER, P.,
DONAUBAUER, J., NARAYANAN, B. A., SOLDANI, M., RILEY, D. and
MCFARLAND, K. 2000. Dealing with the Impact of Ritonavir Polymorphs on the
Late Stages of Bulk Drug Process Development. Organic Process Research &
Development, 4, 413-417.
CHEN, L. R., YOUNG JR, V. G., LECHUGA-BALLESTEROS, D. and GRANT, D. J. W.
1999. Solid-state behavior of cromolyn sodium hydrates. Journal of
Pharmaceutical Sciences, 88, 1191-1200.
CHIENG, N., ZUJOVIC, Z., BOWMAKER, G., RADES, T. and SAVILLE, D. 2006.
Effect of milling conditions on the solid-state conversion of ranitidine
hydrochloride form 1. International Journal of Pharmaceutics, 327, 36-44.
CHIOU, W. L. and RIEGELMAN, S. 1971. Pharmaceutical applications of solid
dispersion systems. Journal of Pharmaceutical Sciences, 60, 1281-1302.
CHOKSHI, R. J., SANDHU, H. K., IYER, R. M., SHAH, N. H., MALICK, A. W. and
ZIA, H. 2005. Characterization of physico-mechanical properties of indomethacin
and polymers to assess their suitability for hot-melt extrusion processs as a means
to manufacture solid dispersion/solution. Journal of Pharmaceutical Sciences, 94,
2463-2474.
CHOW, K., TONG, H. H., LUM, S. and CHOW, A. H. 2008. Engineering of
pharmaceutical materials: An industrial perspective. Journal of Pharmaceutical
Sciences, 97, 2855-2877.
COELHO, A. 2007. TOPAS Academic User Manual. Version 4.1, Australia.

300
COLEMAN, N. J. and CRAIG, D. Q. M. 1996. Modulated temperature differential
scanning calorimetry: A novel approach to pharmaceutical thermal analysis.
International Journal of Pharmaceutics, 135, 13-29.
CORRIGAN, O. I. 1985. Mechanisms of Dissolution of Fast Release Solid Dispersions.
Drug Development and Industrial Pharmacy, 11, 697-724.
CORRIGAN, O. I. 1995. Thermal analysis of spray dried products. Thermochimica Acta,
248, 245-258.
COUCHMAN, P. R. and KARASZ, F. E. 1978. A classical thermodynamic discussion of
the effect of composition on glass-transition temperatures. Macromolecules, 11,
117-119.
COX, J. S. G., WOODARD, G. D. and MCCRONE, W. C. 1971. Solid-state chemistry of
cromolyn sodium (disodium cromoglycate). Journal of Pharmaceutical Sciences,
60, 1458-1465.
CRAIG, D. Q. M. 2002. The mechanisms of drug release from solid dispersions in water-
soluble polymers. International Journal of Pharmaceutics, 231, 131-144.
CRAIG, D. Q. M. and JOHNSON, F. A. 1995. Pharmaceutical applications of dynamic
mechanical thermal analysis. Thermochimica Acta, 248, 97-115.
CRAIG, D. Q. M. and READING, M. 2007. Thermal Analysis of Pharmaceuticals,
London, CRC Press.
CRAIG, D. Q. M., ROYALL, P. G., KETT, V. L. and HOPTON, M. L. 1999. The
relevance of the amorphous state to pharmaceutical dosage forms: glassy drugs and
freeze dried systems. International Journal of Pharmaceutics, 179, 179-207.
CROWLEY, K. J. and ZOGRAFI, G. 2001. The use of thermal methods for predicting
glass-former fragility. Thermochimica Acta, 380, 79-93.
CROWLEY, M. M., ZHANG, F., REPKA, M. A., THUMMA, S., UPADHYE, S. B.,
BATTU, S. K., MCGINITY, J. W. and MARTIN, C. 2007. Pharmaceutical
applications of hot-melt extrusion: Part I. Drug Development and Industrial
Pharmacy, 33, 909-926.
CUI, Y. and YAO, E. 2008. Evaluation of hydrate-screening methods. Journal of
Pharmaceutical Sciences, 97, 2730-2744.
CULLITY, B. D. 1956. Elements of X-ray Diffraction, Reading, Mass., Addison-Wesley
Pub. Co.

301
DAVID, W. I. F., SHANKLAND, K. and SHANKLAND, N. 1998. Routine determination
of molecular crystal structures from powder diffraction data. Chemical
Communications, 931-932.
DE BRABANDER, C., VAN DEN MOOTER, G., VERVAET, C. and REMON, J. P.
2002. Characterization of ibuprofen as a nontraditional plasticizer of ethyl
cellulose. Journal of Pharmaceutical Sciences, 91, 1678-1685.
DE BRABANDER, C., VERVAET, C. and REMON, J. P. 2003. Development and
evaluation of sustained release mini-matrices prepared via hot melt extrusion.
Journal of Controlled Release, 89, 235-247.
DEBNATH, S. and SURYANARAYANAN, R. 2004. Influence of processing-induced
phase transformations on the dissolution of theophylline tablets. AAPS
PharmSciTech, 5.
DESAI, J., ALEXANDER, K. and RIGA, A. 2006. Characterization of polymeric
dispersions of dimenhydrinate in ethyl cellulose for controlled release.
International Journal of Pharmaceutics, 308, 115-123.
DESIRAJU, G. R. 2004. Counterpoint: What's in a Name? Crystal Growth & Design, 4,
1089-1090.
DJURIS, J., NIKOLAKAKIS, I., IBRIC, S., DJURIC, Z. and KACHRIMANIS, K. 2013.
Preparation of carbamazepine–Soluplus® solid dispersions by hot-melt extrusion,
and prediction of drug–polymer miscibility by thermodynamic model fitting.
European Journal of Pharmaceutics and Biopharmaceutics, 84, 228-237.
DONG, Z., CHATTERJI, A., SANDHU, H., CHOI, D. S., CHOKSHI, H. and SHAH, N.
2008. Evaluation of solid state properties of solid dispersions prepared by hot-melt
extrusion and solvent co-precipitation. International Journal of Pharmaceutics,
355, 141-149.
EMA 2003. ICH Topic Q1A (R2) - Stability Testing of new Drug Substances and
Products. UK.
FARJAS, J., BUTCHOSA, N. and ROURA, P. 2010. A simple kinetic method for the
determination of the reaction model from non-isothermal experiments. Journal of
Thermal Analysis and Calorimetry, 102, 615-625.
FDA 1997. Dissolution Testing of Immediate Release Solid Oral Dosage Forms.

302
FENG, J., XU, L., GAO, R., LUO, Y. and TANG, X. 2012. Evaluation of polymer carriers
with regard to the bioavailability enhancement of bifendate solid dispersions
prepared by hot-melt extrusion. Drug Development and Industrial Pharmacy, 38,
735-743.
FLORENCE, A. T. and ATTWOOD, D. 2006. Physicochemical principles of pharmacy,
London, Chicago : Pharmaceutical Press.
FLORY, P. J. 1942. Thermodynamics of High Polymer Solutions. The Journal of
Chemical Physics, 10, 51-61.
FLYNN, J. H. and WALL, L. A. 1966. A quick direct method for determination of
activation energy from thermogravimetric data. Journal of Polymer Science Part B-
Polymer Letters, 4.
FORSTER, A., HEMPENSTALL, J. and RADES, T. 2001a. Characterization of glass
solutions of poorly water-soluble drugs produced by melt extrusion with
hydrophilic amorphous polymers. Journal of Pharmacy and Pharmacology, 53,
303-315.
FORSTER, A., HEMPENSTALL, J., TUCKER, I. and RADES, T. 2001b. Selection of
excipients for melt extrusion with two poorly water-soluble drugs by solubility
parameter calculation and thermal analysis. International Journal of
Pharmaceutics, 226, 147-161.
FUKUOKA, E., MAKITA, M. and YAMAMURA, S. 1989. Glassy state of
pharmaceuticals. III. Thermal properties and stability of glassy pharmaceuticals and
their binary glass systems. Chemical and Pharmaceutical Bulletin, 37, 1047-1050.
GALE, J. D. 2005. GULP: Capabilities and prospects. Zeitschrift fur Kristallographie, 220,
552-554.
GALWEY, A. K. 2000. Structure and order in thermal dehydrations of crystalline solids.
Thermochimica Acta, 355, 181-238.
GHEBREMESKEL, A. N., VEMAVARAPU, C. and LODAYA, M. 2007. Use of
surfactants as plasticizers in preparing solid dispersions of poorly soluble API:
Selection of polymer–surfactant combinations using solubility parameters and
testing the processability. International Journal of Pharmaceutics, 328, 119-129.
GILL, P. S., SAUERBRUNN, S. R. and READING, M. 1993. Modulated differential
scanning calorimetry. Journal of Thermal Analysis, 40, 931-939.
GILMORE, C. J. 2011. X-Ray Diffraction. In: STOR , R. A. and M N, I. (eds.) Solid
State Characterization of Pharmaceuticals. Chichester, UK: John Wiley & Sons

303
GIRON, D. 1995. Thermal analysis and calorimetric methods in the characterisation of
polymorphs and solvates. Thermochimica Acta, 248, 1-59.
GIRON, D., GOLDBRONN, C., MUTZ, M., PFEFFER, S., PIECHON, P. and SCHWAB,
P. 2002. Solid State Characterizations of Pharmaceutical Hydrates. Journal of
Thermal Analysis and Calorimetry, 68, 453-465.
GOLDBERG, A. H., GIBALDI, M. and KANIG, J. L. 1965. Increasing dissolution rates
and gastrointestinal absorption of drugs via solid solutions and eutectic mixtures I.
Theoretical considerations and discussion of the literature. Journal of
Pharmaceutical Sciences, 54, 1145-1148.
GOLDBERG, A. H., GIBALDI, M., KANIG, J. L. and MAYERSOHN, M. 1966.
Increasing dissolution rates and gastrointestinal absorption of drugs via solid
solutions and eutectic mixtures IV: Chloramphenicol—urea system. Journal of
Pharmaceutical Sciences, 55, 581-583.
GORDON, M. and TAYLOR, J. S. 1952. Ideal copolymers and the second-order
transitions of synthetic rubbers. i. non-crystalline copolymers. Journal of Applied
Chemistry, 2, 493-500.
GRAESER, K. A., PATTERSON, J. E. and RADES, T. 2009a. Applying Thermodynamic
and Kinetic Parameters to Predict the Physical Stability of Two Differently
Prepared Amorphous Forms of Simvastatin. Current Drug Delivery, 6, 374-382.
GRAESER, K. A., PATTERSON, J. E., ZEITLER, J. A., GORDON, K. C. and RADES,
T. 2009b. Correlating thermodynamic and kinetic parameters with amorphous
stability. European Journal of Pharmaceutical Sciences, 37, 492-498.
GRAESER, K. A., STRACHAN, C. J., PATTERSON, J. E., GORDON, K. C. and
RADES, T. 2008. Physicochemical Properties and Stability of Two Differently
Prepared Amorphous Forms of Simvastatin. Crystal Growth and Design, 8, 128-
135.
GRANT, D. J. W. and BRITTAIN, H. G. 1995. Solubility of Pharmaceutical Solids. In:
BRITTAIN, H. G. (ed.) Physical Characterization of Pharmaceutical Solids. New
Jersey: Marcel Dekker. 321-386
GREENHALGH, D. J., WILLIAMS, A. C., TIMMINS, P. and YORK, P. 1999. Solubility
parameters as predictors of miscibility in solid dispersions. Journal of
Pharmaceutical Sciences, 88, 1182-1190.
GREINER, A. and WENDORFF, J. H. 2007. Electrospinning: A Fascinating Method for
the Preparation of Ultrathin Fibers. Angewandte Chemie International Edition, 46,
5670-5703.

304
GRIESSER, U. J. 2006. The Importance of Solvates. Polymorphism in the Pharmaceutical
Industry. Germany: WILEY-VCH.211-230.
GRIESSER, U. J. and BURGER, A. 1995. The effect of water vapor pressure on
desolvation kinetics of caffeine 4/5-hydrate. International Journal of
Pharmaceutics, 120, 83-93.
GRIESSER, U. J., JETTI, R. K. R., HADDOW, M. F., BREHMER, T., APPERLEY, D.
C., KING, A. and HARRIS, R. K. 2008. Conformational Polymorphism in
Oxybuprocaine Hydrochloride. Crystal Growth & Design, 8, 44-56.
GRISEDALE, L. C., JAMIESON, M. J., BELTON, P. S., BARKER, S. A. and M.
CRAIG, D. Q. Characterization and quantification of amorphous material in milled
and spray-dried salbutamol sulfate: A comparison of thermal, spectroscopic, and
water vapor sorption approaches. Journal of Pharmaceutical Sciences, 100, 3114-
3129.
GUGUTA, C., MEEKES, H. and DE GELDER, R. 2006. Crystal Structure of Aspartame
Anhydrate from Powder Diffraction Data. Structural Aspects of the Dehydration
Process of Aspartame. Crystal Growth and Design, 6, 2686-2692.
GUPTA, J., NUNES, C., VYAS, S. and JONNALAGADDA, S. 2011. Prediction of
Solubility Parameters and Miscibility of Pharmaceutical Compounds by Molecular
Dynamics Simulations. The Journal of Physical Chemistry B, 115, 2014-2023.
HAIKALA, R., EEROLA, R., TANNINEN, V. P. and YLIRUUSI, J. 1997. Polymorphic
changes of mannitol during freeze-drying: Effect of surface- active agents. PDA
Journal of Pharmaceutical Science and Technology, 51, 96-101.
HALEBLIAN, J. and MCCRONE, W. 1969. Pharmaceutical Applications of
Polymorphism. Journal of Pharmaceutical Sciences, 58, 911-929.
HALLBRUCKER, A., MAYER, E. and JOHARI, G. P. 1989. Glass-liquid transition and
the enthalpy of devitrification of annealed vapor-deposited amorphous solid water:
a comparison with hyperquenched glassy water. The Journal of Physical
Chemistry, 93, 4986-4990.
HAMIED, Y. K., KANKAN, R. N. and RAO, D. R. 2002. Polymorphic Forms of
Olanzapine. U.S. patent application 6348458B1.
HANCOCK, B. C. and SHAMBLIN, S. L. 2001. Molecular mobility of amorphous
pharmaceuticals determined using differential scanning calorimetry.
Thermochimica Acta, 380, 95-107.

305
HANCOCK, B. C., SHAMBLIN, S. L. and ZOGRAFI, G. 1995. Molecular Mobility of
Amorphous Pharmaceutical Solids Below Their Glass Transition Temperatures.
Pharmaceutical Research, 12, 799-806.
HANCOCK, B. C., YORK, P. and ROWE, R. C. 1997. The use of solubility parameters in
pharmaceutical dosage form design. International Journal of Pharmaceutics, 148,
1-21.
HANCOCK, B. C. and ZOGRAFI, G. 1994. The Relationship Between the Glass
Transition Temperature and the Water Content of Amorphous Pharmaceutical
Solids. Pharmaceutical Research, 11, 471-477.
HANSEN, C. M. 2007. Solubility Parameters - An Introduction In: HANSEN, C. M. (ed.)
Hansen Solubility Parameters, A User's Handbook. 2nd ed. London: CRC Press.1-
24
HEACOCK, R. A. and MARION, L. O. 1956. THE INFRARED SPECTRA OF
SECONDARY AMINES AND THEIR SALTS. Canadian Journal of Chemistry,
34, 1782-1795.
HENWOOD, S. Q., LIEBENBERG, W., TIEDT, L. R., LOTTER, A. P. and DE
VILLIERS, M. M. 2001. Characterization of the Solubility and Dissolution
Properties of Several New Rifampicin Polymorphs, Solvates, and Hydrates. Drug
Development and Industrial Pharmacy, 27, 1017-1030.
HERBSTEIN, F. H. 2004. Diversity Amidst Similarity: A Multidisciplinary Approach to
Phase Relationships, Solvates, and Polymorphs. Crystal Growth & Design, 4,
1419-1429.
HERMAN, J., VISAVARUNGROJ, N. and REMON, J. P. 1989. Instability of drug release
from anhydrous theophylline-microcrystalline cellulose formulations. International
Journal of Pharmaceutics, 55, 143-146.
HILDEN, L. R. and MORRIS, K. R. 2004. Physics of amorphous solids. Journal of
Pharmaceutical Sciences, 93, 3-12.
HILFIKER, R. 2006. Polymorphism in the Pharmaceutical Industry, Weinheim, Wiley-
VCH.
HIRAYAMA, F., HONJO, M., ARIMA, H., OKIMOTO, K. and UEKAMA, K. 2000. X-
ray crystallographic characterization of nilvadipine monohydrate and its phase
transition behavior. European Journal of Pharmaceutical Sciences, 11, 81-88.
HODGE, I. M. 1996. Strong and fragile liquids - A brief critique. Journal of Non-
Crystalline Solids, 202, 164-172.

306
HÖRTER, D. and DRESSMAN, J. B. 2001. Influence of physicochemical properties on
dissolution of drugs in the gastrointestinal tract. Advanced Drug Delivery Reviews,
46, 75-87.
HOSOKAWA, T., DATTA, S., SHETH, A. R., BROOKS, N. R., YOUNG, V. G. and
GRANT, D. J. W. 2004. Isostructurality among Five Solvates of Phenylbutazone.
Crystal Growth & Design, 4, 1195-1201.
HOWARD, J. A. K., PATTISON, P. and CHETINA, O. 2003. Private communication to
the Cambridge Crystallographic Data Centre.
HUANG, J., WIGENT, R. J., BENTZLEY, C. M. and SCHWARTZ, J. B. 2006.
Nifedipine solid dispersion in microparticles of ammonio methacrylate copolymer
and ethylcellulose binary blend for controlled drug delivery. Effect of drug loading
on release kinetics. International Journal of Pharmaceutics, 319, 44-54.
HUGGINS, M. L. 1942. THERMODYNAMIC PROPERTIES OF SOLUTIONS OF
LONG-CHAIN COMPOUNDS. Annals of the New York Academy of Sciences, 43,
1-32.
HÜLSMANN, S., BACKENSFELD, T., KEITEL, S. and BODMEIER, R. 2000. Melt
extrusion - An alternative method for enhancing the dissolution rate of 17β-
estradiol hemihydrate. European Journal of Pharmaceutics and Biopharmaceutics,
49, 237-242.
IBERS, J. A. 1999. Paroxetine hydrochloride hemihydrate. Acta Crystallographica Section
C: Crystal Structure Communications, 55, 432-434.
IGNATIOUS, F., SUN, L., LEE, C.-P. and BALDONI, J. 2010. Electrospun Nanofibers in
Oral Drug Delivery. Pharmaceutical Research, 27, 576-588.
JAKALIAN, A., JACK, D. B. and BAYLY, C. I. 2002. Fast, efficient generation of high-
quality atomic charges. AM1-BCC model: II. Parameterization and validation.
Journal of Computational Chemistry, 23, 1623-1641.
JANSSENS, S., DE ZEURE, A., PAUDEL, A., VAN HUMBEECK, J., ROMBAUT, P.
and VAN DEN MOOTER, G. 2010. Influence of preparation methods on solid
state supersaturation of amorphous solid dispersions: A case study with
itraconazole and eudragit E100. Pharmaceutical Research, 27, 775-785.
JANSSENS, S. and VAN DEN MOOTER, G. 2009. Review: physical chemistry of solid
dispersions. Journal of Pharmacy and Pharmacology, 61, 1571-1586.
JO, W. H. and KWON, I. H. 1991. Equation of state theory for melting point depression in
miscible polymer blends. Macromolecules, 24, 3368-3372.
307
JOHNSON, A. M. 1992. Paroxetine: a pharmacological review. International Clinical
Psychopharmacology, 6 Suppl 4, 15-24.
KANIG, J. L. 1964. Properties of fused mannitol in compressed tablets. Journal of
Pharmaceutical Sciences, 53, 188-192.
KARMWAR, P., GRAESER, K., GORDON, K. C., STRACHAN, C. J. and RADES, T.
2011. Investigation of properties and recrystallisation behaviour of amorphous
indomethacin samples prepared by different methods. International Journal of
Pharmaceutics, 417, 94-100.
KARMWAR, P., GRAESER, K., GORDON, K. C., STRACHAN, C. J. and RADES, T.
2012. Effect of different preparation methods on the dissolution behaviour of
amorphous indomethacin. European Journal of Pharmaceutics and
Biopharmaceutics, 80, 459-464.
KASIM, N. A., WHITEHOUSE, M., RAMACHANDRAN, C., BERMEJO, M.,
LENNERNÄS, H., HUSSAIN, A. S., JUNGINGER, H. E., STAVCHANSKY, S.
A., MIDHA, K. K., SHAH, V. P. and AMIDON, G. L. 2004. Molecular properties
of WHO essential drugs and provisional biopharmaceutical classification. Mol
Pharm, 1, 85-96.
KAUSHAL, A. M. and BANSAL, A. K. 2008. Thermodynamic behavior of glassy state of
structurally related compounds. European Journal of Pharmaceutics and
Biopharmaceutics, 69, 1067-1076.
KAUZMANN, W. 1948. The nature of the glassy state and the behavior of liquids at low
temperatures. Chemical Reviews, 43, 219-256.
KAVITHA, C., LAKSHMI, S., BASAPPA, MANTELINGU, K., SRIDHAR, M.,
PRASAD, J. and RANGAPPA, K. 2005. Synthesis and molecular structure
analysis of venlafaxine intermediate and its analog. Journal of Chemical
Crystallography, 35, 957-963.
KAWAKAMI, K. and PIKAL, M. J. 2005. Calorimetric investigation of the structural
relaxation of amorphous materials: Evaluating validity of the methodologies.
Journal of Pharmaceutical Sciences, 94, 948-965.
KE, P., HASEGAWA, S., AL-OBAIDI, H. and BUCKTON, G. 2012. Investigation of
preparation methods on surface/bulk structural relaxation and glass fragility of
amorphous solid dispersions. International Journal of Pharmaceutics, 422, 170-
178.
KESTUR, U. S. and TAYLOR, L. S. 2010. Role of polymer chemistry in influencing
crystal growth rates from amorphous felodipine. CrystEngComm, 12, 2390-2397.

308
KHANKARI, R. K. and GRANT, D. J. W. 1995. Pharmaceutical hydrates. Thermochimica
Acta, 248, 61-79.
KHAWAM, A. and FLANAGAN, D. R. 2006a. Basics and applications of solid-state
kinetics: A pharmaceutical perspective. Journal of Pharmaceutical Sciences, 95,
472-498.
KHAWAM, A. and FLANAGAN, D. R. 2006b. Solid-state kinetic models: Basics and
mathematical fundamentals. Journal of Physical Chemistry B, 110, 17315-17328.
KHOUGAZ, K. and CLAS, S.-D. 2000. Crystallization inhibition in solid dispersions of
MK-0591 and poly(vinylpyrrolidone) polymers. Journal of Pharmaceutical
Sciences, 89, 1325-1334.
KITAMURA, S., KODA, S., MIYAMAE, A., YASUDA, T. and MORIMOTO, Y. 1990.
Dehydration effect on the stability of cefixime trihydrate. International Journal of
Pharmaceutics, 59, 217-224.
KOBAYASHI, K., KIMURA, S., TOGAWA, E., WADA, M. and KUGA, S. 2009. Crystal
transition of paramylon with dehydration and hydration. Carbohydrate Polymers,
80, 492-498.
KONNO, H. and TAYLOR, L. S. 2006. Influence of different polymers on the
crystallization tendency of molecularly dispersed amorphous felodipine. Journal of
Pharmaceutical Sciences, 95, 2692-2705.
KONNO, H. and TAYLOR, L. S. 2008. Ability of different polymers to inhibit the
crystallization of amorphous felodipine in the presence of moisture.
Pharmaceutical Research, 25, 969-978.
KONTOGEORGIS, G. M. 2007. The Hansen Solubility Parameters (HSP) in
Thermodynamic Models for Polymer Solutions. In: HANSEN, C. M. (ed.) Hansen
Solubility Parameters, A User's Handbook. 2nd ed. London: CRC Press.75-93
KORADIA, V., FONTELONGA DE LEMOS, A. F., ALLESØ, M., LOPEZ DE DIEGO,
H., RINGKJØBING-ELEMA, M., MÜLLERTZ, A. and RANTANEN, J. 2011.
Phase transformations of amlodipine besylate solid forms. Journal of
Pharmaceutical Sciences, 100, 2896-2910.
KOTAR-JORDAN, B., LENARSIC, R., GREMAN, M., SMRKOLJ, M., MEDEN, A.,
SIMONIC, I., ZUPET, R., GNIDOVEC, J. and BENKIC, P. 2011. Isopropanol
water solvate of olanzapine.
KREVELEN, D. W. V. and NIJENHUIS, K. T. 2009. Properties of Polymers, Oxford,
Elsevier.

309
KUMAR, L. and BANSAL, A. K. 2011. Effect of humidity on the hydration behaviour of
prazosin hydrochloride polyhydrate: Thermal, sorption and crystallographic study.
Thermochimica Acta, 525, 206-210.
LAKSHMAN, J. P., CAO, Y., KOWALSKI, J. and SERAJUDDIN, A. T. M. 2008.
Application of melt extrusion in the development of a physically and chemically
stable high-energy amorphous solid dispersion of a poorly water-soluble drug.
Molecular Pharmaceutics, 5, 994-1002.
LARSEN, S. D. 1997. Solvate of Olanzapine. US Patent 5637584.
LEE, A. Y., ERDEMIR, D. and MYERSON, A. S. 2011. Crystal polymorphism in
chemical process development. Annual Review of Chemical and Biomolecular
Engineering, 2, 259-280.
LEE, S., RAW, A. and YU, L. 2008. Dissolution Testing. In: KRISHNA, R. and YU, L.
(eds.) Biopharmaceutics Applications in Drug Development. Springer US.47-74
LEUNG, S. S., PADDEN, B. E., MUNSON, E. J. and GRANT, D. J. W. 1998. Hydration
and dehydration behavior of aspartame hemihydrate. Journal of Pharmaceutical
Sciences, 87, 508-513.
LIU, J., RIGSBEE, D. R., STOTZ, C. and PIKAL, M. J. 2002. Dynamics of
pharmaceutical amorphous solids: The study of enthalpy relaxation by isothermal
microcalorimetry. Journal of Pharmaceutical Sciences, 91, 1853-1862.
LLOYD, G. R., CRAIG, D. Q. M. and SMITH, A. 1997. An investigation into the melting
behavior of binary mixes and solid dispersions of paracetamol and PEG 4000.
Journal of Pharmaceutical Sciences, 86, 991-996.
LU, Q. and ZOGRAFI, G. 1998. Phase behavior of binary and ternary amorphous mixtures
containing indomethacin, citric acid, and PVP. Pharmaceutical Research, 15, 1202-
1206.
MACEDO, P. B. and LITOVITZ, T. A. 1965. On the Relative Roles of Free Volume and
Activation Energy in the Viscosity of Liquids. The Journal of Chemical Physics,
42, 245-256.
MACKIN, L., ZANON, R., PARK, J. M., FOSTER, K., OPALENIK, H. and DEMONTE,
M. 2002. Quantification of low levels (<10%) of amorphous content in micronised
active batches using dynamic vapour sorption and isothermal microcalorimetry.
International Journal of Pharmaceutics, 231, 227-236.

310
MAJERIK, V., CHARBIT, G., BADENS, E., HORVÁTH, G., SZOKONYA, L., BOSC,
N. and TEILLAUD, E. 2007. Bioavailability enhancement of an active substance
by supercritical antisolvent precipitation. Journal of Supercritical Fluids, 40, 101-
110.
MAO, C., CHAMARTHY, S. and PINAL, R. 2006. Time-Dependence of Molecular
Mobility during Structural Relaxation and its Impact on Organic Amorphous
Solids: An Investigation Based on a Calorimetric Approach. Pharmaceutical
Research, 23, 1906-1917.
MARSAC, P., LI, T. and TAYLOR, L. 2009. Estimation of Drug–Polymer Miscibility and
Solubility in Amorphous Solid Dispersions Using Experimentally Determined
Interaction Parameters. Pharmaceutical Research, 26, 139-151.
MARSAC, P., SHAMBLIN, S. and TAYLOR, L. 2006. Theoretical and Practical
Approaches for Prediction of Drug-Polymer Miscibility and Solubility.
Pharmaceutical Research, 23, 2417-2426.
MATSUMOTO, T. and ZOGRAFI, G. 1999. Physical properties of solid molecular
dispersions of indomethacin with poly(vinylpyrrolidone) and
poly(vinylpyrrolidone-co-vinyl-acetate) in relation to indomethacin crystallization.
Pharmaceutical Research, 16, 1722-1728.
MAYO, S. L., OLAFSON, B. D. and GODDARD III, W. A. 1990. DREIDING: A generic
force field for molecular simulations. Journal of Physical Chemistry, 94, 8897-
8909.
MCGARVEY, O. S., KETT, V. L. and CRAIG, D. Q. M. 2003. An investigation into the
crystallization of alpha,alpha-trehalose from the amorphous state. Journal of
Physical Chemistry B, 107, 6614-6620.
MCNAMARA, D. P., CHILDS, S. L., GIORDANO, J., IARRICCIO, A., CASSIDY, J.,
SHET, M. S., MANNION, R., O'DONNELL, E. and PARK, A. 2006. Use of a
glutaric acid cocrystal to improve oral bioavailability of a low solubility API.
Pharmaceutical Research, 23, 1888-1897.
MEAURIO, E., ZUZA, E. and SARASUA, J. R. 2005. Miscibility and specific interactions
in blends of poly(L-lactide) with poly(vinylphenol). Macromolecules, 38, 1207-
1215.
MILLER, D. A., MCCONVILLE, J. T., YANG, W., WILLIAMS III, R. O. and
MCGINITY, J. W. 2007. Hot-melt extrusion for enhanced delivery of drug
particles. Journal of Pharmaceutical Sciences, 96, 361-376.
311
MONEGHINI, M., CARCANO, A., ZINGONE, G. and PERISSUTTI, B. 1998. Studies in
dissolution enhancement of atenolol. Part I. International Journal of
Pharmaceutics, 175, 177-183.
MORRIS, K. R., GRIESSER, U. J., ECKHARDT, C. J. and STOWELL, J. G. 2001.
Theoretical approaches to physical transformations of active pharmaceutical
ingredients during manufacturing processes. Advanced Drug Delivery Reviews, 48,
91-114.
MURA, P., FAUCCI, M. T., MANDERIOLI, A. and BRAMANTI, G. 1999a. Influence of
the preparation method on the physicochemical properties of binary systems of
econazole with cyclodextrins. International Journal of Pharmaceutics, 193, 85-95.
MURA, P., FAUCCI, M. T., PARRINI, P. L., FURLANETTO, S. and PINZAUTI, S.
1999b. Influence of the preparation method on the physicochemical properties of
ketoprofen-cyclodextrin binary systems. International Journal of Pharmaceutics,
179, 117-128.
MURA, P., FAUCCI, M. T., PARRINI, P. L., FURLANETTO, S. and PINZAUTI, S.
1999c. Influence of the preparation method on the physicochemical properties of
ketoprofen–cyclodextrin binary systems. International Journal of Pharmaceutics,
179, 117-128.
MURDANDE, S. B., PIKAL, M. J., SHANKER, R. M. and BOGNER, R. H. 2011.
Aqueous solubility of crystalline and amorphous drugs: Challenges in
measurement. Pharmaceutical Development and Technology, 16, 187-200.
NAKAMOTO, K., MARGOSHES, M. and RUNDLE, R. E. 1955. STRETCHING
FREQUENCIES AS A FUNCTION OF DISTANCES IN HYDROGEN BONDS.
Journal of the American Chemical Society, 77, 6480-6486.
NANGIA, A. 2005. Pseudopolymorph: Retain This Widely Accepted Term. Crystal
Growth & Design, 6, 2-4.
NISHI, T. and WANG, T. T. 1975. Melting point depression and kinetic effects of cooling
on crystallization in poly(vinylidene fluoride)-poly(methyl methacrylate) mixtures.
Macromolecules, 8, 909-915.
O'NEIL, A. and EDWARDS, H. 2011. Spectroscopic Characterization. In: STOR , R.
A. and M N, I. (eds.) Solid State Characterization of Pharmaceuticals. UK:
Wiley
OBERHOLTZER, E. R. and BRENNER, G. S. 1979. Cefoxitin sodium: solution and solid-
state chemical stability studies. Journal of Pharmaceutical Sciences, 68, 863-866.

312
OSSI, P. M. 2010. Disordered Materials, Springer Berlin Heidelberg.
OTSUKA, M., HASEGAWA, H. and MATSUDA, Y. 1997. Effect of polymorphic
transformation during the extrusion-granulation process on the pharmaceutical
properties of carbamazepine granules. Chemical and Pharmaceutical Bulletin, 45,
894-898.
OTSUKA, M., OFUSA, T. and MATSUDA, Y. 1999. Effect of environmental humidity on
the transformation pathway of carbamazepine polymorphic modifications during
grinding. Colloids and Surfaces B: Biointerfaces, 13, 263-273.
OZAWA, T. 1965. A NEW METHOD OF ANALYZING THERMOGRAVIMETRIC
DATA. Bulletin of the Chemical Society of Japan, 38, 1881-1886.
PATTERSON, J. E., JAMES, M. B., FORSTER, A. H., LANCASTER, R. W., BUTLER,
J. M. and RADES, T. 2007. Preparation of glass solutions of three poorly water
soluble drugs by spray drying, melt extrusion and ball milling. International
Journal of Pharmaceutics, 336, 22-34.
PAUDEL, A., VAN HUMBEECK, J. and VAN DEN MOOTER, G. 2010. Theoretical and
experimental investigation on the solid solubility and miscibility of naproxen in
poly(vinylpyrrolidone). Molecular Pharmaceutics, 7, 1133-1148.
PAUDEL, A., WORKU, Z. A., MEEUS, J., GUNS, S. and VAN DEN MOOTER, G.
2012. Manufacturing of solid dispersions of poorly water soluble drugs by spray
drying: Formulation and process considerations. International Journal of
Pharmaceutics.
PERCY, S. R. 1872. Improvement in drying and concentrating liquid substances by
atomizing. Letters Patent n. 125,406.
PETIT, S. and COQUEREL, G. 1996. Mechanism of several solid-solid transformations
between dihydrated and anhydrous copper(II) 8-hydroxyquinolinates. Proposition
for a unified model for the dehydration of molecular crystals. Chemistry of
Materials, 8, 2247-2258.
PFEIFFER, R. R., YANG, K. S. and TUCKER, M. A. 1970. Crystal pseudopolymorphism
of cephaloglycin and cephalexin. Journal of Pharmaceutical Sciences, 59, 1809-
1814.
PIRTTIMAKI, J., LAINE, E., KETOLAINEN, J. and PARONEN, P. 1993. EFFECTS OF
GRINDING AND COMPRESSION ON CRYSTAL-STRUCTURE OF
ANHYDROUS CAFFEINE. International Journal of Pharmaceutics, 95, 93-99.

313
POKHARKAR, V. B., MANDPE, L. P., PADAMWAR, M. N., AMBIKE, A. A.,
MAHADIK, K. R. and PARADKAR, A. 2006. Development, characterization and
stabilization of amorphous form of a low Tg drug. Powder Technology, 167, 20-25.
POLLA, G. I., VEGA, D. R., LANZA, H., TOMBARI, D. G., BAGGIO, R., AYALA, A.
P., FILHO, J. M., FERNÁNDEZ, D., LEYVA, G. and DARTAYET, G. 2005.
Thermal behaviour and stability in Olanzapine. International Journal of
Pharmaceutics, 301, 33-40.
POOLE, J. W., OWEN, G., SILVERIO, J., FREYHOF, J. N. and ROSENMAN, S. B.
1968. Physiochemical factors influencing the absorption of the anhydrous and
trihydrate forms of ampicillin. Current Therapeutic Research - Clinical and
Experimental, 10, 292-303.
POUTON, C. W. 2000. Lipid formulations for oral administration of drugs: Non-
emulsifying, self-emulsifying and 'self-microemulsifying' drug delivery systems.
European Journal of Pharmaceutical Sciences, 11, S93-S98.
PRICE, C. P., GRZESIAK, A. L., LANG, M. and MATZGER, A. J. 2002. Polymorphism
of Nabumetone. Crystal Growth & Design, 2, 501-503.
PUDIPEDDI, M. and SERAJUDDIN, A. T. M. 2005. Trends in solubility of polymorphs.
Journal of Pharmaceutical Sciences, 94, 929-939.
QI, S., AVALLE, P., SAKLATVALA, R. and CRAIG, D. Q. M. 2008. An investigation
into the effects of thermal history on the crystallisation behaviour of amorphous
paracetamol. European Journal of Pharmaceutics and Biopharmaceutics, 69, 364-
371.
QIAN, F., HUANG, J. and HUSSAIN, M. A. 2010. Drug–polymer solubility and
miscibility: Stability consideration and practical challenges in amorphous solid
dispersion development. Journal of Pharmaceutical Sciences, 99, 2941-2947.
RASTOGI, S., ZAKRZEWSKI, M. and SURYANARAYANAN, R. 2001. Investigation of
solid-state reactions using variable temperature X-ray powder diffractrometry. I.
Aspartame hemihydrate. Pharmaceutical Research, 18, 267-273.
RASTOGI, S., ZAMANSKY, I., ROY, S., TYLE, P. and SURYANARAYANAN, R.
1999. Solid-state phase transitions of AG337, an antitumor agent. Pharmaceutical
Development and Technology, 4, 623-632.
RÉ, M. I. 2006. Formulating drug delivery systems by spray drying. Drying Technology,
24, 433-446.

314
REDMAN-FUREY, N., DICKS, M., BIGALOW-KERN, A., CAMBRON, R. T., LUBEY,
G., LESTER, C. and VAUGHN, D. 2005. Structural and analytical characterization
of three hydrates and an anhydrate form of risedronate. Journal of Pharmaceutical
Sciences, 94, 893-911.
REINTJES, T. (ed.) 2011. Solubility Enhancement with BASF Pharma Polymers Germany.
REPKA, M. A., BATTU, S. K., UPADHYE, S. B., THUMMA, S., CROWLEY, M. M.,
ZHANG, F., MARTIN, C. and MCGINITY, J. W. 2007. Pharmaceutical
applications of hot-melt extrusion: Part II. Drug Development and Industrial
Pharmacy, 33, 1043-1057.
REPKA, M. A., GERDING, T. G., REPKA, S. L. and MCGINITY, J. W. 1999. Influence
of plasticizers and drugs on the physical-mechanical properties of
hydroxypropylcellulose films prepared by hot melt extrusion. Drug Development
and Industrial Pharmacy, 25, 625-633.
REUTZEL-EDENS, S. M., BUSH, J. K., MAGEE, P. A., STEPHENSON, G. A. and
BYRN, S. R. 2003a. Anhydrates and Hydrates of Olanzapine: Crystallization,
Solid-State Characterization, and Structural Relationships. Crystal Growth &
Design, 3, 897-907.
REUTZEL-EDENS, S. M., KLEEMANN, R. L., LEWELLEN, P. L., BORGHESE, A. L.
and ANTOINE, L. J. 2003b. Crystal forms of LY334370 HCl: Isolation, solid-state
characterization, and physicochemical properties. Journal of Pharmaceutical
Sciences, 92, 1196-1205.
REUTZEL, S. M. 1998. Origins of the unusual hygroscopicity observed in LY297802
tartrate. Journal of Pharmaceutical Sciences, 87, 1568-1571.
RODRÍGUEZ-SPONG, B., PRICE, C. P., JAYASANKAR, A., MATZGER, A. J. and
RODRÍGUEZ-HORNEDO, N. 2004. General principles of pharmaceutical solid
polymorphism: A supramolecular perspective. Advanced Drug Delivery Reviews,
56, 241-274.
ROY, S., GOUD, N. R., BABU, N. J., IQBAL, J., KRUTHIVENTI, A. K. and NANGIA,
A. 2008. Crystal Structures of Norfloxacin Hydrates. Crystal Growth & Design, 8,
4343-4346.
RUMONDOR, A. C. F., STANFORD, L. A. and TAYLOR, L. S. 2009. Effects of polymer
type and storage relative humidity on the kinetics of felodipine crystallization from
amorphous solid dispersions. Pharmaceutical Research, 26, 2599-2606.

315
SAKURAI, A., SAKAI, T., SAKO, K. and MAITANI, Y. 2012. Polymer combination
increased both physical stability and oral absorption of solid dispersions containing
a low glass transition temperature drug: Physicochemical characterization and in
vivo study. Chemical and Pharmaceutical Bulletin, 60, 459-464.
SANPHUI, P., SARMA, B. and NANGIA, A. 2011. Phase transformation in
conformational polymorphs of nimesulide. Journal of Pharmaceutical Sciences,
100, 2287-2299.
SCHNEIDER, H. A. and DI MARZIO, E. A. 1992. The glass temperature of polymer
blends: comparison of both the free volume and the entropy predictions with data.
Polymer, 33, 3453-3461.
SEDDON, K. R. 2004. Pseudopolymorph: A Polemic. Crystal Growth & Design, 4, 1087-
1087.
SEKIGUCHI, K. and OBI, N. 1961. Studies on Absorption of Eutectic Mixture. I. A
Comparison of the Behavior of Eutectic Mixture of Sulfathiazole and that of
Ordinary Sulfathiazole in Man. Chemical & pharmaceutical bulletin, 9, 866-872.
SHAH, B., KAKUMANU, V. K. and BANSAL, A. K. 2006. Analytical techniques for
quantification of amorphous/crystalline phases in pharmaceutical solids. Journal of
Pharmaceutical Sciences, 95, 1641-1665.
SHAH, S., MADDINENI, S., LU, J. and REPKA, M. A. 2012. Melt extrusion with poorly
soluble drugs. International Journal of Pharmaceutics, 1, 233-252.
SHALAEV, E. Y. and ZOGRAFI, G. 1996. How does residual water affect the solid-state
degradation of drugs in the amorphous state? Journal of Pharmaceutical Sciences,
85, 1137-1141.
SHAMBLIN, S. L., HANCOCK, B. C., DUPUIS, Y. and PIKAL, M. J. 2000.
Interpretation of relaxation time constants for amorphous pharmaceutical systems.
Journal of Pharmaceutical Sciences, 89, 417-427.
SHAMBLIN, S. L., TANG, X., CHANG, L., HANCOCK, B. C. and PIKAL, M. J. 1999.
Characterization of the time scales of molecular motion in pharmaceutically
important glasses. Journal of Physical Chemistry B, 103, 4113-4121.
SHAMBLIN, S. L., TAYLOR, L. S. and ZOGRAFI, G. 1998. Mixing behavior of
colyophilized binary systems. Journal of Pharmaceutical Sciences, 87, 694-701.
SHAMMA, R. N. and BASHA, M. 2013. Solupluse (R): A novel polymeric solubilizer for
optimization of Carvedilol solid dispersions: Formulation design and effect of
method of preparation. Powder Technology, 237, 406-414.

316
SHAN, N. and ZAWOROTKO, M. J. 2008. The role of cocrystals in pharmaceutical
science. Drug Discovery Today, 13, 440-446.
SHENG, J., VENKATESH, G. M., DUDDU, S. P. and GRANT, D. J. W. 1999.
Dehydration behavior of eprosartan mesylate dihydrate. Journal of Pharmaceutical
Sciences, 88, 1021-1029.
SHETH, A. R., LUBACH, J. W., MUNSON, E. J., MULLER, F. X. and GRANT, D. J. W.
2005. Mechanochromism of piroxicam accompanied by intermolecular proton
transfer probed by spectroscopic methods and solid-phase changes. Journal of the
American Chemical Society, 127, 6641-6651.
SHIMANOVICH, R., COOKE, M. and PETERSON, M. L. 2012. A rapid approach to the
preliminary assessment of the physical stability of pharmaceutical hydrates.
Journal of Pharmaceutical Sciences, 101, 4013-4017.
SIMHA, R. and BOYER, R. F. 1962. On a general relation involving the glass temperature
and coefficients of expansion of polymers. The Journal of Chemical Physics, 37,
1003-1007.
SIMONELLI, A. P., MEHTA, S. C. and HIGUCHI, W. I. 1969. Dissolution rates of high
energy polyvinylpyrrolidone (PVP)-sulfathiazole coprecipitates. Journal of
Pharmaceutical Sciences, 58, 538-549.
SIX, K., VERRECK, G., PEETERS, J., BREWSTER, M. and VAN DEN MOOTER, G.
2004. Increased Physical Stability and Improved Dissolution Properties of
Itraconazole, a Class II Drug, by Solid Dispersions that Combine Fast- and Slow-
Dissolving Polymers. Journal of Pharmaceutical Sciences, 93, 124-131.
SOLLOHUB, K. and CAL, K. 2010. Spray drying technique: II. Current applications in
pharmaceutical technology. Journal of Pharmaceutical Sciences, 99, 587-597.
SRINARONG, P., DE WAARD, H., FRIJLINK, H. W. and HINRICHS, W. L. J. 2011.
Improved dissolution behavior of lipophilic drugs by solid dispersions: The
production process as starting point for formulation considerations. Expert Opinion
on Drug Delivery, 8, 1121-1140.
STEPHENSON, G. A. 2000. Structure determination from conventional powder
diffraction data: Application to hydrates, hydrochloride salts, and metastable
polymorphs. Journal of Pharmaceutical Sciences, 89, 958-966.
STEPHENSON, G. A. and DISEROAD, B. A. 2000. Structural relationship and
desolvation behavior of cromolyn, cefazolin and fenoprofen sodium hydrates.
International Journal of Pharmaceutics, 198, 167-177.
317
STEPHENSON, G. A., GROLEAU, E. G., KLEEMANN, R. L., XU, W. and RIGSBEE,
D. R. 1998. Formation of isomorphic desolvates: Creating a molecular vacuum.
Journal of Pharmaceutical Sciences, 87, 536-542.
STICKEL, F., FISCHER, E. W. and RICHERT, R. 1995. Dynamics of glass-forming
liquids. I. Temperature-derivative analysis of dielectric relaxation data. The Journal
of Chemical Physics, 102, 6251-6257.
SUGANO, K., OKAZAKI, A., SUGIMOTO, S., TAVORNVIPAS, S., OMURA, A. and
MANO, T. 2007. Solubility and dissolution profile assessment in drug discovery.
Drug Metabolism and Pharmacokinetics, 22, 225-254.
SUN, C. C. 2007. Thermal expansion of organic crystals and precision of calculated crystal
density: A survey of Cambridge Crystal Database. Journal of Pharmaceutical
Sciences, 96, 1043-1052.
SURANA, R., PYNE, A. and SURYANARAYANAN, R. 2004. Effect of Aging on the
Physical Properties of Amorphous Trehalose. Pharmaceutical Research, 21, 867-
874.
SUZUKI, T., ARAKI, T., KITAOKA, H. and TERADA, K. 2012. Characterization of non-
stoichiometric hydration and the dehydration behavior of sitafloxacin hydrate.
Chemical and Pharmaceutical Bulletin, 60, 45-55.
TACHIBANA, T. and NAKAMURA, A. 1965. A methode for preparing an aqueous
colloidal dispersion of organic materials by using water-soluble polymers:
Dispersion ofΒ-carotene by polyvinylpyrrolidone. Kolloid-Zeitschrift und
Zeitschrift für Polymere, 203, 130-133.
TANG, X. and PIKAL, M. J. 2004. Design of Freeze-Drying Processes for
Pharmaceuticals: Practical Advice. Pharmaceutical Research, 21, 191-200.
TANG, X. C., PIKAL, M. J. and TAYLOR, L. S. 2002. A spectroscopic investigation of
hydrogen bond patterns in crystalline and amorphous phases in dihydropyridine
calcium channel blockers. Pharmaceutical Research, 19, 477-483.
TANTISHAIYAKUL, V., KAEWNOPPARAT, N. and INGKATAWORNWONG, S.
1996. Properties of solid dispersions of piroxicam in polyvinylpyrrolidone K-30.
International Journal of Pharmaceutics, 143, 59-66.
TANTISHAIYAKUL, V., KAEWNOPPARAT, N. and INGKATAWORNWONG, S.
1999. Properties of solid dispersions of piroxicam in polyvinylpyrrolidone.
International Journal of Pharmaceutics, 181, 143-151.
318
TAYLOR, L. S. and SHAMBLIN, S. L. 1999. Amorphous Solids. In: BRITTAIN, H. G.
(ed.) Polymorphism in Pharmaceutic Solids. 2nd ed. New York: Informa
Healthcare.
TE, R. L., GRIESSER, U. J., MORRIS, K. R., BYRN, S. R. and STOWELL, J. G. 2003.
X-ray diffraction and solid-state NMR investigation of the single-crystal to single-
crystal dehydration of thiamine hydrochloride monohydrate. Crystal Growth and
Design, 3, 997-1004.
THAKURIA, R. and NANGIA, A. 2011. Polymorphic form IV of olanzapine. Acta
Crystallographica Section C, 67, 461-463.
THO, I., LIEPOLD, B., ROSENBERG, J., MAEGERLEIN, M., BRANDL, M. and
FRICKER, G. 2010. Formation of nano/micro-dispersions with improved
dissolution properties upon dispersion of ritonavir melt extrudate in aqueous media.
European Journal of Pharmaceutical Sciences, 40, 25-32.
TRASI, N. S. and TAYLOR, L. S. 2012. Effect of polymers on nucleation and crystal
growth of amorphous acetaminophen. CrystEngComm, 14, 5188-5197.
TRASK, A. V., MOTHERWELL, W. D. S. and JONES, W. 2006. Physical stability
enhancement of theophylline via cocrystallization. International Journal of
Pharmaceutics, 320, 114-123.
TRUONG, V., BHANDARI, B. R., HOWES, T. and ADHIKARI, B. 2002. Analytical
model for the prediction of glass transition temperature of food systems. In:
LEVINE, H. (ed.) Amorphous Food and Pharmaceutical Systems. The Royal
Society of Chemistry.31-47
URBANETZ, N. A. 2006. Stabilization of solid dispersions of nimodipine and
polyethylene glycol 2000. European Journal of Pharmaceutical Sciences, 28, 67-
76.
VAN DEN MOOTER, G., WUYTS, M., BLATON, N., BUSSON, R., GROBET, P.,
AUGUSTIJNS, P. and KINGET, R. 2000. Physical stabilisation of amorphous
ketoconazole in solid dispersions with polyvinylpyrrolidone K25. European
Journal of Pharmaceutical Sciences, 12, 261-269.
VAN DROOGE, D. J., HINRICHS, W. L. J., VISSER, M. R. and FRIJLINK, H. W. 2006.
Characterization of the molecular distribution of drugs in glassy solid dispersions at
the nano-meter scale, using differential scanning calorimetry and gravimetric water
vapour sorption techniques. International Journal of Pharmaceutics, 310, 220-229.

319
VAN EERDENBRUGH, B. and TAYLOR, L. S. 2010. Small scale screening to determine
the ability of different polymers to inhibit drug crystallization upon rapid solvent
evaporation. Molecular Pharmaceutics, 7, 1328-1337.
VASCONCELOS, T., SARMENTO, B. and COSTA, P. 2007. Solid dispersions as
strategy to improve oral bioavailability of poor water soluble drugs. Drug
Discovery Today, 12, 1068-1075.
VEHRING, R., FOSS, W. R. and LECHUGA-BALLESTEROS, D. 2007. Particle
formation in spray drying. Journal of Aerosol Science, 38, 728-746.
VERHEYEN, S., BLATON, N., KINGET, R. and VAN DEN MOOTER, G. 2002.
Mechanism of increased dissolution of diazepam and temazepam from
polyethylene glycol 6000 solid dispersions. International Journal of
Pharmaceutics, 249, 45-58.
VIDGREN, M. T., VIDGREN, P. A. and PARONEN, T. P. 1987. Comparison of physical
and inhalation properties of spray-dried and mechanically micronized disodium
cromoglycate. International Journal of Pharmaceutics, 35, 139-144.
VIPPAGUNTA, S. R., BRITTAIN, H. G. and GRANT, D. J. W. 2001. Crystalline solids.
Advanced Drug Delivery Reviews, 48, 3-26.
VITEZ, I. M., NEWMAN, A. W., DAVIDOVICH, M. and KIESNOWSKI, C. 1998. The
evolution of hot-stage microscopy to aid solid-state characterizations of
pharmaceutical solids. Thermochimica Acta, 324, 187-196.
VOGT, F. G., DELL'ORCO, P. C., DIEDERICH, A. M., SU, Q., WOOD, J. L., ZUBER,
G. E., KATRINCIC, L. M., MUELLER, R. L., BUSBY, D. J. and DEBROSSE, C.
W. 2006. A study of variable hydration states in topotecan hydrochloride. Journal
of Pharmaceutical and Biomedical Analysis, 40, 1080-1088.
VYAZOVKIN, S., BURNHAM, A. K., CRIADO, J. M., PÉREZ-MAQUEDA, L. A.,
POPESCU, C. and SBIRRAZZUOLI, N. 2011. ICTAC Kinetics Committee
recommendations for performing kinetic computations on thermal analysis data.
Thermochimica Acta, 520, 1-19.
WAFIK GOUDA, H., MOUSTAFA, M. A. and AL SHORA, H. I. 1984. Effect of storage
on nitrofurantoin solid dosage forms. International Journal of Pharmaceutics, 18,
213-215.
WANG, L. M., VELIKOV, V. and ANGELL, C. A. 2002. Direct determination of kinetic
fragility indices of glassforming liquids by differential scanning calorimetry:
Kinetic versus thermodynamic fragilities. Journal of Chemical Physics, 117,
10184-10192.

320
WARD, N. and JACEWICZ, V. W. 2000. Paroxetine Hydrochloride form A or C. United
Kingdom patent application 6133289.
WAWRZYCKA-GORCZYCA, I., BOROWSKI, P., OSYPIUK-TOMASIK, J., MAZUR,
L. and KOZIOL, A. E. 2007. Crystal structure of olanzapine and its solvates. Part
3. Two and three-component solvates with water, ethanol, butan-2-ol and
dichloromethane. Journal of Molecular Structure, 830, 188-197.
WAWRZYCKA-GORCZYCA, I., KOZIOL, A. E., GLICE, M. and CYBULSKI, J. 2004a.
Polymorphic form II of 2-methyl-4-(4-methyl-1-piperazinyl)-10H-thieno- 2,3-b 1,5
benzodiazepin e. Acta Crystallographica Section E-Structure Reports Online, 60,
66-68.
WAWRZYCKA-GORCZYCA, I., MAZUR, L. and KOZIOL, A. E. 2004b. 2-methyl-4-(4-
methyl-1-piperazinyl)-10H-thieno 2,3-b 1,5 benzodiazepine methanol solvate. Acta
Crystallographica Section E-Structure Reports Online, 60, 69-71.
WEUTS, I., KEMPEN, D., DECORTE, A., VERRECK, G., PEETERS, J., BREWSTER,
M. and VAN DEN MOOTER, G. 2004. Phase behaviour analysis of solid
dispersions of loperamide and two structurally related compounds with the
polymers PVP-K30 and PVP-VA64. European Journal of Pharmaceutical
Sciences, 22, 375-385.
WEUTS, I., KEMPEN, D., DECORTE, A., VERRECK, G., PEETERS, J., BREWSTER,
M. and VAN DEN MOOTER, G. 2005. Physical stability of the amorphous state of
loperamide and two fragment molecules in solid dispersions with the polymers
PVP-K30 and PVP-VA64. European Journal of Pharmaceutical Sciences, 25, 313-
320.
WILLART, J. F., DE GUSSEME, A., HEMON, S., DESCAMPS, M., LEVEILLER, F.
and RAMEAU, A. 2002. Vitrification and Polymorphism of Trehalose Induced by
Dehydration of Trehalose Dihydrate. The Journal of Physical Chemistry B, 106,
3365-3370.
WOSTHEINRICH, K. and SCHMIDT, P. C. 2001. Polymorphic changes of thiamine
hydrochloride during granulation and tableting. Drug Development and Industrial
Pharmacy, 27, 481-489.
YANG, Z., NOLLENBERGER, K., ALBERS, J., CRAIG, D. and QI, S. 2013.
Microstructure of an Immiscible Polymer Blend and Its Stabilization Effect on
Amorphous Solid Dispersions. Molecular Pharmaceutics, 10, 2767-2780.
YOKOTA, M., UEKUSA, H. and OHASHI, Y. 1999. Structure Analyses of Two Crystal
Forms of Paroxetine Hydrochloride. Bulletin of the Chemical Society of Japan, 72,
1731-1736.

321
YOUNG, W. W. L. and SURYANARAYANAN, R. 1991. Kinetics of transition of
anhydrous carbamazepine to carbamazepine dihydrate in aqueous suspensions.
Journal of Pharmaceutical Sciences, 80, 496-500.
YU, D. G., GAO, L. D., WHITE, K., BRANFORD-WHITE, C., LU, W. Y. and ZHU, L.
M. 2010. Multicomponent amorphous nanofibers electrospun from hot aqueous
solutions of a poorly soluble drug. Pharmaceutical Research, 27, 2466-2477.
YU, L. 2001. Amorphous pharmaceutical solids: preparation, characterization and
stabilization. Advanced Drug Delivery Reviews, 48, 27-42.
YU, L., MILTON, N., GROLEAU, E. G., MISHRA, D. S. and VANSICKLE, R. E. 1999.
Existence of a mannitol hydrate during freeze-drying and practical implications.
Journal of Pharmaceutical Sciences, 88, 196-198.
YU, L., REUTZEL-EDENS, S. M. and MITCHELL, C. A. 2000. Crystallization and
Polymorphism of Conformationally Flexible Molecules: Problems, Patterns, and
Strategies. Organic Process Research & Development, 4, 396-402.
ÜKS L, N., KARATAŞ, A., ÖZKAN, ., SAVAŞ R, A., ÖZKAN, S. A. and
BAYKARA, T. 2003. Enhanced bioavailability of piroxicam using Gelucire 44/14
and Labrasol: In vitro and in vivo evaluation. European Journal of Pharmaceutics
and Biopharmaceutics, 56, 453-459.
ZHANG, F., AALTONEN, J., TIAN, F., SAVILLE, D. J. and RADES, T. 2009. Influence
of particle size and preparation methods on the physical and chemical stability of
amorphous simvastatin. European Journal of Pharmaceutics and
Biopharmaceutics, 71, 64-70.
ZHANG, G. G. Z., LAW, D., SCHMITT, E. A. and QIU, Y. H. 2004. Phase
transformation considerations during process development and manufacture of
solid oral dosage forms. Advanced Drug Delivery Reviews, 56, 371-390.
ZHAO, Y., INBAR, P., CHOKSHI, H. P., MALICK, A. W. and CHOI, D. S. 2011.
Prediction of the thermal phase diagram of amorphous solid dispersions by flory–
huggins theory. Journal of Pharmaceutical Sciences, 100, 3196-3207.
ZHOU, D., ZHANG, G. G. Z., LAW, D., GRANT, D. J. W. and SCHMITT, E. A. 2002.
Physical stability of amorphous pharmaceuticals: Importance of configurational
thermodynamic quantities and molecular mobility. Journal of Pharmaceutical
Sciences, 91, 1863-1872.
ZHU, H. 2006. Dehydration behavior and structural characterization of the GW275919X
monohydrate. International Journal of Pharmaceutics, 315, 18-23.

322
ZHU, H. and GRANT, D. J. W. 2001. Dehydration behavior of nedocromil magnesium
pentahydrate. International Journal of Pharmaceutics, 215, 251-262.
ZHU, L., JONA, J., NAGAPUDI, K. and WU, T. A. 2010. Fast Surface Crystallization of
Amorphous Griseofulvin Below T (g). Pharmaceutical Research, 27, 1558-1567.

I stand at the seashore, alone, and start to
think. . .
There are the rushing
waves mountains of molecules
each stupidly minding its own business
trillions apart
yet forming white surf in unison.
Ages on ages before
any eyes could see
year after year
thunderously pounding the shore as now.
For whom, for what?
On a dead planet
with no life to entertain.
Never at rest
tortured by energy
wasted prodigiously by the sun
poured into space.
A mite makes the sea roar.
Deep in the sea
all molecules repeat
the pattern of one another
till complex new ones are formed.
They make others like themselves
and a new dance starts.
Growing in size and complexity
living things
masses of atoms
DNA, protein
dancing a pattern ever more intricate.
Out of the cradle
onto dry land
here it is
standing:
atoms with consciousness;
matter with curiosity.
Stands at the sea,
wonders at wondering:
I a universe of atoms,
an atom in the universe.
Richard P. Feynman