An Integrated Remote Sensing and Gis Approach in ... Integrated Remote Sensing a nd Gis Approach in...
9
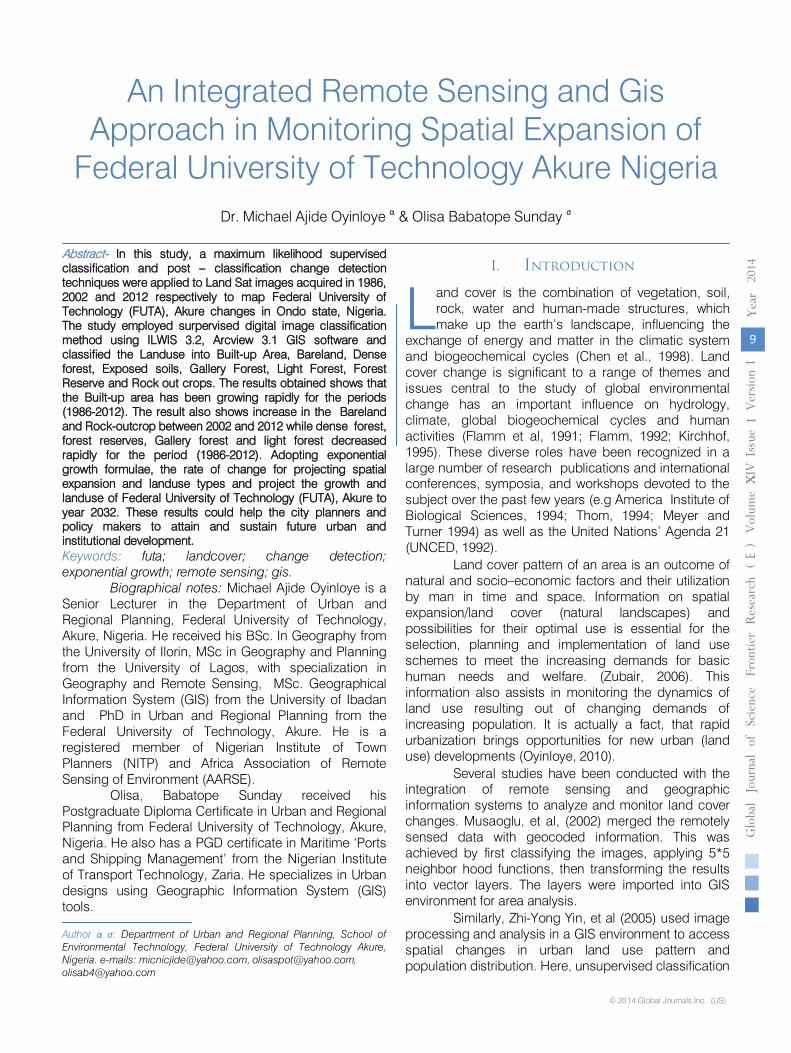
Global Journal of Science Frontier Research: E Interdiciplinary Volume 14 Issue 1 Version 1.0 Year 2014 Type : Double Blind Peer Reviewed International Research Journal Publisher: Global Journals Inc. (USA) Online ISSN: 2249-4626 & Print ISSN: 0975-5896 An Integrated Remote Sensing and Gis Approach in Monitoring Spatial Expansion of Federal University of Technology Akure Nigeria By Dr. Michael Ajide Oyinloye & Olisa Babatope Sunday Federal University of Technology, Nigeria Abstract- In this study, a maximum likelihood supervised classification and post – classification change detection techniques were applied to Land Sat images acquired in 1986, 2002 and 2012 respectively to map Federal University of Technology (FUTA), Akure changes in Ondo state, Nigeria. The study employed surpervised digital image classification method using ILWIS 3.2, Arcview 3.1 GIS software and classified the Landuse into Built-up Area, Bareland, Dense forest, Exposed soils, Gallery Forest, Light Forest, Forest Reserve and Rock out crops. The results obtained shows that the Built-up area has been growing rapidly for the periods (1986-2012). The result also shows increase in the Bareland and Rock-outcrop between 2002 and 2012 while dense forest, forest reserves, Gallery forest and light forest decreased rapidly for the period (1986-2012). Adopting exponential growth formulae, the rate of change for projecting spatial expansion and landuse types and project the growth and landuse of Federal University of Technology (FUTA), Akure to year 2032. These results could help the city planners and policy makers to attain and sustain future urban and institutional development. Keywords: futa; landcover; change detection; exponential growth; remote sensing; gis. GJSFR-E Classification : AnIntegratedRemoteSensingandGisApproahinMonitoringSpatialxpansionofFederalUniversityofTechnologyAkureNigeria Strictly as per the compliance and regulations of : © 2014. Dr. Michael Ajide Oyinloye & Olisa Babatope Sunday. This is a research/review paper, distributed under the terms of the Creative Commons Attribution-Noncommercial 3.0 Unported License http://creativecommons.org/licenses/by-nc/3.0/), permitting all non commercial use, distribution, and reproduction in any medium, provided the original work is properly cited. FOR Code: 291003
Transcript of An Integrated Remote Sensing and Gis Approach in ... Integrated Remote Sensing a nd Gis Approach in...
Global Journal of Science Frontier Research: E Interdiciplinary Volume 14 Issue 1 Version 1.0 Year 2014 Type : Double Blind Peer Reviewed International Research Journal Publisher: Global Journals Inc. (USA) Online ISSN: 2249-4626 & Print ISSN: 0975-5896
An Integrated Remote Sensing and Gis Approach in Monitoring Spatial Expansion of Federal University of Technology Akure Nigeria
By Dr. Michael Ajide Oyinloye & Olisa Babatope Sunday Federal University of Technology, Nigeria
Abstract- In this study, a maximum likelihood supervised classification and post – classification change detection techniques were applied to Land Sat images acquired in 1986, 2002 and 2012 respectively to map Federal University of Technology (FUTA), Akure changes in Ondo state, Nigeria. The study employed surpervised digital image classification method using ILWIS 3.2, Arcview 3.1 GIS software and classified the Landuse into Built-up Area, Bareland, Dense forest, Exposed soils, Gallery Forest, Light Forest, Forest Reserve and Rock out crops. The results obtained shows that the Built-up area has been growing rapidly for the periods (1986-2012). The result also shows increase in the Bareland and Rock-outcrop between 2002 and 2012 while dense forest, forest reserves, Gallery forest and light forest decreased rapidly for the period (1986-2012). Adopting exponential growth formulae, the rate of change for projecting spatial expansion and landuse types and project the growth and landuse of Federal University of Technology (FUTA), Akure to year 2032. These results could help the city planners and policy makers to attain and sustain future urban and institutional development.
Keywords: futa; landcover; change detection; exponential growth; remote sensing; gis.
GJSFR-E Classification :
AnIntegratedRemoteSensingandGisApproahinMonitoringSpatialxpansionofFederalUniversityofTechnologyAkureNigeria
Strictly as per the compliance and regulations of :
© 2014. Dr. Michael Ajide Oyinloye & Olisa Babatope Sunday. This is a research/review paper, distributed under the terms of the Creative Commons Attribution-Noncommercial 3.0 Unported License http://creativecommons.org/licenses/by-nc/3.0/), permitting all non commercial use, distribution, and reproduction in any medium, provided the original work is properly cited.
FOR Code: 291003
An Integrated Remote Sensing and Gis Approach in Monitoring Spatial Expansion of
Federal University of Technology Akure Nigeria Dr. Michael Ajide Oyinloye α & Olisa Babatope Sunday σ
Abstract- In this study, a maximum likelihood supervised classification and post – classification change detection techniques were applied to Land Sat images acquired in 1986, 2002 and 2012 respectively to map Federal University of Technology (FUTA), Akure changes in Ondo state, Nigeria. The study employed surpervised digital image classification method using ILWIS 3.2, Arcview 3.1 GIS software and classified the Landuse into Built-up Area, Bareland, Dense forest, Exposed soils, Gallery Forest, Light Forest, Forest Reserve and Rock out crops. The results obtained shows that the Built-up area has been growing rapidly for the periods (1986-2012). The result also shows increase in the Bareland and Rock-outcrop between 2002 and 2012 while dense forest, forest reserves, Gallery forest and light forest decreased rapidly for the period (1986-2012). Adopting exponential growth formulae, the rate of change for projecting spatial expansion and landuse types and project the growth and landuse of Federal University of Technology (FUTA), Akure to year 2032. These results could help the city planners and policy makers to attain and sustain future urban and institutional development. Keywords: futa; landcover; change detection; exponential growth; remote sensing; gis.
Biographical notes: Michael Ajide Oyinloye is a Senior Lecturer in the Department of Urban and Regional Planning, Federal University of Technology, Akure, Nigeria. He received his BSc. In Geography from the University of Ilorin, MSc in Geography and Planning from the University of Lagos, with specialization in Geography and Remote Sensing, MSc. Geographical Information System (GIS) from the University of Ibadan and PhD in Urban and Regional Planning from the Federal University of Technology, Akure. He is a registered member of Nigerian Institute of Town Planners (NITP) and Africa Association of Remote Sensing of Environment (AARSE).
Olisa, Babatope Sunday received his Postgraduate Diploma Certificate in Urban and Regional Planning from Federal University of Technology, Akure, Nigeria. He also has a PGD certificate in Maritime ‘Ports and Shipping Management’ from the Nigerian Institute of Transport Technology, Zaria. He specializes in Urban designs using Geographic Information System (GIS) tools. Author α σ: Department of Urban and Regional Planning, School of Environmental Technology, Federal University of Technology Akure, Nigeria. e-mails: [email protected], [email protected], [email protected]
I. Introduction
and cover is the combination of vegetation, soil, rock, water and human-made structures, which make up the earth’s landscape, influencing the
exchange of energy and matter in the climatic system and biogeochemical cycles (Chen et al., 1998). Land cover change is significant to a range of themes and issues central to the study of global environmental change has an important influence on hydrology, climate, global biogeochemical cycles and human activities (Flamm et al, 1991; Flamm, 1992; Kirchhof, 1995). These diverse roles have been recognized in a large number of research publications and international conferences, symposia, and workshops devoted to the subject over the past few years (e.g America Institute of Biological Sciences, 1994; Thom, 1994; Meyer and Turner 1994) as well as the United Nations’ Agenda 21 (UNCED, 1992).
Land cover pattern of an area is an outcome of natural and socio–economic factors and their utilization by man in time and space. Information on spatial expansion/land cover (natural landscapes) and possibilities for their optimal use is essential for the selection, planning and implementation of land use schemes to meet the increasing demands for basic human needs and welfare. (Zubair, 2006). This information also assists in monitoring the dynamics of land use resulting out of changing demands of increasing population. It is actually a fact, that rapid urbanization brings opportunities for new urban (land use) developments (Oyinloye, 2010).
Several studies have been conducted with the integration of remote sensing and geographic information systems to analyze and monitor land cover changes. Musaoglu, et al, (2002) merged the remotely sensed data with geocoded information. This was achieved by first classifying the images, applying 5*5 neighbor hood functions, then transforming the results into vector layers. The layers were imported into GIS environment for area analysis.
Similarly, Zhi-Yong Yin, et al (2005) used image processing and analysis in a GIS environment to access spatial changes in urban land use pattern and population distribution. Here, unsupervised classification
L 9
Globa
lJo
urna
lof
Scienc
eFr
ontie
rResea
rch
V
olum
eXIV
X Issue
e
rsion
IV
IYea
r
(
)E
2014
© 2014 Global Journals Inc. (US)
was used to classify the image into land use classes. With census data in a GIS, census polygon was constructed into various sets of units, and then comparison made with the classified image population in surface areas. In his studies carried out by 2004 in Shaoxing City in China using satellite imageries for the year 1984, 1997 and 2000, in which one of the goals of the study was to produce a landuse map of shaoxing city and its surroundings, the result shows that there are undoubtedly a lot of changes that occurred between 1984 and 1997 when compared with those of 2000, due to sufficient time gap. From the study, it was observed that residential area development was mainly at the expense of agriculture land use.
In the West African forest region, cities developed among the Yoruba, Fulani, and Hausa people as well as in the Ashanti and Benin kingdom. As well as being commercial and political centers they worked as spiritual centers. The Nigerian city of Lagos had 665000 inhabitants in 1963 (Rakodi, 1997) and 8.7 million in 2000 is expected to become the worlds’ 11th biggest city by 2015 with 16 million inhabitants (UN, 2002). The urbanization of most of Africa countries is moving fast forward, especially south of the Sahara. As a country develops from primarily an agricultural to an industrial economy, large-scale migration of rural residents to towns and cities takes place.
In Federal University of Technology Akure, speedy urbanization took place in the last two decades due to population growth of students and staff which has been attributable to the increase in population of the host city of Akure and catchment areas and is still going on (Olisa, 2012). Spatial developments are no longer following a controlled and sustainable pattern due to lack of development plans. Meanwhile, the pressure of horizontal expansion that had started for years has continued to increase till this period in Federal University of technology Akure and its environs. This could sometimes be seen as socio-physical developments which consequently have effects on the natural landscapes. While these social issues affect the study area, their impact on vegetation distribution and composition are harder to estimate. The extent of this development is however deemed to be monitored in order to guide decision makers on the distribution of facilities/infrastructures and also to ensure that the growth is compatible with the concept that embraces Environmental Sustainability.
The aim of this paper therefore is to use the application of remote sensing and GIS approach to monitoring spatial expansion of Federal University of Technology, Akure with a view to determining the pattern of landuse/ landcover changes and its implications on the study area. The objectives are to;
i. identification of various landcover and landuse classes in remotely sensed data sources;
ii. determine the spatial extent and the impact urban growth on the rural surroundings.
iii. examine the major determinants of spatial expansion and land use types and the rate of urban growth in FUTA and its surrounding areas; and
iv. examine relationship between urban (population) growth and spatial expansion / landuse type.
v. adopt the exponential growth formulae; Af = Ab(1+%/100) f-b, (where A is the future, b
is the base year and % is the rate of change for projecting urban expansion and landuse type) to project the growth and landcover change of the study area to year 2032.
II. Study rea: Futa and Environs
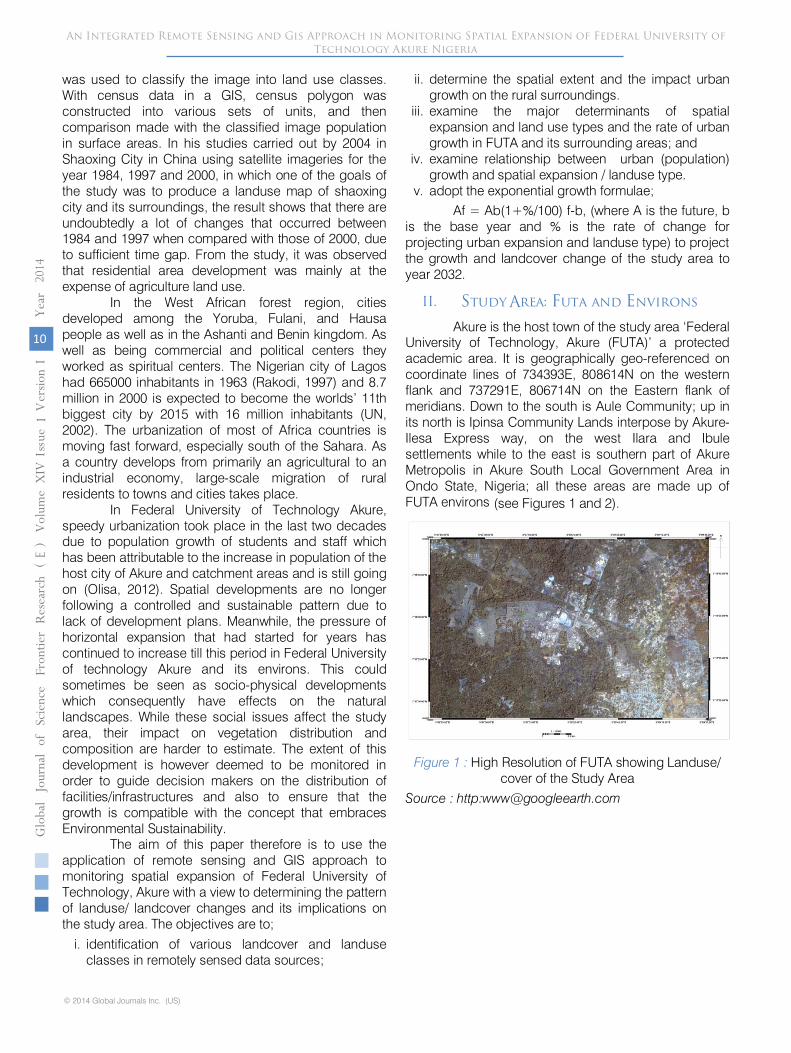
Akure is the host town of the study area ‘Federal University of Technology, Akure (FUTA)’ a protected academic area. It is geographically geo-referenced on coordinate lines of 734393E, 808614N on the western flank and 737291E, 806714N on the Eastern flank of meridians. Down to the south is Aule Community; up in its north is Ipinsa Community Lands interpose by Akure-Ilesa Express way, on the west Ilara and Ibule settlements while to the east is southern part of Akure Metropolis in Akure South Local Government Area in Ondo State, Nigeria; all these areas are made up of FUTA environs (see Figures 1 and 2).
Figure 1 : High Resolution of FUTA showing Landuse/
cover of the Study Area Source
: http:[email protected]
© 2014 Global Journals Inc. (US)
10
Globa
lJo
urna
lof
Scienc
eFr
ontie
rResea
rch
V
olum
eXIV
Issue
e
rsion
IV
I
(
)E
Yea
r20
14An Integrated Remote Sensing and Gis Approach in Monitoring Spatial Expansion of Federal University of
Technology Akure Nigeria
A
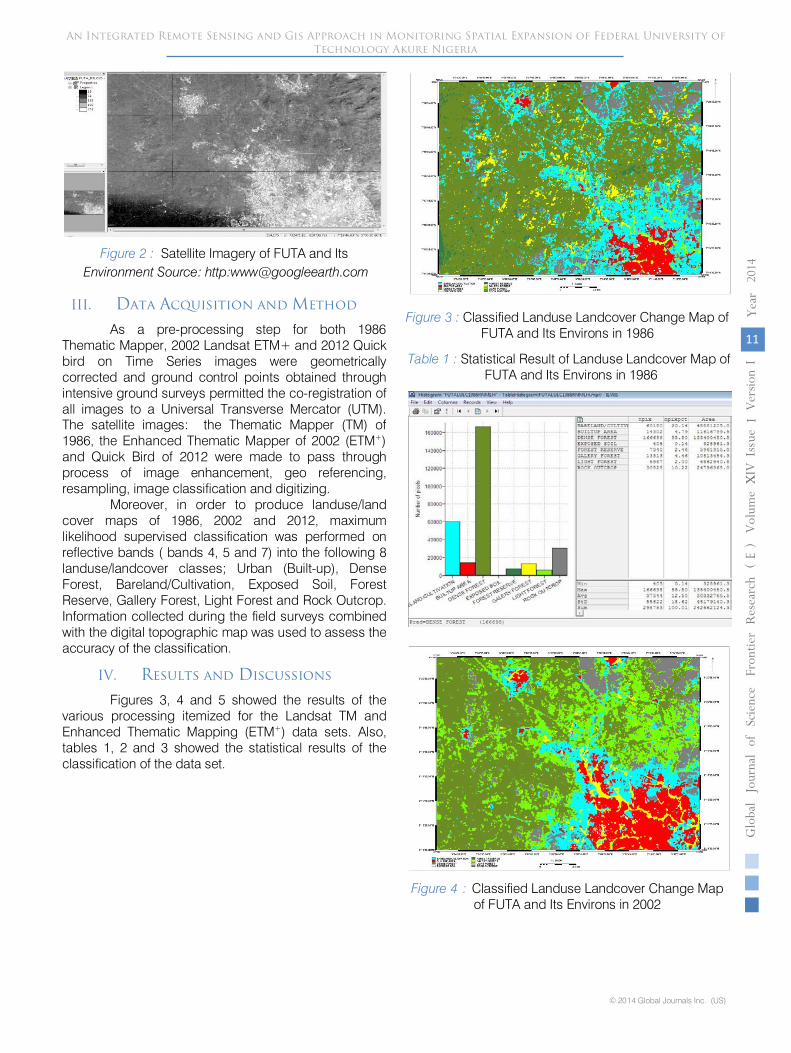
Figure 2 : Satellite Imagery of FUTA and Its Environment Source: http:[email protected]
III. Data Acquisition and Method
As a pre-processing step for both 1986 Thematic Mapper, 2002 Landsat ETM+ and 2012 Quick bird on Time Series images were geometrically corrected and ground control points obtained through intensive ground surveys permitted the co-registration of all images to a Universal Transverse Mercator (UTM). The satellite images: the Thematic Mapper (TM) of 1986, the Enhanced Thematic Mapper of 2002 (ETM+) and Quick Bird of 2012 were made to pass through process of image enhancement, geo referencing, resampling, image classification and digitizing.
Moreover, in order to produce landuse/land cover maps of 1986, 2002 and 2012, maximum likelihood supervised classification was performed on reflective bands ( bands 4, 5 and 7) into the following 8 landuse/landcover classes; Urban (Built-up), Dense Forest, Bareland/Cultivation, Exposed Soil, Forest Reserve, Gallery Forest, Light Forest and Rock Outcrop. Information collected during the field surveys combined with the digital topographic map was used to assess the accuracy of the classification.
IV. Results and Discussions
Figures 3, 4 and 5 showed the results of the various processing itemized for the Landsat TM and Enhanced Thematic Mapping (ETM+) data sets. Also, tables 1, 2 and 3 showed the statistical results of the classification of the data set.
Figure 3
: Classified
Landuse Landcover Change Map of
FUTA and Its Environs in 1986
Table 1 : Statistical Result of Landuse Landcover Map of
FUTA and Its Environs in 1986
Figure 4
: Classified Landuse Landcover Change Map of FUTA and Its Environs in 2002
11
Globa
lJo
urna
lof
Scienc
eFr
ontie
rResea
rch
V
olum
eXIV
X Issue
e
rsion
IV
IYea
r
(
)E
2014
© 2014 Global Journals Inc. (US)
An Integrated Remote Sensing and Gis Approach in Monitoring Spatial Expansion of Federal University of Technology Akure Nigeria
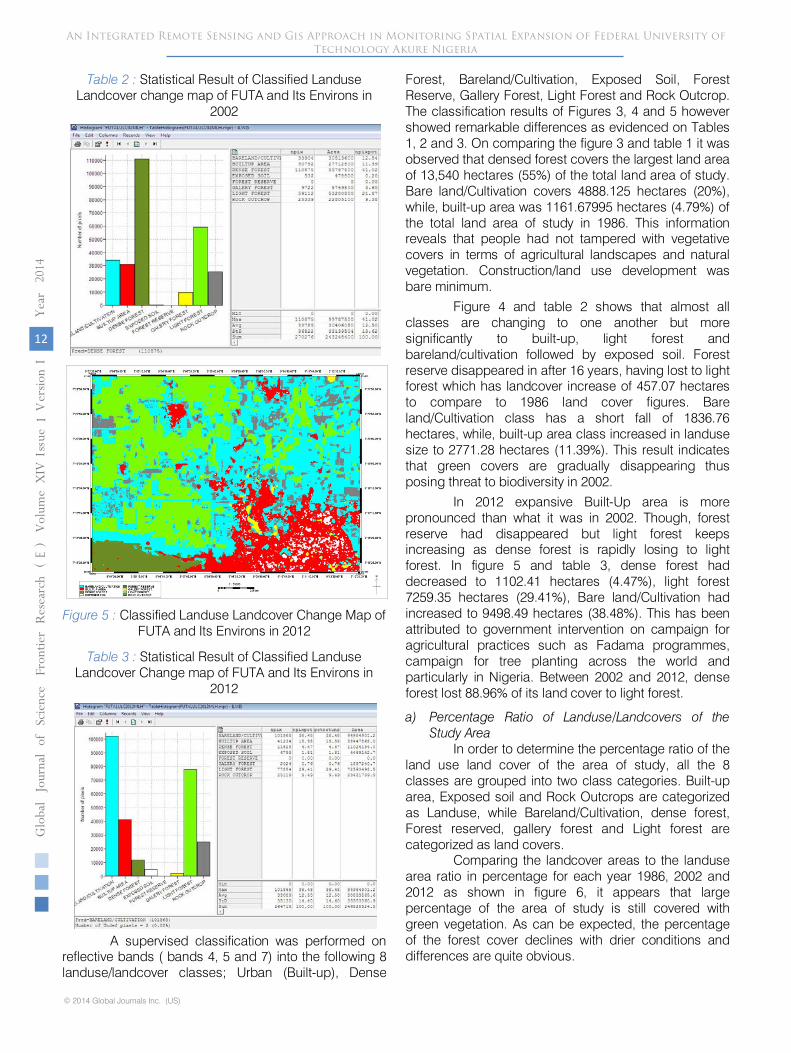
Table 2 : Statistical Result of Classified Landuse Landcover change map of FUTA and Its Environs in
2002
Figure 5 : Classified Landuse Landcover Change Map of FUTA and Its Environs in 2012
Table 3 : Statistical Result of Classified Landuse Landcover Change map of FUTA and Its Environs in
2012
A supervised classification was performed on
reflective bands ( bands 4, 5 and 7) into the following 8 landuse/landcover classes; Urban (Built-up), Dense
Forest, Bareland/Cultivation, Exposed Soil, Forest Reserve, Gallery Forest, Light Forest and Rock Outcrop. The classification results of Figures 3, 4 and 5 however showed remarkable differences as evidenced on Tables 1, 2 and 3. On comparing the figure 3 and table 1 it was observed that densed forest covers the largest land area of 13,540 hectares (55%) of the total land area of study. Bare land/Cultivation covers 4888.125 hectares (20%), while, built-up area was 1161.67995 hectares (4.79%) of the total land area of study in 1986. This information reveals that people had not tampered with vegetative covers in terms of agricultural landscapes and natural vegetation. Construction/land use development was bare minimum.
Figure 4 and table 2 shows that almost all classes are changing to one another but more significantly to built-up, light forest and bareland/cultivation followed by exposed soil. Forest reserve disappeared in after 16 years, having lost to light forest which has landcover increase of 457.07 hectares to compare to 1986 land cover figures. Bare land/Cultivation class has a short fall of 1836.76 hectares, while, built-up area class increased in landuse size to 2771.28 hectares (11.39%). This result indicates that green covers are gradually disappearing thus posing threat to biodiversity in 2002.
In 2012 expansive Built-Up area is more pronounced than what it was in 2002. Though, forest reserve had disappeared but light forest keeps increasing as dense forest is rapidly losing to light forest. In figure 5 and table 3, dense forest had decreased to 1102.41 hectares (4.47%), light forest 7259.35 hectares (29.41%), Bare land/Cultivation had increased to 9498.49 hectares (38.48%). This has been attributed to government intervention on campaign for agricultural practices such as Fadama programmes, campaign for tree planting across the world and particularly in Nigeria. Between 2002 and 2012, dense forest lost 88.96% of its land cover to light forest.
a) Percentage Ratio of Landuse/Landcovers of the Study Area
In order to determine the percentage ratio of the land use land cover of the area of study, all the 8 classes are grouped into two class categories. Built-up area, Exposed soil and Rock Outcrops are categorized as Landuse, while Bareland/Cultivation, dense forest, Forest reserved, gallery forest and Light forest are categorized as land covers.
Comparing the landcover areas to the landuse area ratio in percentage for each year 1986, 2002 and 2012 as shown in figure 6, it appears that large percentage of the area of study is still covered with green vegetation. As can be expected, the percentage of the forest cover declines with drier conditions and differences are quite obvious.
© 2014 Global Journals Inc. (US)
12
Globa
lJo
urna
lof
Scienc
eFr
ontie
rResea
rch
V
olum
eXIV
Issue
e
rsion
IV
I
(
)E
Yea
r20
14An Integrated Remote Sensing and Gis Approach in Monitoring Spatial Expansion of Federal University of
Technology Akure Nigeria
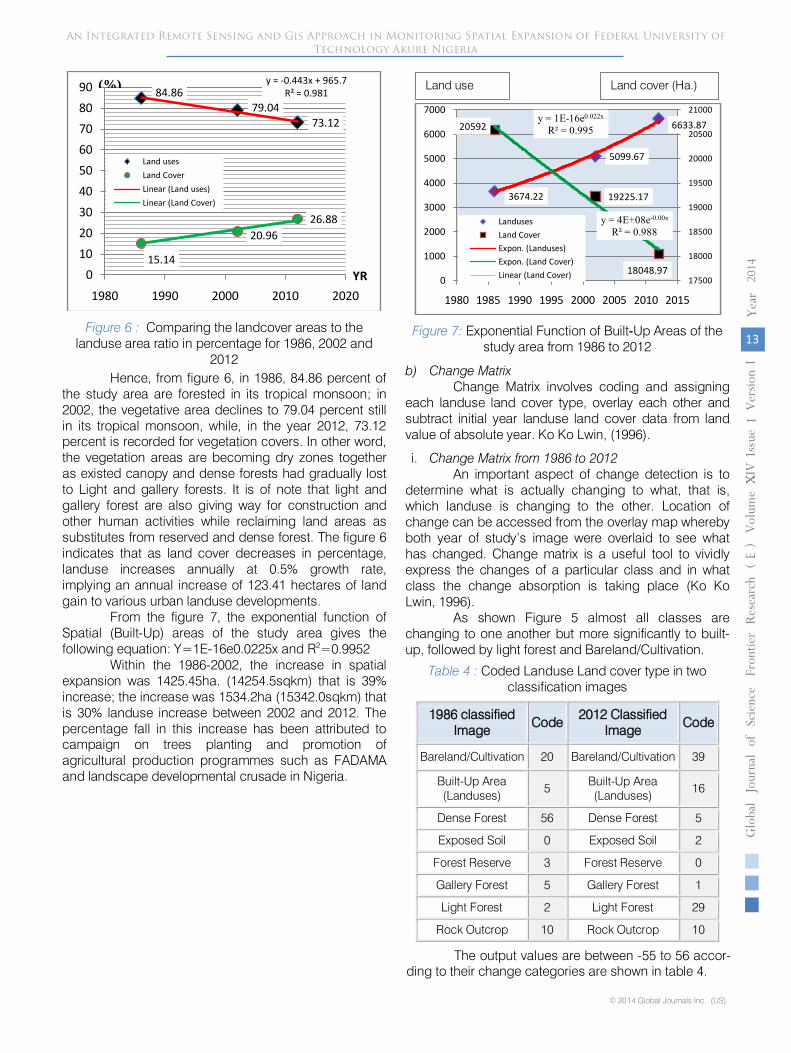
Figure 6 : Comparing the landcover areas to the landuse area ratio in percentage for 1986, 2002 and
2012 Hence, from figure 6, in 1986, 84.86 percent of
the study area are forested in its tropical monsoon; in 2002, the vegetative area declines to 79.04 percent still in its tropical monsoon, while, in the year 2012, 73.12 percent is recorded for vegetation covers. In other word, the vegetation areas are becoming dry zones together as existed canopy and dense forests had gradually lost to Light and gallery forests. It is of note that light and gallery forest are also giving way for construction and other human activities while reclaiming land areas as substitutes from reserved and dense forest. The figure 6 indicates that as land cover decreases in percentage, landuse increases annually at 0.5% growth rate, implying an annual increase of 123.41 hectares of land gain to various urban landuse developments.
From the figure 7, the exponential function of Spatial (Built-Up) areas of the study area gives the following equation: Y=1E-16e0.0225x and R2=0.9952
Within the 1986-2002, the increase in spatial expansion was 1425.45ha. (14254.5sqkm) that is 39% increase; the increase was 1534.2ha (15342.0sqkm) that is 30% landuse increase between 2002 and 2012. The percentage fall in this increase has been attributed to campaign on trees planting and promotion of agricultural production programmes such as FADAMA and landscape developmental crusade in Nigeria.
Figure 7: Exponential Function of Built-Up Areas of the study area from 1986 to 2012
b) Change Matrix Change Matrix involves coding and assigning
each landuse land cover type, overlay each other and subtract initial year landuse land cover data from land value of absolute year. Ko Ko Lwin, (1996).
i. Change Matrix from 1986 to 2012 An important aspect of change detection is to
determine what is actually changing to what, that is, which landuse is changing to the other. Location of change can be accessed from the overlay map whereby both year of study’s image were overlaid to see what has changed. Change matrix is a useful tool to vividly express the changes of a particular class and in what class the change absorption is taking place (Ko Ko Lwin, 1996).
As shown Figure 5 almost all classes are changing to one another but more significantly to built-up, followed by light forest and Bareland/Cultivation.
Table 4 : Coded Landuse Land cover type in two classification images
1986 classified Image
Code 2012 Classified
Image Code
Bareland/Cultivation 20 Bareland/Cultivation 39
Built-Up Area (Landuses)
5 Built-Up Area (Landuses)
16
Dense Forest 56 Dense Forest 5 Exposed Soil 0 Exposed Soil 2
Forest Reserve 3 Forest Reserve 0 Gallery Forest 5 Gallery Forest 1 Light Forest 2 Light Forest 29
Rock Outcrop 10 Rock Outcrop 10
84.8679.04
73.12
15.14
20.9626.88
y = -0.443x + 965.7R² = 0.981
0102030405060708090
1980 1990 2000 2010 2020
Land usesLand CoverLinear (Land uses)Linear (Land Cover)
(%)
YR
3674.22
5099.67
6633.8720592
19225.17
18048.97
y = 1E-16e0.022x
R² = 0.995
y = 4E+08e-0.00x
R² = 0.988
17500
18000
18500
19000
19500
20000
20500
21000
0
1000
2000
3000
4000
5000
6000
7000
1980 1985 1990 1995 2000 2005 2010 2015
LandusesLand CoverExpon. (Landuses)Expon. (Land Cover)Linear (Land Cover)
Land cover (Ha.) Land use
13
Globa
lJo
urna
lof
Scienc
eFr
ontie
rResea
rch
V
olum
eXIV
X Issue
e
rsion
IV
IYea
r
(
)E
2014
© 2014 Global Journals Inc. (US)
An Integrated Remote Sensing and Gis Approach in Monitoring Spatial Expansion of Federal University of Technology Akure Nigeria
-
3674.22
5099.67
6633.8720592
19225.17
18048.97
y = 1E-16e0.022x
R² = 0.995
y = 4E+08e-0.00x
R² = 0.988
17500
18000
18500
19000
19500
20000
20500
21000
0
1000
2000
3000
4000
5000
6000
7000
1980 1985 1990 1995 2000 2005 2010 2015
LandusesLand CoverExpon. (Landuses)Expon. (Land Cover)Linear (Land Cover)
Land cover (Ha.)Land use
The output values are between -55 to 56 accor-ding to their change categories are shown in table 4.
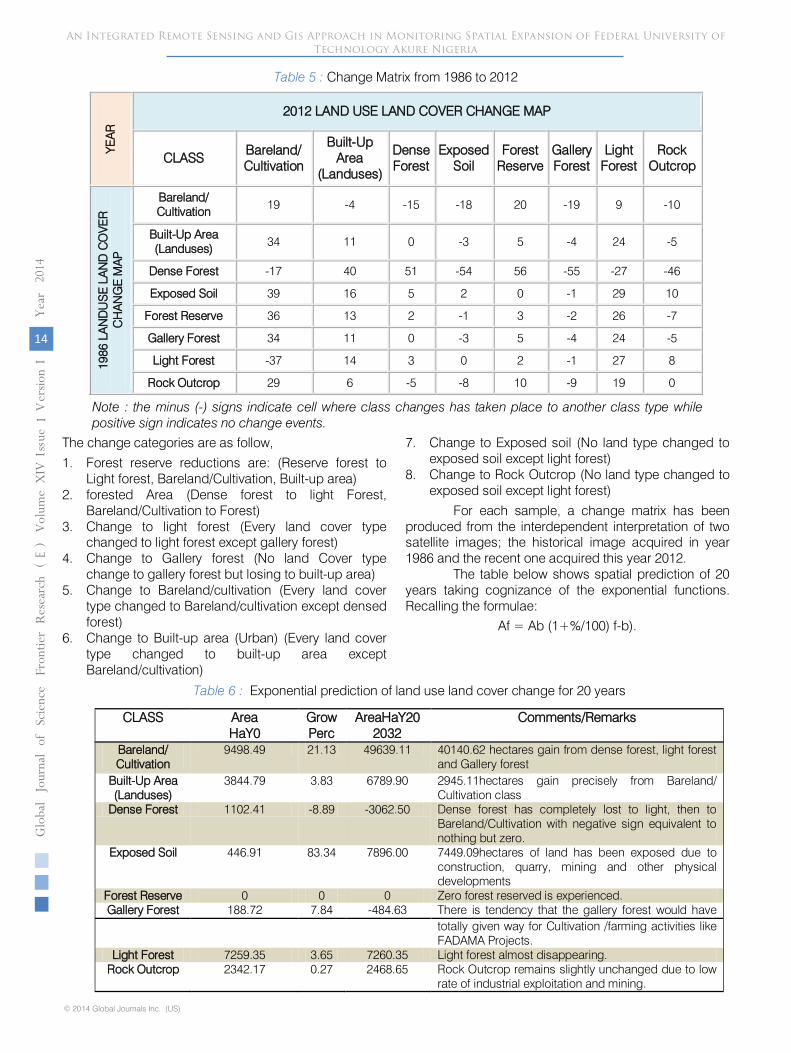
Table 5
:
Change Matrix from 1986 to 2012
Note
: the minus (-) signs indicate cell where class changes has taken place to another class type while positive sign indicates no change events.
The change categories are as follow,
1.
Forest reserve reductions are: (Reserve forest to Light forest, Bareland/Cultivation, Built-up area)
2.
forested Area (Dense forest to light Forest, Bareland/Cultivation to Forest)
3.
Change to light forest (Every land cover type changed to light forest except gallery forest)
4.
Change to Gallery forest (No land Cover type change to gallery forest but losing to built-up area)
5.
Change to Bareland/cultivation (Every land cover type changed to Bareland/cultivation except densed forest)
6.
Change to Built-up area (Urban) (Every land cover type changed to
built-up area except Bareland/cultivation)
7.
Change to Exposed soil (No land type changed to exposed soil except light forest)
8.
Change to Rock Outcrop (No land type changed to exposed soil except light forest)
For each sample, a change matrix has been produced from the interdependent interpretation of two satellite images; the historical image acquired in year 1986 and the recent one acquired this year 2012.
The table below shows spatial prediction of 20 years taking cognizance of the exponential functions. Recalling the formulae:
Af = Ab
(1+%/100) f-b).
Table 6
:
Exponential prediction of land use land cover change for 20 years
CLASS
Area
HaY0
Grow
Perc
AreaHaY20
2032
Comments/Remarks
Bareland/
Cultivation
9498.49
21.13
49639.11
40140.62 hectares gain from dense forest, light forest and Gallery forest
Built-Up Area
(Landuses)
3844.79
3.83
6789.90
2945.11hectares gain precisely from Bareland/
Cultivation class
Dense Forest
1102.41
-8.89
-3062.50
Dense forest has completely lost to light, then to Bareland/Cultivation with negative sign equivalent to nothing but zero.
Exposed Soil
446.91
83.34
7896.00
7449.09hectares of land has been exposed due to construction, quarry, mining and other physical developments
Forest Reserve
0
0
0
Zero forest reserved is experienced.
Gallery Forest
188.72
7.84
-484.63
There is tendency that the gallery forest would have
YEA
R
2012 LAND USE LAND COVER CHANGE MAP
CLASS
Bareland/
Cultivation
Built-Up Area
(Landuses)
Dense Forest
Exposed Soil
Forest Reserve
Gallery Forest
Light Forest
Rock Outcrop
1986
LA
ND
US
E L
AN
D C
OVE
R
CH
AN
GE
MA
P
Bareland/
Cultivation
19
-4
-15
-18
20
-19
9
-10
Built-Up Area
(Landuses)
34
11
0
-3
5
-4
24
-5
Dense Forest
-17
40
51
-54
56
-55
-27
-46
Exposed Soil
39
16
5
2
0
-1
29
10
Forest Reserve
36
13
2
-1
3
-2
26
-7
Gallery Forest
34
11
0
-3
5
-4
24
-5
Light Forest
-37
14
3
0
2
-1
27
8
Rock Outcrop
29
6
-5
-8
10
-9
19
0
14
Globa
lJo
urna
lof
Scienc
eFr
ontie
rResea
rch
V
olum
eXIV
Issue
e
rsion
IV
I
(
)E
Yea
r20
14An Integrated Remote Sensing and Gis Approach in Monitoring Spatial Expansion of Federal University of
Technology Akure Nigeria
totally given way for Cultivation /farming activities like FADAMA Projects.
Light Forest 7259.35 3.65 7260.35 Light forest almost disappearing.Rock Outcrop 2342.17 0.27 2468.65 Rock Outcrop remains slightly unchanged due to low
rate of industrial exploitation and mining.
© 2014 Global Journals Inc. (US)
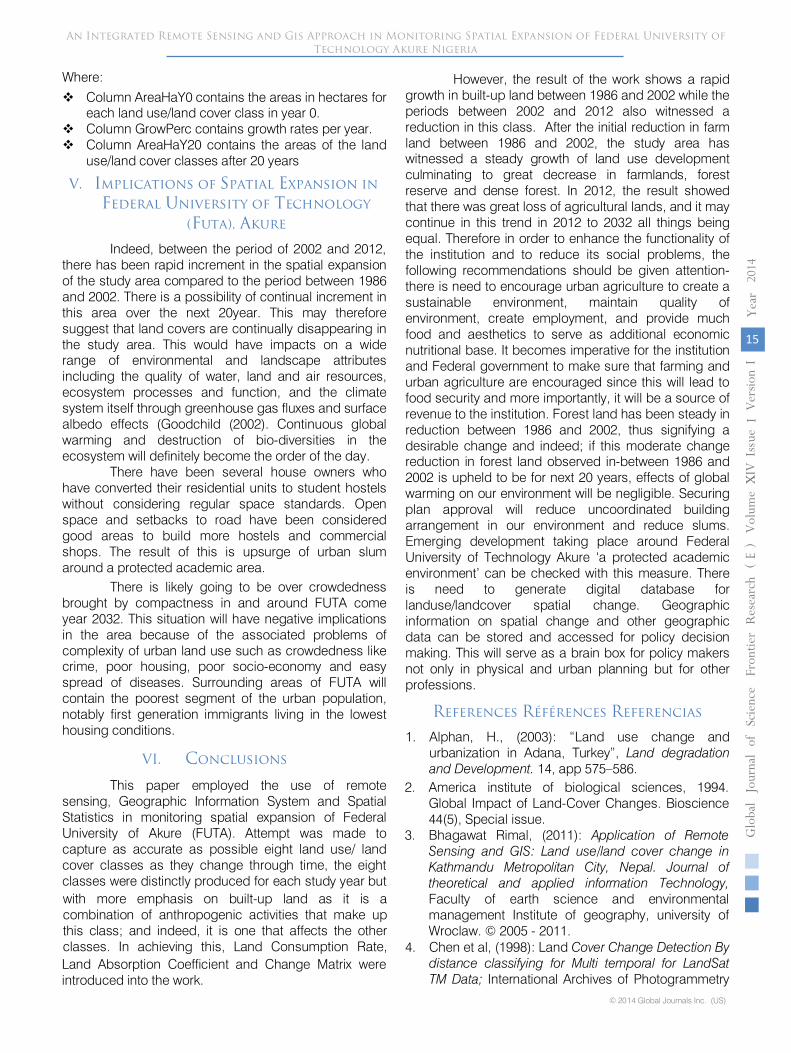
Where:
Column AreaHaY0 contains the areas in hectares for each land use/land cover class in year 0.
Column GrowPerc contains growth rates per year.
Column AreaHaY20 contains the areas of the land use/land cover classes after 20 years
V.
Implications of Spatial Expansion in Federal University of Technology
(Futa), Akure
Indeed, between the period of 2002 and 2012, there has been rapid increment in the spatial expansion of the study area compared to the period between 1986 and 2002. There is a possibility of continual increment in this area over the next 20year. This may therefore suggest that land covers are continually disappearing in the study area. This would have impacts on a wide range of environmental and landscape attributes including the quality of water, land and air resources, ecosystem processes and function, and the climate system itself through greenhouse gas fluxes and surface albedo effects (Goodchild (2002). Continuous global warming and destruction of bio-diversities in the ecosystem will definitely become the order of the day.
There have been several house owners who have converted their residential units to student hostels without considering regular space standards. Open space and setbacks to road have been considered good areas to build more hostels and commercial shops. The result of this is upsurge of urban slum around a protected academic area.
There is likely going to be over crowdedness brought by compactness in and around FUTA come year 2032. This situation will have negative implications in the area because of the associated problems of complexity of urban land use such as crowdedness like crime, poor housing, poor socio-economy and easy spread of diseases. Surrounding areas of FUTA will contain the poorest segment of the urban population, notably first generation immigrants living in the lowest housing conditions.
VI.
Conclusions
This paper employed the use of remote sensing, Geographic Information System and Spatial Statistics in monitoring spatial expansion of Federal University of Akure (FUTA). Attempt was made to capture as accurate as possible eight land use/ land cover classes as they change through time, the eight
classes were distinctly produced for each study year but with more emphasis on built-up land as it is a combination of anthropogenic activities that make up this class; and indeed, it is one that affects the other classes. In achieving this, Land Consumption Rate, Land Absorption Coefficient and Change Matrix were introduced into the work.
However, the result of the work shows a rapid growth in built-up land between 1986 and 2002 while the periods between 2002 and 2012 also witnessed a reduction in this class. After the initial reduction in farm land between 1986 and 2002, the study area has witnessed a steady growth of land use development culminating to great decrease in farmlands, forest reserve and dense forest. In 2012, the result showed that there was great loss of agricultural lands, and it may continue in this trend in 2012 to 2032 all things being equal. Therefore in order to enhance the functionality of the institution and to reduce its social problems, the following recommendations should be given attention-
there is need to encourage urban agriculture to create a sustainable environment, maintain quality of environment, create employment, and provide much food and aesthetics to serve as additional economic nutritional base. It becomes imperative
for the institution and Federal government to make sure that farming and urban agriculture are encouraged since this will lead to food security and more importantly, it will be a source of revenue to the institution. Forest land has been steady in reduction between 1986 and 2002, thus signifying a desirable change and indeed; if this moderate change reduction in forest land observed in-between 1986 and 2002 is upheld to be for next 20 years, effects of global warming on our environment will be negligible. Securing plan approval will reduce uncoordinated building arrangement in our environment and reduce slums. Emerging development taking place around Federal University of Technology Akure ‘a protected academic environment’ can be checked with this measure. There is need to generate digital database for landuse/landcover spatial change. Geographic information on spatial change and other geographic data can be stored and accessed for policy decision making. This will serve as a brain box for policy makers not only in physical and urban planning but for other professions.
References Références Referencias
1.
Alphan, H., (2003): “Land use change and urbanization in Adana, Turkey”, Land degradation and Development. 14, app 575–586.
15
Globa
lJo
urna
lof
Scienc
eFr
ontie
rResea
rch
V
olum
eXIV
X Issue
e
rsion
IV
IYea
r
(
)E
2014
© 2014 Global Journals Inc. (US)
An Integrated Remote Sensing and Gis Approach in Monitoring Spatial Expansion of Federal University of Technology Akure Nigeria
2. America institute of biological sciences, 1994. Global Impact of Land-Cover Changes. Bioscience 44(5), Special issue.
3. Bhagawat Rimal, (2011): Application of Remote Sensing and GIS: Land use/land cover change in Kathmandu Metropolitan City, Nepal. Journal of theoretical and applied information Technology, Faculty of earth science and environmental management Institute of geography, university of Wroclaw. © 2005 - 2011.
4. Chen et al, (1998): Land Cover Change Detection By distance classifying for Multi temporal for LandSat TM Data; International Archives of Photogrammetry
and Remote Sensing. Vol XXXII, part 7, Band pest, 1998 pp 399-405
5.
Flamm et al, (1991): Land use Patterns: Implications for long term Sustainable Development and Environmental Vitality;
A conceptual models. International Association of Landscape Ecology, Ottawa, Canada, July 20-25, 1991.
6.
Flamm, (1992) : Simulating the Socioeconomic Impacts of Landuse on Landscape: International Association of Landscape Ecology Annual meeting, Corvallis Oregon, April 1992
7.
Jensen (1995): Integration of geographic information systems and remote sensing
edited by Jeffrey L. Star, John E. Estes, Kenneth Christian McGwire.
8.
John R. Jensen, Dave Cowen, Sunil Narumalani, and Joanne Halls (1995): Principal of Change Detection Using Digital remote sensor Data) Integration of Geographic Information System and Remote Sensing, Edited by Jeffrey L. Star, John, E. Estes, Kenneth C. McGwire. Cambridge University Press.
9.
Keith C. Clarke, Sara L. McLafferty, and Barbara J. Tempalski (1996); Epidemiology and Geographic Information Systems:
A Review and Discussion of Future Directions: Hunter College-CUNY, New York, New York, USA
10.
Kerry, R. and Oliver, M. A. (2007) The Analysis of ranked observations of soil structure using indicator geostatistics.
Geoderma 140:397-416.
11.
Kirchhof, 1995: Monitoring of Tropical Rain Forest in East Kalimantan, Indonesia-
a vital tool for sustainable land use management. DLRN-Nachrichten (ISSN o937-0420), no 77, Feb. 1995,pp.24-29
12.
Kolwin,(1996) Ryosuke, Ryosuke Shibasaki: Monitoring and Analysis of Deforestation Process using Satellite Imagery and GIS (Case Study in Myanmar)
Center for Spatial Information Science, University of Tokyo.
13.
Lark, R. M. and Ferguson, R. B. (2004) Mapping risk of soil nutrient deficiency or excess by disjunctive and indicator
kriging. Geoderma 118:39-53.
14.
Lavrov, V. N., 1997, 'Space Survey Photocameras for Cartographic Purposes,'
Proceedings
of the Fourth International Conference on Remote Sensing for Marine and Coastal Environments, Michigan: ERIM, 7 p.
15.
Meyer and turner
1994
16.
Michael F. Goodchild (2002): GIS and Spatial Statistics: One World View or Two?;
University of California, Santa Barbara.
17.
Musaoglu, et al 2002: Case study of using Remote sensing Data and GIS for Land Management; Catalaca Region. FLGXXII International Congress USA, Washington D.C USA, April 19-26, 2002.
Spatial Expansion
Federal University of Technology, Akure and its Environments. PGD Thesis Department of Urban and Regional Planning, Federal University of Technology, Akure
19.
Oyinloye M.A. (2010): Direction and Implications of Urban Growth around Akure, Nigeria: A Geographical Information System and Remote Sensing Approach.
20.
Oyinloye, M.A. (2010): Spatial Analysis of Urban Growth in Akure, Nigeria. PhD. Thesis, Department of Urban and Regional Planning, Federal University of Technology, Akure
21.
Rakodi, Carole
1997: The Urban Challenge in Africa: Growth and Management of Its Large Cities. New York United
Nations University, Tokyo.
22.
Thom, B.G. (1994); Landuse and landcover in Australia living with global change. Land Degradation and Rehabitation, 5 (2). (special issues).
23.
UNCED, (1992). Agenda 21 –Report of the United Nations Conference on Environment and Development. Rio de Janeiros, Brazil, 3-14 June 1992.
24.
United Nations (UN), Population Division 2002: World Urbanization Prospects, the 2001 Revision. New York.
25.
Zubair, A.O. (2006): Change Detection in Land use and Land cover Using Remote Sensing Data and GIS (A case study of Ilorin and its environs in Kwara State.)
The Department of Geography, University of Ibadan, Nigeria.
26.
Zhi-young yin, et al 2005: Changes in Urban built-up surface
and population Distribution Pattern during 1986-1999. A case study of Cairo; Egypt. Computer, Environment and urban System 29 (2005); 595-616.
© 2014 Global Journals Inc. (US)
16
Globa
lJo
urna
lof
Scienc
eFr
ontie
rResea
rch
V
olum
eXIV
Issue
e
rsion
IV
I
(
)E
Yea
r20
14An Integrated Remote Sensing and Gis Approach in Monitoring Spatial Expansion of Federal University of
Technology Akure Nigeria
18. Olisa, B.S. (2012): Integrating Spatial Statistics and Geographical Information System (GIS) In Monitoring