Affirmative Action Plan Statistical Reports...
82
AAP Statistical Review │1 © 2013 Peoplefluent 2013 Affirmative Action Plan Statistical Reports Review K. Williams, Business Consultant Julia Méndez, CAAP, PHR, CELS Principal Business Consultant Peoplefluent Research Institute
Transcript of Affirmative Action Plan Statistical Reports...
AAP Statistical Review │1© 2013 Peoplefluent2013
Affirmative Action Plan Statistical Reports Review
K. Williams, Business Consultant
Julia Méndez, CAAP, PHR, CELS
Principal Business Consultant
Peoplefluent Research Institute
© 2013 Peoplefluent
© 2012 Peoplefluent
AAP Statistical Reports Review 2
Agenda
• Workforce Analysis• Job Group Analysis• Determining Availability• Incumbency vs. Availability• Placement Goals• Goal Attainment• Hire Analysis• Promotion Analysis• Termination Analysis• Compensation Analysis Reports
© 2013 Peoplefluent
© 2012 Peoplefluent
AAP Statistical Reports Review 3
For AAPlanner Users
• Work Force Analysis and/or Organizational Display
• Job Group Analysis
• Census Reports
• Labor Report
• Incumbency v. Estimated Availability
• Availability Analysis
• Annual Placement Goals
• Goal Attainment
• Adverse Impact Analysis (Summary Counts, Analysis, Results)
• Paragraph 11, Itemized Listing
© 2013 Peoplefluent
© 2012 Peoplefluent
AAP Statistical Reports Review 4
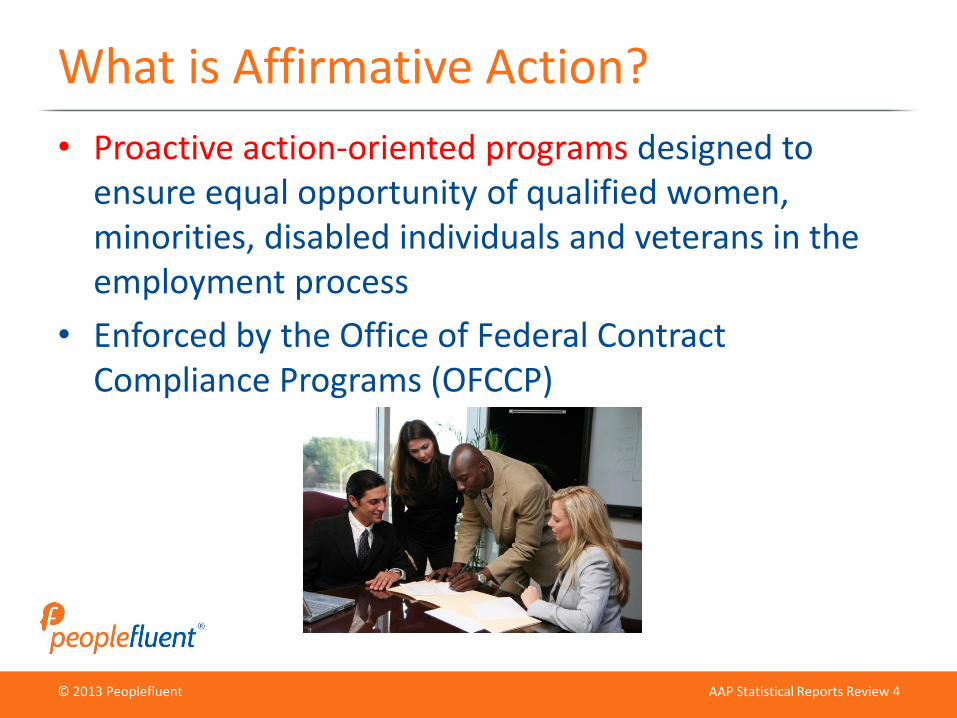
What is Affirmative Action?
• Proactive action-oriented programs designed to ensure equal opportunity of qualified women, minorities, disabled individuals and veterans in the employment process
• Enforced by the Office of Federal Contract Compliance Programs (OFCCP)
© 2013 Peoplefluent
© 2012 Peoplefluent
AAP Statistical Reports Review 5
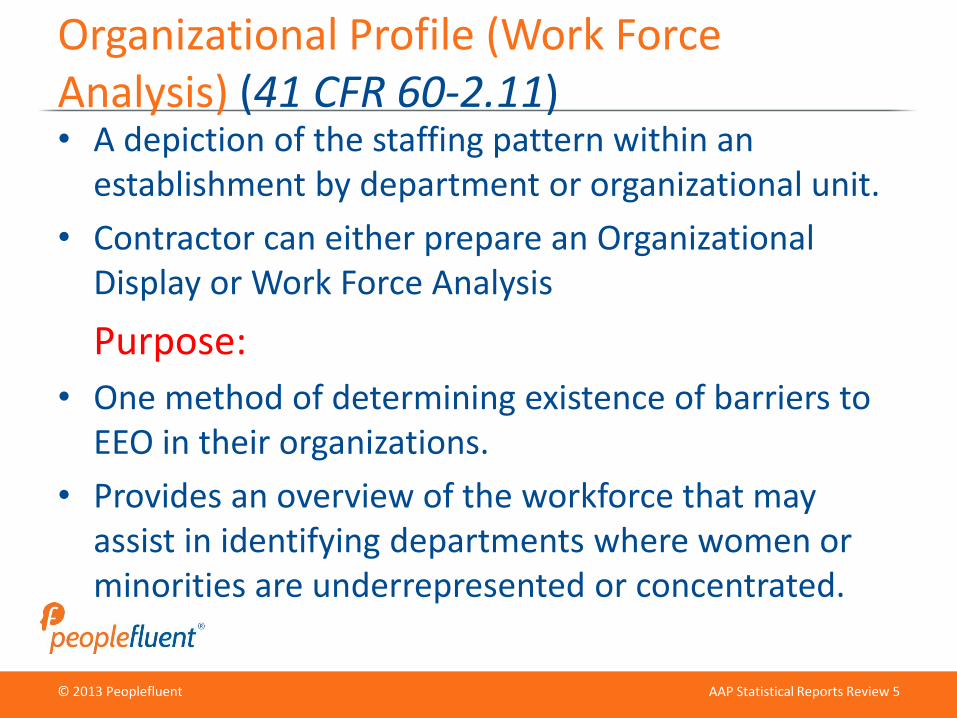
Organizational Profile (Work Force Analysis) (41 CFR 60-2.11)• A depiction of the staffing pattern within an
establishment by department or organizational unit.
• Contractor can either prepare an Organizational Display or Work Force Analysis
Purpose:
• One method of determining existence of barriers to EEO in their organizations.
• Provides an overview of the workforce that may assist in identifying departments where women or minorities are underrepresented or concentrated.
© 2013 Peoplefluent
© 2012 Peoplefluent
AAP Statistical Reports Review 6
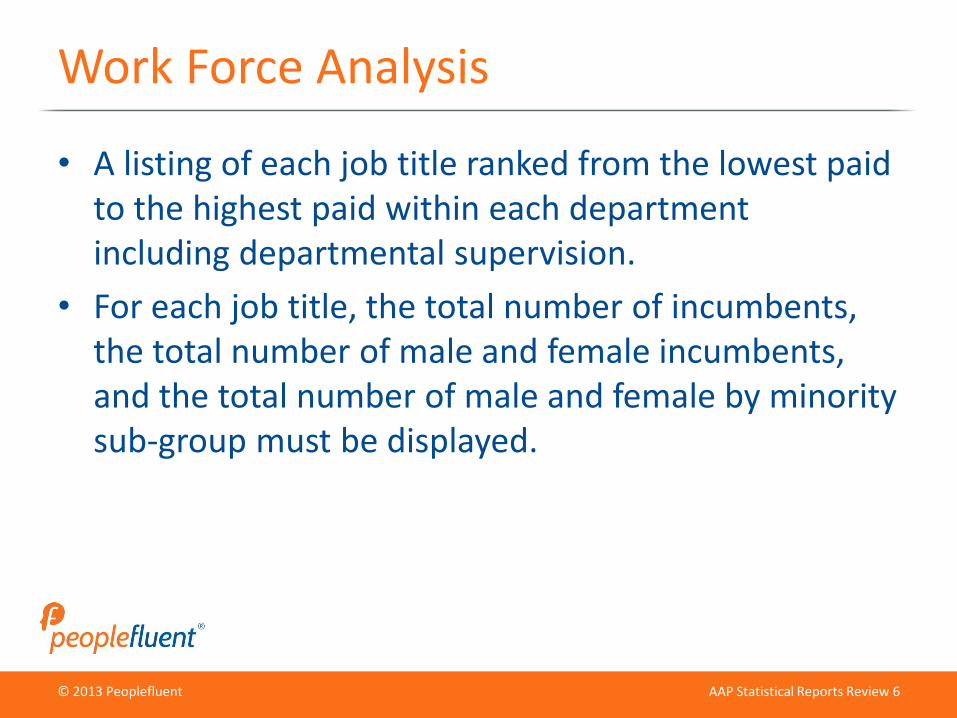
Work Force Analysis
• A listing of each job title ranked from the lowest paid to the highest paid within each department including departmental supervision.
• For each job title, the total number of incumbents, the total number of male and female incumbents, and the total number of male and female by minority sub-group must be displayed.
© 2013 Peoplefluent
© 2012 Peoplefluent
AAP Statistical Reports Review 7
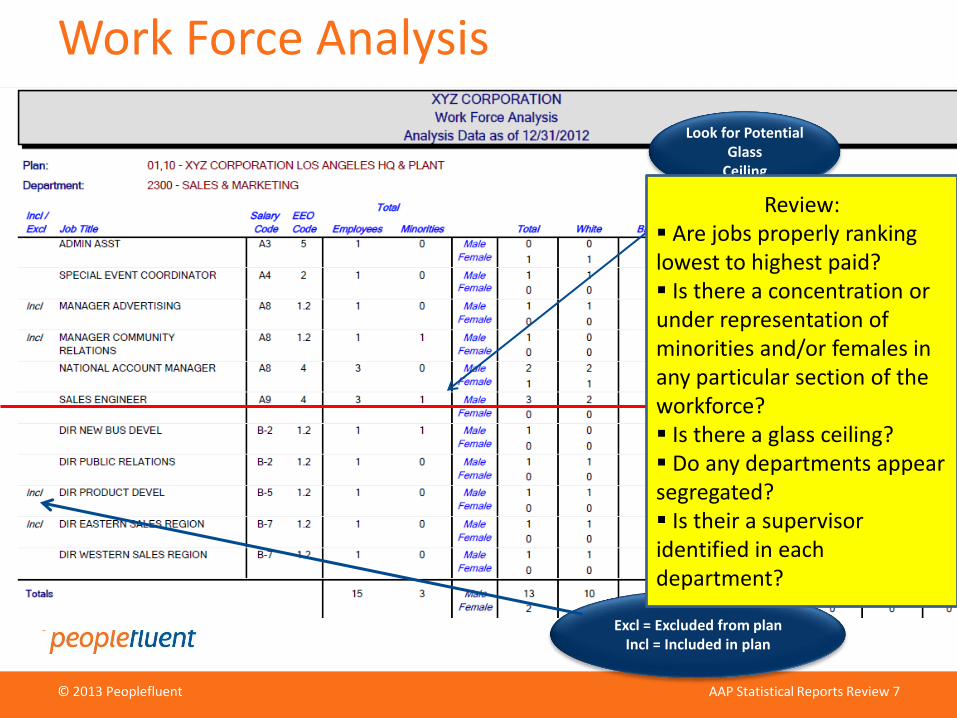
Excl = Excluded from planIncl = Included in plan
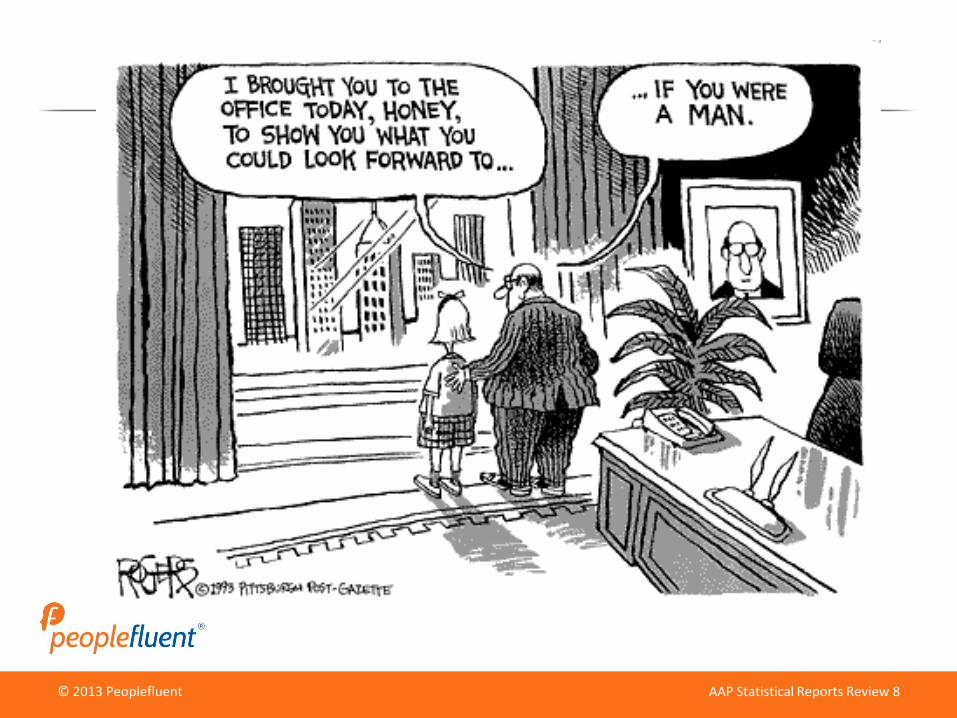
Look for Potential Glass
Ceiling
Work Force Analysis
Review: Are jobs properly ranking lowest to highest paid? Is there a concentration or under representation of minorities and/or females in any particular section of the workforce? Is there a glass ceiling? Do any departments appear segregated? Is their a supervisor identified in each department?
© 2013 Peoplefluent
© 2012 Peoplefluent
AAP Statistical Reports Review 8
© 2013 Peoplefluent
© 2012 Peoplefluent
AAP Statistical Reports Review 9
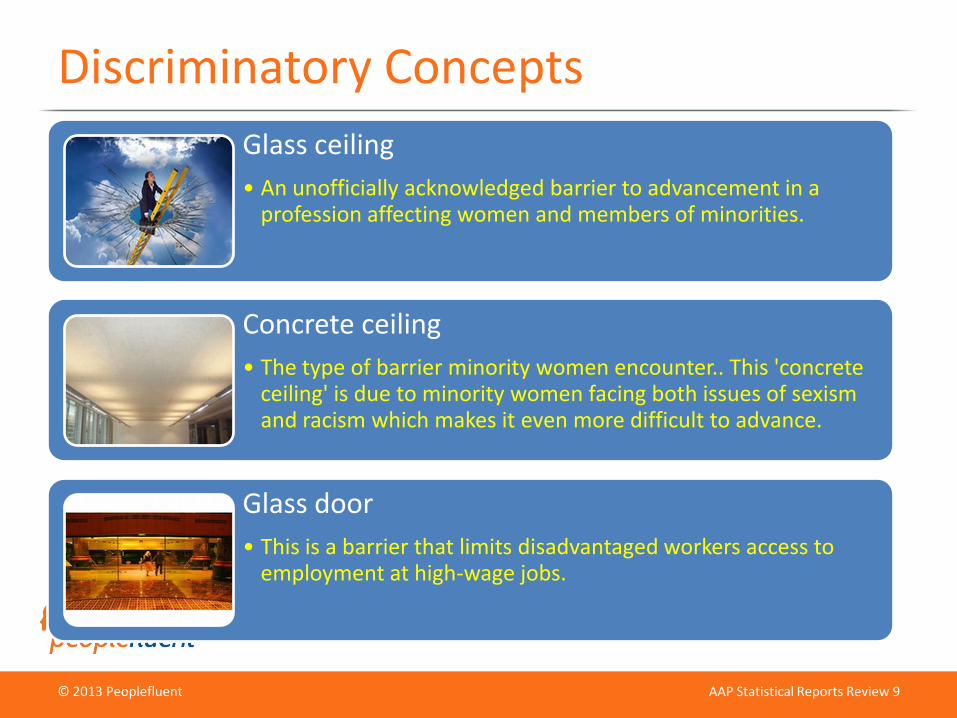
Discriminatory Concepts
Glass ceiling
• An unofficially acknowledged barrier to advancement in a profession affecting women and members of minorities.
Concrete ceiling
• The type of barrier minority women encounter.. This 'concrete ceiling' is due to minority women facing both issues of sexism and racism which makes it even more difficult to advance.
Glass door
• This is a barrier that limits disadvantaged workers access to employment at high-wage jobs.
© 2013 Peoplefluent
© 2012 Peoplefluent
AAP Statistical Reports Review 10
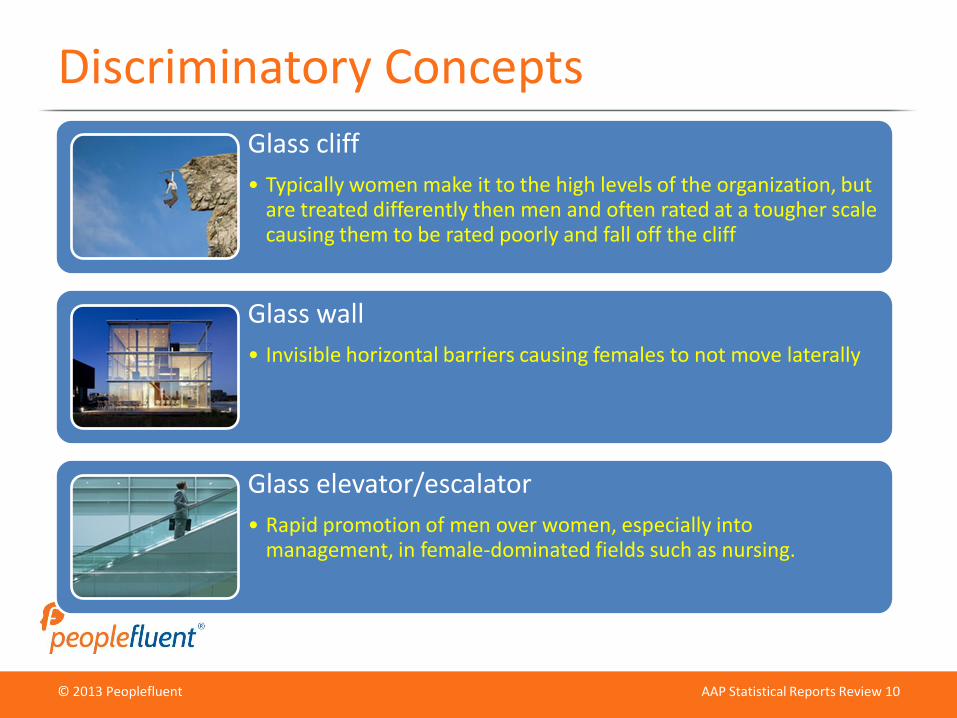
Discriminatory Concepts
Glass cliff
• Typically women make it to the high levels of the organization, but are treated differently then men and often rated at a tougher scale causing them to be rated poorly and fall off the cliff
Glass wall
• Invisible horizontal barriers causing females to not move laterally
Glass elevator/escalator
• Rapid promotion of men over women, especially into management, in female-dominated fields such as nursing.
© 2013 Peoplefluent
© 2012 Peoplefluent
AAP Statistical Reports Review 11
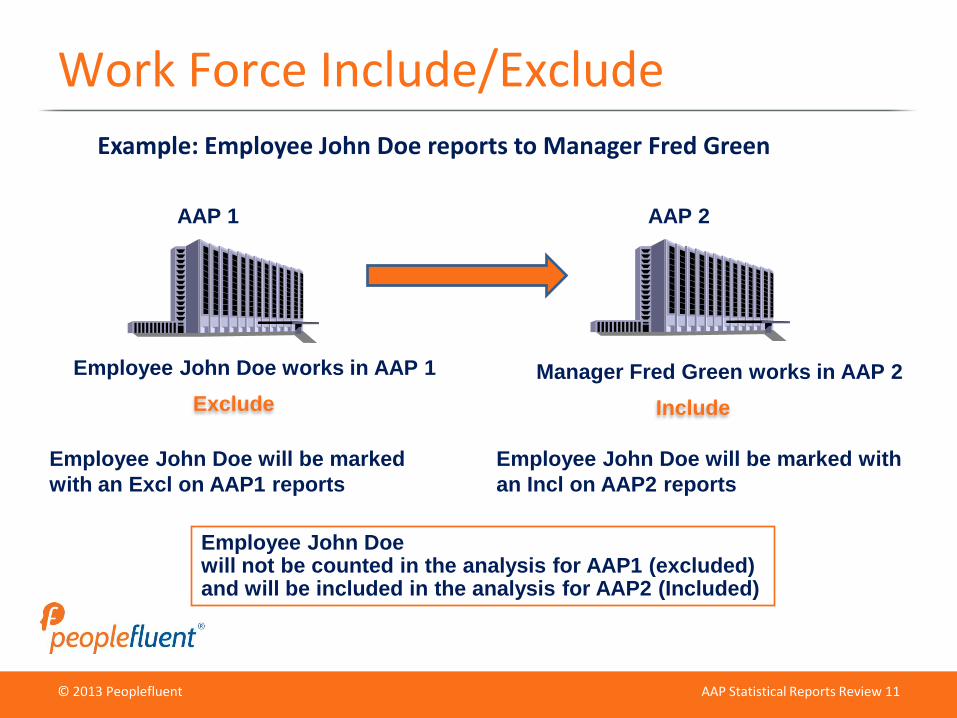
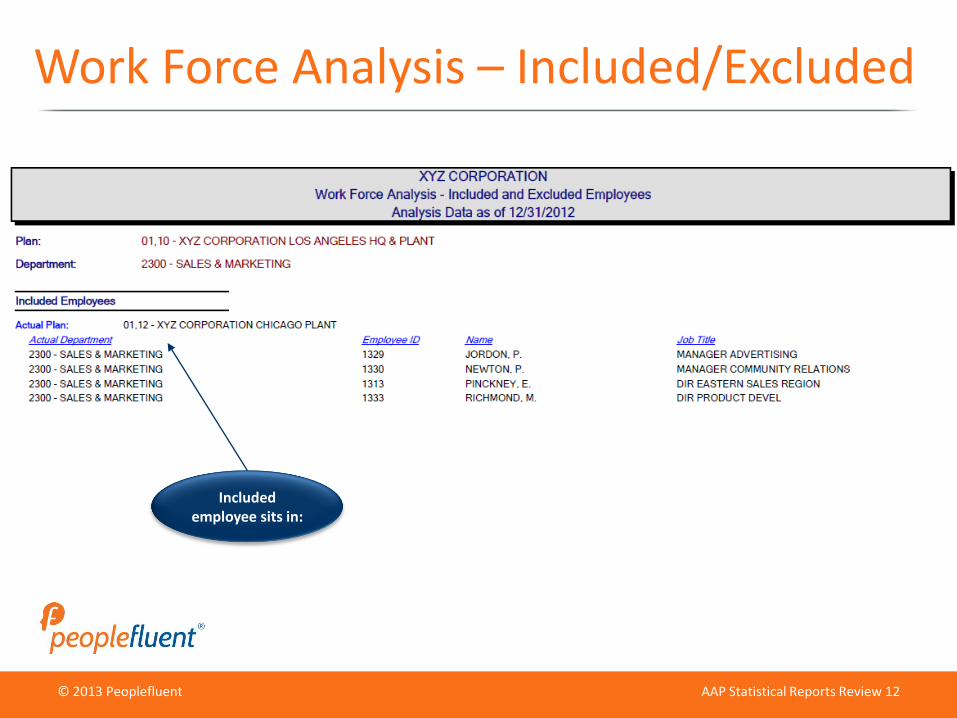
Work Force Include/Exclude
Example: Employee John Doe reports to Manager Fred Green
AAP 1 AAP 2
Employee John Doe works in AAP 1 Manager Fred Green works in AAP 2
Employee John Doe will not be counted in the analysis for AAP1 (excluded) and will be included in the analysis for AAP2 (Included)
Exclude
Employee John Doe will be marked
with an Excl on AAP1 reports
Employee John Doe will be marked with
an Incl on AAP2 reports
Include
© 2013 Peoplefluent
© 2012 Peoplefluent
AAP Statistical Reports Review 12
Work Force Analysis – Included/Excluded
Included employee sits in:
© 2013 Peoplefluent
© 2012 Peoplefluent
AAP Statistical Reports Review 13
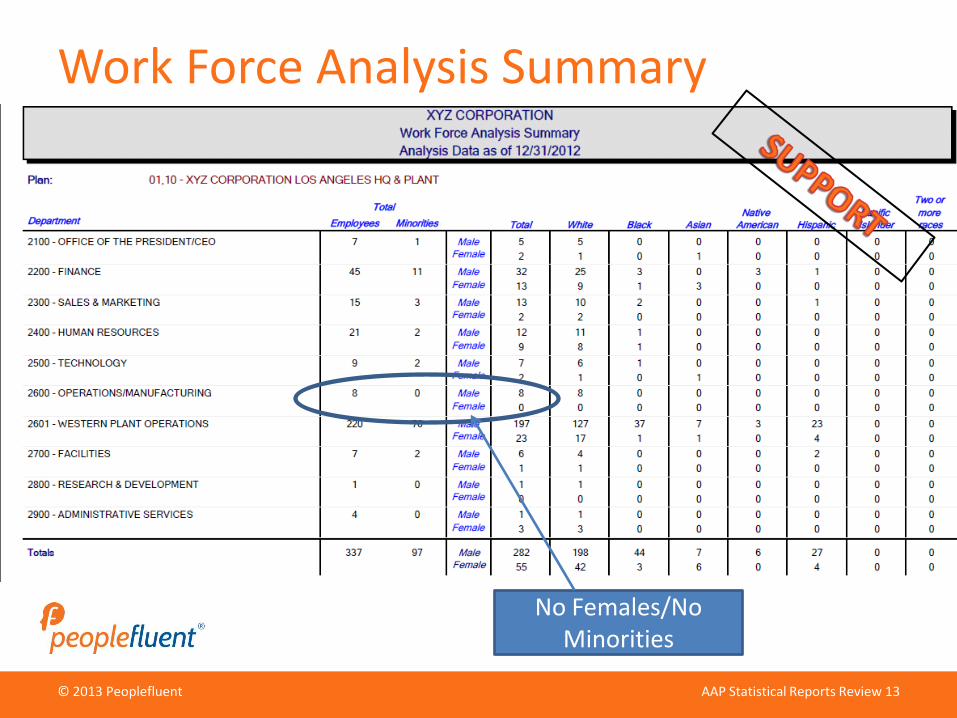
Work Force Analysis Summary
No Females/No Minorities
© 2013 Peoplefluent
© 2012 Peoplefluent
AAP Statistical Reports Review 14
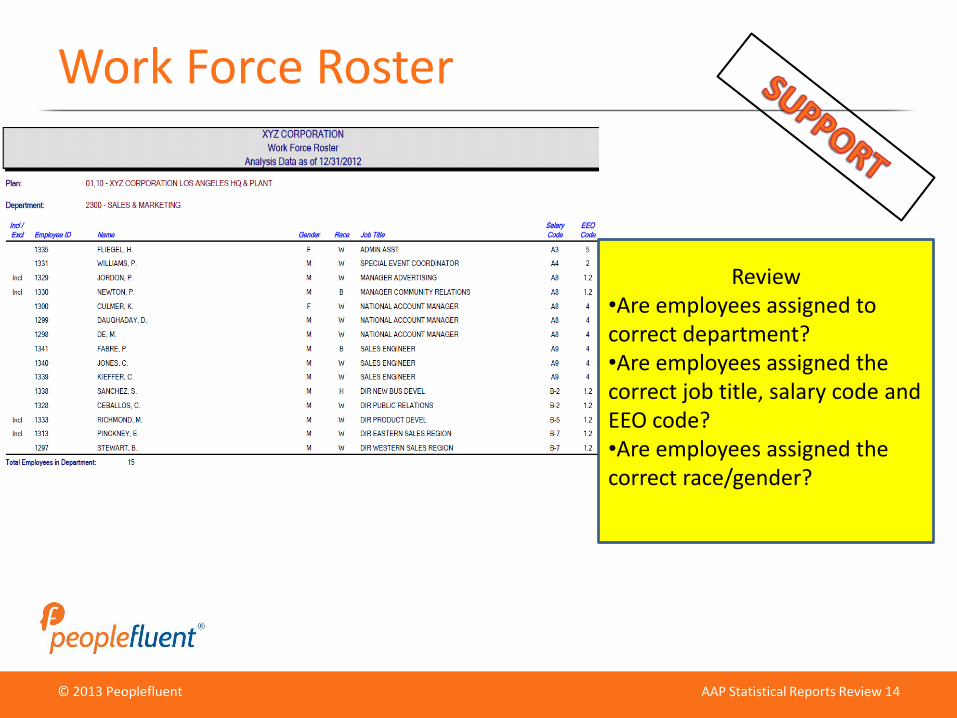
Work Force Roster
Review•Are employees assigned to correct department?•Are employees assigned the correct job title, salary code and EEO code?•Are employees assigned the correct race/gender?
© 2013 Peoplefluent
© 2012 Peoplefluent
AAP Statistical Reports Review 15
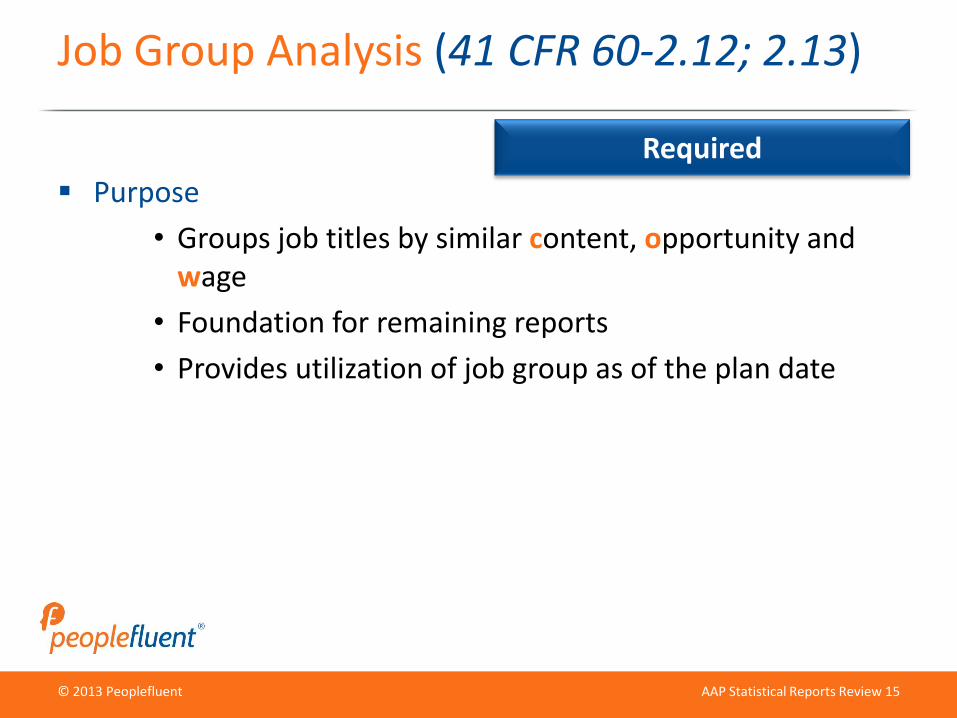
Job Group Analysis (41 CFR 60-2.12; 2.13)
Purpose
• Groups job titles by similar content, opportunity and wage
• Foundation for remaining reports
• Provides utilization of job group as of the plan date
Required
© 2013 Peoplefluent
© 2012 Peoplefluent
AAP Statistical Reports Review 16
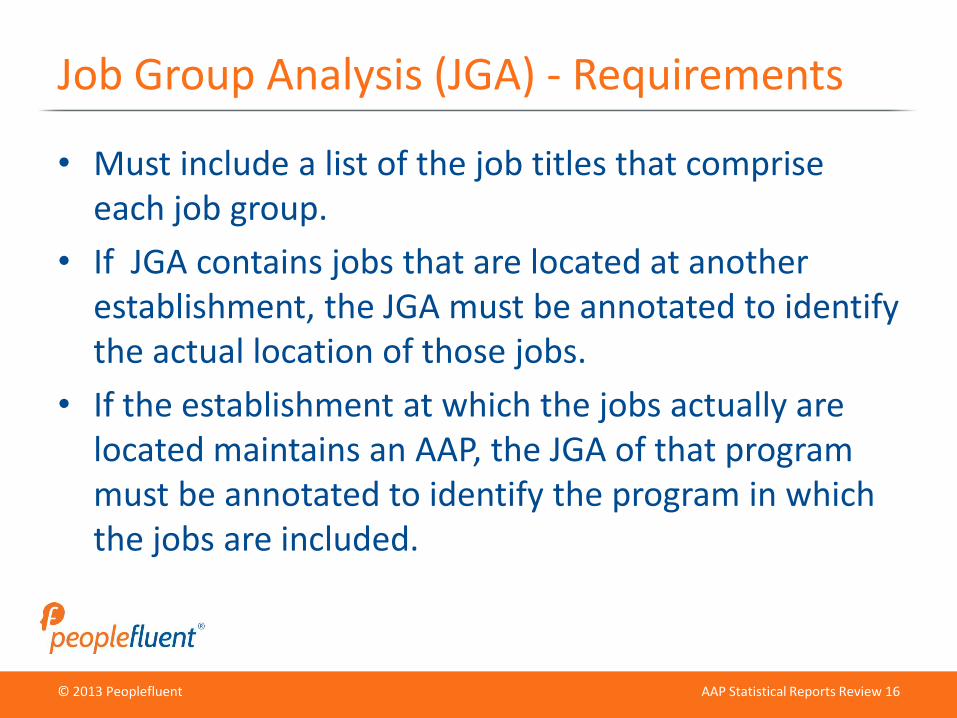
Job Group Analysis (JGA) - Requirements
• Must include a list of the job titles that comprise each job group.
• If JGA contains jobs that are located at another establishment, the JGA must be annotated to identify the actual location of those jobs.
• If the establishment at which the jobs actually are located maintains an AAP, the JGA of that program must be annotated to identify the program in which the jobs are included.
© 2013 Peoplefluent
© 2012 Peoplefluent
AAP Statistical Reports Review 17
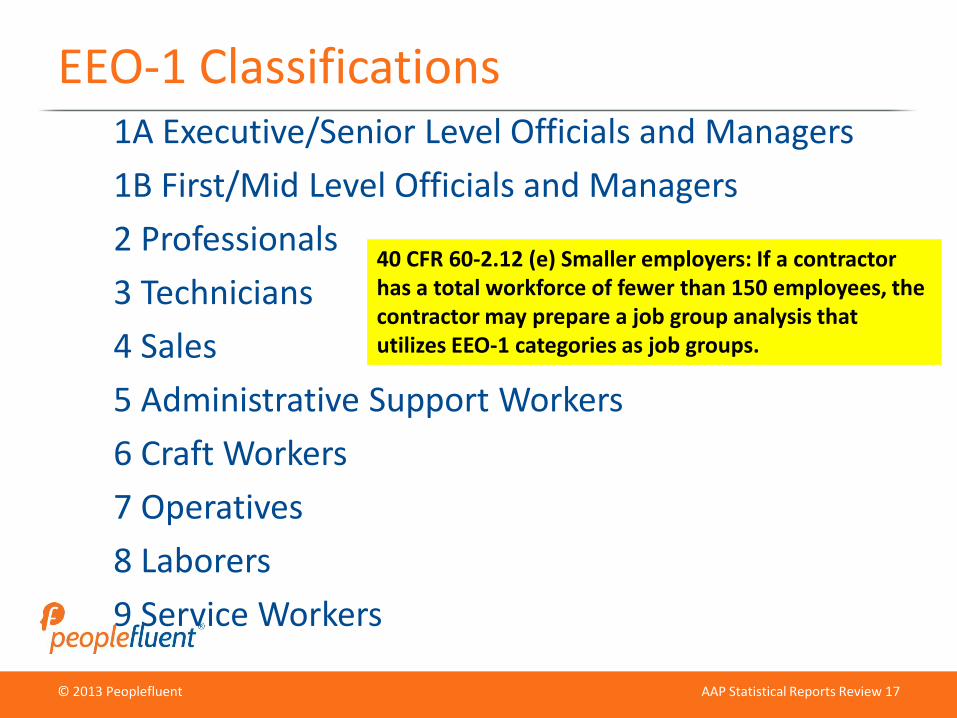
EEO-1 Classifications1A Executive/Senior Level Officials and Managers
1B First/Mid Level Officials and Managers
2 Professionals
3 Technicians
4 Sales
5 Administrative Support Workers
6 Craft Workers
7 Operatives
8 Laborers
9 Service Workers
40 CFR 60-2.12 (e) Smaller employers: If a contractor has a total workforce of fewer than 150 employees, the contractor may prepare a job group analysis that utilizes EEO-1 categories as job groups.
© 2013 Peoplefluent
© 2012 Peoplefluent
AAP Statistical Reports Review 18
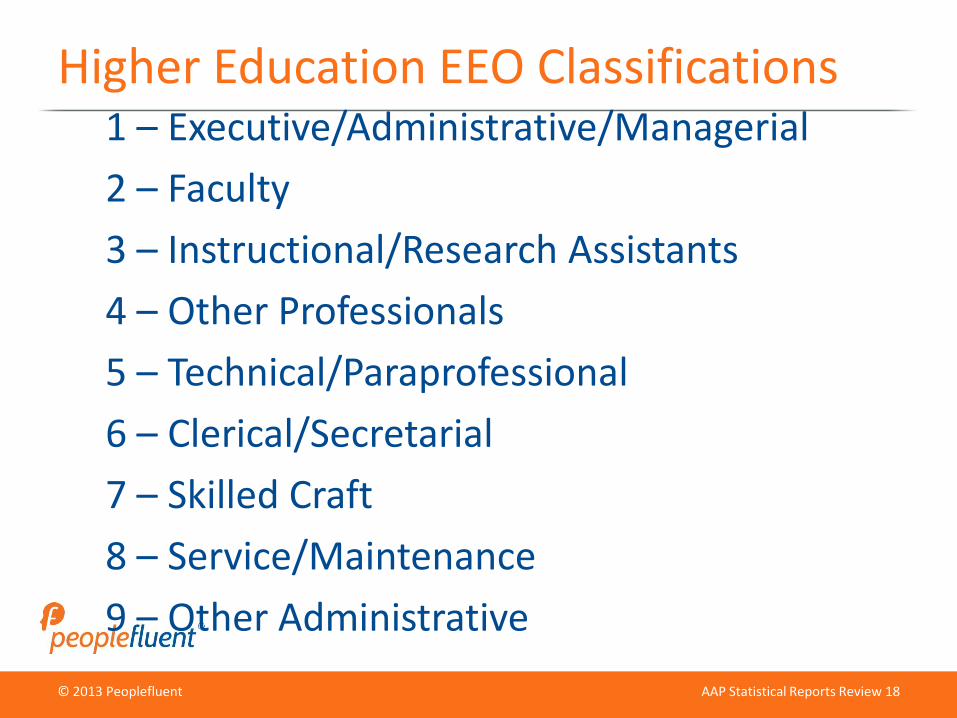
Higher Education EEO Classifications1 – Executive/Administrative/Managerial
2 – Faculty
3 – Instructional/Research Assistants
4 – Other Professionals
5 – Technical/Paraprofessional
6 – Clerical/Secretarial
7 – Skilled Craft
8 – Service/Maintenance
9 – Other Administrative
© 2013 Peoplefluent
© 2012 Peoplefluent
AAP Statistical Reports Review 19
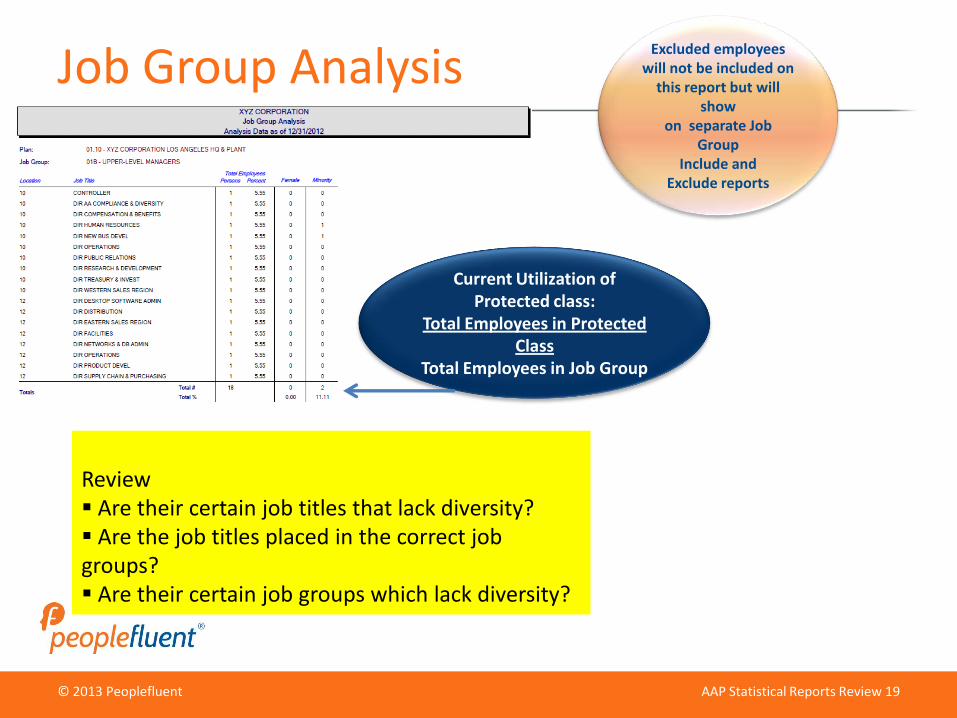
Job Group Analysis
Current Utilization of Protected class:
Total Employees in Protected Class
Total Employees in Job Group
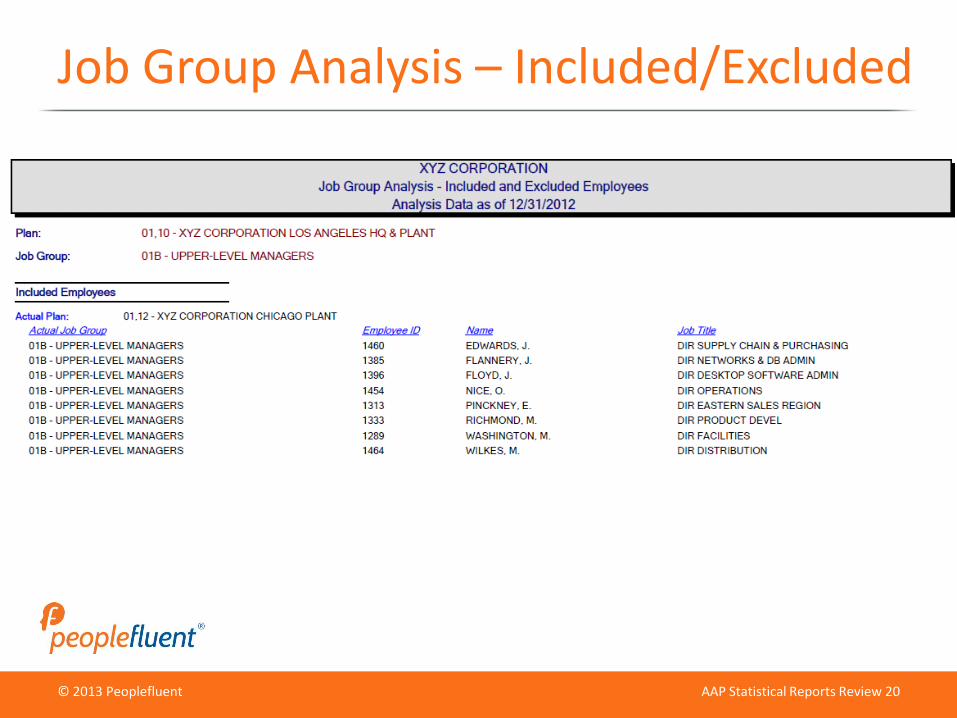
Excluded employees will not be included on
this report but will show
on separate Job Group
Include and Exclude reports
Review Are their certain job titles that lack diversity? Are the job titles placed in the correct job groups? Are their certain job groups which lack diversity?
© 2013 Peoplefluent
© 2012 Peoplefluent
AAP Statistical Reports Review 20
Job Group Analysis – Included/Excluded
© 2013 Peoplefluent
© 2012 Peoplefluent
AAP Statistical Reports Review 21
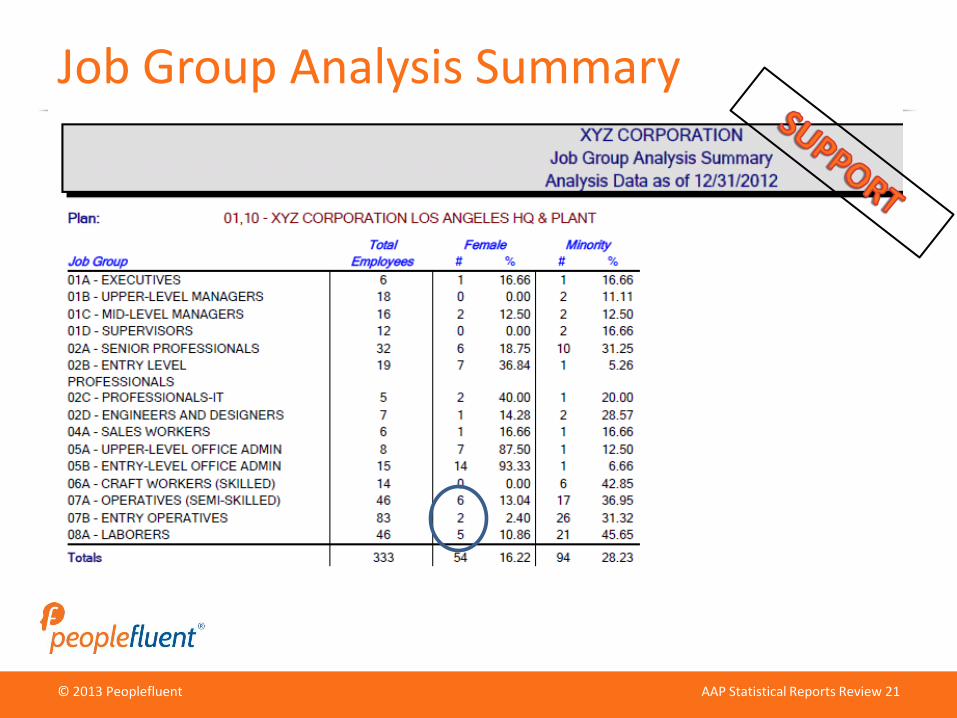
Job Group Analysis Summary
© 2013 Peoplefluent
© 2012 Peoplefluent
AAP Statistical Reports Review 22
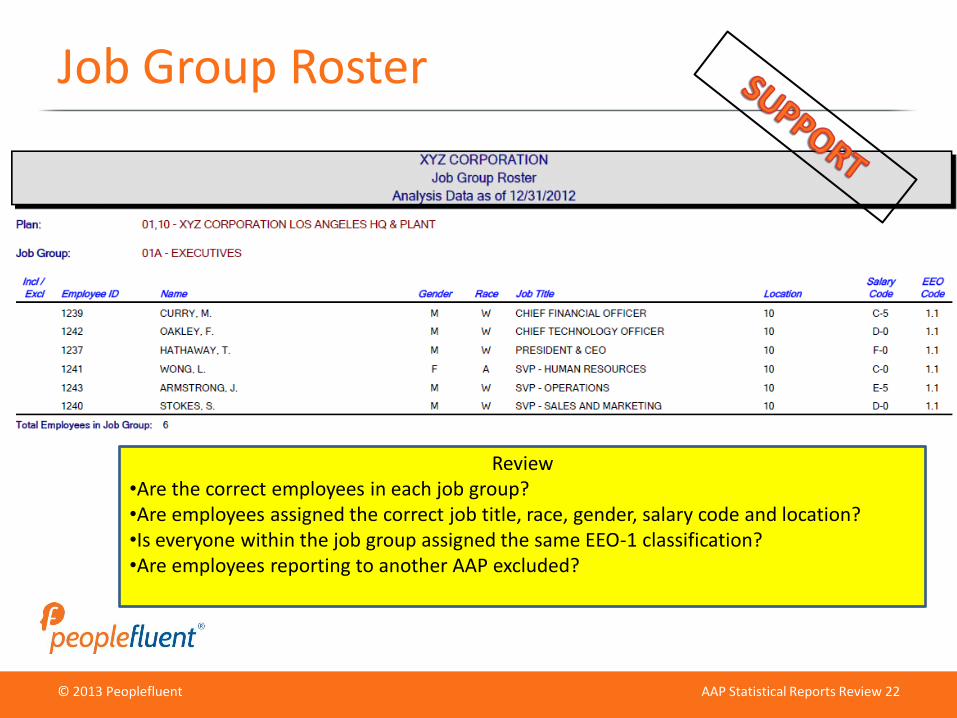
Job Group Roster
Review•Are the correct employees in each job group?•Are employees assigned the correct job title, race, gender, salary code and location?•Is everyone within the job group assigned the same EEO-1 classification?•Are employees reporting to another AAP excluded?
© 2013 Peoplefluent
© 2012 Peoplefluent
AAP Statistical Reports Review 23
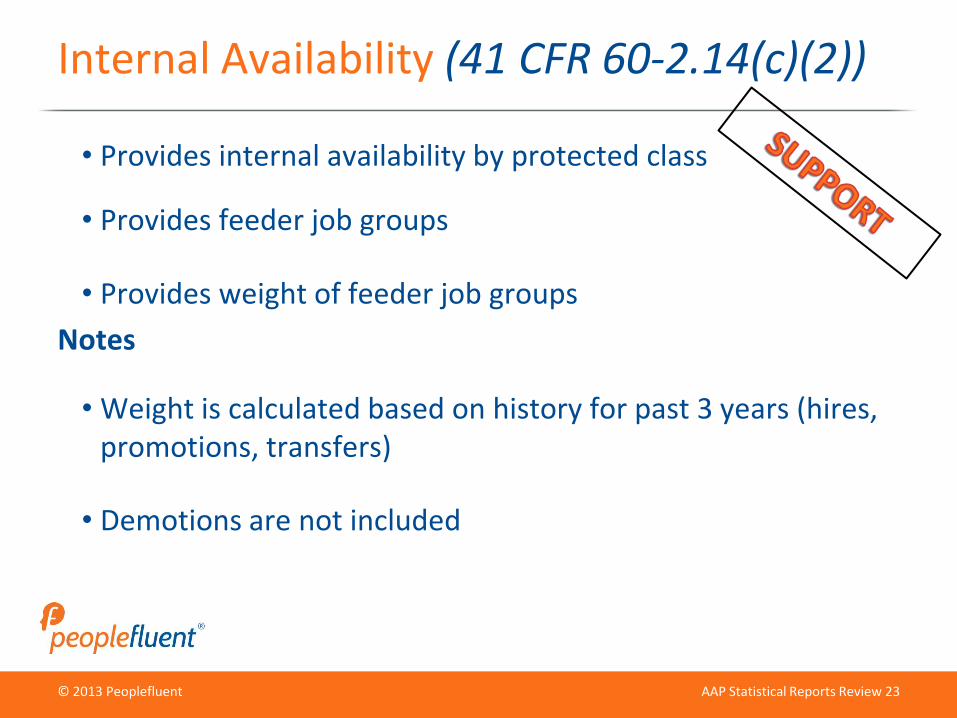
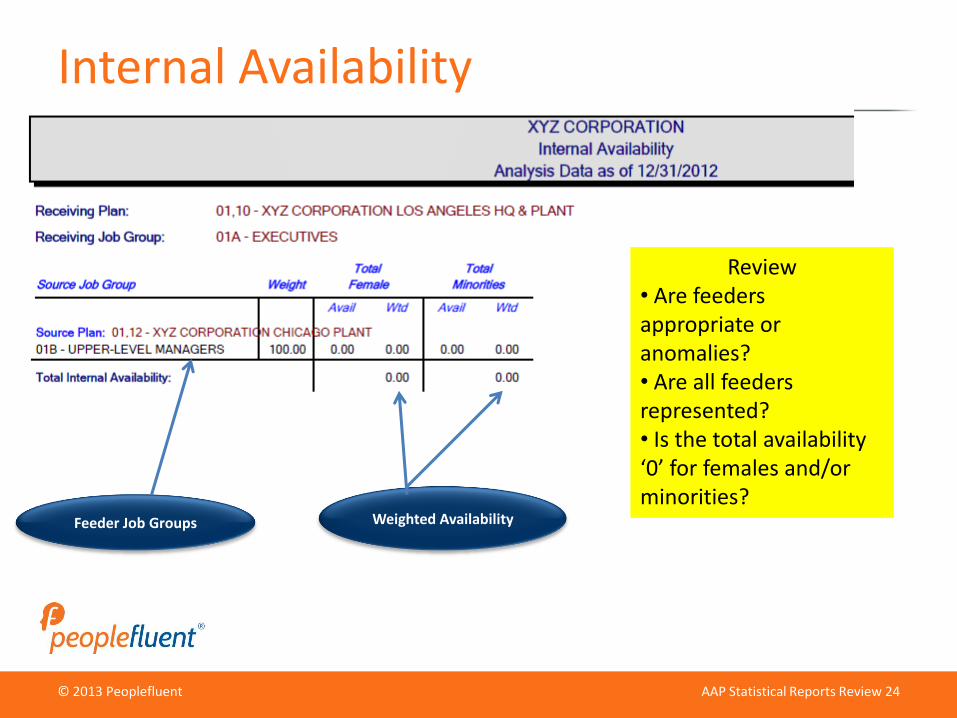
Internal Availability (41 CFR 60-2.14(c)(2))
• Provides internal availability by protected class
• Provides feeder job groups
• Provides weight of feeder job groups
Notes
• Weight is calculated based on history for past 3 years (hires, promotions, transfers)
• Demotions are not included
© 2013 Peoplefluent
© 2012 Peoplefluent
AAP Statistical Reports Review 24
Weighted AvailabilityFeeder Job Groups
Internal Availability
Review• Are feeders appropriate or anomalies?• Are all feeders represented?• Is the total availability ‘0’ for females and/or minorities?
© 2013 Peoplefluent
© 2012 Peoplefluent
AAP Statistical Reports Review 25
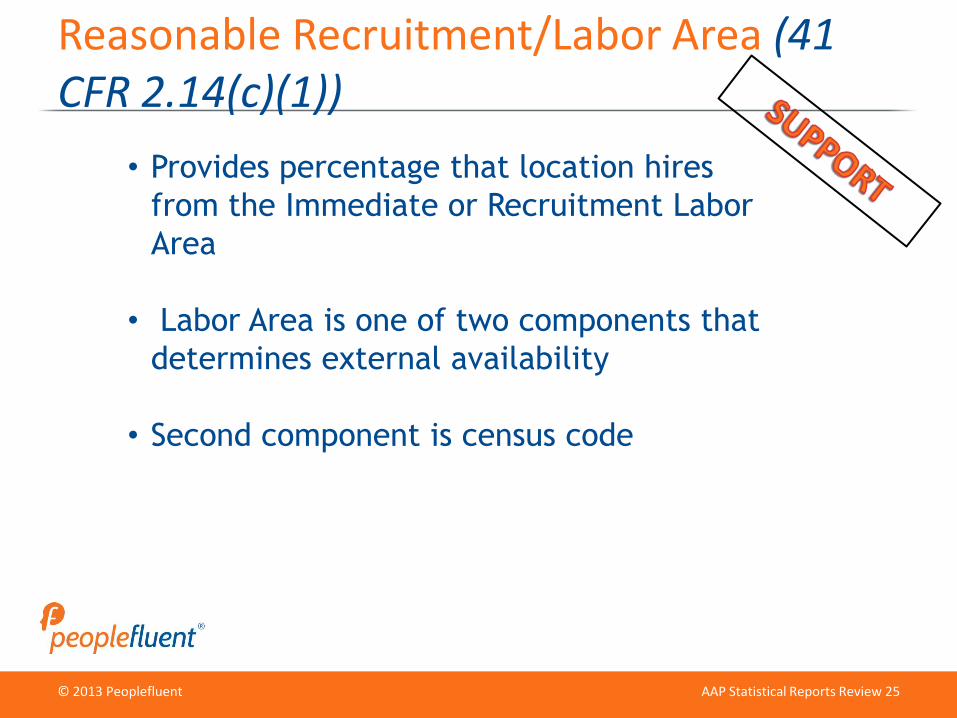
• Provides percentage that location hires
from the Immediate or Recruitment Labor
Area
• Labor Area is one of two components that
determines external availability
• Second component is census code
Reasonable Recruitment/Labor Area (41 CFR 2.14(c)(1))
© 2013 Peoplefluent
© 2012 Peoplefluent
AAP Statistical Reports Review 26
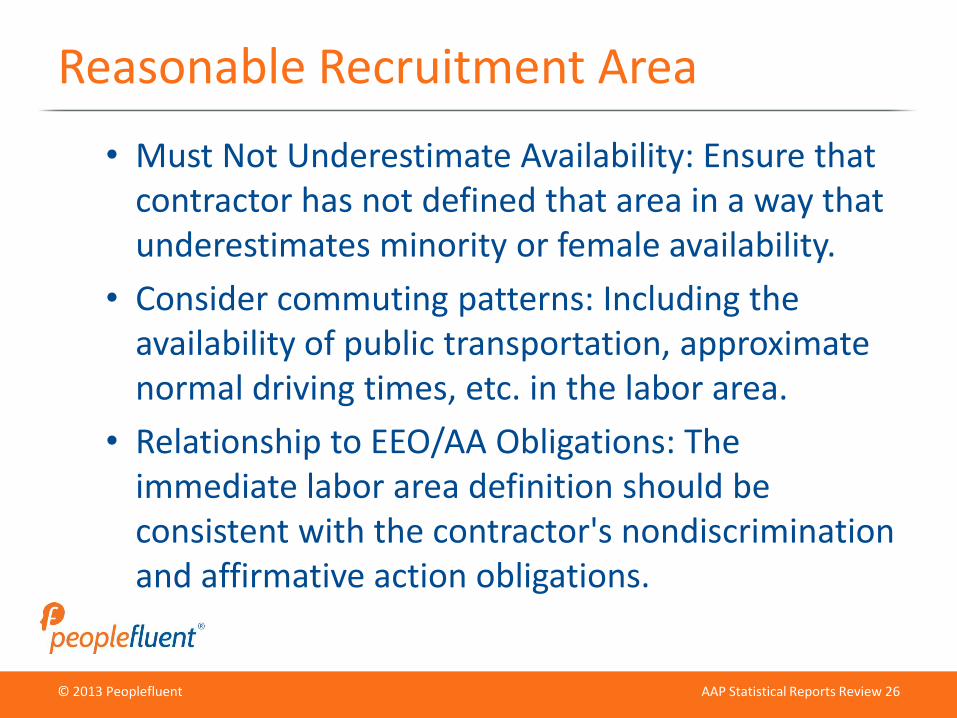
Reasonable Recruitment Area
• Must Not Underestimate Availability: Ensure that contractor has not defined that area in a way that underestimates minority or female availability.
• Consider commuting patterns: Including the availability of public transportation, approximate normal driving times, etc. in the labor area.
• Relationship to EEO/AA Obligations: The immediate labor area definition should be consistent with the contractor's nondiscrimination and affirmative action obligations.
© 2013 Peoplefluent
© 2012 Peoplefluent
AAP Statistical Reports Review 27
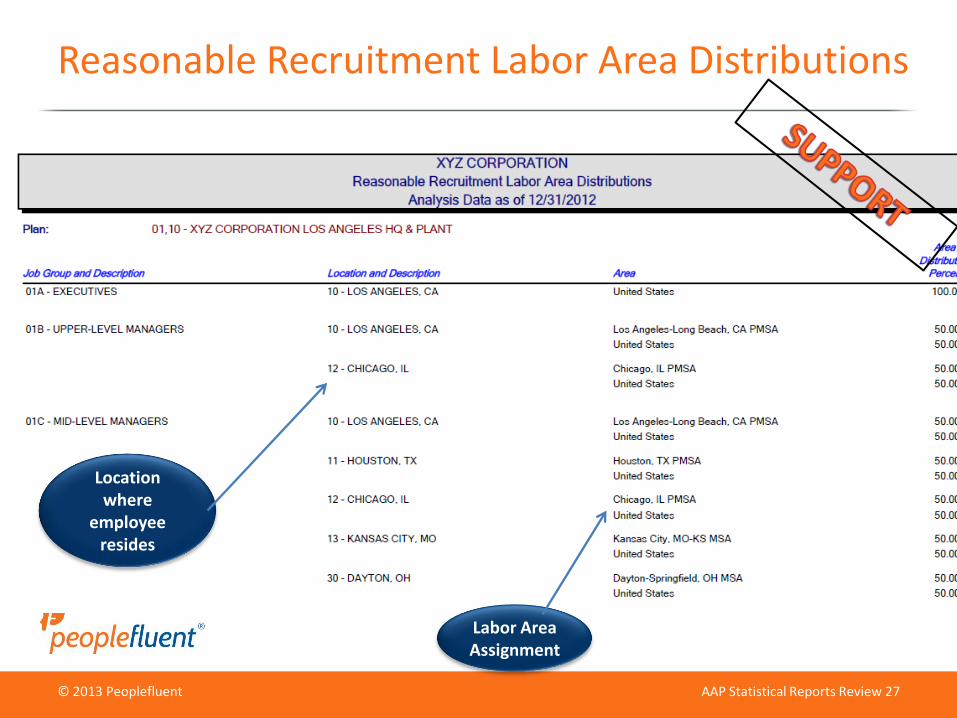
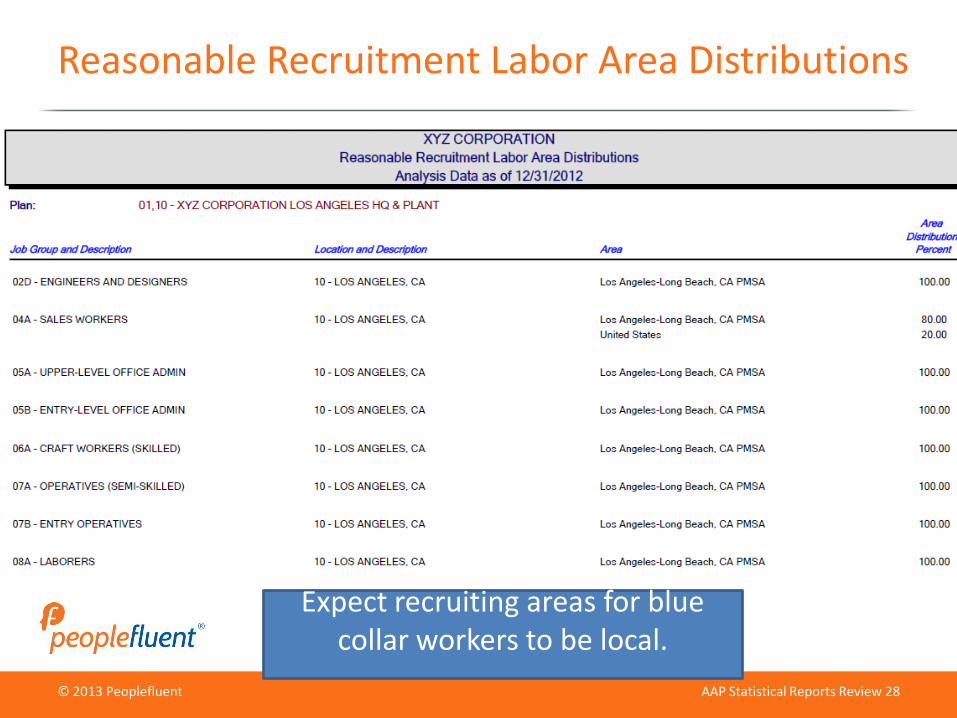
Reasonable Recruitment Labor Area Distributions
Labor AreaAssignment
Location where
employee resides
© 2013 Peoplefluent
© 2012 Peoplefluent
AAP Statistical Reports Review 28
Reasonable Recruitment Labor Area Distributions
Expect recruiting areas for blue collar workers to be local.

© 2013 Peoplefluent
© 2012 Peoplefluent
AAP Statistical Reports Review 29
Recruiting Area Check Points
• Does the contractor recruit in other areas, not reflected on the report, with higher minority/female availability?
• Can the contractor expand its area to increase the numbers of minority group persons and women in the percentage of available workers?
• Where do other nearby employers recruit to fill similar jobs?
• Are the recruitment areas assigned to each job group reasonable given the pay or supply and demand?
© 2013 Peoplefluent
© 2012 Peoplefluent
AAP Statistical Reports Review 30
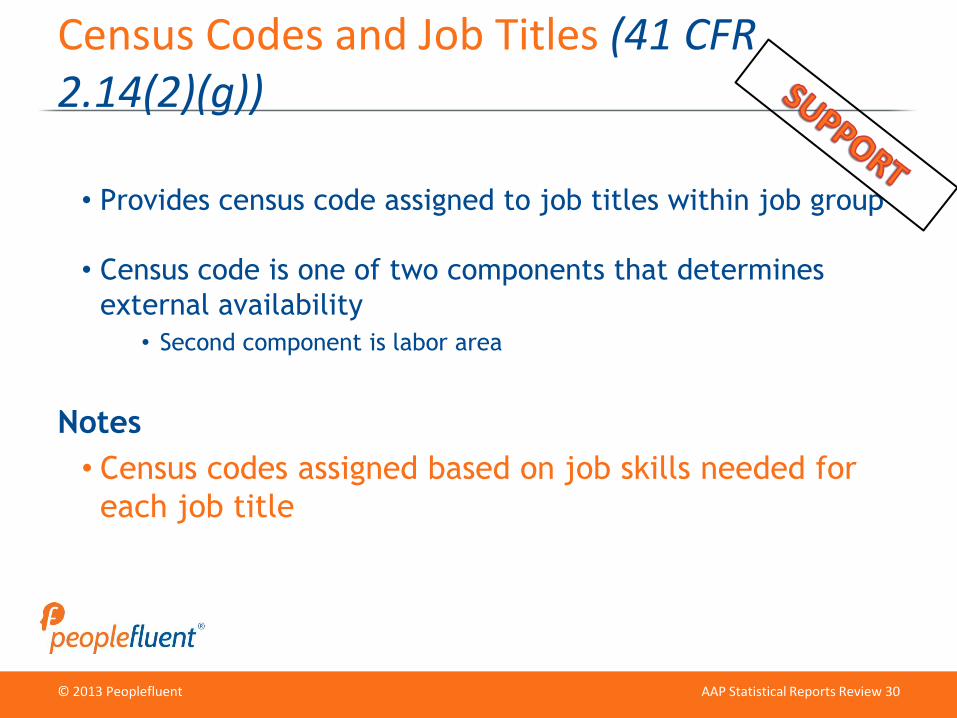
• Provides census code assigned to job titles within job group
• Census code is one of two components that determines
external availability
• Second component is labor area
Notes
• Census codes assigned based on job skills needed for
each job title
Census Codes and Job Titles (41 CFR 2.14(2)(g))
© 2013 Peoplefluent
© 2012 Peoplefluent
AAP Statistical Reports Review 31
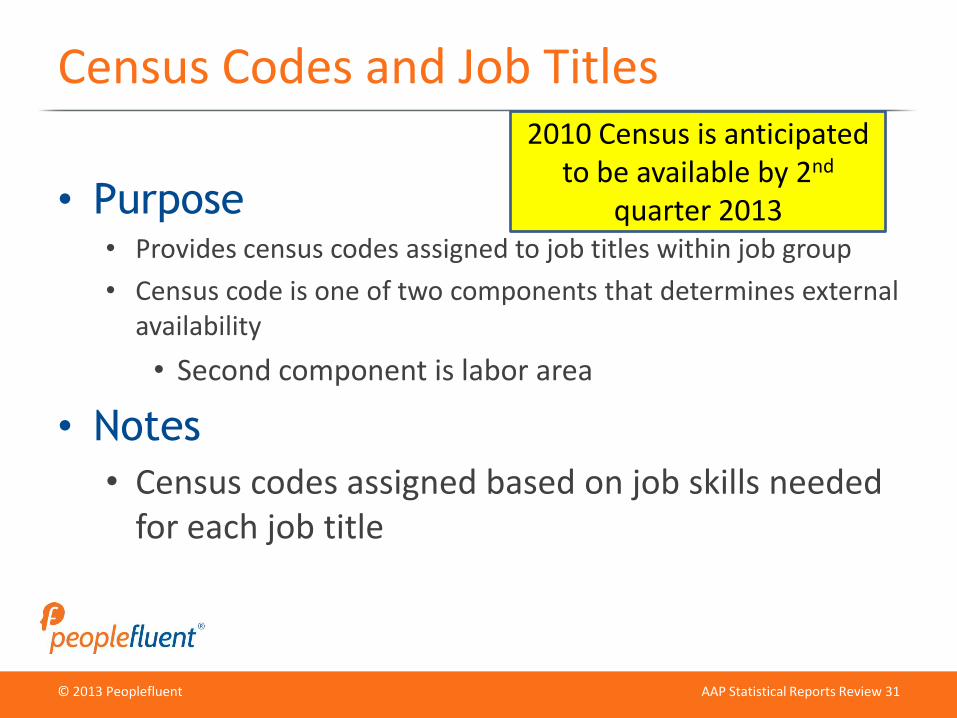
Census Codes and Job Titles
• Purpose• Provides census codes assigned to job titles within job group
• Census code is one of two components that determines external availability
• Second component is labor area
• Notes
• Census codes assigned based on job skills needed for each job title
2010 Census is anticipated to be available by 2nd
quarter 2013
© 2013 Peoplefluent
© 2012 Peoplefluent
AAP Statistical Reports Review 32
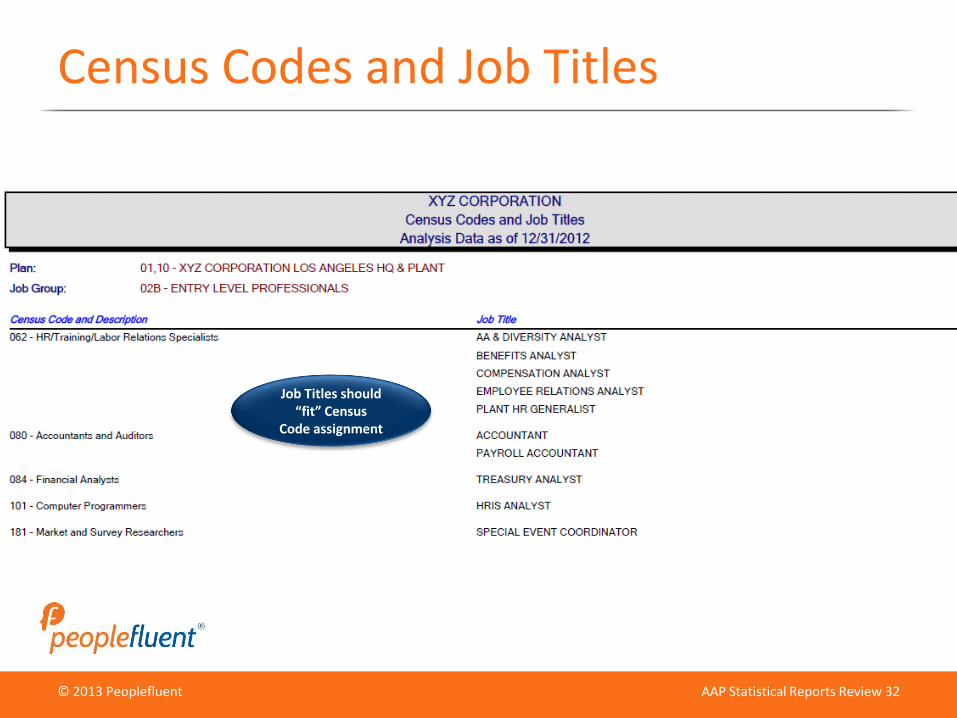
Census Codes and Job Titles
Job Titles should“fit” Census
Code assignment
© 2013 Peoplefluent
© 2012 Peoplefluent
AAP Statistical Reports Review 33
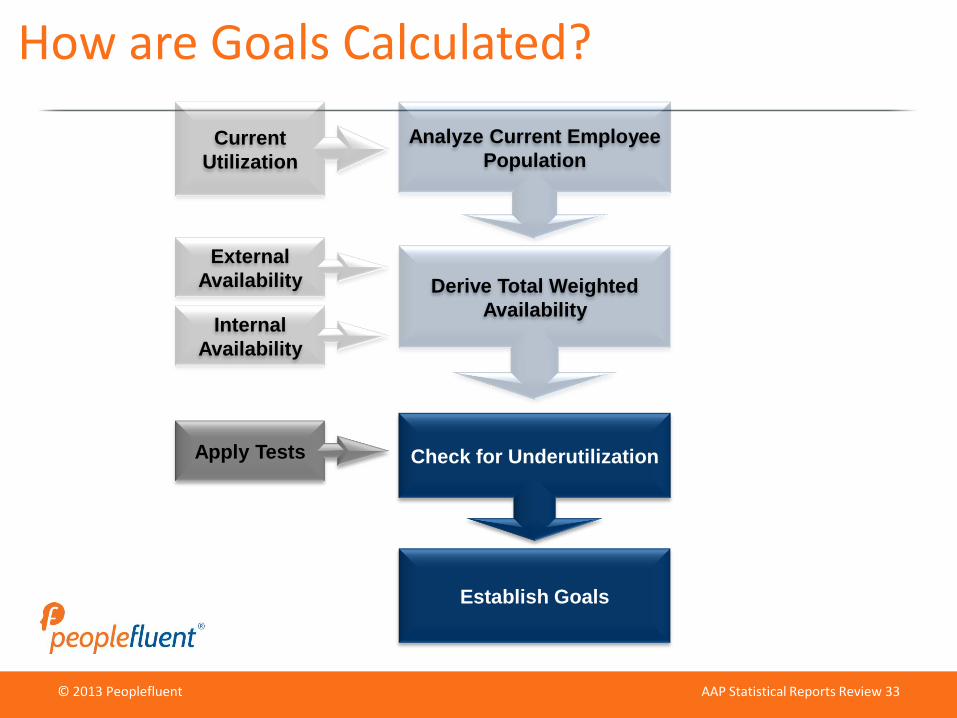
How are Goals Calculated?
External
Availability
Internal
Availability
Derive Total Weighted
Availability
Current
Utilization
Analyze Current Employee
Population
Establish Goals
Check for UnderutilizationApply Tests
© 2013 Peoplefluent
© 2012 Peoplefluent
AAP Statistical Reports Review 34
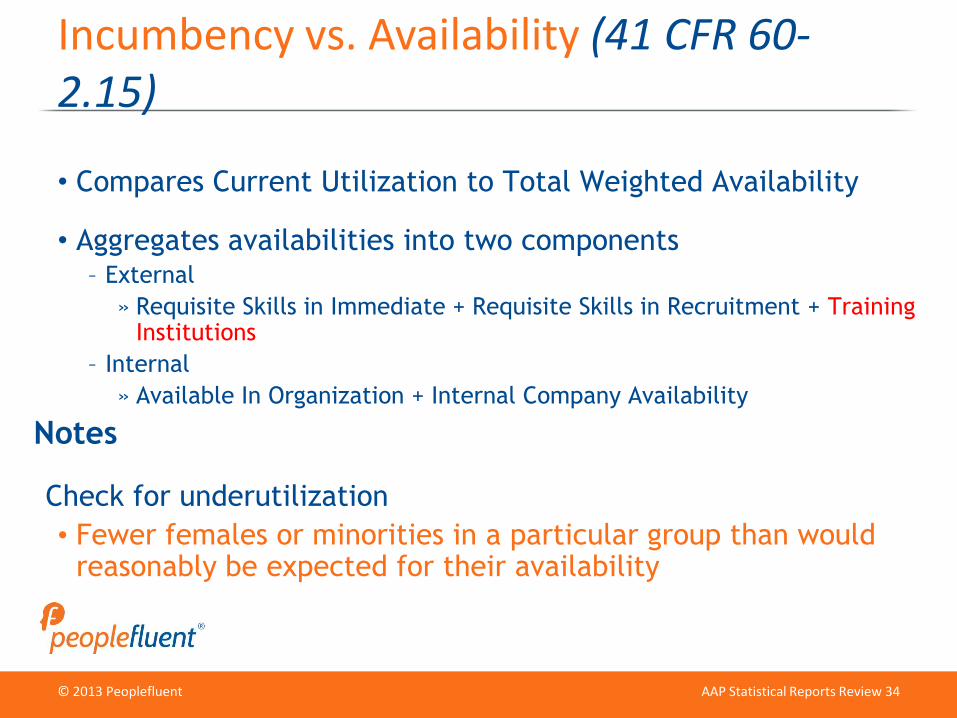
• Compares Current Utilization to Total Weighted Availability
• Aggregates availabilities into two components– External
» Requisite Skills in Immediate + Requisite Skills in Recruitment + Training Institutions
– Internal
» Available In Organization + Internal Company Availability
Notes
Check for underutilization
• Fewer females or minorities in a particular group than would reasonably be expected for their availability
Incumbency vs. Availability (41 CFR 60-2.15)
© 2013 Peoplefluent
© 2012 Peoplefluent
AAP Statistical Reports Review 35
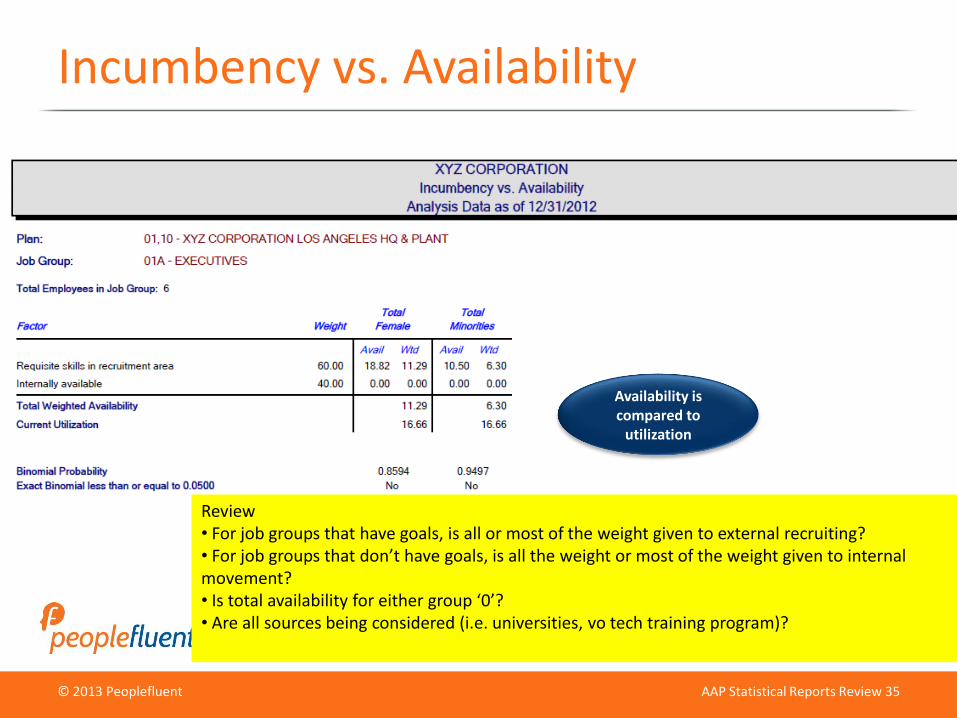
Incumbency vs. Availability
Availability is compared to
utilization
Review• For job groups that have goals, is all or most of the weight given to external recruiting?• For job groups that don’t have goals, is all the weight or most of the weight given to internal movement?• Is total availability for either group ‘0’?• Are all sources being considered (i.e. universities, vo tech training program)?
© 2013 Peoplefluent
© 2012 Peoplefluent
AAP Statistical Reports Review 36
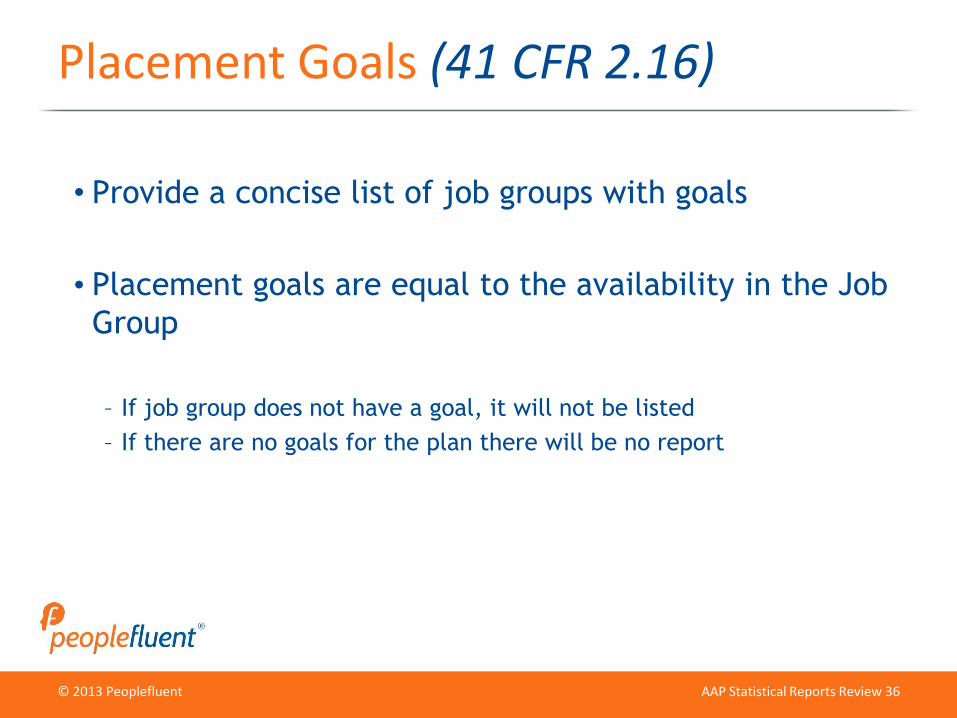
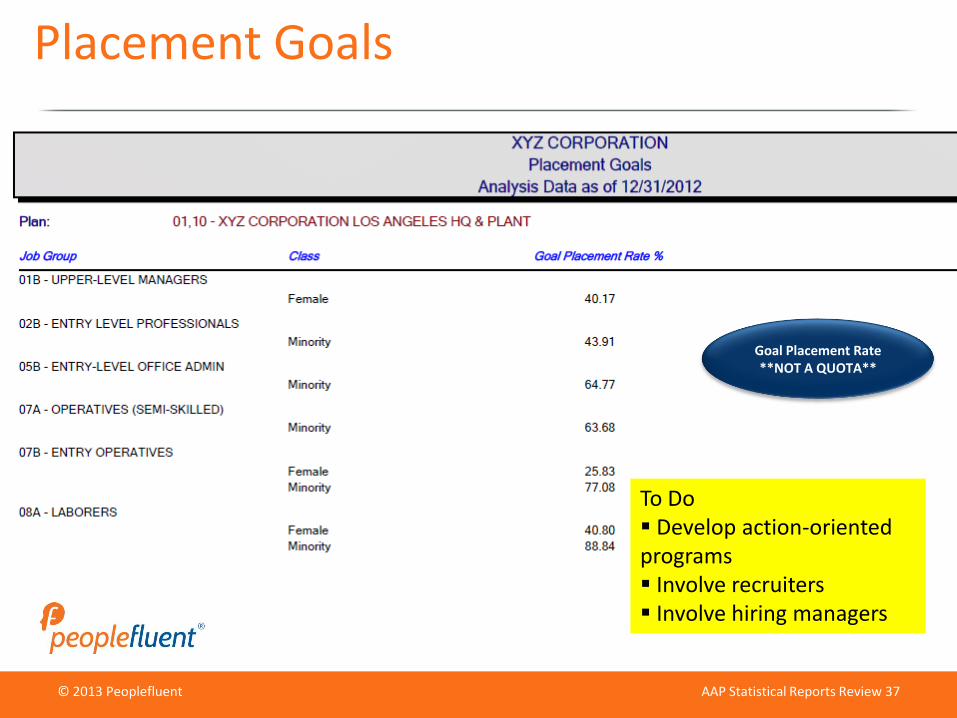
• Provide a concise list of job groups with goals
• Placement goals are equal to the availability in the Job
Group
– If job group does not have a goal, it will not be listed
– If there are no goals for the plan there will be no report
Placement Goals (41 CFR 2.16)
© 2013 Peoplefluent
© 2012 Peoplefluent
AAP Statistical Reports Review 37
Placement Goals
Goal Placement Rate **NOT A QUOTA**
To Do Develop action-oriented programs Involve recruiters Involve hiring managers
© 2013 Peoplefluent
© 2012 Peoplefluent
AAP Statistical Reports Review 38
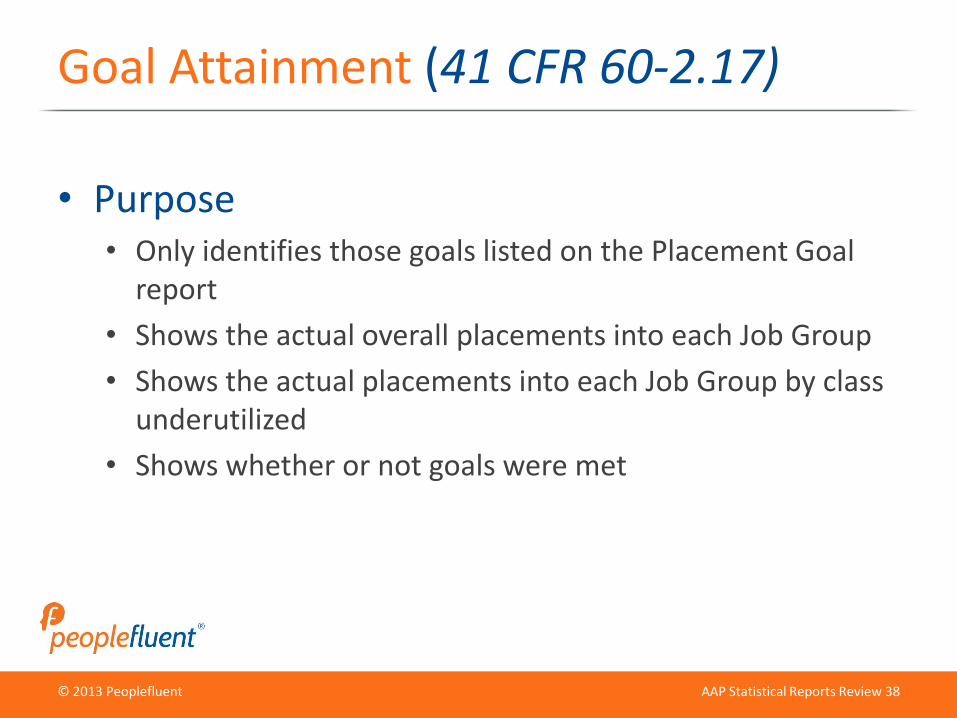
Goal Attainment (41 CFR 60-2.17)
• Purpose• Only identifies those goals listed on the Placement Goal
report
• Shows the actual overall placements into each Job Group
• Shows the actual placements into each Job Group by class underutilized
• Shows whether or not goals were met
© 2013 Peoplefluent
© 2012 Peoplefluent
AAP Statistical Reports Review 39
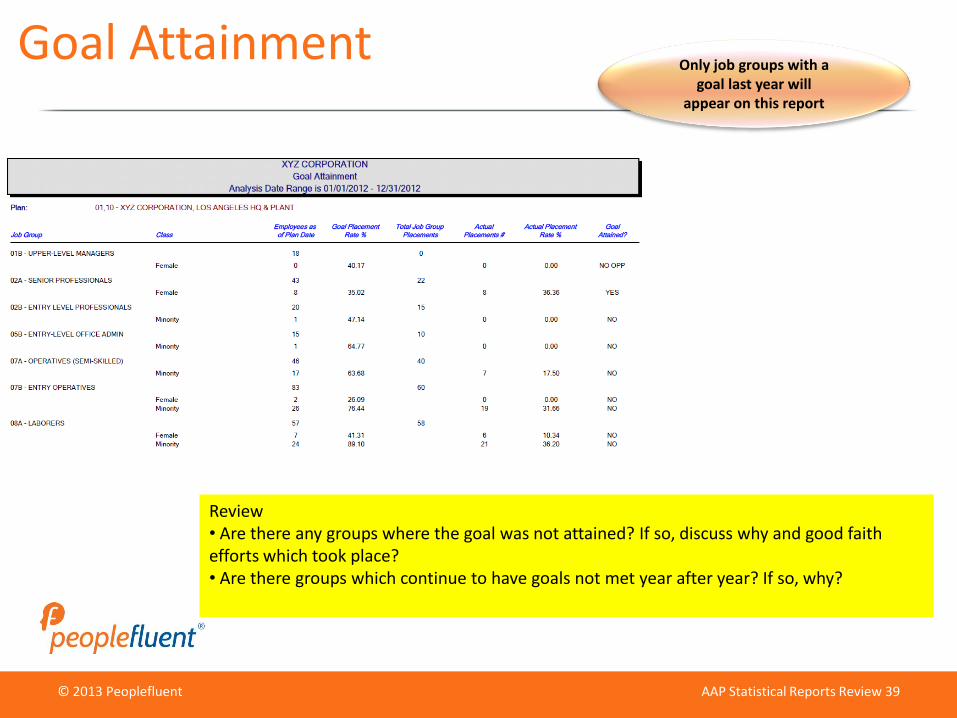
Only job groups with agoal last year will
appear on this report
Goal Attainment
Review• Are there any groups where the goal was not attained? If so, discuss why and good faith efforts which took place?• Are there groups which continue to have goals not met year after year? If so, why?
© 2013 Peoplefluent
© 2012 Peoplefluent
AAP Statistical Reports Review 40
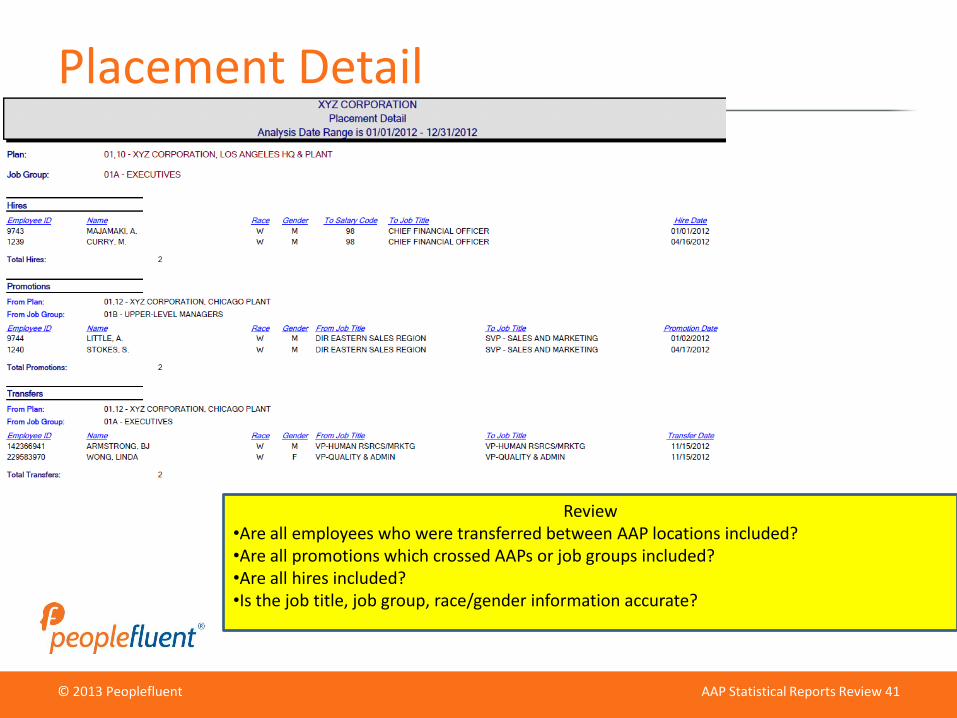
• Listing of Hires, Promotions, and Transfers by job group
for the year prior to the plan date
• Lists promotions and transfers “to” job group
• Provides supporting data for Goal Attainment
Placement Detail
© 2013 Peoplefluent
© 2012 Peoplefluent
AAP Statistical Reports Review 41
Placement Detail
Review•Are all employees who were transferred between AAP locations included?•Are all promotions which crossed AAPs or job groups included?•Are all hires included?•Is the job title, job group, race/gender information accurate?
© 2013 PeoplefluentAAP Statistical Reports
Review│42
Adverse Impact
© 2013 Peoplefluent
© 2012 Peoplefluent
AAP Statistical Reports Review 43
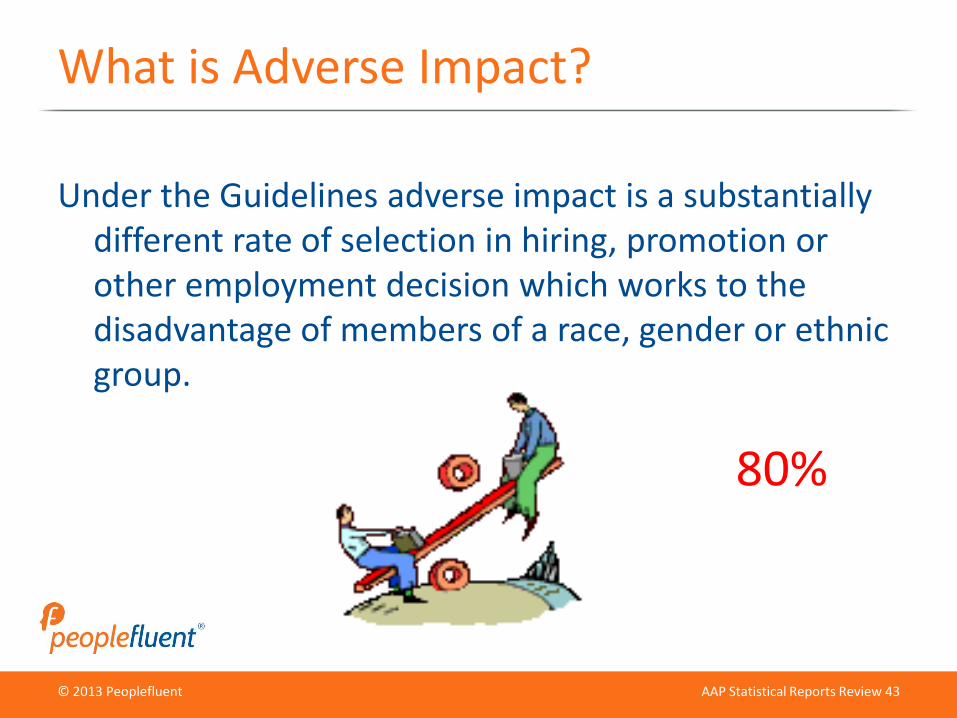
What is Adverse Impact?
Under the Guidelines adverse impact is a substantially different rate of selection in hiring, promotion or other employment decision which works to the disadvantage of members of a race, gender or ethnic group.
80%
© 2013 Peoplefluent
© 2012 Peoplefluent
AAP Statistical Reports Review 44
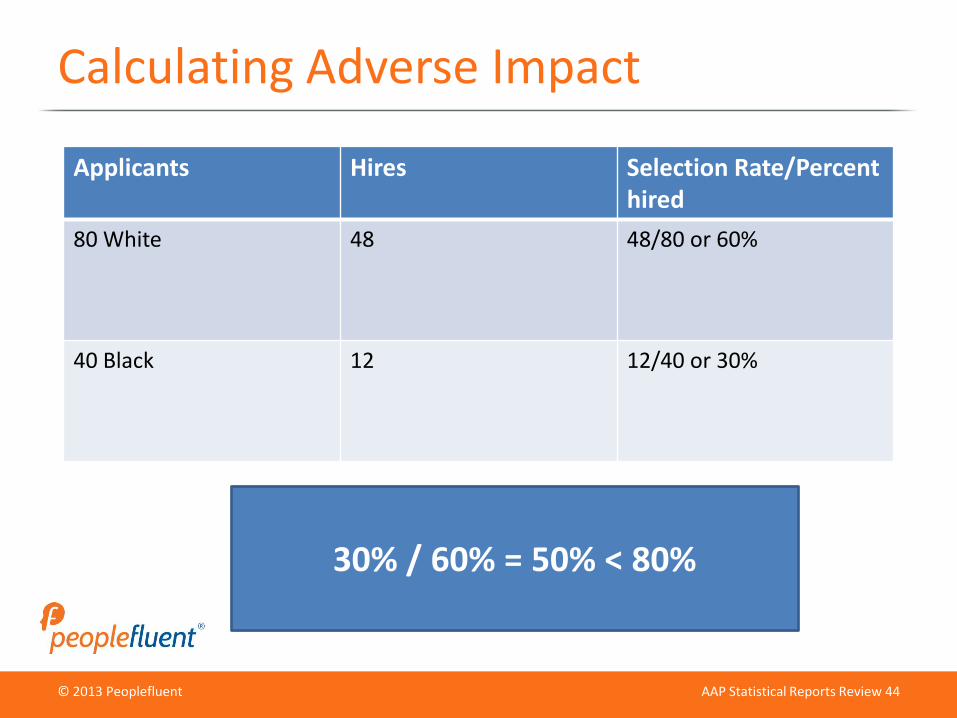
Calculating Adverse Impact
Applicants Hires Selection Rate/Percent hired
80 White 48 48/80 or 60%
40 Black 12 12/40 or 30%
30% / 60% = 50% < 80%
© 2013 Peoplefluent
© 2012 Peoplefluent
AAP Statistical Reports Review 45
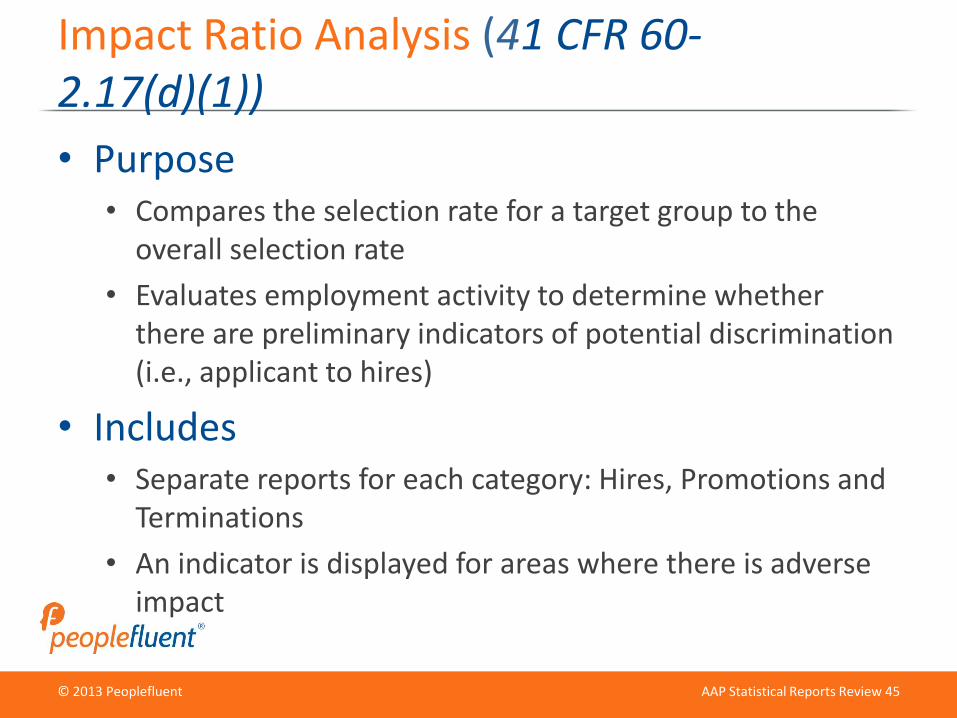
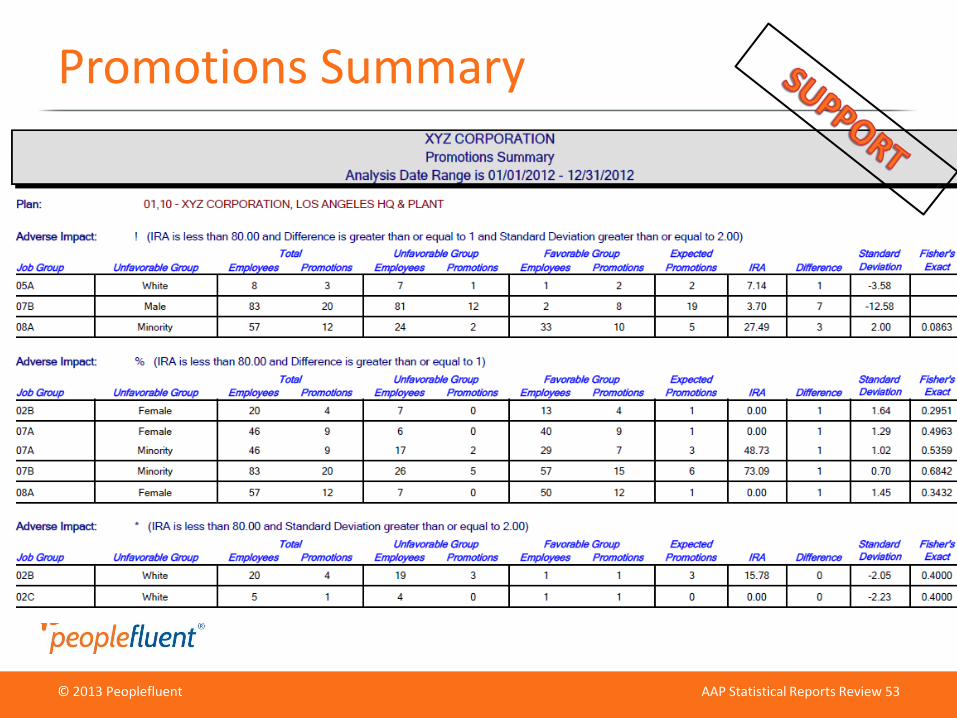
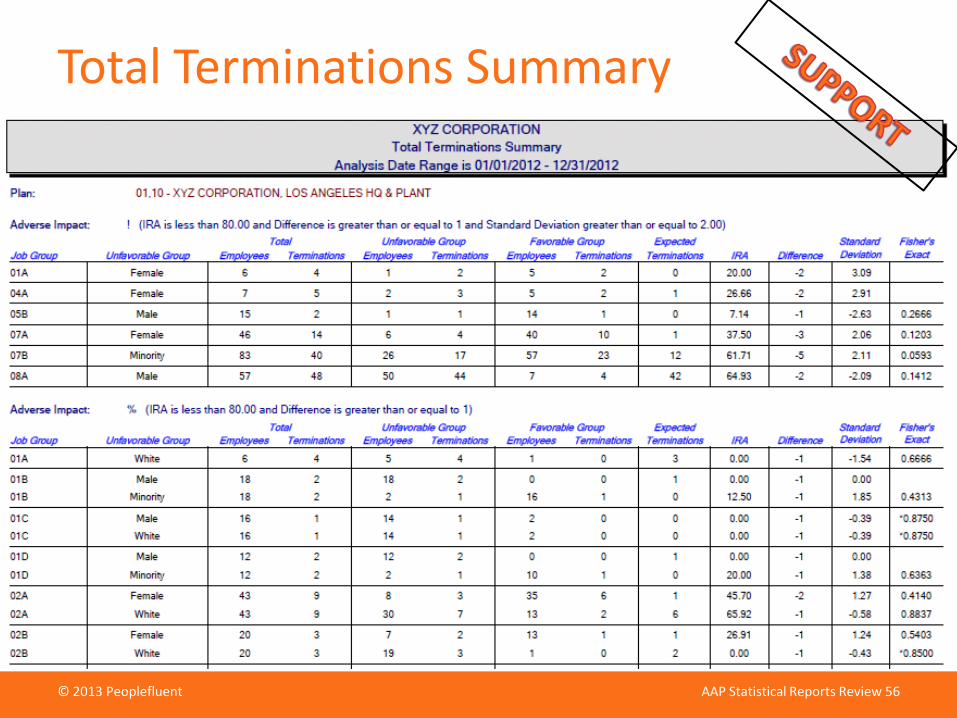
Impact Ratio Analysis (41 CFR 60-2.17(d)(1))
• Purpose• Compares the selection rate for a target group to the
overall selection rate
• Evaluates employment activity to determine whether there are preliminary indicators of potential discrimination (i.e., applicant to hires)
• Includes• Separate reports for each category: Hires, Promotions and
Terminations
• An indicator is displayed for areas where there is adverse impact
© 2013 Peoplefluent
© 2012 Peoplefluent
AAP Statistical Reports Review 46
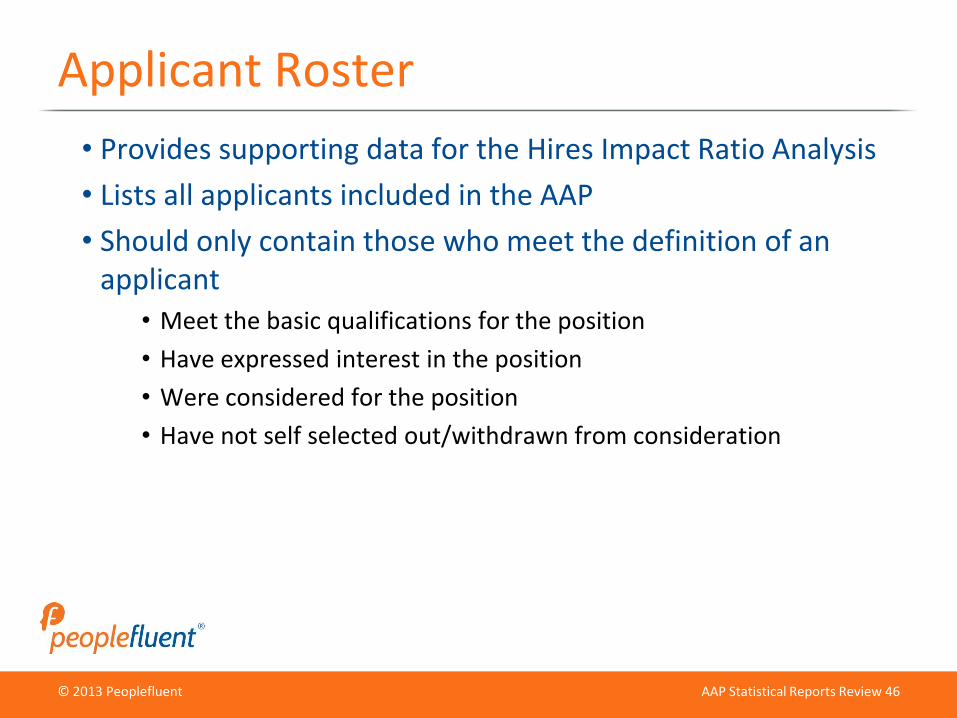
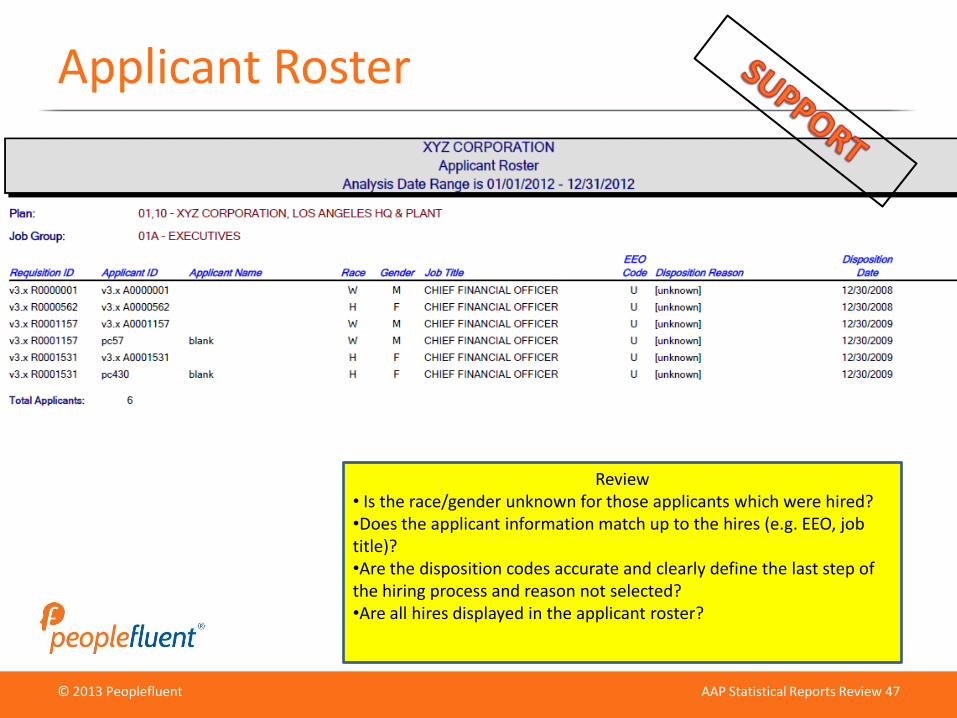
Applicant Roster
• Provides supporting data for the Hires Impact Ratio Analysis
• Lists all applicants included in the AAP
• Should only contain those who meet the definition of an applicant
• Meet the basic qualifications for the position
• Have expressed interest in the position
• Were considered for the position
• Have not self selected out/withdrawn from consideration
© 2013 Peoplefluent
© 2012 Peoplefluent
AAP Statistical Reports Review 47
Applicant Roster
Review• Is the race/gender unknown for those applicants which were hired?•Does the applicant information match up to the hires (e.g. EEO, job title)?•Are the disposition codes accurate and clearly define the last step of the hiring process and reason not selected?•Are all hires displayed in the applicant roster?
© 2013 Peoplefluent
© 2012 Peoplefluent
AAP Statistical Reports Review 48
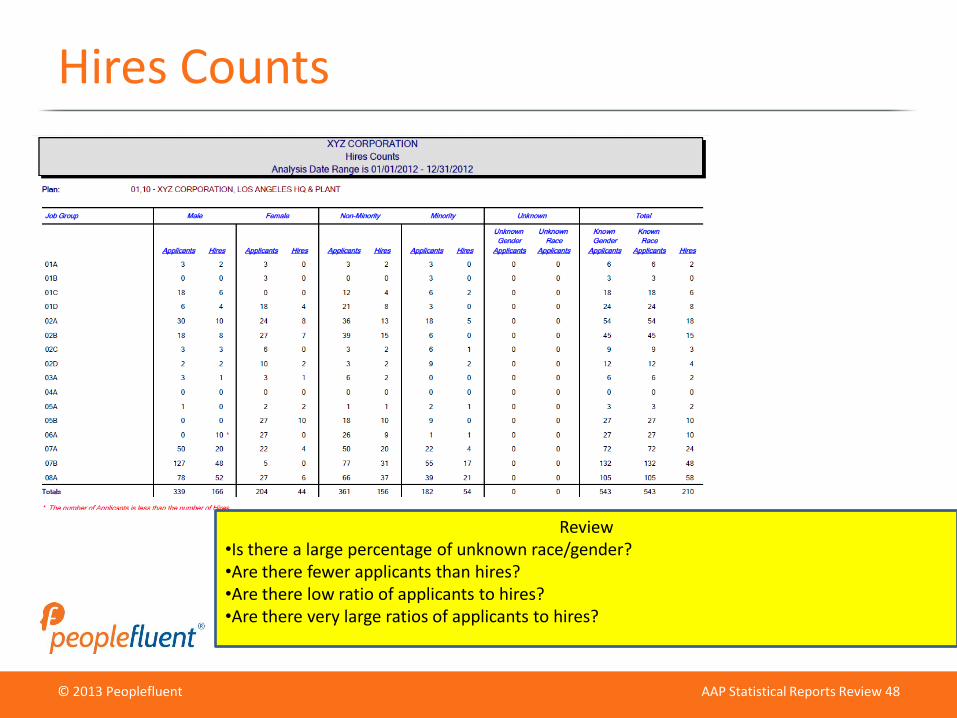
Hires Counts
Review•Is there a large percentage of unknown race/gender?•Are there fewer applicants than hires?•Are there low ratio of applicants to hires?•Are there very large ratios of applicants to hires?
© 2013 Peoplefluent
© 2012 Peoplefluent
AAP Statistical Reports Review 49
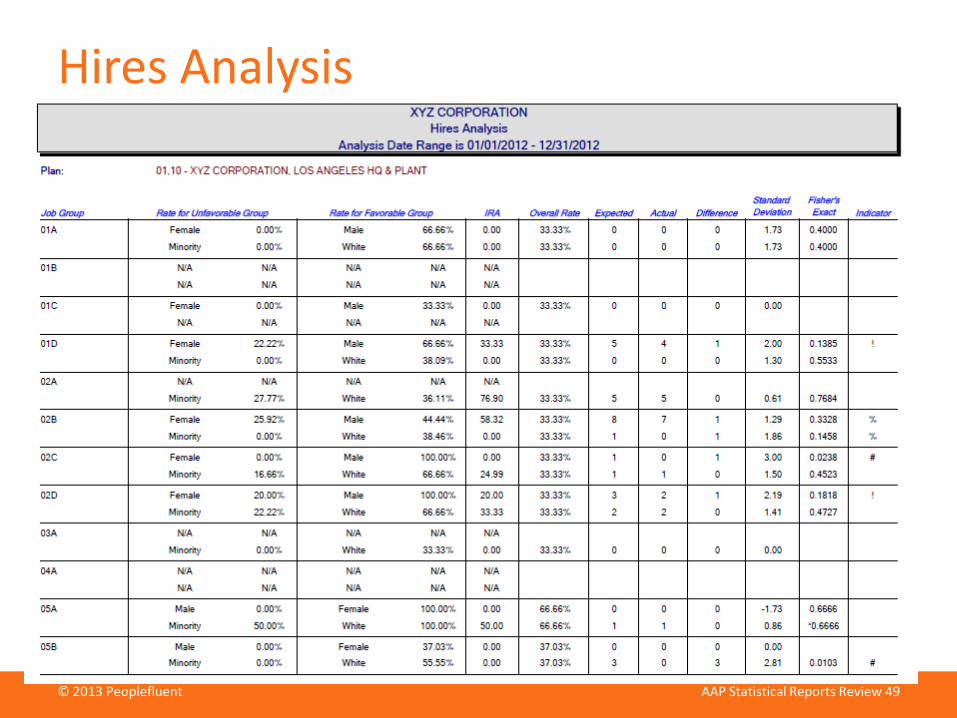
Hires Analysis
© 2013 Peoplefluent
© 2012 Peoplefluent
AAP Statistical Reports Review 50
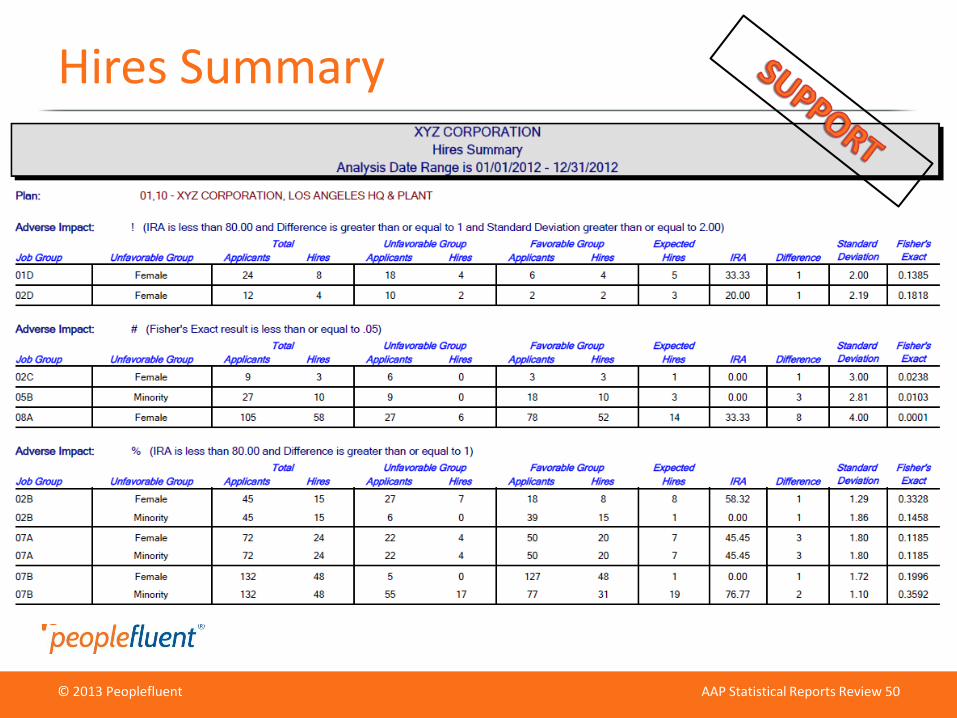
Hires Summary
© 2013 Peoplefluent
© 2012 Peoplefluent
AAP Statistical Reports Review 51
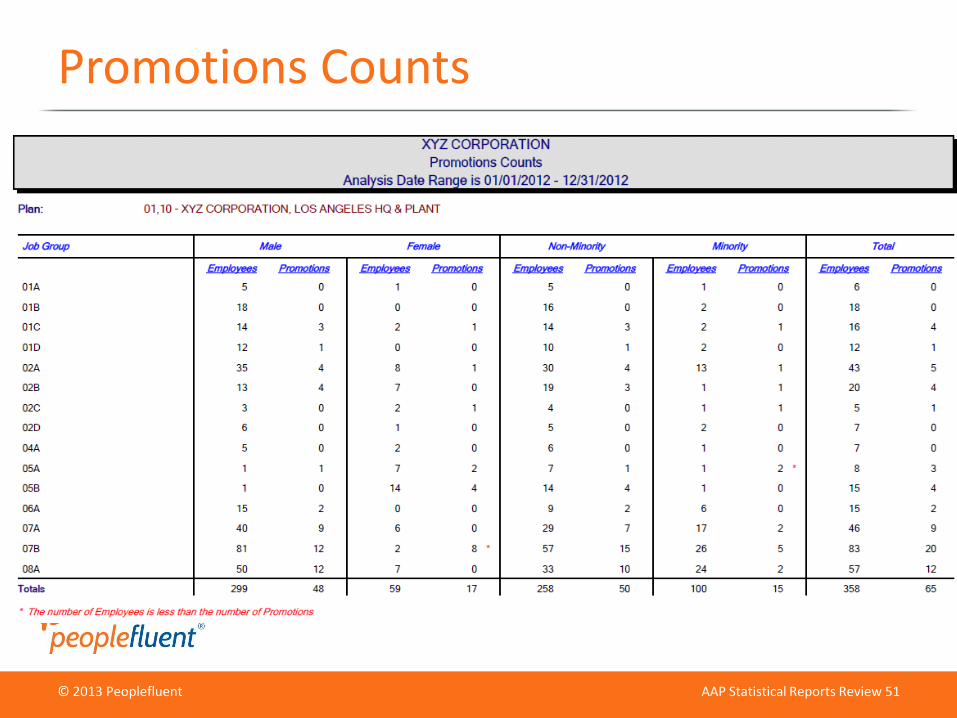
Promotions Counts
© 2013 Peoplefluent
© 2012 Peoplefluent
AAP Statistical Reports Review 52
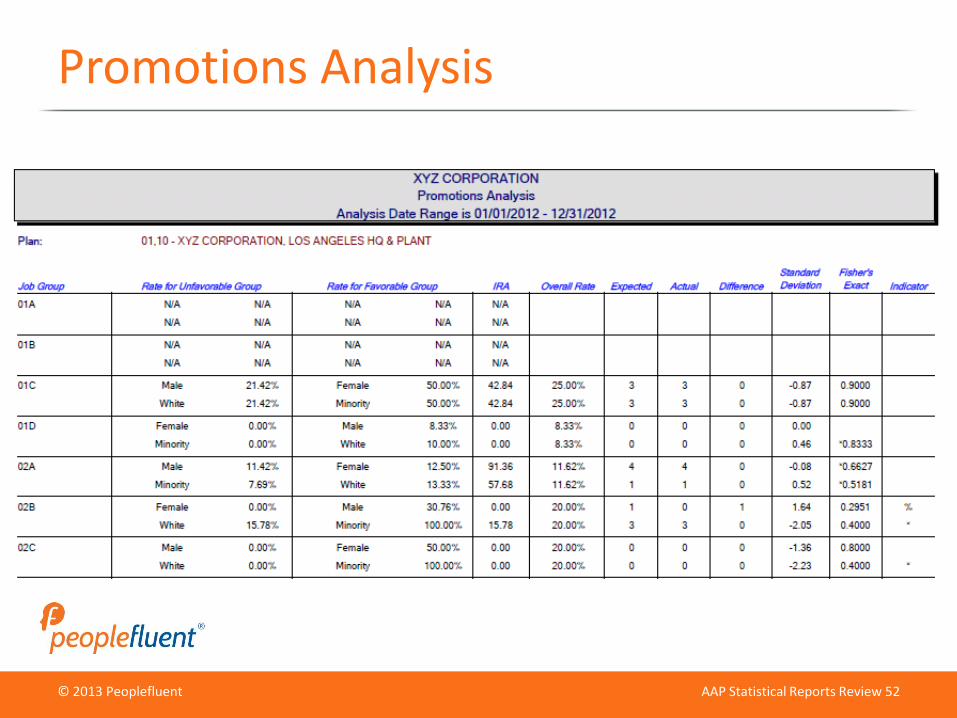
Promotions Analysis
© 2013 Peoplefluent
© 2012 Peoplefluent
AAP Statistical Reports Review 53
Promotions Summary
© 2013 Peoplefluent
© 2012 Peoplefluent
AAP Statistical Reports Review 54
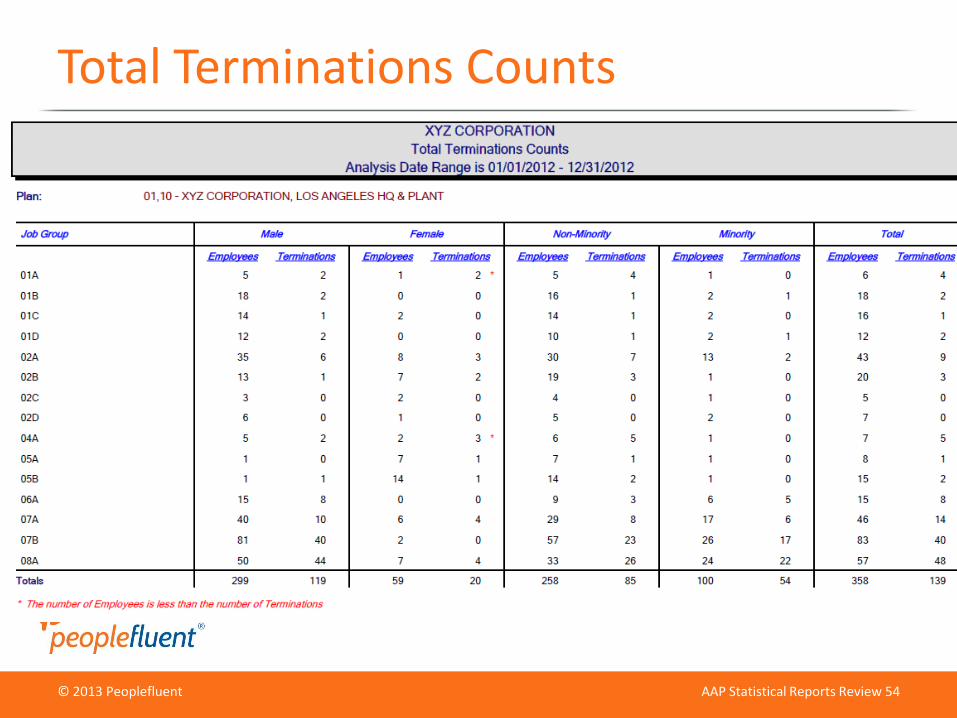
Total Terminations Counts
© 2013 Peoplefluent
© 2012 Peoplefluent
AAP Statistical Reports Review 55
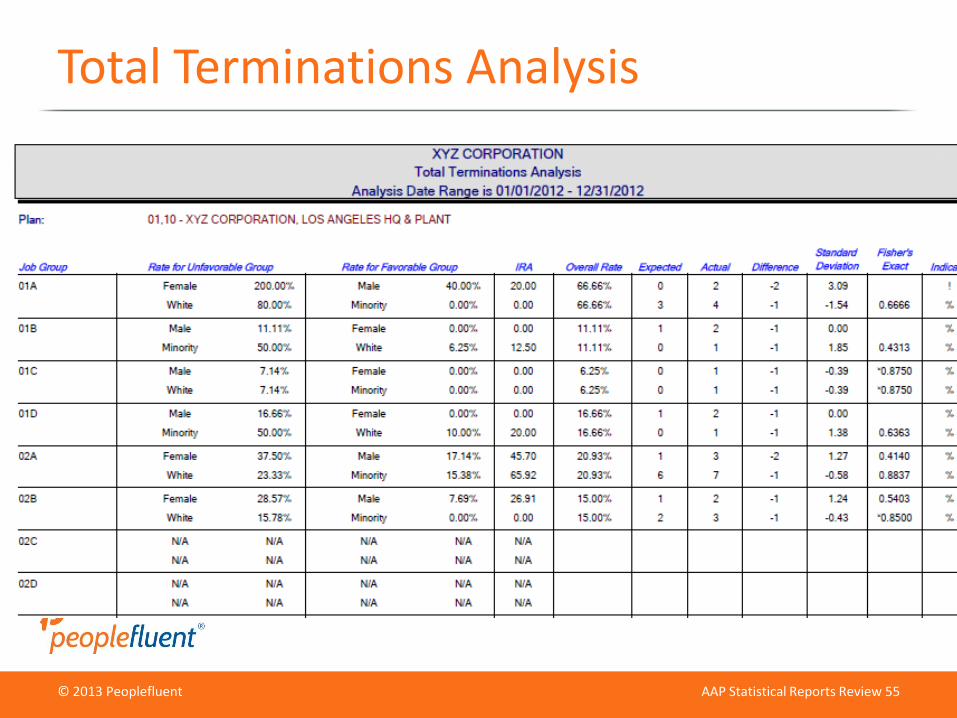
Total Terminations Analysis
© 2013 Peoplefluent
© 2012 Peoplefluent
AAP Statistical Reports Review 56
Total Terminations Summary
© 2013 Peoplefluent
© 2012 Peoplefluent
AAP Statistical Reports Review 57
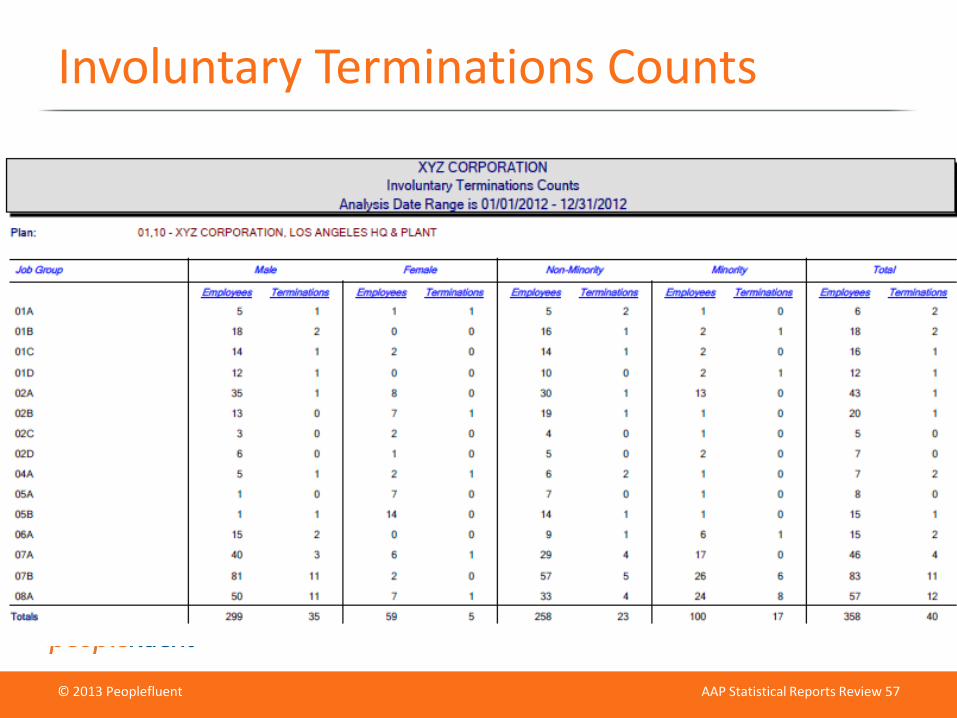
Involuntary Terminations Counts
© 2013 Peoplefluent
© 2012 Peoplefluent
AAP Statistical Reports Review 58
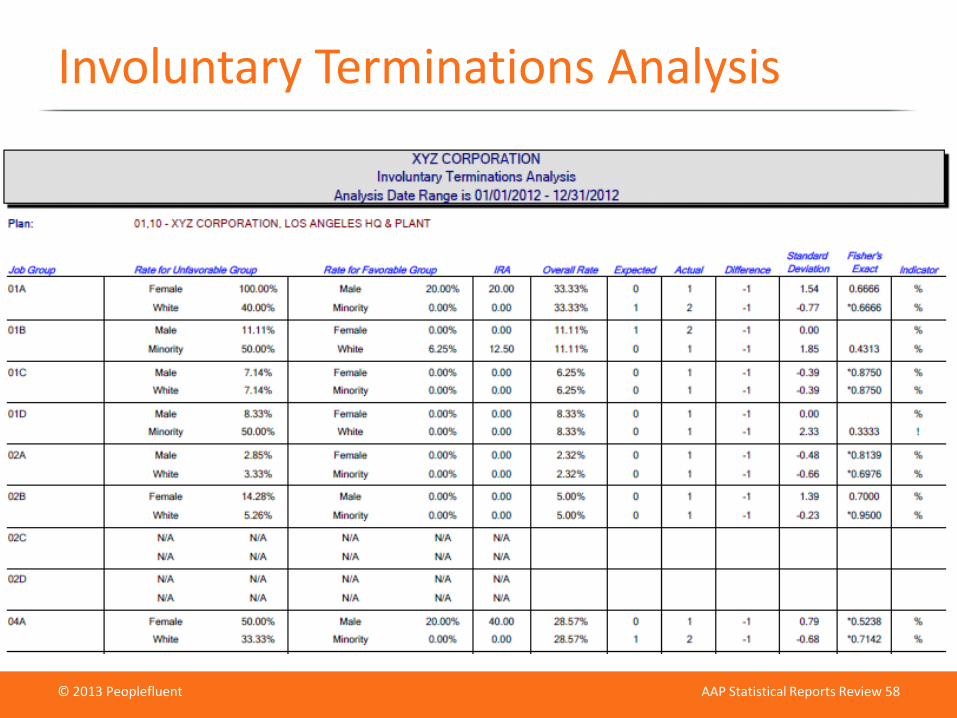
Involuntary Terminations Analysis
© 2013 Peoplefluent
© 2012 Peoplefluent
AAP Statistical Reports Review 59
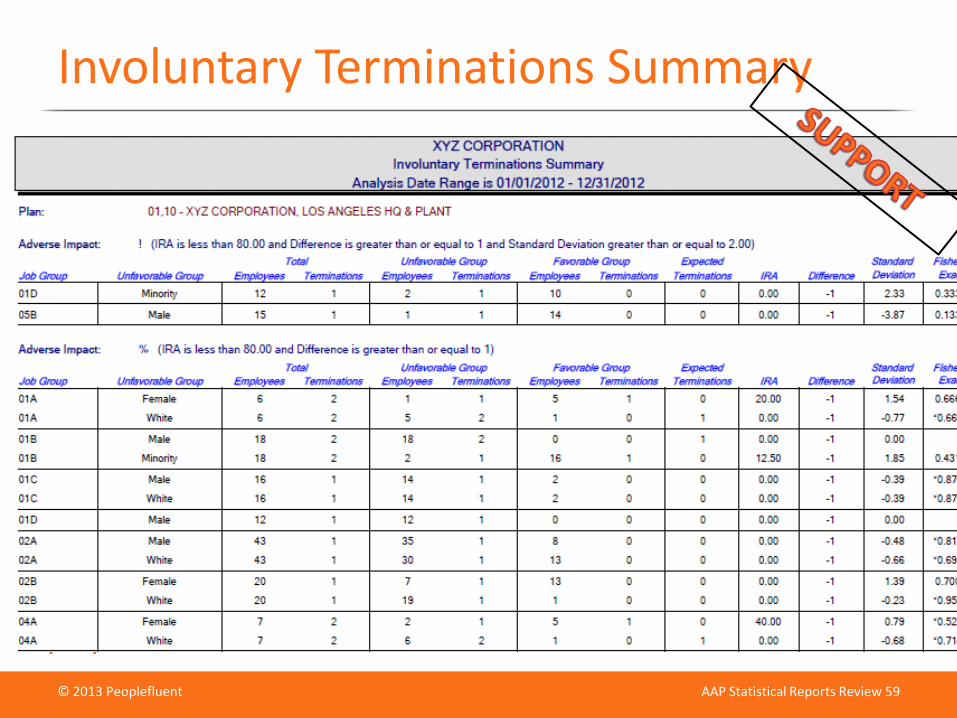
Involuntary Terminations Summary
© 2013 Peoplefluent
© 2012 Peoplefluent
AAP Statistical Reports Review 60
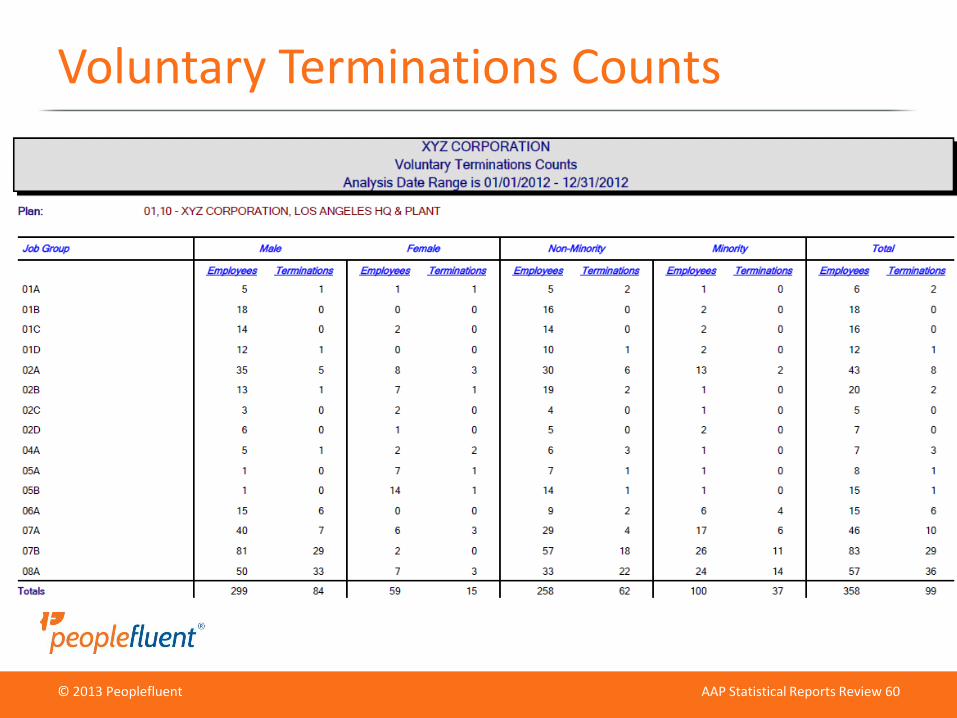
Voluntary Terminations Counts
© 2013 Peoplefluent
© 2012 Peoplefluent
AAP Statistical Reports Review 61
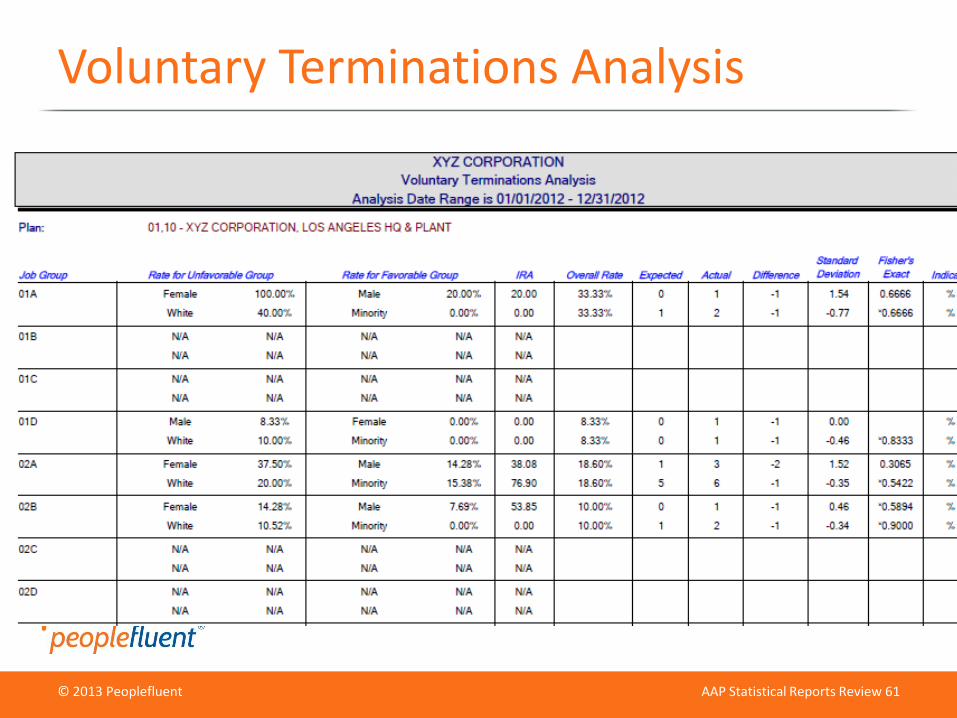
Voluntary Terminations Analysis
© 2013 Peoplefluent
© 2012 Peoplefluent
AAP Statistical Reports Review 62
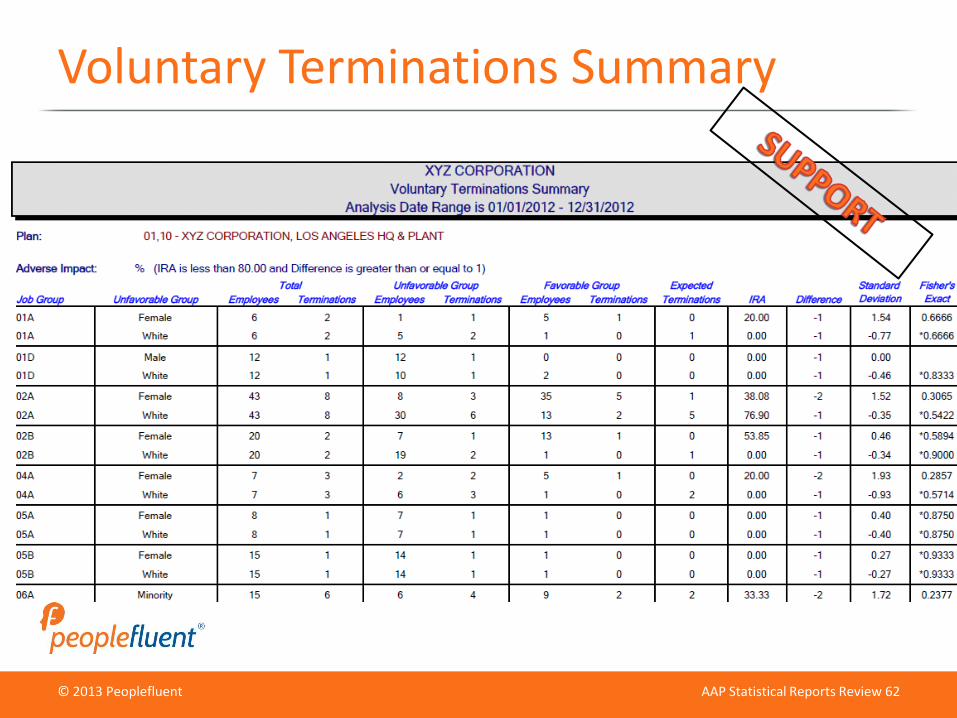
Voluntary Terminations Summary
© 2013 Peoplefluent
© 2012 Peoplefluent
AAP Statistical Reports Review 63
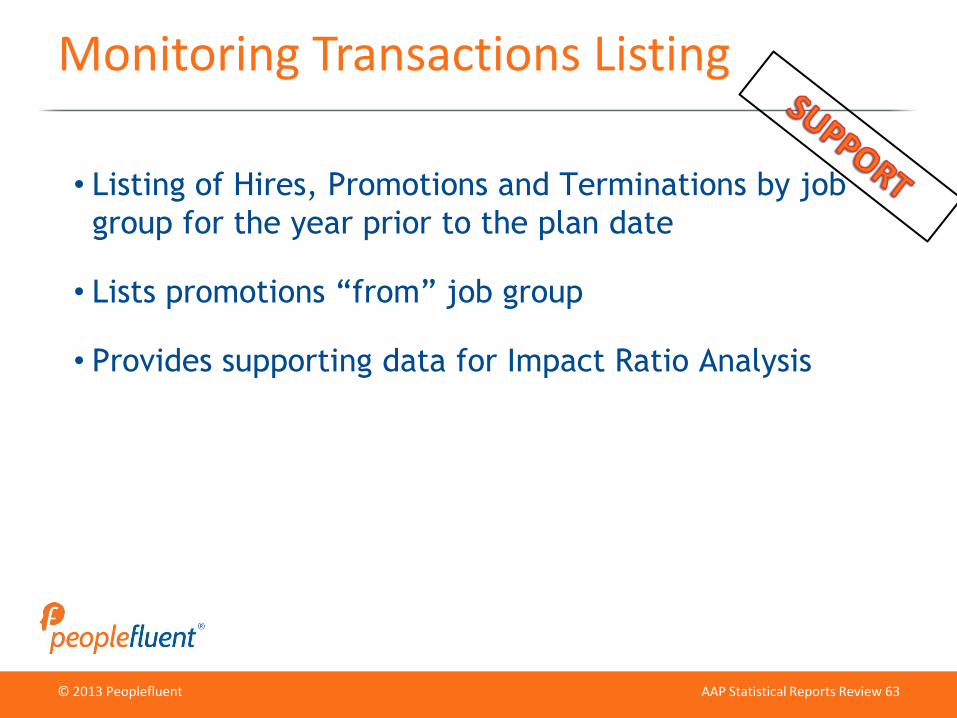
• Listing of Hires, Promotions and Terminations by job
group for the year prior to the plan date
• Lists promotions “from” job group
• Provides supporting data for Impact Ratio Analysis
Monitoring Transactions Listing
© 2013 Peoplefluent
© 2012 Peoplefluent
AAP Statistical Reports Review 64
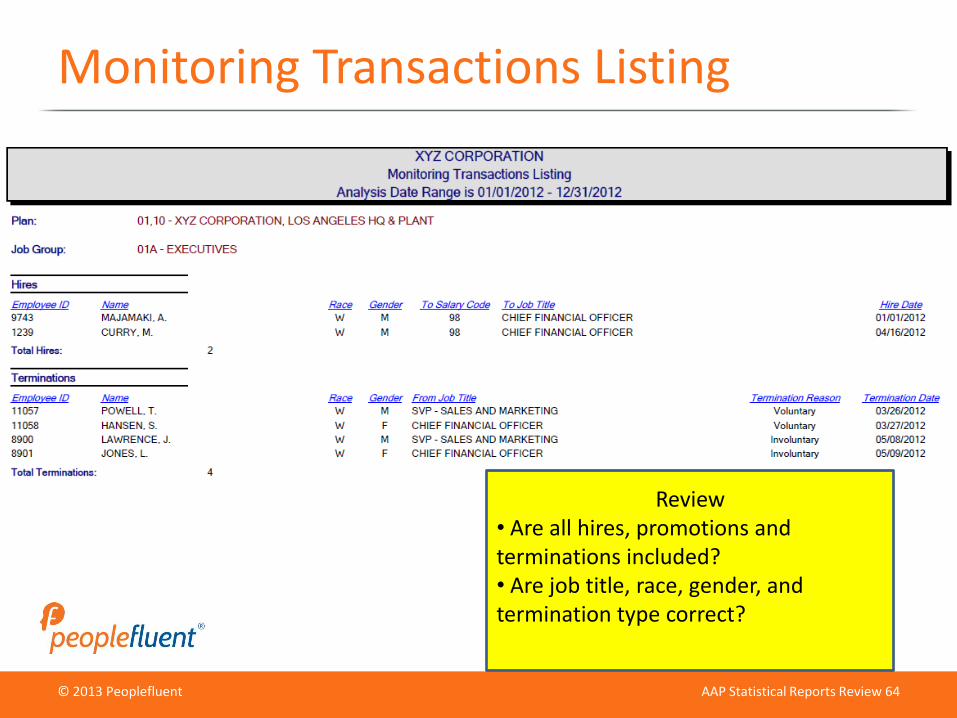
Monitoring Transactions Listing
Review• Are all hires, promotions and terminations included?• Are job title, race, gender, and termination type correct?
© 2013 Peoplefluent
© 2012 Peoplefluent
AAP Statistical Reports Review 65
Step Analysis (41 CFR 60-3.4(c))
• If adverse impact is found in hiring decisions even after the pool of candidates has been refined, a Step Analysis MUST be prepared in order to determine which step of the selection process caused adverse
impact
• Minimum qualifications
• Phone interview
• Face-to-face interview
• Written test
• Drug test
© 2013 PeoplefluentAAP Statistical Reports
Review│66
Compensation Review
© 2013 Peoplefluent
© 2012 Peoplefluent
AAP Statistical Reports Review 67
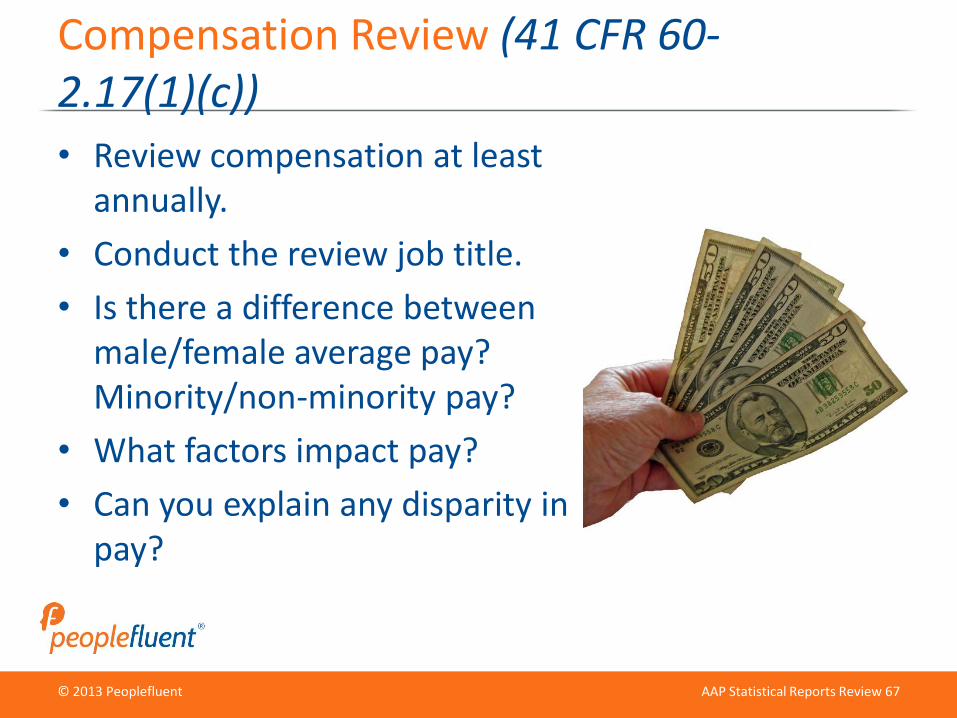
Compensation Review (41 CFR 60-2.17(1)(c))
• Review compensation at least annually.
• Conduct the review job title.
• Is there a difference between male/female average pay? Minority/non-minority pay?
• What factors impact pay?
• Can you explain any disparity in pay?
© 2013 Peoplefluent
© 2012 Peoplefluent
AAP Statistical Reports Review 68
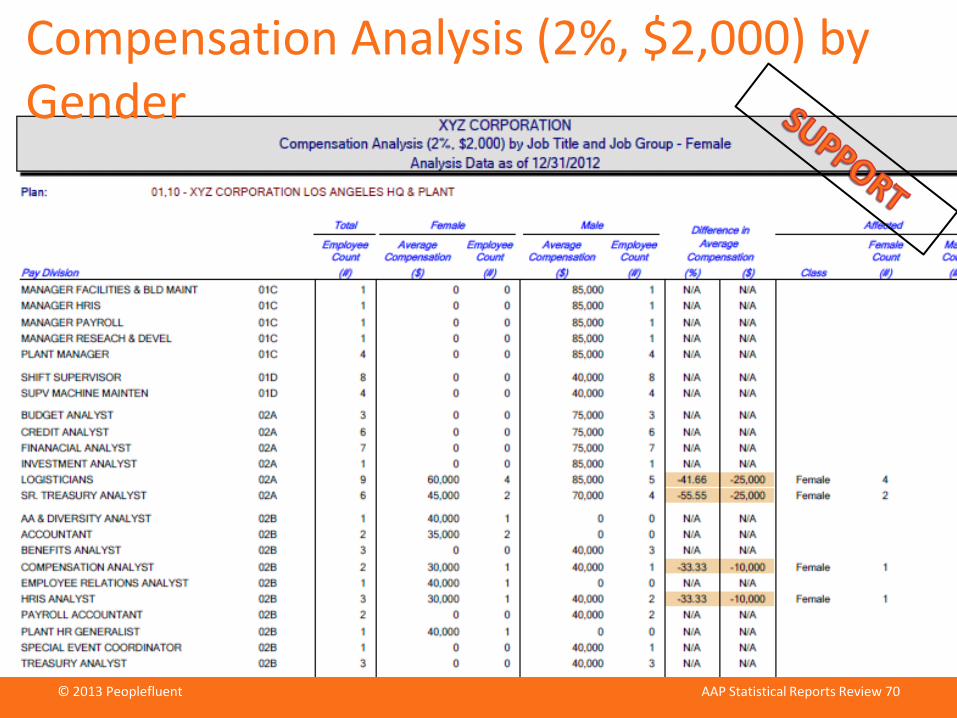
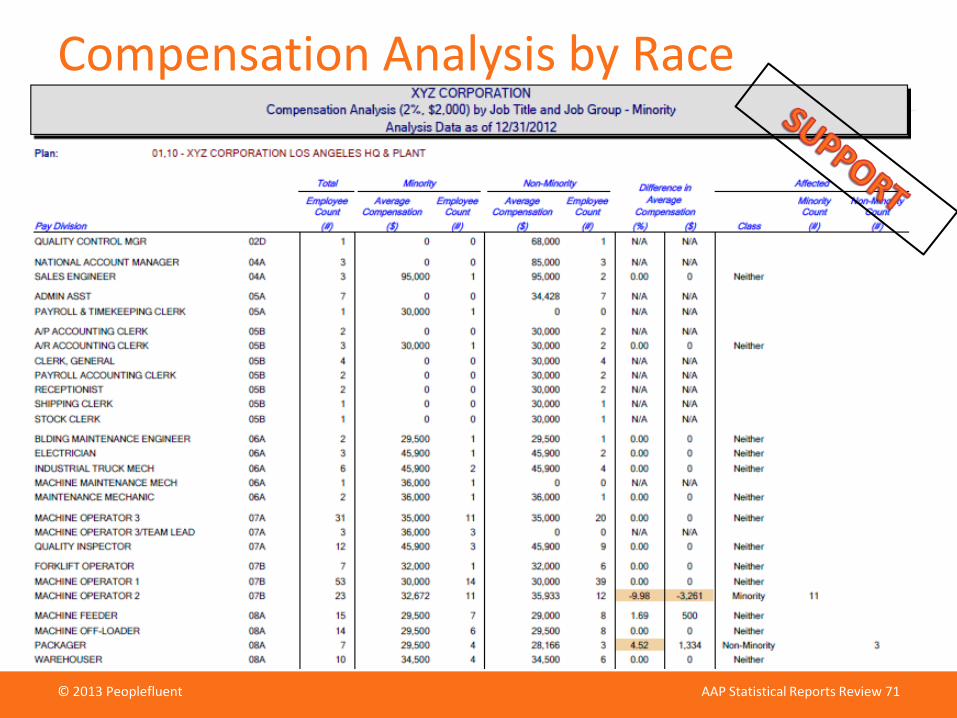
Compensation Reports
Item #11 – Required only if under audit
• Provides the annualized compensation for males/females
and minority/non-minority in each salary grade or job
group/job title
• Meets the requirement for item 11 on the OFCCP standard
audit scheduling letter
2%, $2000 – Support Report
• Provides an analysis of compensation between males/females and minority/non-minority and highlights areas where research is needed
© 2013 Peoplefluent
© 2012 Peoplefluent
AAP Statistical Reports Review 69
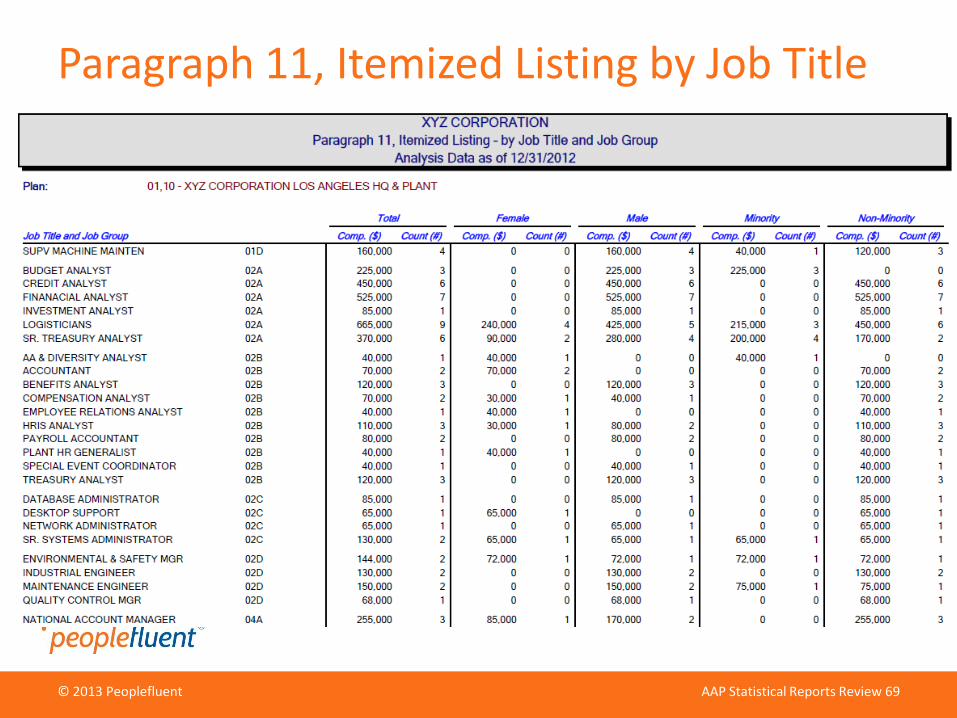
Paragraph 11, Itemized Listing by Job Title
© 2013 Peoplefluent
© 2012 Peoplefluent
AAP Statistical Reports Review 70
Compensation Analysis (2%, $2,000) by Gender
© 2013 Peoplefluent
© 2012 Peoplefluent
AAP Statistical Reports Review 71
Compensation Analysis by Race
© 2013 Peoplefluent
© 2012 Peoplefluent
AAP Statistical Reports Review 72
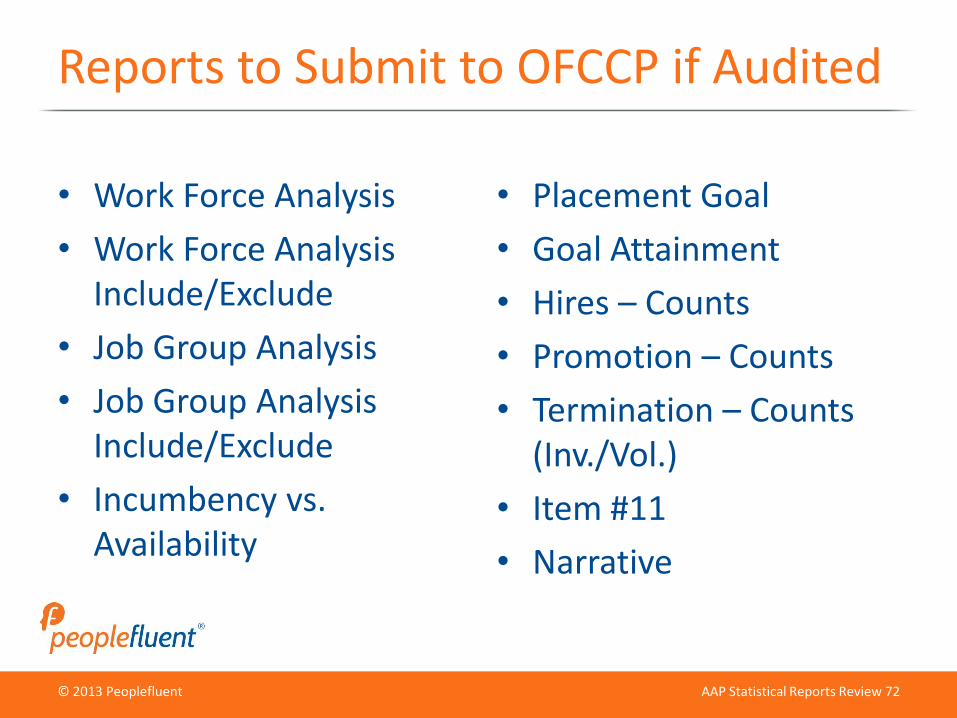
Reports to Submit to OFCCP if Audited
• Work Force Analysis
• Work Force Analysis Include/Exclude
• Job Group Analysis
• Job Group Analysis Include/Exclude
• Incumbency vs. Availability
• Placement Goal
• Goal Attainment
• Hires – Counts
• Promotion – Counts
• Termination – Counts (Inv./Vol.)
• Item #11
• Narrative
© 2013 Peoplefluent
© 2012 Peoplefluent
AAP Statistical Reports Review 73
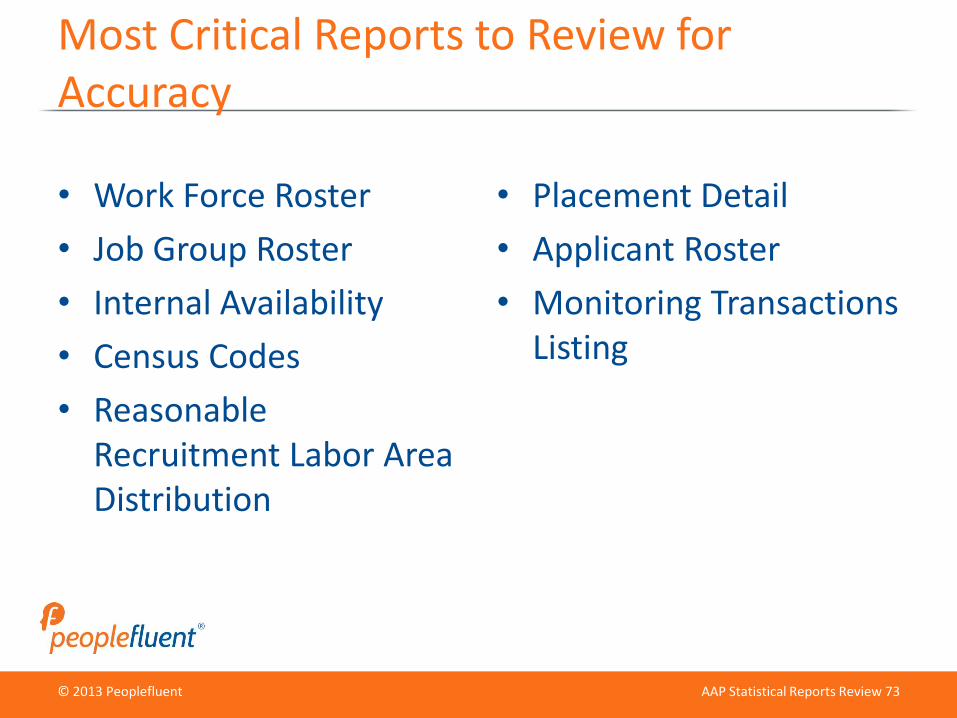
Most Critical Reports to Review for Accuracy
• Work Force Roster
• Job Group Roster
• Internal Availability
• Census Codes
• Reasonable Recruitment Labor Area Distribution
• Placement Detail
• Applicant Roster
• Monitoring Transactions Listing
© 2013 Peoplefluent
© 2012 Peoplefluent
AAP Statistical Reports Review 74
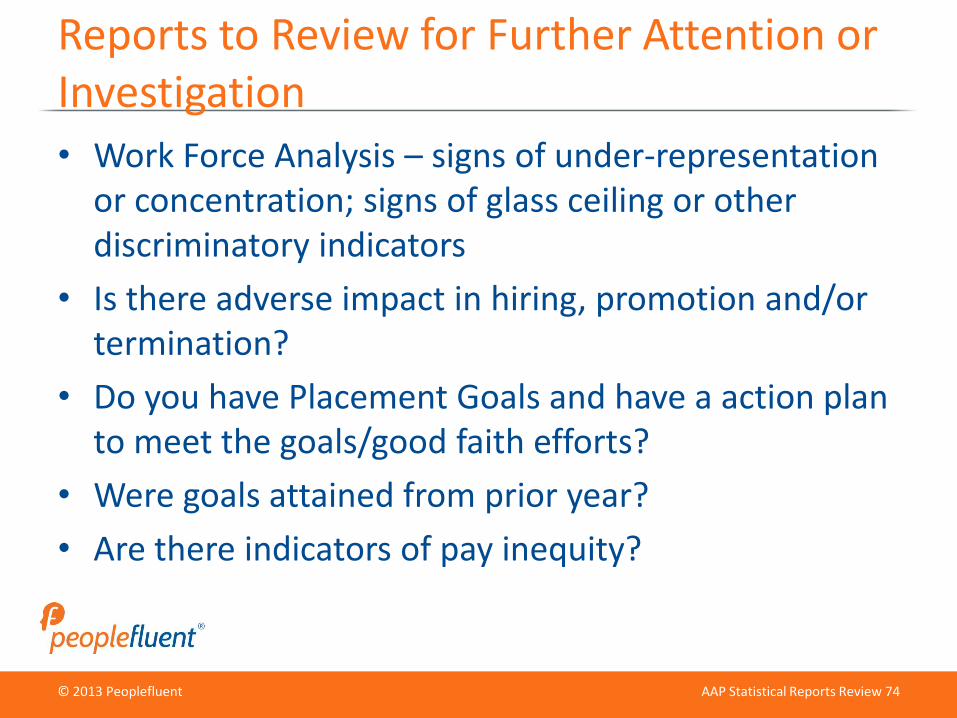
Reports to Review for Further Attention or Investigation
• Work Force Analysis – signs of under-representation or concentration; signs of glass ceiling or other discriminatory indicators
• Is there adverse impact in hiring, promotion and/or termination?
• Do you have Placement Goals and have a action plan to meet the goals/good faith efforts?
• Were goals attained from prior year?
• Are there indicators of pay inequity?

© 2013 Peoplefluent
© 2012 Peoplefluent
AAP Statistical Reports Review 75
Upcoming Training Opportunities
Webinars:
Feb. 5, 2013
• Principles of Affirmative Action Planning
Feb. 19, 2013
• Principles of Good Faith Efforts
Principles of AA Classroom Training:
March 11 & 12 (Chicago)
July 15 & 16 (Dallas)
October 21 & 22 (New Orleans)
© 2013 Peoplefluent
© 2012 Peoplefluent
AAP Statistical Reports Review 76
Upcoming Training Opportunities
Online Software Training:
Feb. 20 & 21, 2013
• AAPlanner / Monitor
April 16 & 17, 2013
• Pay Equity / Paystat
April 17 & 18, 2013
• AAPlanner / Monitor
Compliance Reporting Center (CRC)
• Feb. 19, 2013
• March 19, 2013

© 2013 Peoplefluent
© 2012 Peoplefluent
AAP Statistical Reports Review 77
Questions?
Send questions to [email protected]
© 2013 PeoplefluentAAP Statistical Reports
Review│78
Appendix
© 2013 Peoplefluent
© 2012 Peoplefluent
AAP Statistical Reports Review 79
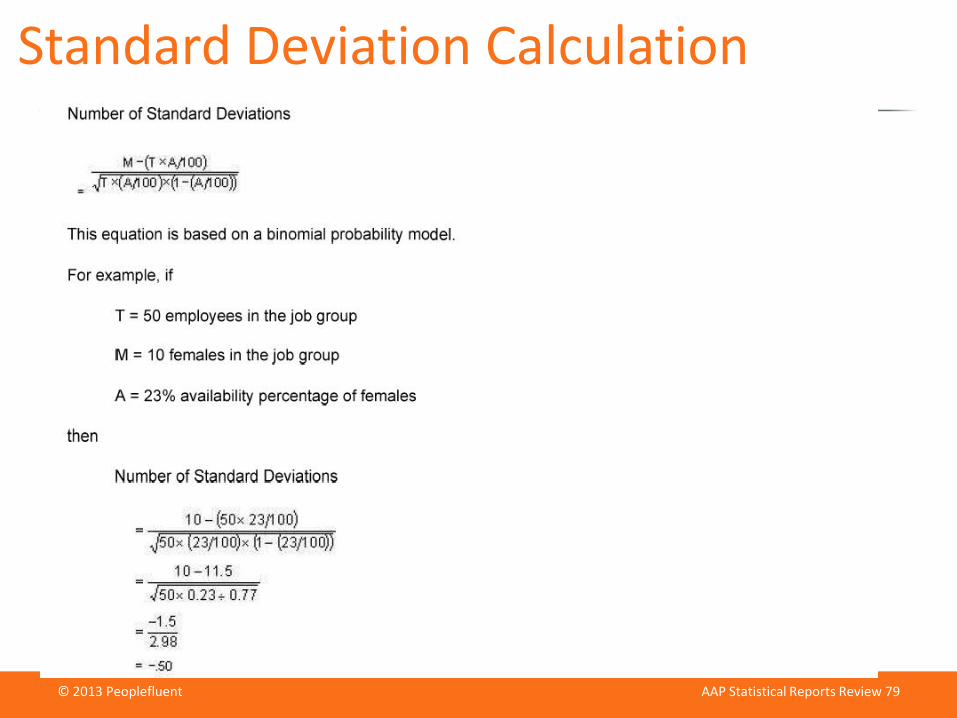
Standard Deviation Calculation
© 2013 Peoplefluent
© 2012 Peoplefluent
AAP Statistical Reports Review 80
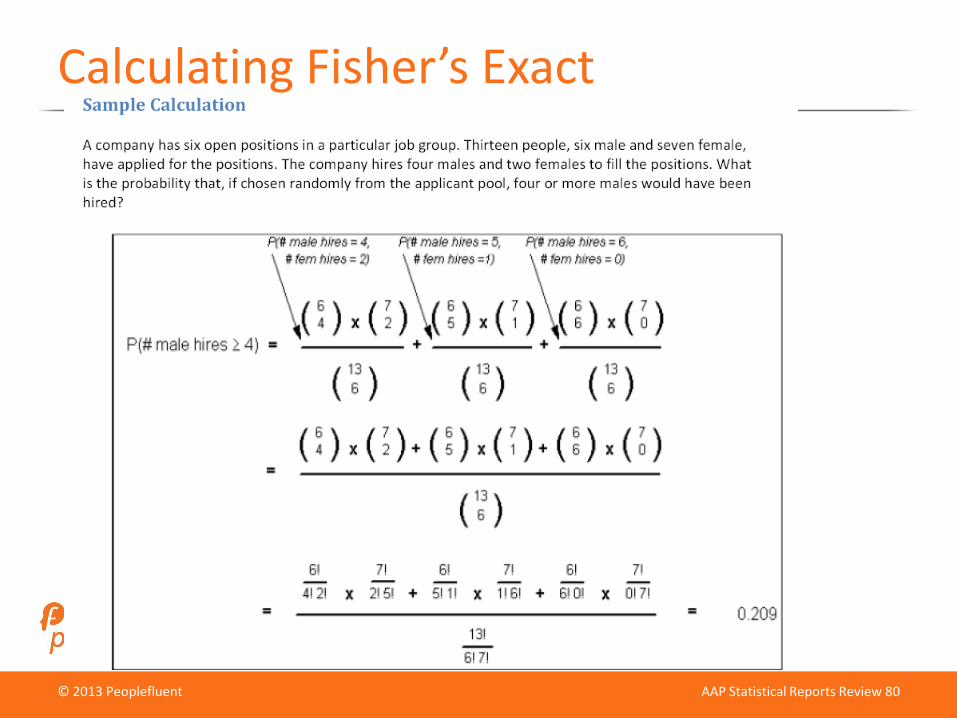
Calculating Fisher’s Exact
© 2013 Peoplefluent
© 2012 Peoplefluent
AAP Statistical Reports Review 81
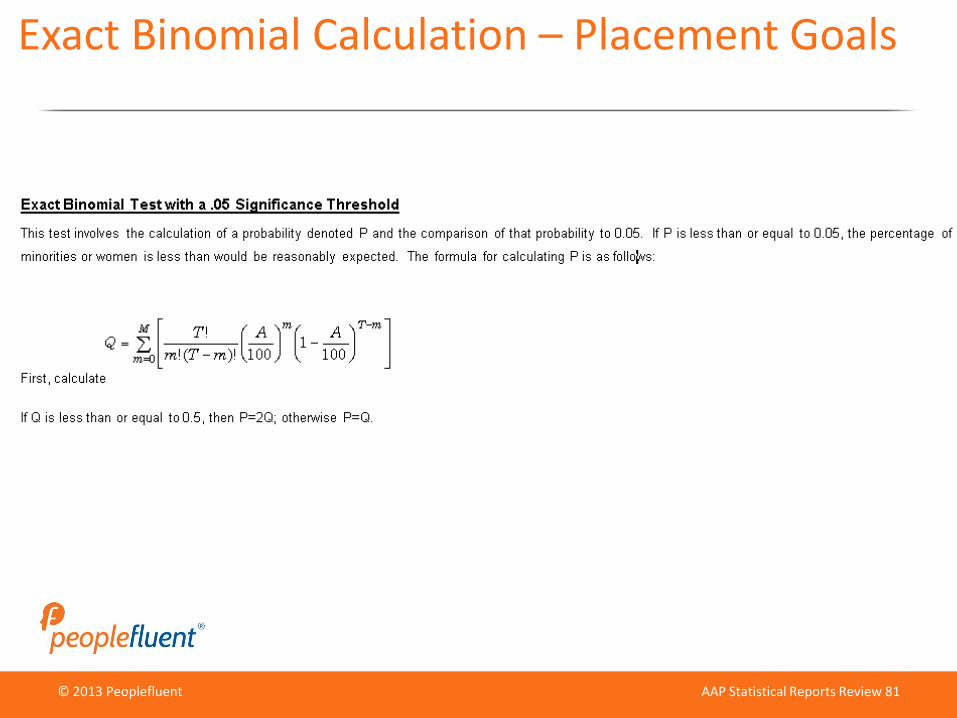
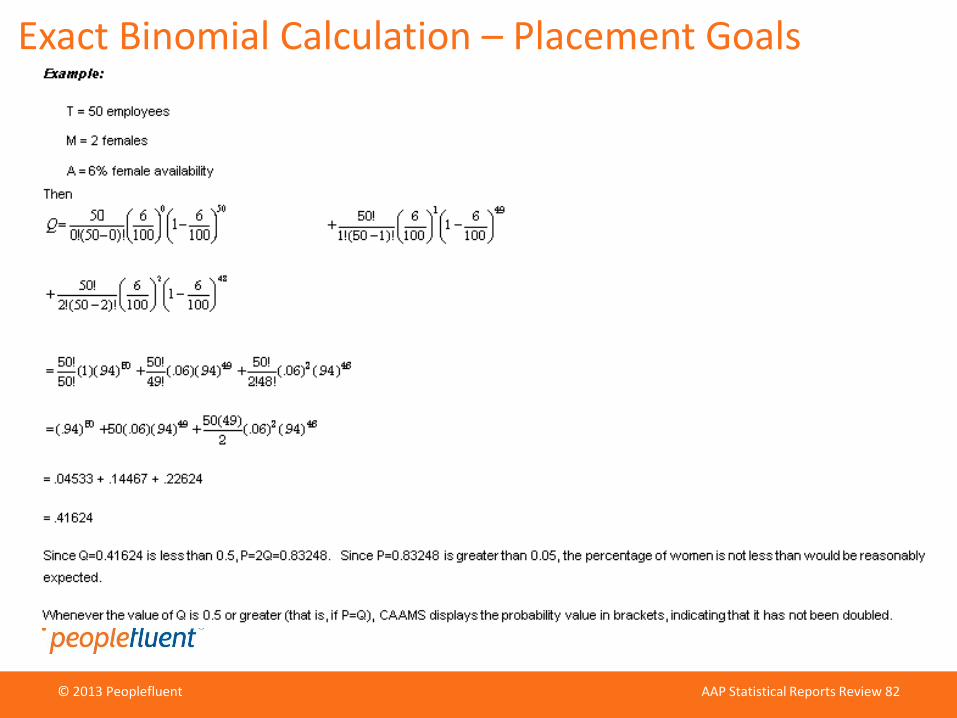
Exact Binomial Calculation – Placement Goals
© 2013 Peoplefluent
© 2012 Peoplefluent
AAP Statistical Reports Review 82
Exact Binomial Calculation – Placement Goals