AERMOD Experiences during the Birmingham Area Particle ... 9thconf oct 2008... · AERMOD...
49
adem.alabama.gov AERMOD Experiences during the Birmingham Area Particle Study (BAPS) EPA 9 th Modeling Conference October 9, 2008
Transcript of AERMOD Experiences during the Birmingham Area Particle ... 9thconf oct 2008... · AERMOD...

adem.alabama.gov
AERMOD Experiences during the Birmingham
Area Particle Study (BAPS)
EPA 9th Modeling ConferenceOctober 9, 2008

adem.alabama.gov
Background
• EPA designated Jefferson, Shelby, and a small portion of Walker counties as nonattainment for the annual standard effective April 5, 2005.
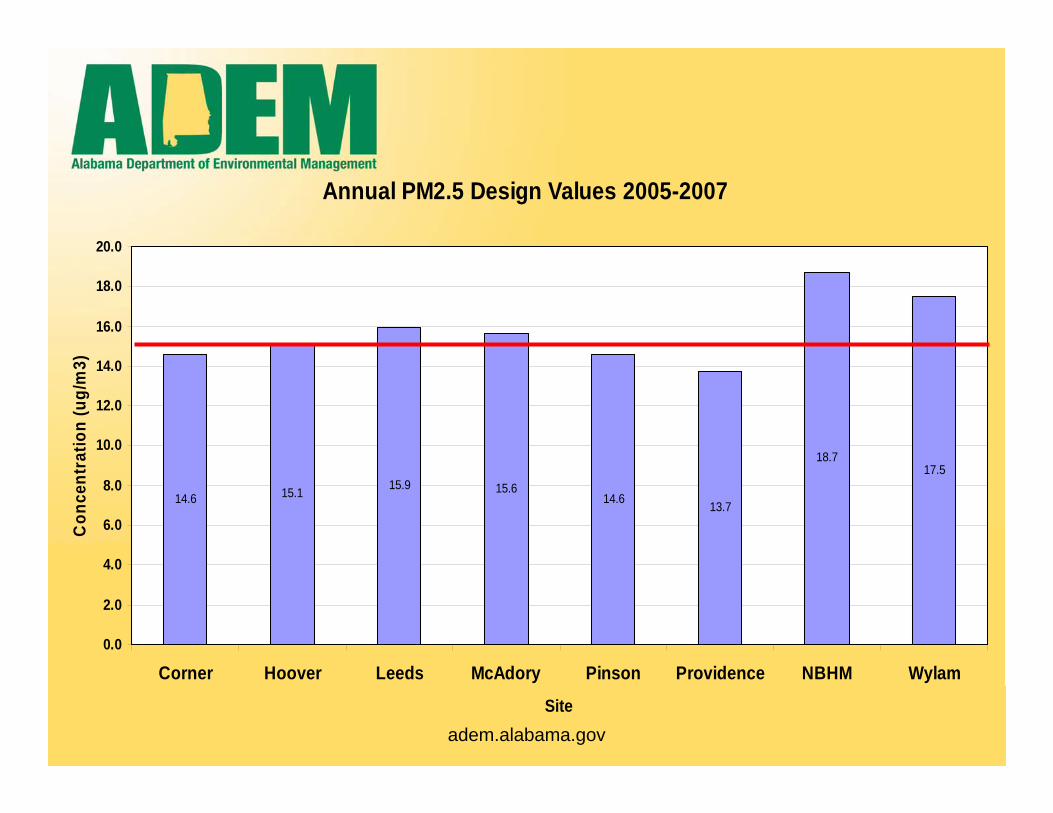
• Current PM2.5 Design Values – 2005-2007:– North Bham – 18.9 ug/m3 (18.7)– Wylam - 17.7 ug/m3 (17.5)
• NAAQS = 15 ug/m3

adem.alabama.gov
State Implementation Plan
• Contracted with ENVAIR to help identify causes of high PM2.5.
• Based on the conclusions of the ENVAIR study, the SIP focuses on reduction of emissions of fine particles in the area surrounding the North Birmingham and Wylam monitors.
• The plan also relies on reductions from national programs such as CAIR, and cleaner cars, diesels and fuels.
• Base Case 2002/2009/2012 modeling to help develop attainment plan is being completed using a CMAQ/AERMOD integrated approach in accordance with EPA implementation guidance.

adem.alabama.gov
Measurement Sites
840 860 880 900 920 940 960 980 1000 1020 1040-760
-740
-720
-700
-680
-660
-640
-620
-600
-580
Ashland
Gadsden
Birmingham North
route 8 Mcadory
1801 Bruce Shaw RdWylam
Hoover
PinsonWarrior
Tuscaloosa
Jasper
Childersburg
Birmingham North
1801 Bruce Shaw Rd
CTR
Birmingham PM2.5 Observation SitesFRMSTNSEARCH

adem.alabama.gov
Birmingham Area Design Values
15.9215.60Leeds
13.7513.4613.0712.3012.6314.08Providence
14.5914.5214.2213.5313.8714.95Corner
14.6014.4514.1813.5713.7214.72Pinson
15.6015.4915.0114.5914.7315.65McAdory
15.1215.1414.7614.3314.7316.18Hoover
17.4517.2816.4916.0516.7418.43Wylam
18.6718.5618.2417.531819.63North Bham
2005-2007
2004-2006
2003-2005
2002-2004
2001-2003
2000-2002Site
3 Year Avg.
adem.alabama.gov
Annual PM2.5 Design Values 2005-2007
14.6 15.1 15.9 15.614.6 13.7
18.717.5
0.0
2.0
4.0
6.0
8.0
10.0
12.0
14.0
16.0
18.0
20.0
Corner Hoover Leeds McAdory Pinson Providence NBHM Wylam
Site
Con
cent
ratio
n (u
g/m
3)

adem.alabama.gov
Modeling predicts that EPA’s adopted regulations for mobile sources and electric utilities will reduce regional and general urban PM by about 1 μg m–3.
Additional modeling suggests this may be higher, i.e. 1 – 1.5 μg m–3
This reduction will help, but is not likely to bring Wylam and North Birmingham into attainment by 2010
Are reductions of local PM possible? Need to understand what local PM is and where it comes from.
VISTAS/CAIR Modeling

adem.alabama.gov
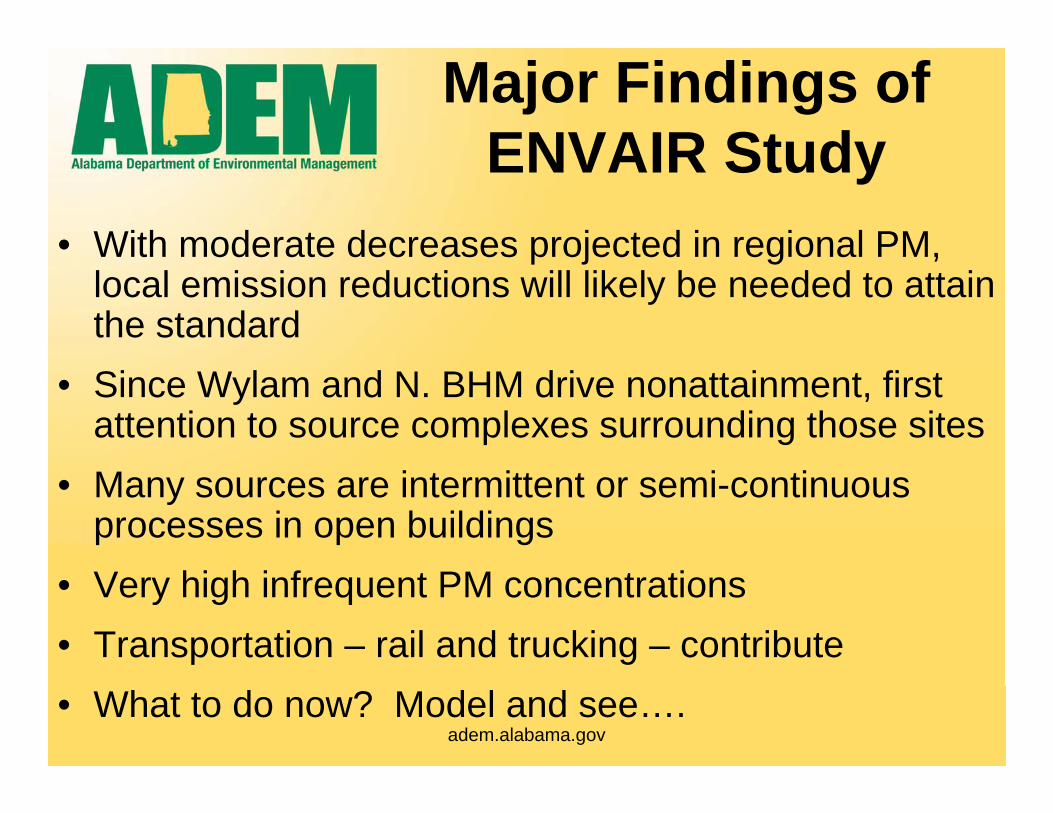
Major Findings of ENVAIR Study
• Nonattainment due to N. Birmingham & Wylam• Local and urban PM contributions are
superimposed on regional component– Regional - ~12-14 μg/m3
– General urban - ~2 μg/m3
– Local - ~3-4 μg/m3
• Multiple lines of evidence link local excess PM at Wylam and North Birmingham to several geographical source complexes
• Evidence includes wind directions, carbon compounds, elements (metals), day-of-week variations, fence-line samples, & PM spikes
adem.alabama.gov
• With moderate decreases projected in regional PM, local emission reductions will likely be needed to attain the standard
• Since Wylam and N. BHM drive nonattainment, first attention to source complexes surrounding those sites
• Many sources are intermittent or semi-continuous processes in open buildings
• Very high infrequent PM concentrations• Transportation – rail and trucking – contribute • What to do now? Model and see….
Major Findings of ENVAIR Study
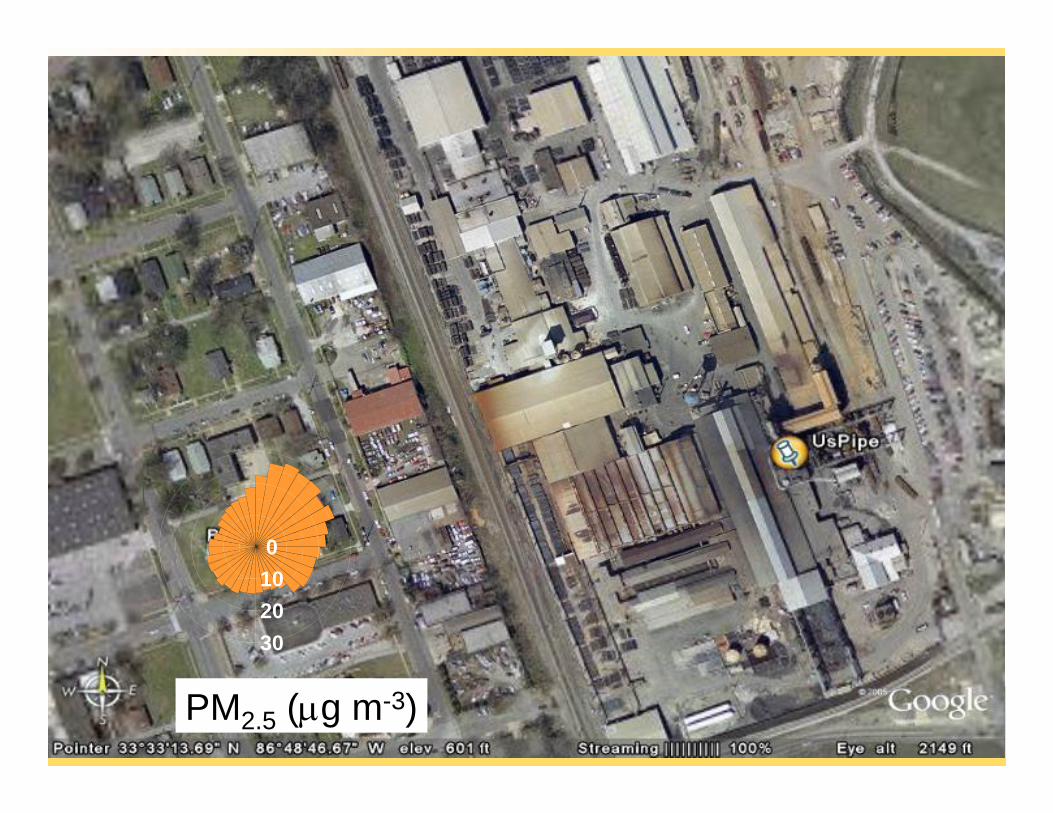
adem.alabama.govPM2.5 (μg m-3)
0102030

adem.alabama.gov
PM2.5 (μg m-3)0
102030
adem.alabama.gov
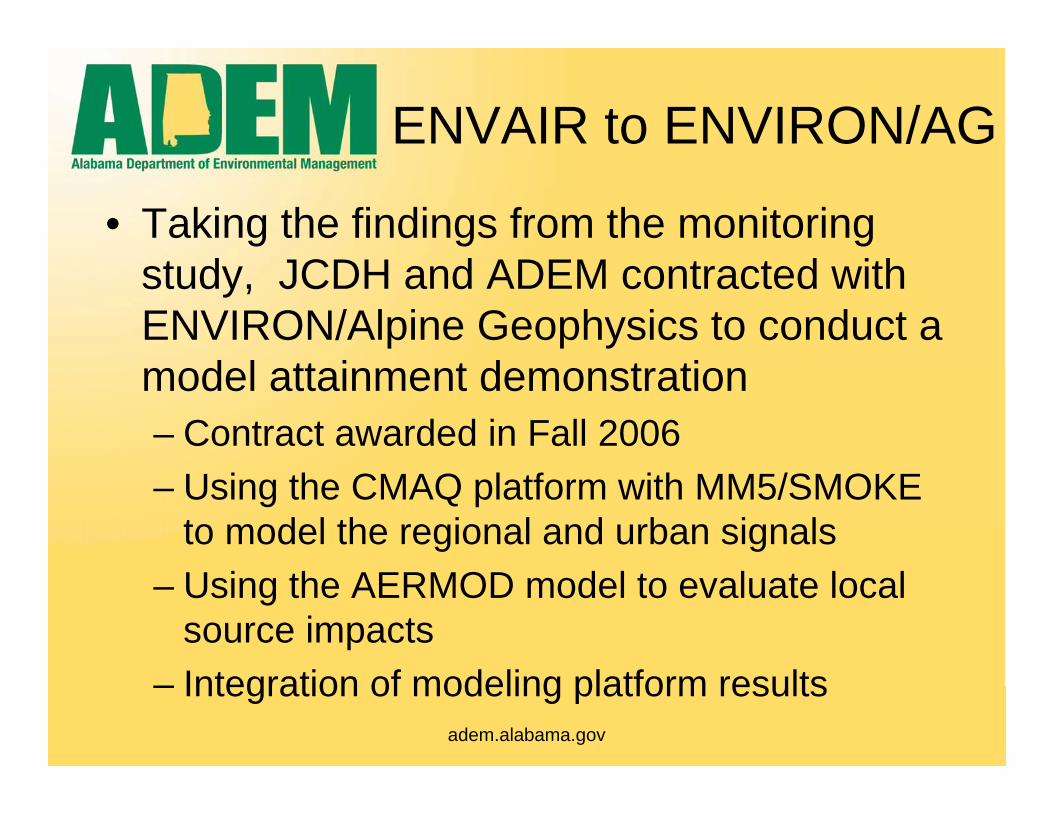
ENVAIR to ENVIRON/AG
• Taking the findings from the monitoring study, JCDH and ADEM contracted with ENVIRON/Alpine Geophysics to conduct a model attainment demonstration– Contract awarded in Fall 2006– Using the CMAQ platform with MM5/SMOKE
to model the regional and urban signals– Using the AERMOD model to evaluate local
source impacts– Integration of modeling platform results
adem.alabama.gov
What doesn’t kill you….
• This has been a learning process• Many different stakeholders• New territory for modeling• Uncertainty in emissions inventories• Uncertainty in modeling integration• Highly variable emissions from many types
of sources, many of whom have never been involved in a modeling study of this magnitude
• Sheer number of sources

adem.alabama.gov
Emissions Inventory Development
• Multiple 2002, 2009, and 2012 CMAQ and AERMOD inventories have been developed to identify direct, inert PMfine emissions– Much bigger challenge than expected– Many sources never modeled with this much detail
and scrutiny– Emissions factors for PM2.5 poorly defined, if even
available– Needed to weigh a perfect inventory against time and
resource constraints– Known errors in emissions are being corrected in the
final runs– Small sources may have significant impacts

adem.alabama.gov
Emissions Inventory Issues
• Mistakes were made by both the regulatory agencies as well as the facilities. This is due in large part, to the lack of understanding of what is needed to model at this level– For transparency, we insisted on active involvement of facilities. – If we had known how difficult it would be, we might have contracted for
the inventory development.
• This led to multiple revisions of the 2002, 2009 and 2012 SMOKE runs
• SMOKE outputs were run through CAMx to produce consistent hourly emissions profiles to be input into AERMOD

adem.alabama.gov
AERMOD Modeling
• Our studies showed a clear “local sources”signature, especially for primary PM2.5.
• CMAQ, even with 4 km grid spacing, was not considered adequate to resolve impacts due to local emission controls.
• AERMOD selected as the best way to model the significant industrial contributors.
• Which local sources should be modeled?

adem.alabama.gov
AERMOD Modeling Local Source Criteria
• No established criteria- all new territory.• Based on the results of the ENVAIR study, it was assumed
that every source identified by the study would be included.• Any source within 5 km of either monitor with PM2.5
emissions greater than 1 tpy (~1/4 lb/hr) was included.• Between 5 – 10 km of either monitor, any source with PM2.5
emissions greater than 4 tpy (~1 lb/hr) was included.• A Q/d and Q/d2 analyses supported the above criteria fairly
well.• Total of 46 facilities identified; roughly 1200 individual
emitting sources. Included point, area, volume and buoyant lines.

adem.alabama.gov
AERMOD Modeling Grid
• Initial discussions with EPA and among the study participants led to a 1 km X 1 km AERMOD receptor grid with 100 meter spacing
• Plant property issues
• Additional discussion led to agreement on a 300 m X 300 m Cartesian grid with 100 meter spacing.
• For the attainment demonstration, concentrations will be averaged across all receptors
• For culpability and RACT, concentrations at the monitor were used

adem.alabama.gov
AERMOD Met Data
• Used 2002 met data – same as base case emission data year.
• Options– Conventional NWS ASOS data at Birmingham airport
(BHM) – 7 – 18 km from key monitors.– SEARCH site wind data at North Bham monitor.– Hourly-averaged ASOS data at BHM.
• Choice – hybrid of hourly ASOS data augmented by conventional ASOS data as necessary. SEARCH data had too many holes and quality questions. OAQPS invaluable in developing the hybrid data set.

adem.alabama.gov
AERMOD Met DataNBHM PM2.5 - AERMOD PREDICTIONS VS. OBSERVED - LIGHT
WINDS IMPACT STUDY (Q1 2002)
0
20
40
60
80
100
BHM_1-min BHM_ISHD NBHM PM2.5 SEARCH(1.0) SEARCH(.28)

adem.alabama.gov
AERMOD Overview
AERMOD run for local significant facilities– ADEM assessed “significance” and
determined facility list for AERMOD– Only primary PM2.5 was simulated– Wind inputs generated using draft EPA
1-minute ASOS data methodology– For 2002 MPE, 24-hr concentrations
saved at WYLM and NBHM monitor coordinates

adem.alabama.gov
AERMOD Overview
Thus, we expect AERMOD to predict lower concentrations than daily FRM observations
– Observation-based analyses (ENVAIR Study) suggest annual local industrial contribution is
• ~3 ug/m3 at NBHM• ~2 ug/m3 at WYLM
But we recognize AERMOD is considered a“conservative” (high) model

adem.alabama.gov
AERMOD Results
5.316.47Annual
4.936.094th
5.176.483rd
5.737.022nd
5.46.271st
WYLM
19.6733.49Annual
21.3335.874th
22.1837.663rd
20.1634.692nd
15.0225.741st
NBHM
2009 Quarterly PM2.5Concentration
2002 Quarterly PM2.5ConcentrationQuarterMonitor
adem.alabama.gov
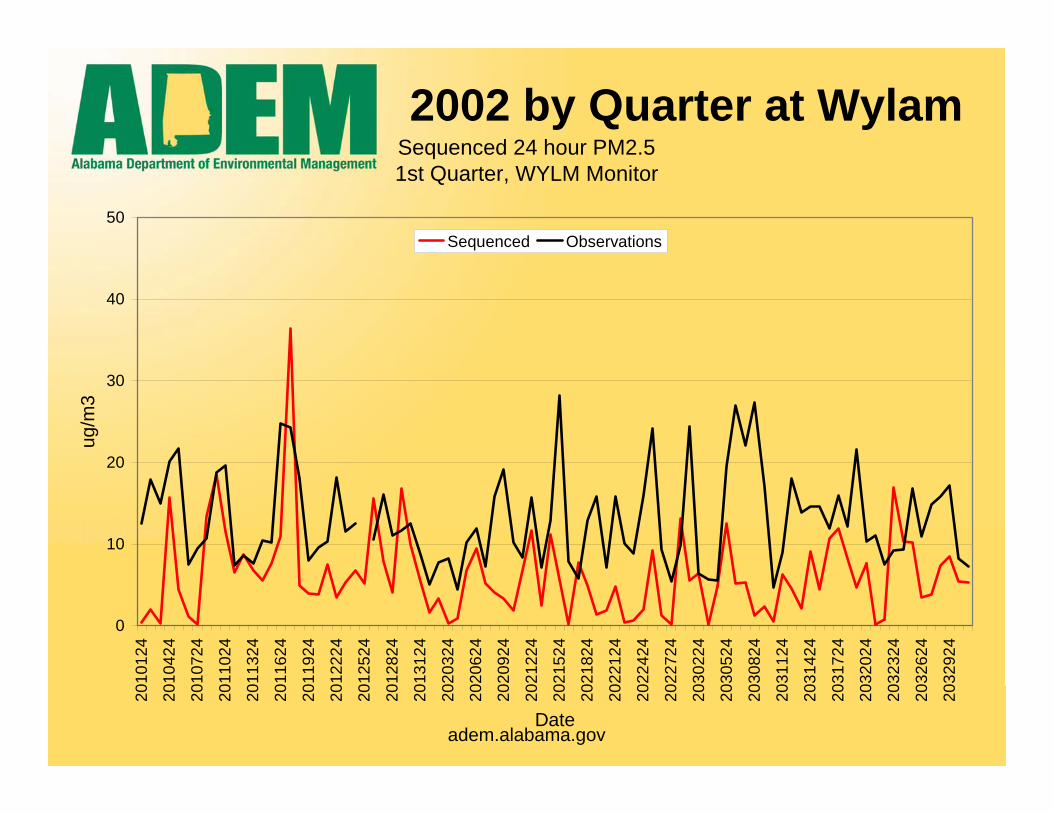
2002 by Quarter at WylamSequenced 24 hour PM2.51st Quarter, WYLM Monitor
0
10
20
30
40
50
2010
124
2010
424
2010
724
2011
024
2011
324
2011
624
2011
924
2012
224
2012
524
2012
824
2013
124
2020
324
2020
624
2020
924
2021
224
2021
524
2021
824
2022
124
2022
424
2022
724
2030
224
2030
524
2030
824
2031
124
2031
424
2031
724
2032
024
2032
324
2032
624
2032
924
Date
ug/m
3
Sequenced Observations

adem.alabama.gov
Sequenced 24 hour PM2.52nd Quarter, WYLM Monitor
0
10
20
30
40
50
2010
124
2010
424
2010
724
2011
024
2011
324
2011
624
2011
924
2012
224
2012
524
2012
824
2013
124
2020
324
2020
624
2020
924
2021
224
2021
524
2021
824
2022
124
2022
424
2022
724
2030
224
2030
524
2030
824
2031
124
2031
424
2031
724
2032
024
2032
324
2032
624
2032
924
Date
ug/m
3
Sequenced Observations
2002 by Quarter at Wylam

adem.alabama.gov
2002 by Quarter at WylamRanked 24 hour PM2.5
1st Quarter, WYLM Monitor
0
10
20
30
40
50
1 4 7 10 13 16 19 22 25 28 31 34 37 40 43 46 49 52 55 58 61 64 67 70 73 76 79 82 85 88
Rank
ug/m
3
Ranked Observations

adem.alabama.gov
Ranked 24 hour PM2.53rd Quarter, WYLM Monitor
0
10
20
30
40
50
1 4 7 10 13 16 19 22 25 28 31 34 37 40 43 46 49 52 55 58 61 64 67 70 73 76 79 82 85 88 91
Rank
ug/m
3
Ranked Observations
2002 by Quarter at Wylam

adem.alabama.gov
2002 Wylam Frequency Distribution
Annual Frequency DistributionW YLM
0
20
40
60
80
100
120
140
160
0-5 5-10 10-15 15-20 20-25 25-30 30-35 35-40 40-45 45-50 >50
ug/m3
Freq
uenc
y
Obs AERMOD

adem.alabama.gov
WYLM Results
Agrees with expected patterns (good)– Always lower than daily FRM total obs
• Expected local industry contributions are ~2 ug/m3
• AERMOD annual mean is ~ 6.5 ug/m3– AERMOD is rarely >10x the assumed
local component (4 days)• >5x local component 20% of the year
– Annual frequency distribution is heavy in the 0-10 ug/m3 range

adem.alabama.gov
2002 by Quarter at NBHM
Sequenced 24 hour PM2.52nd Quarter, NBHM Monitor
0
20
40
60
80
100
120
140
160
2040
124
2040
424
2040
724
2041
024
2041
324
20416
2420
41924
20422
2420
42524
20428
2420
50124
20504
2420
50724
20510
2420
51324
20516
2420
51924
20522
2420
52524
20528
2420
53124
20603
2420
60624
20609
2420
6122
420
6152
420
6182
420
6212
420
6242
420
6272
4
Date
ug/m
3
Sequenced Observations

adem.alabama.gov
Sequenced 24 hour PM2.53rd Quarter, NBHM Monitor
0
20
40
60
80
100
120
140
160
2070
124
2070
424
2070
724
2071
024
2071
324
2071
624
2071
924
2072
224
2072
524
2072
824
2073
124
2080
324
2080
624
2080
924
2081
224
2081
524
2081
824
2082
124
2082
424
2082
724
2083
024
2090
224
2090
524
2090
824
2091
124
2091
424
2091
724
2092
024
2092
324
2092
624
Date
ug/m
3
Sequenced Observations
2002 by Quarter at NBHM

adem.alabama.gov
2002 by Quarter at NBHMRanked 24 hour PM2.5
3rd Quarter, NBHM Monitor
0
20
40
60
80
100
120
140
160
1 4 7 10 13 16 19 22 25 28 31 34 37 40 43 46 49 52 55 58 61 64 67 70 73 76 79 82 85 88 91
Rank
ug/m
3
Ranked Observations
adem.alabama.gov
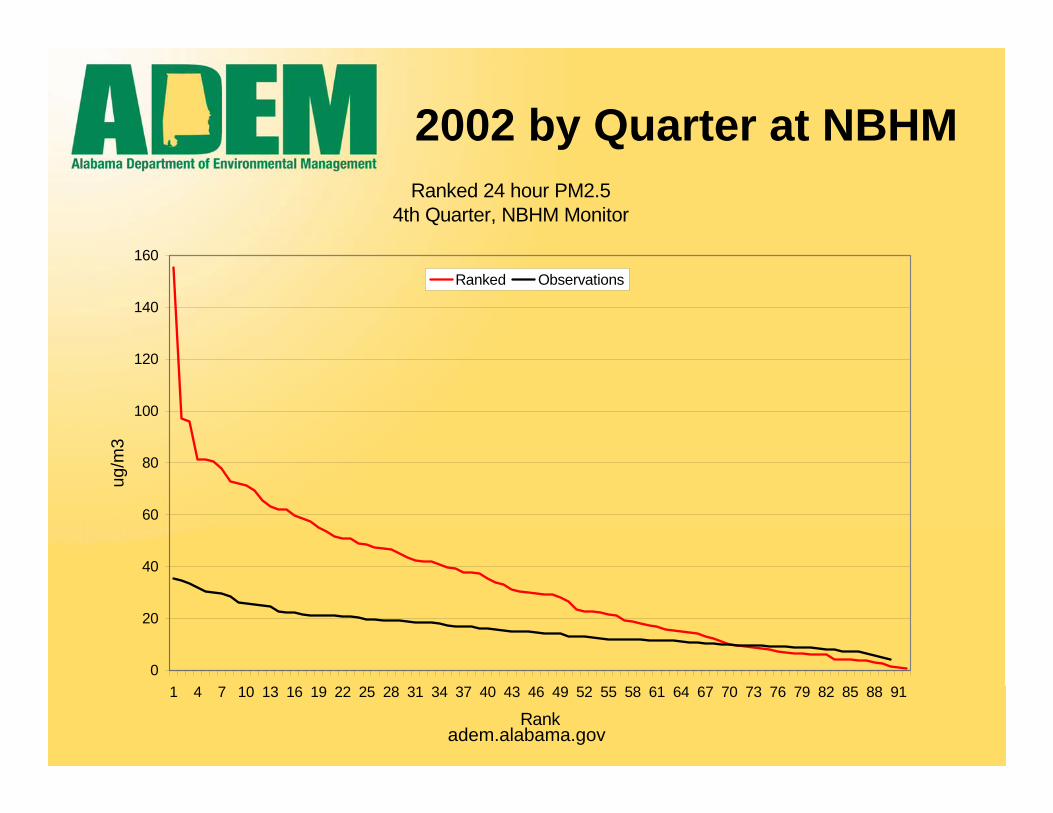
2002 by Quarter at NBHMRanked 24 hour PM2.5
4th Quarter, NBHM Monitor
0
20
40
60
80
100
120
140
160
1 4 7 10 13 16 19 22 25 28 31 34 37 40 43 46 49 52 55 58 61 64 67 70 73 76 79 82 85 88 91
Rank
ug/m
3
Ranked Observations

adem.alabama.gov
2002 NBHM Frequency Distribution
Annual Frequency DistributionNBHM
0
10
20
30
40
50
60
70
80
90
100
0-5 5-10 10-15 15-20 20-25 25-30 30-35 35-40 40-45 45-50 >50
ug/m3
Freq
uenc
y
Obs AERMOD
adem.alabama.gov
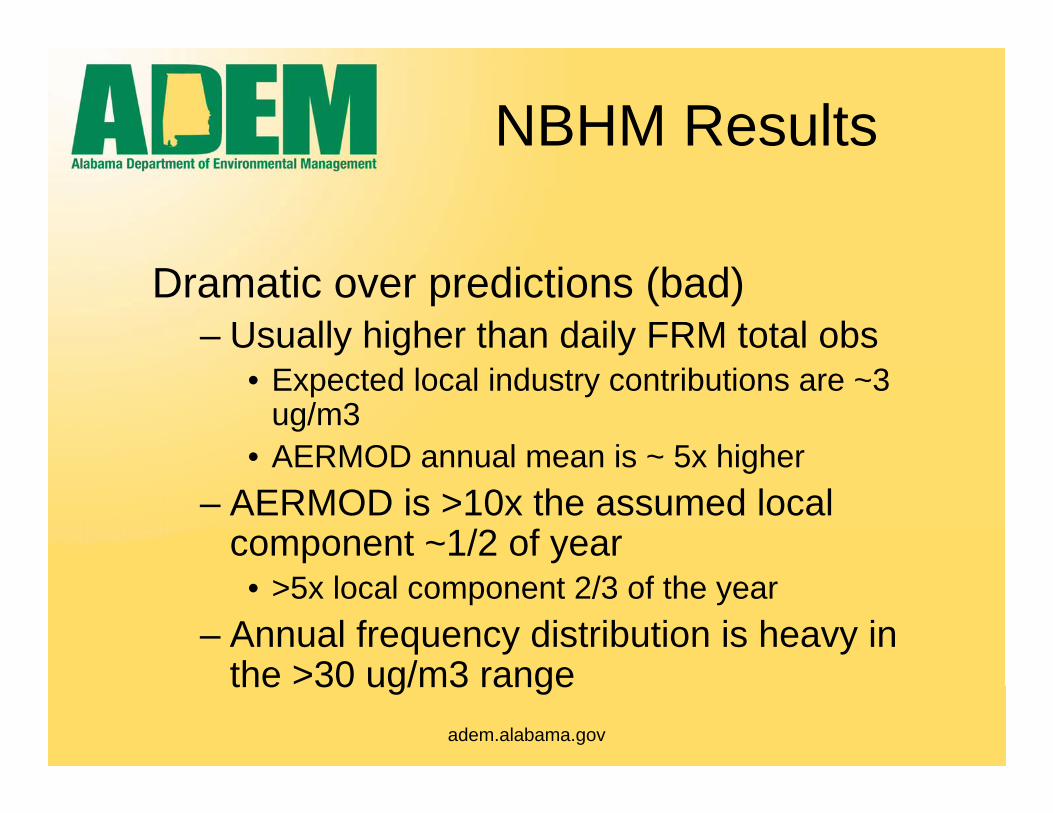
NBHM Results
Dramatic over predictions (bad)– Usually higher than daily FRM total obs
• Expected local industry contributions are ~3 ug/m3
• AERMOD annual mean is ~ 5x higher– AERMOD is >10x the assumed local
component ~1/2 of year• >5x local component 2/3 of the year
– Annual frequency distribution is heavy in the >30 ug/m3 range
adem.alabama.gov
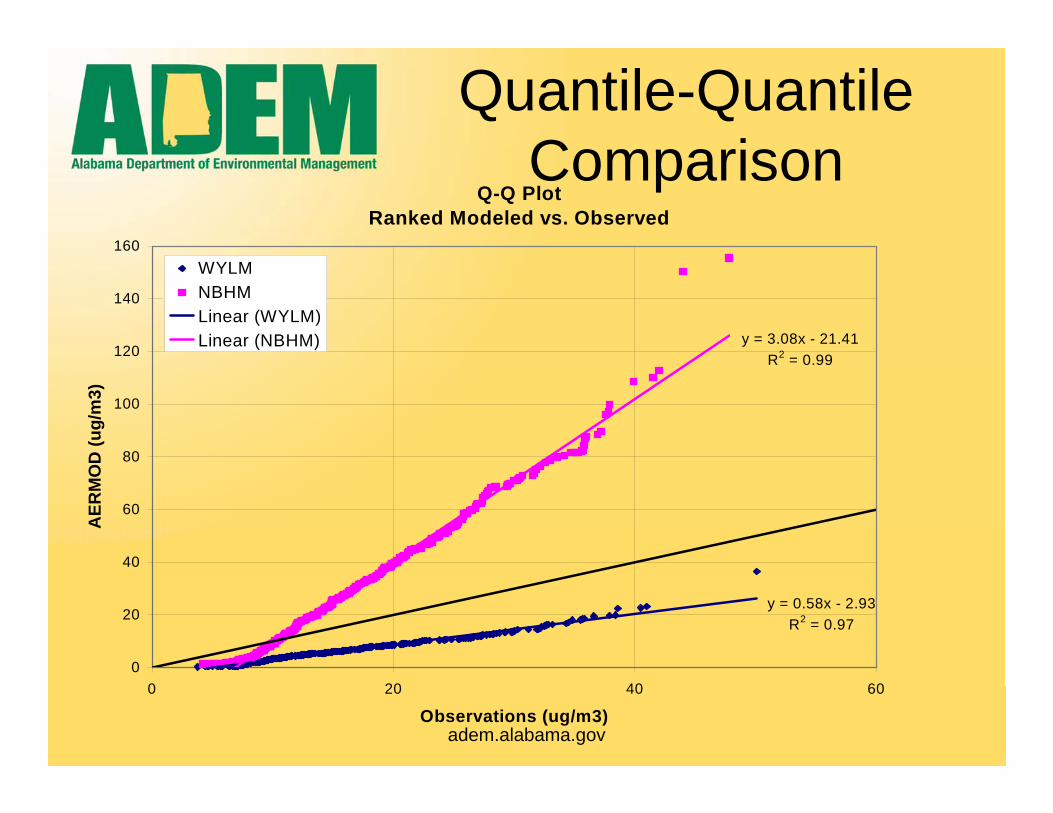
Quantile-QuantileComparison
Q-Q PlotRanked Modeled vs. Observed
y = 0.58x - 2.93R2 = 0.97
y = 3.08x - 21.41R2 = 0.99
0
20
40
60
80
100
120
140
160
0 20 40 60
Observations (ug/m3)
AER
MO
D (u
g/m
3)
WYLMNBHMLinear (WYLM)Linear (NBHM)

adem.alabama.gov
Conclusions• Q-Q plot shows a marked difference in
the character of AERMOD prediction between NBHM and WYLM– NBHM shown to be dominated by facilities
in very close proximity– Are sources characterized adequately?– Should we expect AERMOD to perform
poorly for certain source configurations?– What are our expectations from AERMOD?
adem.alabama.gov
Conclusions, cont.• Additional revisions to source characterizations
have been made, and emission rates have been revised
• Will these changes affect AERMOD performance?• Unknown
• Hope to show compliance with CMAQ alone• Think that future modeling exercises like this should
focus on refining photochemical models to handle at very small grid scales– Don’t feel this is the best use of these models

adem.alabama.gov
• AERMOD was run for selected local sources for the 2002 and 2009 bases to simulate the dispersion of primary inert PM2.5.
• CMAQ was run to simulate the dispersion of urban and regional scale primary as well as secondary emissions of PM.– Secondary and gaseous PM from all facilities
• CMAQ was run twice for the 2002 and 2009 bases– Each base year was run once with all sources and once without the
AERMOD sources– Additional runs, including alternate future years, are being
considered• The results of the combination of CMAQ and AERMOD
were used to obtain the future year projections of PM2.5.
CMAQ - AERMOD Integration
adem.alabama.gov
• Followed EPA’s modeling guidance
• EPA’s involvement has been invaluable– Met data– Modeling assistance– Discussion on issues such as source
characterization, policy implications and model performance
• Even with this involvement, it is still difficult to determine whether this is an appropriate application of the model for this situation.
CMAQ - AERMOD Integration

adem.alabama.gov
2009 DV ProjectionsCirca Spring 2008
• CMAQ “all-source” runs– 1x1 and 3x3 grid cell averaging around
NBHM and WYLM• CMAQ + AERMOD runs

adem.alabama.gov
CMAQ "All Source" 2009 DV Projection (3x3 cell average)
0.00
5.00
10.00
15.00
20.00
2002 NBHM 2009 NBHM 2002 WYLM 2009 WYLM
Ann
ual C
once
ntra
tion
(ug/
m3)
PBWNH4NO3SO4OCECCrustal
18.4
15.5
17.116.7

adem.alabama.gov
CMAQ + AERMOD 2009 DV Projection (3x3 cell average)
0.00
5.00
10.00
15.00
20.00
2002 NBHM 2009 NBHM 2002 WYLM 2009 WYLM
Ann
ual C
once
ntra
tion
(ug/
m3)
PBWNH4NO3SO4OCECCrustalLocal
18.4
15.0
17.1
15.7

adem.alabama.gov
2009 CMAQ“All-Source” Projection
3x3 averaging
2002 2009 ReductionN. Bham. 18.4 16.7 -1.7McAdory 15.0 13.8 -1.2
Providence 13.0 11.7 -1.3Wylam 17.1 15.5 -1.6Hoover 15.1 13.7 -1.4Pinson 14.0 12.6 -1.4Corner 14.1 12.6 -1.5
adem.alabama.gov
ASIP Modeling Results
• Updated modeling for 2012 (12km) accomplished by ASIP in July/August for GA and AL SIPs
• All states provided updated emissions inventories• Alabama rolled in the “to-date” 2002 BAPSinventory
• CAIR controls assumed

adem.alabama.gov
ASIP Modeling Results• The 2012 results are promising
– It’s important not to look to closely at the number per se, but rather the reduction
–2002/2009 results used different emissions inventories than the 2012 (VISTAS vs. BAPS)
–Still, we think the results show that controls in GA and AL will help bring the area into attainment
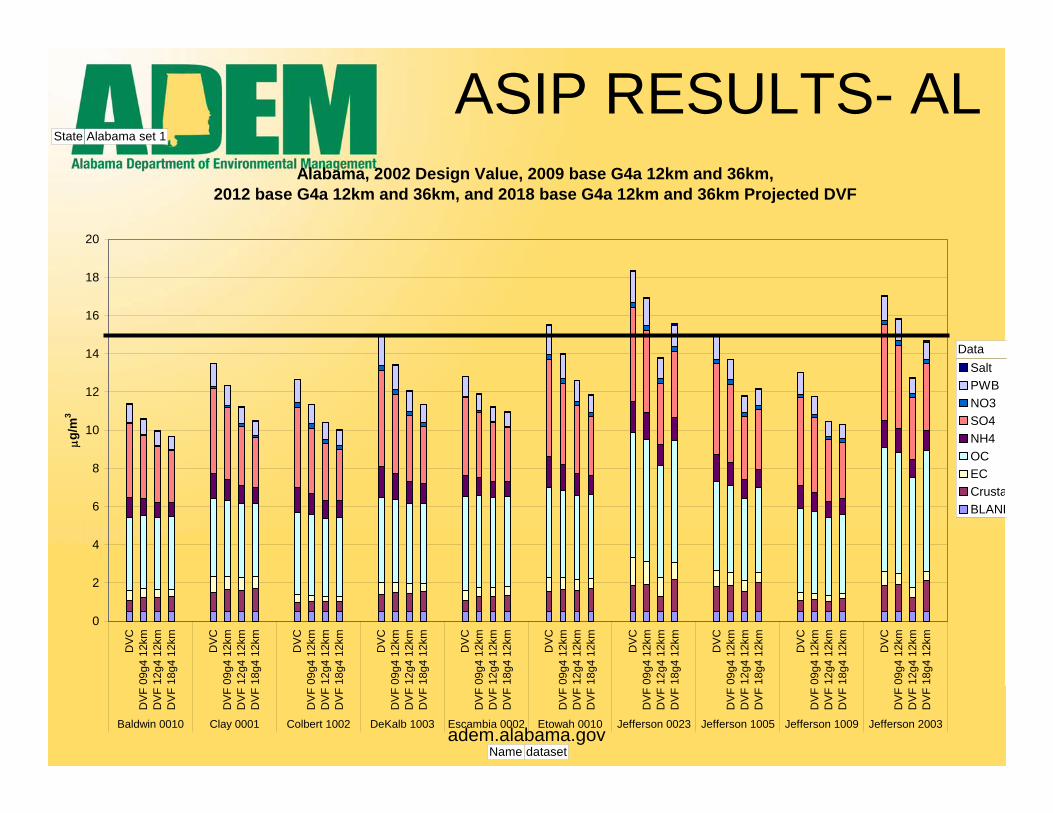
• The following chart illustrates the 2002 Base, 2009 Best and Final, 2012 Initial, 2018 Best and Final results for Alabama assuming CAIR implementation.
adem.alabama.gov
ASIP RESULTS- ALAlabama, 2002 Design Value, 2009 base G4a 12km and 36km,
2012 base G4a 12km and 36km, and 2018 base G4a 12km and 36km Projected DVF
0
2
4
6
8
10
12
14
16
18
20
DV
CD
VF
09g4
12k
mD
VF
12g4
12k
mD
VF
18g4
12k
m
DV
CD
VF
09g4
12k
mD
VF
12g4
12k
mD
VF
18g4
12k
m
DV
CD
VF
09g4
12k
mD
VF
12g4
12k
mD
VF
18g4
12k
m
DV
CD
VF
09g4
12k
mD
VF
12g4
12k
mD
VF
18g4
12k
m
DV
CD
VF
09g4
12k
mD
VF
12g4
12k
mD
VF
18g4
12k
m
DV
CD
VF
09g4
12k
mD
VF
12g4
12k
mD
VF
18g4
12k
m
DV
CD
VF
09g4
12k
mD
VF
12g4
12k
mD
VF
18g4
12k
m
DV
CD
VF
09g4
12k
mD
VF
12g4
12k
mD
VF
18g4
12k
m
DV
CD
VF
09g4
12k
mD
VF
12g4
12k
mD
VF
18g4
12k
m
DV
CD
VF
09g4
12k
mD
VF
12g4
12k
mD
VF
18g4
12k
m
Baldwin 0010 Clay 0001 Colbert 1002 DeKalb 1003 Escambia 0002 Etowah 0010 Jefferson 0023 Jefferson 1005 Jefferson 1009 Jefferson 2003
μg/m
3
SaltPWBNO3SO4NH4OCECCrustaBLANK
State Alabama set 1
Name dataset
Data
adem.alabama.gov
Determination of Attainment Year
• ADEM will propose an attainment date that represents attainment as expeditiously as practicable based on implementation of existing Federal and State measures and all new reasonable local measures.
•We believe that 2012 will represent the best future year for theBirmingham NAA•However, we will model both future years and develop RRF’s(2009 and 2012)
• In our 2009 basecase, we will account for controls already on the books such as CAIR and mobile source controls, as well as local industry controls implemented between 2002 and 2009.
• Same for 2012

adem.alabama.gov
Final Attainment Plan
• The process of identifying significant contributors and candidate control strategies will continue until an emissions reduction plan is developed that demonstrates attainment.
• JCDH will modify permits to reflect final emission controls.