Advanced Info Services (ADVANC TB) - · PDF...
14
See important disclosures at the end of this report Powered by EFA Platform 1 Results Review, 11 May 2015 Advanced Info Service (ADVANC TB) Buy (Maintained) Communications - Telecommunications Target Price: THB279.00 Market Cap: USD21,110m Price: THB238.00 รายได้บริการในรอบไตรมาส 1/58 แข็งแกร่ง Macro Risks Growth Value 70 75 80 85 90 95 100 105 190 200 210 220 230 240 250 260 Advanced Info Services (ADVANC TB) Price Close Relative to Stock Exchange of Thailand Index (RHS) 5 10 15 20 25 30 35 40 May-14 Jul-14 Sep-14 Nov-14 Jan-15 Mar-15 Vol m Source: Bloomberg Avg Turnover (THB/USD) 1,129m/34.6m Cons. Upside (%) 5.0 Upside (%) 17.2 52-wk Price low/high (THB) 202 - 255 Free float (%) 51 Share outstanding (m) 2,973 Shareholders (%) InTouchPlc 42.5 SingTel 21.3 Share Performance (%) YTD 1m 3m 6m 12m Absolute (5.2) (2.1) (3.7) 2.1 3.9 Relative (5.2) 0.9 3.5 7.2 (4.8) Shariah compliant Veena Naidu License No. 24418, 66 2862 9752 [email protected] Jeffrey Tan +603 9207 7633 [email protected] Vikran Lumyai Source: Company data, RHB มูลค่ากาไรจากการดาเนินงานในไตรมาส 1/58 เพิ่มขึ้น 3.7% y-o-y เป็ น 9.76 พันล ้าน บาทเป็นไปตามคาดจากรายได้บริการที่เติบโตแข็งแกร่ง (4.6% y-o-y) ยังคงแนะนา “ซื้อ” ที่ราคาเป้าหมายเท่ากับ 279.00 บาท (17% upside) โดยอัตราการใช้บริการ สมาร์ทโฟน 3G เพิ่มขึ้นเป็ น 58% (22.5 ล้านเครื่อง) ด้วยอานิสงส์จากอัตรา ค่าธรรมเนียมสัมปทานที่ลดลง (-23% y-o-y) ส่วนประเด็นสาคัญได้แก่แผนการขาย สินทรัพย์ลงทุนจากการให้บริการ bundle (ของระบบมือถือ, FBB และ Wifi) รวมทั้ง แผนการเพิ่มอัตราการใช ้บริการ 3G handset ขึ้นเป็ น 70% ภายในปลายปี โมเมนตัมยังแข็งแกร่ง มูลค่ากาไรจากการดาเนินงานในไตรมาส 1/58 เท่ากับ 9.76 พันล้านบาท (+ 3.7% y-o-y) เป็นไปตามคาด หรือคิดเป็ นสัดส่วน 22%/24% ของประมาณการ ของเราและ consensus ตามลาดับ โดยรายได้บริการเพิ่มขึ้น 4.6% เทียบกับ DTAC ที่ติดลบ (-3.6%, “ซื้อ” ราคาเป้าหมาย 109.00 บาท) มากกว่าเป้าบริษัท ราว 3-4% ส่วน รายได ้ voice ลดลงในอัตราที่ชะลอตัว (1Q15:-14.2%, 4Q14: - 15%) จากแนวโน้มการฟื้นตัวทางเศรษฐกิจ ทั้งนี้ ด ้วยงบลงทุนเครือข่ายที่เพิ่มขึ้น และค่าเสื่อมราคาจากการขยายเครือข่ายได ้รับการชดเชยจากต ้นทุนค่าสัมปทานที่ ลดลง 23% โดย ต ้นทุนค่าธรรมเนียมสัมปทานคิดเป็ นสัดส่วน 14.2% ของรายได ้ บริการ จากระดับปกติที่ 14.6% ในไตรมาส 4/14 (1Q14: 19.3%) ทาให ้ EBITDA margin ทรงตัวที่ 55% จากเดิม 54.9% ในไตรมาสที่ผ่านมา ความต้องการใช้บริการ data เพิ่มข ึ้น รายได ้ non-voice ยังคงเพิ่มขึ้นต่อเนื่อง 33.7% y-o-y (4Q14: 40.7%) ได ้รับ อานิสงส์จากราคาสมาร์ทโฟนที่ลดลงและความนิยมการใช ้บริการโซเชียลมีเดียที่ เพิ่มขึ้น โดยคิดเป็นสัดส่วนราว 35% ของรายได้บริการ เพิ่มขึ้นจากเดิม 25% ใน ไตรมาส 1/14 (4Q14: 33%) ส่วนรายได ้ data คิดเป็นสัดส่วนมากถึง 83% ของ รายได้บริการรวมจากการใช้บริการ data ต่อเลขหมาย (VoU) ที่เพิ่มขึ้น 10% y- o-y เป็ น 1.63GB/เดือน (4Q14: 1.48GB) ปร ับท ิ้ง SIM ที่ไม่ active ออกไป AIS ได ้ทาการปรับทิ้ง SIM บนบริการ prepaid ออกไปราว 4.3 ล้านเลขหมายฉุด ให ้ผู ้ใช ้บริการรวม (total sub.) ลดลงราว 2.35 ล้านเลขหมาย หรือคิดเป็นอัตรา การเพิ่มขึ้นสุทธิราว 1.83 ล้านเลขหมายในไตรมาสนี้ ในขณะที่ prepaid ARUP และ MOU เพิ่มขึ้นชั่นคราว ยังคงแนะนา “ซื้อ” เรายังคงประมาณการกาไรในรอบปี 2558/59 (+19.4%, +9.7% y-o-y) ด ้วย ราคาเป้าหมายคานวณจากวิธี DCF เท่ากับ 279.00 บาท (WACC 8.9%, TG 1.5%) อิงจากค่า PE ปี 2558 ที่ 16x และด้วยผลประกอบการไตรมาส 1/58 ที่ แข็งแกร่ง เราเชื่อว่าผู้บริหารจะสามารถดาเนินตามเป้าที่วางไว้คือ ( i) รายได ้ บริการเพิ่มขึ้น 4-5% เป็ นไปในทิศทางเดียวกันกับคาดการณ์ของเราที่ 4.4% (ii) อัตราการใช ้บริการสมาร์ทโฟนบนเครือข่าย 3G ที่ 70% (1Q15: 58%) (iii) CAPEX ราว 4.0 หมื่นล้านบาทจากการขยายฐานโครงข่าย 29000 แห่ง (1Q15: 22800 แห่ง) และเป้า FBB ที่ 80000 เลขหมายภายในปี 2558) Forecasts and Valuations Dec-12 Dec-13 Dec-14 Dec-15F Dec-16F Total turnover (THBm) 141,568 146,811 148,728 149,859 151,662 Reported net profit (THBm) 34,883 36,274 36,034 43,830 48,099 Recurring net profit (THBm) 34,883 36,274 36,697 43,830 48,099 Recurring net profit growth (%) 31.1 4.0 1.2 19.4 9.7 Recurring EPS (THB) 11.7 12.2 12.3 14.7 16.2 DPS (THB) 10.9 12.1 11.7 14.7 16.2 Recurring P/E (x) 20.2 19.4 19.2 16.1 14.6 P/B (x) 16.3 15.4 15.1 13.8 13.3 P/CF (x) 13.9 13.8 11.4 11.7 10.7 Dividend Yield (%) 4.6 5.1 4.9 6.2 6.8 EV/EBITDA (x) 11.5 11.3 10.9 9.6 9.2 Return on average equity (%) 84.5 81.4 77.9 89.7 92.5 Net debt to equity (%) net cash 25.3 40.1 78.3 84.5 Our vs consensus EPS (adjusted) (%) 3.0 2.0
Transcript of Advanced Info Services (ADVANC TB) - · PDF...
See important disclosures at the end of this report Powered by EFATM
Platform 1
Results Review, 11 May 2015
Advanced Info Service (ADVANC TB) Buy (Maintained) Communications - Telecommunications Target Price: THB279.00
Market Cap: USD21,110m Price: THB238.00
รายไดบรการในรอบไตรมาส 1/58 แขงแกรง
Macro
2.00
Risks
2.00
Growth
2.00
Value
2.00
70
75
80
85
90
95
100
105
190
200
210
220
230
240
250
260
Advanced Info Services (ADVANC TB)Price Close Relative to Stock Exchange of Thailand Index (RHS)
5
10
15
20
25
30
35
40
Ma
y-1
4
Jul-1
4
Sep-1
4
No
v-1
4
Jan-1
5
Ma
r-1
5
Vol m
Source: Bloomberg
Avg Turnover (THB/USD) 1,129m/34.6m
Cons. Upside (%) 5.0
Upside (%) 17.2
52-wk Price low/high (THB) 202 - 255
Free float (%) 51
Share outstanding (m) 2,973
Shareholders (%)
InTouchPlc 42.5
SingTel 21.3
Share Performance (%)
YTD 1m 3m 6m 12m
Absolute (5.2) (2.1) (3.7) 2.1 3.9
Relative (5.2) 0.9 3.5 7.2 (4.8)
Shariah compliant
Veena Naidu License No. 24418, 66 2862 9752
Jeffrey Tan +603 9207 7633
Vikran Lumyai
Source: Company data, RHB
มลคาก าไรจากการด าเนนงานในไตรมาส 1/58 เพมขน 3.7% y-o-y เปน 9.76 พนลานบาทเปนไปตามคาดจากรายไดบรการทเตบโตแขงแกรง (4.6% y-o-y) ยงคงแนะน า “ซอ” ทราคาเปาหมายเทากบ 279.00 บาท (17% upside) โดยอตราการใชบรการสมารทโฟน 3G เพมขนเปน 58% (22.5 ลานเครอง) ดวยอานสงสจากอตราคาธรรมเนยมสมปทานทลดลง (-23% y-o-y) สวนประเดนส าคญไดแกแผนการขาย
สนทรพยลงทนจากการใหบรการ bundle (ของระบบมอถอ, FBB และ Wifi) รวมทงแผนการเพมอตราการใชบรการ 3G handset ขนเปน 70% ภายในปลายป โมเมนตมยงแขงแกรง
มลคาก าไรจากการด าเนนงานในไตรมาส 1/58 เทากบ 9.76 พนลานบาท (+3.7% y-o-y) เปนไปตามคาด หรอคดเปนสดสวน 22%/24% ของประมาณการของเราและ consensus ตามล าดบ โดยรายไดบรการเพมขน 4.6% เทยบกบ DTAC ทตดลบ (-3.6%, “ซอ” ราคาเปาหมาย 109.00 บาท) มากกวาเปาบรษทราว 3-4% สวน รายได voice ลดลงในอตราทชะลอตว (1Q15:-14.2%, 4Q14: -15%) จากแนวโนมการฟนตวทางเศรษฐกจ ทงน ดวยงบลงทนเครอขายทเพมขนและคาเสอมราคาจากการขยายเครอขายไดรบการชดเชยจากตนทนคาสมปทานทลดลง 23% โดย ตนทนคาธรรมเนยมสมปทานคดเปนสดสวน 14.2% ของรายได บรการ จากระดบปกตท 14.6% ในไตรมาส 4/14 (1Q14: 19.3%) ท าให EBITDA margin ทรงตวท 55% จากเดม 54.9% ในไตรมาสทผานมา
ความตองการใชบรการ data เพมข น รายได non-voice ยงคงเพมขนตอเนอง 33.7% y-o-y (4Q14: 40.7%) ไดรบอานสงสจากราคาสมารทโฟนทลดลงและความนยมการใชบรการโซเชยลมเดยทเพมขน โดยคดเปนสดสวนราว 35% ของรายไดบรการ เพมขนจากเดม 25% ในไตรมาส 1/14 (4Q14: 33%) สวนรายได data คดเปนสดสวนมากถง 83% ของรายไดบรการรวมจากการใชบรการ data ตอเลขหมาย (VoU) ทเพมขน 10% y-o-y เปน 1.63GB/เดอน (4Q14: 1.48GB)
ปรบทง SIM ทไม active ออกไป AIS ไดท าการปรบทง SIM บนบรการ prepaid ออกไปราว 4.3 ลานเลขหมายฉดใหผใชบรการรวม (total sub.) ลดลงราว 2.35 ลานเลขหมาย หรอคดเปนอตราการเพมขนสทธราว 1.83 ลานเลขหมายในไตรมาสน ในขณะท prepaid ARUP และ MOU เพมขนชนคราว
ยงคงแนะน า “ซอ” เรายงคงประมาณการก าไรในรอบป 2558/59 (+19.4%, +9.7% y-o-y) ดวยราคาเปาหมายค านวณจากวธ DCF เทากบ 279.00 บาท (WACC 8.9%, TG 1.5%) องจากคา PE ป 2558 ท 16x และดวยผลประกอบการไตรมาส 1/58 ทแขงแกรง เราเชอวาผบรหารจะสามารถด าเนนตามเปาทวางไวคอ (i) รายได บรการเพมขน 4-5% เปนไปในทศทางเดยวกนกบคาดการณของเราท 4.4% (ii) อตราการใชบรการสมารทโฟนบนเครอขาย 3G ท 70% (1Q15: 58%) (iii) CAPEX ราว 4.0 หมนลานบาทจากการขยายฐานโครงขาย 29000 แหง (1Q15: 22800 แหง) และเปา FBB ท 80000 เลขหมายภายในป 2558)
Forecasts and Valuations Dec-12 Dec-13 Dec-14 Dec-15F Dec-16F
Total turnover (THBm) 141,568 146,811 148,728 149,859 151,662
Reported net profit (THBm) 34,883 36,274 36,034 43,830 48,099
Recurring net profit (THBm) 34,883 36,274 36,697 43,830 48,099
Recurring net profit growth (%) 31.1 4.0 1.2 19.4 9.7
Recurring EPS (THB) 11.7 12.2 12.3 14.7 16.2
DPS (THB) 10.9 12.1 11.7 14.7 16.2
Recurring P/E (x) 20.2 19.4 19.2 16.1 14.6
P/B (x) 16.3 15.4 15.1 13.8 13.3
P/CF (x) 13.9 13.8 11.4 11.7 10.7
Dividend Yield (%) 4.6 5.1 4.9 6.2 6.8
EV/EBITDA (x) 11.5 11.3 10.9 9.6 9.2
Return on average equity (%) 84.5 81.4 77.9 89.7 92.5
Net debt to equity (%) net cash 25.3 40.1 78.3 84.5
Our vs consensus EPS (adjusted) (%) 3.0 2.0
Advanced Info Service (ADVANC TB)
10 May 2015
See important disclosures at the end of this report 2
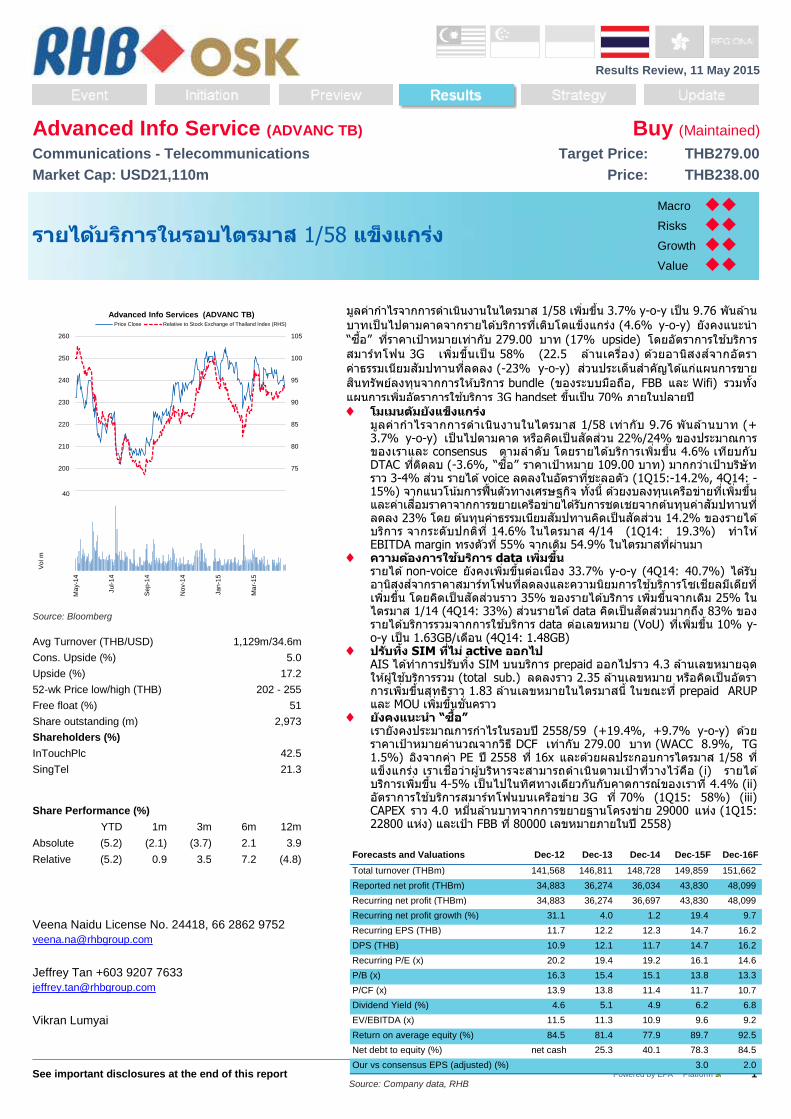
Figure 1: AIS’ 1Q15 results review
FYE Dec (THBm) 1Q14 4Q14 1Q15 QoQ (%) YoY (%) Comments
Revenue 36,449.0 40,444.0 40,536.0 0.2 11.2 YoY growth due to a 46.8% surge in handset sales
EBITDA 16,454.0 17,727.0 18,073.0 2.0 9.8
EBITDA Margin (%) 45.1 43.8 44.6 Declined YoY from higher handset sales, up QoQ from higher handset margin (1Q15: 3.9% vs 4Q14: 1.9%)
Depreciation (4,285.9) (5,121.2) (5,455.5) 6.5 27.3 Up QoQ/YoY due to network expansion
EBIT 12,168.1 12,605.8 12,617.5 0.1 3.7
EBIT Margin (%) 33.4 31.2 31.1
Interest expense (229.0) (457.8) (428.8) (6.3) 87.3
Interest income 144.3 211.2 198.2 (6.1) 37.4
Associates 0.0 0.0 0.0 nm nm
EI/Others (167.1) (148.0) (90.4) (38.9) (45.9)
Pretax profit 11,916.2 12,211.1 12,296.4 0.7 3.2
Pretax Margin (%) 32.7 30.2 30.3
Tax (2,442.7) (3,099.7) (2,399.8) (22.6) (1.8)
Effective tax rate (%) (20.5) (25.4) (19.5)
Minority Interest 7.0 10.9 0.2 (98.3) (97.4)
Net Profit 9,480.5 9,122.3 9,896.9 8.5 4.4 Increased YoY as higher EBITDA offset higher depreciation and finance cost. Grew QoQ on stronger EBITDA and lower taxes
Core Profit 9,408.1 9,811.9 9,760.3 (0.5) 3.7 In line with our forecast, at about 22% of our full-year estimate
Net Margin (%) 26.0 24.2 24.4
Source: Company data, RHB
Figure 2: Breakdown of AIS’ revenue and expenses
FYE Dec (THBm) 1Q14 4Q14 1Q15 QoQ (%) YoY (%) Comments
Revenue
Voice revenue 17,327.5 15,455.0 14,871.0 (3.8) (14.2) QoQ/YoY lower due to data substitution
- Postpaid (voice) 4,409.5 4,375.0 4,386.0 0.3 (0.5)
- Prepaid (voice) 12,918.0 11,080.0 10,485.0 (5.4) (18.8)
Non-voice revenue 9,567.0 12,051.0 12,787.0 6.1 33.7 Grew QoQ/YoY from rising mobile data. Mobile data now represents 83% of non-voice revenue
International roaming 500.0 650.0 526.0 (19.1) 5.2 Fell QoQ on cannibalisation from substituted products
Others (IDD, other fees) 1,572.0 1,882.0 2,124.0 12.9 35.1 Increased QoQ/YoY from Wifi services
Interconnection revenue 1,836.0 1,953.0 1,940.0 (0.7) 5.7
Handset sales 5,646.0 8,454.0 8,288.0 (2.0) 46.8 Grew YoY due to 1.4m LAVA units sold
Total revenue 36,448.0 40,444.0 40,537.0 0.2 11.2
Service revenue excl. IC 28,966.5 30,038.0 30,308.0 0.9 4.6 Grew YoY, 3-4% above guidance due to mobile data
Expense
Handset costs 5,514.0 8,299.0 7,967.0 (4.0) 44.5 1Q15 handset margin was 3.9% (4Q14: 1.9%)
Interconnection cost 1,683.0 1,738.0 1,726.0 (0.7) 2.6
Depreciation & amortisation 4,224.0 5,040.0 5,375.0 6.6 27.2 Increased QoQ/YoY on continuous 3G investment
Network opex 1,892.0 2,227.0 2,351.0 5.6 24.3 Grew QoQ/YoY due to more base stations
Other cost of services 1,562.0 1,657.0 1,680.0 1.4 7.6
Regulatory fee 5,588.0 3,856.0 4,299.0 11.5 (23.1) Lower YoY due to higher 3G penetration. Higher QoQ due to a one-time adjustment in 4Q14. If normalised, 4Q14 would be THB4.4bn
Advanced Info Service (ADVANC TB)
10 May 2015
See important disclosures at the end of this report 3
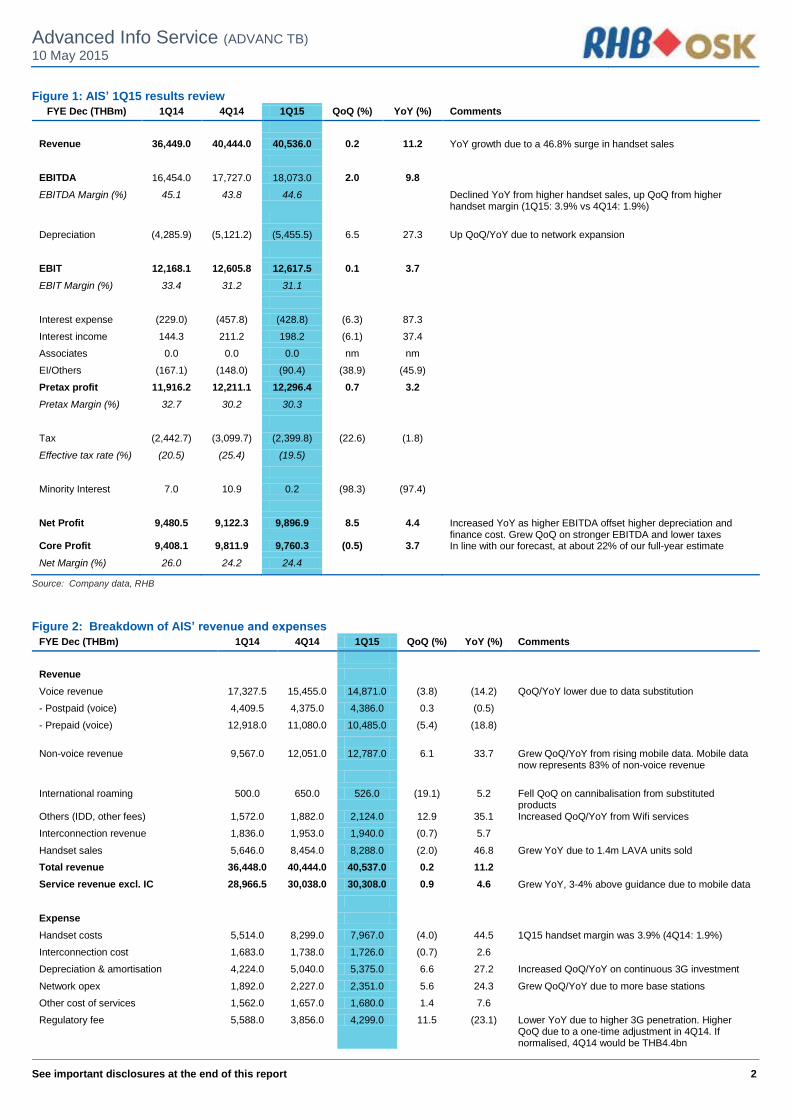
Marketing expense 1,185.0 1,866.0 1,332.0 (28.6) 12.4 Dropped QoQ on seasonality, but rose YoY from 3G marketing campaigns
General admin & staff cost 2,501.0 2,782.0 2,933.0 5.4 17.3 Declined QoQ due to a write-off from obsolete assets. Grew YoY from higher headcount.
Bad debt provision 257.0 340.0 331.0 (2.6) 28.8 Increased YoY due to higher number of postpaid subscribers
Depreciation (SGA) 62.0 81.0 81.0 0.0 30.6
Subtotal 24,468.0 27,886.0 28,075.0 0.7 14.7
Depreciation (CF) (1,214.1) (1,927.9) (2,270.0) 17.7 87.0
Amortisation (CF) (3,071.8) (3,193.3) (3,185.5) (0.2) 3.7
Management benefit (IS) 34.8 37.7 39.7 5.2 14.1
Disposals and write-off of assets (CF) (239.6) (110.5) (227.0) 105.5 (5.3)
Other finance costs paid (CF) 18.3 26.7 33.0 23.6 80.3
Restatement (1.6) (1.7) (1.2)
Total 19,994.0 22,717.0 22,463.9 (1.1) 12.4
EBITDA 16,454.0 17,727.0 18,073.0 2.0 9.8
EBITDA margin (%) 45.1 43.8 44.6
Service margin (%) 53.0 54.9 55.0 Up YoY due to improved revenue and lower regulatory fee. Stayed flat QoQ as lower marketing expenses offset higher regulatory fee
Source: Company data, RHB
Figure 3: AIS’ quarterly margin
Source: Company data, Note: *Service margins exclude handset sales
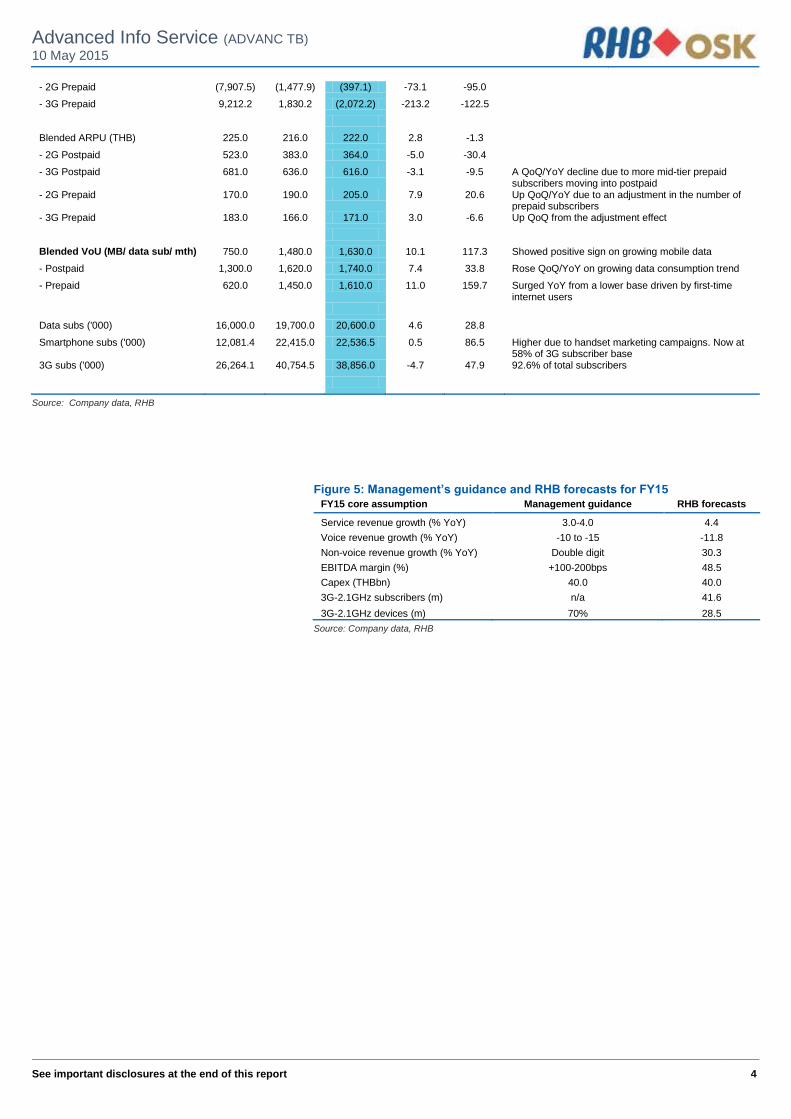
Figure 4: AIS’ key operating statistics
1Q14 4Q14 1Q15 QoQ (%) YoY (%) Comments
Total subscribers ('000) 42,362.5 44,301.3 41,950.0 -5.3 -1.0 Discarded 4.3m inactive subscribers in 1Q15, with no retrospective adjustment to previous quarters
2G-900/1800MH network
- 2G Postpaid 985.7 536.4 481.5 -10.2 -51.2
- 3G Postpaid 3,478.1 4,404.3 4,578.0 3.9 31.6
3G 2.1GHz network
- 2G Prepaid 15,112.7 3,010.4 2,613.3 -13.2 -82.7
- 3G Prepaid 22,786.0 36,350.2 34,278.0 -5.7 50.4 Dropped QoQ from a one-time adjustment to eliminate inactive prepaid subscribers who had been inactive for more than 90 days
Total net add ('000) 1,501.6 506.1 (2,351.3) -564.6 -256.6 The real net add of 1.83m in 1Q15 did not depict the real net add of subscribers because the number of inactive subscribers has been accumulating over the past quarters
- 2G Postpaid (488.5) (89.9) (54.9) -38.9 -88.8
- 3G Postpaid 685.4 243.9 173.7 -28.8 -74.7
Advanced Info Service (ADVANC TB)
10 May 2015
See important disclosures at the end of this report 4
- 2G Prepaid (7,907.5) (1,477.9) (397.1) -73.1 -95.0
- 3G Prepaid 9,212.2 1,830.2 (2,072.2) -213.2 -122.5
Blended ARPU (THB) 225.0 216.0 222.0 2.8 -1.3
- 2G Postpaid 523.0 383.0 364.0 -5.0 -30.4
- 3G Postpaid 681.0 636.0 616.0 -3.1 -9.5 A QoQ/YoY decline due to more mid-tier prepaid subscribers moving into postpaid
- 2G Prepaid 170.0 190.0 205.0 7.9 20.6 Up QoQ/YoY due to an adjustment in the number of prepaid subscribers
- 3G Prepaid 183.0 166.0 171.0 3.0 -6.6 Up QoQ from the adjustment effect
Blended VoU (MB/ data sub/ mth) 750.0 1,480.0 1,630.0 10.1 117.3 Showed positive sign on growing mobile data
- Postpaid 1,300.0 1,620.0 1,740.0 7.4 33.8 Rose QoQ/YoY on growing data consumption trend
- Prepaid 620.0 1,450.0 1,610.0 11.0 159.7 Surged YoY from a lower base driven by first-time internet users
Data subs ('000) 16,000.0 19,700.0 20,600.0 4.6 28.8
Smartphone subs ('000) 12,081.4 22,415.0 22,536.5 0.5 86.5 Higher due to handset marketing campaigns. Now at 58% of 3G subscriber base
3G subs ('000) 26,264.1 40,754.5 38,856.0 -4.7 47.9 92.6% of total subscribers
Source: Company data, RHB
Figure 5: Management’s guidance and RHB forecasts for FY15
FY15 core assumption Management guidance RHB forecasts
Service revenue growth (% YoY) 3.0-4.0 4.4
Voice revenue growth (% YoY) -10 to -15 -11.8
Non-voice revenue growth (% YoY) Double digit 30.3
EBITDA margin (%) +100-200bps 48.5
Capex (THBbn) 40.0 40.0
3G-2.1GHz subscribers (m) n/a 41.6
3G-2.1GHz devices (m) 70% 28.5
Source: Company data, RHB
Advanced Info Service (ADVANC TB)
10 May 2015
See important disclosures at the end of this report 5
Financial Exhibits
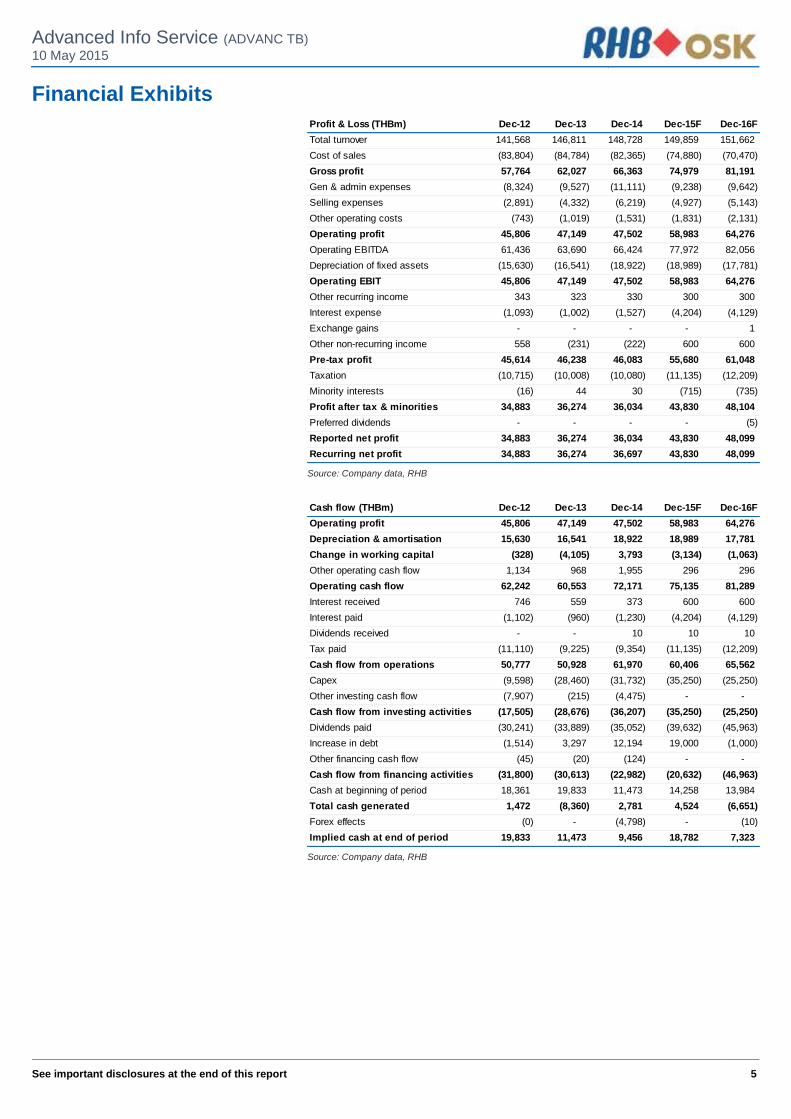
Profit & Loss (THBm) Dec-12 Dec-13 Dec-14 Dec-15F Dec-16F
Total turnover 141,568 146,811 148,728 149,859 151,662
Cost of sales (83,804) (84,784) (82,365) (74,880) (70,470)
Gross profit 57,764 62,027 66,363 74,979 81,191
Gen & admin expenses (8,324) (9,527) (11,111) (9,238) (9,642)
Selling expenses (2,891) (4,332) (6,219) (4,927) (5,143)
Other operating costs (743) (1,019) (1,531) (1,831) (2,131)
Operating profit 45,806 47,149 47,502 58,983 64,276
Operating EBITDA 61,436 63,690 66,424 77,972 82,056
Depreciation of fixed assets (15,630) (16,541) (18,922) (18,989) (17,781)
Operating EBIT 45,806 47,149 47,502 58,983 64,276
Other recurring income 343 323 330 300 300
Interest expense (1,093) (1,002) (1,527) (4,204) (4,129)
Exchange gains - - - - 1
Other non-recurring income 558 (231) (222) 600 600
Pre-tax profit 45,614 46,238 46,083 55,680 61,048
Taxation (10,715) (10,008) (10,080) (11,135) (12,209)
Minority interests (16) 44 30 (715) (735)
Profit after tax & minorities 34,883 36,274 36,034 43,830 48,104
Preferred dividends - - - - (5)
Reported net profit 34,883 36,274 36,034 43,830 48,099
Recurring net profit 34,883 36,274 36,697 43,830 48,099
Source: Company data, RHB
Cash flow (THBm) Dec-12 Dec-13 Dec-14 Dec-15F Dec-16F
Operating profit 45,806 47,149 47,502 58,983 64,276
Depreciation & amortisation 15,630 16,541 18,922 18,989 17,781
Change in working capital (328) (4,105) 3,793 (3,134) (1,063)
Other operating cash flow 1,134 968 1,955 296 296
Operating cash flow 62,242 60,553 72,171 75,135 81,289
Interest received 746 559 373 600 600
Interest paid (1,102) (960) (1,230) (4,204) (4,129)
Dividends received - - 10 10 10
Tax paid (11,110) (9,225) (9,354) (11,135) (12,209)
Cash flow from operations 50,777 50,928 61,970 60,406 65,562
Capex (9,598) (28,460) (31,732) (35,250) (25,250)
Other investing cash flow (7,907) (215) (4,475) - -
Cash flow from investing activities (17,505) (28,676) (36,207) (35,250) (25,250)
Dividends paid (30,241) (33,889) (35,052) (39,632) (45,963)
Increase in debt (1,514) 3,297 12,194 19,000 (1,000)
Other financing cash flow (45) (20) (124) - -
Cash flow from financing activities (31,800) (30,613) (22,982) (20,632) (46,963)
Cash at beginning of period 18,361 19,833 11,473 14,258 13,984
Total cash generated 1,472 (8,360) 2,781 4,524 (6,651)
Forex effects (0) - (4,798) - (10)
Implied cash at end of period 19,833 11,473 9,456 18,782 7,323
Source: Company data, RHB
Advanced Info Service (ADVANC TB)
10 May 2015
See important disclosures at the end of this report 6
Financial Exhibits
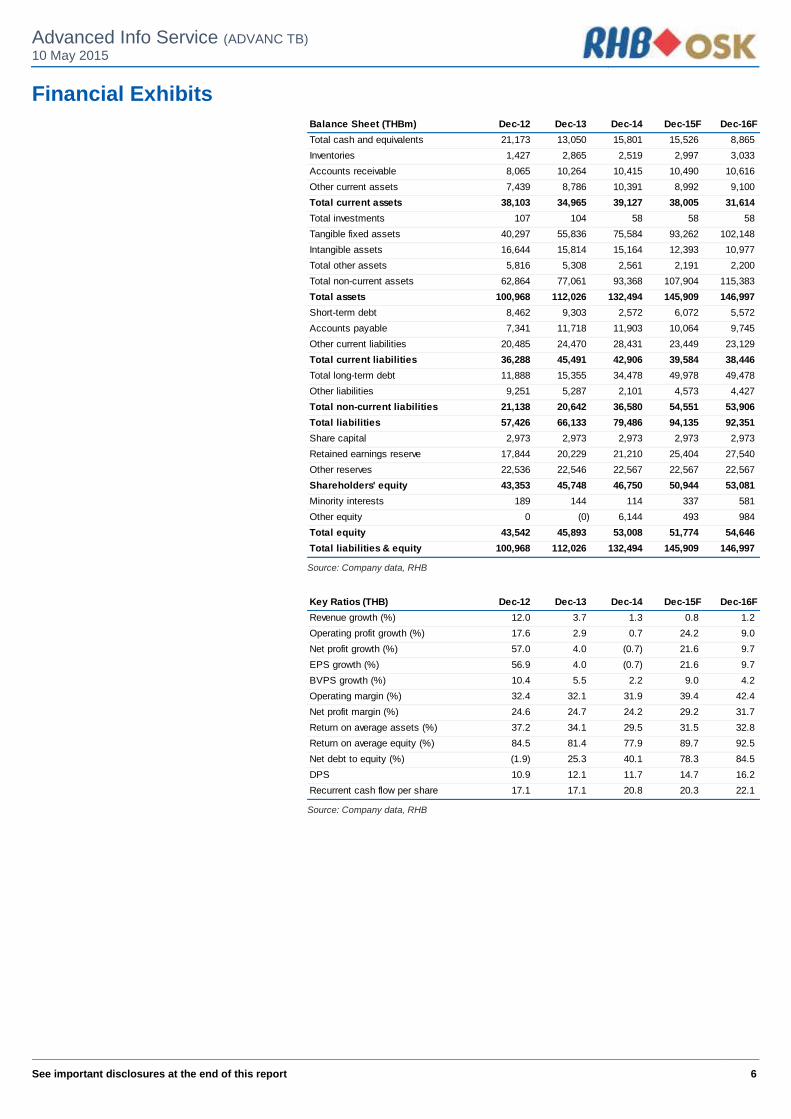
Balance Sheet (THBm) Dec-12 Dec-13 Dec-14 Dec-15F Dec-16F
Total cash and equivalents 21,173 13,050 15,801 15,526 8,865
Inventories 1,427 2,865 2,519 2,997 3,033
Accounts receivable 8,065 10,264 10,415 10,490 10,616
Other current assets 7,439 8,786 10,391 8,992 9,100
Total current assets 38,103 34,965 39,127 38,005 31,614
Total investments 107 104 58 58 58
Tangible fixed assets 40,297 55,836 75,584 93,262 102,148
Intangible assets 16,644 15,814 15,164 12,393 10,977
Total other assets 5,816 5,308 2,561 2,191 2,200
Total non-current assets 62,864 77,061 93,368 107,904 115,383
Total assets 100,968 112,026 132,494 145,909 146,997
Short-term debt 8,462 9,303 2,572 6,072 5,572
Accounts payable 7,341 11,718 11,903 10,064 9,745
Other current liabilities 20,485 24,470 28,431 23,449 23,129
Total current liabilities 36,288 45,491 42,906 39,584 38,446
Total long-term debt 11,888 15,355 34,478 49,978 49,478
Other liabilities 9,251 5,287 2,101 4,573 4,427
Total non-current liabilities 21,138 20,642 36,580 54,551 53,906
Total liabilities 57,426 66,133 79,486 94,135 92,351
Share capital 2,973 2,973 2,973 2,973 2,973
Retained earnings reserve 17,844 20,229 21,210 25,404 27,540
Other reserves 22,536 22,546 22,567 22,567 22,567
Shareholders' equity 43,353 45,748 46,750 50,944 53,081
Minority interests 189 144 114 337 581
Other equity 0 (0) 6,144 493 984
Total equity 43,542 45,893 53,008 51,774 54,646
Total liabilities & equity 100,968 112,026 132,494 145,909 146,997
Source: Company data, RHB
Key Ratios (THB) Dec-12 Dec-13 Dec-14 Dec-15F Dec-16F
Revenue growth (%) 12.0 3.7 1.3 0.8 1.2
Operating profit growth (%) 17.6 2.9 0.7 24.2 9.0
Net profit growth (%) 57.0 4.0 (0.7) 21.6 9.7
EPS growth (%) 56.9 4.0 (0.7) 21.6 9.7
BVPS growth (%) 10.4 5.5 2.2 9.0 4.2
Operating margin (%) 32.4 32.1 31.9 39.4 42.4
Net profit margin (%) 24.6 24.7 24.2 29.2 31.7
Return on average assets (%) 37.2 34.1 29.5 31.5 32.8
Return on average equity (%) 84.5 81.4 77.9 89.7 92.5
Net debt to equity (%) (1.9) 25.3 40.1 78.3 84.5
DPS 10.9 12.1 11.7 14.7 16.2
Recurrent cash flow per share 17.1 17.1 20.8 20.3 22.1
Source: Company data, RHB
Advanced Info Service (ADVANC TB)
10 May 2015
See important disclosures at the end of this report 7
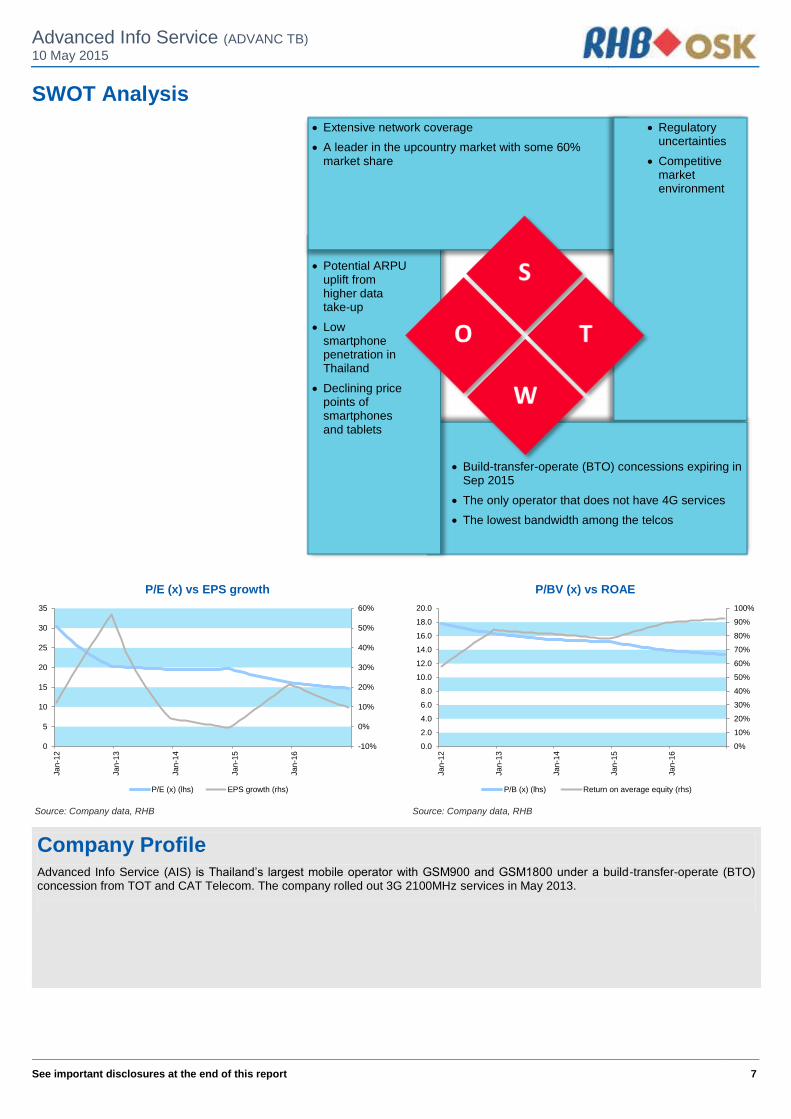
SWOT Analysis
Extensive network coverage
A leader in the upcountry market with some 60% market share
Regulatory uncertainties
Competitive market environment
Potential ARPU uplift from higher data take-up
Low smartphone penetration in Thailand
Declining price points of smartphones and tablets
Build-transfer-operate (BTO) concessions expiring in Sep 2015
The only operator that does not have 4G services
The lowest bandwidth among the telcos
-10%
0%
10%
20%
30%
40%
50%
60%
0
5
10
15
20
25
30
35
Jan
-12
Jan
-13
Jan
-14
Jan
-15
Jan
-16
P/E (x) vs EPS growth
P/E (x) (lhs) EPS growth (rhs)
0%
10%
20%
30%
40%
50%
60%
70%
80%
90%
100%
0.0
2.0
4.0
6.0
8.0
10.0
12.0
14.0
16.0
18.0
20.0
Jan
-12
Jan
-13
Jan
-14
Jan
-15
Jan
-16
P/BV (x) vs ROAE
P/B (x) (lhs) Return on average equity (rhs)
Source: Company data, RHB Source: Company data, RHB
Company Profile Advanced Info Service (AIS) is Thailand’s largest mobile operator with GSM900 and GSM1800 under a build-transfer-operate (BTO) concession from TOT and CAT Telecom. The company rolled out 3G 2100MHz services in May 2013.
Advanced Info Service (ADVANC TB)
10 May 2015
See important disclosures at the end of this report 8
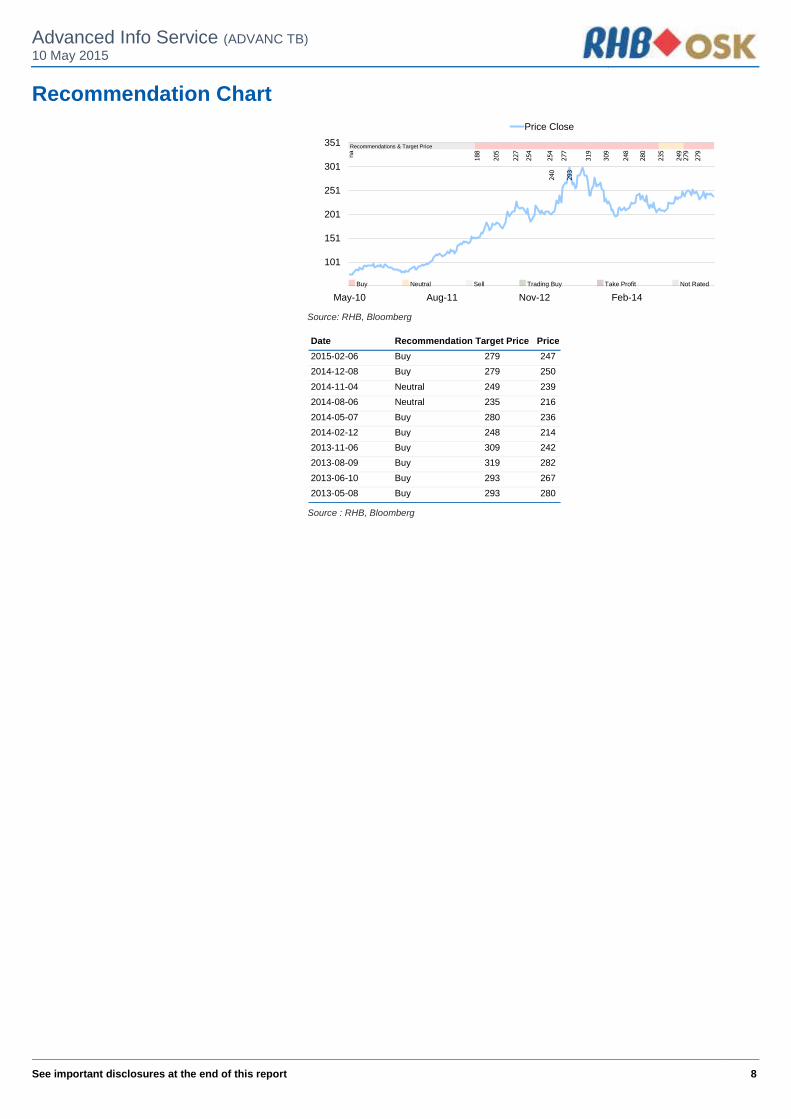
Recommendation Chart
51
101
151
201
251
301
351
May-10 Aug-11 Nov-12 Feb-14
Price Close
na
Recommendations & Target Price
Buy Neutral Sell Trading Buy Take Profit Not Rated
Source: RHB, Bloomberg
Source : RHB, Bloomberg
Date Recommendation Target Price Price
2015-02-06 Buy 279 247
2014-12-08 Buy 279 250
2014-11-04 Neutral 249 239
2014-08-06 Neutral 235 216
2014-05-07 Buy 280 236
2014-02-12 Buy 248 214
2013-11-06 Buy 309 242
2013-08-09 Buy 319 282
2013-06-10 Buy 293 267
2013-05-08 Buy 293 280
9
RHB Guide to Investment Ratings Buy: Share price may exceed 10% over the next 12 months Trading Buy: Share price may exceed 15% over the next 3 months, however longer-term outlook remains uncertain Neutral: Share price may fall within the range of +/- 10% over the next 12 months Take Profit: Target price has been attained. Look to accumulate at lower levels Sell: Share price may fall by more than 10% over the next 12 months Not Rated: Stock is not within regular research coverage
Investment Research Disclaimers
RHB has issued this report for information purposes only. This report is intended for circulation amongst RHB and its affiliates’ clients generally or such
persons as may be deemed eligible by RHB to receive this report and does not have regard to the specific investment objectives, financial situation and
the particular needs of any specific person who may receive this report. This report is not intended, and should not under any circumstances be construed
as, an offer or a solicitation of an offer to buy or sell the securities referred to herein or any related financial instruments.
This report may further consist of, whether in whole or in part, summaries, research, compilations, extracts or analysis that has been prepared by RHB’s
strategic, joint venture and/or business partners. No representation or warranty (express or implied) is given as to the accuracy or completeness of such
information and accordingly investors should make their own informed decisions before relying on the same.
This report is not directed to, or intended for distribution to or use by, any person or entity who is a citizen or resident of or located in any locality, state,
country or other jurisdiction where such distribution, publication, availability or use would be contrary to the applicable laws or regulations. By accepting
this report, the recipient hereof (i) represents and warrants that it is lawfully able to receive this document under the laws and regulations of the jurisdiction
in which it is located or other applicable laws and (ii) acknowledges and agrees to be bound by the limitations contained herein. Any failure to comply with
these limitations may constitute a violation of applicable laws.
All the information contained herein is based upon publicly available information and has been obtained from sources that RHB believes to be reliable and
correct at the time of issue of this report. However, such sources have not been independently verified by RHB and/or its affiliates and this report does not
purport to contain all information that a prospective investor may require. The opinions expressed herein are RHB’s present opinions only and are subject
to change without prior notice. RHB is not under any obligation to update or keep current the information and opinions expressed herein or to provide the
recipient with access to any additional information. Consequently, RHB does not guarantee, represent or warrant, expressly or impliedly, as to the
adequacy, accuracy, reliability, fairness or completeness of the information and opinion contained in this report. Neither RHB (including its officers,
directors, associates, connected parties, and/or employees) nor does any of its agents accept any liability for any direct, indirect or consequential losses,
loss of profits and/or damages that may arise from the use or reliance of this research report and/or further communications given in relation to this report.
Any such responsibility or liability is hereby expressly disclaimed.
Whilst every effort is made to ensure that statement of facts made in this report are accurate, all estimates, projections, forecasts, expressions of opinion
and other subjective judgments contained in this report are based on assumptions considered to be reasonable and must not be construed as a
representation that the matters referred to therein will occur. Different assumptions by RHB or any other source may yield substantially different results
and recommendations contained on one type of research product may differ from recommendations contained in other types of research. The
performance of currencies may affect the value of, or income from, the securities or any other financial instruments referenced in this report. Holders of
depositary receipts backed by the securities discussed in this report assume currency risk. Past performance is not a guide to future performance. Income
from investments may fluctuate. The price or value of the investments to which this report relates, either directly or indirectly, may fall or rise against the
interest of investors.
This report does not purport to be comprehensive or to contain all the information that a prospective investor may need in order to make an investment
decision. The recipient of this report is making its own independent assessment and decisions regarding any securities or financial instruments referenced
herein. Any investment discussed or recommended in this report may be unsuitable for an investor depending on the investor’s specific investment
objectives and financial position. The material in this report is general information intended for recipients who understand the risks of investing in financial
instruments. This report does not take into account whether an investment or course of action and any associated risks are suitable for the recipient. Any
recommendations contained in this report must therefore not be relied upon as investment advice based on the recipient's personal circumstances.
Investors should make their own independent evaluation of the information contained herein, consider their own investment objective, financial situation
and particular needs and seek their own financial, business, legal, tax and other advice regarding the appropriateness of investing in any securities or the
investment strategies discussed or recommended in this report.
This report may contain forward-looking statements which are often but not always identified by the use of words such as “believe”, “estimate”, “intend”
and “expect” and statements that an event or result “may”, “will” or “might” occur or be achieved and other similar expressions. Such forward-looking
statements are based on assumptions made and information currently available to RHB and are subject to known and unknown risks, uncertainties and
other factors which may cause the actual results, performance or achievement to be materially different from any future results, performance or
achievement, expressed or implied by such forward-looking statements. Caution should be taken with respect to such statements and recipients of this
report should not place undue reliance on any such forward-looking statements. RHB expressly disclaims any obligation to update or revise any forward-
looking statements, whether as a result of new information, future events or circumstances after the date of this publication or to reflect the occurrence of
unanticipated events.

10
The use of any website to access this report electronically is done at the recipient’s own risk, and it is the recipient’s sole responsibility to take precautions
to ensure that it is free from viruses or other items of a destructive nature. This report may also provide the addresses of, or contain hyperlinks to,
websites. RHB takes no responsibility for the content contained therein. Such addresses or hyperlinks (including addresses or hyperlinks to RHB own
website material) are provided solely for the recipient’s convenience. The information and the content of the linked site do not in any way form part of this
report. Accessing such website or following such link through the report or RHB website shall be at the recipient’s own risk.
This report may contain information obtained from third parties. Third party content providers do not guarantee the accuracy, completeness, timeliness or
availability of any information and are not responsible for any errors or omissions (negligent or otherwise), regardless of the cause, or for the results
obtained from the use of such content. Third party content providers give no express or implied warranties, including, but not limited to, any warranties of
merchantability or fitness for a particular purpose or use. Third party content providers shall not be liable for any direct, indirect, incidental, exemplary,
compensatory, punitive, special or consequential damages, costs, expenses, legal fees, or losses (including lost income or profits and opportunity costs) in
connection with any use of their content.
The research analysts responsible for the production of this report hereby certifies that the views expressed herein accurately and exclusively reflect his or
her personal views and opinions about any and all of the issuers or securities analysed in this report and were prepared independently and autonomously.
The research analysts that authored this report are precluded by RHB in all circumstances from trading in the securities or other financial instruments
referenced in the report, or from having an interest in the company(ies) that they cover.
RHB and/or its affiliates and/or their directors, officers, associates, connected parties and/or employees, may have, or have had, interests in the securities
or qualified holdings, in subject company(ies) mentioned in this report or any securities related thereto and may from time to time add to or dispose of, or
may be materially interested in, any such securities. Further, RHB and/or its affiliates may have, or have had, business relationships with the subject
company(ies) mentioned in this report and may from time to time seek to provide investment banking or other services to the subject company(ies)
referred to in this research report. As a result, investors should be aware that a conflict of interest may exist.
The contents of this report is strictly confidential and may not be copied, reproduced, published, distributed, transmitted or passed, in whole or in part, to
any other person without the prior express written consent of RHB and/or its affiliates. This report has been delivered to RHB and its affiliates’ clients for
information purposes only and upon the express understanding that such parties will use it only for the purposes set forth above. By electing to view or
accepting a copy of this report, the recipients have agreed that they will not print, copy, videotape, record, hyperlink, download, or otherwise attempt to
reproduce or re-transmit (in any form including hard copy or electronic distribution format) the contents of this report. RHB and/or its affiliates accepts no
liability whatsoever for the actions of third parties in this respect.
The contents of this report are subject to copyright. Please refer to Restrictions on Distribution below for information regarding the distributors of this
report. Recipients must not reproduce or disseminate any content or findings of this report without the express permission of RHB and the distributors.
The securities mentioned in this publication may not be eligible for sale in some states or countries or certain categories of investors. The recipient of this
report should have regard to the laws of the recipient’s place of domicile when contemplating transactions in the securities or other financial instruments
referred to herein. The securities discussed in this report may not have been registered in such jurisdiction. Without prejudice to the foregoing, the
recipient is to note that additional disclaimers, warnings or qualifications may apply based on geographical location of the person or entity receiving this
report.
RESTRICTIONS ON DISTRIBUTION
Malaysia
This report is issued and distributed in Malaysia by RHB Research Institute Sdn Bhd. The views and opinions in this report are our own as of the date
hereof and is subject to change. If the Financial Services and Markets Act of the United Kingdom or the rules of the Financial Conduct Authority apply to a
recipient, our obligations owed to such recipient therein are unaffected. RHB Research Institute Sdn Bhd has no obligation to update its opinion or the
information in this report.
Thailand
This report is issued and distributed in the Kingdom of Thailand by RHB OSK Securities (Thailand) PCL, a licensed securities company that is authorised
by the Ministry of Finance, regulated by the Securities and Exchange Commission of Thailand and is a member of the Stock Exchange of Thailand. The
Thai Institute of Directors Association has disclosed the Corporate Governance Report of Thai Listed Companies made pursuant to the policy of the
Securities and Exchange Commission of Thailand. RHB OSK Securities (Thailand) PCL does not endorse, confirm nor certify the result of the Corporate
Governance Report of Thai Listed Companies.
Indonesia
This report is issued and distributed in Indonesia by PT RHB OSK Securities Indonesia. This research does not constitute an offering document and it
should not be construed as an offer of securities in Indonesia. Any securities offered or sold, directly or indirectly, in Indonesia or to any Indonesian citizen
or corporation (wherever located) or to any Indonesian resident in a manner which constitutes a public offering under Indonesian laws and regulations
must comply with the prevailing Indonesian laws and regulations.

11
Singapore
This report is issued and distributed in Singapore by RHB Research Institute Singapore Pte Ltd and it may only be distributed in Singapore to accredited
investors, expert investors and institutional investors as defined in the Financial Advisers Regulations and the Securities and Futures Act (Chapter 289), as
amended from time to time. By virtue of distribution to these categories of investors, RHB Research Institute Singapore Pte Ltd and its representatives are
not required to comply with Section 36 of the Financial Advisers Act (Chapter 110) (Section 36 relates to disclosure of RHB Research Institute Singapore
Pte Ltd ’s interest and/or its representative's interest in securities). Recipients of this report in Singapore may contact RHB Research Institute Singapore
Pte Ltd in respect of any matter arising from or in connection with the report.
Hong Kong
This report is issued and distributed in Hong Kong by RHB OSK Securities Hong Kong Limited (興業僑豐證券有限公司) (CE No.: ADU220) (“RHBSHK”)
which is licensed in Hong Kong by the Securities and Futures Commission for Type 1 (dealing in securities) and Type 4 (advising on securities) regulated
activities. Any investors wishing to purchase or otherwise deal in the securities covered in this report should contact RHB OSK Securities Hong Kong
Limited.
United States
This report was prepared by RHB and is being distributed solely and directly to “major” U.S. institutional investors as defined under, and pursuant to, the
requirements of Rule 15a-6 under the U.S. Securities and Exchange Act of 1934, as amended (the “Exchange Act”). RHB is not registered as a broker-
dealer in the United States and does not offer brokerage services to U.S. persons. Any order for the purchase or sale of the securities discussed herein
that are listed on Bursa Malaysia Securities Berhad must be placed with and through Auerbach Grayson (“AG”). Any order for the purchase or sale of all
other securities discussed herein must be placed with and through such other registered U.S. broker-dealer as appointed by RHB from time to time as
required by the Exchange Act Rule 15a-6.
This report is confidential and not intended for distribution to, or use by, persons other than the recipient and its employees, agents and advisors, as
applicable.
Additionally, where research is distributed via Electronic Service Provider, the analysts whose names appear in this report are not registered or qualified
as research analysts in the United States and are not associated persons of Auerbach Grayson AG or such other registered U.S. broker-dealer as
appointed by RHB from time to time and therefore may not be subject to any applicable restrictions under Financial Industry Regulatory Authority
(“FINRA”) rules on communications with a subject company, public appearances and personal trading.
Investing in any non-U.S. securities or related financial instruments discussed in this research report may present certain risks. The securities of non-U.S.
issuers may not be registered with, or be subject to the regulations of, the U.S. Securities and Exchange Commission. Information on non-U.S. securities
or related financial instruments may be limited. Foreign companies may not be subject to audit and reporting standards and regulatory requirements
comparable to those in the United States.
The financial instruments discussed in this report may not be suitable for all investors.
Transactions in foreign markets may be subject to regulations that differ from or offer less protection than those in the United States.
OWNERSHIP AND MATERIAL CONFLICTS OF INTEREST
Malaysia
RHB does not have qualified shareholding (1% or more) in the subject company (ies) covered in this report except for:
a) -
RHB and/or its subsidiaries are not liquidity providers or market makers for the subject company (ies) covered in this report except for:
a) -
RHB and/or its subsidiaries have not participated as a syndicate member in share offerings and/or bond issues in securities covered in this report in the
last 12 months except for:
a) -
RHB has not provided investment banking services to the company/companies covered in this report in the last 12 months except for:
a) -
Thailand
RHB OSK Securities (Thailand) PCL and/or its directors, officers, associates, connected parties and/or employees, may have, or have had, interests
and/or commitments in the securities in subject company(ies) mentioned in this report or any securities related thereto. Further, RHB OSK Securities
(Thailand) PCL may have, or have had, business relationships with the subject company(ies) mentioned in this report. As a result, investors should
exercise their own judgment carefully before making any investment decisions.
12
Indonesia
PT RHB OSK Securities Indonesia is not affiliated with the subject company(ies) covered in this report both directly or indirectly as per the definitions of
affiliation above.
Pursuant to the Capital Market Law (Law Number 8 Year 1995) and the supporting regulations thereof, what constitutes as affiliated parties are as follows:
1. Familial relationship due to marriage or blood up to the second degree, both horizontally or vertically;
2. Affiliation between parties to the employees, Directors or Commissioners of the parties concerned;
3. Affiliation between 2 companies whereby one or more member of the Board of Directors or the Commissioners are the same;
4. Affiliation between the Company and the parties, both directly or indirectly, controlling or being controlled by the Company;
5. Affiliation between 2 companies which are controlled, directly or indirectly, by the same party; or
6. Affiliation between the Company and the main Shareholders.
PT RHB OSK Securities Indonesia is not an insider as defined in the Capital Market Law and the information contained in this report is not considered as
insider information prohibited by law.
Insider means:
a. a commissioner, director or employee of an Issuer or Public Company;
b. a substantial shareholder of an Issuer or Public Company;
c. an individual, who because of his position or profession, or because of a business relationship with an Issuer or Public Company, has access to
inside information; and
d. an individual who within the last six months was a Person defined in letters a, b or c, above.
Singapore
RHB Research Institute Singapore Pte Ltd and/or its subsidiaries and/or associated companies do not make a market in any securities covered in this
report, except for:
(a) -
The staff of RHB Research Institute Singapore Pte Ltd and its subsidiaries and/or its associated companies do not serve on any board or trustee positions
of any issuer whose securities are covered in this report, except for:
(a) -
RHB Research Institute Singapore Pte Ltd and/or its subsidiaries and/or its associated companies do not have and have not within the last 12 months had
any corporate finance advisory relationship with the issuer of the securities covered in this report or any other relationship (including a shareholding of 1%
or more in the securities covered in this report) that may create a potential conflict of interest, except for:
(a) -
Hong Kong
RHBSHK or any of its group companies may have financial interests in in relation to an issuer or a new listing applicant (as the case may be) the securities
in respect of which are reviewed in the report, and such interests aggregate to an amount equal to or more than (a) 1% of the subject company’s market
capitalization (in the case of an issuer as defined under paragraph 16 of the Code of Conduct for Persons Licensed by or Registered with the Securities
and Futures Commission (the “Code of Conduct”); and/or (b) an amount equal to or more than 1% of the subject company’s issued share capital, or issued
units, as applicable (in the case of a new listing applicant as defined in the Code of Conduct). Further, the analysts named in this report or their associates
may have financial interests in relation to an issuer or a new listing applicant (as the case may be) in the securities which are reviewed in the report.
RHBSHK or any of its group companies may make a market in the securities covered by this report.
RHBSHK or any of its group companies may have analysts or their associates, individual(s) employed by or associated with RHBSHK or any of its group
companies serving as an officer of the company or any of the companies covered by this report.
RHBSHK or any of its group companies may have received compensation or a mandate for investment banking services to the company or any of the
companies covered by this report within the past 12 months.
Note: The reference to “group companies” above refers to a group company of RHBSHK that carries on a business in Hong Kong in (a) investment
banking; (b) proprietary trading or market making; or (c) agency broking, in relation to securities listed or traded on The Stock Exchange of Hong Kong
Limited.

13
Kuala Lumpur Hong Kong Singapore
RHB Research Institute Sdn Bhd Level 11, Tower One, RHB Centre
Jalan Tun Razak Kuala Lumpur
Malaysia Tel : +(60) 3 9280 2185 Fax : +(60) 3 9284 8693
RHB OSK Securities Hong Kong Ltd.
12th Floor
World-Wide House 19 Des Voeux Road Central, Hong Kong
Tel : +(852) 2525 1118 Fax : +(852) 2810 0908
RHB Research Institute Singapore
Pte Ltd (formerly known as DMG & Partners Research Pte Ltd)
10 Collyer Quay #09-08 Ocean Financial Centre
Singapore 049315 Tel : +(65) 6533 1818 Fax : +(65) 6532 6211
Jakarta Shanghai Phnom Penh
PT RHB OSK Securities Indonesia
Wisma Mulia, 20th Floor Jl. Jend. Gatot Subroto No. 42
Jakarta 12710, Indonesia Tel : +(6221) 2783 0888 Fax : +(6221) 2783 0777
RHB OSK (China) Investment Advisory Co. Ltd.
Suite 4005, CITIC Square 1168 Nanjing West Road
Shanghai 20041 China
Tel : +(8621) 6288 9611 Fax : +(8621) 6288 9633
RHB OSK Indochina Securities Limited
No. 1-3, Street 271 Sangkat Toeuk Thla, Khan Sen Sok
Phnom Penh Cambodia
Tel: +(855) 23 969 161 Fax: +(855) 23 969 171
Bangkok
RHB OSK Securities (Thailand) PCL
10th Floor, Sathorn Square Office Tower 98, North Sathorn Road, Silom
Bangrak, Bangkok 10500 Thailand
Tel: +(66) 2 862 9999 Fax : +(66) 2 862 9799

Thai Institute of Directors Association (IOD) – Corporate Governance Report Rating 2014
Excellent
BAFS HANA KTB SAMART SIM BCP INTUCH MINT SAMTEL SPALI BTS IRPC PSL SAT TISCO CPN IVL PTT SC TMB EGCO KBANK PTTEP SCB TOP GRAMMY KKP PTTGC SE-ED
Very Good
AAV BKI DTAC KSL NMG PS SNP TIPCO UAC ACAP BLA DTC LANNA NSI PT SPI TK VGI ADVANC BMCL EASTW LH OCC QH SSF TKT VNT ANAN BROOK EE LHBANK OFM RATCH SSI TNITY WACOAL AOT CENTEL ERW LOXLEY PAP ROBINS SSSC TNL ASIMAR CFRESH GBX LPN PE RS STA TOG ASK CIMBT GC MACO PG S&J SVI TRC ASP CK GFPT MC PHOL SAMCO TCAP TRUE BANPU CNT GUNKUL MCOT PJW SCC TF TSTE BAY CPF HEMRAJ NBC PM SINGER THAI TSTH BBL CSL HMPRO NCH PPS SIS THANI TTA BECL DELTA ICC NINE PR SITHAI THCOM TTW BIGC DRT KCE NKI PRANDA SNC TIP TVO
Good
2S AQUA CCET EA IFS MAKRO NTV PRG SIAM STPI TIC TUF AF ARIP CGD ESSO IHL MATCH NUSA PRIN SIRI SUC TICON TVD AH AS CGS FE INET MBK NWR PTG SKR SWC TIW TWFP AHC ASIA CHOW FORTH IRC MBKET NYT QLT SMG SYMC TKS UMI AIT AYUD CI FPI IRCP MEGA OGC QTC SMK SYNEX TLUXE UP AJ BEAUTY CKP GENCO ITD MFC OISHI RCL SMPC SYNTEC TMI UPF AKP BEC CM GL KBS MFEC PACE SABINA SMT TASCO TMT UPOIC AKR BFIT CMR GLOBAL KGI MJD PATO SALEE SOLAR TBSP TNDT UT AMANAH BH CSC GLOW KKC MODERN PB SCBLIF SPC TEAM TPC UV AMARIN BJC CSP GOLD KTC MONO PDI SCCC SPCG TFD TPCORP UWC AMATA BJCHI CSS HOTPOT L&E MOONG PICO SCG SPPT TFI TRT VIH AP BOL DCC HTC LRH MPG PPM SEAFCO SST THANA TRU WAVE APCO BTNC DEMCO HTECH LST MTI PPP SEAOIL STANLY THIP TSC WHA APCS BWG DNA HYDRO MAJOR NC PREB SFP STEC THREL TTCL WIN
WINNER YUASA
ZMICO
IOD (IOD Disclaimer)
การเปดเผลผลการส ารวจของสมาคมสงเสรมสถาบนกรรมการบรษทไทย (IOD) ในเรองการก ากบดแลกจการ (Corporate Governance) นเปนการด าเนนการตามนโยบายของส านกงานคณะกรรมการก ากบหลกทรพยและตลาดหลกทรพย โดยการส ารวจของ IOD เปนการส ารวจและประเมนจากขอมลของบรษทจดทะเบยนในตลาดหลกทรพยแหงประเทศไทยและตลาดหลกทรพยเอมเอไอ ทมการเปดเผยตอสาธารณะและเปนขอมลทผลงทนทวไปสามารถเขาถงได ดงนนผลส ารวจดงกลาวจงเปนการน าเสนอในมมมองของบคคลภายนอกโดยไมไดเปนการประเมนการปฏบตและมไดมการใชขอมลภายในในการประเมน
อนง ผลการส ารวจดงกลาว เปนผลการส ารวจ ณ วนทปรากฎในรายงานการก ากบดและกจการบรษทจดทะเบยนไทยเทานน ดงนนผลการส ารวจจงอาจเปลยนแปลงไดภายหลงวนดงกลาว ทงนบรษทหลกทรพย อารเอสบ โอเอส เค จ ากด (มหาชน) มไดยนยนหรอรบรองถงความถกตองของผลการส ารวจดงกลาวแตอยางใด