ADITYA BIRLA · ADITYA BIRLA GROUP‐ OVERVIEW ... ROCE ‐Return on Average Capital Employed ROIC...
61
14 th May, 2018 BSE Limited Corporate Relationship Department Phiroze Jeejeebhoy Towers, Dalal Street Mumbai 400 001. Tel.: 2272 1233/34 Fax:22721919 Scrip Code: 532538 Dear Sirs, ADITYA BIRLA The Manager Listing Department The National Stock Exchange of India Limited "Exchange Plaza", Sandra - Kurla Complex, Sandra (East), Mumbai 400 051. Tel.: 26598236 Fax: 2659 8237 I 38. Scrip Code: ULTRACEMCO Sub: Disclosure under Regulation 30 of Securities and Exchange Board of India (Listing Obligations and Disclosure Requirements) Regulations, 2015 - Intimation of Investor Meeting and Corporate Dossier In terms of Regulation 30 of the Securities and Exchange Board of India (listing Obligations and Disclosure Requirements) Regulations, 2015, please find attached details of the investor meetings to be held on 14 1h and 15 th May, 2018 which will be attended by the representatives of the Company. The Schedule may undergo change due to exigencies on part of the investor I Company. An updated Corporate Dossier is also attached. This is for your information and records, please. Thanking you, Yours faithfully, For UltraTech Cement Limited S. K. Chatterjee Company Secretary Encl. a/a. U 14·M4MM,MM The Engineer's Choice UltraTech Cement Limited Registered Office : Ahura Centre, B - Wing, 2"' Floor, Mahakali Caves Road, Andheri (East), Mumbai 400 093, India T: +91 22 6691 7800/ 2926 7800 I F:+91 22 6692 8109 IW:www.ultratechcement.com/ www.adityabirla.com I CIN : L26940MH2000PLC128420
Transcript of ADITYA BIRLA · ADITYA BIRLA GROUP‐ OVERVIEW ... ROCE ‐Return on Average Capital Employed ROIC...
14th May, 2018
BSE Limited Corporate Relationship Department Phiroze Jeejeebhoy Towers, Dalal Street Mumbai 400 001. Tel.: 2272 1233/34 Fax:22721919 Scrip Code: 532538
Dear Sirs,
ADITYA BIRLA
The Manager Listing Department The National Stock Exchange of India Limited "Exchange Plaza", Sandra - Kurla Complex, Sandra (East), Mumbai 400 051. Tel.: 26598236 Fax: 2659 8237 I 38. Scrip Code: ULTRACEMCO
Sub: Disclosure under Regulation 30 of Securities and Exchange Board of India (Listing Obligations and Disclosure Requirements) Regulations, 2015 - Intimation of
Investor Meeting and Corporate Dossier
In terms of Regulation 30 of the Securities and Exchange Board of India (listing Obligations and Disclosure Requirements) Regulations, 2015, please find attached details of the investor meetings to be held on 141h and 15th May, 2018 which will be attended by the representatives of the Company.
The Schedule may undergo change due to exigencies on part of the investor I Company.
An updated Corporate Dossier is also attached.
This is for your information and records, please.
Thanking you,
Yours faithfully, For UltraTech Cement Limited
S. K. Chatterjee Company Secretary
Encl. a/a.
Ultra»Jch 14·M4MM,MM
The Engineer's Choice
UltraTech Cement Limited
Registered Office : Ahura Centre, B - Wing, 2"' Floor, Mahakali Caves Road, Andheri (East), Mumbai 400 093, India
T: +91 22 6691 7800 / 2926 7800 I F: +91 22 6692 8109 IW:www.ultratechcement.com/ www.adityabirla.com I CIN : L26940MH2000PLC128420
INDIA'SLARGESTCEMENT
COMPANY
STOCK CODE: BSE: 532538 NSE: ULTRACEMCO REUTERS: UTCL.NS BLOOMBERG: UTCEM IS / UTCEM LX
CORPORATE DOSSIER
CONTENTS
ADITYA BIRLA GROUP‐
OVERVIEW
INDIAN CEMENT SECTOR
ULTRATECH LANDSCAPE
OPERATIONAL AND FINANCIAL PERFORMANCE
GLOSSARYMnt ‐Million Metric tons Lmt ‐ Lakhs Metric tons MTPA ‐Million Tons Per Annum MW ‐Mega Watts Q1 ‐ April‐June Q2 ‐ July – SeptemberQ3 ‐ October ‐ December Q4 ‐ January‐March CY ‐ Current year period LY ‐ Corresponding period last Year FY ‐Financial Year (April‐March)ROCE ‐ Return on Average Capital Employed ROIC ‐ Return on Invested Capital
Note: The financial figures in this presentation have been rounded off to the nearest ` 1 Cr. 1 US$ = ` 64.35

ADITYA BIRLA GROUPOVERVIEW
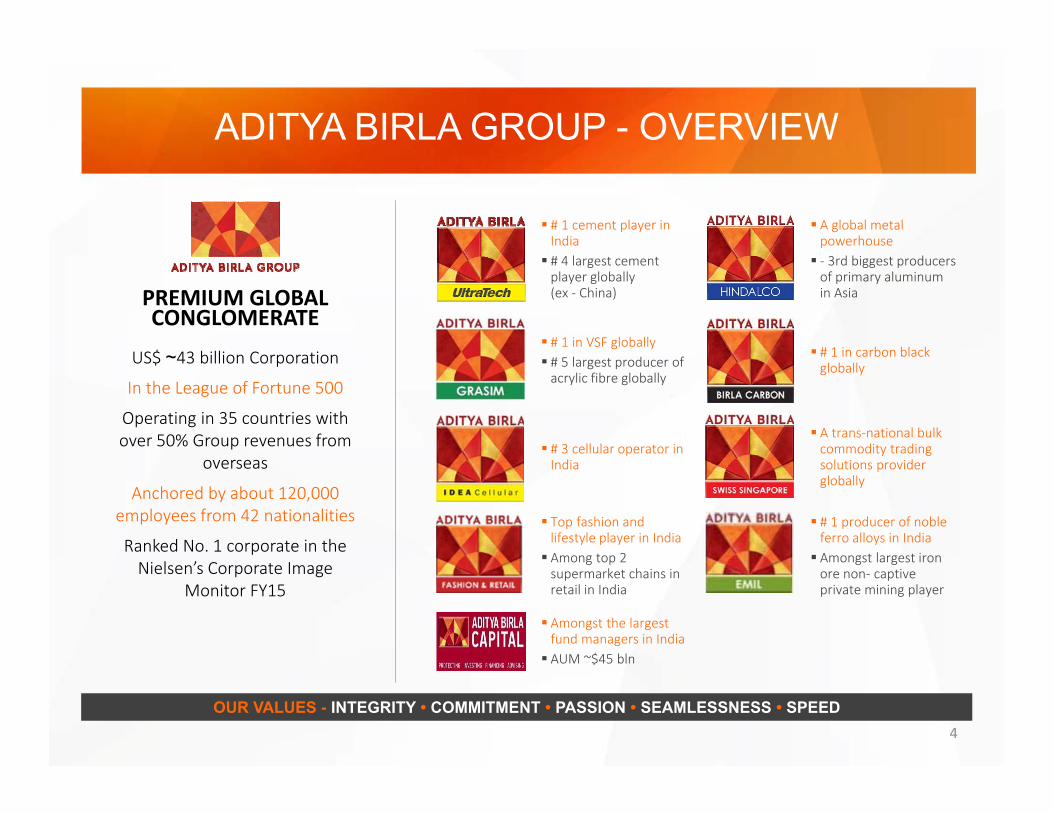
ADITYA BIRLA GROUP - OVERVIEW
PREMIUM GLOBAL CONGLOMERATE
4
US$ ~43 billion CorporationIn the League of Fortune 500
Operating in 35 countries with over 50% Group revenues from
overseas
Anchored by about 120,000 employees from 42 nationalities
Ranked No. 1 corporate in the Nielsen’s Corporate Image
Monitor FY15
# 1 cement player in India # 4 largest cement player globally (ex ‐ China)
# 1 in VSF globally # 5 largest producer of acrylic fibre globally
# 3 cellular operator in India
Top fashion and lifestyle player in India Among top 2 supermarket chains in retail in India
A global metal powerhouse ‐ 3rd biggest producers of primary aluminum in Asia
# 1 in carbon black globally
A trans‐national bulk commodity trading solutions provider globally
# 1 producer of noble ferro alloys in India Amongst largest iron ore non‐ captive private mining player
Amongst the largest fund managers in India AUM ~$45 bln
OUR VALUES - INTEGRITY • COMMITMENT • PASSION • SEAMLESSNESS • SPEED
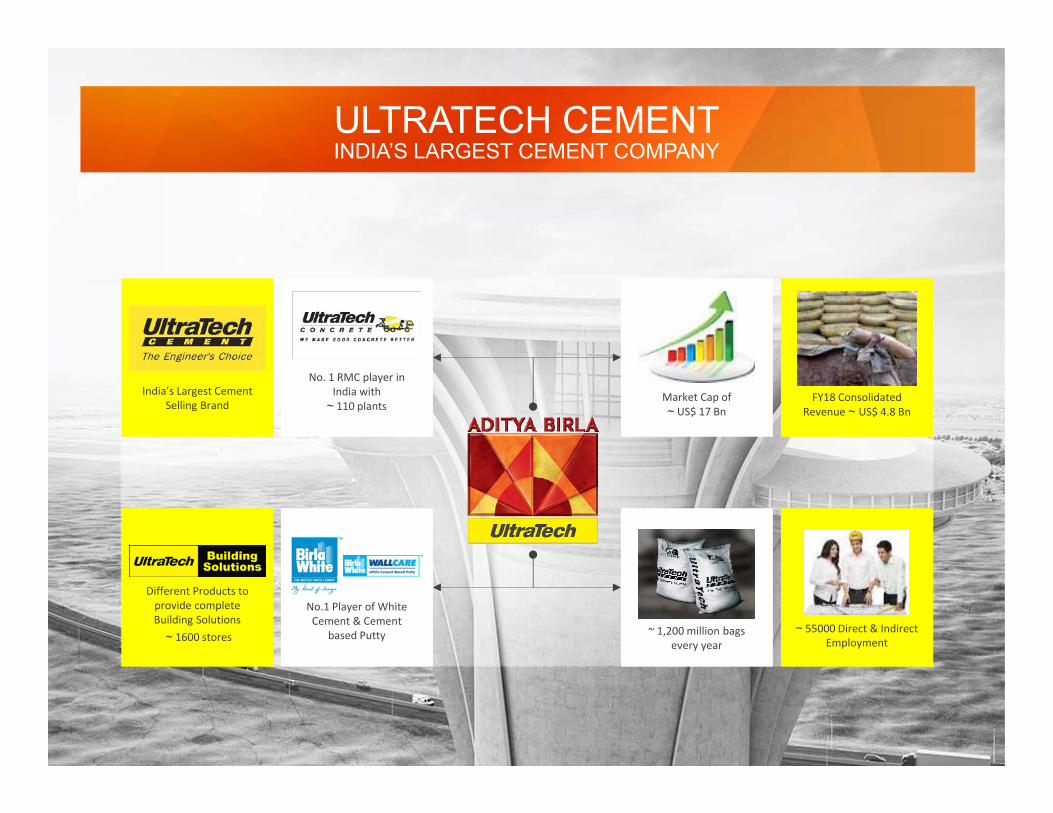
ULTRATECH CEMENT
India’s Largest Cement Selling Brand
5
INDIA’S LARGEST CEMENT COMPANY
No. 1 RMC player in India with
~ 110 plantsMarket Cap of~ US$ 17 Bn
FY18 Consolidated Revenue ~ US$ 4.8 Bn
Different Products to provide complete Building Solutions
~ 1600 stores
No.1 Player of White Cement & Cement
based Putty ~ 1,200 million bags every year
~ 55000 Direct & Indirect Employment
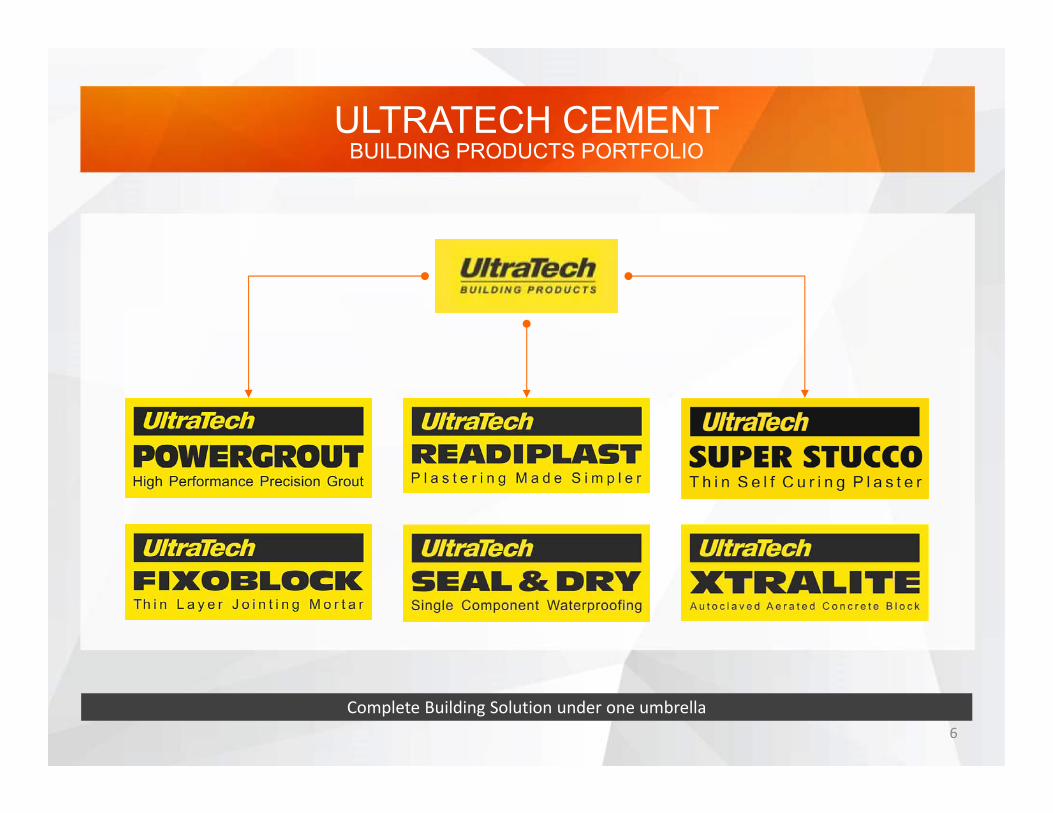
ULTRATECH CEMENT
6
BUILDING PRODUCTS PORTFOLIO
Complete Building Solution under one umbrella

OUR VISION AND MISSION
7
Vision
To be The Leader in Building Solutions
Mission
To deliver superior value to our stakeholders on the four pillars of
Innovation Team EmpowermentSustainability Customer
Centricity
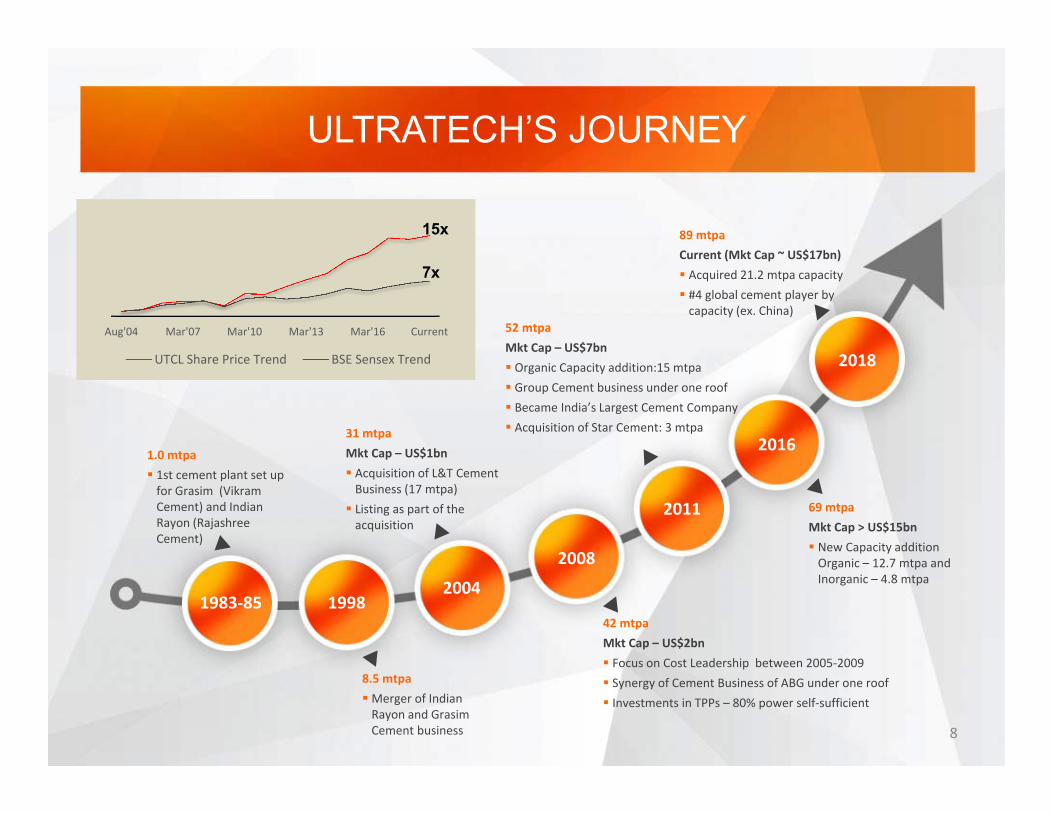
31 mtpaMkt Cap – US$1bn Acquisition of L&T Cement Business (17 mtpa) Listing as part of the acquisition
ULTRATECH’S JOURNEY
8
1.0 mtpa 1st cement plant set up for Grasim (VikramCement) and Indian Rayon (RajashreeCement)
8.5 mtpaMerger of Indian Rayon and Grasim Cement business
42 mtpaMkt Cap – US$2bn Focus on Cost Leadership between 2005‐2009 Synergy of Cement Business of ABG under one roof Investments in TPPs – 80% power self‐sufficient
52 mtpaMkt Cap – US$7bn Organic Capacity addition:15 mtpa Group Cement business under one roof Became India’s Largest Cement Company Acquisition of Star Cement: 3 mtpa
69 mtpaMkt Cap > US$15bn New Capacity addition Organic – 12.7 mtpa and Inorganic – 4.8 mtpa
89 mtpaCurrent (Mkt Cap ~ US$17bn) Acquired 21.2 mtpa capacity #4 global cement player by capacity (ex. China)
Aug'04 Mar'07 Mar'10 Mar'13 Mar'16 Current
UTCL Share Price Trend BSE Sensex Trend
15x
7x
1983‐85 19982004
2008
2011
2016
2018
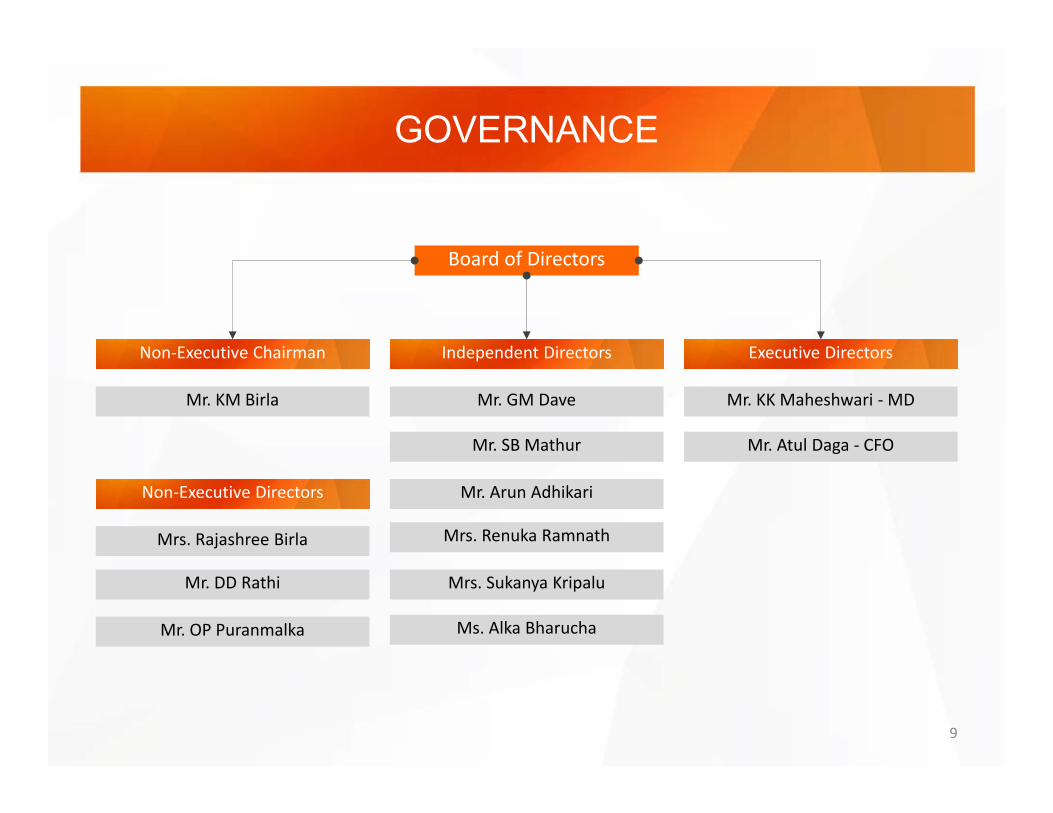
GOVERNANCE
9
Board of Directors
Non‐Executive Chairman Independent Directors Executive Directors
Mr. KM Birla Mr. GM Dave Mr. KK Maheshwari ‐ MD
Non‐Executive Directors
Mr. SB Mathur Mr. Atul Daga ‐ CFO
Mrs. Rajashree Birla
Mr. Arun Adhikari
Mr. DD Rathi
Mrs. Renuka Ramnath
Mr. OP Puranmalka
Mrs. Sukanya Kripalu
Ms. Alka Bharucha
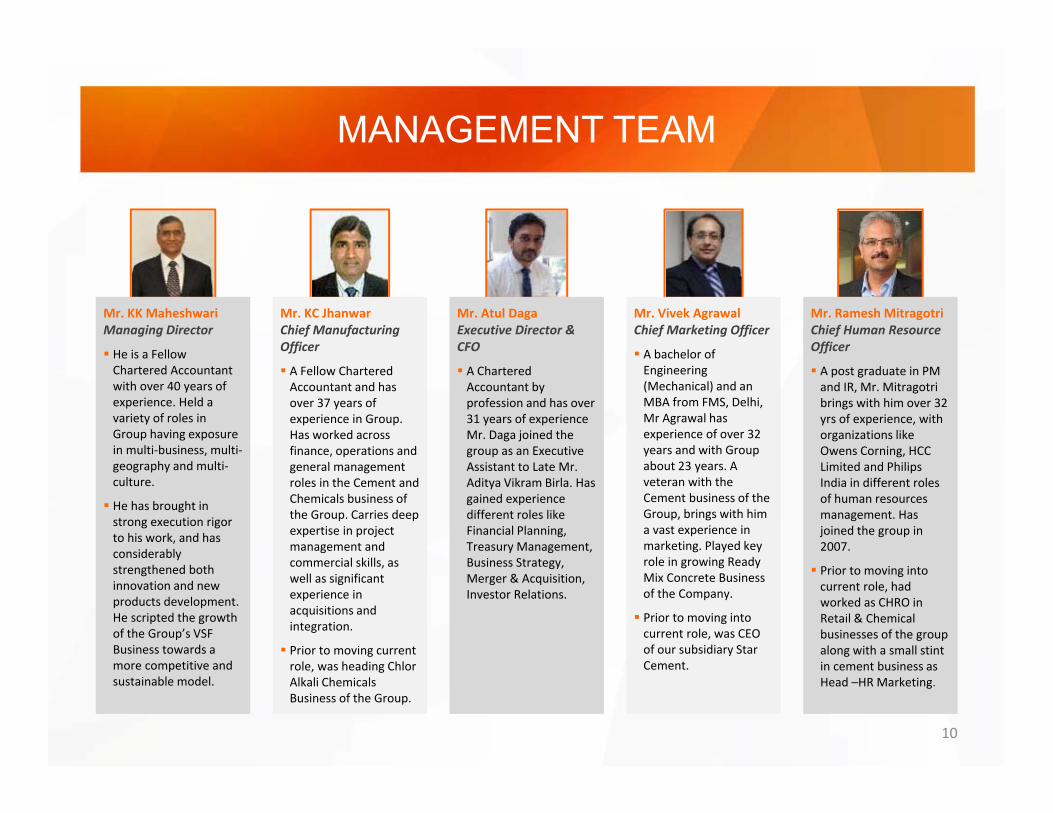
MANAGEMENT TEAM
10
Mr. KK MaheshwariManaging Director
He is a Fellow Chartered Accountant with over 40 years of experience. Held a variety of roles in Group having exposure in multi‐business, multi‐geography and multi‐culture.
He has brought in strong execution rigor to his work, and has considerably strengthened both innovation and new products development. He scripted the growth of the Group’s VSF Business towards a more competitive and sustainable model.
Mr. KC JhanwarChief Manufacturing Officer
A Fellow Chartered Accountant and has over 37 years of experience in Group. Has worked across finance, operations and general management roles in the Cement and Chemicals business of the Group. Carries deep expertise in project management and commercial skills, as well as significant experience in acquisitions and integration.
Prior to moving current role, was heading ChlorAlkali Chemicals Business of the Group.
Mr. Atul DagaExecutive Director & CFO
A Chartered Accountant by profession and has over 31 years of experience Mr. Daga joined the group as an Executive Assistant to Late Mr. Aditya Vikram Birla. Has gained experience different roles like Financial Planning, Treasury Management, Business Strategy, Merger & Acquisition, Investor Relations.
Mr. Vivek AgrawalChief Marketing Officer
A bachelor of Engineering (Mechanical) and an MBA from FMS, Delhi, Mr Agrawal has experience of over 32 years and with Group about 23 years. A veteran with the Cement business of the Group, brings with him a vast experience in marketing. Played key role in growing Ready Mix Concrete Business of the Company.
Prior to moving into current role, was CEO of our subsidiary Star Cement.
Mr. Ramesh MitragotriChief Human Resource Officer
A post graduate in PM and IR, Mr. Mitragotri brings with him over 32 yrs of experience, with organizations like Owens Corning, HCC Limited and Philips India in different roles of human resources management. Has joined the group in 2007.
Prior to moving into current role, had worked as CHRO in Retail & Chemical businesses of the group along with a small stint in cement business as Head –HR Marketing.
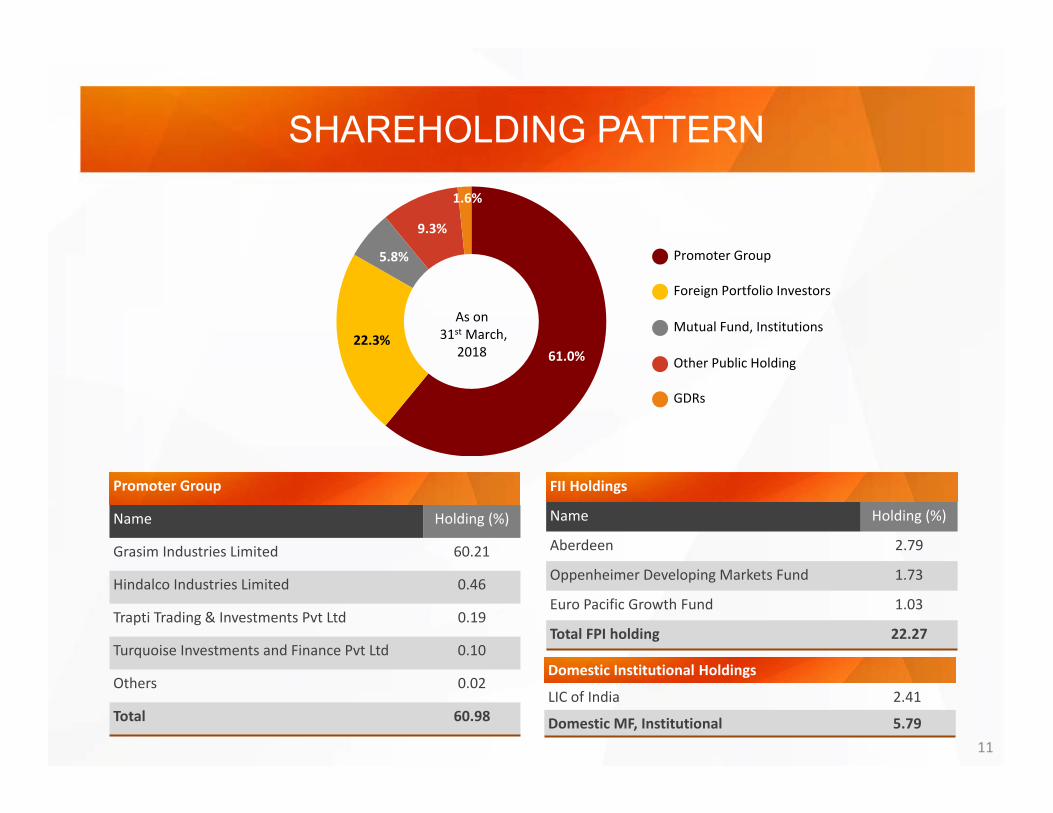
SHAREHOLDING PATTERN
11
Promoter Group
Name Holding (%)
Grasim Industries Limited 60.21
Hindalco Industries Limited 0.46
Trapti Trading & Investments Pvt Ltd 0.19
Turquoise Investments and Finance Pvt Ltd 0.10
Others 0.02
Total 60.98
FII Holdings
Name Holding (%)
Aberdeen 2.79
Oppenheimer Developing Markets Fund 1.73
Euro Pacific Growth Fund 1.03
Total FPI holding 22.27
61.0%22.3%
5.8%
9.3%
1.6%
Promoter Group
Foreign Portfolio Investors
Mutual Fund, Institutions
Other Public Holding
GDRs
As on31st March,
2018
Domestic Institutional Holdings
LIC of India 2.41
Domestic MF, Institutional 5.79
Indian Cement Sector
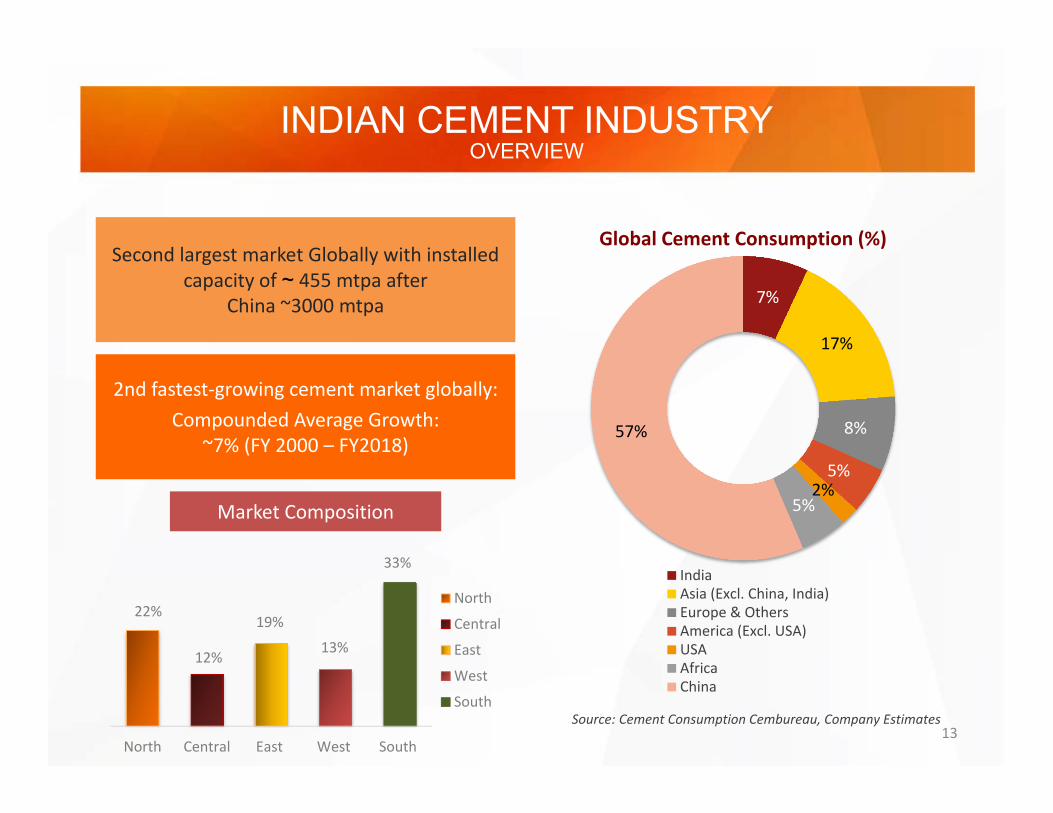
INDIAN CEMENT INDUSTRY
13
OVERVIEW
Second largest market Globally with installed capacity of ~ 455 mtpa after
China ~3000 mtpa
2nd fastest‐growing cement market globally: Compounded Average Growth:
~7% (FY 2000 – FY2018)
Market Composition
7%
17%
8%
5%2%
5%
57%
Global Cement Consumption (%)
IndiaAsia (Excl. China, India)Europe & OthersAmerica (Excl. USA)USAAfricaChina
Source: Cement Consumption Cembureau, Company Estimates
22%
12%
19%
13%
33%
North Central East West South
North
Central
East
West
South
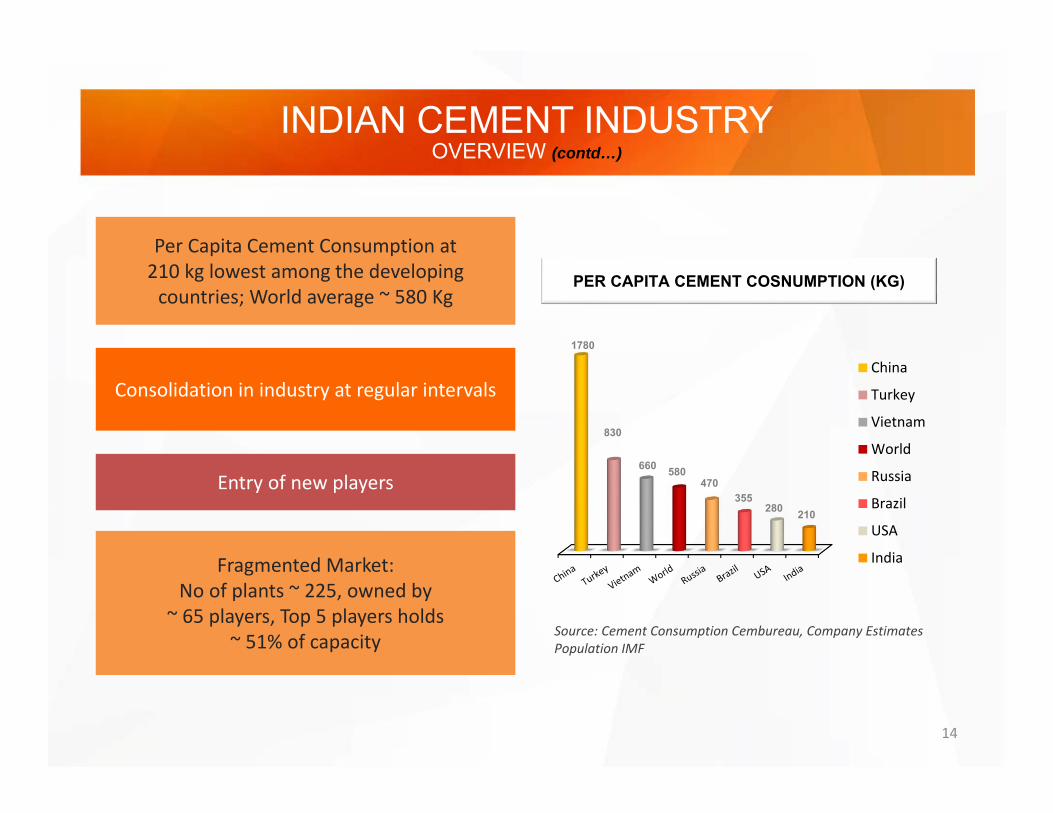
INDIAN CEMENT INDUSTRY
14
OVERVIEW (contd…)
Per Capita Cement Consumption at 210 kg lowest among the developing countries; World average ~ 580 Kg
Consolidation in industry at regular intervals
Entry of new players
Fragmented Market:No of plants ~ 225, owned by
~ 65 players, Top 5 players holds ~ 51% of capacity Source: Cement Consumption Cembureau, Company Estimates
Population IMF
PER CAPITA CEMENT COSNUMPTION (KG)
1780
830
660 580470
355280 210
China
Turkey
Vietnam
World
Russia
Brazil
USA
India
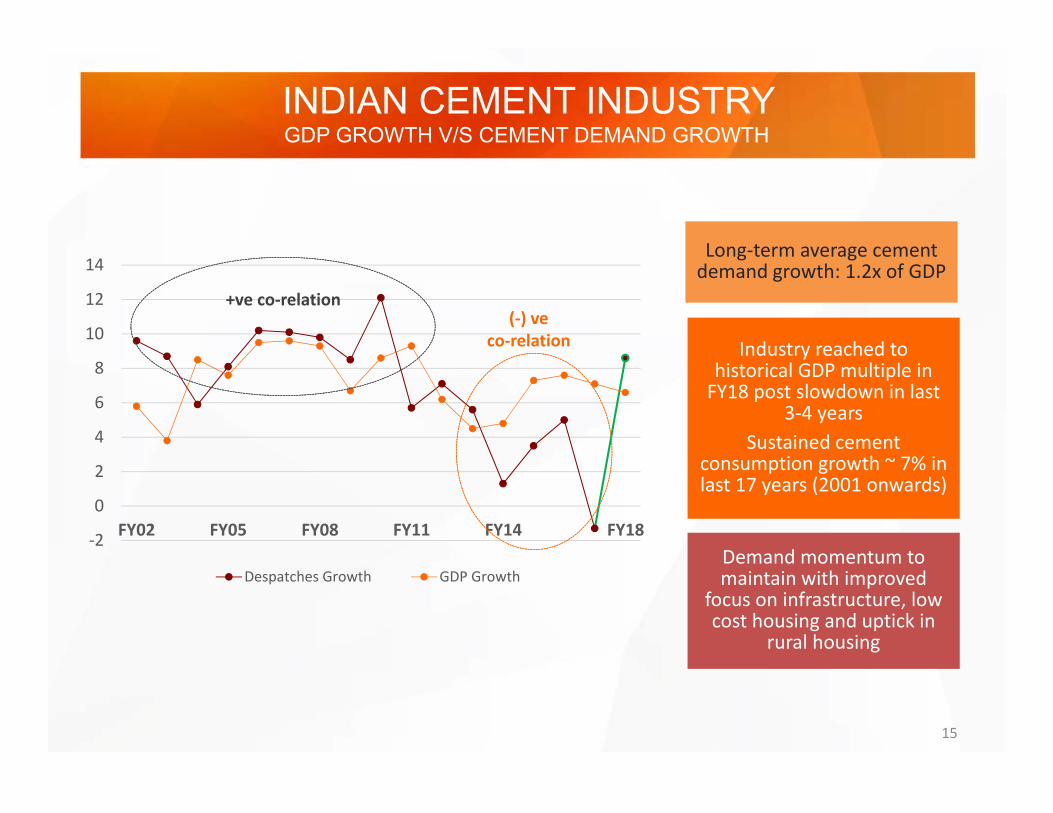
INDIAN CEMENT INDUSTRY
15
GDP GROWTH V/S CEMENT DEMAND GROWTH
Long‐term average cement demand growth: 1.2x of GDP
Industry reached to historical GDP multiple in FY18 post slowdown in last
3‐4 years Sustained cement
consumption growth ~ 7% in last 17 years (2001 onwards)
Demand momentum to maintain with improved
focus on infrastructure, low cost housing and uptick in
rural housing
‐2
0
2
4
6
8
10
12
14
FY02 FY05 FY08 FY11 FY14 FY18
Despatches Growth GDP Growth
+ve co‐relation(‐) ve
co‐relation
INDIAN CEMENT INDUSTRY
16
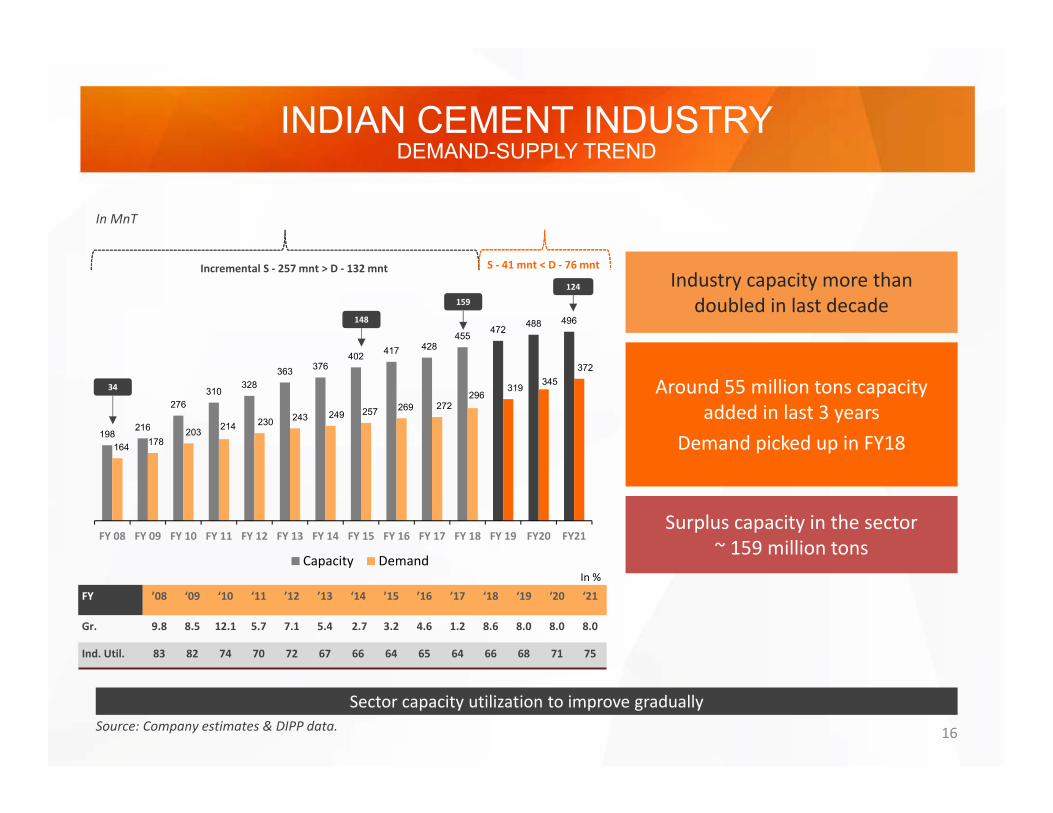
DEMAND-SUPPLY TREND
198216
276310
328363 376
402 417 428455
472 488 496
164 178203 214 230 243 249 257 269 272
296319 345
372
FY 08 FY 09 FY 10 FY 11 FY 12 FY 13 FY 14 FY 15 FY 16 FY 17 FY 18 FY 19 FY20 FY21
Capacity Demand
Industry capacity more than doubled in last decade
Around 55 million tons capacity added in last 3 years
Demand picked up in FY18
Surplus capacity in the sector ~ 159 million tons
Sector capacity utilization to improve gradually
In MnT
Source: Company estimates & DIPP data.
FY ’08 ‘09 ‘10 ‘11 ’12 ’13 ‘14 ’15 ’16 ’17 ‘18 ‘19 ‘20 ‘21
Gr. 9.8 8.5 12.1 5.7 7.1 5.4 2.7 3.2 4.6 1.2 8.6 8.0 8.0 8.0
Ind. Util. 83 82 74 70 72 67 66 64 65 64 66 68 71 75
Incremental S ‐ 257 mnt > D ‐ 132 mnt S ‐ 41 mnt < D ‐ 76 mnt
159
124
34
148
In %
DEMAND GROWTH DRIVERS
17
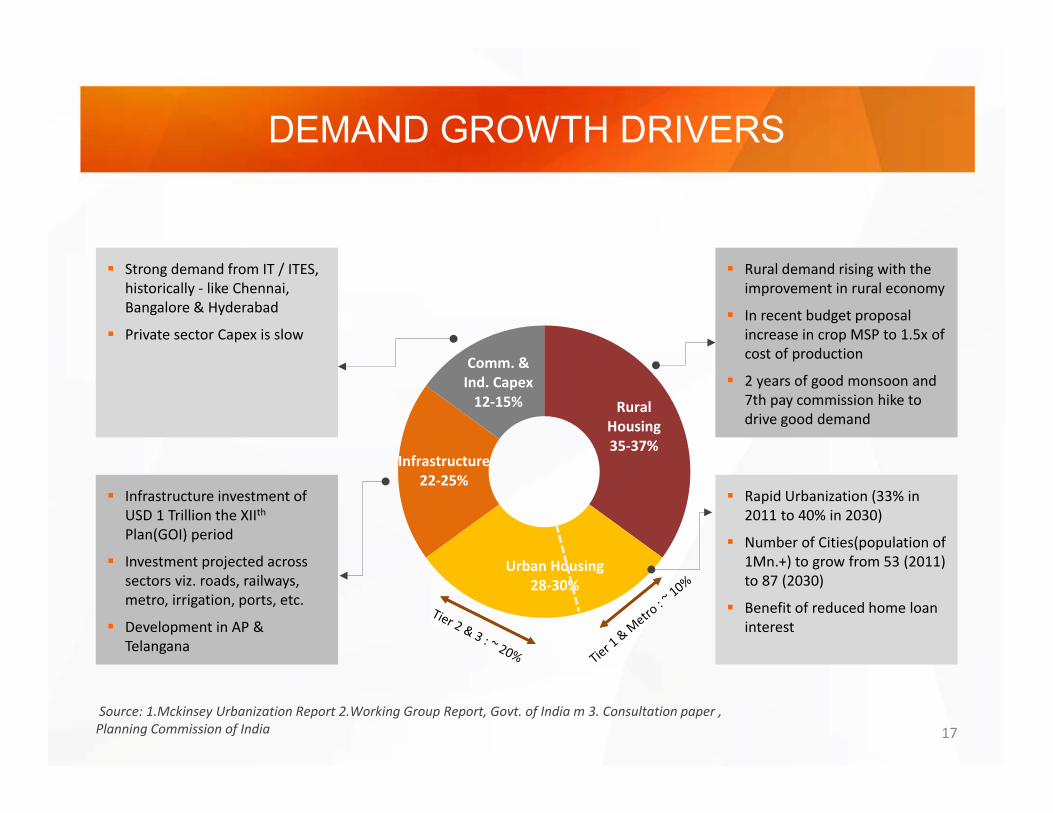
Strong demand from IT / ITES, historically ‐ like Chennai, Bangalore & Hyderabad
Private sector Capex is slow
Source: 1.Mckinsey Urbanization Report 2.Working Group Report, Govt. of India m 3. Consultation paper , Planning Commission of India
Rural demand rising with the improvement in rural economy
In recent budget proposal increase in crop MSP to 1.5x of cost of production
2 years of good monsoon and 7th pay commission hike to drive good demand
Infrastructure investment of USD 1 Trillion the XIIthPlan(GOI) period
Investment projected across sectors viz. roads, railways, metro, irrigation, ports, etc.
Development in AP & Telangana
Rapid Urbanization (33% in 2011 to 40% in 2030)
Number of Cities(population of 1Mn.+) to grow from 53 (2011) to 87 (2030)
Benefit of reduced home loan interest
Rural Housing 35‐37%
Urban Housing28‐30%
Infrastructure22‐25%
Comm. & Ind. Capex12‐15%
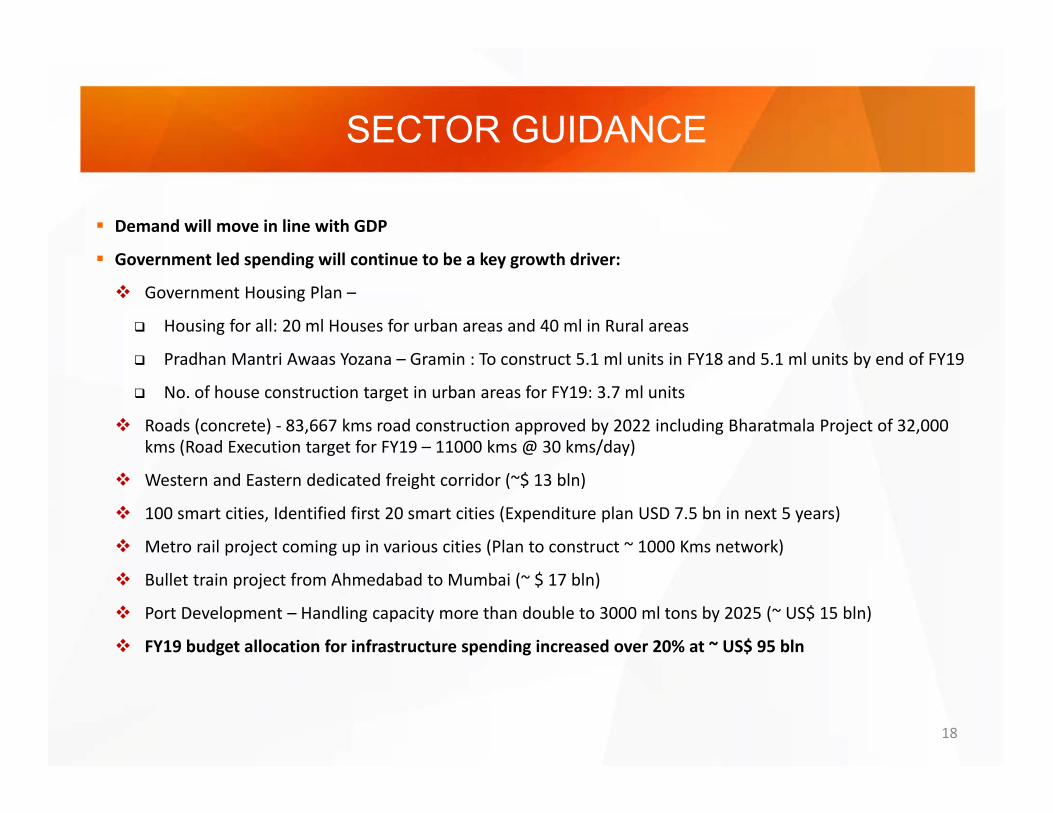
SECTOR GUIDANCE
18
Demand will move in line with GDP
Government led spending will continue to be a key growth driver:
Government Housing Plan –
Housing for all: 20 ml Houses for urban areas and 40 ml in Rural areas
Pradhan Mantri Awaas Yozana – Gramin : To construct 5.1 ml units in FY18 and 5.1 ml units by end of FY19
No. of house construction target in urban areas for FY19: 3.7 ml units
Roads (concrete) ‐ 83,667 kms road construction approved by 2022 including Bharatmala Project of 32,000 kms (Road Execution target for FY19 – 11000 kms @ 30 kms/day)
Western and Eastern dedicated freight corridor (~$ 13 bln)
100 smart cities, Identified first 20 smart cities (Expenditure plan USD 7.5 bn in next 5 years)
Metro rail project coming up in various cities (Plan to construct ~ 1000 Kms network)
Bullet train project from Ahmedabad to Mumbai (~ $ 17 bln)
Port Development – Handling capacity more than double to 3000 ml tons by 2025 (~ US$ 15 bln)
FY19 budget allocation for infrastructure spending increased over 20% at ~ US$ 95 bln
UltraTech Landscape
ULTRATECH
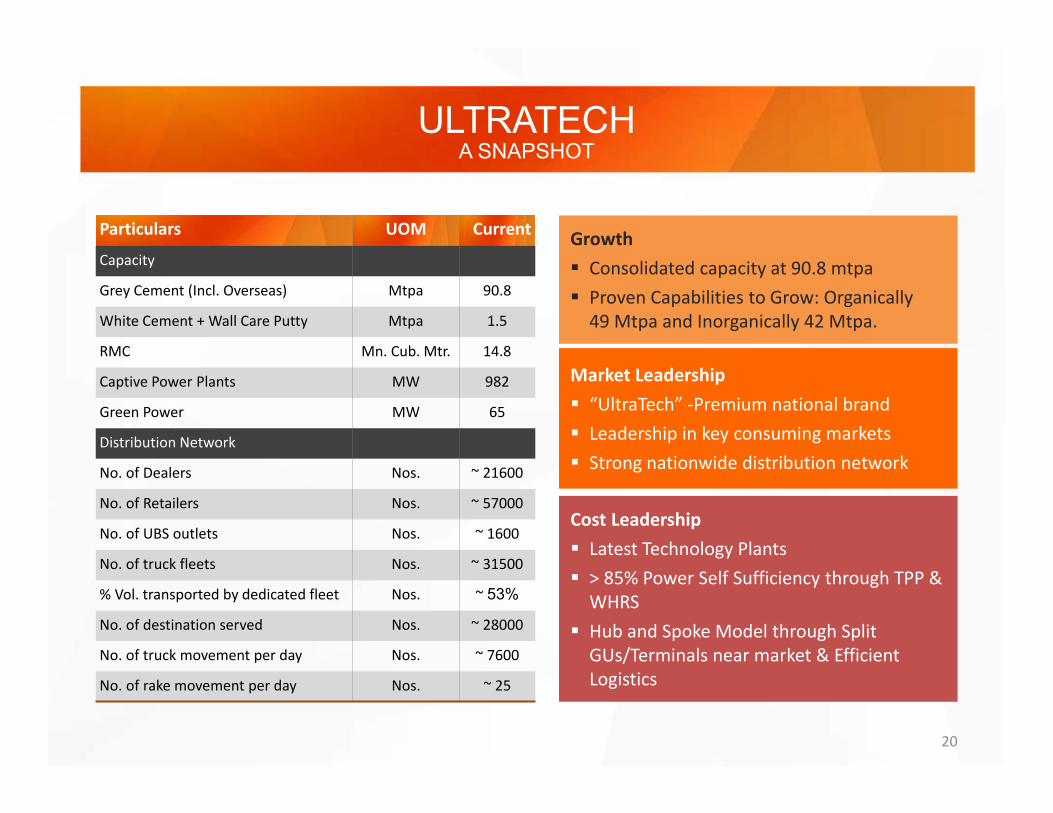
20
A SNAPSHOT
Growth Consolidated capacity at 90.8 mtpa Proven Capabilities to Grow: Organically 49 Mtpa and Inorganically 42 Mtpa.
Particulars UOM Current
Capacity
Grey Cement (Incl. Overseas) Mtpa 90.8
White Cement + Wall Care Putty Mtpa 1.5
RMC Mn. Cub. Mtr. 14.8
Captive Power Plants MW 982
Green Power MW 65
Distribution Network
No. of Dealers Nos. ~ 21600
No. of Retailers Nos. ~ 57000
No. of UBS outlets Nos. ~ 1600
No. of truck fleets Nos. ~ 31500
% Vol. transported by dedicated fleet Nos. ~ 53%
No. of destination served Nos. ~ 28000
No. of truck movement per day Nos. ~ 7600
No. of rake movement per day Nos. ~ 25
Cost Leadership Latest Technology Plants > 85% Power Self Sufficiency through TPP & WHRS
Hub and Spoke Model through Split GUs/Terminals near market & Efficient Logistics
Market Leadership “UltraTech” ‐Premium national brand Leadership in key consuming markets Strong nationwide distribution network
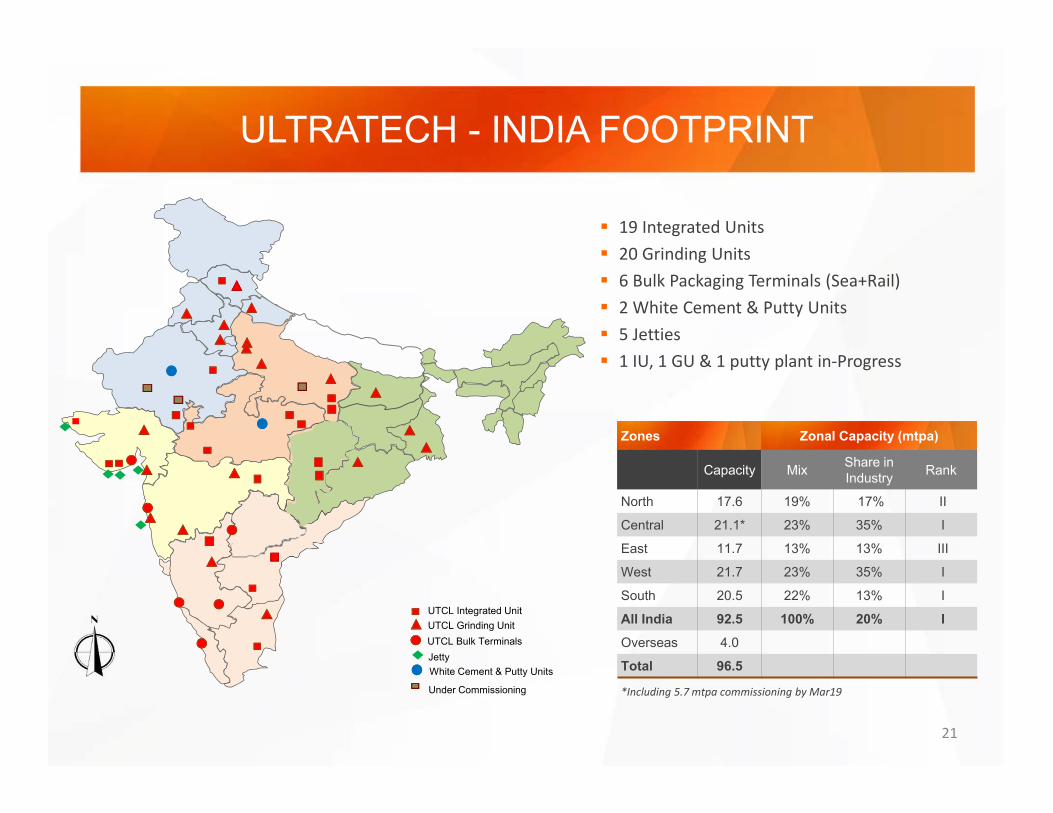
ULTRATECH - INDIA FOOTPRINT
21
19 Integrated Units 20 Grinding Units 6 Bulk Packaging Terminals (Sea+Rail) 2 White Cement & Putty Units 5 Jetties 1 IU, 1 GU & 1 putty plant in‐Progress
Zones Zonal Capacity (mtpa)
Capacity Mix Share inIndustry Rank
North 17.6 19% 17% II
Central 21.1* 23% 35% I
East 11.7 13% 13% III
West 21.7 23% 35% I
South 20.5 22% 13% I
All India 92.5 100% 20% IOverseas 4.0
Total 96.5
*Including 5.7 mtpa commissioning by Mar19
White Cement & Putty Units
Under Commissioning
Jetty
UTCL Grinding UnitUTCL Integrated Unit
UTCL Bulk Terminals
Operational and Financial Performance
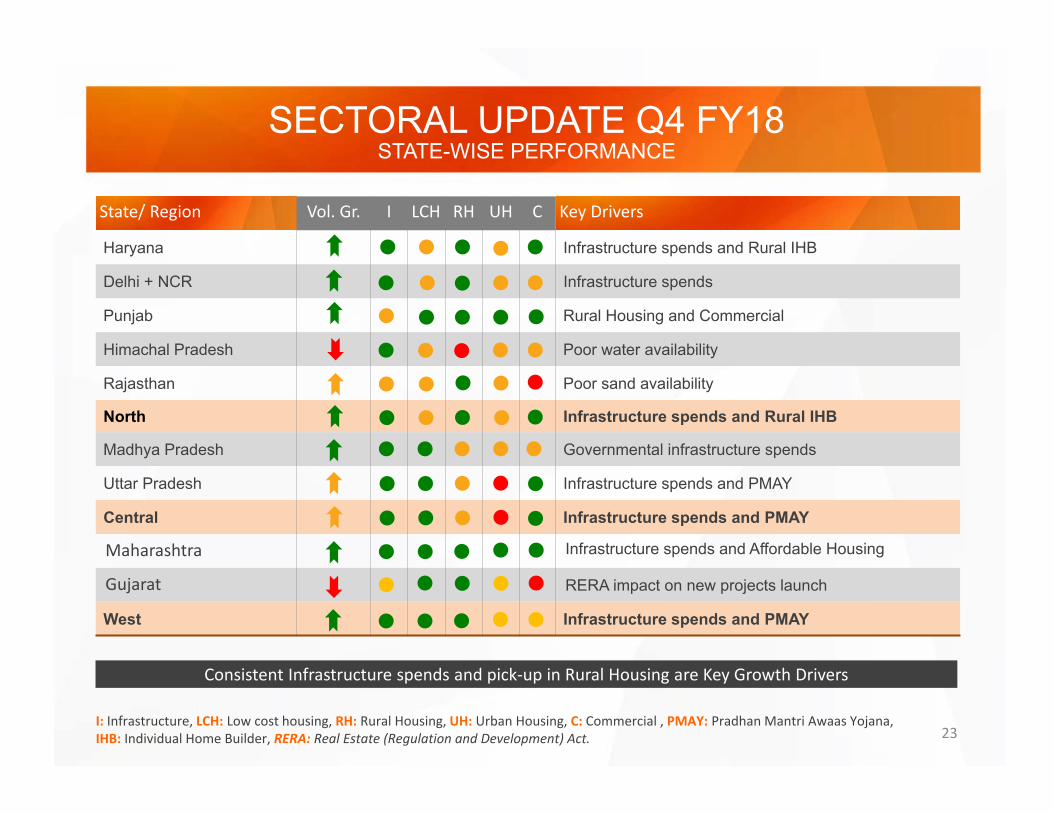
SECTORAL UPDATE Q4 FY18
23
STATE-WISE PERFORMANCE
Consistent Infrastructure spends and pick‐up in Rural Housing are Key Growth Drivers
I: Infrastructure, LCH: Low cost housing, RH: Rural Housing, UH: Urban Housing, C: Commercial , PMAY: Pradhan Mantri Awaas Yojana, IHB: Individual Home Builder, RERA: Real Estate (Regulation and Development) Act.
State/ Region Vol. Gr. I LCH RH UH C Key Drivers
Haryana Infrastructure spends and Rural IHB
Delhi + NCR Infrastructure spends
Punjab Rural Housing and Commercial
Himachal Pradesh Poor water availability
Rajasthan Poor sand availability
North Infrastructure spends and Rural IHB
Madhya Pradesh Governmental infrastructure spends
Uttar Pradesh Infrastructure spends and PMAY
Central Infrastructure spends and PMAY
Maharashtra Infrastructure spends and Affordable Housing
Gujarat RERA impact on new projects launch
West Infrastructure spends and PMAY
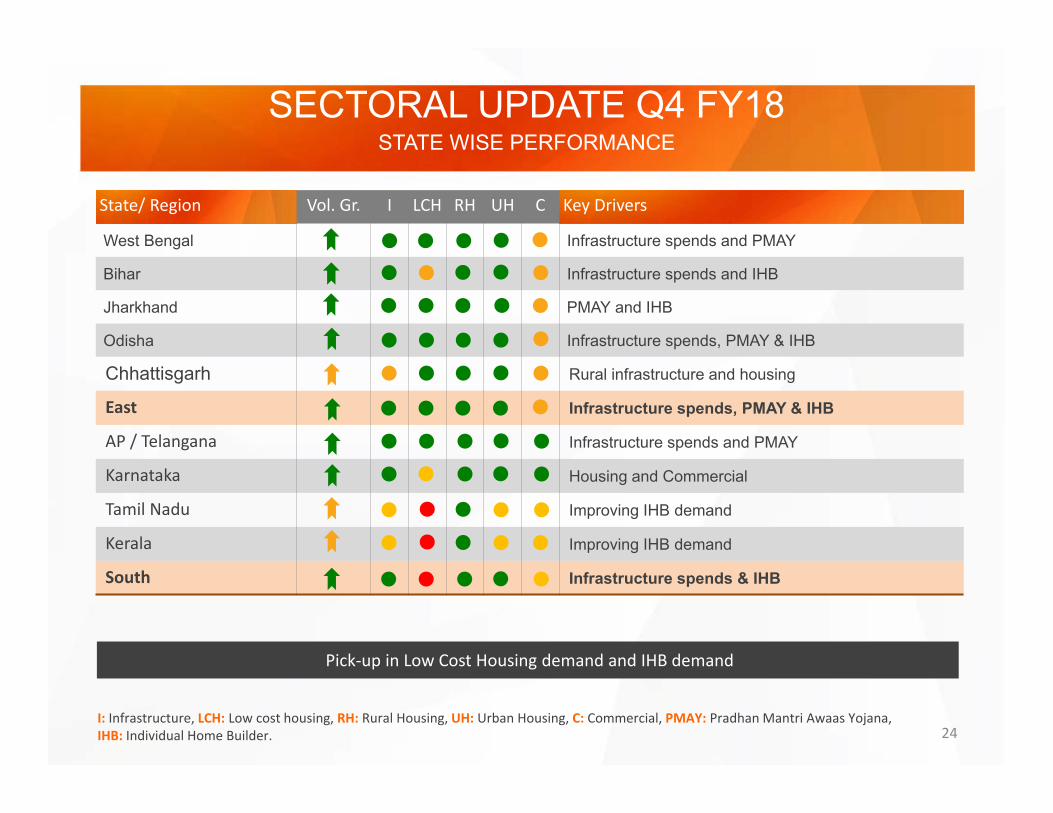
SECTORAL UPDATE Q4 FY18
24
STATE WISE PERFORMANCE
Pick‐up in Low Cost Housing demand and IHB demand
I: Infrastructure, LCH: Low cost housing, RH: Rural Housing, UH: Urban Housing, C: Commercial, PMAY: Pradhan Mantri Awaas Yojana, IHB: Individual Home Builder.
State/ Region Vol. Gr. I LCH RH UH C Key Drivers
West Bengal Infrastructure spends and PMAY
Bihar Infrastructure spends and IHB
Jharkhand PMAY and IHB
Odisha Infrastructure spends, PMAY & IHB
Chhattisgarh Rural infrastructure and housing
East Infrastructure spends, PMAY & IHB
AP / Telangana Infrastructure spends and PMAY
Karnataka Housing and Commercial
Tamil Nadu Improving IHB demand
Kerala Improving IHB demand
South Infrastructure spends & IHB
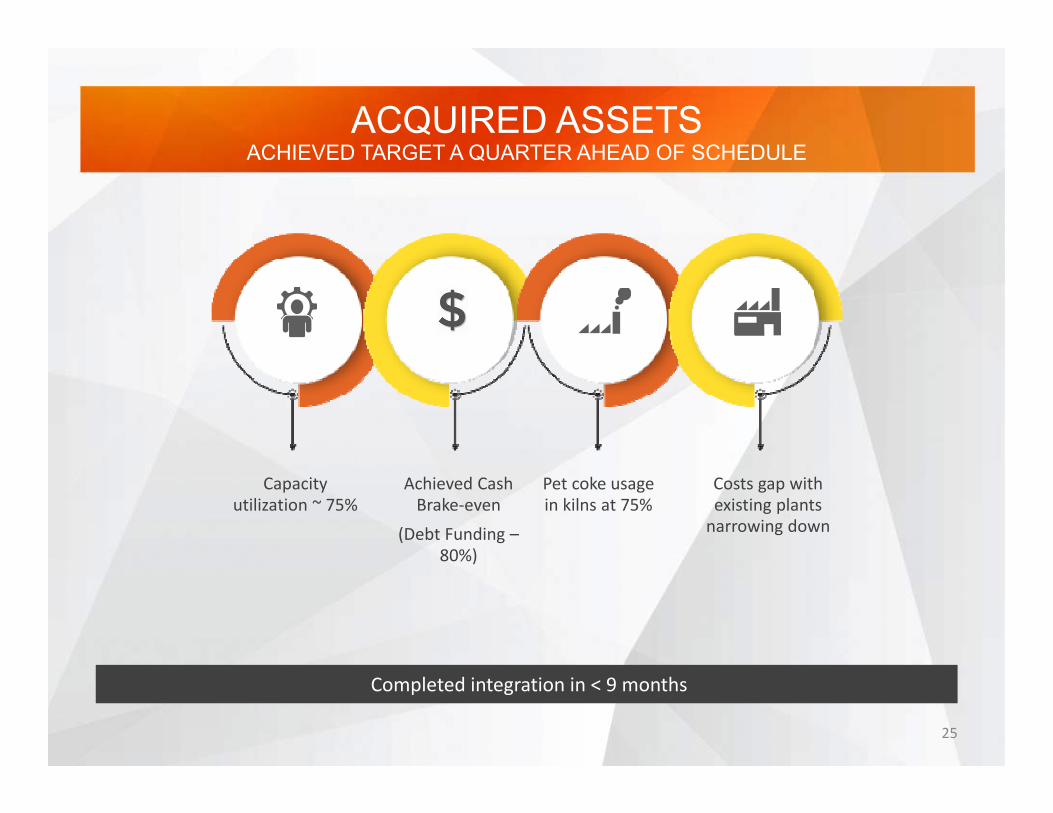
ACQUIRED ASSETS
25
ACHIEVED TARGET A QUARTER AHEAD OF SCHEDULE
Completed integration in < 9 months
Capacity utilization ~ 75%
Achieved Cash Brake‐even
(Debt Funding –80%)
Pet coke usage in kilns at 75%
Costs gap with existing plants narrowing down
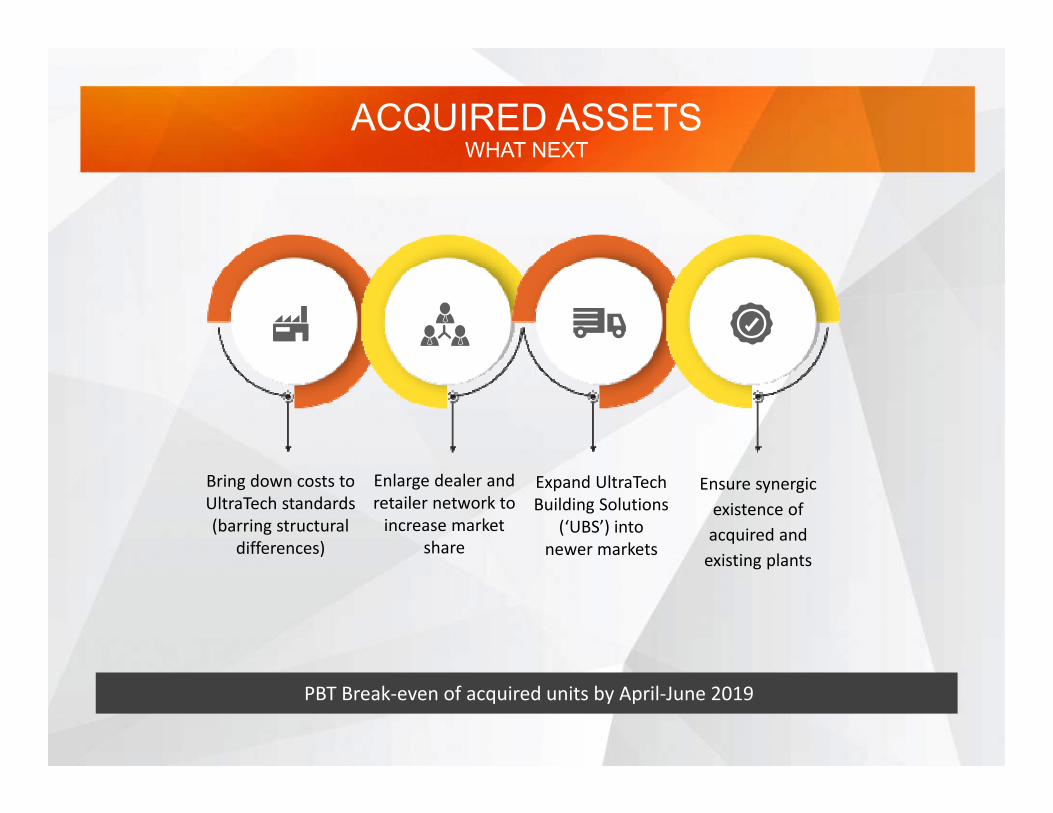
ACQUIRED ASSETS
26
WHAT NEXT
PBT Break‐even of acquired units by April‐June 2019
Bring down costs to UltraTech standards (barring structural
differences)
Enlarge dealer and retailer network to increase market
share
Expand UltraTech Building Solutions
(‘UBS’) into newer markets
Ensure synergic existence of acquired and existing plants
ACQUIRED ASSETSWHAT NEXT
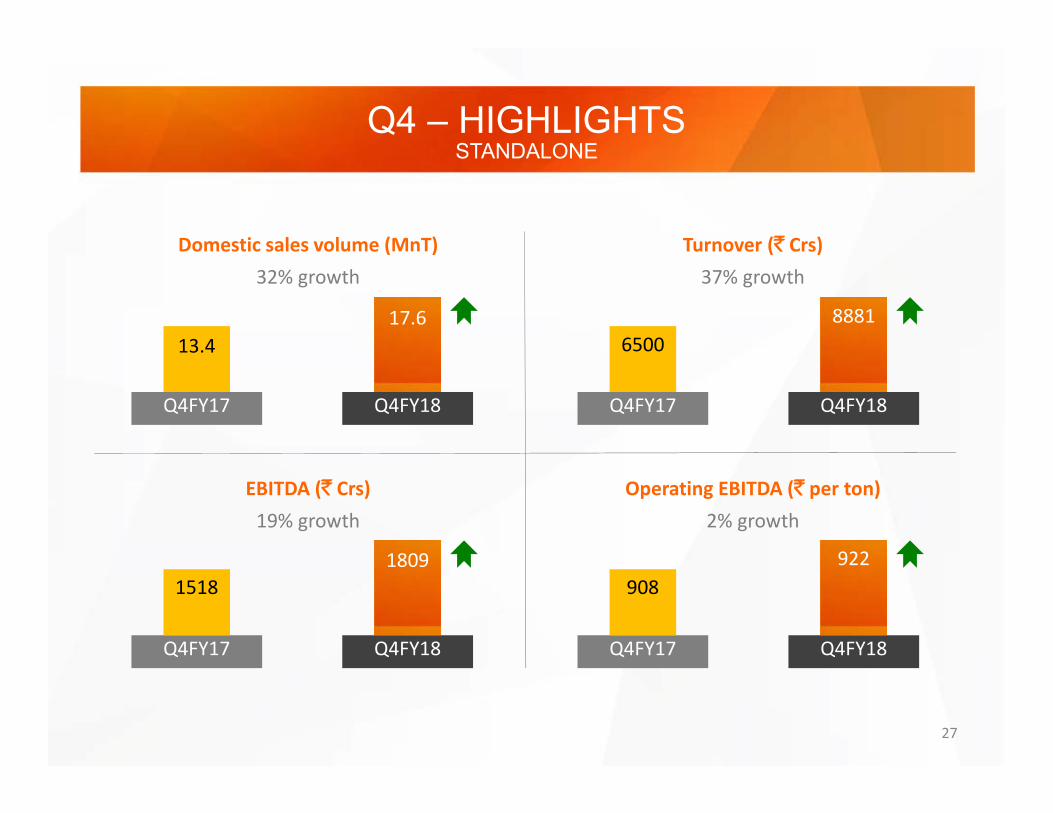
Q4 – HIGHLIGHTS
27
STANDALONE
Domestic sales volume (MnT)
Q4FY17 Q4FY18
Turnover (` Crs)
Q4FY17 Q4FY18
Q4FY17 Q4FY18
Operating EBITDA (` per ton)
Q4FY17 Q4FY18
32% growth
13.417.6
19% growth
15181809
37% growth
65008881
2% growth
908922
EBITDA (` Crs)
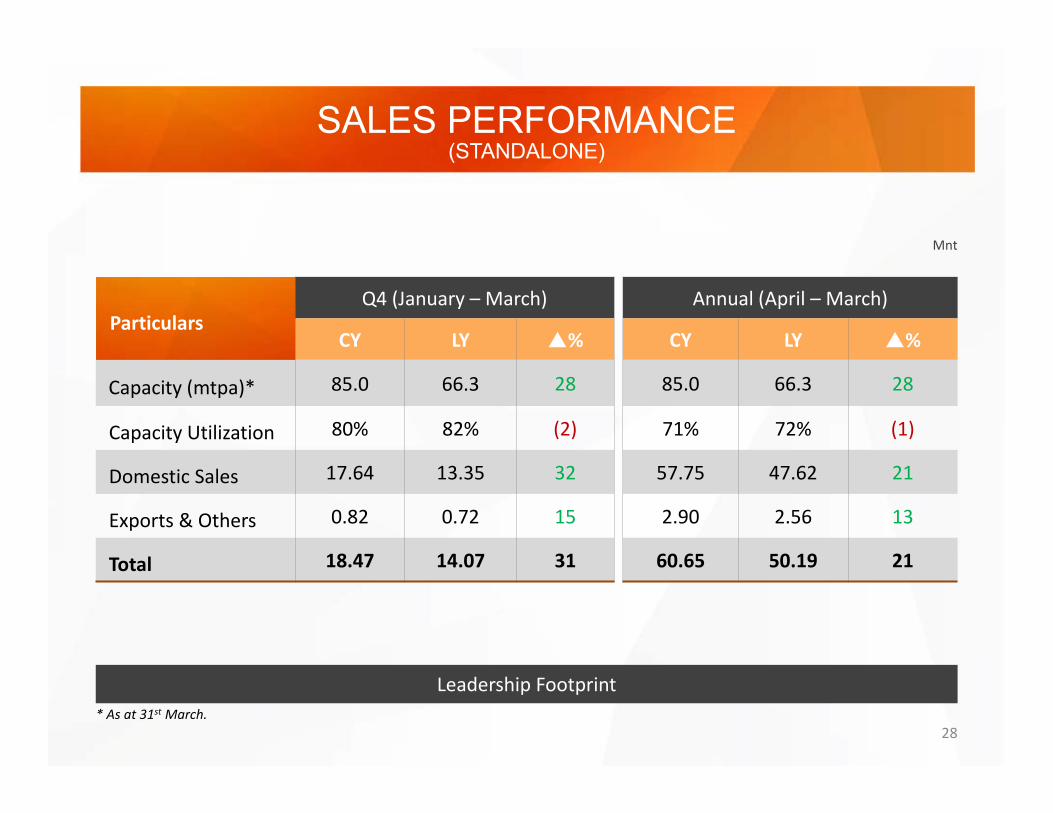
SALES PERFORMANCE
28
(STANDALONE)
Leadership Footprint* As at 31st March.
ParticularsQ4 (January – March) Annual (April – March)
CY LY % CY LY %
Capacity (mtpa)* 85.0 66.3 28 85.0 66.3 28
Capacity Utilization 80% 82% (2) 71% 72% (1)
Domestic Sales 17.64 13.35 32 57.75 47.62 21
Exports & Others 0.82 0.72 15 2.90 2.56 13
Total 18.47 14.07 31 60.65 50.19 21
Mnt
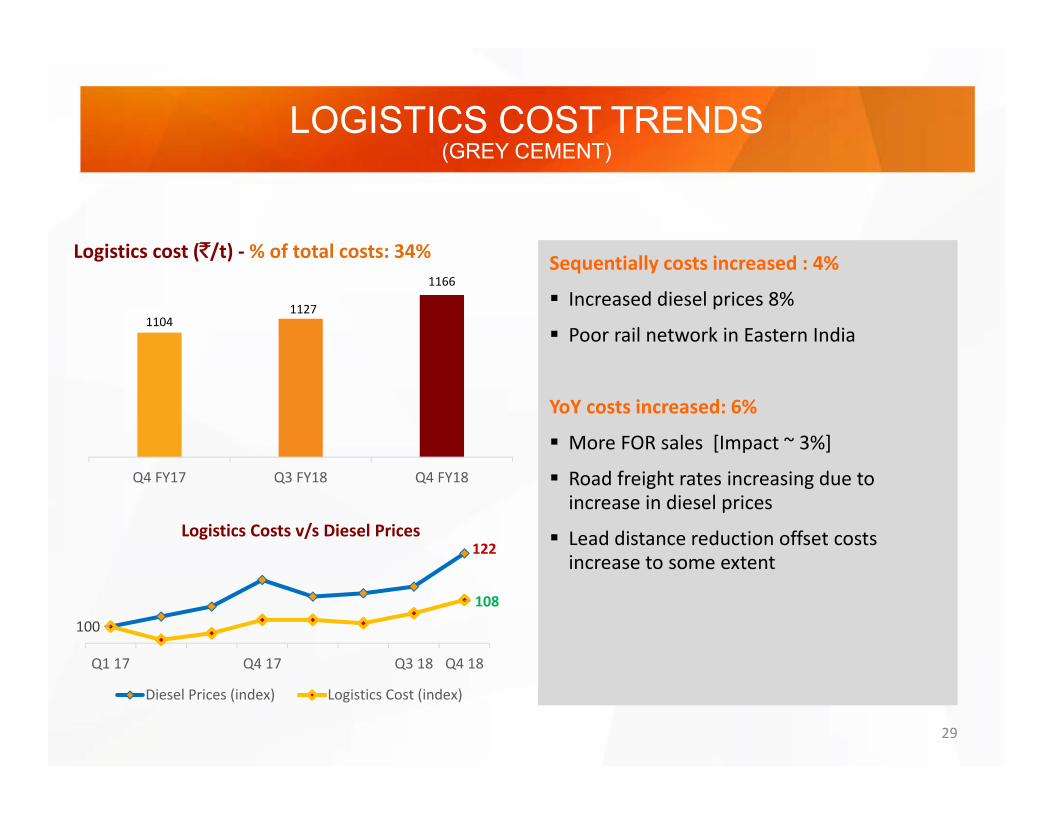
LOGISTICS COST TRENDS
29
(GREY CEMENT)
Sequentially costs increased : 4%
Increased diesel prices 8%
Poor rail network in Eastern India
YoY costs increased: 6%
More FOR sales [Impact ~ 3%]
Road freight rates increasing due to increase in diesel prices
Lead distance reduction offset costs increase to some extent
11041127
1166
Q4 FY17 Q3 FY18 Q4 FY18
Logistics cost (`/t) ‐ % of total costs: 34%
122
100
108
Q1 17 Q4 17 Q3 18 Q4 18
Logistics Costs v/s Diesel Prices
Diesel Prices (index) Logistics Cost (index)
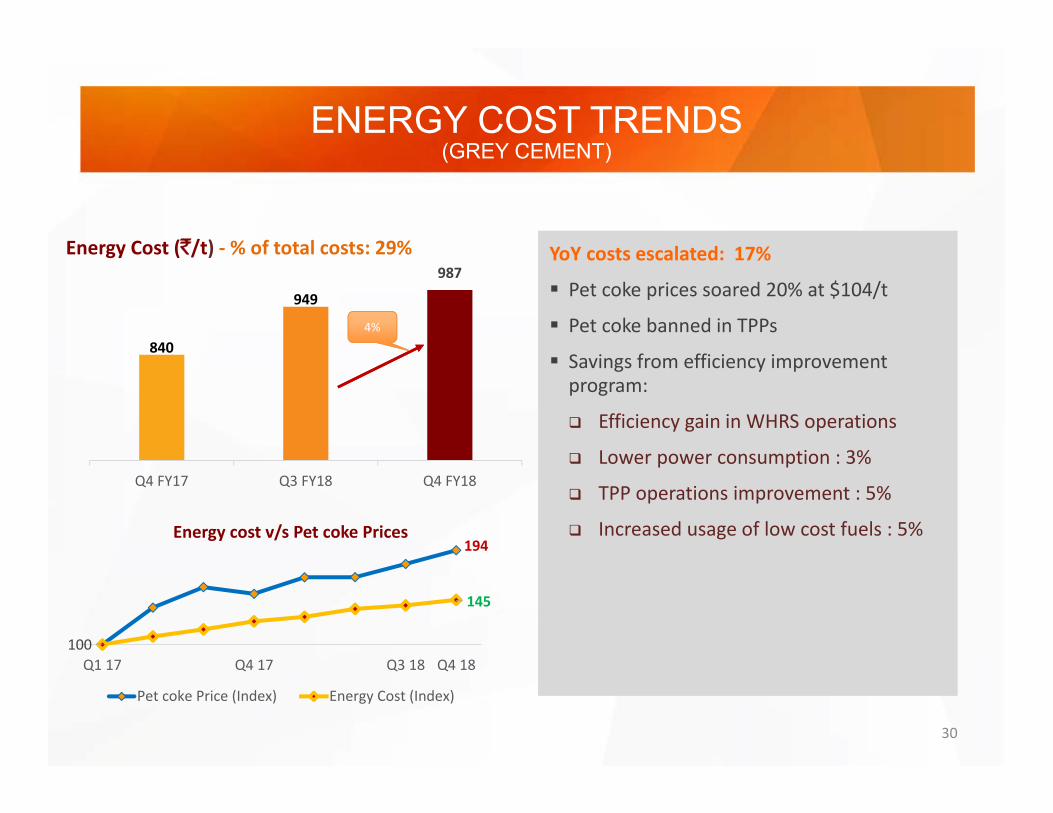
ENERGY COST TRENDS
30
(GREY CEMENT)
YoY costs escalated: 17%
Pet coke prices soared 20% at $104/t
Pet coke banned in TPPs
Savings from efficiency improvement program:
Efficiency gain in WHRS operations
Lower power consumption : 3%
TPP operations improvement : 5%
Increased usage of low cost fuels : 5%
840
949
987
Q4 FY17 Q3 FY18 Q4 FY18
Energy Cost (`/t) ‐ % of total costs: 29%
194
100
145
Q1 17 Q4 17 Q3 18 Q4 18
Energy cost v/s Pet coke Prices
Pet coke Price (Index) Energy Cost (Index)
4%
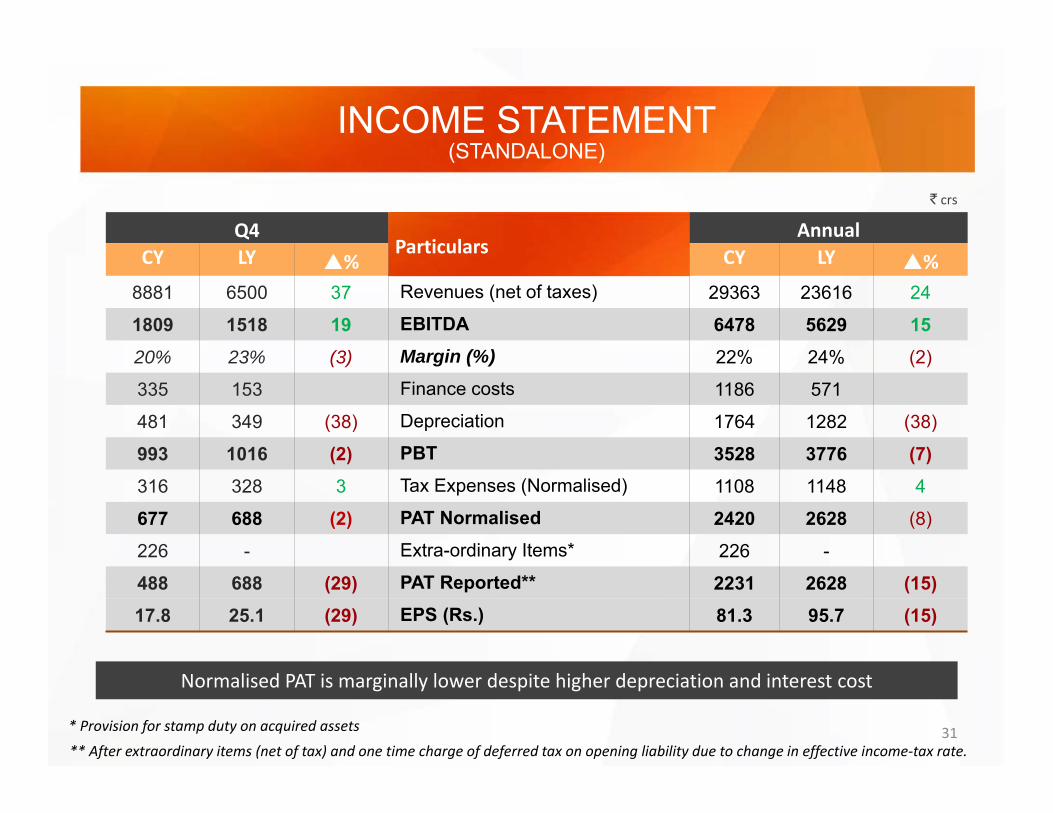
INCOME STATEMENT
31
(STANDALONE)
` crs
Q4Particulars
AnnualCY LY % CY LY %
8881 6500 37 Revenues (net of taxes) 29363 23616 24
1809 1518 19 EBITDA 6478 5629 1520% 23% (3) Margin (%) 22% 24% (2)
335 153 Finance costs 1186 571
481 349 (38) Depreciation 1764 1282 (38)
993 1016 (2) PBT 3528 3776 (7)316 328 3 Tax Expenses (Normalised) 1108 1148 4
677 688 (2) PAT Normalised 2420 2628 (8)
226 - Extra-ordinary Items* 226 -
488 688 (29) PAT Reported** 2231 2628 (15)17.8 25.1 (29) EPS (Rs.) 81.3 95.7 (15)
* Provision for stamp duty on acquired assets
** After extraordinary items (net of tax) and one time charge of deferred tax on opening liability due to change in effective income‐tax rate.
Normalised PAT is marginally lower despite higher depreciation and interest cost
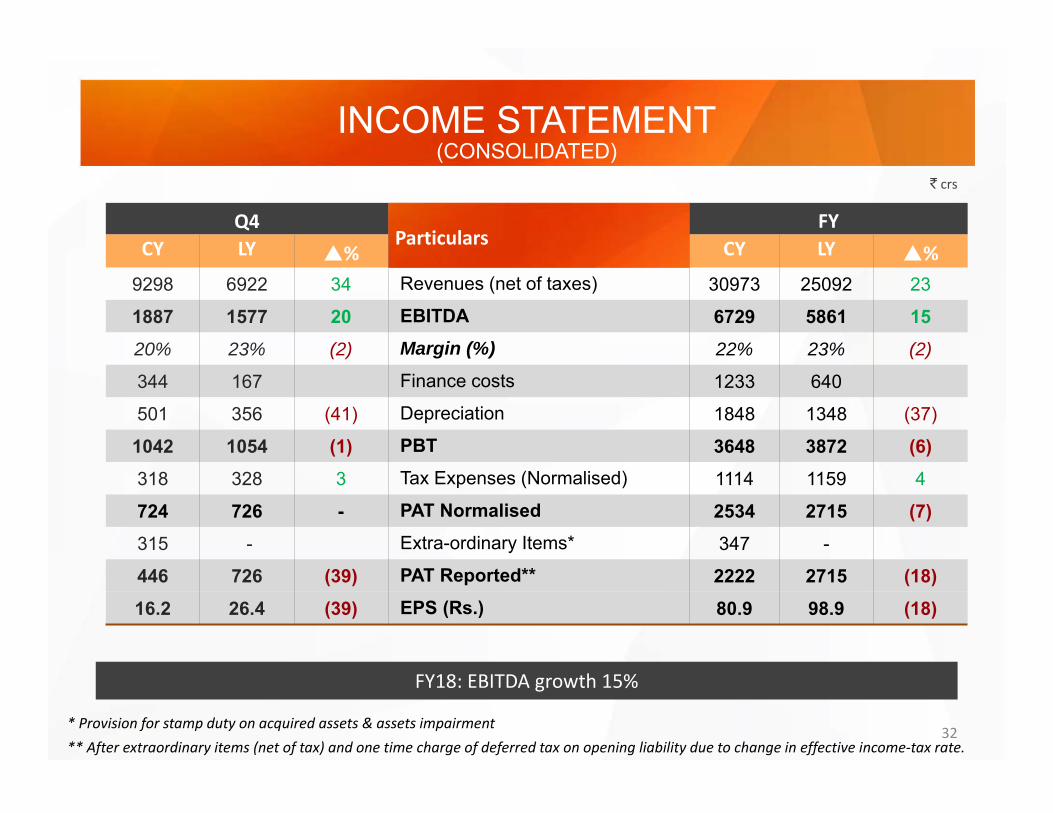
INCOME STATEMENT
32
(CONSOLIDATED)
FY18: EBITDA growth 15%
` crs
Q4Particulars
FYCY LY % CY LY %
9298 6922 34 Revenues (net of taxes) 30973 25092 23
1887 1577 20 EBITDA 6729 5861 1520% 23% (2) Margin (%) 22% 23% (2)
344 167 Finance costs 1233 640
501 356 (41) Depreciation 1848 1348 (37)
1042 1054 (1) PBT 3648 3872 (6)318 328 3 Tax Expenses (Normalised) 1114 1159 4
724 726 - PAT Normalised 2534 2715 (7)315 - Extra-ordinary Items* 347 -
446 726 (39) PAT Reported** 2222 2715 (18)16.2 26.4 (39) EPS (Rs.) 80.9 98.9 (18)
* Provision for stamp duty on acquired assets & assets impairment** After extraordinary items (net of tax) and one time charge of deferred tax on opening liability due to change in effective income‐tax rate.
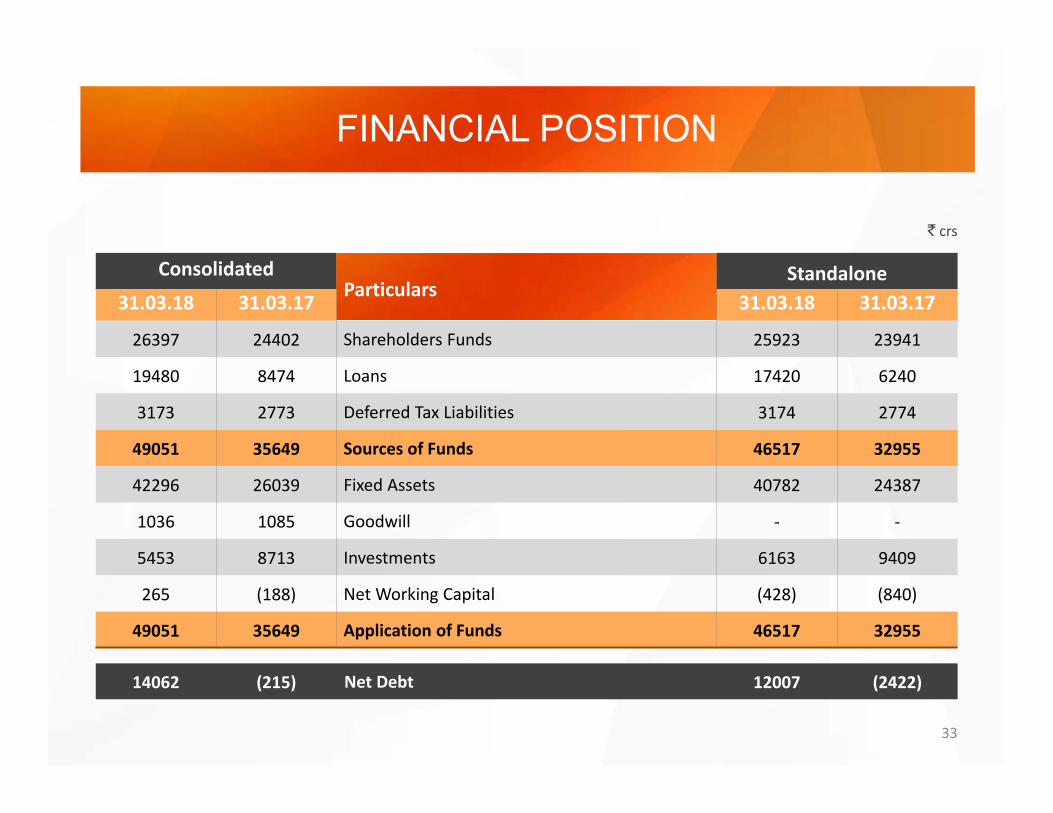
FINANCIAL POSITION
33
` crs
14062 (215) Net Debt 12007 (2422)
ConsolidatedParticulars
Standalone31.03.18 31.03.17 31.03.18 31.03.17
26397 24402 Shareholders Funds 25923 23941
19480 8474 Loans 17420 6240
3173 2773 Deferred Tax Liabilities 3174 2774
49051 35649 Sources of Funds 46517 32955
42296 26039 Fixed Assets 40782 24387
1036 1085 Goodwill ‐ ‐
5453 8713 Investments 6163 9409
265 (188) Net Working Capital (428) (840)
49051 35649 Application of Funds 46517 32955
34* Excluding Acquisition cost of ` 16189 Crs.
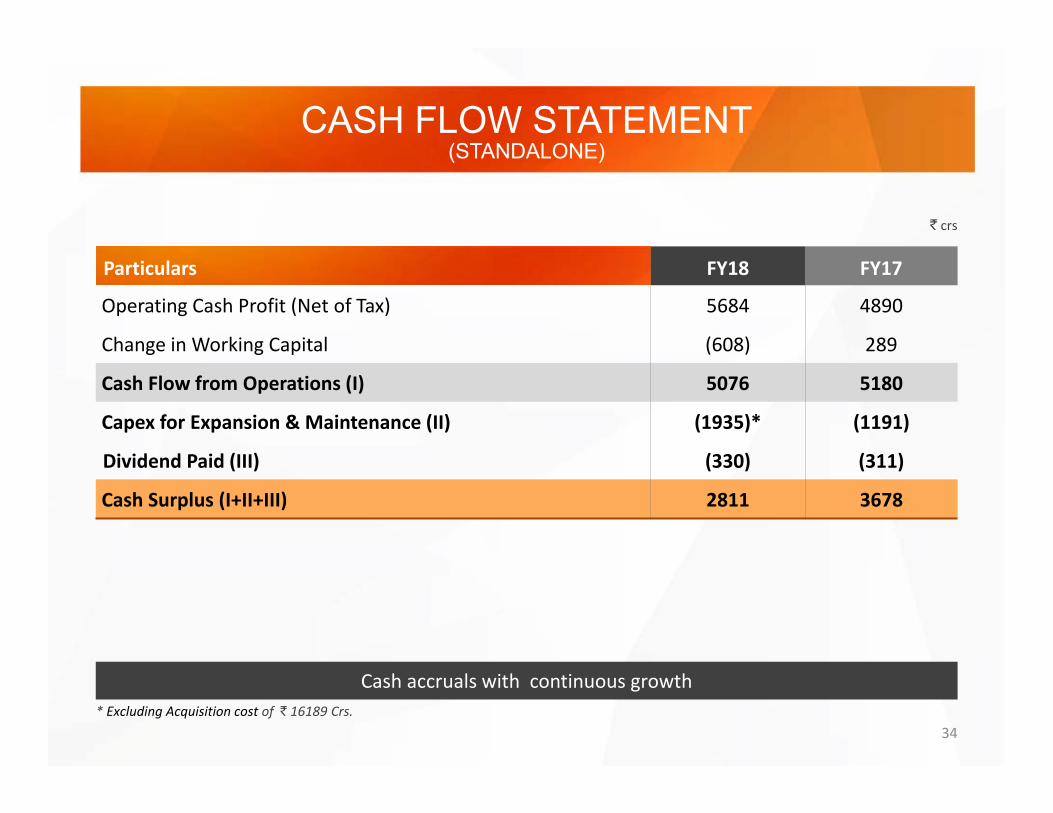
CASH FLOW STATEMENT(STANDALONE)
Particulars FY18 FY17
Operating Cash Profit (Net of Tax) 5684 4890
Change in Working Capital (608) 289
Cash Flow from Operations (I) 5076 5180
Capex for Expansion & Maintenance (II) (1935)* (1191)
Dividend Paid (III) (330) (311)
Cash Surplus (I+II+III) 2811 3678
` crs
Cash accruals with continuous growth
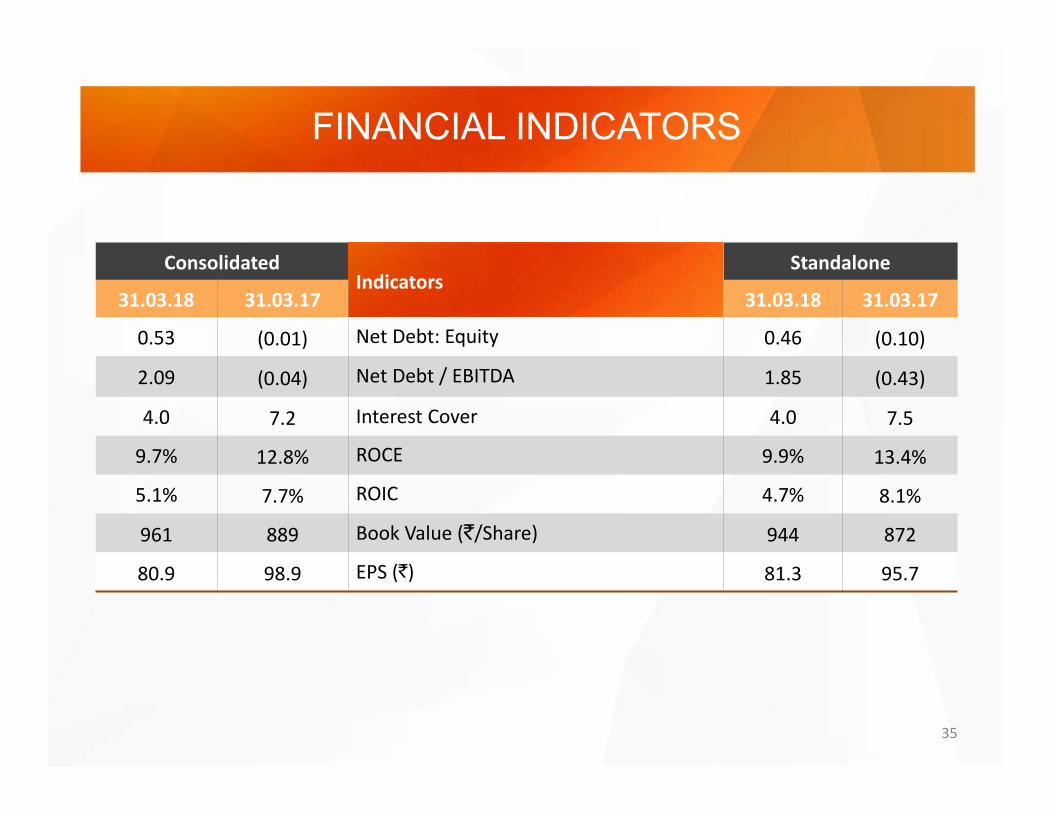
35
FINANCIAL INDICATORS
ConsolidatedIndicators
Standalone
31.03.18 31.03.17 31.03.18 31.03.17
0.53 (0.01) Net Debt: Equity 0.46 (0.10)
2.09 (0.04) Net Debt / EBITDA 1.85 (0.43)
4.0 7.2 Interest Cover 4.0 7.5
9.7% 12.8% ROCE 9.9% 13.4%
5.1% 7.7% ROIC 4.7% 8.1%
961 889 Book Value (`/Share) 944 872
80.9 98.9 EPS (`) 81.3 95.7

Historical Performance Trend
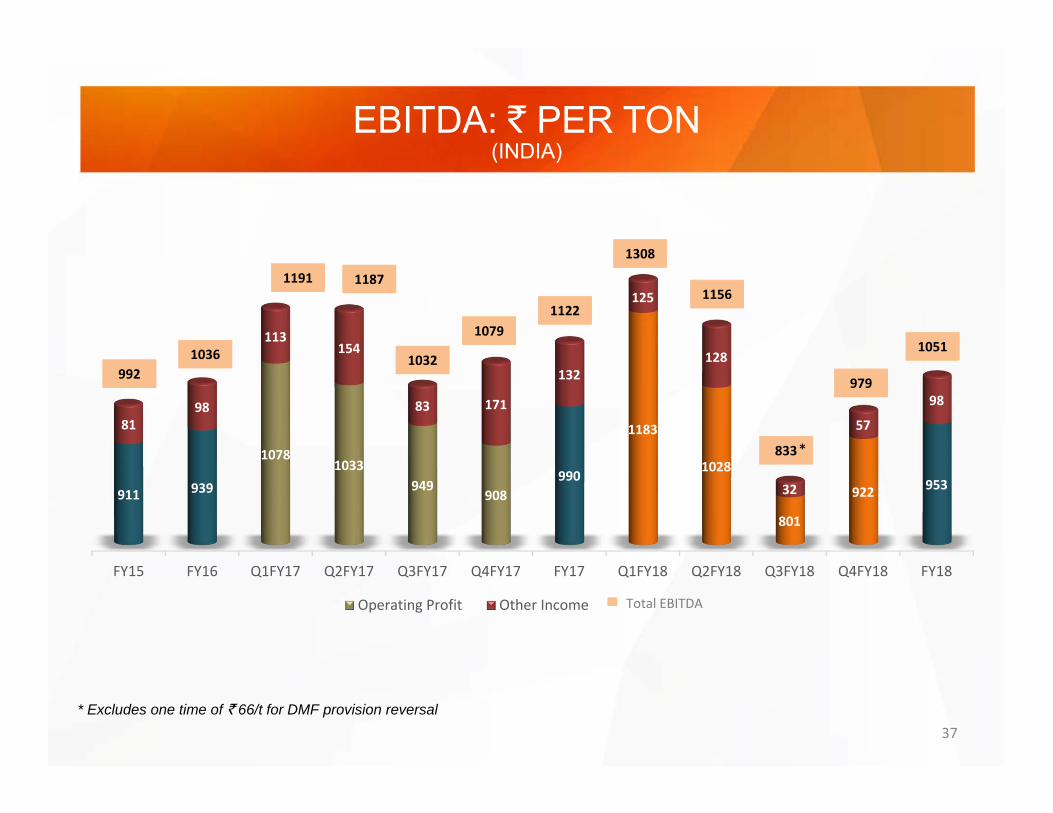
EBITDA: ` PER TON
37
(INDIA)
* Excludes one time of ` 66/t for DMF provision reversal
FY15 FY16 Q1FY17 Q2FY17 Q3FY17 Q4FY17 FY17 Q1FY18 Q2FY18 Q3FY18 Q4FY18 FY18
911 939
10781033
949908
990
1183
1028
801
922 953
8198
113154
83 171
132
125
128
32
57
98
Operating Profit Other Income Total EBITDA
9921036
1191 1187
1032
11221079
1308
1156
979
833*
1051
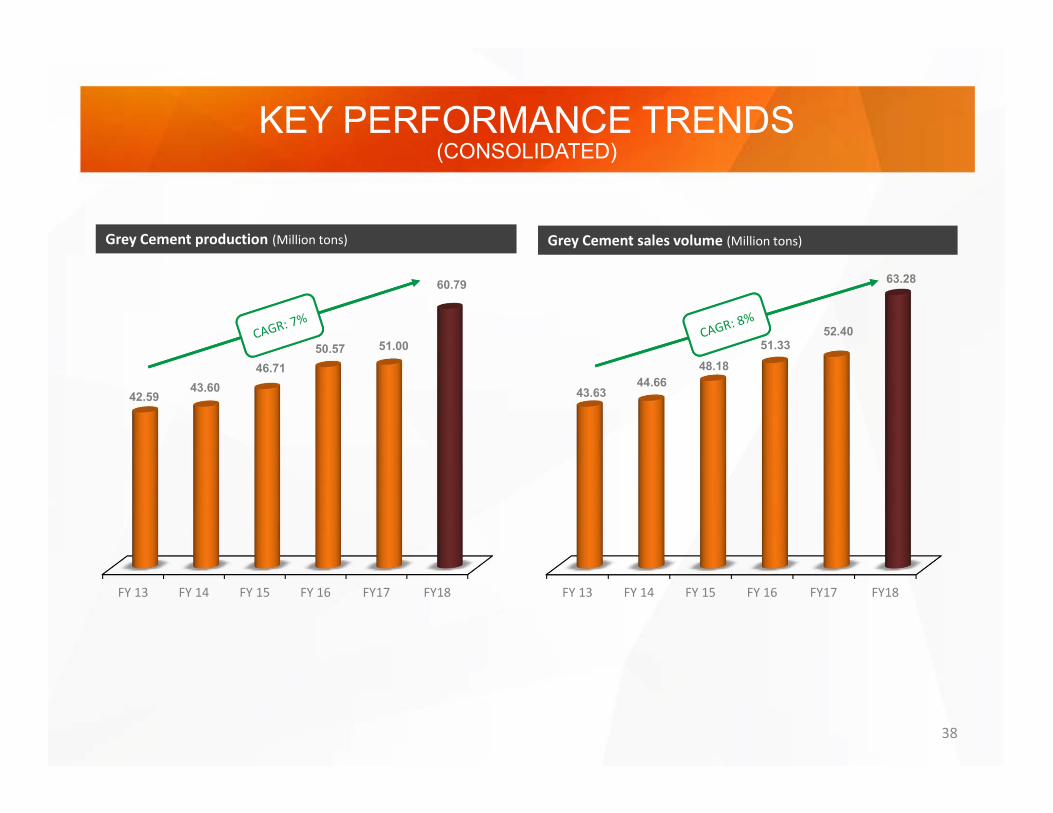
38
KEY PERFORMANCE TRENDS(CONSOLIDATED)
Grey Cement sales volume (Million tons)Grey Cement production (Million tons)
FY 13 FY 14 FY 15 FY 16 FY17 FY18
43.6344.66
48.1851.33
52.40
63.28
FY 13 FY 14 FY 15 FY 16 FY17 FY18
42.5943.60
46.7150.57 51.00
60.79
39Note: Figures of FY15 & prior are reported nos. as per previous Indian Accounting Standards
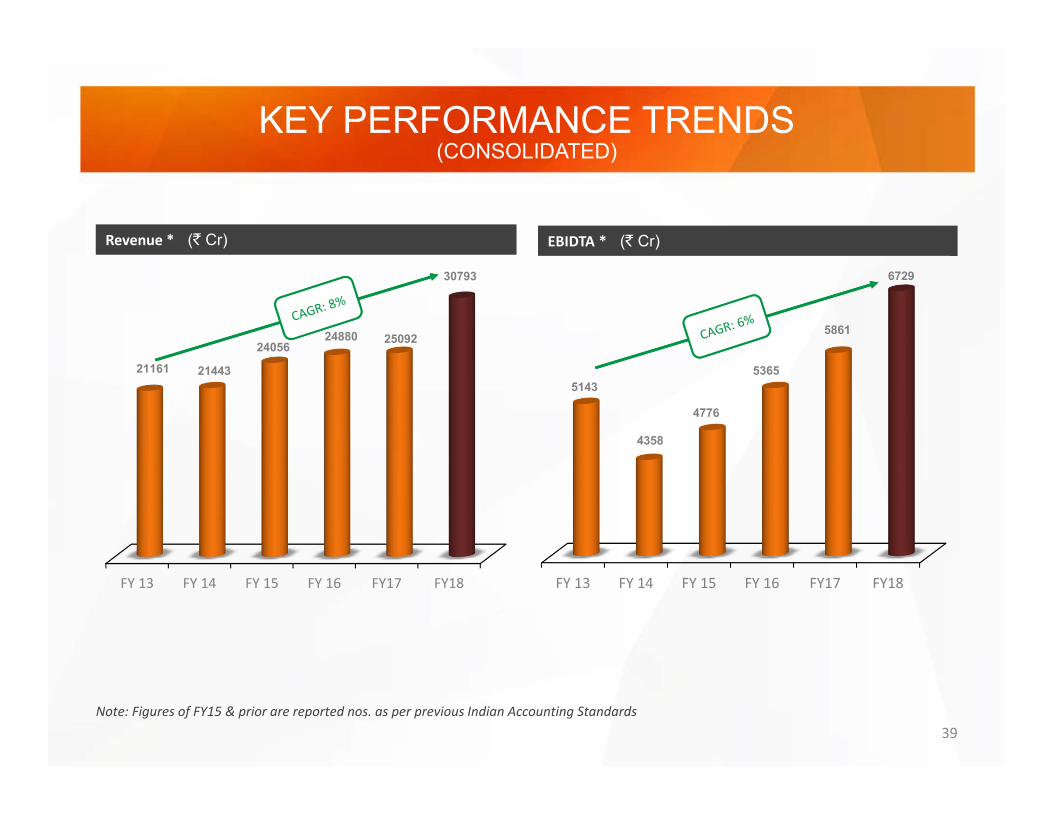
KEY PERFORMANCE TRENDS(CONSOLIDATED)
EBIDTA * (` Cr)Revenue * (` Cr)
FY 13 FY 14 FY 15 FY 16 FY17 FY18
21161 21443
2405624880 25092
30793
FY 13 FY 14 FY 15 FY 16 FY17 FY18
5143
4358
4776
5365
5861
6729
40
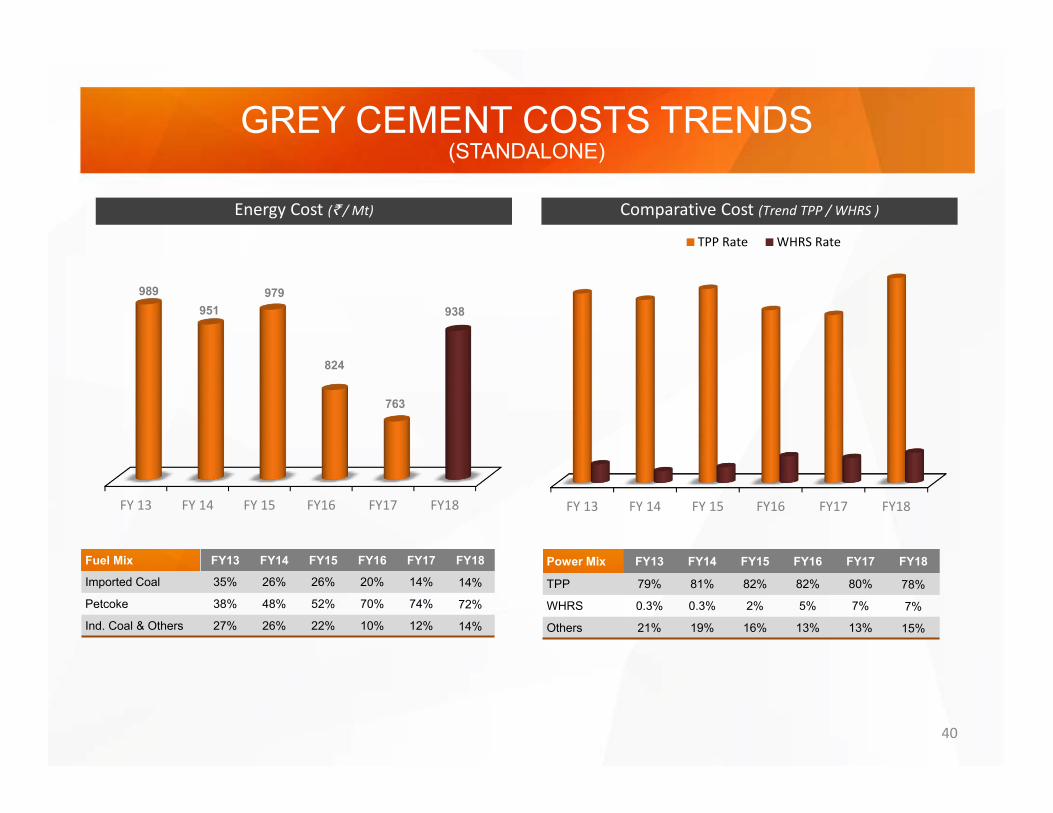
GREY CEMENT COSTS TRENDS(STANDALONE)
Energy Cost (` / Mt) Comparative Cost (Trend TPP / WHRS )
Fuel Mix FY13 FY14 FY15 FY16 FY17 FY18
Imported Coal 35% 26% 26% 20% 14% 14%
Petcoke 38% 48% 52% 70% 74% 72%
Ind. Coal & Others 27% 26% 22% 10% 12% 14%
Power Mix FY13 FY14 FY15 FY16 FY17 FY18
TPP 79% 81% 82% 82% 80% 78%
WHRS 0.3% 0.3% 2% 5% 7% 7%
Others 21% 19% 16% 13% 13% 15%
FY 13 FY 14 FY 15 FY16 FY17 FY18
989951
979
824
763
938
FY 13 FY 14 FY 15 FY16 FY17 FY18
TPP Rate WHRS Rate
41
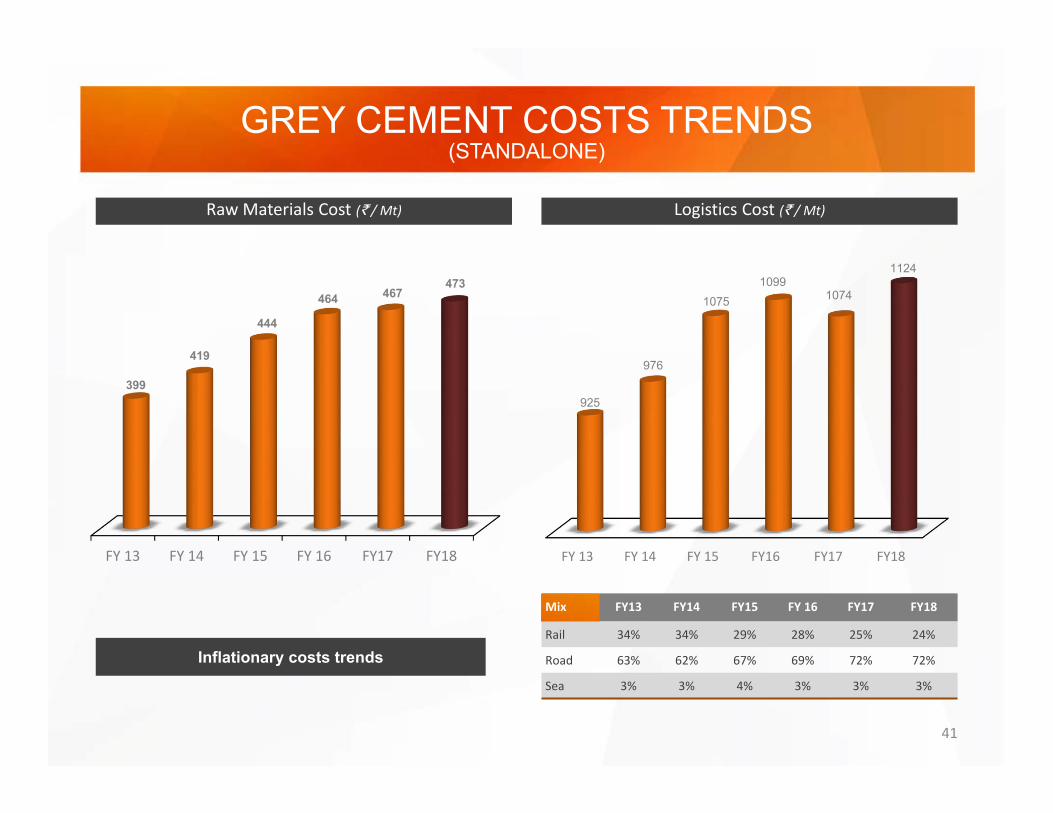
GREY CEMENT COSTS TRENDS(STANDALONE)
Raw Materials Cost (` / Mt) Logistics Cost (` / Mt)
Mix FY13 FY14 FY15 FY 16 FY17 FY18
Rail 34% 34% 29% 28% 25% 24%
Road 63% 62% 67% 69% 72% 72%
Sea 3% 3% 4% 3% 3% 3%
FY 13 FY 14 FY 15 FY 16 FY17 FY18
399
419
444
464 467473
FY 13 FY 14 FY 15 FY16 FY17 FY18
925
976
10751099
1074
1124
Inflationary costs trends

One step ahead…UltraTech
43
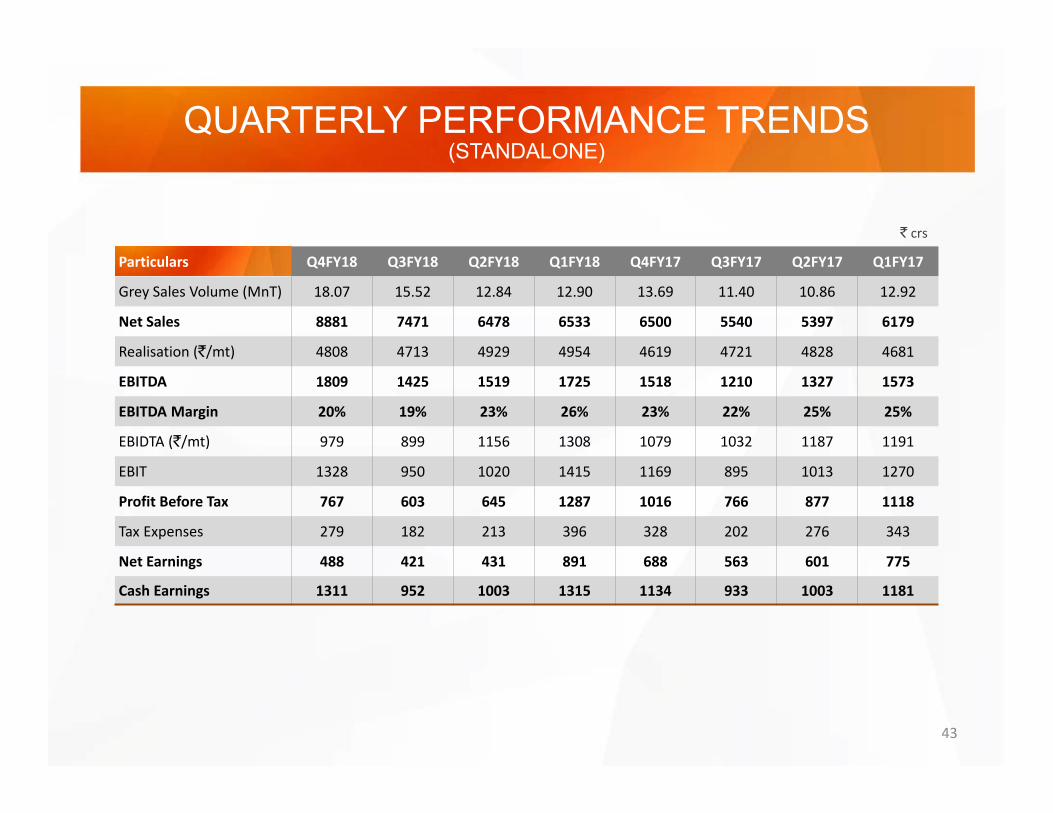
QUARTERLY PERFORMANCE TRENDS(STANDALONE)
` crs
Particulars Q4FY18 Q3FY18 Q2FY18 Q1FY18 Q4FY17 Q3FY17 Q2FY17 Q1FY17
Grey Sales Volume (MnT) 18.07 15.52 12.84 12.90 13.69 11.40 10.86 12.92
Net Sales 8881 7471 6478 6533 6500 5540 5397 6179
Realisation (`/mt) 4808 4713 4929 4954 4619 4721 4828 4681
EBITDA 1809 1425 1519 1725 1518 1210 1327 1573
EBITDA Margin 20% 19% 23% 26% 23% 22% 25% 25%
EBIDTA (`/mt) 979 899 1156 1308 1079 1032 1187 1191
EBIT 1328 950 1020 1415 1169 895 1013 1270
Profit Before Tax 767 603 645 1287 1016 766 877 1118
Tax Expenses 279 182 213 396 328 202 276 343
Net Earnings 488 421 431 891 688 563 601 775
Cash Earnings 1311 952 1003 1315 1134 933 1003 1181
44
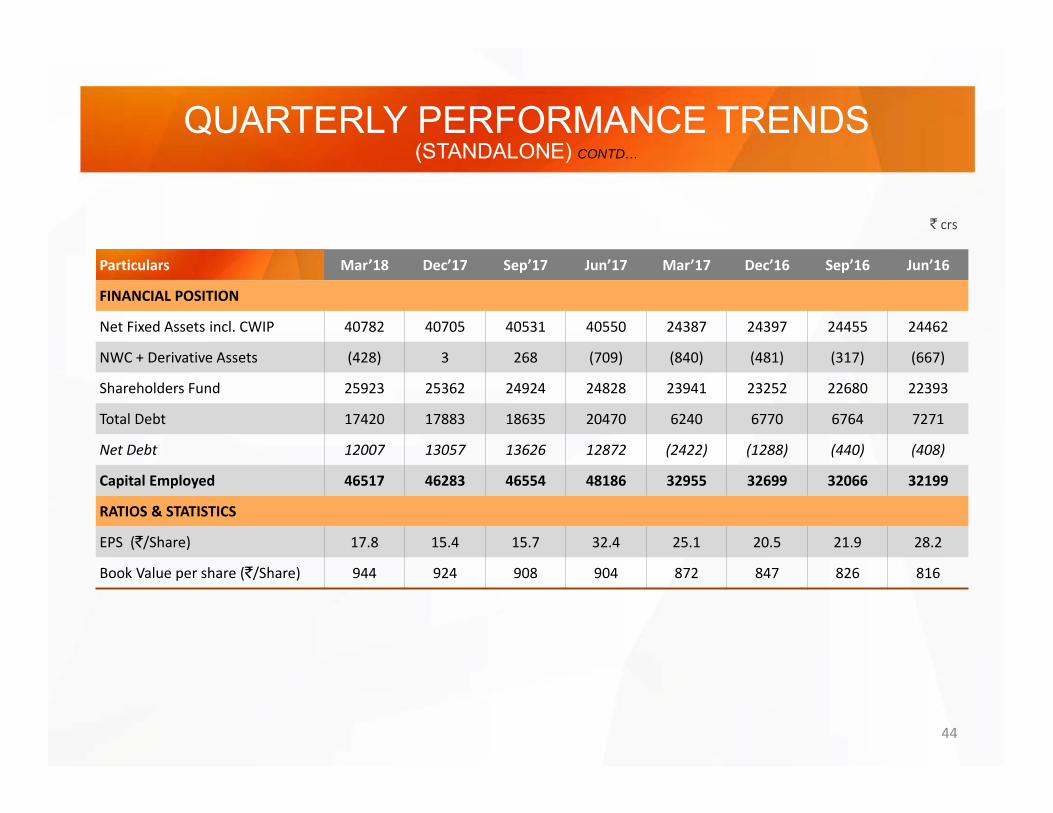
QUARTERLY PERFORMANCE TRENDS(STANDALONE) CONTD…
` crs
Particulars Mar’18 Dec’17 Sep’17 Jun’17 Mar’17 Dec’16 Sep’16 Jun’16
FINANCIAL POSITION
Net Fixed Assets incl. CWIP 40782 40705 40531 40550 24387 24397 24455 24462
NWC + Derivative Assets (428) 3 268 (709) (840) (481) (317) (667)
Shareholders Fund 25923 25362 24924 24828 23941 23252 22680 22393
Total Debt 17420 17883 18635 20470 6240 6770 6764 7271
Net Debt 12007 13057 13626 12872 (2422) (1288) (440) (408)
Capital Employed 46517 46283 46554 48186 32955 32699 32066 32199
RATIOS & STATISTICS
EPS (`/Share) 17.8 15.4 15.7 32.4 25.1 20.5 21.9 28.2
Book Value per share (`/Share) 944 924 908 904 872 847 826 816
45
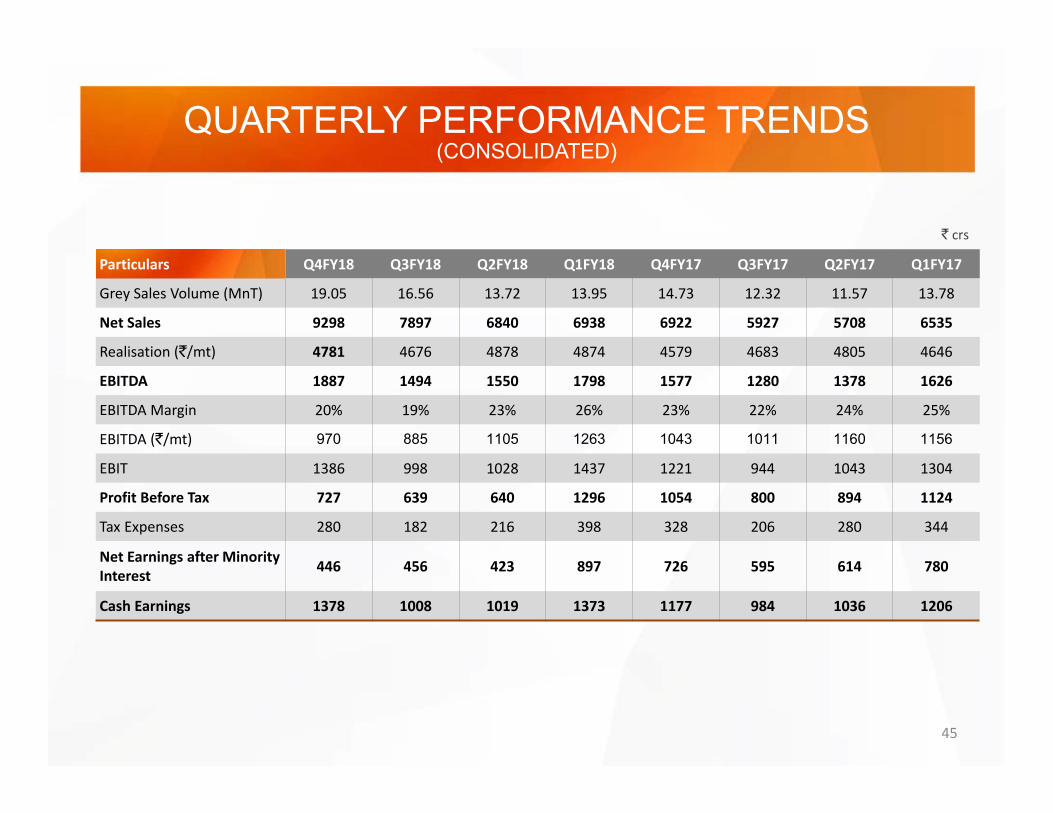
QUARTERLY PERFORMANCE TRENDS(CONSOLIDATED)
` crs
Particulars Q4FY18 Q3FY18 Q2FY18 Q1FY18 Q4FY17 Q3FY17 Q2FY17 Q1FY17
Grey Sales Volume (MnT) 19.05 16.56 13.72 13.95 14.73 12.32 11.57 13.78
Net Sales 9298 7897 6840 6938 6922 5927 5708 6535
Realisation (`/mt) 4781 4676 4878 4874 4579 4683 4805 4646
EBITDA 1887 1494 1550 1798 1577 1280 1378 1626
EBITDA Margin 20% 19% 23% 26% 23% 22% 24% 25%
EBITDA (`/mt) 970 885 1105 1263 1043 1011 1160 1156
EBIT 1386 998 1028 1437 1221 944 1043 1304
Profit Before Tax 727 639 640 1296 1054 800 894 1124
Tax Expenses 280 182 216 398 328 206 280 344
Net Earnings after MinorityInterest 446 456 423 897 726 595 614 780
Cash Earnings 1378 1008 1019 1373 1177 984 1036 1206
46
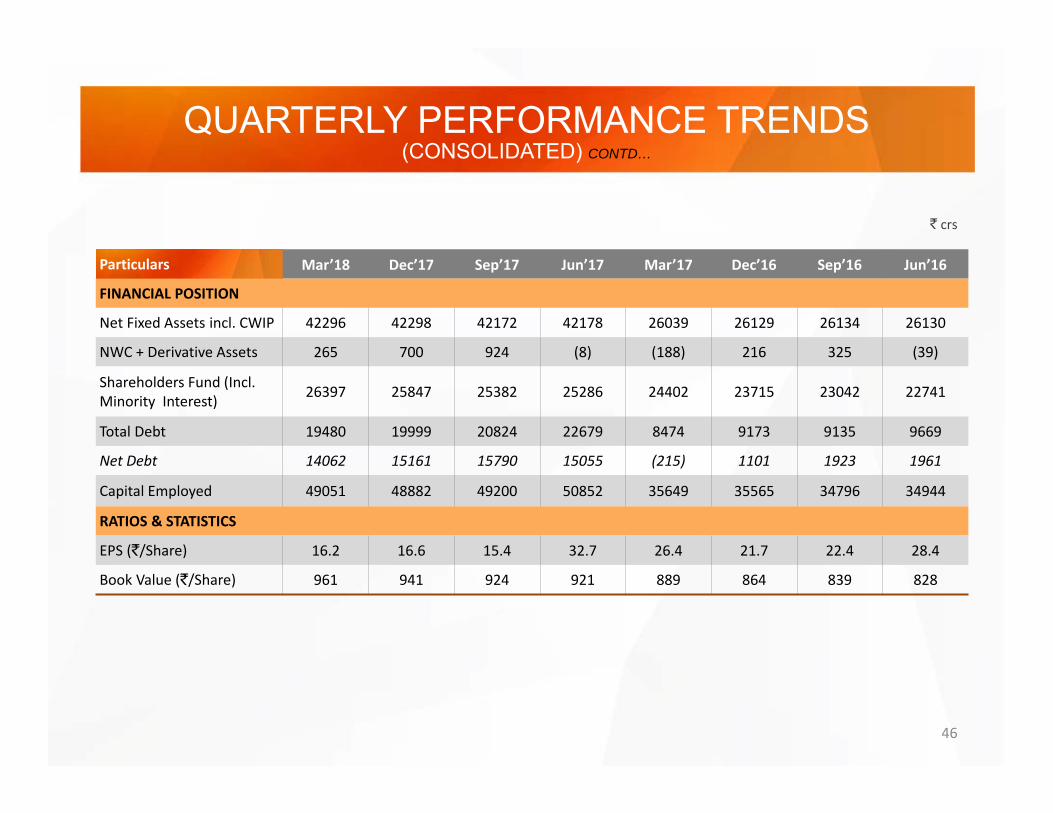
QUARTERLY PERFORMANCE TRENDS(CONSOLIDATED) CONTD…
` crs
Particulars Mar’18 Dec’17 Sep’17 Jun’17 Mar’17 Dec’16 Sep’16 Jun’16
FINANCIAL POSITION
Net Fixed Assets incl. CWIP 42296 42298 42172 42178 26039 26129 26134 26130
NWC + Derivative Assets 265 700 924 (8) (188) 216 325 (39)
Shareholders Fund (Incl. Minority Interest) 26397 25847 25382 25286 24402 23715 23042 22741
Total Debt 19480 19999 20824 22679 8474 9173 9135 9669
Net Debt 14062 15161 15790 15055 (215) 1101 1923 1961
Capital Employed 49051 48882 49200 50852 35649 35565 34796 34944
RATIOS & STATISTICS
EPS (`/Share) 16.2 16.6 15.4 32.7 26.4 21.7 22.4 28.4
Book Value (`/Share) 961 941 924 921 889 864 839 828
47
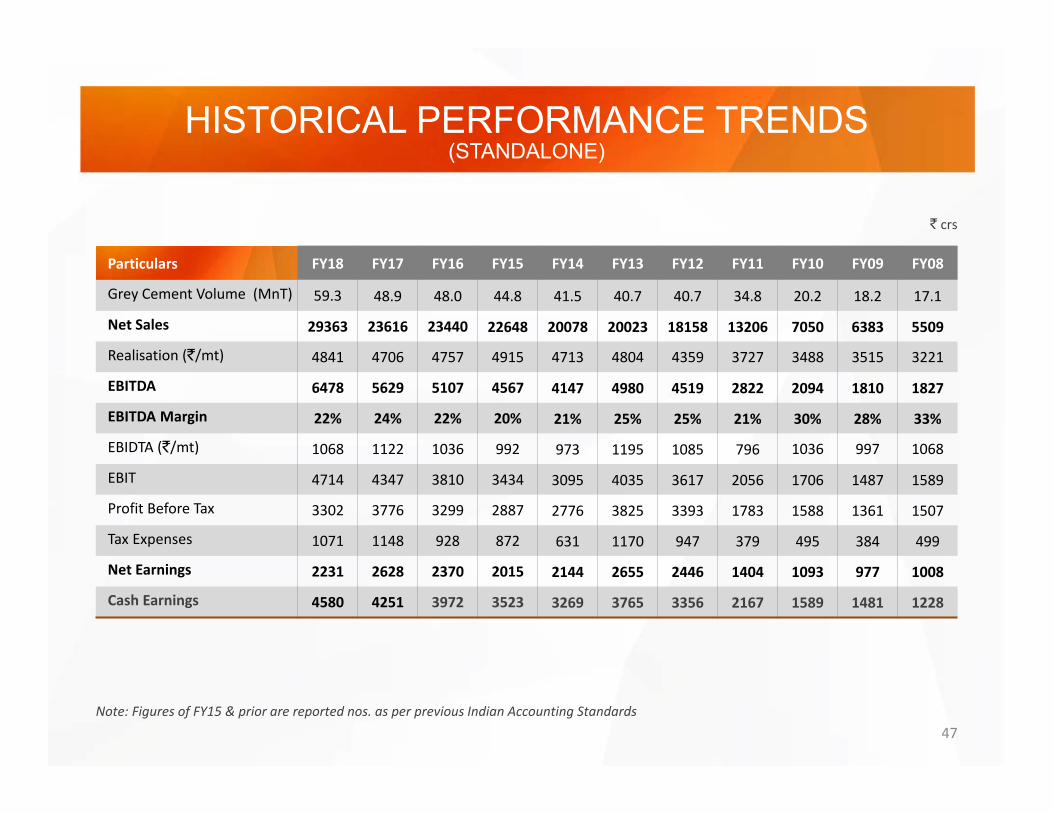
HISTORICAL PERFORMANCE TRENDS(STANDALONE)
` crs
Particulars FY18 FY17 FY16 FY15 FY14 FY13 FY12 FY11 FY10 FY09 FY08
Grey Cement Volume (MnT) 59.3 48.9 48.0 44.8 41.5 40.7 40.7 34.8 20.2 18.2 17.1
Net Sales 29363 23616 23440 22648 20078 20023 18158 13206 7050 6383 5509
Realisation (`/mt) 4841 4706 4757 4915 4713 4804 4359 3727 3488 3515 3221
EBITDA 6478 5629 5107 4567 4147 4980 4519 2822 2094 1810 1827
EBITDA Margin 22% 24% 22% 20% 21% 25% 25% 21% 30% 28% 33%
EBIDTA (`/mt) 1068 1122 1036 992 973 1195 1085 796 1036 997 1068
EBIT 4714 4347 3810 3434 3095 4035 3617 2056 1706 1487 1589
Profit Before Tax 3302 3776 3299 2887 2776 3825 3393 1783 1588 1361 1507
Tax Expenses 1071 1148 928 872 631 1170 947 379 495 384 499
Net Earnings 2231 2628 2370 2015 2144 2655 2446 1404 1093 977 1008
Cash Earnings 4580 4251 3972 3523 3269 3765 3356 2167 1589 1481 1228
Note: Figures of FY15 & prior are reported nos. as per previous Indian Accounting Standards
48
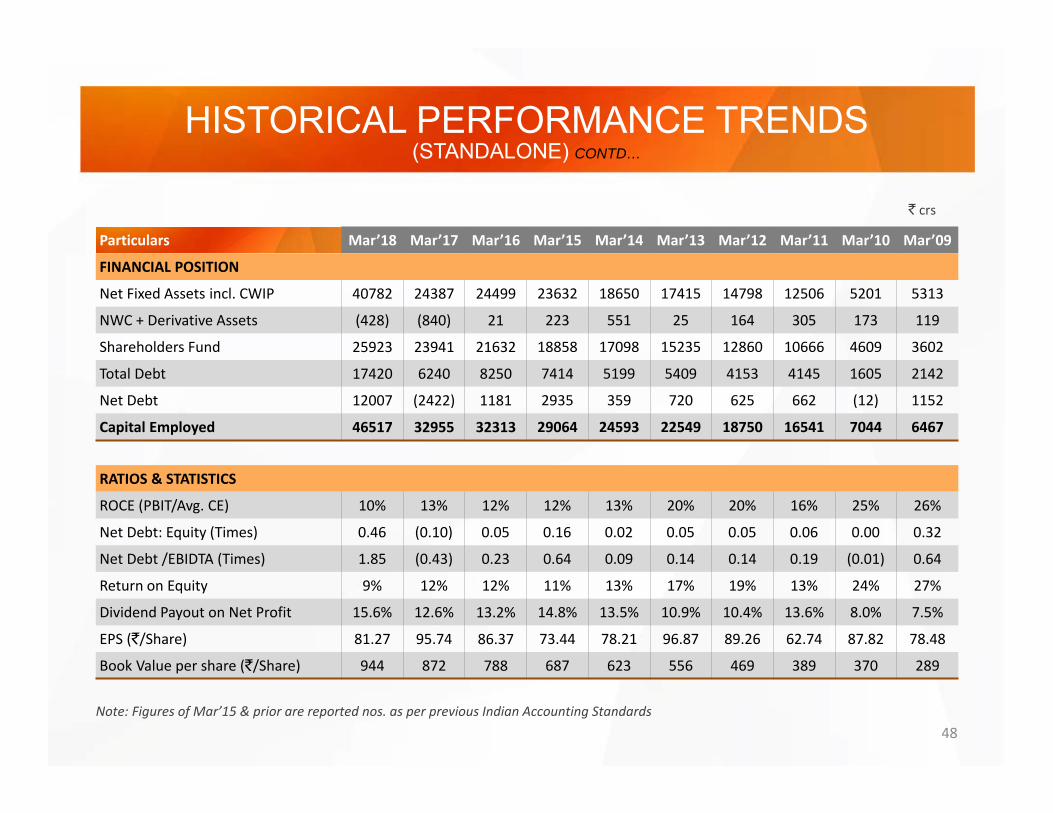
HISTORICAL PERFORMANCE TRENDS(STANDALONE) CONTD…
` crs
Note: Figures of Mar’15 & prior are reported nos. as per previous Indian Accounting Standards
Particulars Mar’18 Mar’17 Mar’16 Mar’15 Mar’14 Mar’13 Mar’12 Mar’11 Mar’10 Mar’09
FINANCIAL POSITION
Net Fixed Assets incl. CWIP 40782 24387 24499 23632 18650 17415 14798 12506 5201 5313
NWC + Derivative Assets (428) (840) 21 223 551 25 164 305 173 119
Shareholders Fund 25923 23941 21632 18858 17098 15235 12860 10666 4609 3602
Total Debt 17420 6240 8250 7414 5199 5409 4153 4145 1605 2142
Net Debt 12007 (2422) 1181 2935 359 720 625 662 (12) 1152
Capital Employed 46517 32955 32313 29064 24593 22549 18750 16541 7044 6467
RATIOS & STATISTICS
ROCE (PBIT/Avg. CE) 10% 13% 12% 12% 13% 20% 20% 16% 25% 26%
Net Debt: Equity (Times) 0.46 (0.10) 0.05 0.16 0.02 0.05 0.05 0.06 0.00 0.32
Net Debt /EBIDTA (Times) 1.85 (0.43) 0.23 0.64 0.09 0.14 0.14 0.19 (0.01) 0.64
Return on Equity 9% 12% 12% 11% 13% 17% 19% 13% 24% 27%
Dividend Payout on Net Profit 15.6% 12.6% 13.2% 14.8% 13.5% 10.9% 10.4% 13.6% 8.0% 7.5%
EPS (`/Share) 81.27 95.74 86.37 73.44 78.21 96.87 89.26 62.74 87.82 78.48
Book Value per share (`/Share) 944 872 788 687 623 556 469 389 370 289
49
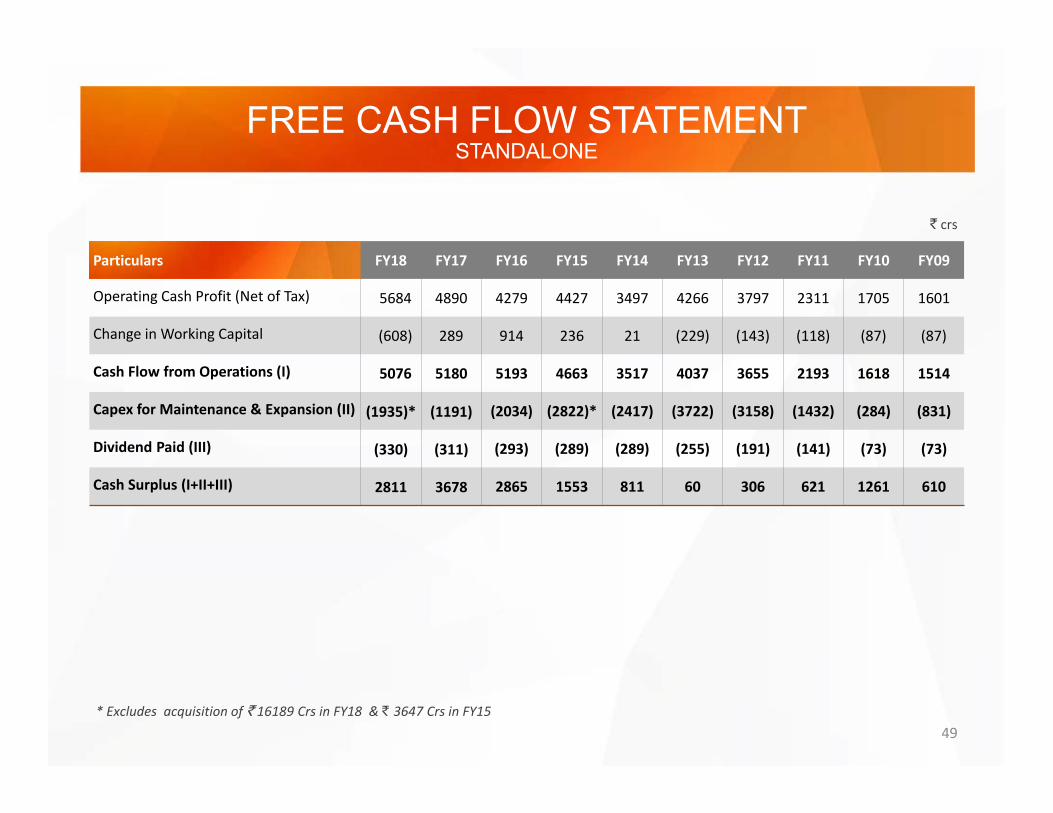
FREE CASH FLOW STATEMENTSTANDALONE
` crs
* Excludes acquisition of ` 16189 Crs in FY18 & ` 3647 Crs in FY15
Particulars FY18 FY17 FY16 FY15 FY14 FY13 FY12 FY11 FY10 FY09
Operating Cash Profit (Net of Tax) 5684 4890 4279 4427 3497 4266 3797 2311 1705 1601
Change in Working Capital (608) 289 914 236 21 (229) (143) (118) (87) (87)
Cash Flow from Operations (I) 5076 5180 5193 4663 3517 4037 3655 2193 1618 1514
Capex for Maintenance & Expansion (II) (1935)* (1191) (2034) (2822)* (2417) (3722) (3158) (1432) (284) (831)
Dividend Paid (III) (330) (311) (293) (289) (289) (255) (191) (141) (73) (73)
Cash Surplus (I+II+III) 2811 3678 2865 1553 811 60 306 621 1261 610
50
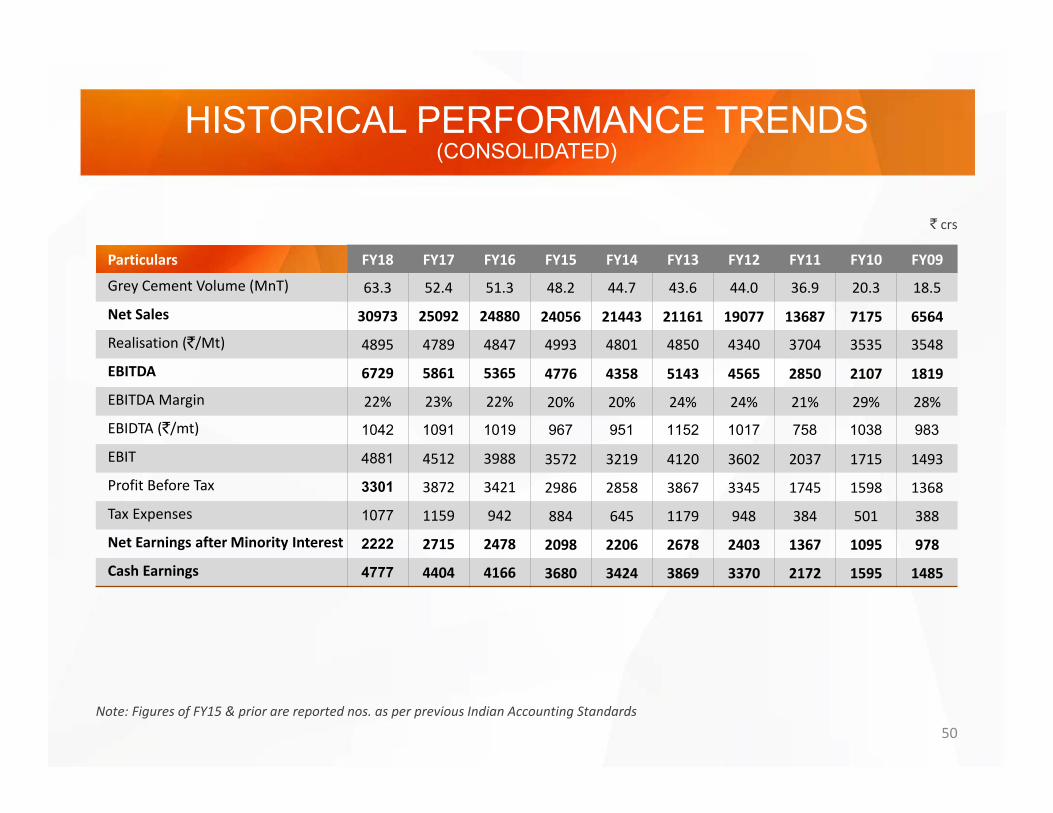
HISTORICAL PERFORMANCE TRENDS(CONSOLIDATED)
` crs
Note: Figures of FY15 & prior are reported nos. as per previous Indian Accounting Standards
Particulars FY18 FY17 FY16 FY15 FY14 FY13 FY12 FY11 FY10 FY09
Grey Cement Volume (MnT) 63.3 52.4 51.3 48.2 44.7 43.6 44.0 36.9 20.3 18.5
Net Sales 30973 25092 24880 24056 21443 21161 19077 13687 7175 6564
Realisation (`/Mt) 4895 4789 4847 4993 4801 4850 4340 3704 3535 3548
EBITDA 6729 5861 5365 4776 4358 5143 4565 2850 2107 1819
EBITDA Margin 22% 23% 22% 20% 20% 24% 24% 21% 29% 28%
EBIDTA (`/mt) 1042 1091 1019 967 951 1152 1017 758 1038 983
EBIT 4881 4512 3988 3572 3219 4120 3602 2037 1715 1493
Profit Before Tax 3301 3872 3421 2986 2858 3867 3345 1745 1598 1368
Tax Expenses 1077 1159 942 884 645 1179 948 384 501 388
Net Earnings after Minority Interest 2222 2715 2478 2098 2206 2678 2403 1367 1095 978
Cash Earnings 4777 4404 4166 3680 3424 3869 3370 2172 1595 1485
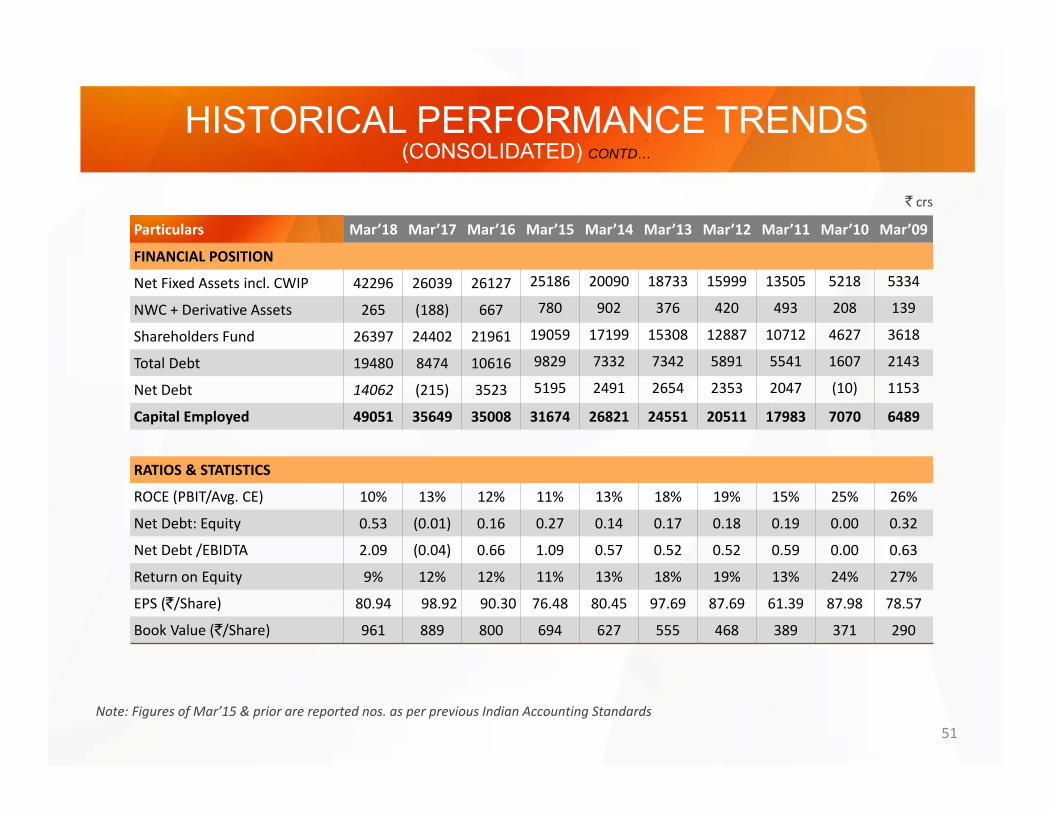
Particulars Mar’18 Mar’17 Mar’16 Mar’15 Mar’14 Mar’13 Mar’12 Mar’11 Mar’10 Mar’09
FINANCIAL POSITION
Net Fixed Assets incl. CWIP 42296 26039 26127 25186 20090 18733 15999 13505 5218 5334
NWC + Derivative Assets 265 (188) 667 780 902 376 420 493 208 139
Shareholders Fund 26397 24402 21961 19059 17199 15308 12887 10712 4627 3618
Total Debt 19480 8474 10616 9829 7332 7342 5891 5541 1607 2143
Net Debt 14062 (215) 3523 5195 2491 2654 2353 2047 (10) 1153
Capital Employed 49051 35649 35008 31674 26821 24551 20511 17983 7070 6489
RATIOS & STATISTICS
ROCE (PBIT/Avg. CE) 10% 13% 12% 11% 13% 18% 19% 15% 25% 26%
Net Debt: Equity 0.53 (0.01) 0.16 0.27 0.14 0.17 0.18 0.19 0.00 0.32
Net Debt /EBIDTA 2.09 (0.04) 0.66 1.09 0.57 0.52 0.52 0.59 0.00 0.63
Return on Equity 9% 12% 12% 11% 13% 18% 19% 13% 24% 27%
EPS (`/Share) 80.94 98.92 90.30 76.48 80.45 97.69 87.69 61.39 87.98 78.57
Book Value (`/Share) 961 889 800 694 627 555 468 389 371 290
51
HISTORICAL PERFORMANCE TRENDS(CONSOLIDATED) CONTD…
` crs
Note: Figures of Mar’15 & prior are reported nos. as per previous Indian Accounting Standards

INCOME STATEMENT
52
(STANDALONE)
US$ Mn
Q4Particulars
FYCY LY % CY LY %
1380 1010 37 Revenues (net of taxes) 4563 3670 24
281 236 19 EBITDA 1007 875 1520% 23% (3) Margin (%) 22% 24% (2)
52 24 Finance costs 184 89
75 54 (38) Depreciation 274 199 (38)
154 158 (2) PBT 548 587 (7)49 51 3 Tax Expenses (Normalised) 172 178 4
105 107 (2) PAT Normalised 376 408 (8)35 - Extra-ordinary Items* 35 -
76 107 (29) PAT Reported** 347 408 (15)0.3 0.4 (29) EPS (Rs.) 1.3 1.5 (15)
* Provision for stamp duty on acquired assets** After extraordinary items (net of tax) and one time charge of deferred tax on opening liability due to change in effective income‐tax rate.
Normalised PAT is marginally lower despite higher depreciation and interest cost
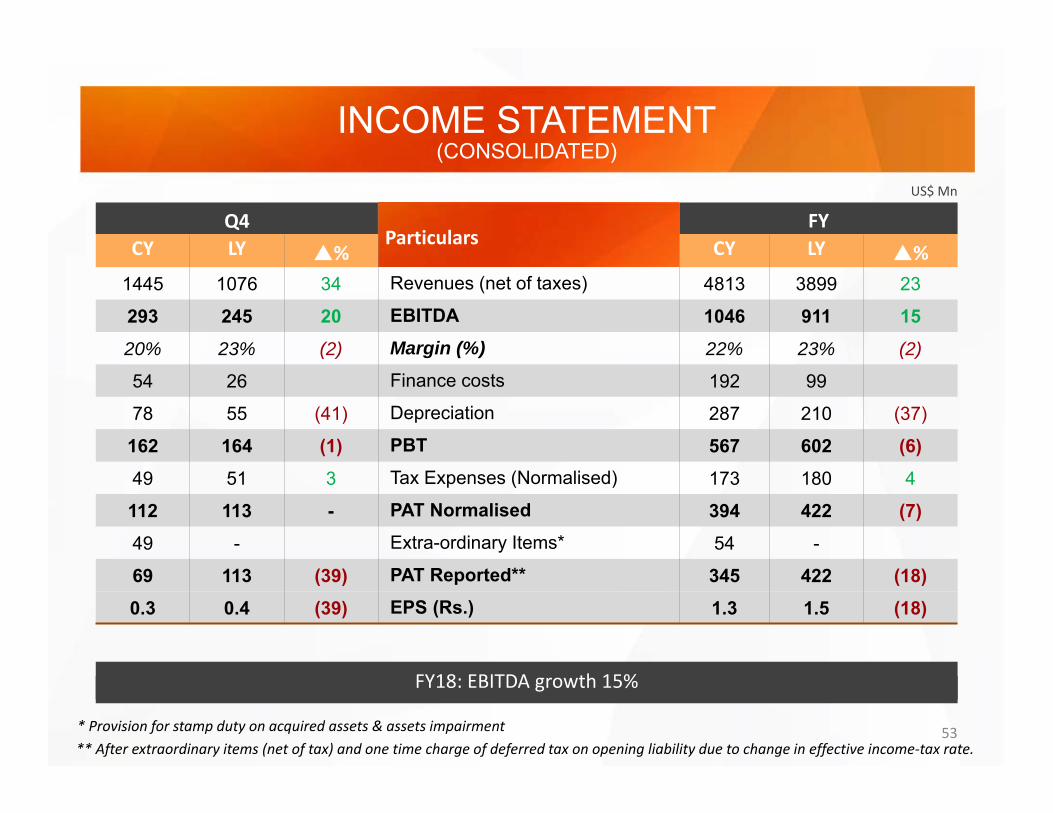
INCOME STATEMENT
53
(CONSOLIDATED)
Q3FY18: EBITDA GROWTH 17%
US$ Mn
FY18: EBITDA growth 15%
Q4Particulars
FYCY LY % CY LY %
1445 1076 34 Revenues (net of taxes) 4813 3899 23
293 245 20 EBITDA 1046 911 1520% 23% (2) Margin (%) 22% 23% (2)
54 26 Finance costs 192 99
78 55 (41) Depreciation 287 210 (37)
162 164 (1) PBT 567 602 (6)49 51 3 Tax Expenses (Normalised) 173 180 4
112 113 - PAT Normalised 394 422 (7)49 - Extra-ordinary Items* 54 -
69 113 (39) PAT Reported** 345 422 (18)0.3 0.4 (39) EPS (Rs.) 1.3 1.5 (18)
* Provision for stamp duty on acquired assets & assets impairment** After extraordinary items (net of tax) and one time charge of deferred tax on opening liability due to change in effective income‐tax rate.
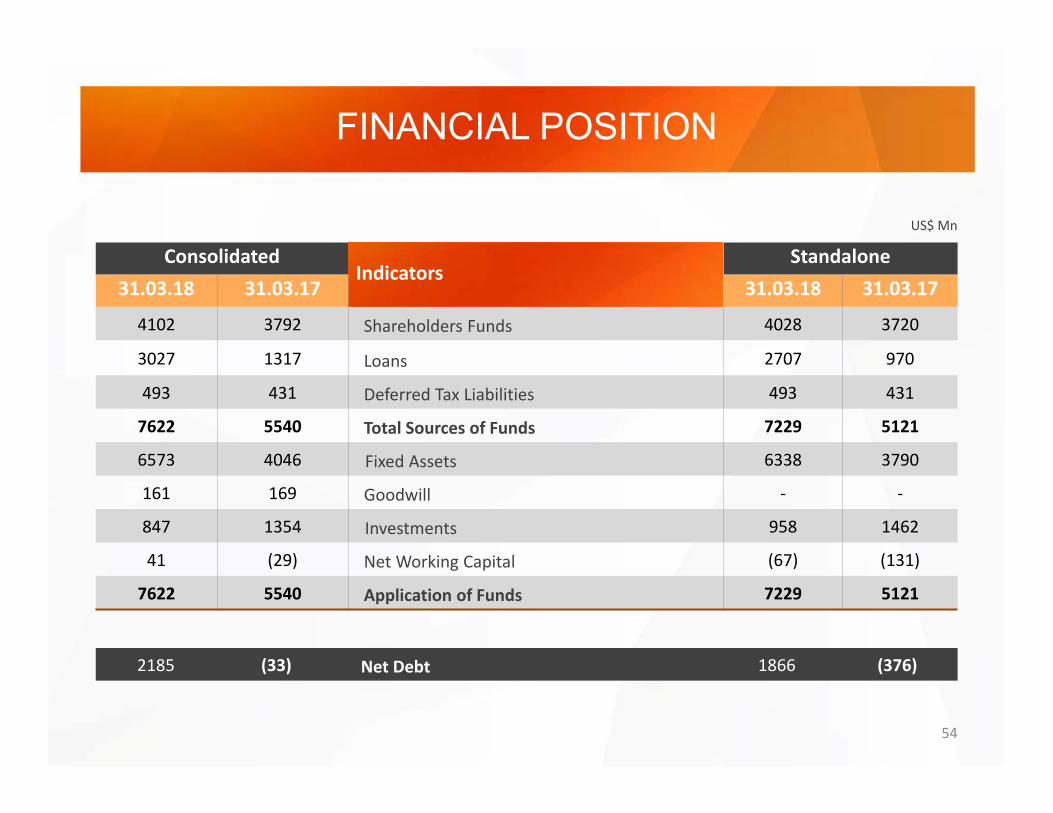
54
FINANCIAL POSITION
US$ Mn
2185 (33) Net Debt 1866 (376)
ConsolidatedIndicators
Standalone31.03.18 31.03.17 31.03.18 31.03.17
4102 3792 Shareholders Funds 4028 3720
3027 1317 Loans 2707 970
493 431 Deferred Tax Liabilities 493 431
7622 5540 Total Sources of Funds 7229 5121
6573 4046 Fixed Assets 6338 3790
161 169 Goodwill ‐ ‐
847 1354 Investments 958 1462
41 (29) Net Working Capital (67) (131)
7622 5540 Application of Funds 7229 5121
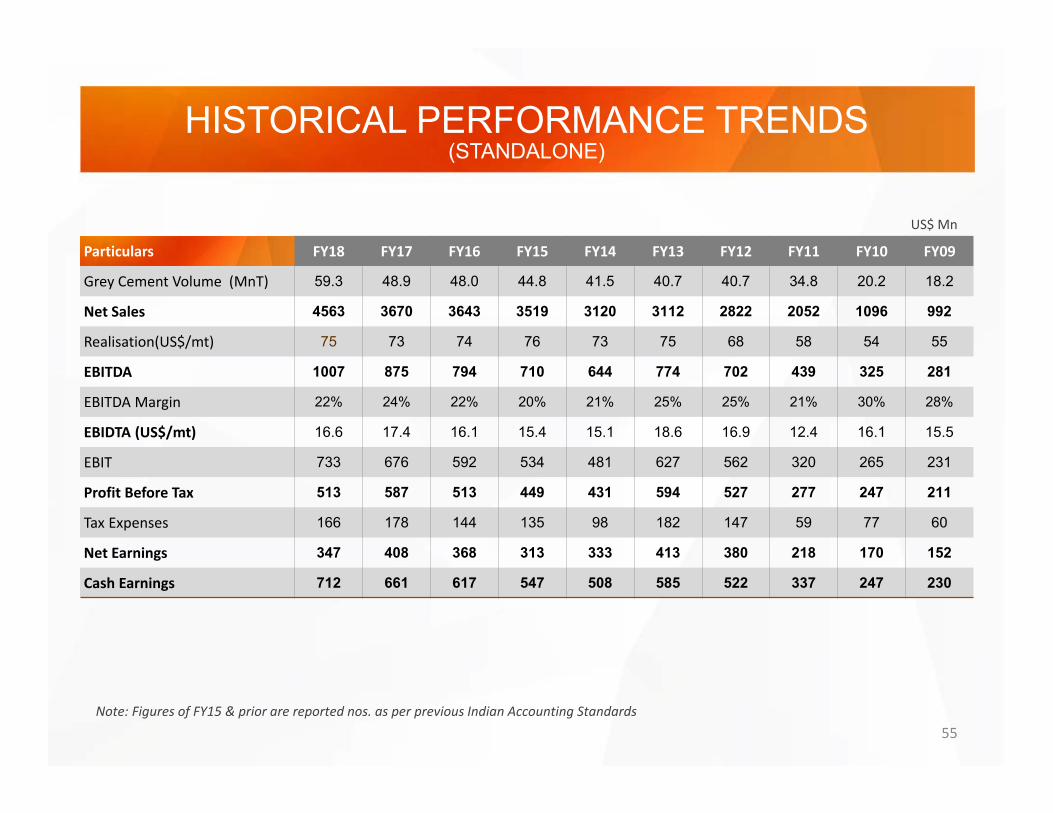
55
HISTORICAL PERFORMANCE TRENDS(STANDALONE)
US$ Mn
Note: Figures of FY15 & prior are reported nos. as per previous Indian Accounting Standards
Particulars FY18 FY17 FY16 FY15 FY14 FY13 FY12 FY11 FY10 FY09
Grey Cement Volume (MnT) 59.3 48.9 48.0 44.8 41.5 40.7 40.7 34.8 20.2 18.2
Net Sales 4563 3670 3643 3519 3120 3112 2822 2052 1096 992
Realisation(US$/mt) 75 73 74 76 73 75 68 58 54 55
EBITDA 1007 875 794 710 644 774 702 439 325 281
EBITDA Margin 22% 24% 22% 20% 21% 25% 25% 21% 30% 28%
EBIDTA (US$/mt) 16.6 17.4 16.1 15.4 15.1 18.6 16.9 12.4 16.1 15.5
EBIT 733 676 592 534 481 627 562 320 265 231
Profit Before Tax 513 587 513 449 431 594 527 277 247 211
Tax Expenses 166 178 144 135 98 182 147 59 77 60
Net Earnings 347 408 368 313 333 413 380 218 170 152
Cash Earnings 712 661 617 547 508 585 522 337 247 230
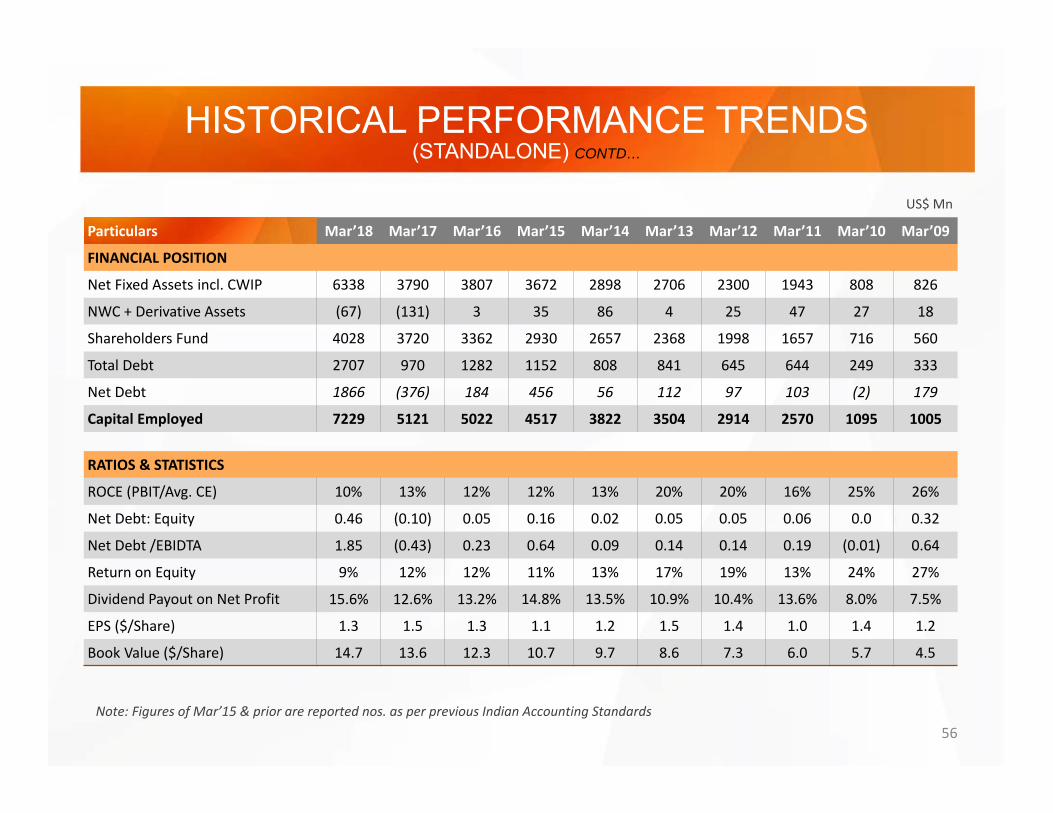
56
HISTORICAL PERFORMANCE TRENDS(STANDALONE) CONTD…
US$ Mn
Note: Figures of Mar’15 & prior are reported nos. as per previous Indian Accounting Standards
Particulars Mar’18 Mar’17 Mar’16 Mar’15 Mar’14 Mar’13 Mar’12 Mar’11 Mar’10 Mar’09
FINANCIAL POSITION
Net Fixed Assets incl. CWIP 6338 3790 3807 3672 2898 2706 2300 1943 808 826
NWC + Derivative Assets (67) (131) 3 35 86 4 25 47 27 18
Shareholders Fund 4028 3720 3362 2930 2657 2368 1998 1657 716 560
Total Debt 2707 970 1282 1152 808 841 645 644 249 333
Net Debt 1866 (376) 184 456 56 112 97 103 (2) 179
Capital Employed 7229 5121 5022 4517 3822 3504 2914 2570 1095 1005
RATIOS & STATISTICS
ROCE (PBIT/Avg. CE) 10% 13% 12% 12% 13% 20% 20% 16% 25% 26%
Net Debt: Equity 0.46 (0.10) 0.05 0.16 0.02 0.05 0.05 0.06 0.0 0.32
Net Debt /EBIDTA 1.85 (0.43) 0.23 0.64 0.09 0.14 0.14 0.19 (0.01) 0.64
Return on Equity 9% 12% 12% 11% 13% 17% 19% 13% 24% 27%
Dividend Payout on Net Profit 15.6% 12.6% 13.2% 14.8% 13.5% 10.9% 10.4% 13.6% 8.0% 7.5%
EPS ($/Share) 1.3 1.5 1.3 1.1 1.2 1.5 1.4 1.0 1.4 1.2
Book Value ($/Share) 14.7 13.6 12.3 10.7 9.7 8.6 7.3 6.0 5.7 4.5
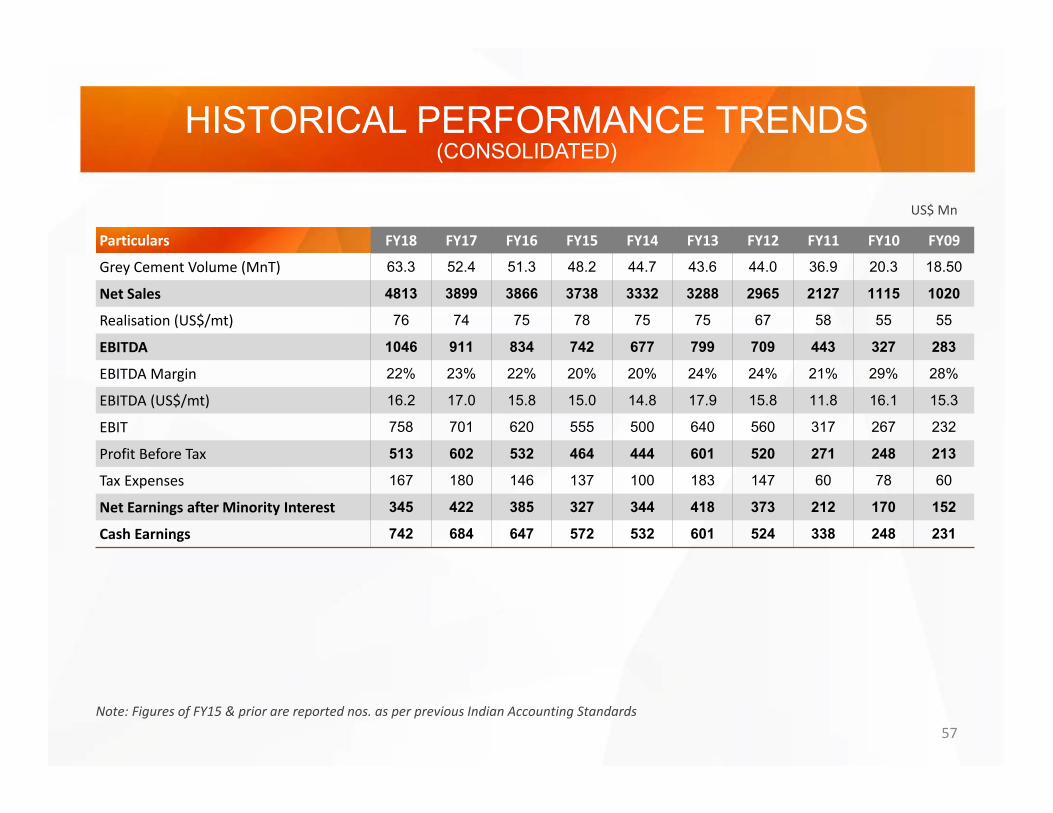
57
HISTORICAL PERFORMANCE TRENDS(CONSOLIDATED)
US$ Mn
Note: Figures of FY15 & prior are reported nos. as per previous Indian Accounting Standards
Particulars FY18 FY17 FY16 FY15 FY14 FY13 FY12 FY11 FY10 FY09
Grey Cement Volume (MnT) 63.3 52.4 51.3 48.2 44.7 43.6 44.0 36.9 20.3 18.50
Net Sales 4813 3899 3866 3738 3332 3288 2965 2127 1115 1020
Realisation (US$/mt) 76 74 75 78 75 75 67 58 55 55
EBITDA 1046 911 834 742 677 799 709 443 327 283
EBITDA Margin 22% 23% 22% 20% 20% 24% 24% 21% 29% 28%
EBITDA (US$/mt) 16.2 17.0 15.8 15.0 14.8 17.9 15.8 11.8 16.1 15.3
EBIT 758 701 620 555 500 640 560 317 267 232
Profit Before Tax 513 602 532 464 444 601 520 271 248 213
Tax Expenses 167 180 146 137 100 183 147 60 78 60
Net Earnings after Minority Interest 345 422 385 327 344 418 373 212 170 152
Cash Earnings 742 684 647 572 532 601 524 338 248 231
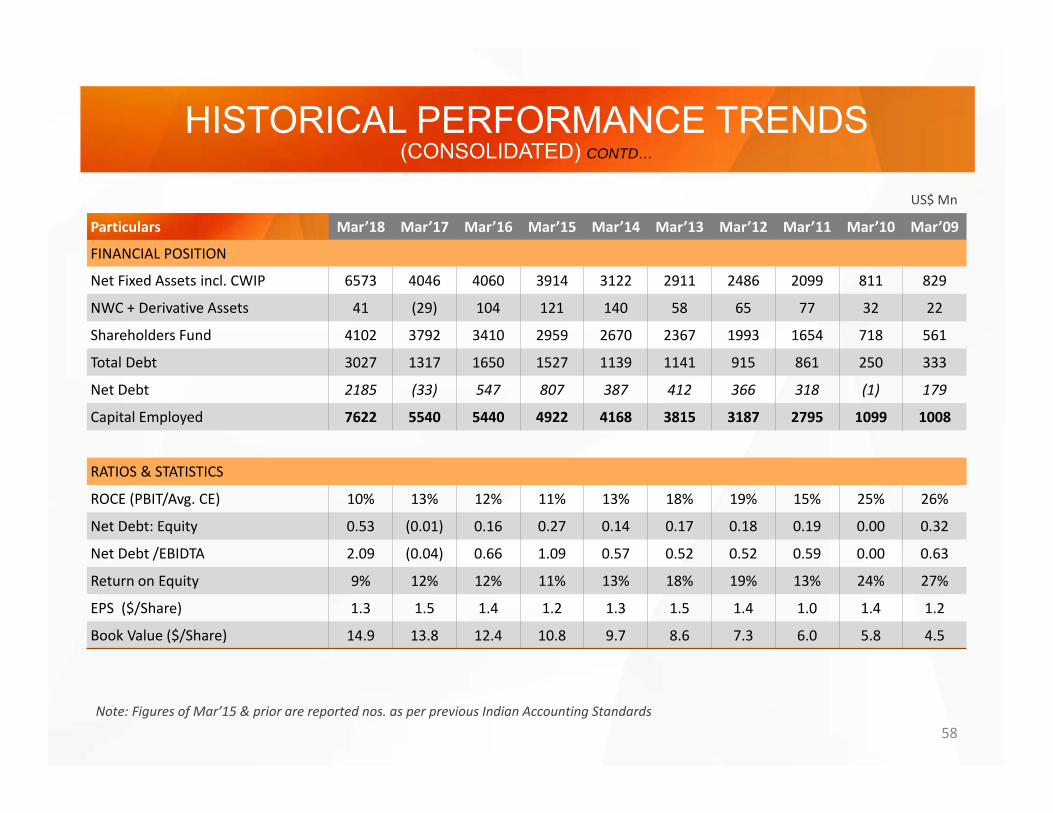
58
HISTORICAL PERFORMANCE TRENDS(CONSOLIDATED) CONTD…
US$ Mn
Note: Figures of Mar’15 & prior are reported nos. as per previous Indian Accounting Standards
Particulars Mar’18 Mar’17 Mar’16 Mar’15 Mar’14 Mar’13 Mar’12 Mar’11 Mar’10 Mar’09
FINANCIAL POSITION
Net Fixed Assets incl. CWIP 6573 4046 4060 3914 3122 2911 2486 2099 811 829
NWC + Derivative Assets 41 (29) 104 121 140 58 65 77 32 22
Shareholders Fund 4102 3792 3410 2959 2670 2367 1993 1654 718 561
Total Debt 3027 1317 1650 1527 1139 1141 915 861 250 333
Net Debt 2185 (33) 547 807 387 412 366 318 (1) 179
Capital Employed 7622 5540 5440 4922 4168 3815 3187 2795 1099 1008
RATIOS & STATISTICS
ROCE (PBIT/Avg. CE) 10% 13% 12% 11% 13% 18% 19% 15% 25% 26%
Net Debt: Equity 0.53 (0.01) 0.16 0.27 0.14 0.17 0.18 0.19 0.00 0.32
Net Debt /EBIDTA 2.09 (0.04) 0.66 1.09 0.57 0.52 0.52 0.59 0.00 0.63
Return on Equity 9% 12% 12% 11% 13% 18% 19% 13% 24% 27%
EPS ($/Share) 1.3 1.5 1.4 1.2 1.3 1.5 1.4 1.0 1.4 1.2
Book Value ($/Share) 14.9 13.8 12.4 10.8 9.7 8.6 7.3 6.0 5.8 4.5
DisclaimerStatements in this “Presentation” describing the Company’s objectives, estimates, expectations or
predictions may be “forward looking statements” within the meaning of applicable securities laws and regulations. Actual results could differ materially from those expressed or implied. Important factors that could make a difference to the Company’s operations include global and Indian demand supply conditions, finished goods prices, feedstock availability and prices, cyclical demand and pricing in the
Company’s principal markets, changes in Government regulations, tax regimes, economic developments within India and the countries within which the Company conducts business and other factors such as litigation and labour negotiations. The Company assumes no responsibility to publicly amend, modify or revise any forward looking statement, on the basis of any subsequent development,
information or events, or otherwise.
UltraTech Cement LimitedRegd. Office: 2nd Floor, ‘B’ Wing, Ahura Centre, MIDC, Andheri (E), Mumbai ‐ 400 093
Corporate Identity Number L26940MH2000PLC128420
www.ultratechcement.com or [email protected]