Academic patenting in Europe: new evidence from the KEINS database Francesco Lissoni (Università di...
28
Academic patenting in Europe: new evidence from the KEINS database Francesco Lissoni (Università di Brescia & CESPRI-Università Bocconi) European Universities Learning to Compete June 12, 2008, Stockholm
-
Upload
delilah-matthews -
Category
Documents
-
view
215 -
download
0
Transcript of Academic patenting in Europe: new evidence from the KEINS database Francesco Lissoni (Università di...
Academic patenting in Europe: new evidence from the KEINS
database
Francesco Lissoni (Università di Brescia & CESPRI-Università Bocconi)
European Universities Learning to CompeteJune 12, 2008, Stockholm
2
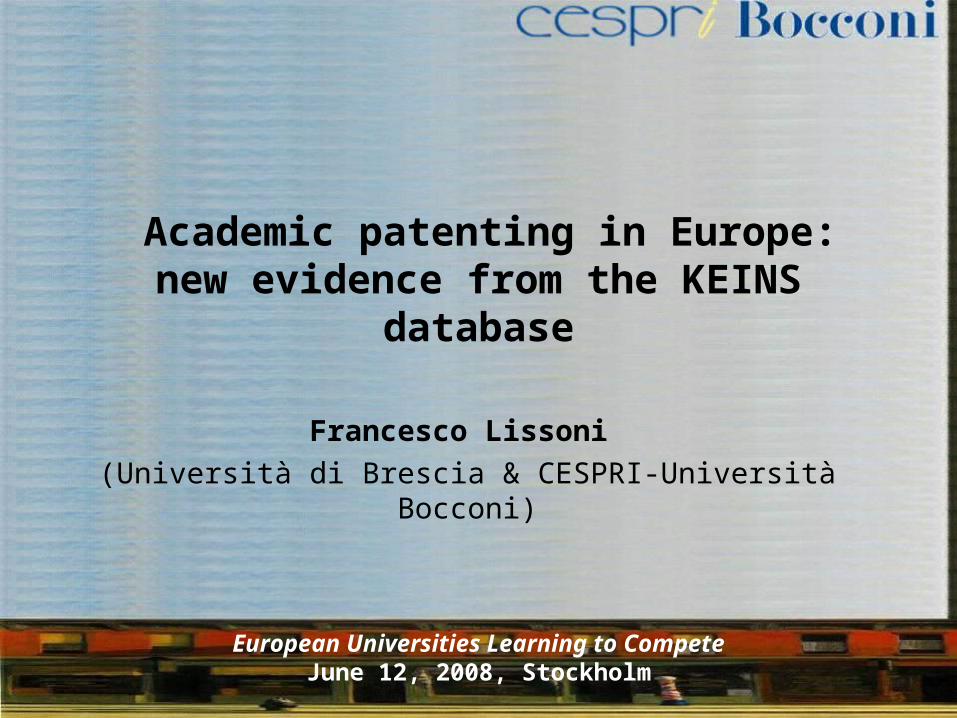
Sources
• Lissoni F., Llerena P., McKelvey M., Sanditov B. (2008), “Academic Patenting in Europe: New Evidence from the KEINS Database” IN THE BOOK Data on France, Italy and Sweden
• Lissoni F., Nuvolari A., Tartari V., “Academic patenting in the Netherlands”, not-yet-a-draft

3
Outline
1. Motivation: re-assessment of academic patenting phenomenon in Europe
2. Academic inventorship and the KEINS database: origin and methodology
3. Academic patenting in Sweden in an international perspective
4. Summing up and research questions from 3.5. More research questions
4
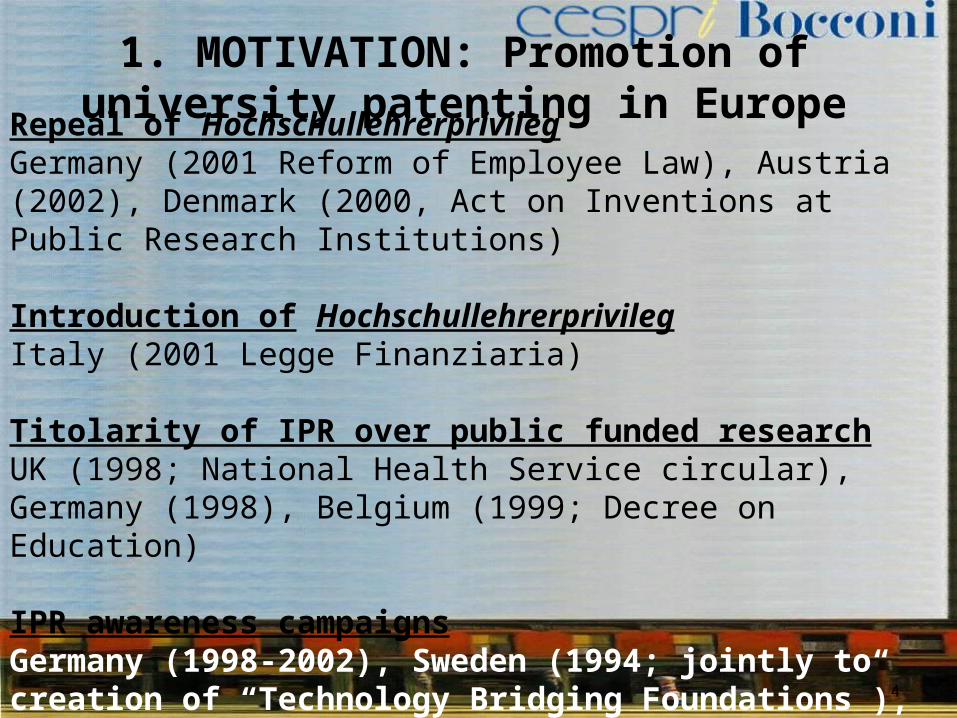
Repeal of HochschullehrerprivilegGermany (2001 Reform of Employee Law), Austria (2002), Denmark (2000, Act on Inventions at Public Research Institutions)
Introduction of HochschullehrerprivilegItaly (2001 Legge Finanziaria)
Titolarity of IPR over public funded researchUK (1998; National Health Service circular), Germany (1998), Belgium (1999; Decree on Education)
IPR awareness campaignsGermany (1998-2002), Sweden (1994; jointly to creation of “Technology Bridging Foundations”), France (1999; 2001)
1. MOTIVATION: Promotion of university patenting in Europe
5
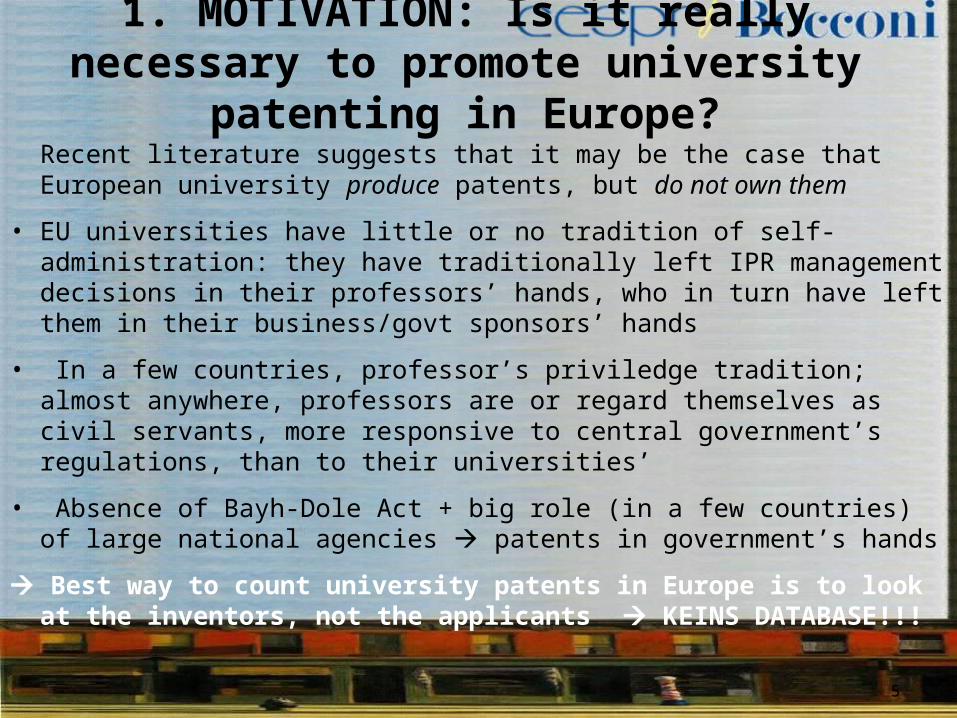
1. MOTIVATION: Is it really necessary to promote university patenting in
Europe?Recent literature suggests that it may be the case that European university produce patents, but do not own them
• EU universities have little or no tradition of self-administration: they have traditionally left IPR management decisions in their professors’ hands, who in turn have left them in their business/govt sponsors’ hands
• In a few countries, professor’s priviledge tradition; almost anywhere, professors are or regard themselves as civil servants, more responsive to central government’s regulations, than to their universities’
• Absence of Bayh-Dole Act + big role (in a few countries) of large national agencies patents in government’s hands
Best way to count university patents in Europe is to look at the inventors, not the applicants KEINS DATABASE!!!
6
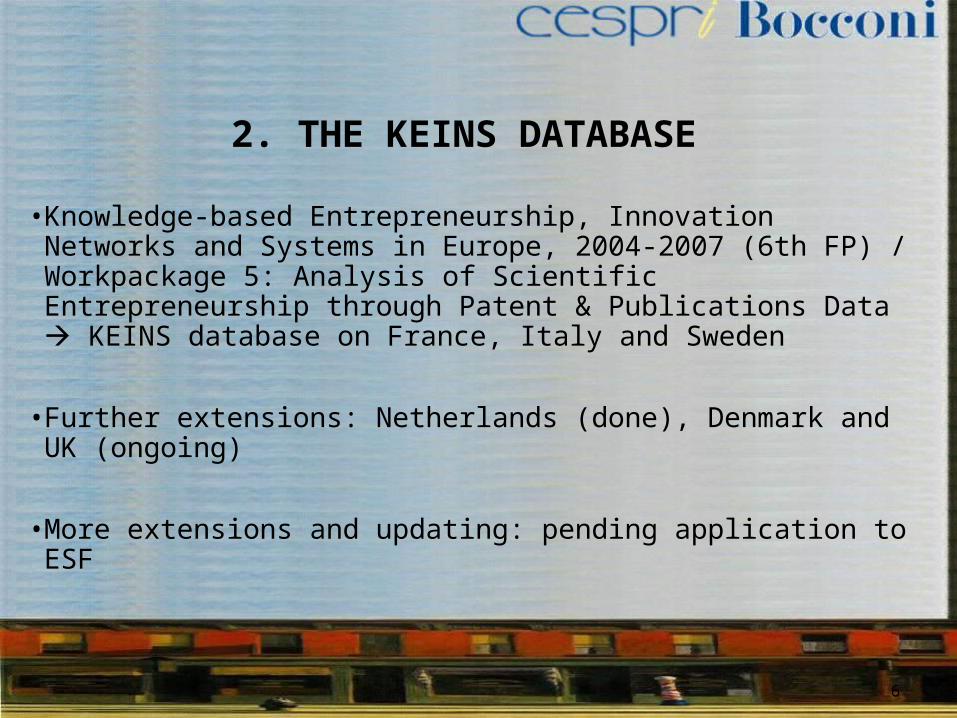
2. THE KEINS DATABASE
•Knowledge-based Entrepreneurship, Innovation Networks and Systems in Europe, 2004-2007 (6th FP) / Workpackage 5: Analysis of Scientific Entrepreneurship through Patent & Publications Data KEINS database on France, Italy and Sweden
•Further extensions: Netherlands (done), Denmark and UK (ongoing)
•More extensions and updating: pending application to ESF
7
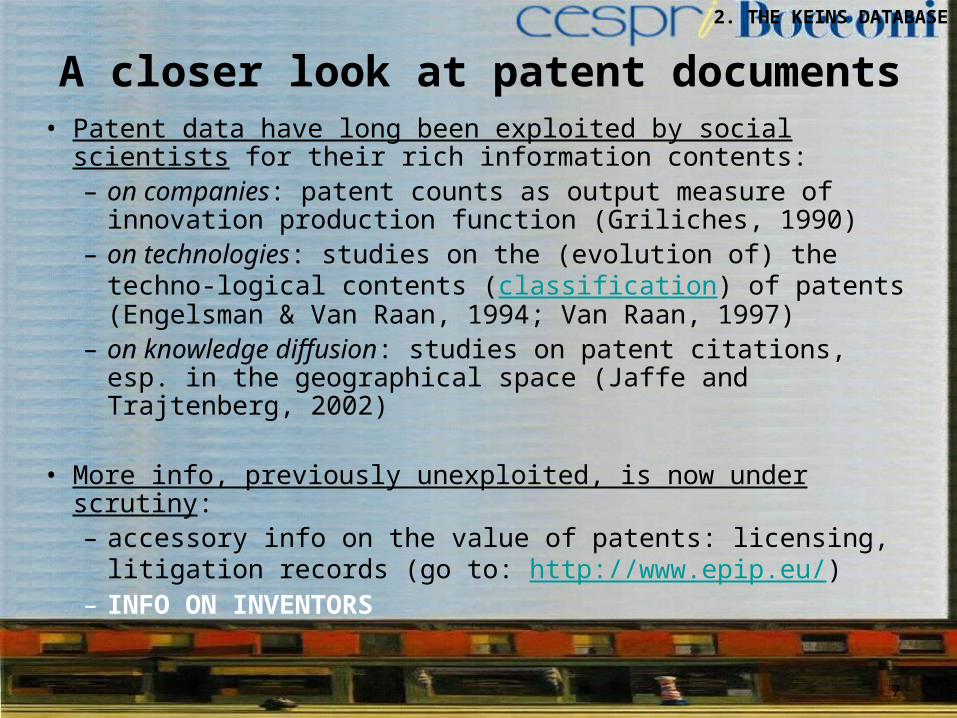
A closer look at patent documents• Patent data have long been exploited by social
scientists for their rich information contents:– on companies: patent counts as output measure of
innovation production function (Griliches, 1990)– on technologies: studies on the (evolution of) the
techno-logical contents (classification) of patents (Engelsman & Van Raan, 1994; Van Raan, 1997)
– on knowledge diffusion: studies on patent citations, esp. in the geographical space (Jaffe and Trajtenberg, 2002)
• More info, previously unexploited, is now under scrutiny:– accessory info on the value of patents: licensing,
litigation records (go to: http://www.epip.eu/)– INFO ON INVENTORS
2. THE KEINS DATABASE
8
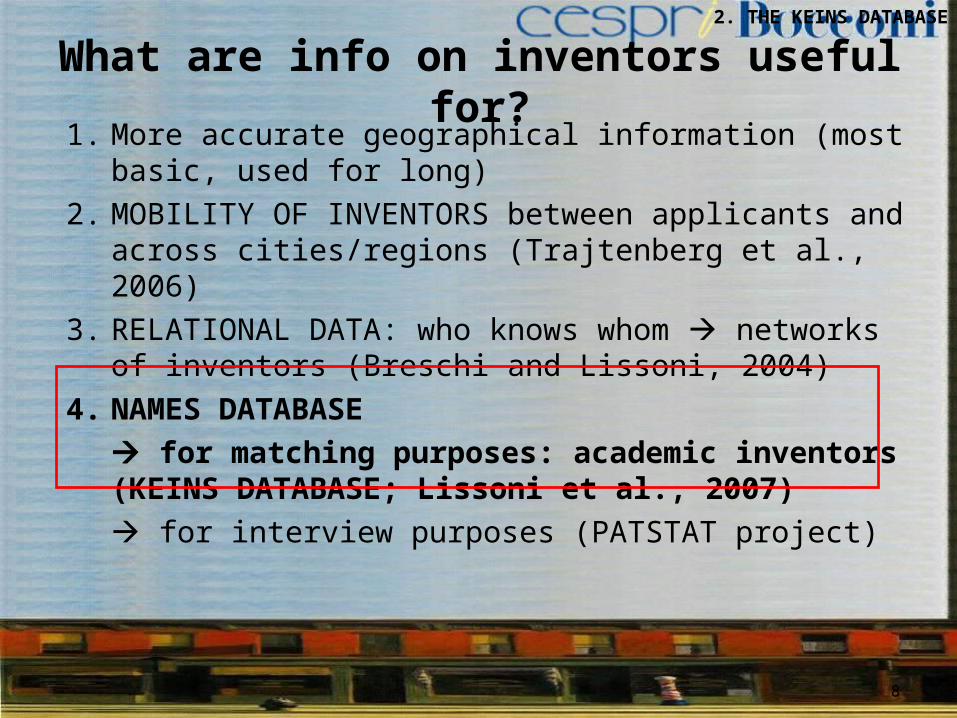
What are info on inventors useful for?
1. More accurate geographical information (most basic, used for long)
2. MOBILITY OF INVENTORS between applicants and across cities/regions (Trajtenberg et al., 2006)
3. RELATIONAL DATA: who knows whom networks of inventors (Breschi and Lissoni, 2004)
4. NAMES DATABASE for matching purposes: academic inventors (KEINS DATABASE; Lissoni et al., 2007) for interview purposes (PATSTAT project)
2. THE KEINS DATABASE
9
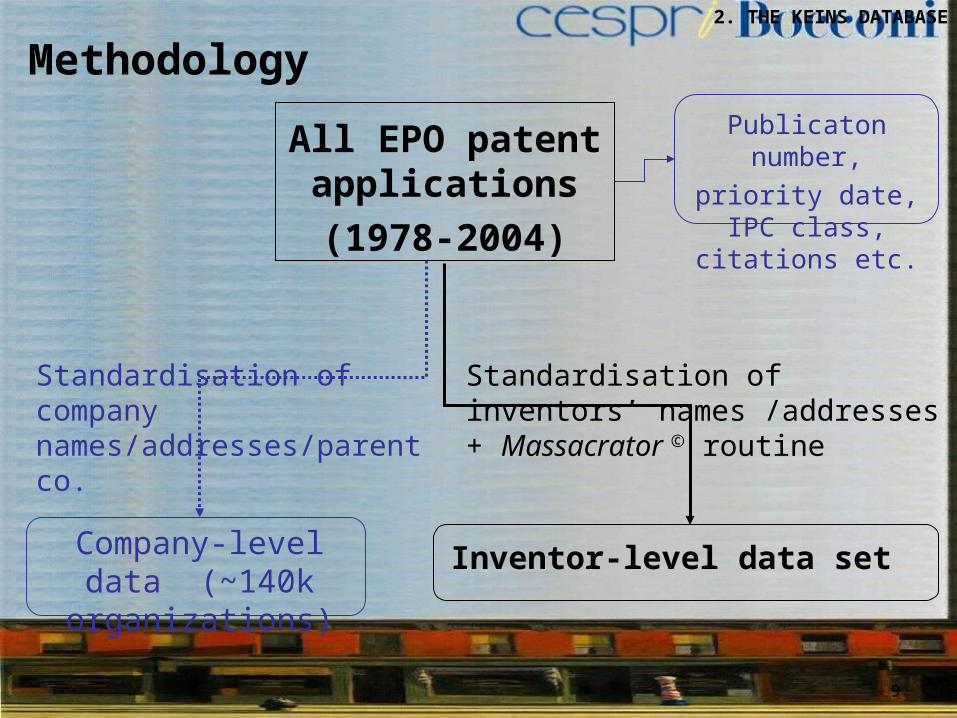
All EPO patent applications(1978-2004)
Standardisation of company names/addresses/parent co.
Company-level data (~140k
organizations)
Standardisation of inventors’ names /addresses + Massacrator © routine
Inventor-level data set
Publicaton number,
priority date, IPC class, citations
etc.
Methodology2. THE KEINS DATABASE

10
2. THE KEINS DATABASE
INVENTOR-PROFESSOR
MATCHING EXERCISE

11
3. Academic patenting in Sweden in an international perspective
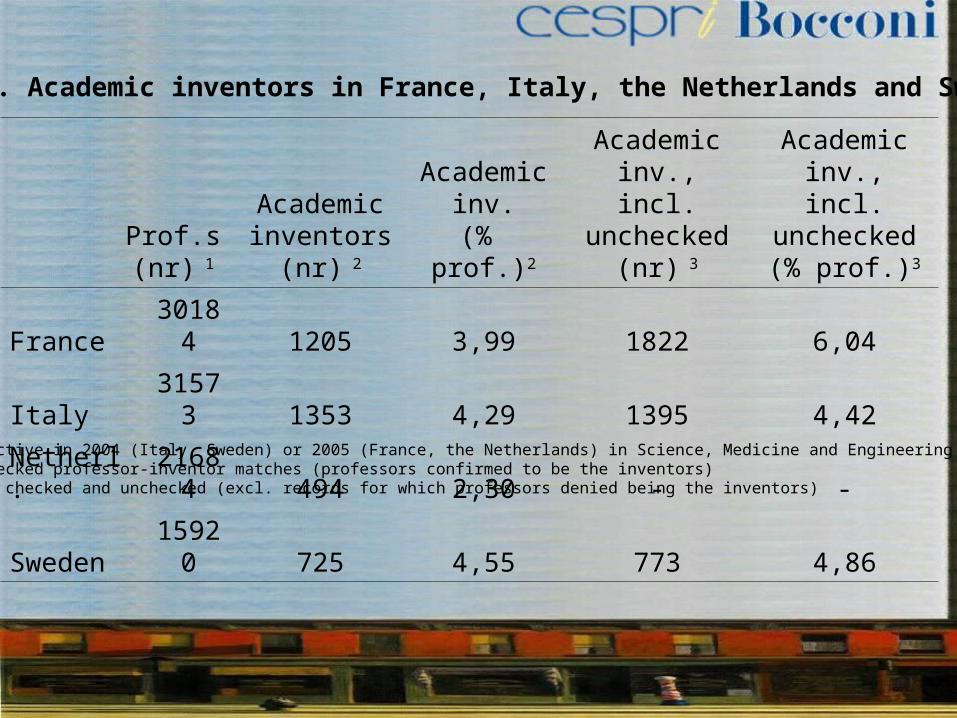
Table 1. Academic inventors in France, Italy, the Netherlands and Sweden
Prof.s (nr) 1
Academic inventors
(nr) 2
Academic inv.
(% prof.)2
Academic inv., incl.
unchecked (nr) 3
Academic inv., incl.
unchecked(% prof.)3
France3018
4 1205 3,99 1822 6,04
Italy3157
3 1353 4,29 1395 4,42
Netherl.2168
4 494 2,30 - -
Sweden1592
0 725 4,55 773 4,86
1 Professors active in 2004 (Italy, Sweden) or 2005 (France, the Netherlands) in Science, Medicine and Engineering2 Data from checked professor-inventor matches (professors confirmed to be the inventors)3 All records, checked and unchecked (excl. records for which professors denied being the inventors)
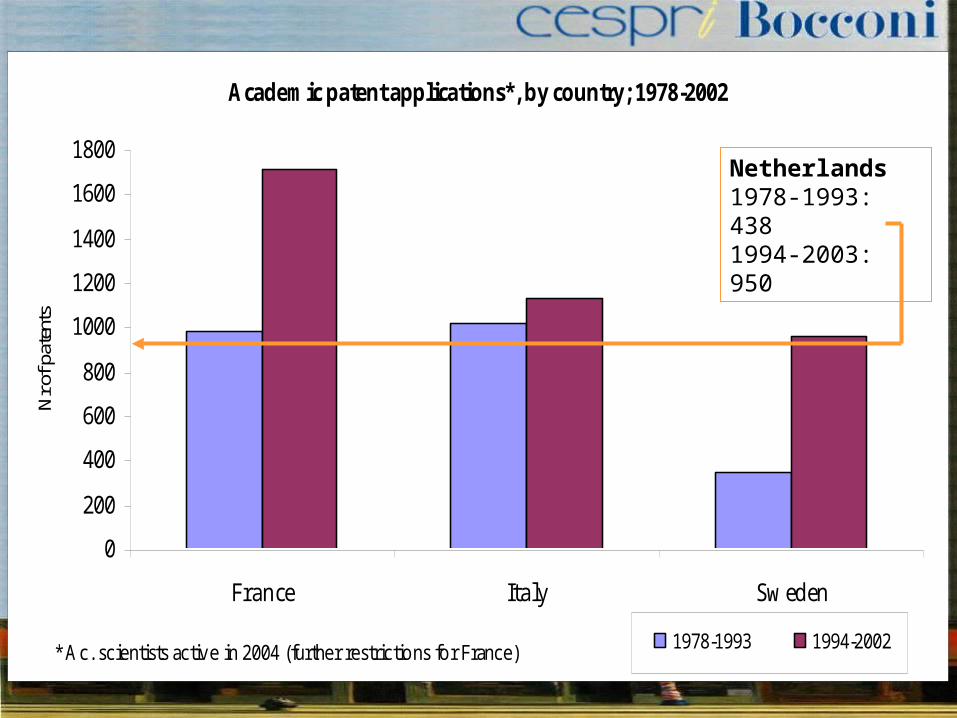
Academic patent applications*, by country; 1978-2002
0
200
400
600
800
1000
1200
1400
1600
1800
France Italy Sweden
* Ac. scientists active in 2004 (further restrictions for France)
Nr o
f pat
ents
1978-1993 1994-2002
Netherlands1978-1993: 4381994-2003: 950
14
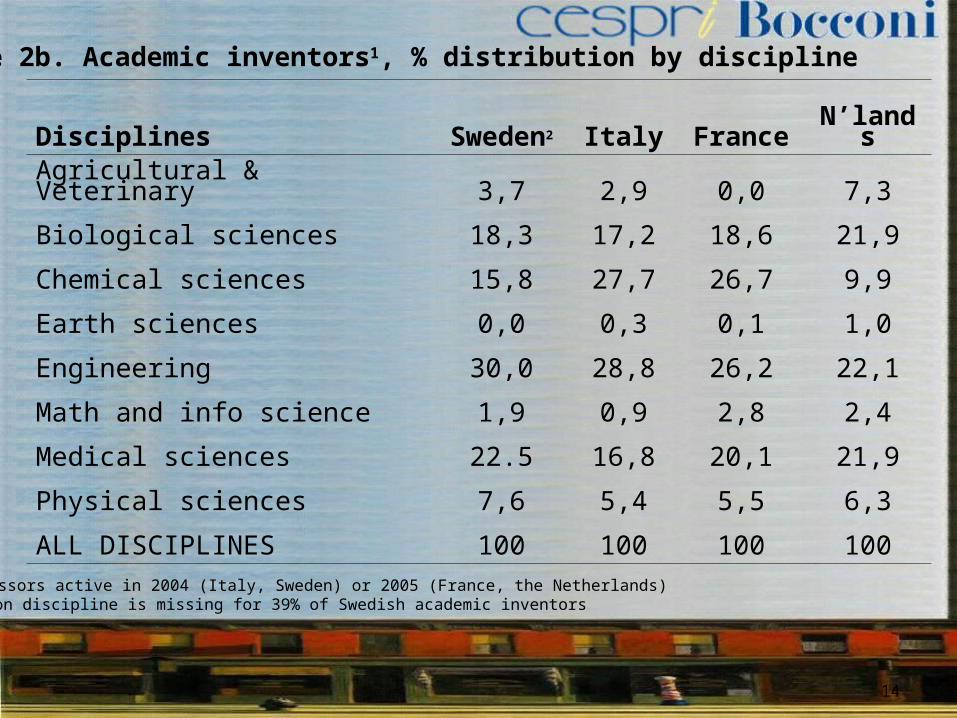
Table 2b. Academic inventors1, % distribution by discipline
DisciplinesSweden
2 Italy FranceN’land
s
Agricultural & Veterinary 3,7 2,9 0,0 7,3
Biological sciences 18,3 17,2 18,6 21,9
Chemical sciences 15,8 27,7 26,7 9,9
Earth sciences 0,0 0,3 0,1 1,0
Engineering 30,0 28,8 26,2 22,1
Math and info science 1,9 0,9 2,8 2,4
Medical sciences 22.5 16,8 20,1 21,9
Physical sciences 7,6 5,4 5,5 6,3
ALL DISCIPLINES 100 100 100 1001 Professors active in 2004 (Italy, Sweden) or 2005 (France, the Netherlands)2 Info on discipline is missing for 39% of Swedish academic inventors
15
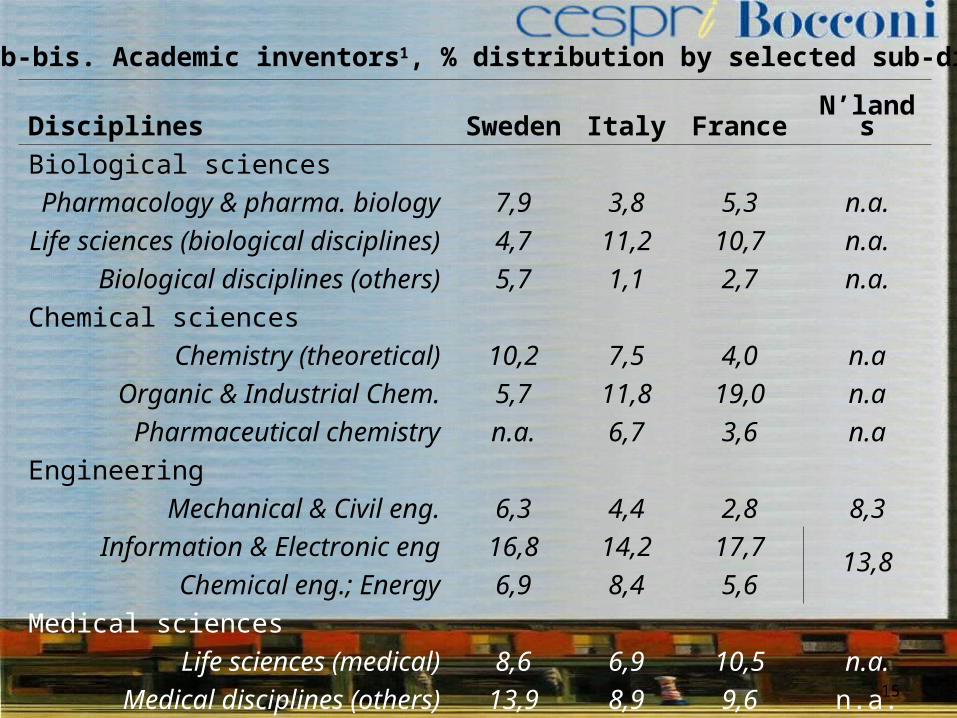
Table 2b-bis. Academic inventors1, % distribution by selected sub-discipline
DisciplinesSwede
n Italy FranceN’land
s
Biological sciencesPharmacology & pharma.
biology 7,9 3,8 5,3 n.a.Life sciences (biological
disciplines) 4,7 11,2 10,7 n.a.Biological disciplines (others) 5,7 1,1 2,7 n.a.
Chemical sciencesChemistry (theoretical) 10,2 7,5 4,0 n.a
Organic & Industrial Chem. 5,7 11,8 19,0 n.aPharmaceutical chemistry n.a. 6,7 3,6 n.a
EngineeringMechanical & Civil eng. 6,3 4,4 2,8 8,3
Information & Electronic eng 16,8 14,2 17,7 13,8Chemical eng.; Energy 6,9 8,4 5,6
Medical sciencesLife sciences (medical) 8,6 6,9 10,5 n.a.
Medical disciplines (others) 13,9 8,9 9,6 n.a.
16
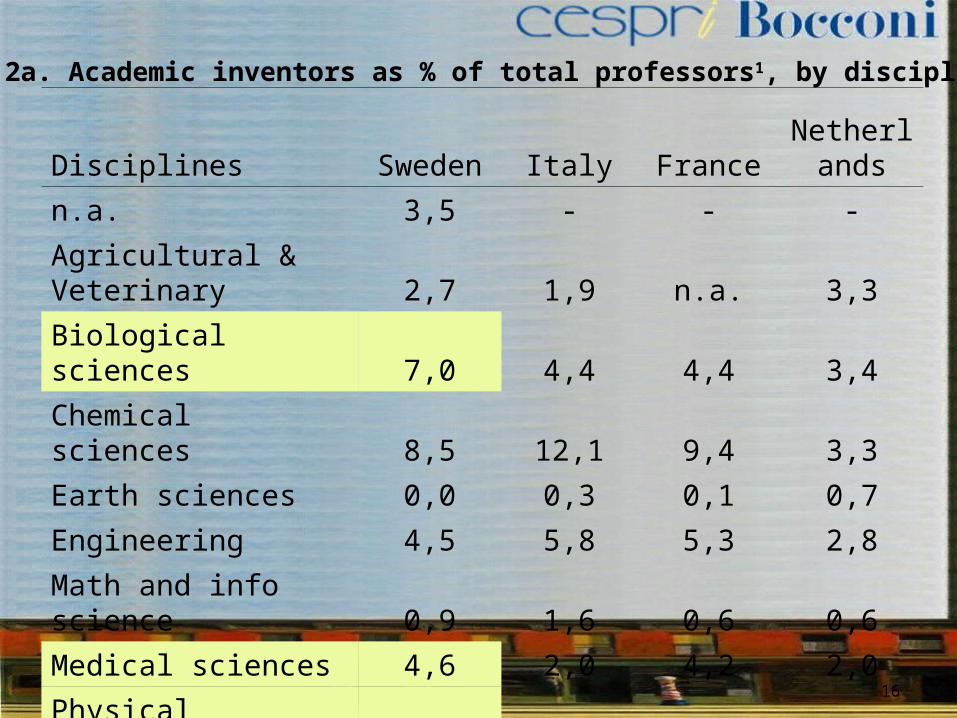
Table 2a. Academic inventors as % of total professors1, by discipline
Disciplines Sweden Italy FranceNetherl
ands
n.a. 3,5 - - -
Agricultural & Veterinary 2,7 1,9 n.a. 3,3
Biological sciences 7,0 4,4 4,4 3,4
Chemical sciences 8,5 12,1 9,4 3,3
Earth sciences 0,0 0,3 0,1 0,7
Engineering 4,5 5,8 5,3 2,8
Math and info science 0,9 1,6 0,6 0,6
Medical sciences 4,6 2,0 4,2 2,0
Physical sciences 4,7 2,7 2,5 1,5
ALL DISCIPLINES 4,5 4,3 4,0 2,3

17
Technological distribution of all the academic patents applications by country ; 1994-2002
0,0%
10,0%
20,0%
30,0%
40,0%
50,0%
60,0%
70,0%
80,0%
90,0%
100,0%
The Netherlands France Italy Sw eden
% a
cade
mic
pat
ents
Electronic Instrumentation Materials Chemistry
Pharmacology - Biotechnologies Process Engineering Mechanical Engineering Transports
Consumption goods - Civil Engineering
18
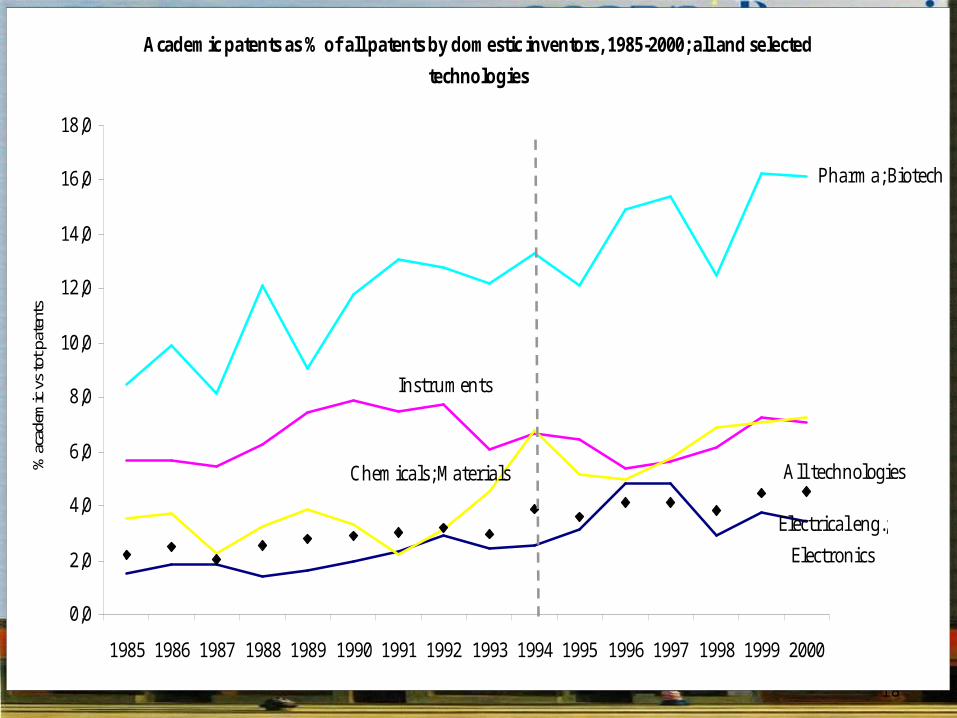
Academic patents as % of all patents by domestic inventors, 1985-2000; all and selected
technologies
Electrical eng.;
Electronics
Instruments
Chemicals; Materials
Pharma; Biotech
All technologies
0,0
2,0
4,0
6,0
8,0
10,0
12,0
14,0
16,0
18,0
1985 1986 1987 1988 1989 1990 1991 1992 1993 1994 1995 1996 1997 1998 1999 2000
% a
cade
mic
vs
tot p
aten
ts

19
APPLICANTSPAT
sMAIN CLASS
ABB 151 Equipment and electrical machines
Ericsson 114 Telecommunications
Pharmacia UpJohn 75 Pharmacology and cosmetics
AstraZeneca 40 Pharmacology and cosmetics
Telia 27 Information Technologies
Siemens 25 Medical technologies
Karolinska 19 Biotechnologies
A & Science Invest 17 Pharmacology and cosmetics
Sandvik 16 Materials, Metallurgy
Kvaerner Pulping 13 Materials treatment
Top ten owners of academic patents in Sweden, 1978-2003

20
APPLICANTS PATs MAIN CLASS
Francia
CNRS 220 Biotech., Medical technology
INSERM 99 Biotech., Organic Chemistry
Total 72 Macromolecular Chemistry, Thermal Processes
France Telecom 55 Telecommunications
Cea 52 Surface treatments, Materials, Metallurgy
Thales 45 Analysis, measure and control technologies, Telecommunications
Rhodia 40 Macromolecular Chemistry, Materials, Metallurgy
Universite Paris VI 42 Biotechnologies
Adir & Co. 38 Organic Chemistry
Institut Pasteur 38 Biotech., Organic Chemistry
Top ten owners of academic patents in France, 1978-2003
21
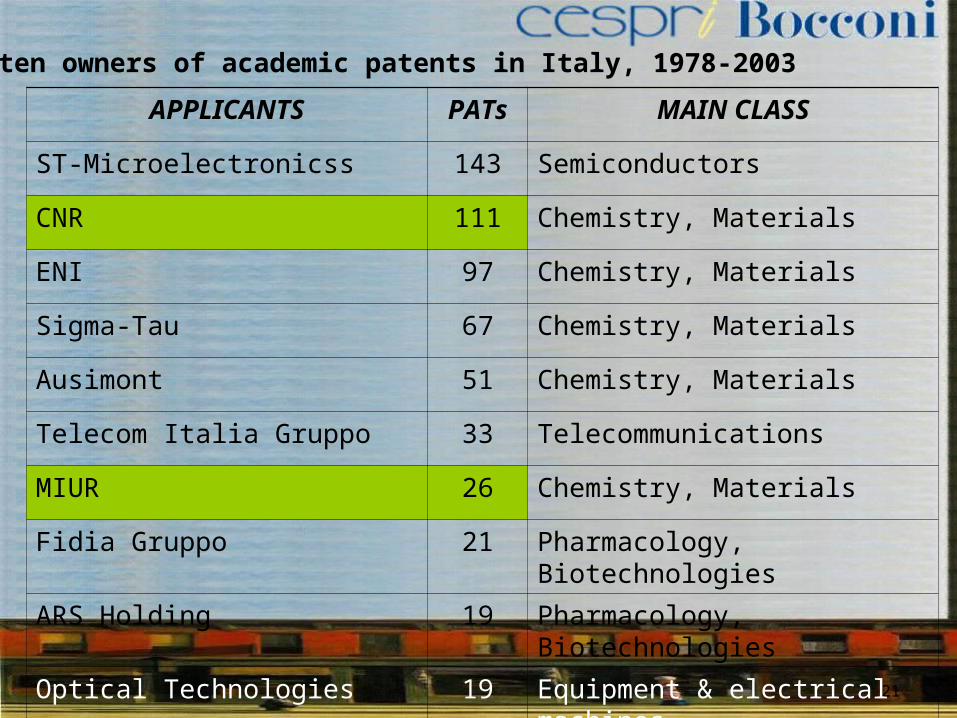
APPLICANTS PATs MAIN CLASS
ST-Microelectronicss 143 Semiconductors
CNR 111 Chemistry, Materials
ENI 97 Chemistry, Materials
Sigma-Tau 67 Chemistry, Materials
Ausimont 51 Chemistry, Materials
Telecom Italia Gruppo 33 Telecommunications
MIUR 26 Chemistry, Materials
Fidia Gruppo 21 Pharmacology, Biotechnologies
ARS Holding 19 Pharmacology, Biotechnologies
Optical Technologies 19 Equipment & electrical machines
Top ten owners of academic patents in Italy, 1978-2003

22
Top ten owners of academic patents in the Netherlands, 1978-2003
APPLICANTS PATs MAIN CLASS
Philips 236 Electronics
Unilever 98 Pharmacology - Biotechnologies
Leiden University 73 Pharmacology - Biotechnologies
Utrecht University 43 Pharmacology - Biotechnologies
AKZO 43 Instrumentation and Pharmacology Biotechnologies
Delft University 42 Process Engineering
University of Groningen 32 Pharmacology - Biotechnologies
Stichting voor de technische wetenschappen (STW)
31 Instrumentation and Pharmacology Biotechnologies
Leadd (Leiden univ.) 23 Pharmacology - Biotechnologies
University of Amsterdam 22 Pharmacology - Biotechnologies
23
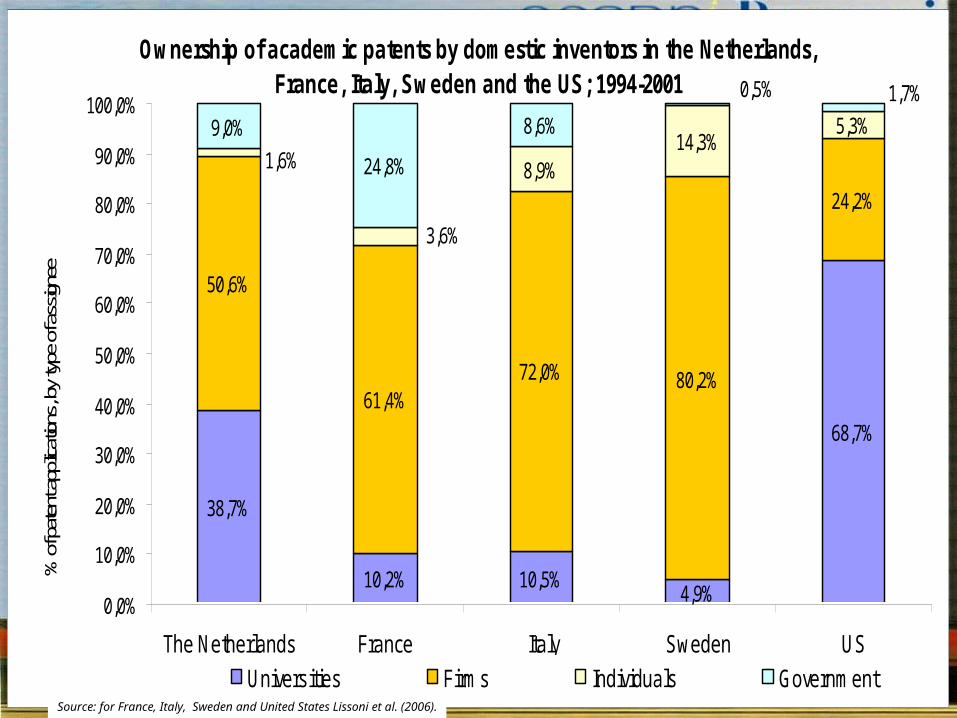
Ownership of academic patents by domestic inventors in the Netherlands, France, Italy, Sweden and the US; 1994-2001
38,7%
10,2% 10,5%4,9%
68,7%
50,6%
61,4%72,0% 80,2%
24,2%8,9%
14,3%5,3%9,0%
24,8%
8,6%
1,6%
3,6%
1,7%0,5%
0,0%
10,0%
20,0%
30,0%
40,0%
50,0%
60,0%
70,0%
80,0%
90,0%
100,0%
The Netherlands France Italy Sweden US
% o
f pat
ent a
pplic
ation
s, b
y ty
pe o
f ass
ignee
Universities Firms Individuals GovernmentSource: for France, Italy, Sweden and United States Lissoni et al. (2006).
24
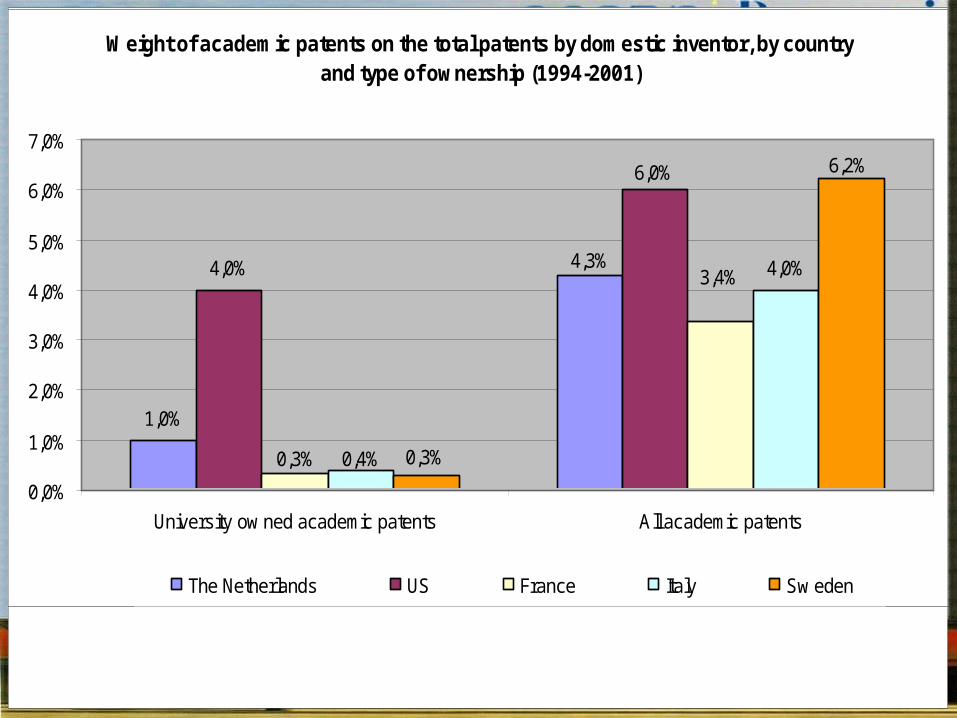
Weight of academic patents on total patents by domestic inventors, by country and
type of ownership (1994-2001)
0,0%
1,0%
2,0%
3,0%
4,0%
5,0%
6,0%
7,0%
University-owned academic
patents (1) (2)
All academic patents% w
eight of
aca
dem
ic p
ate
nt
ap
plica
tions
on t
ota
l ap
plica
tions
US*
France
Italy
Sweden
(1) US univ-owened patent include no-profit organizations (4,2% of tot obs); all data include co-assigned
patents (source: Thursby et al., 2006)
(2) Estimate of weight of univ-owned patents from Mowery and Sampat (2006)
Weight of academic patents on the total patents by domestic inventor, by country and type of ownership (1994-2001)
1,0%
4,0% 4,0%4,3%
6,0%
3,4%
0,3% 0,4%
6,2%
0,3%
0,0%
1,0%
2,0%
3,0%
4,0%
5,0%
6,0%
7,0%
University ow ned academic patents All academic patents
The Netherlands US France Italy Sw eden

25
4. Summing up and research questions Does Europe really fare worse than the US in academic
patenting? YES, in absolute numbers. NO, as % of overall patenting activity, esp. Sweden
Does a “European model” of academic patenting exist? YES, it consists of leaving ownership largely in business companies’ hands. BUT: things are changing: university ownership is increasing (Della Malva, Lissoni, Llerena, 2008) the Netherlands seems to be a partial exception
Ownership patterns for academic patenting are affected both by: IPR regulations Institutional features of academic systems Academic scientists’ incentives to invent-for-patenting,
disclose to universities, and relate to industry
Stratification of universities with respect to patent portfolios
26
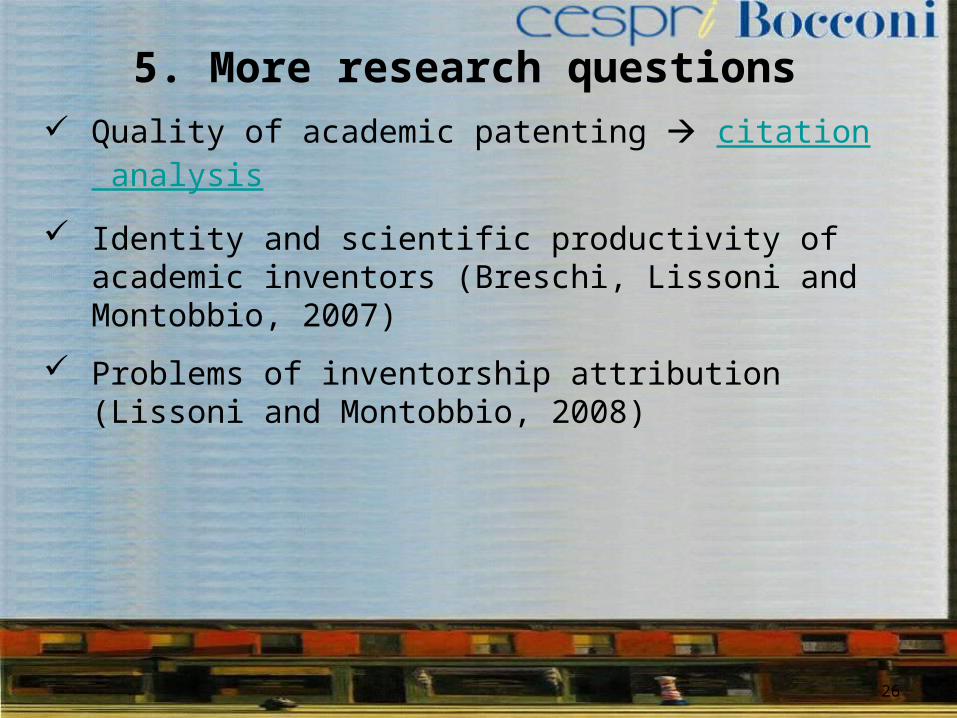
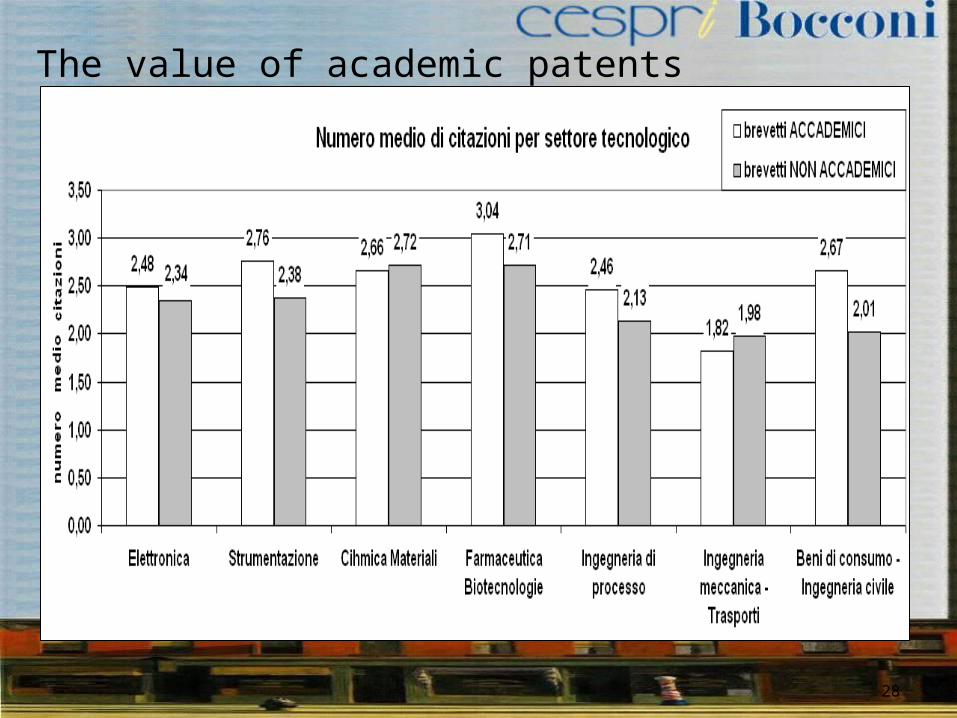
5. More research questions Quality of academic patenting citation
analysis
Identity and scientific productivity of academic inventors (Breschi, Lissoni and Montobbio, 2007)
Problems of inventorship attribution (Lissoni and Montobbio, 2008)

27
Average of the received citations in the Netherlands, Italy, France and Sweden. 1994-2002
2,13 2,11 2,162,04
1,92
2,242,30
1,89
0,00
0,50
1,00
1,50
2,00
2,50
THE NETHERLANDS ITALY FRANCE SWEDEN
Academic patents Not academic patents
The value of academic patents
28
The value of academic patents