A Simulation Tool for Combined Rail/Road Transport in
15
To appear in: Journal of Mathematics and Computers in Simulation, IMACS/Elsevier Science 1 A Simulation Tool for Combined Rail/Road Transport in Intermodal Terminals Andrea E. Rizzoli a,* , Nicoletta Fornara a , Luca Maria Gambardella a a IDSIA, Galleria2, CH-6928, Manno, Lugano, Switzerland Abstract A simulation model of the flow of Intermodal Terminal Units (ITUs) among and within inland intermodal terminals is presented. The intermodal terminals are inter-connected by rail corridors. Each terminal serves a user catchment area via a road network. The terminal is modelled as a set of platforms, which are served by a number of gantry cranes and front lifters. The user of the simulation model defines the structure of the terminal and the train and truck arrival scenarios. The train arrivals are defined in a train timetable, while the patterns of truck arrivals for ITU delivery and pick-up can be either statistically modelled or given as a deterministic input. The simulator can be used to simulate both a single terminal and a rail network, that is, two or more interconnected terminals. During the simulation, various statistics are gathered to assess the performance of the terminal equipment, the ITU residence time, and the terminal throughput. The simulation software has been implemented as a discrete-event simulation model, using MODSIM III as development tool. The simulator tool has been developed as part of the PLATFORM project, funded by the Directorate General VII of the European Community. Keywords: intermodal transport, intermodal terminal simulation. 1. Introduction The “globalisation” of world economy has led to a constant decrease in the cost of transport (95% of world cargo moves by ship, transport costs account for 1% of the total cost [1]). Nowadays many intermodal terminals are still managed without a pervasive support of information technologies: the terminal management highly relies on well-assessed policies, typical of each terminal, which have been defined by the managers on the basis of their experience. In most cases these policies are satisfactory since the terminals have sufficient resources in terms of tracks, equipment, human resources and they can support the current flows of freight. On the other hand, the growth of freight transport shows a rapidly increasing trend in the short and medium terms, which the current infrastructures and management tools cannot meet. The European Intermodal Association established the working group “Intermodal Terminals”, which defined a set of minimum requirements for the intermodal terminals of the future (http://www.eia-ngo.com/terminals.html). These standards define the minimum dimensions of a terminal able to guarantee sufficient traffic concentration and independent economic management using the currently available techniques. Irrespective, terminal operators prefer to explore whether new management methodologies can improve the terminal performance before investing in new equipment or enlarging the area of the terminals. Computer based simulation can provide the * Corresponding author. Tel.: +41-91-6108664; fax: +41-91-6108661; e-mail: [email protected]
Transcript of A Simulation Tool for Combined Rail/Road Transport in
To appear in: Journal of Mathematics and Computers in Simulation, IMACS/Elsevier Science
1
A Simulation Tool for Combined Rail/Road Transportin Intermodal Terminals
Andrea E. Rizzolia,*, Nicoletta Fornaraa, Luca Maria Gambardellaa
aIDSIA, Galleria2, CH-6928, Manno, Lugano, Switzerland
Abstract
A simulation model of the flow of Intermodal Terminal Units (ITUs) among and within inland intermodalterminals is presented. The intermodal terminals are inter-connected by rail corridors. Each terminal serves a usercatchment area via a road network. The terminal is modelled as a set of platforms, which are served by a numberof gantry cranes and front lifters. The user of the simulation model defines the structure of the terminal and thetrain and truck arrival scenarios. The train arrivals are defined in a train timetable, while the patterns of truckarrivals for ITU delivery and pick-up can be either statistically modelled or given as a deterministic input. Thesimulator can be used to simulate both a single terminal and a rail network, that is, two or more interconnectedterminals. During the simulation, various statistics are gathered to assess the performance of the terminalequipment, the ITU residence time, and the terminal throughput. The simulation software has been implementedas a discrete-event simulation model, using MODSIM III as development tool. The simulator tool has beendeveloped as part of the PLATFORM project, funded by the Directorate General VII of the European Community.
Keywords: intermodal transport, intermodal terminal simulation.
1. Introduction
The “globalisation” of world economy has led to a constant decrease in the cost of transport(95% of world cargo moves by ship, transport costs account for 1% of the total cost [1]). Nowadaysmany intermodal terminals are still managed without a pervasive support of informationtechnologies: the terminal management highly relies on well-assessed policies, typical of eachterminal, which have been defined by the managers on the basis of their experience. In most casesthese policies are satisfactory since the terminals have sufficient resources in terms of tracks,equipment, human resources and they can support the current flows of freight. On the other hand,the growth of freight transport shows a rapidly increasing trend in the short and medium terms,which the current infrastructures and management tools cannot meet.
The European Intermodal Association established the working group “Intermodal Terminals”,which defined a set of minimum requirements for the intermodal terminals of the future(http://www.eia-ngo.com/terminals.html). These standards define the minimum dimensions of aterminal able to guarantee sufficient traffic concentration and independent economic managementusing the currently available techniques. Irrespective, terminal operators prefer to explore whethernew management methodologies can improve the terminal performance before investing in newequipment or enlarging the area of the terminals. Computer based simulation can provide the
* Corresponding author. Tel.: +41-91-6108664; fax: +41-91-6108661; e-mail: [email protected]
To appear in: Journal of Mathematics and Computers in Simulation, IMACS/Elsevier Science
2
decision-makers with the help they need in creating the strategies for development.
2. Issues in the simulation of rail/road intermodal terminals
Rail/road intermodal terminals differentiate from maritime intermodal terminals since they are“inland” and they are nodes in a tightly interconnected network, composed of the rail and the roadnetworks. They are usually smaller than their maritime counterparts and the residence time of ITUsin the terminal is usually much shorter (approximately 24 hours). In such terminals, particular caremust be devoted to the model of the arrival and departure processes of trains and trucks at theterminal gate. While it is not the aim of this paper to enter into the details of what happens beyondthe terminal gates, we remind the reader that a consistent number of researchers have worked on theproblem of the simulation and the optimisation of the rail network (for a review see [2], anapplication study is presented in [3]) and a comparable, if not greater, effort has been put into theresearch on traffic simulation [4]. These studies are of great importance since their results can beused to model the “interfaces” of the terminal with the external world. The task of the modeller istherefore eased and s/he can concentrate on the modelling details of the terminal.
When integrating the rail, road and terminal components in an unique simulation framework, itis necessary to ensure the models to be congruent, that is to adopt the same “level of resolution”with respect to both time and description of ITUs. For instance, according to the required level ofdetail, the intermodal transport can be modelled either as a continuous system, describing the ITUsas a continuous flow, or as a discrete system, where each single ITUs is represented. If the ITUdescription in the road or rail networks is not congruent with the one adopted in the terminal, it isnecessary to write “ad hoc” models to convert the different types of inputs and outputs. Forinstance, data on the traffic rate at the terminal gates, which could be obtained by the simulationmodel of the road network, can be used to generate ITUs arrivals and departures in the terminal. Inthe PLATFORM simulation model we also have adopted such an approach and it is described inSection 4.2.
Despite the above mentioned differences between maritime and rail/road intermodal terminals,they display some common features that are invariant with respect to the modes of transport. Forinstance, all terminals must have a yard area where the ITUs are stored. In all terminals, cranes(gantry and front lifters) move ITUs to and from the various transport means. The ITUs enter andleave terminals through gates, where decisions are made regarding the destination of the ITUs withinthe terminal itself. Besides structural similarities, terminals share common processes such as theefficient storage of the ITUs on the yard, and the scheduling of loading and unloading operations.The benefit is that much research has been done on maritime terminals (see for instance [5], [6],[7] on terminal simulation, [7] and [8] on optimisation of container scheduling) and it can provideinspiration for application to the rail/road sector.
While the similarity of the intermodal structures facilitates the transfer of concepts developed formaritime intermodal transport to the rail sector, many processes have some distinctive features,especially regarding the handling of the ITUs. In the maritime transport ITUs are standardized ISOcontainers and they are stackable, while ITUs in the combined rail/road transport sector can becontainers, semi-trailer, swap bodies, each one with different characteristics and requiring a differentway of handling (e.g.: swap bodies and semi-trailers are not stackable). Another obstacle to thetechnology transfer is represented by the Information Technology systems currently installed inrail/road terminals: while maritime terminals have been investing in the IT sector for a long time,
To appear in: Journal of Mathematics and Computers in Simulation, IMACS/Elsevier Science
3
rail/road terminals have not done the same. The consequence is that often data, such as the physicallocation of the ITU on the yard, which are necessary to implement efficient management strategies,are not available.
There are some signals that things are changing. The pressure of freight traffic on European roadsis pushing the European Community to invest and promote intermodal transport as a viablealternative to long-haul road transport [9]. The PLATFORM project is one of the outcomes of thispolicy and we expect that this and other demonstrative projects will show the terminal operatorsways to invest to improve the efficiency of their management procedures, thus enhancing theircompetitiveness with respect to road-only freight.
3. The platform project
The Platform project was financed by the IV Framework Programme of the Directorate GeneralVII (transport) of the European Community. One of the aims of the project was the“implementation of a simulation environment for the assessment of impacts produced by theadoption of different technologies and management policies to enhance terminal performances”.To achieve this objective, the project needed to encompass all the phases of an intermodal transportof an ITU, a requirement for the comparison of the performance of intermodality against road-onlybased transport.
An intermodal transport along a rail corridor connecting two terminals T1 and T2 can be dividedinto three legs. The initial leg describes the trip from the origin of the ITU to the first terminal T1.This leg is usually managed by a forwarding company owning a truck fleet. Trucks pick up anddeliver ITUs in the company’s user catchment area. The second leg is the transport from T1 to T2by train. The railway companies owning the rail network manage this leg. Often, different railcompanies cooperate in transnational transports. The third and final leg is the transport from T2to the ITU destination is again managed by a forwarding company.
To represent the intermodal transport in all its parts the PLATFORM integrated simulationenvironment will be composed of three modules: the road network planning and simulation module,which plans the management of the forwarders’ orders and simulates the traffic of trucks on the roadnetwork; the terminal simulation module, which simulates the terminal nodes and the change oftransport mode, from truck to train and back; the corridor simulation module, which simulates therail network connecting the terminals. These three modules are designed to work in parallel in orderto produce results on the performance of the integrated rail-road network. Typically, the roadplanning and simulation module accepts intermodal transport orders for transport of an ITU fromcity to city. It then books a place for the ITU on one of the train connecting two intermodalterminals and then schedules truck delivery and pickup of the ITU. The scheduled truck delivers theITU in the terminal, that is, this information is provided as input to the terminal simulation module.This module takes care of handling the ITU where it was booked on, then sends the train to thecorresponding terminal. This action is handled by the corridor simulation module. At the receivingterminal similar actions are preformed: the ITU is unloaded from train and loaded on the pickuptruck. The truck is passed back to the road planning and simulation module, which routes it to itsfinal destination.
In this paper, we present the software component of the PLATFORM project dedicated t oterminal and corridor simulation. A thorough description of the road planning module can be found
To appear in: Journal of Mathematics and Computers in Simulation, IMACS/Elsevier Science
4
in [10] and its theoretical basis in [11].
An intermodal terminal can be regarded as a node in a network that models the connectivity ofthe origins and destinations in the supply chain. If we look at the performance of this network, weare interested in understanding if it is possible to increase the throughput of the nodes, that is, of theterminals. Since the rail network can sustain a marginal increase in traffic, an improvement in theterminal throughput might reduce the percentage of long-haul transports on the road. Because ofthis observation, we model the internal processes in the intermodal terminals in order to understandhow an increase in the intermodal traffic affects the terminal performance. In the next section, themodelling assumptions to simulate the terminal are described.
4. The platform simulation model
The analysis of the user requirements, gathered from an in-depth literature review and frominterviews to intermodal operators through Europe [12], identified the need to model three mainprocesses: the loading /unloading of ITUs onto/from the train; the storage of ITUs on the yard; thearrival and departure process of ITUs by truck.
Modelling these processes requires a resolution of the model at the level of the single ITU moveand this led to the selection of the discrete-event simulation paradigm. This approach is particularlyapt to describe the inner workings of a terminal, for instance to evaluate the train loading andunloading processes, but its computational cost can be excessive to simulate a real network ofintermodal terminals. Nevertheless, the choice of a discrete model cannot be regarded as a dead-endfor further investigations, since it can be employed to calibrate a continuous black-box model of theterminal, once the statistical distributions of its inputs and outputs are given [13].
The PLATFORM terminal simulator has been developed in MODSIM III [14], a commerciallyavailable object-oriented and process-oriented simulation language. The adoption of the object-oriented paradigm allowed software components to be defined that correspond to their real-worldcounterparts and with a similar behaviour. The terminal components modelled in the terminalsimulator are:
− the road gate, where trucks enter and leave the terminal;
− the rail gate, where trains enter and leave the terminal. The rail gate is connected to theshunting area, outside the terminal, where the rail network operator shunts trains before theyenter the terminal. The rail gate is also connected to the rail tracks inside the terminal;
− the platforms, each composed by a set of rail tracks and by a buffer area. The buffer area is atemporary storage area for ITUs that are waiting to be loaded/unloaded to and from trainsentering the platform. Each platform is served by a set of gantry cranes, spanning the platformlength and serving the set of rail tracks and the buffer area;
− the storage area, a longer term (usually 24 hours) area to park ITUs. The front lifters, serve thestorage area, they serve trucks directed to the storage area picking up the ITUs and storing themin the storage area.
These components are implemented in the simulation code as classes, using the object-orientedprogramming language provided by MODSIM III. The modeller can easily assemble a rail/roadterminal model creating instances of these classes. Moreover, since the Platform simulation model
To appear in: Journal of Mathematics and Computers in Simulation, IMACS/Elsevier Science
5
reads from a database the structure of the terminal model and creates the instances of the modelcomponents, the modeller does not need to write code to create different terminal instances. Thisallows the Platform simulation module to be quite generic and to be able to model a variety ofdifferent terminal layouts and equipment.
The modeller creates model instances either specifying some characteristic parameters (e.g. theservice time of a crane) or the subparts of a component (e.g. the number of rail tracks in aplatform). In particular, s/he can define the yard layout: how many platforms are present in themodel, the capacity of the associated buffer areas, the number of gantry cranes working on theplatform, and the number of rail tracks in the platform. Only one storage area can be defined andits capacity must be entered too. For each gantry crane, the modeller must specify the averagenumber of moves per hour and the crane operating cost per hour. Then, the terminal storage mustbe defined: the size of the storage area and the number of front lifters serving it, with theirperformances (number of moves per hour and cost per hour). Finally, the modeller defines theterminal interface to the external world. The road gate is identified by the number of lanes and theaverage time needed to service a truck. This service time is an aggregate representation of the timerequired processing the papers when a truck shows up at the road gate. The rail gate is representedby the number of shunting tracks, the number of link tracks between the shunting area and theterminal. The user must also specify the average time required to move a train from the shuntingarea into the terminal. This average value is easy to compute since it mainly depends on the distancefrom the shunting area to the destination rail track.
In the next sections we describe how the terminal model can be embedded in the simulation of anintermodal transport by rail corridor simulation (Section 4.1), how truck arrivals and departures atthe terminal gate can be modelled (Section 4.2), and how the terminal components work together(Section 4.3).
4.1. Rail corridor and rail network simulation
Intermodal transport involves transporting ITUs on a fully interconnected network, butintermodal corridors are commonplace. A corridor is a privileged point-to-point railway connectionbetween two terminals. The creation of rail corridors made possible for intermodal transport t ocompete with road-only transport not only in terms of cost, but also in terms of time. Exploringthe performance of intermodal transport over rail corridors was one of the objectives of Platformproject and the characteristics of the corridors made its simulation a simple problem to be solved.The underlying hypothesis is that a corridor is an abstract representation of a path in a complex railnetwork. The simulation of a corridor link is driven by a timetable, which contains the departure andarrival times of trains. When a train travels from an origin terminal to a destination along acorridor, the simulator makes the train arrive in the destination terminal after a set time, given bythe arrival time minus the departure time, plus a stochastically generated delay, to account forunexpected events.
The two nodes of the corridors are terminal models that are running in the same simulation. Atrain travelling in a corridor must be loaded in the source terminal and unloaded in the destinationterminal. In the source terminal, it is represented as a list of ITU bookings. Booking are placed byforwarding companies, which will send trucks to deliver ITUs according to the booking details (hourof train departure, type of ITU, weight allowance, etc.). When the train is loaded and its departuretime has arrived, it leaves the source terminal for its destination on the corridor. At the destination,
To appear in: Journal of Mathematics and Computers in Simulation, IMACS/Elsevier Science
6
the train is unloaded and trucks arrive to pick up the transported ITUs. The generation of truckarrivals and departures is described in Section 4.2.
However, a terminal does not exchange ITUs only along a corridor, it is also linked to many otherterminals, which often generate the major share of the rail traffic (we examined the Verona terminalin Northern Italy where traffic on the Verona-Munich (Southern Germany) corridor accounted onlyfor 15% of the total rail traffic in one week). For this reason, the Platform simulator takes intoaccount these external contributions by means of the rail network simulation. Again, a very simplesimulation module generates train arrivals and departures according to a timetable. The differencewith the previous corridor simulation is that departing trains must not be transferred to anotherterminal model, but they are simply discarded to represent the traffic of ITUs brought in by trucksand then leaving for other terminals, external to the corridor. On the other hand, incoming trainsbring in new ITUs, which are later picked up by trucks, again contributing to the global traffic in theterminal.
The software structure used to model train arrivals and departures is a priority ranked queue, wherethe order is given by the time stamps associated with the departure and arrival events. Duringsimulation, the train generation module inserts arrival and departure events in the Future Events List[14] of the terminal simulators. When the event time is reached, the train is then handled by theterminal rail gate and finally handed over to the terminal internal processes for loading andunloading.
4.2. Simulating truck arrivals at the road gate
The simulation of the truck arrival process is needed to complete the description of the terminalinput and output flows, besides the ITU traffic generated by the rail corridor and the rail network.
Trucks arrive at the terminal to deliver ITUs, which are then loaded on departing trains, and topick up ITUs, which have arrived by train. In the first case, trucks usually arrive before the trainleaves, while in the second case trucks usually arrive after the train arrival, so that they canminimise the length of stay in the terminal. These remarks are confirmed by the observed data.
The Platform simulation module allows for two modes of truck arrival generation: manual andautomatic. The manual generation of truck arrivals is particularly useful to perform trace-drivensimulation, where recordings of truck arrival events are stored in time series, later fed into thesimulator. This approach is extremely useful to validate the model [15].
When trace-drive data are not available, or when the simulation user wants to test alternativearrival patterns, an algorithm is used to automatically generate stochastic arrivals, according to astatistical distribution. To implement the automatic arrival module, we first calibrated and thenvalidated a model on the observed data. The ability of the model in reproducing the observed dataturns out to be useful when the modeller wants to add new trains in the terminal simulation, whilemaintaining the same truck arrival pattern. On the other hand, its simple parameterization (onlyone parameter) allows the modeller to generate different arrival patterns, modifying the parametervalue. The model calibration and validation is reported in the next paragraphs.
To appear in: Journal of Mathematics and Computers in Simulation, IMACS/Elsevier Science
7
0
0.2
0.4
0.6
0.8
1
1.2
0 4 8 12 16 20 24 28 32 36 40 44 48 52 56
hours
% o
f ar
riva
ls
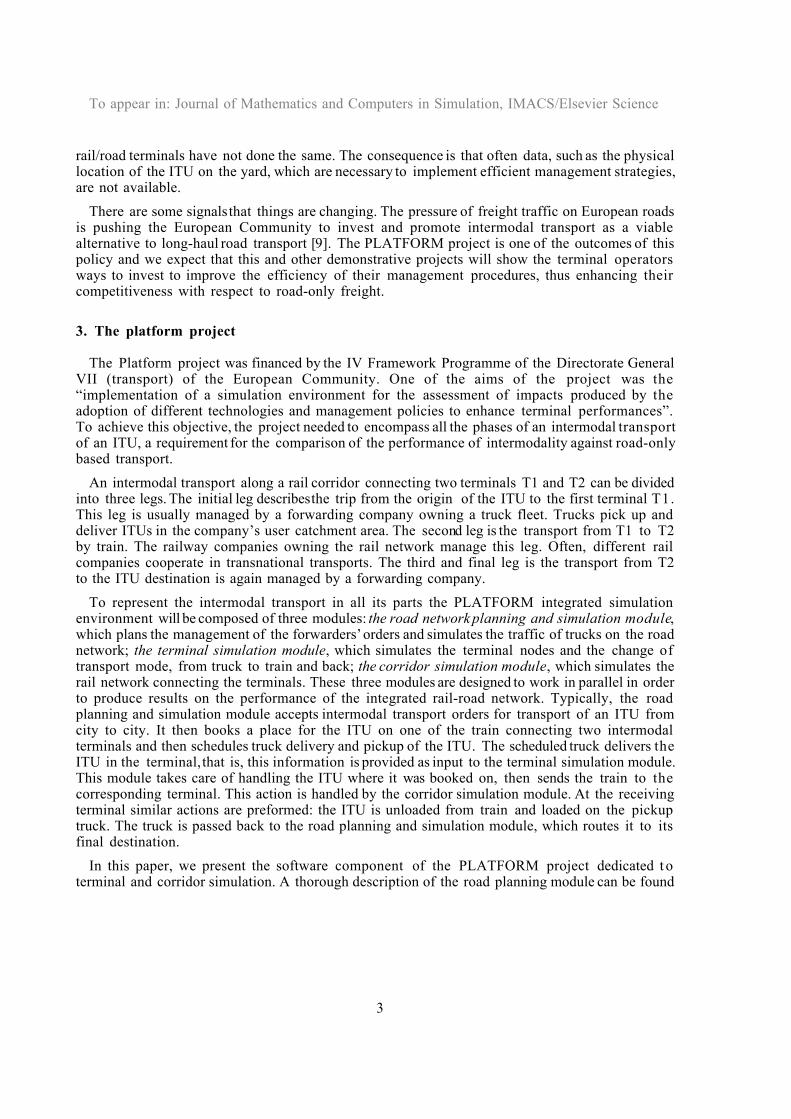
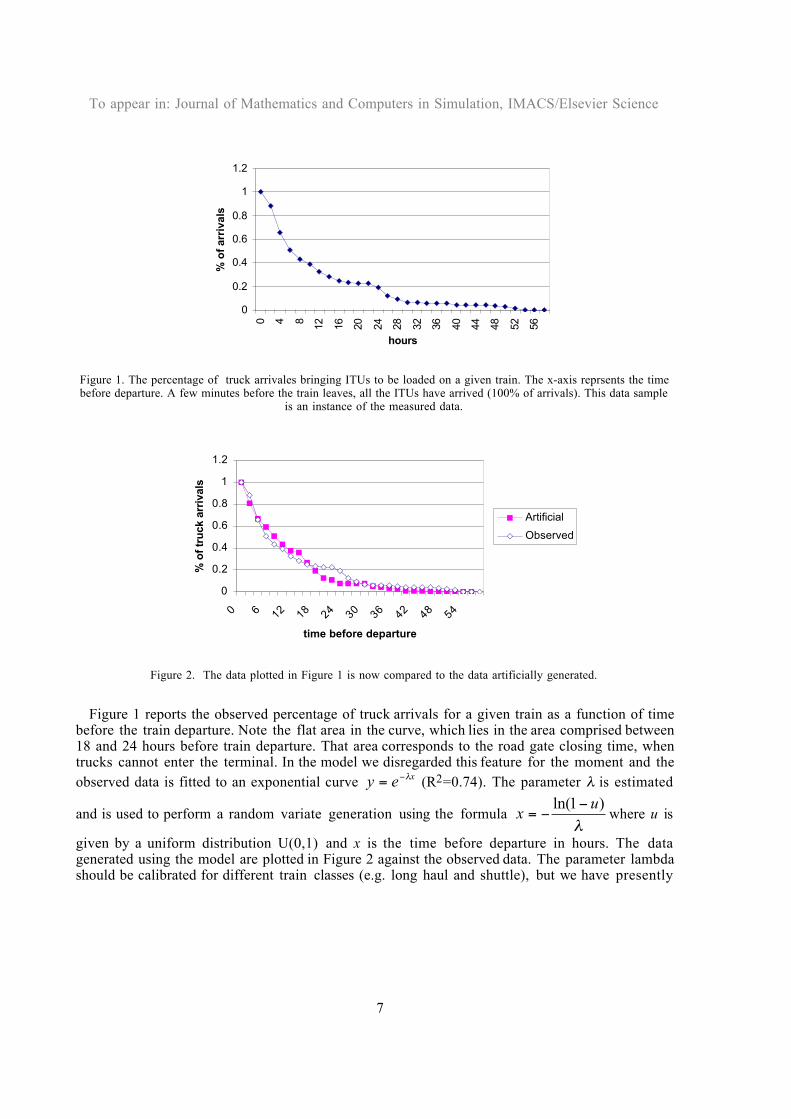
Figure 1. The percentage of truck arrivales bringing ITUs to be loaded on a given train. The x-axis reprsents the timebefore departure. A few minutes before the train leaves, all the ITUs have arrived (100% of arrivals). This data sample
is an instance of the measured data.
0
0.2
0.4
0.6
0.8
1
1.2
0 6 12 18 24 30 36 42 48 54
time before departure
% o
f tr
uck
arr
ival
s
Artificial
Observed
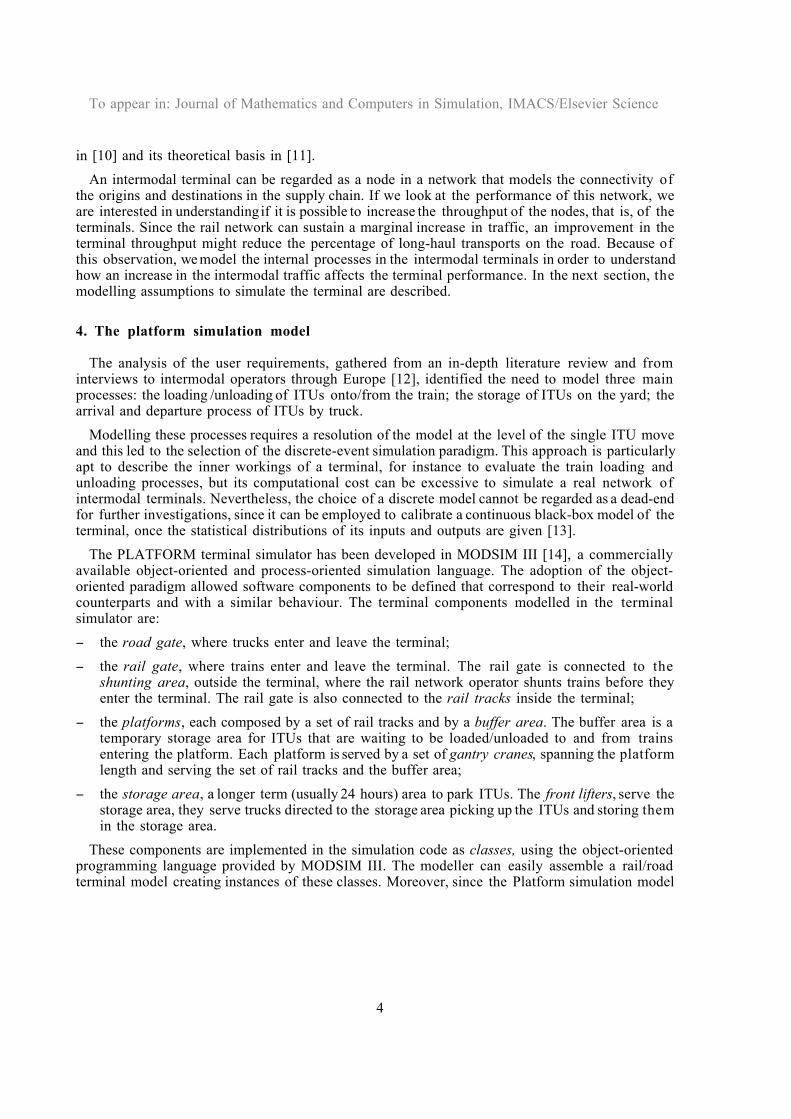
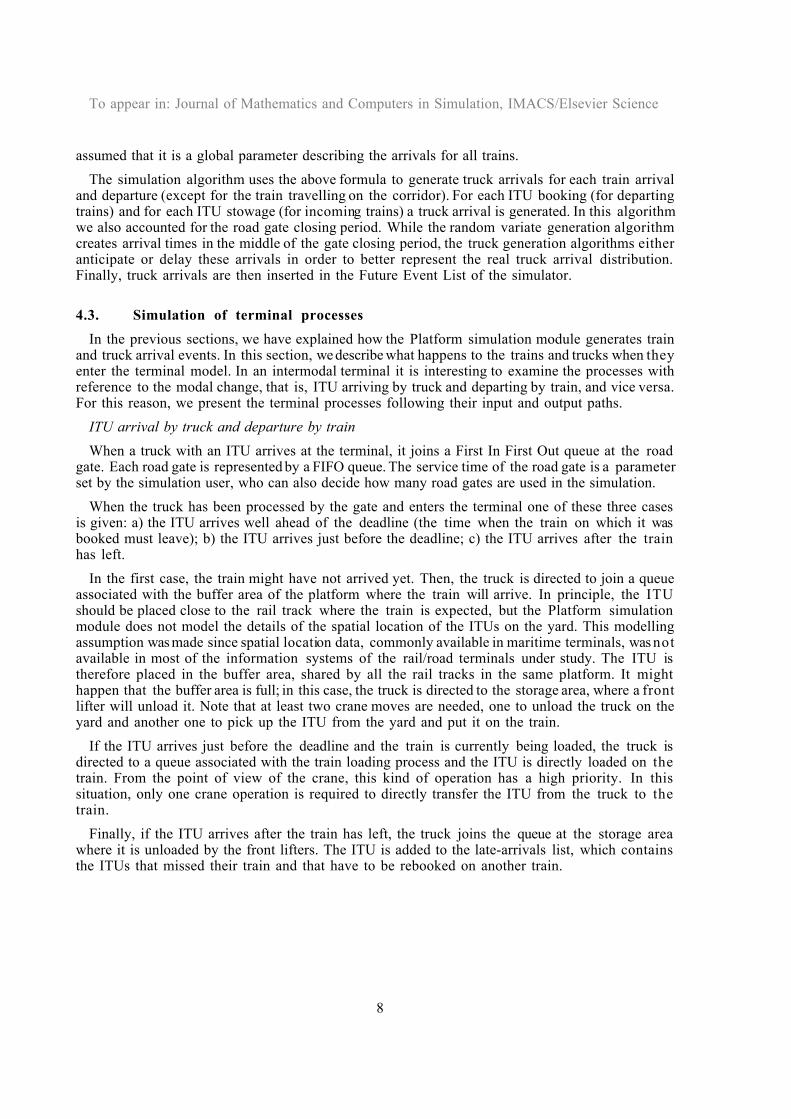
Figure 2. The data plotted in Figure 1 is now compared to the data artificially generated.
Figure 1 reports the observed percentage of truck arrivals for a given train as a function of timebefore the train departure. Note the flat area in the curve, which lies in the area comprised between18 and 24 hours before train departure. That area corresponds to the road gate closing time, whentrucks cannot enter the terminal. In the model we disregarded this feature for the moment and theobserved data is fitted to an exponential curve xey λ−= (R2=0.74). The parameter λ is estimated
and is used to perform a random variate generation using the formula λ
)1ln( ux
−−= where u is
given by a uniform distribution U(0,1) and x is the time before departure in hours. The datagenerated using the model are plotted in Figure 2 against the observed data. The parameter lambdashould be calibrated for different train classes (e.g. long haul and shuttle), but we have presently
To appear in: Journal of Mathematics and Computers in Simulation, IMACS/Elsevier Science
8
assumed that it is a global parameter describing the arrivals for all trains.
The simulation algorithm uses the above formula to generate truck arrivals for each train arrivaland departure (except for the train travelling on the corridor). For each ITU booking (for departingtrains) and for each ITU stowage (for incoming trains) a truck arrival is generated. In this algorithmwe also accounted for the road gate closing period. While the random variate generation algorithmcreates arrival times in the middle of the gate closing period, the truck generation algorithms eitheranticipate or delay these arrivals in order to better represent the real truck arrival distribution.Finally, truck arrivals are then inserted in the Future Event List of the simulator.
4.3. Simulation of terminal processes
In the previous sections, we have explained how the Platform simulation module generates trainand truck arrival events. In this section, we describe what happens to the trains and trucks when theyenter the terminal model. In an intermodal terminal it is interesting to examine the processes withreference to the modal change, that is, ITU arriving by truck and departing by train, and vice versa.For this reason, we present the terminal processes following their input and output paths.
ITU arrival by truck and departure by train
When a truck with an ITU arrives at the terminal, it joins a First In First Out queue at the roadgate. Each road gate is represented by a FIFO queue. The service time of the road gate is a parameterset by the simulation user, who can also decide how many road gates are used in the simulation.
When the truck has been processed by the gate and enters the terminal one of these three casesis given: a) the ITU arrives well ahead of the deadline (the time when the train on which it wasbooked must leave); b) the ITU arrives just before the deadline; c) the ITU arrives after the trainhas left.
In the first case, the train might have not arrived yet. Then, the truck is directed to join a queueassociated with the buffer area of the platform where the train will arrive. In principle, the ITUshould be placed close to the rail track where the train is expected, but the Platform simulationmodule does not model the details of the spatial location of the ITUs on the yard. This modellingassumption was made since spatial location data, commonly available in maritime terminals, was notavailable in most of the information systems of the rail/road terminals under study. The ITU istherefore placed in the buffer area, shared by all the rail tracks in the same platform. It mighthappen that the buffer area is full; in this case, the truck is directed to the storage area, where a frontlifter will unload it. Note that at least two crane moves are needed, one to unload the truck on theyard and another one to pick up the ITU from the yard and put it on the train.
If the ITU arrives just before the deadline and the train is currently being loaded, the truck isdirected to a queue associated with the train loading process and the ITU is directly loaded on thetrain. From the point of view of the crane, this kind of operation has a high priority. In thissituation, only one crane operation is required to directly transfer the ITU from the truck to thetrain.
Finally, if the ITU arrives after the train has left, the truck joins the queue at the storage areawhere it is unloaded by the front lifters. The ITU is added to the late-arrivals list, which containsthe ITUs that missed their train and that have to be rebooked on another train.
To appear in: Journal of Mathematics and Computers in Simulation, IMACS/Elsevier Science
9
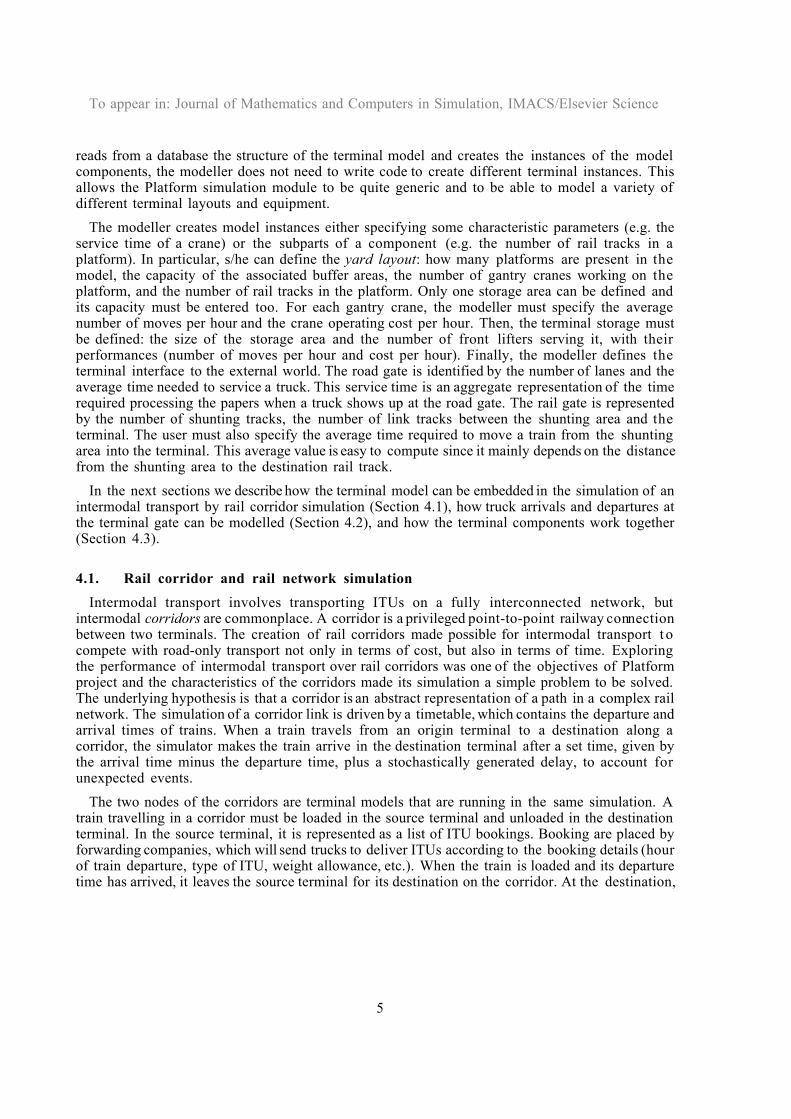
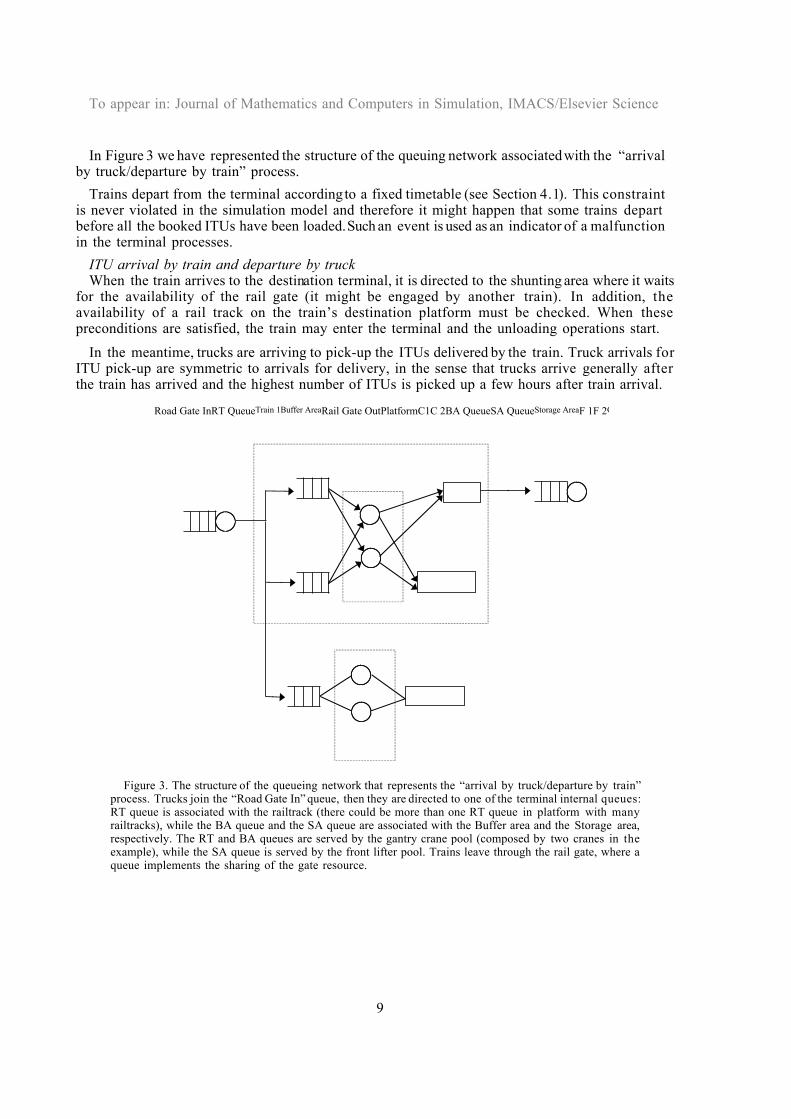
In Figure 3 we have represented the structure of the queuing network associated with the “arrivalby truck/departure by train” process.
Trains depart from the terminal according to a fixed timetable (see Section 4.1). This constraintis never violated in the simulation model and therefore it might happen that some trains departbefore all the booked ITUs have been loaded. Such an event is used as an indicator of a malfunctionin the terminal processes.
ITU arrival by train and departure by truckWhen the train arrives to the destination terminal, it is directed to the shunting area where it waits
for the availability of the rail gate (it might be engaged by another train). In addition, theavailability of a rail track on the train’s destination platform must be checked. When thesepreconditions are satisfied, the train may enter the terminal and the unloading operations start.
In the meantime, trucks are arriving to pick-up the ITUs delivered by the train. Truck arrivals forITU pick-up are symmetric to arrivals for delivery, in the sense that trucks arrive generally afterthe train has arrived and the highest number of ITUs is picked up a few hours after train arrival.
Road Gate InRT QueueTrain 1Buffer AreaRail Gate OutPlatformC1C 2BA QueueSA QueueStorage AreaF 1F 2Gantry CranePoolFront LifterPool
Figure 3. The structure of the queueing network that represents the “arrival by truck/departure by train”process. Trucks join the “Road Gate In” queue, then they are directed to one of the terminal internal queues:RT queue is associated with the railtrack (there could be more than one RT queue in platform with manyrailtracks), while the BA queue and the SA queue are associated with the Buffer area and the Storage area,respectively. The RT and BA queues are served by the gantry crane pool (composed by two cranes in theexample), while the SA queue is served by the front lifter pool. Trains leave through the rail gate, where aqueue implements the sharing of the gate resource.
To appear in: Journal of Mathematics and Computers in Simulation, IMACS/Elsevier Science
10
When an empty truck arrives at the terminal, it waits in a queue at the gate and then enters theterminal. Four alternatives are given: 1) the requested ITU is stored in the storage area; 2) the ITUhas already been unloaded from the train and it is stored in the buffer area; 3) the ITU is still on thetrain, waiting to be unloaded; 4) the truck has arrived before the train. In the first case, the truck isdirected to the storage area, where it joins the job queue at the front lifters. In the second case, thetruck is directed to the platform, where it joins the job queue at the platform. In the third case, thetruck also joins the queue at the platform, but its priority is higher, since the objective of theterminal is to maximise the number of direct transfers between the train and the truck. Finally, ifthe requested ITU is not in the terminal, the truck waits for its arrival in a dedicated queue.
Train loading/unloadingIn this section, we detail how we modelled the train loading/unloading operations to give a
complete picture of the Platform terminal simulator.
The proposed modelling approach for train loading/unloading operations is platform-centred. Aplatform scheduler is associated with each platform, which assigns operations to the available cranes.The storage area is managed via a FIFO queue which accesses the pool of front lifters.
Trains are modelled as sets of ITUs to be moved. Each move is an operation and a sequence ofoperations is a job. Thus, a sequence of loading/unloading operations for a train corresponds to a job.Each operation has a priority (for instance, if the ITU is to be picked-up by a truck). The platformscheduler assigns each operation to the available cranes, ordering by priority. Operations with thesame priority are scheduled with a round-robin policy (one ITU for each job).
The possible operations performed by a gantry crane are: (1) loading an ITU on a wagon of adeparting train from a truck or from the buffer area; (2) unloading an ITU from a wagon of anincoming train either to a truck or to the buffer area; (3) loading an ITU to a truck from the bufferarea; (4) unloading an ITU from a truck to the buffer area.
The order of the operations when loading a train is the following: first the ITUs on waiting trucks(direct transshipment) are loaded, second the ITUs on the yard. The trucks arriving when thecorresponding train is being loaded join the queue of waiting trucks and are given the highestpriority. This allows the loading process to be quicker and to minimise the time spent by the truckswaiting for service.
When unloading a train the order is: first move the ITUs on the waiting trucks, then theremaining ITUs. Thus, a truck arriving for pick-up is served with the highest priority.
The cranes available for the loading/unloading operation must be allocated in the current workshift and suitable for the operation. The list of the cranes that will be active during a given workshift are set by the simulation user in the resource allocation table.
At least one gantry crane must be allocated at all times to perform both direct truck/traintransshipment and storage in buffer areas. At least one front lifter is needed if the storage area mustbe accessed. When deciding which resource should be used to carry out an operation, it may happenthat different operations compete for resources. A round-robin resource allocation policy wasadopted to avoid starving and deadlocks.
Crane service time was modelled by a Gaussian distribution. In reality, each ITU is served in a timet, which is the average value of the time taken to travel along the rail track to pick-up/unload theITU.
To appear in: Journal of Mathematics and Computers in Simulation, IMACS/Elsevier Science
11
The Platform simulation module has been designed in order to work in cooperation with anintermodal transport planner (ITP) module. The aim of the ITP module is to synchronize the truckarrivals in the terminal in order to minimise waiting times and reduce the queue length at the gates.If the planning of transport on the road network is perfect, all the trucks would arrive in the optimalorder, so the crane is making incremental moves, which are time efficient, and t decreases. If theplanning is poor, the crane will probably travel back and forth to serve unexpected trucks, thusincreasing the average service time. If the crane has to serve more than one train and has to switchamong tracks, it is assumed that t is incremented by a fixed quantity to represent the time taken tochange track. The information regarding the time of delivery for an ITU is known in advance onlyif a road-dispatching module is present. Thus, the advantage of planning the road network is thatit is possible to improve the crane performance, since a better synchronization of the truck arrivalswould transform most operations in direct train/truck transshipments.
5. Simulation experiments
Many important European terminal operators were involved in the Platform Consortium and theyprovided both data series, used to generate input scenarios for the simulated terminal, and terminalstructures, reproduced in the modelling environment. In particular, the terminal structuralparameters are described in a project’s deliverable [12].
As stated in Section 3, the Platform project has a broader scope than the simulation of a singleterminal, the Platform integrated simulation environment includes an Intermodal Transport Planner[11] to schedule the transport of the ITUs in the road network. When two or more terminals areinterconnected, rail corridors are also simulated and ITUs can be exchanged among the terminals.The Platform integrated simulation environment will thus allow simulating all the three legs of theITU trip: from origin to the terminal on the road network, from terminal to terminal on the railcorridor, from terminal to destination on the road network. The Platform integrated simulationenvironment is managed via a user friendly Graphical User Interface [10]. The GUI was developed by ETRA (Valencia, Spain), one of the partners in the project. The GUI can be also used to drivethe stand-alone terminal simulator and it provides an interface to access the scenario data and thesimulation parameters that are stored in a set of database tables.
The simulation user can modify structural parameters, simulation parameters and input scenarios.All of this can be easily done using the GUI which accesses a database where all the parameters arestored.
In the following sections, we detail how we set up simulation experiments in order to evaluateterminal management alternatives and we examine the results.
To appear in: Journal of Mathematics and Computers in Simulation, IMACS/Elsevier Science
12
The experimental set-upThe experiments were performed on the model of the Quadrante Europa intermodal terminal,
locaed in Verona, Italy, and operated by Cemat SpA.
Two road gates (with a singe queue), four platforms (named A, B, C, and D), two yard cranes perplatform and three front lifters are present in the current configuration of the terminal. After
having defined the structure of the terminal (the number of platforms and their capacity, the numberof rail tracks, the capacity of the storage area), the simulation user must define the pieces ofequipment and their performances, expressed as the average number of moves per hour. The usercan specify the resource allocation in detail: for each piece of equipment it is possible to specify inwhich work shifts it is active. The work shift pattern is also user-customizable.
Before launching a simulation, the input scenarios must be defined. They are composed by a traintimetable which records train arrival and departures. The TrainGenerator simulation module(described in Section 4.1) takes care of generating the corresponding arrival and departure eventsduring the simulation. Truck arrivals for ITU pick-up and delivery can both be specified as inputscenarios read from historical databases to perform trace-driven simulations, as shown in Section4.2.
Finally, the user enters the simulation horizon and the simulation can start. The state of thesimulation model must be initialised. For this purpose, the actual simulation starts one day beforethe start time as specified by the user. This allows the simulation program to set-up the initial queuesat the road and rail gates and to initialise the yard areas, thus avoiding the problems due to startingthe model from an empty state.
The alternative comparisonThree management alternatives were explored: alternative 0 consists in replicating the current
management practices, in order to calibrate the model; alternative 1 is based on the hypothesis thatthe adoption of computer aided management tools increases the performance of the rail gateprocedures; alternative 2 sees the enhancement of the crane equipment, to speed-up transshipment
0
10
20
30
40
50
60
19288.5558827.51097
1366.51636
1905.5More
ITU residence time
# o
ccu
rren
cies
Frequency
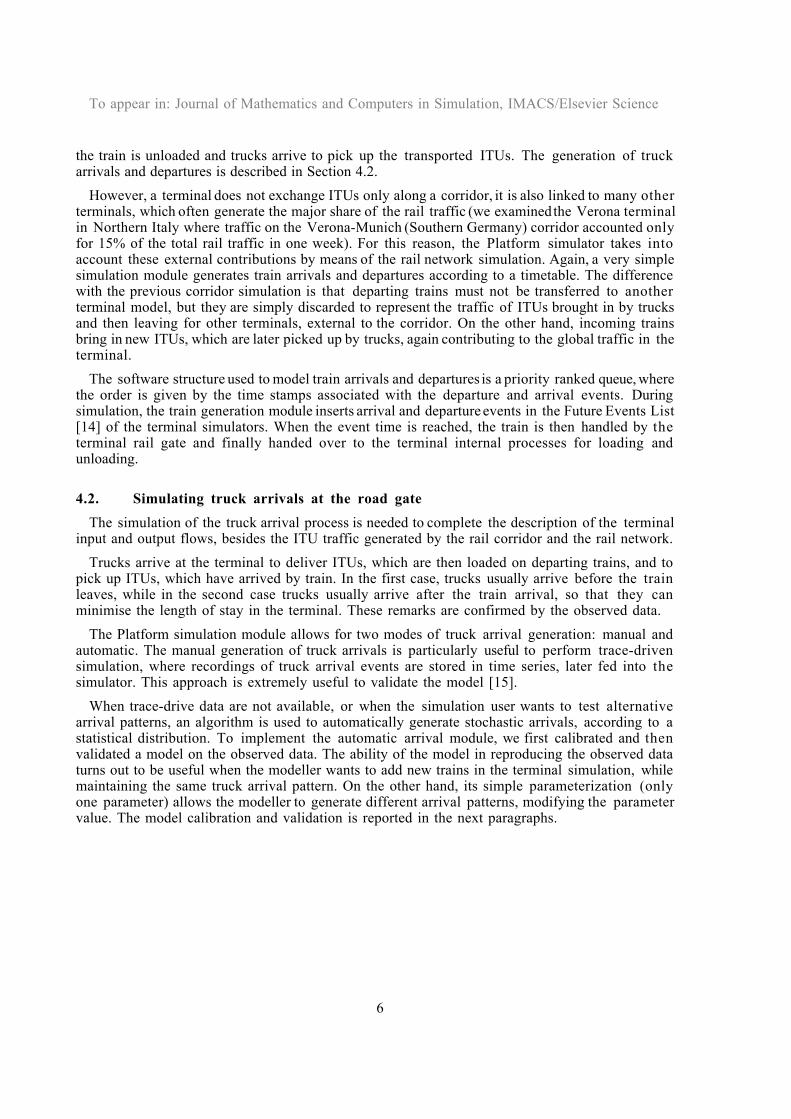
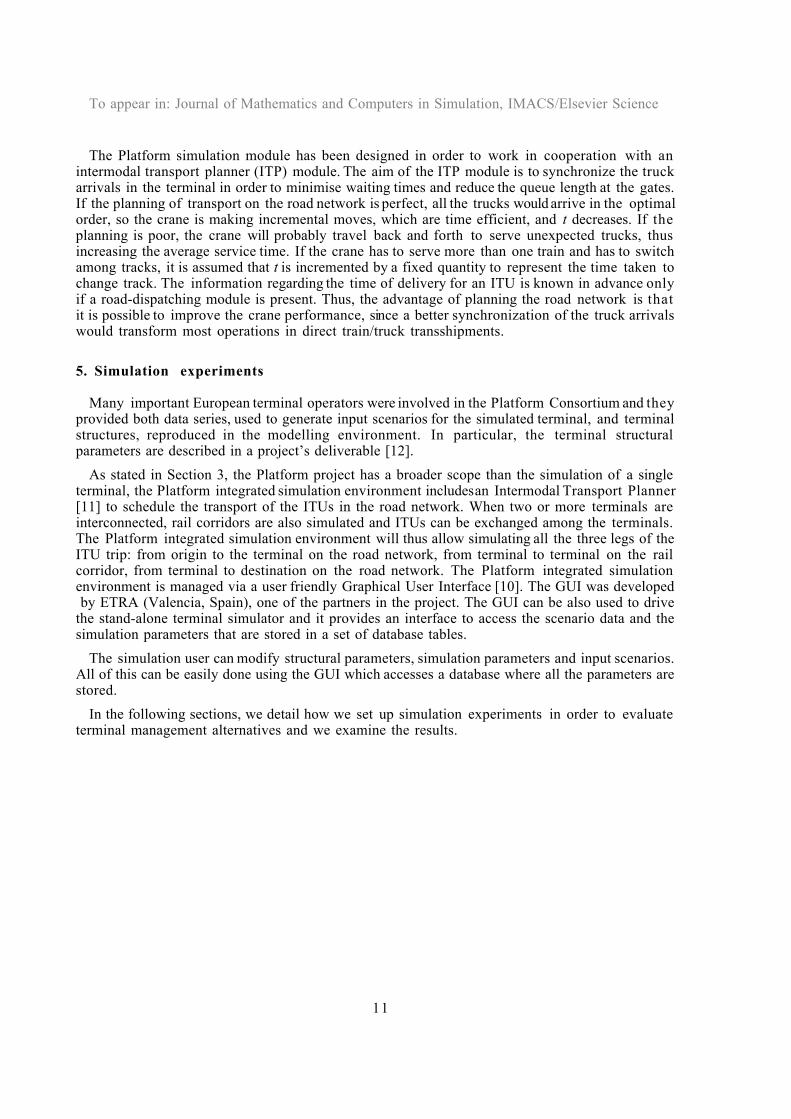
Figure 4. Histogram representing the frequency distribution of the ITUresidence time. The average value is 489 minutes.
To appear in: Journal of Mathematics and Computers in Simulation, IMACS/Elsevier Science
13
operations.
In alternative 0 the average road gate processing time was set to 6.5 minutes. It was observed anaverage waiting time of trucks at the road gate of 18.06 minutes and a mean residence time of ITUsin the terminal of 489 minutes. Figure 4 shows the frequency distribution of the residence times.Despite the average value being quite low, there are some instances when ITUs spend much more
time on the terminal yard.
These simulation outputs reasonably matched the observed values of 18 minutes for the road gatewaiting time and of twelve hours for the mean residence time. Unfortunately, not much morequantitative data was available for model validation.
0
2
4
6
8
10
12
14
1
51
101
151
201
251
301
351
401
451
501
551
601
651
701
751
801
851
901
951
1001
1051
1101
minutes
tru
cks
in q
ueu
e
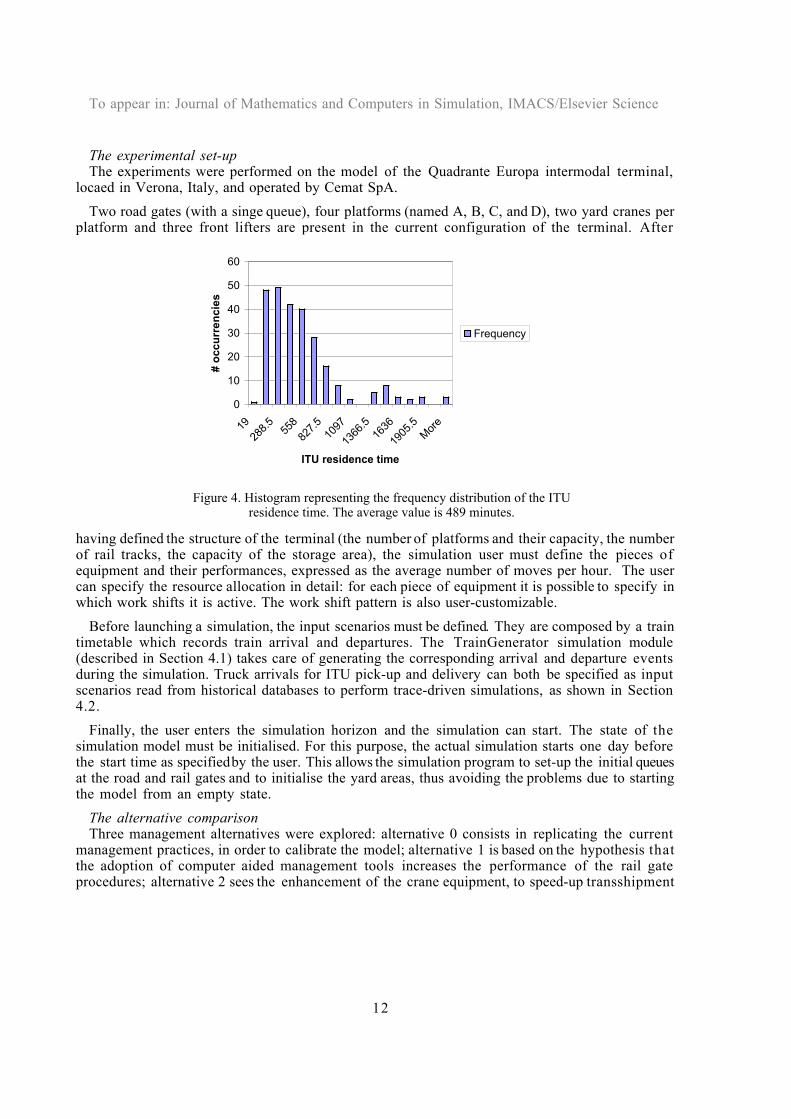
Figure 5: the number of trucks in the queue waiting to enter at the road gate plotted against simulation time for λ = 7min. The simulation starts with 10 trucks already waiting at the road gate.
0
2
4
6
8
10
12
14
1
56
111
166
221
276
331
386
441
496
551
606
661
716
771
826
881
936
991
1046
1101
minutes
tru
cks
in q
ueu
e
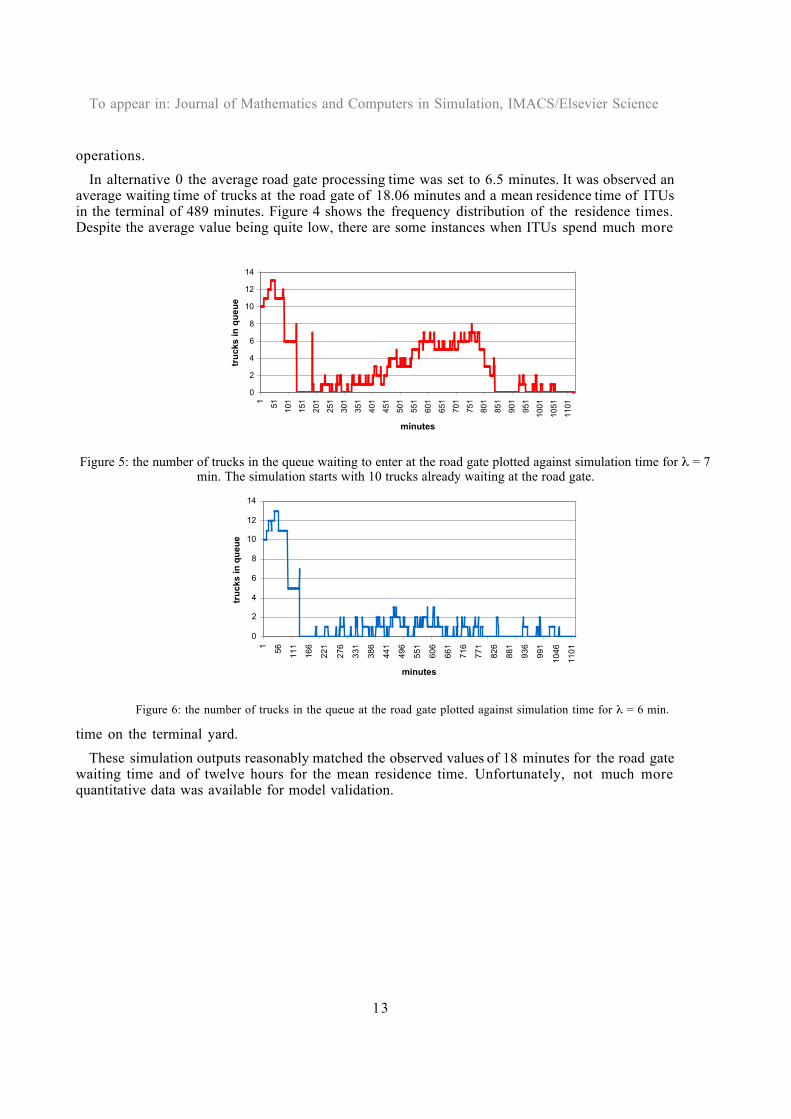
Figure 6: the number of trucks in the queue at the road gate plotted against simulation time for λ = 6 min.
To appear in: Journal of Mathematics and Computers in Simulation, IMACS/Elsevier Science
14
Table 1. The relation between the processing time at the road gate and the average waiting time for trucks queuingat the gate.
processing time (min) waiting time (min)5.0 9.966 13.42
6.5 (alt 0) 18.067 29.148 62.42
In alternative 1 we observe that the adoption of CAM (computer aided management) tools hasan impact on the processing time at the road gate. Different values of the gate processing time resultin different average waiting times for trucks queuing at the gate, as reported in Table 1. Thesituation at the road gate is also represented by the graphs reported in Figures 5 and 6, where thenumber of queued trucks is plotted against simulation time. It is evident and expected that a lowerprocessing time reduces the average number of trucks in the queue, but from Table 1 we can alsoobserve that a small increment in the gate processing time can have a serious impact on the gatequeues. This situation can be explained thinking of the road gate as an M/M/1 queue [16]. In thisqueue model, the waiting time is known to tend to infinity when the ratio of inter-arrival rate overthe service rate tends to 1. This is an indicator that the terminal management must be very carefulin the operation of the road gate and that even the current situation (alternative 0) could decay,given that the processing time is an average value which depends on many factors, some of themunforeseeable.
In alternative 2 we examined the impact on the terminal performance of the use of improvedtransshipment equipment, thus we increased the performances of the yard cranes by 30%, lettingthe road gate processing time at the value of alternative 0 (6.5 minutes). We observed a decreaseof the mean ITU residence time down to 481 minutes, which was not an indicative change. It canbe inferred that a better synchronization between the road network and the terminal should improvethe overall performance. Planned truck arrivals can be used as a mean to decrease the total transporttime in an intermodal transport, thus making it more attractive than road only transport.Forthcoming studies based on the use of the PLATFORM integrated simulation environment willdeal with this hypothesis.
6. Conclusions
We have presented the terminal simulator component of the PLATFORM project. This moduledescribes the processes taking place in an intermodal rail/road terminal and is based on the discrete-event simulation paradigm. The basic processes of the flow of the ITUs in the terminal have beenconsidered in the model. The simulation user can define the terminal structure and test alternativeinput scenarios to evaluate the impact of new technologies and infrastructures on existing terminals.An equally relevant part of the PLATFORM project is dedicated to the study of the impact of roadnetwork scheduling on intermodal transport. In this study, the presented terminal simulator playsthe important role of the bimodal node in the transport network.
7. Acknowledgments
To appear in: Journal of Mathematics and Computers in Simulation, IMACS/Elsevier Science
15
This paper is based on work carried out under the European Commission’s PLATFORM project(http://www.idsia.ch/platform) within the transport RTD programme (Task 3.2/7). The project hasbeen coordinated by Ingegneria dei Trasporti, Rome, Italy and the Consortium brings together manyof the leading experts in Europe in the fields of telematics and transport project evaluation. Theauthors wish to thank Cosimo Epifani and Adriano Alessandrini for their contributions in theexperimentation with the Platform simulation module.
8. References
[1] S. Taggart, The 20-ton packet. Wired, 7 (10) (1999).[2] J.-F. Cordeau, P. Toth, D. Vigo, A survey of optimisation models for train routing and scheduling.
Transportation Science, 32 (4) (1998) 380-404.[3] M. Lewellen, K. Tumay, Network simulation of a major railroad. In WSC '98, Proceedings of 1998 Winter
Simulation Conference (Edited by D. J. Medeiros et al.), pp. 1135-1138, SCS. Washington DC, (1998).[4] M. Pursula, Simulation of traffic systems - an overview. Journal of Geographic Information and Decision
Analysis, 3 (1) 1-8, (1999).[5] Y. Hayuth, M.A. Pollatschek, Y. Roll, Building a port simulator. Simulation, 63 (3) (1994) 179-189.[6] L.M. Gambardella, G. Bontempi, E. Taillard, D. Romanengo, G. Raso, P. Piermari, Simulation and
forecasting in an intermodal container terminal. In Proceedings of the 8th European Simulation Symposium(Edited by A.G. Bruzzone and E.J.H. Kerckhoffs), pp. 626-630, SCS, Genoa, Italy (1996).
[7] L.M. Gambardella, A. Rizzoli, M. Zaffalon, Simulation and planning for intermodal container terminal.Simulation, 71 (2) (1998) 107-116.
[8] E. Kozan, P. Preston, Genetic algorithms to schedule container transfers at multimodal terminals.International Transactions in Operational Research, 6 (3) (1999) 311-329.
[9] Directorate General VII of the European Commission, Combined goods transport: intermodality of goodstransport, SCADPlus Union Policy (http://europa.eu.int/scadplus/leg/en/lvb/l24179.htm).
[10] Platform Consortium, Implementation of an integrated computer simulation environment for thePLATFORM scenarios. Platform Deliverable D4. (1998).
[11] H.-J. Bürckert, K. Fischer, G. Vierke, Transportation scheduling with holonic MAS — the TeleTruckapproach. In Proceedings of the 14th European Meeting on Cybernetics and Systems Research, (Edited byR. Trappl), Vol. 2, (1998) 695-700.
[12] Platform Consortium, Guidelines for a computer-controlled freight platform for a time-tabled railway freightnetwork, user requirements and functions. Platform Deliverable D1. (1998).
[13] J.P.C. Kleijnen, Experimental design for sensitivity analysis, optimization, and validation of simulationmodels. In Handbook of Simulation (Edited by J. Banks), pp.173-223. John Wiley & Sons. New York,(1998).
[14] CACI Products Company, MODSIM III User’s Manual, La Jolla (1997).[15] J.P.C. Kleijnen, B. Bettonvil and W. van Groenendaal, Validation of trace-driven simulation models: a
novel regression test. Management Science, 44 (6) (1998) 812-819.[16] J. Walrand. An Introduction to Queueing Networks, Prentice-Hall, Englewood Cliffs (1988).