A review of new approaches to groundwater resource and...
23
DEPARTMENT OF PRIMARY INDUSTRIES A review of new approaches to groundwater resource and salinity assessment using mining and oil industry 3D visualisation and quantification tools. January 2006
Transcript of A review of new approaches to groundwater resource and...
DEPARTMENT OF
PRIMARY INDUSTRIES
A review of new approaches to groundwater resource and salinity assessment using mining and oil industry 3D visualisation and quantification tools.
January 2006
Published by: Department of Primary Industries
Primary Industries Research Victoria Bendigo 3550 April 2006
Also published on http://www.dpi.vic.gov.au
© The State of Victoria, 2006
This publication is copyright. No part may be reproduced by any process except in accordance with the provisions of the Copyright Act 1968.
Authorised by the Victorian Government, Midland Highway, Epsom. 3551.
The National Library of Australia Cataloguing-in-Publication entry: Don Cherry. A review of new approaches to Groundwater Resource And Salinity Assessment using mining and oil industry 3D visualisation and quantification tools. Bibliography. ISBN 978-1-74264-781-4 (online) ISSN
This publication may be of assistance to you but the State of Victoria and its employees do not guarantee that the publication is without flaw of any kind or is wholly appropriate for your particular purposes and therefore disclaims all liability for any error, loss or other consequence which may arise from you relying on any information in this publication.
Deleted: 
Cherry (2005) 3D visualisation tools
i
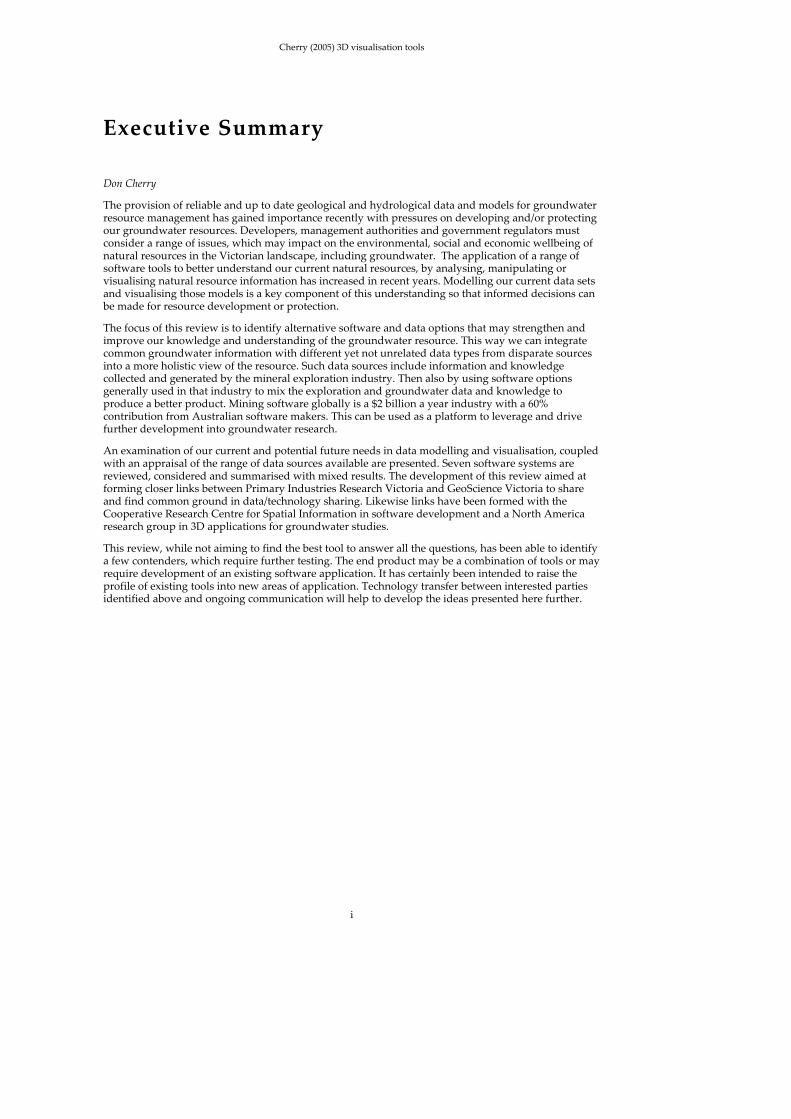
Executive Summary
Don Cherry
The provision of reliable and up to date geological and hydrological data and models for groundwater resource management has gained importance recently with pressures on developing and/or protecting our groundwater resources. Developers, management authorities and government regulators must consider a range of issues, which may impact on the environmental, social and economic wellbeing of natural resources in the Victorian landscape, including groundwater. The application of a range of software tools to better understand our current natural resources, by analysing, manipulating or visualising natural resource information has increased in recent years. Modelling our current data sets and visualising those models is a key component of this understanding so that informed decisions can be made for resource development or protection.
The focus of this review is to identify alternative software and data options that may strengthen and improve our knowledge and understanding of the groundwater resource. This way we can integrate common groundwater information with different yet not unrelated data types from disparate sources into a more holistic view of the resource. Such data sources include information and knowledge collected and generated by the mineral exploration industry. Then also by using software options generally used in that industry to mix the exploration and groundwater data and knowledge to produce a better product. Mining software globally is a $2 billion a year industry with a 60% contribution from Australian software makers. This can be used as a platform to leverage and drive further development into groundwater research.
An examination of our current and potential future needs in data modelling and visualisation, coupled with an appraisal of the range of data sources available are presented. Seven software systems are reviewed, considered and summarised with mixed results. The development of this review aimed at forming closer links between Primary Industries Research Victoria and GeoScience Victoria to share and find common ground in data/technology sharing. Likewise links have been formed with the Cooperative Research Centre for Spatial Information in software development and a North America research group in 3D applications for groundwater studies.
This review, while not aiming to find the best tool to answer all the questions, has been able to identify a few contenders, which require further testing. The end product may be a combination of tools or may require development of an existing software application. It has certainly been intended to raise the profile of existing tools into new areas of application. Technology transfer between interested parties identified above and ongoing communication will help to develop the ideas presented here further.
Cherry (2005) 3D visualisation tools
ii
Contents This cover page to be replaced with Formal Report Cover at completion of report. ..........................................1
DRAFT..................................................................................................................................................................................1
Executive Summary ............................................................................................................................................................i
Abstract.................................................................................................................................................................................1
1 Introduction...............................................................................................................................................................1
Groundwater status in Victoria ........................................................................................................................................1
Current methods of modelling groundwater.................................................................................................................2
2 Review methodology...............................................................................................................................................5
How do the miners do it? ..................................................................................................................................................6
Groundwater Vs Minerals Paradigm ..............................................................................................................................6
3 What data is available? ...........................................................................................................................................8
Traditional sources..............................................................................................................................................................8
Groundwater bore datasets .....................................................................................................................................8
Private water bores ...................................................................................................................................................9
Surface streams, dams and wells............................................................................................................................9
Mining and exploration data.............................................................................................................................................9
Mineral exploration bore holes...............................................................................................................................9
Geophysical data (in/on ground and remote sensed).........................................................................................9
Quality ................................................................................................................................................................................10
Missed opportunities? ......................................................................................................................................................10
4 Software review......................................................................................................................................................11
The candidates ...................................................................................................................................................................11
High end products (>>$15k) ..................................................................................................................................11
Middle order ($5‐15K) ............................................................................................................................................11
Lower end (<$5K)....................................................................................................................................................11
Which does what? .............................................................................................................................................................12
Vulcan .......................................................................................................................................................................12
Micromine ................................................................................................................................................................12
GOCAD.....................................................................................................................................................................12
3D Geomodeller ......................................................................................................................................................13
FracSIS.......................................................................................................................................................................13
Datamine Studio......................................................................................................................................................14
Rockworks 2004.......................................................................................................................................................15
DPI‐MPD 3D‐4D software review ‐ summary .............................................................................................................16
5 Conclusions and Recommendations..................................................................................................................17
6 References................................................................................................................................................................18
7 Appendix..................................................................................................................................................................19
What are our needs? .........................................................................................................................................................19
Figures Error! No table of figures entries found.
Tables Error! No table of figures entries found.

Cherry (2005) 3D Visualisation Tools
1
A review of new approaches to groundwater resource and salinity assessment using mining and oil industry 3D visualisation and quantification tools. Don Cherry
Abstract
The demand for high quality 3D geological and hydrological information will continue to increase as the
demand for understanding our groundwater resources increases. With the growing needs of the community
to improve landscape planning and resource utilisation, better data and data analysis techniques will aid
and manage these demands. Huge disparate datasets and the requirements of ʹinstantʹ information focuses
research and development on IT and software technologies to deliver the results. While current groundwater
modelling techniques provide reasonably good models and visualisation, this study looks at alternative
software and data sources to augment and improve the current status. Data and 3D visualisation
technologies employed by the mineral exploration and mining industries are a viable alternative.
Keywords: [3D visualisation, groundwater, mineral exploration, bore holes, stratigraphy, and software]
1 Introduction As attention to environmental and land‐use issues grows, particularly in urban and periurban areas, there is an increasing need for information on groundwater resources. Groundwater is an important alternative water source and there are many areas where it has the potential to supplement dwindling surface water supplies, which have come under pressure from ongoing drought conditions. The study of groundwater systems is needed to determine their resource potential and to understand interactions with surface water systems and land based assets (wetlands, biodiversity). It is also critical to their protection and long‐term sustainable development as well as the development and survival of semi‐rural communities. Geological data synthesis is a fundamental component in building an accurate understanding of groundwater systems. Deficiencies in hydrogeological understanding (and numerical groundwater modelling) are most commonly traced back to a lack of geological understanding due to either (or both) inadequate data or synthesis of available data. Although technological capability is accelerating in this area, there is also an ongoing lack of high‐quality data to match the technology. This study, while principally funded by the Agriculture Development Division of DPI, has broad application across agriculture, water resources and the geosciences. It will explore the range of data available for inclusion in groundwater studies, but more particularly focus on the 3D visualisation and quantification tools used in the mineral exploration and mining industries as applications for visualisation (and modelling) of groundwater and aquifers. The aim of this work is to improve the current methodologies for assessment of groundwater resources and salinity. Additional research areas that could benefit include soil and the regolith studies.
Groundwater status in Victoria Groundwater resources support a significant proportion of the Stateʹs primary production (supply) or impact adversely in other circumstances (salinity, land subsidence, and saline intrusion). Annual water use across Victoria is estimated at 4.8 million megalitres (ML). Groundwater comprises roughly 10% of this consumption (VRO 2005). Private bores, springs and public water supplies tap into this resource and both water quality and yield determine the suitability of this supply. The most important aspect of water quality is determined by its salinity or quantity of Total Dissolved Salts (TDS). Good drinking water has TDS of less than 1000 mg/l. As the TDS increases, the range of water uses is increasingly restricted until water with more than about 14000 mg/l TDS is virtually un‐useable except in specific industries. At these levels of TDS the water may impact adversely on agriculture, non‐farming industries, the built infrastructure and the environment.
Groundwater resources can be measured in terms of the average rate at which they are naturally renewed. These are expressed as annual volumes. Minor sources are those that are too limited or sparse for major water supply development, but may be useful for meeting local demands. Divertible resources are those considered suitable for development. The total estimated groundwater resource of Victoria, from both divertible and minor sources is 970,000 ML per annum, about twice what is currently being used. About 90% is available from the divertible resource and the remainder is
Cherry (2005) 3D Visualisation Tools
2
provided by minor sources (VRO 2005). Significant known groundwater resources in Victoria are designated under Groundwater Management Areas (GMAs), each with a Permissible Annual Volume (PAV) which equates to the calculated sustainable groundwater yield and is defined as the maximum annual volume of groundwater permitted to be extracted from the GMA aquifer system(s). A recent audit of PAVs highlighted the inadequate groundwater data available to describe groundwater processes and resources (Reid, 2004).
The major adverse environmental impact arising from groundwater in the state is saline groundwater discharge to streams and low lying areas due to rising watertables. Shallow watertables, regardless of water quality are also an issue where waterlogging and/or salinity can impact on agricultural production and the built environment. Over the last few decades, numerous studies have been undertaken to increase our understanding and to find a remedy(s) to the salinity problem. The National Land and Water Resource Audit (NLWRA 2000) was undertaken to compile a national scale study of the dryland salinity problem. It collated and provided information on the distribution, trends and impacts of dryland salinity in Australia, providing an important basis for tackling salinity management.
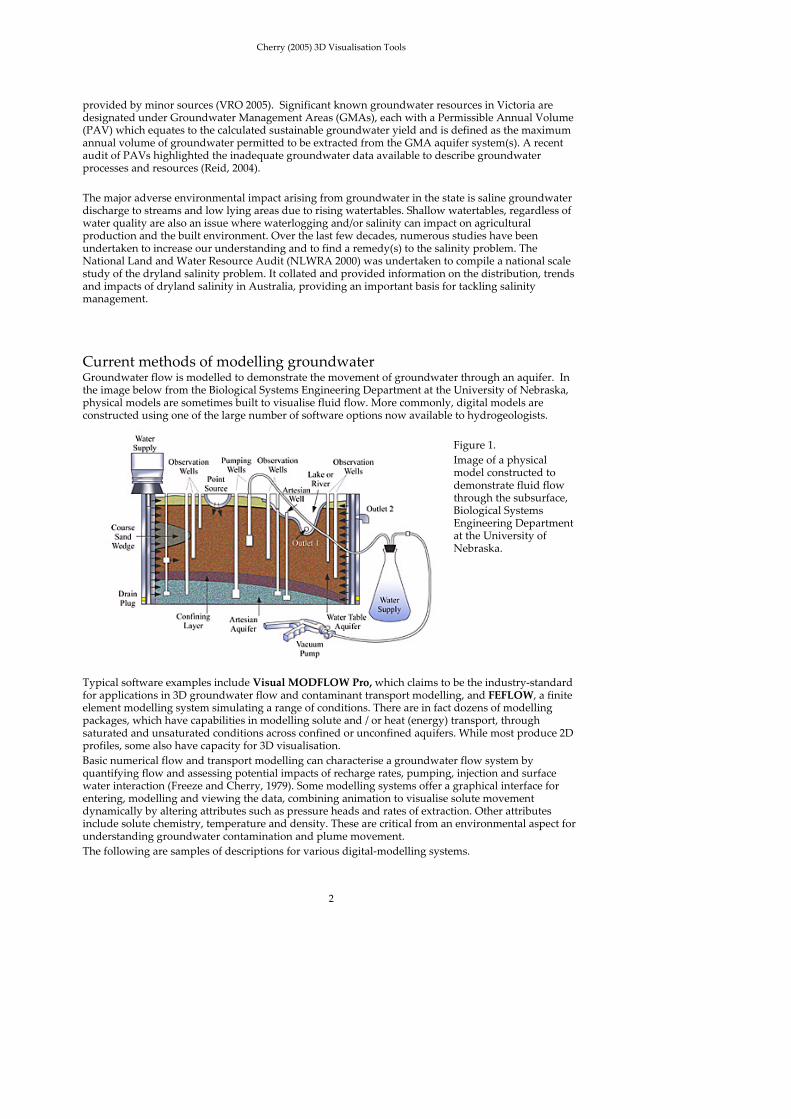
Current methods of modelling groundwater Groundwater flow is modelled to demonstrate the movement of groundwater through an aquifer. In the image below from the Biological Systems Engineering Department at the University of Nebraska, physical models are sometimes built to visualise fluid flow. More commonly, digital models are constructed using one of the large number of software options now available to hydrogeologists.
Figure 1.
Image of a physical model constructed to demonstrate fluid flow through the subsurface, Biological Systems Engineering Department at the University of Nebraska.
Typical software examples include Visual MODFLOW Pro, which claims to be the industry‐standard for applications in 3D groundwater flow and contaminant transport modelling, and FEFLOW, a finite element modelling system simulating a range of conditions. There are in fact dozens of modelling packages, which have capabilities in modelling solute and / or heat (energy) transport, through saturated and unsaturated conditions across confined or unconfined aquifers. While most produce 2D profiles, some also have capacity for 3D visualisation.
Basic numerical flow and transport modelling can characterise a groundwater flow system by quantifying flow and assessing potential impacts of recharge rates, pumping, injection and surface water interaction (Freeze and Cherry, 1979). Some modelling systems offer a graphical interface for entering, modelling and viewing the data, combining animation to visualise solute movement dynamically by altering attributes such as pressure heads and rates of extraction. Other attributes include solute chemistry, temperature and density. These are critical from an environmental aspect for understanding groundwater contamination and plume movement.
The following are samples of descriptions for various digital‐modelling systems.
Cherry (2005) 3D Visualisation Tools
3
MODFLOW 2000 ʺis a three‐dimensional finite‐difference groundwater model that was first published in 1984. It has a modular structure that allows it to be easily modified to adapt the code for a particular application… (It) simulates steady and nonsteady flow in an irregularly shaped flow system in which aquifer layers can be confined, unconfined, or a combination of confined and unconfined…... MODFLOW is currently the most used numerical model in the U.S. Geological Survey for ground‐ water flow problems. ʺ
(http://water.usgs.gov/nrp/gwsoftware/modflow2000/Mf2k.txt)
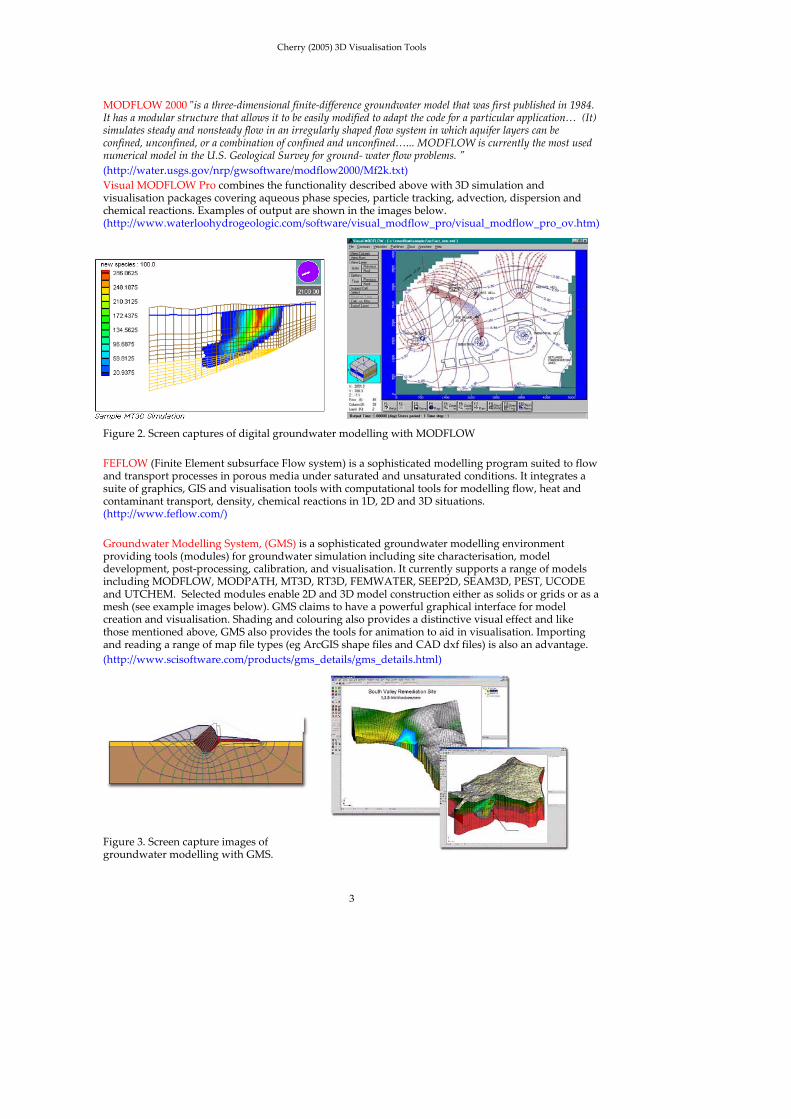
Visual MODFLOW Pro combines the functionality described above with 3D simulation and visualisation packages covering aqueous phase species, particle tracking, advection, dispersion and chemical reactions. Examples of output are shown in the images below. (http://www.waterloohydrogeologic.com/software/visual_modflow_pro/visual_modflow_pro_ov.htm)
Figure 2. Screen captures of digital groundwater modelling with MODFLOW
FEFLOW (Finite Element subsurface Flow system) is a sophisticated modelling program suited to flow and transport processes in porous media under saturated and unsaturated conditions. It integrates a suite of graphics, GIS and visualisation tools with computational tools for modelling flow, heat and contaminant transport, density, chemical reactions in 1D, 2D and 3D situations. (http://www.feflow.com/)
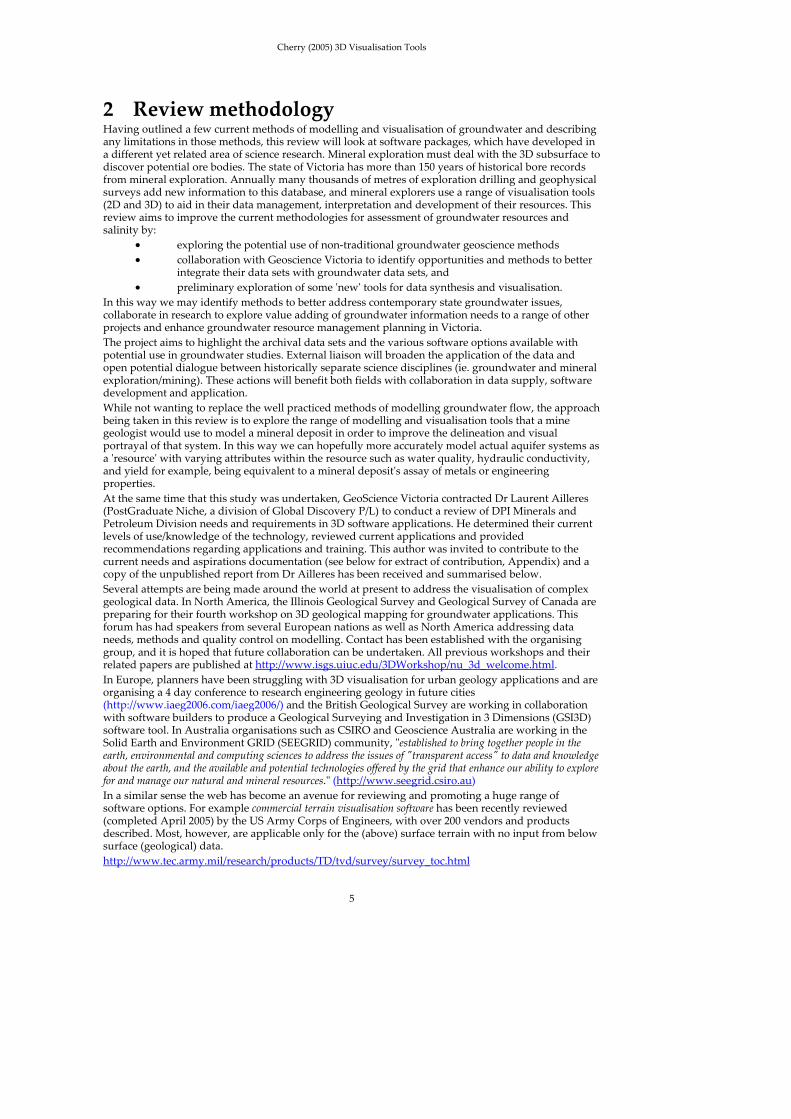
Groundwater Modelling System, (GMS) is a sophisticated groundwater modelling environment providing tools (modules) for groundwater simulation including site characterisation, model development, post‐processing, calibration, and visualisation. It currently supports a range of models including MODFLOW, MODPATH, MT3D, RT3D, FEMWATER, SEEP2D, SEAM3D, PEST, UCODE and UTCHEM. Selected modules enable 2D and 3D model construction either as solids or grids or as a mesh (see example images below). GMS claims to have a powerful graphical interface for model creation and visualisation. Shading and colouring also provides a distinctive visual effect and like those mentioned above, GMS also provides the tools for animation to aid in visualisation. Importing and reading a range of map file types (eg ArcGIS shape files and CAD dxf files) is also an advantage.
(http://www.scisoftware.com/products/gms_details/gms_details.html)
Figure 3. Screen capture images of groundwater modelling with GMS.

Cherry (2005) 3D Visualisation Tools
4
Geographic Information Systems (GIS). The integration of GIS into groundwater modelling is also becoming a ʹfeatureʹ of several modelling packages. GIS can be used in a multiplicity of applications related to occurrence and movement of groundwater. One of the main benefits is that simulation results can be geo‐referenced for display with other features such as surface geology, hydrology or parcel boundaries. This then promises increased accuracy in data input and opportunity for further process modelling output, as well as visually appealing presentation of results. These improvements in technology also allow for improved groundwater risk assessment to be carried out in relation to identification and remediation of contaminant plumes, environmental impact evaluation for civil engineering and human activity affecting ground water.
Cherry (2005) 3D Visualisation Tools
5
2 Review methodology Having outlined a few current methods of modelling and visualisation of groundwater and describing any limitations in those methods, this review will look at software packages, which have developed in a different yet related area of science research. Mineral exploration must deal with the 3D subsurface to discover potential ore bodies. The state of Victoria has more than 150 years of historical bore records from mineral exploration. Annually many thousands of metres of exploration drilling and geophysical surveys add new information to this database, and mineral explorers use a range of visualisation tools (2D and 3D) to aid in their data management, interpretation and development of their resources. This review aims to improve the current methodologies for assessment of groundwater resources and salinity by:
exploring the potential use of non‐traditional groundwater geoscience methods
collaboration with Geoscience Victoria to identify opportunities and methods to better integrate their data sets with groundwater data sets, and
preliminary exploration of some ʹnewʹ tools for data synthesis and visualisation.
In this way we may identify methods to better address contemporary state groundwater issues, collaborate in research to explore value adding of groundwater information needs to a range of other projects and enhance groundwater resource management planning in Victoria.
The project aims to highlight the archival data sets and the various software options available with potential use in groundwater studies. External liaison will broaden the application of the data and open potential dialogue between historically separate science disciplines (ie. groundwater and mineral exploration/mining). These actions will benefit both fields with collaboration in data supply, software development and application.
While not wanting to replace the well practiced methods of modelling groundwater flow, the approach being taken in this review is to explore the range of modelling and visualisation tools that a mine geologist would use to model a mineral deposit in order to improve the delineation and visual portrayal of that system. In this way we can hopefully more accurately model actual aquifer systems as a ʹresourceʹ with varying attributes within the resource such as water quality, hydraulic conductivity, and yield for example, being equivalent to a mineral depositʹs assay of metals or engineering properties.
At the same time that this study was undertaken, GeoScience Victoria contracted Dr Laurent Ailleres (PostGraduate Niche, a division of Global Discovery P/L) to conduct a review of DPI Minerals and Petroleum Division needs and requirements in 3D software applications. He determined their current levels of use/knowledge of the technology, reviewed current applications and provided recommendations regarding applications and training. This author was invited to contribute to the current needs and aspirations documentation (see below for extract of contribution, Appendix) and a copy of the unpublished report from Dr Ailleres has been received and summarised below.
Several attempts are being made around the world at present to address the visualisation of complex geological data. In North America, the Illinois Geological Survey and Geological Survey of Canada are preparing for their fourth workshop on 3D geological mapping for groundwater applications. This forum has had speakers from several European nations as well as North America addressing data needs, methods and quality control on modelling. Contact has been established with the organising group, and it is hoped that future collaboration can be undertaken. All previous workshops and their related papers are published at http://www.isgs.uiuc.edu/3DWorkshop/nu_3d_welcome.html.
In Europe, planners have been struggling with 3D visualisation for urban geology applications and are organising a 4 day conference to research engineering geology in future cities (http://www.iaeg2006.com/iaeg2006/) and the British Geological Survey are working in collaboration with software builders to produce a Geological Surveying and Investigation in 3 Dimensions (GSI3D) software tool. In Australia organisations such as CSIRO and Geoscience Australia are working in the Solid Earth and Environment GRID (SEEGRID) community, ʺestablished to bring together people in the earth, environmental and computing sciences to address the issues of ʺtransparent accessʺ to data and knowledge about the earth, and the available and potential technologies offered by the grid that enhance our ability to explore for and manage our natural and mineral resources.ʺ (http://www.seegrid.csiro.au)
In a similar sense the web has become an avenue for reviewing and promoting a huge range of software options. For example commercial terrain visualisation software has been recently reviewed (completed April 2005) by the US Army Corps of Engineers, with over 200 vendors and products described. Most, however, are applicable only for the (above) surface terrain with no input from below surface (geological) data.
http://www.tec.army.mil/research/products/TD/tvd/survey/survey_toc.html
Cherry (2005) 3D Visualisation Tools
6
Ongoing research studies at Australian universities have been developing the use of 3D visualisation in the geosciences. Recent work (eg. Giles, 2004) included the use of state of the art LiDAR data to build an accurate topographic surface, which was then used in an attempt to model subsurface geology from bore data in the Corangamite CMA, west of Melbourne. Giles used desktop software including MapInfo and plug‐ins to produce a set of images and models. While the images were stunning, Giles admits that there were processing problems, particularly with the size of the datasets and the quality of the bore data.
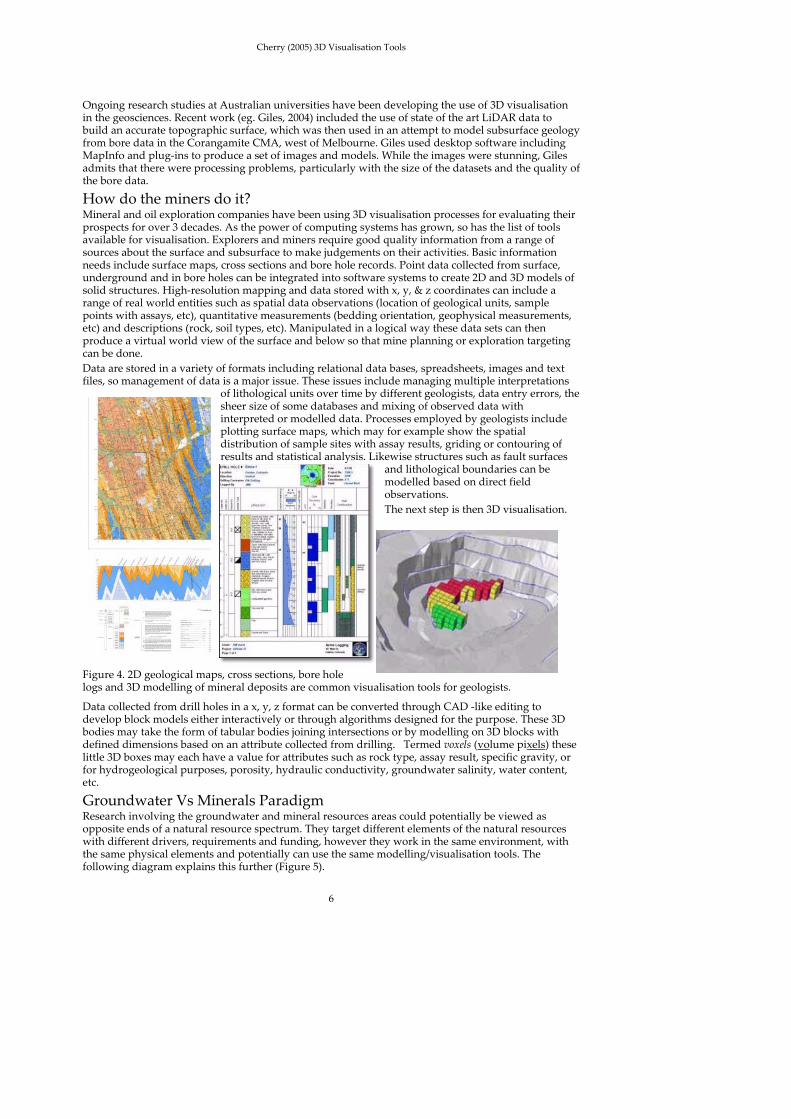
How do the miners do it? Mineral and oil exploration companies have been using 3D visualisation processes for evaluating their prospects for over 3 decades. As the power of computing systems has grown, so has the list of tools available for visualisation. Explorers and miners require good quality information from a range of sources about the surface and subsurface to make judgements on their activities. Basic information needs include surface maps, cross sections and bore hole records. Point data collected from surface, underground and in bore holes can be integrated into software systems to create 2D and 3D models of solid structures. High‐resolution mapping and data stored with x, y, & z coordinates can include a range of real world entities such as spatial data observations (location of geological units, sample points with assays, etc), quantitative measurements (bedding orientation, geophysical measurements, etc) and descriptions (rock, soil types, etc). Manipulated in a logical way these data sets can then produce a virtual world view of the surface and below so that mine planning or exploration targeting can be done.
Data are stored in a variety of formats including relational data bases, spreadsheets, images and text files, so management of data is a major issue. These issues include managing multiple interpretations
of lithological units over time by different geologists, data entry errors, the sheer size of some databases and mixing of observed data with interpreted or modelled data. Processes employed by geologists include plotting surface maps, which may for example show the spatial distribution of sample sites with assay results, griding or contouring of results and statistical analysis. Likewise structures such as fault surfaces
and lithological boundaries can be modelled based on direct field observations.
The next step is then 3D visualisation.
Figure 4. 2D geological maps, cross sections, bore hole logs and 3D modelling of mineral deposits are common visualisation tools for geologists.
Data collected from drill holes in a x, y, z format can be converted through CAD ‐like editing to develop block models either interactively or through algorithms designed for the purpose. These 3D bodies may take the form of tabular bodies joining intersections or by modelling on 3D blocks with defined dimensions based on an attribute collected from drilling. Termed voxels (volume pixels) these little 3D boxes may each have a value for attributes such as rock type, assay result, specific gravity, or for hydrogeological purposes, porosity, hydraulic conductivity, groundwater salinity, water content, etc.
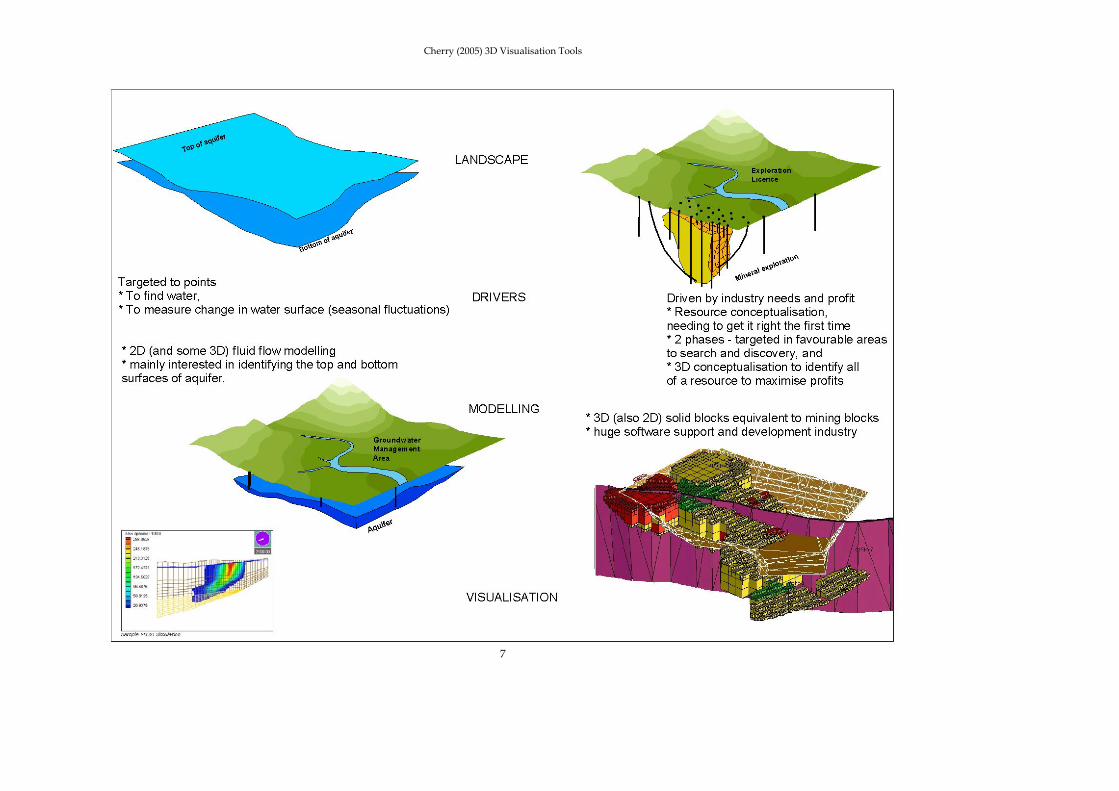
Groundwater Vs Minerals Paradigm Research involving the groundwater and mineral resources areas could potentially be viewed as opposite ends of a natural resource spectrum. They target different elements of the natural resources with different drivers, requirements and funding, however they work in the same environment, with the same physical elements and potentially can use the same modelling/visualisation tools. The following diagram explains this further (Figure 5).
Cherry (2005) 3D Visualisation Tools
7

Cherry (2005) 3D Visualisation Tools
8
3 What data is available? Traditional sources Groundwater bore datasets Groundwater database(s) for the state of Victoria are maintained by Primary Industries Research Victoria (PIRVic) and Sinclair Knight Merz (SKM). The Salinity Groundwater Monitoring Network (SGMN) and the State Observation Bore Network (SOBN) operate from these databases. Other monitoring and groundwater investigation bores have been established for specific projects, but are not necessarily included within the above programs (Heislers et al 2005).
The SGMN originated from the salinity management, monitoring and community education programs linked to the development and implementation of various Victorian regional salinity strategies. The physical elements of this program are owned by DSE, but operated by PIRVic.
The SOBN is administered by SKM on behalf of DSE, and has its origins in groundwater management and resource/salinity investigations. A significant proportion of the monitoring is inherited from agencies such as the Rural Water Commission and the Geological Survey of Victoria of the 1970s and 1980s.
The Victorian Water data warehouse http://www.vicwaterdata.net/vicwaterdata/home.aspx acts as a repository for much of the data collected making it available over the web for any person to access. Simple selection tools, either geographic (through CMA or catchment boundaries) or via searching particular bore IDs, can result in a report detailing the groundwater levels and quality, bore logs (if they exist) or some other detail about the groundwater. The images below show typical reports from the warehouse.
Figure 6. Standard site reports from the Victorian water data warehouse website.
Some site reports have good bore log details and a long history of groundwater monitoring. The table below lists the Catchment Management Authority areas and the numbers of bore records with log (lithological) information.
This type of data is important for geological characterisation of the subsurface in studying the spatial distribution of aquifers and their water quality, quantity and protection. Table 1 shows that less than half of the boreholes in this database have a reliable lithological log for geological characterisation as of June 2005.

Cherry (2005) 3D Visualisation Tools
9
Table No 1
CMA Sites with lithology
North East 1296
Goulburn Broken
15546
North Central 8495
Mallee 1347
Wimmera 1044
Glenelg Hopkins
8670
Corangamite 3291
Port Phillip 10485
East Gippsland
325
West Gippsland
2683
Total 53182
from >>130000
Private water bores A significant number of private bores have been sunk across Victoria, some of which, particularly older bores, may not be included in the ʹofficialʹ register. The owner may collect water quality information from these, however they would be considered to be generally inaccessible for geological studies.
Surface streams, dams and wells Across Victoria streams, dams and wells intersect or cut across the geological strata exposing subsurface details which can in some instances be used for modelling and informing geological interpretation. Much of the geology exposed in these locations would be captured in the suite of geological maps produced by GeoScience Victoria.
Mining and exploration data Mineral exploration bore holes Australian Bureau of Statistics data suggests that between 25 000 and 50 000m of exploration and mining related drilling was conducted in Victoria each quarter between 1996 and 2004. A significant proportion of this activity would have been within mine sites, related to mine development and therefore of limited use if it were available. Exploration activity on the other hand tends to be more wide spread, targeting prospects with bore hole logging conducted by geologists, geophysicists or drillers and providing a valuable resource of information about the subsurface (see Figure 5). Besides collecting samples for assay, many geologists record good descriptions of the rock types and their condition (eg state of weathering, fractures, depth to water intersection etc) as intersected in drilling. While an exploration or mining licence is active, all activities and records are confidential, even when information is submitted to government for quarterly, half yearly and annual reporting. Eventually this resource of information becomes public when leases are relinquished and it joins the huge archival dataset known as GEDIS, (geological exploration and development information system, http://www.dpi.gov.au) which houses geological data collected over the previous 150+ years of exploration and mining history in Victoria.
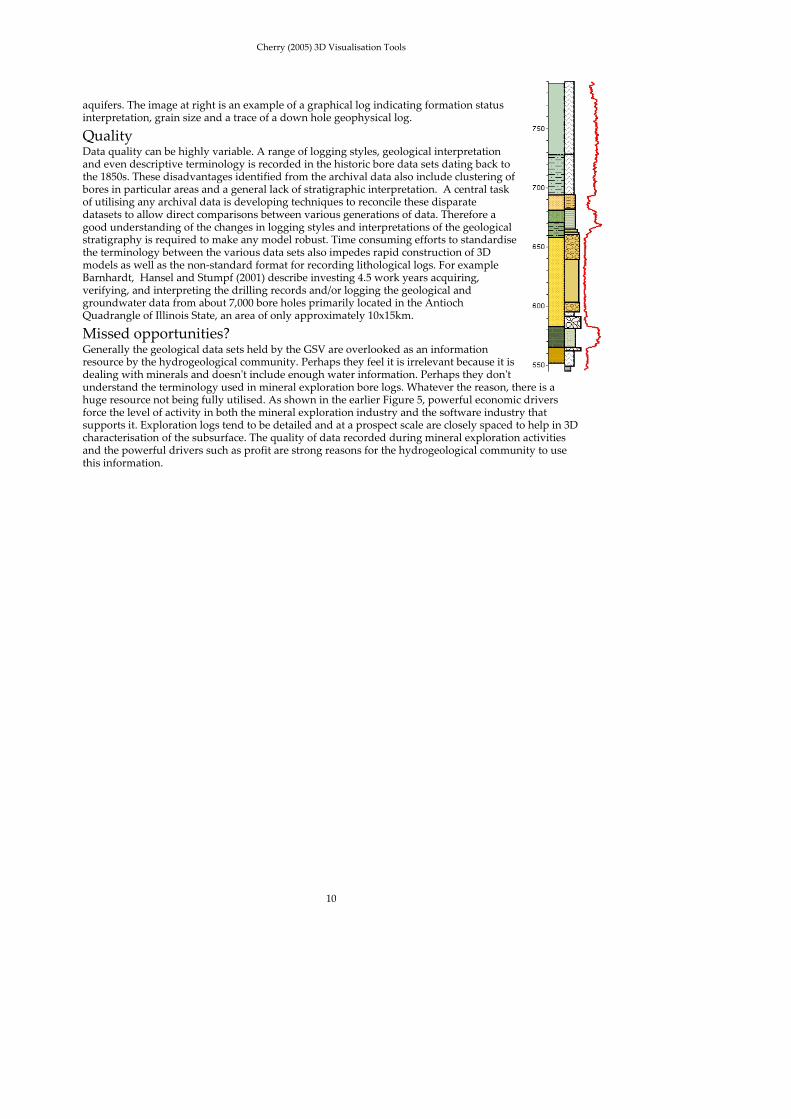
Geophysical data (in/on ground and remote sensed) While beyond the scope of this review, geophysical information is mentioned here as another source of data which can be integrated into a number of software systems with bore hole data to better model and understand the subsurface. Some government agencies conduct geophysical surveys for agricultural purposes, while many mineral exploration companies use these techniques to assist in finding and defining mineral prospects. These data types tend to be under‐utilised in the water resources sector and could be applied to models to enhance their 3D resolution and better characterise
Note.
Numbers in this table were drawn from the Victorian Water Data Warehouse. There are over 130 000 bores with records in the Warehouse, however a breakdown into individual CMAs was not possible.
Cherry (2005) 3D Visualisation Tools
10
aquifers. The image at right is an example of a graphical log indicating formation status interpretation, grain size and a trace of a down hole geophysical log.
Quality Data quality can be highly variable. A range of logging styles, geological interpretation and even descriptive terminology is recorded in the historic bore data sets dating back to the 1850s. These disadvantages identified from the archival data also include clustering of bores in particular areas and a general lack of stratigraphic interpretation. A central task of utilising any archival data is developing techniques to reconcile these disparate datasets to allow direct comparisons between various generations of data. Therefore a good understanding of the changes in logging styles and interpretations of the geological stratigraphy is required to make any model robust. Time consuming efforts to standardise the terminology between the various data sets also impedes rapid construction of 3D models as well as the non‐standard format for recording lithological logs. For example Barnhardt, Hansel and Stumpf (2001) describe investing 4.5 work years acquiring, verifying, and interpreting the drilling records and/or logging the geological and groundwater data from about 7,000 bore holes primarily located in the Antioch Quadrangle of Illinois State, an area of only approximately 10x15km.
Missed opportunities? Generally the geological data sets held by the GSV are overlooked as an information resource by the hydrogeological community. Perhaps they feel it is irrelevant because it is dealing with minerals and doesnʹt include enough water information. Perhaps they donʹt understand the terminology used in mineral exploration bore logs. Whatever the reason, there is a huge resource not being fully utilised. As shown in the earlier Figure 5, powerful economic drivers force the level of activity in both the mineral exploration industry and the software industry that supports it. Exploration logs tend to be detailed and at a prospect scale are closely spaced to help in 3D characterisation of the subsurface. The quality of data recorded during mineral exploration activities and the powerful drivers such as profit are strong reasons for the hydrogeological community to use this information.
Cherry (2005) 3D Visualisation Tools
11
4 Software review Globally, the mining software market is worth about $2 billion a year and continues to grow annually by about 25%. Australia currently supplies mining software to 60% of the worldʹs mines (www.access.edu.au). This market includes all mining software from support solutions in mine management and planning to economic development, supply chain, maintenance, human resources and, of course, geological and engineering needs. In addition to above, developments within Australia by private companies and government research organisations are leading the world in application of the rapidly growing IT systems in earth and landscape visualisation. This review is only for the geological visualisation portion.
A range of software products were selected across as wide a price range as possible. This is reflected in the list below and is also reflected in the ability of some products to complete/manage the tasks as required.
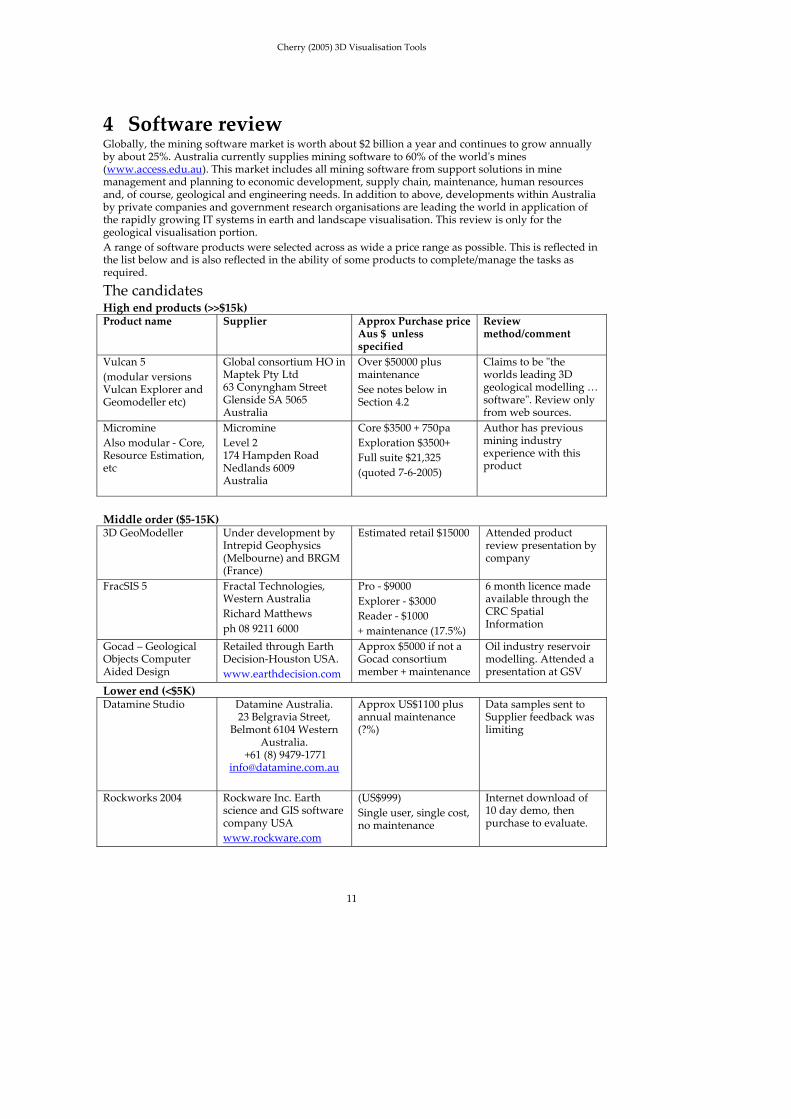
The candidates High end products (>>$15k) Product name Supplier Approx Purchase price
Aus $ unless specified
Review method/comment
Vulcan 5
(modular versions Vulcan Explorer and Geomodeller etc)
Global consortium HO in Maptek Pty Ltd 63 Conyngham Street Glenside SA 5065 Australia
Over $50000 plus maintenance
See notes below in Section 4.2
Claims to be ʺthe worlds leading 3D geological modelling … softwareʺ. Review only from web sources.
Micromine
Also modular ‐ Core, Resource Estimation, etc
Micromine
Level 2 174 Hampden Road Nedlands 6009 Australia
Core $3500 + 750pa
Exploration $3500+
Full suite $21,325
(quoted 7‐6‐2005)
Author has previous mining industry experience with this product
Middle order ($5‐15K) 3D GeoModeller Under development by
Intrepid Geophysics (Melbourne) and BRGM (France)
Estimated retail $15000 Attended product review presentation by company
FracSIS 5 Fractal Technologies, Western Australia
Richard Matthews
ph 08 9211 6000
Pro ‐ $9000
Explorer ‐ $3000
Reader ‐ $1000
+ maintenance (17.5%)
6 month licence made available through the CRC Spatial Information
Gocad – Geological Objects Computer Aided Design
Retailed through Earth Decision‐Houston USA.
www.earthdecision.com
Approx $5000 if not a Gocad consortium member + maintenance
Oil industry reservoir modelling. Attended a presentation at GSV
Lower end (<$5K) Datamine Studio Datamine Australia.
23 Belgravia Street, Belmont 6104 Western
Australia. +61 (8) 9479‐1771
Approx US$1100 plus annual maintenance (?%)
Data samples sent to Supplier feedback was limiting
Rockworks 2004 Rockware Inc. Earth science and GIS software company USA
www.rockware.com
(US$999)
Single user, single cost, no maintenance
Internet download of 10 day demo, then purchase to evaluate.
Cherry (2005) 3D Visualisation Tools
12
Which does what? Following is a simple description of each reviewed or sampled product and some notes on their respective performances.
Vulcan A trial version was not acquired during the review period. Enquiries with the vendor Maptek, resulted in a quote for the Geomodeller and Groundwater Modelling Modules which came to $53350 plus some $8000 annual maintenance.
These are entry point modules for the type of work covered in this review. The full suite includes a much larger (and very expensive) Vulcan system which has full mine design functionality. Geomodeller is targeted at exploration teams working with stratigraphic deposits, where they require data management and validation, geological interpretation, cross sectioning and interactive 3D graphics through a range of CAD tools. It has the capability of loading gridded models and bore data, including down hole geophysical logs and lithological horizons. Several of the modules also have geostatistical tools.
This system also has an interface, which supports third party groundwater modelling platforms such as MODFLOW and AQUIFEM. The interface allows data entry, modelling analysis and visualisation. The Vulcan website (www.vulcan3d.com) provides scant details on the inputs and outputs but has many pictures of sections, 3D models and screen dumps. The system, however, is considered in the industry to be one of the best. Whilst it may be a superior product with data input and visualisation etc, cost is a major inhibitor.
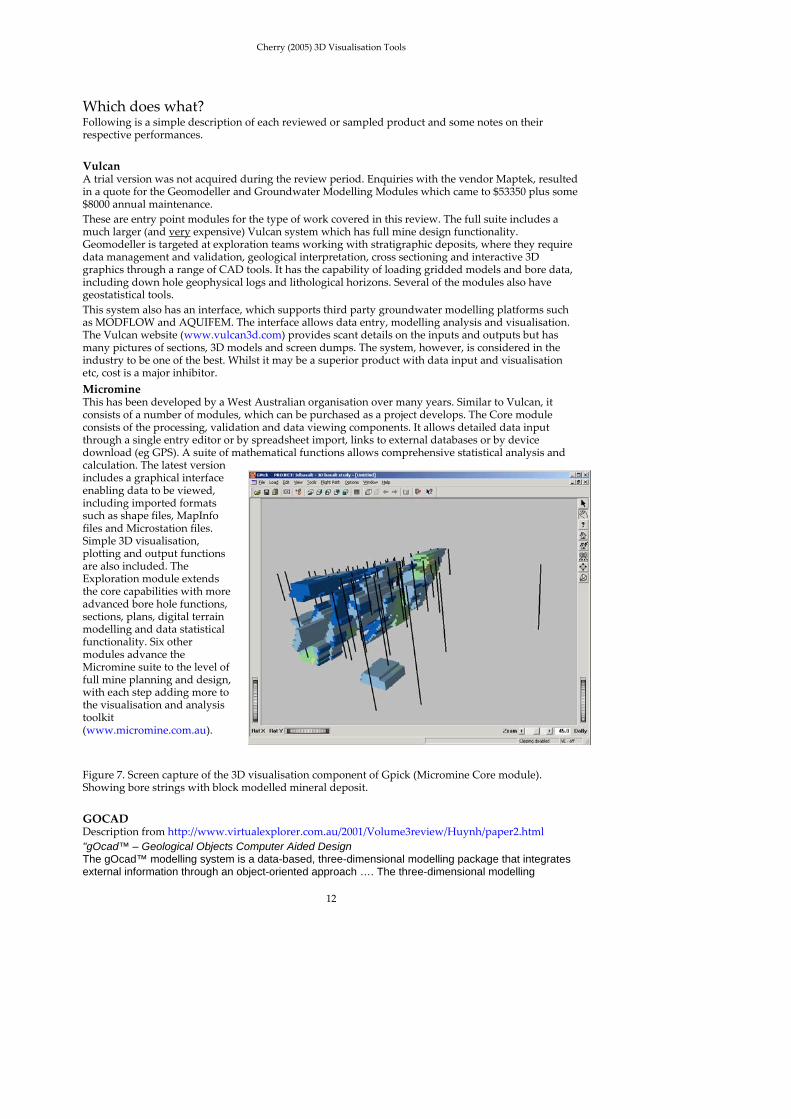
Micromine This has been developed by a West Australian organisation over many years. Similar to Vulcan, it consists of a number of modules, which can be purchased as a project develops. The Core module consists of the processing, validation and data viewing components. It allows detailed data input through a single entry editor or by spreadsheet import, links to external databases or by device download (eg GPS). A suite of mathematical functions allows comprehensive statistical analysis and calculation. The latest version includes a graphical interface enabling data to be viewed, including imported formats such as shape files, MapInfo files and Microstation files. Simple 3D visualisation, plotting and output functions are also included. The Exploration module extends the core capabilities with more advanced bore hole functions, sections, plans, digital terrain modelling and data statistical functionality. Six other modules advance the Micromine suite to the level of full mine planning and design, with each step adding more to the visualisation and analysis toolkit (www.micromine.com.au).
Figure 7. Screen capture of the 3D visualisation component of Gpick (Micromine Core module). Showing bore strings with block modelled mineral deposit.
GOCAD Description from http://www.virtualexplorer.com.au/2001/Volume3review/Huynh/paper2.html
"gOcad™ – Geological Objects Computer Aided Design The gOcad™ modelling system is a data-based, three-dimensional modelling package that integrates external information through an object-oriented approach …. The three-dimensional modelling
Cherry (2005) 3D Visualisation Tools
13
environment of gOcad™ allows representation and definition of sophisticated models that are topologically and geometrically consistent with many types of external geological information including, boreholes, level plans and cross-sections, seismic lines. The modelling framework allows for interactive manipulation, interpretation and visualisation of geological models comprising two basic model-types relevant to this investigation; (i) surface-type models representing geological and or structural boundaries; and (ii) grid-type models in which physical rock properties may be characterised in the defined model space." Gocad is one of the favourite 3D modelling tools within the petroleum industry, having been developed by a consortium of oil exploration companies and as a result is biased towards this type of application. Unfortunately, a demo version was not obtained to test with groundwater data sets, but the similarity between modelling and understanding groundwater systems and oil reservoirs is recognised. It was essentially designed for geologic interpretation and display. A presentation provided to the GSV clearly demonstrated the range of applications and tools in Gocad. The software allows importing of a range of file formats, including competitor packages and keeps a ʹhistory fileʹ of processing activity for later use or reference. It provides a suite of tools for interpreting, displaying, and performing analysis of geological data in relation to petroleum enterprises, including reasonably powerful kriging algorithms for modelling. The makers claim it can perform rapid and accurate interpretation of geologic structures and stratigraphy with data ranging from regional geologic interpretations to detailed stratigraphic reservoir analyses. The system has distinct advantages with algorithms built to model geological structures such as faults and folds, which are important as petroleum traps or pathways. Not surprisingly, such a feature would have similar advantages for gaining understanding of restrictions to, and preferred pathways for, groundwater flow. Key features also include some strong geostatistical tools and being able to model oil/gas reservoirs. A list of plug‐ins already exists with the consortium continuing to produce new developments regularly.
3D Geomodeller Developed by the French government geological survey (Bureau de Recherches Geologiques et Minieres ‐ BRGM) 3D Geomodeller has been taken up by Melbourne based geophysical exploration company, Intrepid Geophysics, to further develop and market. Most Australian geological surveys (state and federal) and a few companies are contributing funds towards software development. The product is not yet available, however working versions have been demonstrated to the author and others at open workshops. The software represents a radically different approach to geological modelling. While most are based on an engineering‐type CAD (computer aided drafting)visualisation, this product is purpose built to use the primary geological observations (ie dip and strike, unit thickness, intersections, etc) to build a model using geologically intelligent relationships. The model can also be updated with new observations and has the capacity to incorporate geophysical data such as gravity (and electromagnetic surveys planned in the future). Mathematical equations control the model formation and rebuilding is relatively quick with iterations improving the ʺlookʺ of the model. Sections and volume calculations can be made, however the geological model must be kept relatively simple with a maximum of around 4000 data points. The author was suitably impressed with how the algorithm handles some complexity such as cross cutting geological features (eg. faults and intrusions) and with how it gives an obvious incorrect result if the operator mixes up age relationships of various geologic entities. Unfortunately, it can only read from xyz and asci‐type databases, and bore hole logs would need considerable reformatting to be included in the modelling. This product is not yet ready for the general 3D visualisation of the geological world, however it is one to watch for in the future. (http://www.intrepid‐geophysics.com)
FracSIS A temporary licence for FracSIS was supplied through the Department of Primary Industries involvement in the CRC for Spatial Information. The Victorian government is a member of the CRC SI consortium aiming to make spatial applications affordable and useable anytime and anywhere. FracSIS has two main components, those being a data manager and a data viewer. Within the data manager all elements can be imported or exported and manipulated, while a processing window tracks the action with a time record and component title. The data viewer, also known as Scene, is the visualisation component where a wide range of models and data from a long list of proprietary software formats can be viewed. Figure 8 shows the Scene component with a perspective view of some Victorian data.

Cherry (2005) 3D Visualisation Tools
14
FracSIS was designed as a spatial database and 3D‐visualisation package for exploration and mining. It combines an object‐oriented database designed to store geological, geochemical and geophysical data with an interactive 3D‐visualisation environment.
As part of the Glass Earth project, CSIRO and Fractal Technologies (maker of FracSIS) are jointly researching how the database and visualisation software can be used in disciplines complementary to exploration and mining. One example is to model groundwater flow. This software was chosen for the Glass Earth project because it was specifically designed technology for storage and management of terabytes of geoscientific data. Fractal Technologies are also developing web services to enable geoscientists to publish and distribute their 3D models around the world.
Figure 8. Screen capture of Scene (data viewer) shows the Creswick DEM (north to upper right).
http://technology.infomine.com/softwaremine/articles/Fractal052703.asp
Datamine Studio This product is part of the ʺExploration Officeʺ, a large suite of software products designed to capture, display, organise and evaluate all exploration drilling and sampling data. The Australian based company joined forces with a Canadian company (Century Systems) to cover the difficult area of data management, which the company claims it now handles better than the MS Access system. Datamine Studio is the geological modelling and planning component. It is modular, allowing growth as required and includes database utilities, block modelling, wireframe, geostatistics, 3D visualisation plus a host of mine design and optimisation specific modules.
Figure 9 Typical screen layout from the Datamine website
A suite of data files were sent to Datamine in Western Australia so that they could test the data structure and types without the author having to obtain a copy of the software and conduct the trial. Included in the set were examples of the groundwater database, bore hole database from GSV (both as MS Access files), some examples of polygon shapefile and ESRI grids and some geophysical data files from PIRVicʹs EM sensors and Gamma Ray Spectrometer equipment. Although a large set, they were sent as examples of our datasets to trial and test the complexity within them.
Figure 10. (here and over page) Screen capture images of the study undertaken by Datamine using Victorian groundwater data. Top image is a section along bores showing lithologies and depth to water, the lower image is an attempted surface based on the depth to water intersections.

Cherry (2005) 3D Visualisation Tools
15
Datamine conducted a systematic study of the supplied datasets. The consultant found our data model confusing and cumbersome and referred to missing data, particularly from some of the bore data. In this case he was referring to missing or poor bore logs and to some of the standing water level data which is only measured sporadically. He also had difficulty handling co‐sited bores (nested bores) which tend to have the exact same coordinates. He mentioned the reduced integrity in the database due to non‐standard codes in bore logs and suggested another product (ʺIn Touchʺ) as a potential for viewing and interrogating data.
Rockworks 2004 While in the cheaper end of the market, Rockworks offers on its web description an excellent list of tools to allow management, analysis and display of borehole and surface information. However, it was found that a 10 day free trial of the down loaded product was not enough time, even to just read the help files and trial the sample data sets, let alone try to import PIRVic data to trial.
Due to its low purchase price it was decided to purchase a single licence to trial the software over a longer period. After reading an adequate amount of the tutorial material supplied, bore hole data was imported from a Victorian data set, but adjusting this data to the format required by Rockworks initially seemed cumbersome. The list of processing tools allows a range of tasks to be performed if the data were available. With simple files containing bore hole locations, and logs of intersections with subsurface geology, a series of images (Figure 11) were produced to test the programʹs functionality.
Figure 11 Screen capture of Rockplot3D showing bore logs with 6X vertical exaggeration.
This system promises a lot and appears simple to use from the accompanying documentation, however it is an all‐or‐nothing application, meaning that if there is a minor error in the data format, then no visual result is produced! Having had some successes with
importing Victorian data to produce the image in Figure 11, creating sections or a 3D block model proved more difficult without any indication of where problems occurred.
Cherry (2005) 3D Visualisation Tools
16
DPI‐MPD 3D‐4D software review ‐ summary Ailleres (2005) reviewed eleven software applications and considered criteria such as model and attribute editing, 3D model creation/interrogation, metadata handling, visual tools, advanced modelling and integration capabilities for other disciplines (eg groundwater). Some discussion ensued around the current and required configurations of visualisation, 3D modelling and advanced modelling, pointing out where particular needs are being met and not being met. With respect to groundwater, Ailleres noted that none of the basic versions of the systems reviewed offered any kind of advanced modelling functionality, although Vulcan was given a tick for including a module linking MODFLOW. He also pointed out the two types of geometrical modelling (CAD and intuitive) and the overlap of other features such as visualisation, data analysis and resource modelling. All of these are considered as advantageous in this review.
Ailleres also described the market penetration of the reviewed products, noting industry, academic and government agencies, which use various applications. Purchase and licence maintenance costs were briefly outlined, highlighting the difficulty that was faced with obtaining accurate costs from the vendors if you were only reviewing the software. In some cases they were reluctant to provide details if you were not actually a purchaser! Something this author encountered also.
Ailleres discussed the short and long term issues surrounding data management, highlighting the difficulties encountered with ʹsilosʹ of data and knowledge, and the paucity of cross application compatibility. His suggestion of a ʹdata‐exchange layerʹ between the data storage format and applications would be worthwhile.
Finally Ailleres presented 3 options: ‐
1) a solution to solve the visualisation requirement for resources only,
2) keeping the minerals and petroleum sections separate with individual platforms for treating the specific data, or
3) rationalising the applications (and the costs both in maintenance and training) and using a CAD application while supporting the development of the 3D Modeller package (Ailleresʹ preferred option).
The CAD application recommended by Ailleres is based on the ranking of each of the criteria noted above. Each program was given an overall rating. In all, 21 specific items were rated and the highest scoring application was Gocad. Ailleres also made the point of declaring that there may be an unintentional bias to this application due to his advanced knowledge of its application and its potential for plug‐in development.
Cherry (2005) 3D Visualisation Tools
17
5 Conclusions and Recommendations The vision for the Victorian governmentʹs Department of Primary Industries is Growing Victoria’s Future. A strategic component of this vision is within the Agriculture Development Divisionʹs Key Programs, which include Integrating Farming Systems into Landscapes. This program aims to deliver new knowledge that will underpin our understanding of the interactions of farming systems with biophysical processes. Key outcomes will include maintaining a healthy and productive natural resource base, enhancing and protecting this natural resource and improving the landscapes and farming viability. These outcomes can be achieved in part by using the best available tools to view and analyse them and utilising the most up to date and accurate data.
This review has explored a small selection of 3D visualisation and quantification tools used in the mining and oil industries with a particular view to their application in groundwater resource and salinity assessment. In addition, research into the available data and alternatives, their quality and the needs of end users has been undertaken. Although not discussed in the report, modelling of soil information could also be included as a potential use for the software packages reviewed.
Not surprisingly, most of the software options are structured in a variety of ways and utilise a range of different terminologies, as well as use different data formats for their successful operation. All require at least some labour‐intensive data processing or synthesis to arrange these formats. The biggest challenges lie in having to integrate variable quality data such as logs from groundwater bores, with high quality data such as that from engineering and mineral exploration bore logs and from geophysics.
A key theme of the review was to concentrate on the ease of use of data in the applications to construct 3‐D models (visualisations) of the geology. The applications may all variously create multiple cross sections, fence diagrams, block diagrams, stacked‐unit maps and isopach maps. Unfortunately, none of the applications reviewed were clear winners in terms of user friendliness. However that may be due only to unfamiliarity with the product. All required some degree of high‐labour data processing to format data or learn the various tools/functions. The author is certain that given time, greater familiarity with a particular application will improve the speed at which data can be processed.
Amongst the applications reviewed, Vulcan proved too expensive to even consider any further and 3D Geomodeller is not yet ready for use. The FracSIS application is certainly excellent in terms of visualising data by being able to import a wide range of other formats. However, it is limited in its processing capability, so that another package (such as Micromine, Vulcan, Gocad or one of about 25 other systems) must be available to first conduct the advanced processing. Micromine (Core module) included some great tools for inputting and processing data from bore holes but was found to be a bit limited in 3D processing by not having a block modelling component. However, that is available in another module and the visualisation component of the core module was generally good. Rockworks has all of its tools in one package which is an advantage, but there were a few processing problems with its data format requirements. This package is attractive due to its cheaper price, yet a little functionality is lost due to that ʹcheapnessʹ. Being unable to test the Datamine software first hand was probably an oversight as this package has a lot to offer and is reasonably priced. The data model issues alluded to by the Datamine consultant however may be highlighting similar issues as described for Rockworks. Finally Gocad also offers a good range of tools and options to cover the potential needs of PIRVic outlined at the start of the report. Being unable to test it even as a demo package was disappointing, but the recommendation by Ailleres (2005) and the demonstration witnessed at the GSV may hint at a very applicable package.
To optimise our data resources (ie. archival and bore hole databases) and strengthen our position to make informed decisions about our natural resources (in this case, our groundwater resources, as well as our land and water resources in terms of salinity management), we need to keep up with the emerging technologies. Software applications abound with a range of tools available to help in processing, analysing and visualising the data that is collected. Further exploration and testing of a couple of applications is recommended to gain more familiarity with their formats. This recommendation would comprise a scoping study or even a small research project on actually putting three packages (certainly Gocad, with the other two selected from FracSIS, Micromine and Datamine), to detailed tests with a range of datasets. Such testing would focus on a current problem area (eg Upper Loddon catchment aquifers) with the view to solve real issues with real data. Time restrictions did not allow such a comprehensive study for this review. Scientific and geographic visualisation technologies within DPI can be easily enhanced with any of these applications so that in the near future we can improve our understanding of the subsurface to allow better decision making about the protection and utilisation of groundwater and the management of salinity.
Cherry (2005) 3D Visualisation Tools
18
6 References
Ailleres L (2005) 3D/4D Geological Modelling Options Analysis Report to DPI Minerals and Petroleum Division, PGN report 5/2005 (unpublished)
Barnhardt M L, Hansel A K and. Stumpf A J (2001) Developing the database for 3‐D modeling: acquiring, assembling, verifying, assessing, interpreting, and integrating source data. Illinois State Geological Survey in Geological Models for Groundwater Flow Modeling Workshop Extended Abstracts April 22, 2001 at the 35th Annual Meeting North‐Central Section Geological Society of America (published on web at http://www.isgs.uiuc.edu/3DWorkshop/2001workshop/3_d_geology_2001_workshop.html)
Giles S R, (2004) Geological modelling of the Lake Murdeduke‐Barwon River region, Bachelor or Applied Science (Honours) thesis, University of Ballarat (unpublished) pp145.
Freeze RA and Cherry JA 1979 Groundwater, Prentice Hall pp604.
Heislers D, Clarke, R and Cherry D (2004) Glenelg Hopkins Catchment Management Authority groundwater and salinity monitoring evaluation, Department of Primary Industries, Primary Industries Research Victoria Research Report 52.
National Land and Water Resources Audit (2000) Australian Dryland Salinity Assessment 2000: extents, impacts, processes, monitoring and management options. Natural Heritage Trust.
Reid M (2004) Audit of permissible annual volumes for 35 Victorian groundwater management
areas CLPR (PIRVIC) Research report No. 54
VRO (2005) Victorian Resources Online, web‐based resource of documents pertaining to Victoriaʹs
natural resources (soil, water, vegetation, biodiversity, landuse and climate data) available at
http://www.dpi.vic.gov.au/dpi/vro/vrosite.nsf/pages/vrohome
Cherry (2005) 3D Visualisation Tools
19
7 Appendix What are our needs? Following is an extract of documentation submitted to the external review made for GeoScience Victoria. The findings of this review are included in a report by Ailleres (2005).
This summary was prepared with input from Mark Reid and Paul Rampant
ʺPIRVic (Soil & Water and Landscape Systems Platforms) Geoscience 3D modelling needs
What we do:
We provide corporate interpretation of data we collect and data we gather from other sources.
We make 2D maps (soil, surface water, groundwater, geological and geophysical interpretation) of various scales, 2D cross‐sections (groundwater profiles), and some 3D block models. Particularly groundwater surfaces, isopachs, formation surfaces and modelling some 3D/4D aspects such as g/w flow, landscape evolution and landscape hazards (salinity, soil acidification etc). Also interpretation of ground penetrating radar.
What software we use:
We use Arcview, ArcGIS (Arc Map, Spatial analyst, Arc Scene etc)
ENVI
Outcomes/limitations of the software:
Visualisation limitations
Difficulty in handling non compatible datasets (bore holes, geophysics, chemistry, soils)
Future requirements:
We need data in the third dimension, i.e. bore holes, some down hole geophysics, some surface/airborne geophysics (eg GPR, EM, gamma etc).
We want a modelling package that gives the intersection of geological 3D surfaces with topography, to help draw maps. Also be able to extract sections and level plans.
Need to consider other geological features such as fault surfaces, facies changes, fracture density/orientation etc.
Needs to be able to deal with large amounts of data for regional models.
We may want to model fluid (surface and groundwater) flow.
We want to be able to reconcile potential field data and other geophysical data with our map data and interpretations.
Don’t want a completely black box model – want some user control over constraints.
Models need to be importable and exportable to other software. Eg. groundwater/hydraulic software MODFLOW, FEFLOW.
Handy to have an Object oriented model builder.
To view impacts (models) of new data and changing rules to surface/subsurface water flows
Want excellent visualisation in order to appreciate complex 3D images.
Want the hardware to visualise this, e.g. special stereo vision goggles and projectors.
We need training and the time to do the training in order to learn how to use the software and hardware.
We need to statistically manage rock/groundwater/soil properties such as porosity, grainsize, hydraulic & electrical conductivity, TDS, chemical analysis etc.
We need the “WOW” factor to keep stakeholders happy.
We have to remain compatible with industry standards and software.ʺ