A Detailed Urban Road Traffic Emissions Inventory … · Vitor Gois - Raleigh, 16 May 2007 InventAr...
29
Vitor Gois - Raleigh, 16 May 2007 InventAr A detailed urban road traffic emissions inventory model using aerial photography and GPS surveys Vitor Gois - H. Maciel, L. Nogueira, C. Almeida, P. Torres, S. Mesquita, F. Ferreira InventAr, Estudos e Projectos Unip, Lda., Portugal. Departamento de Ciências e Engenharia do Ambiente, Universidade Nova de Lisboa, Portugal. Comissão de Coordenação e Desenvolvimento Regional de Lisboa e Vale do Tejo, Portugal. [email protected] EPA’s 16th Annual International Emission Inventory Conference
Transcript of A Detailed Urban Road Traffic Emissions Inventory … · Vitor Gois - Raleigh, 16 May 2007 InventAr...

Vitor Gois - Raleigh, 16 May 2007
InventAr
A detailed urban road traffic emissions inventory model using aerial photography
and GPS surveys
Vitor Gois - H. Maciel, L. Nogueira, C. Almeida, P. Torres, S. Mesquita, F. Ferreira
InventAr, Estudos e Projectos Unip, Lda., Portugal.Departamento de Ciências e Engenharia do Ambiente, Universidade Nova de Lisboa, Portugal.Comissão de Coordenação e Desenvolvimento Regional de Lisboa e Vale do Tejo, Portugal.
EPA’s 16th Annual International Emission Inventory Conference
Vitor Gois - Raleigh, 16 May 2007
InventAr
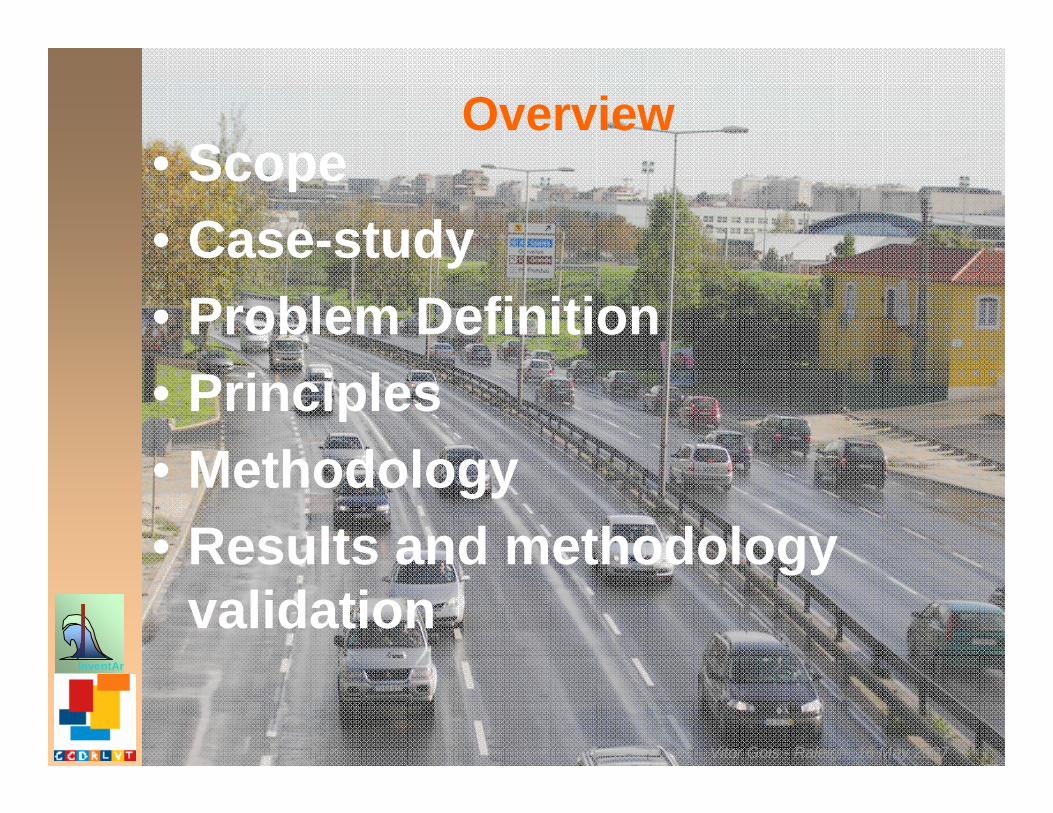
• Scope• Case-study• Problem Definition• Principles• Methodology • Results and methodology
validation
Overview

Vitor Gois - Raleigh, 16 May 2007
InventAr
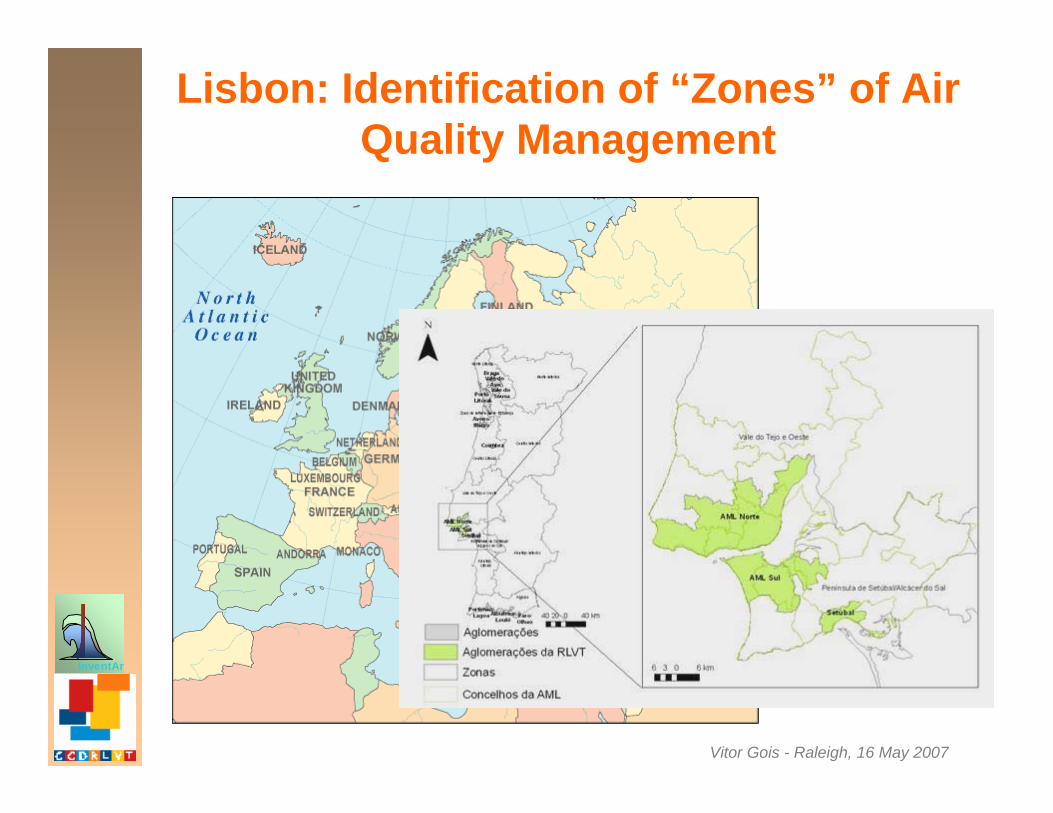
Scope• EU law (Directive 96/62/CE) defines zones, where air quality must be
assessed in detail, using:
– Monitoring stations– Periodic campaigns (e.g. Passive sampling)– Modelling & Air emission inventories
• Air quality problems have been detected in Lisbon area in most recent years
– Particulate matter (PM10): widespread– NO2: confined to traffic hotspots– Ozone in summer
• Particulate levels (PM10) in Lisbon show the highest values in Europe as consequence of:
– Importance of diesel vehicles– Specific meteorological conditions– Road re-suspension– Topographic conditions– Natural events (Saharan dust, forest fires)
Vitor Gois - Raleigh, 16 May 2007
InventAr
Lisbon: Identification of “Zones” of Air Quality Management

Vitor Gois - Raleigh, 16 May 2007
InventAr
Air Quality Problems in recent yearsLisbon area - PM10

Vitor Gois - Raleigh, 16 May 2007
InventAr
Air Quality Problems in recent yearsLisbon area - NO2

Vitor Gois - Raleigh, 16 May 2007
InventAr
Urban Transportation as major contributor to Air Quality
• Road Transport is the dominant factor of PM in Lisbon
– Weekly variation, with maximum values at weekdays especially on Fridays when traffic levels tend to be the highest
– Chemical analysis of particles collected in samplers (55 per cent of particulate matter are originated, directly or indirectly)
– Natural events (Saharan dust outbreaks and forest fires)
OLIVAIS monitoring station(μg/m3 , %) N = 103 days
3,410%
7,421%
13,838%
10,931%
crustal marine aerosol secondary PM road traffic
Av. LIBERDADE monitoring station(μg/m3 , %) N = 49 days
3,29%6,4
17%
14,238%
13,636%
crustal marine aerosol secondary PM road traffic
Vitor Gois - Raleigh, 16 May 2007
InventAr
Air Quality Management Tools under development in Lisbon Region
• Air Quality Management is under responsibility of the
Commission for Coordination and Regional Development of Lisbon and Tagus Valley (CCDR-LVT)
• Policies– Improvement of the monitoring survey system:
• Stationary stations• Extensive monitoring: period campaigns using Passive sampling
(Diffusion tubes and portable PM samplers)– Plans and Programs (June, 2005)
• Identification of measures and policies, mainly traffic related– Modelling tools
• Regional level (TAPM from CSIRO)• European level (Chimere, CAMx, REM-3 under CAFE program)

Vitor Gois - Raleigh, 16 May 2007
InventAr
Definition of the Inventory model• The Air Emission Inventory Model has to consider that:
– Urban road transport MUST be the major component – Air quality problems are very local– A high level of spatial detail is necessary
• Suitable for the scale used in modelling• Considering the scale at which policies and measures are defined
– Affordable costs and low investment• Relying in a small team• Using available data as much as possible• Unfeasible to extend the existing traffic monitoring system
• Main objectives were to gain knowledge:
– How many vehicles are moving at a given place and time– What type of vehicles exist (in movement)– How fast are vehicles moving (time of travel)– How are they moving (topography)

Vitor Gois - Raleigh, 16 May 2007
InventAr
Methodology: General Structure
Length(i)(km)
Car Counting(i)(number of vehicles)
Car Density(i)(vehicles/km)
Speed(i)(km/h)
GPS(i)(km/h)
Path Survey(i)(km/h) TMH(i)
(vehicles/h)
Temporal Correction Factor(i)
Gertrude(i)(traffic data)
TMA(i,f)(vehicles/year)
Vkm(i,k,f)vehic/km
Fleet(k)(%)
FC Factor (i,k,f)(g/km)
EF(i,k,p)(g/km)
Emissions (i,p)(kg/road link)
Road NetworkGIS
Fuel Sales (f)(ton)
Commuters (k,f)(vehic/day) Fuel Consumption
(f)(ton)
Speed(i)(km/h)
i - road linkk - vehicle classf - fuel typep - pollutant
Aerial Photography
Vitor Gois - Raleigh, 16 May 2007
InventAr
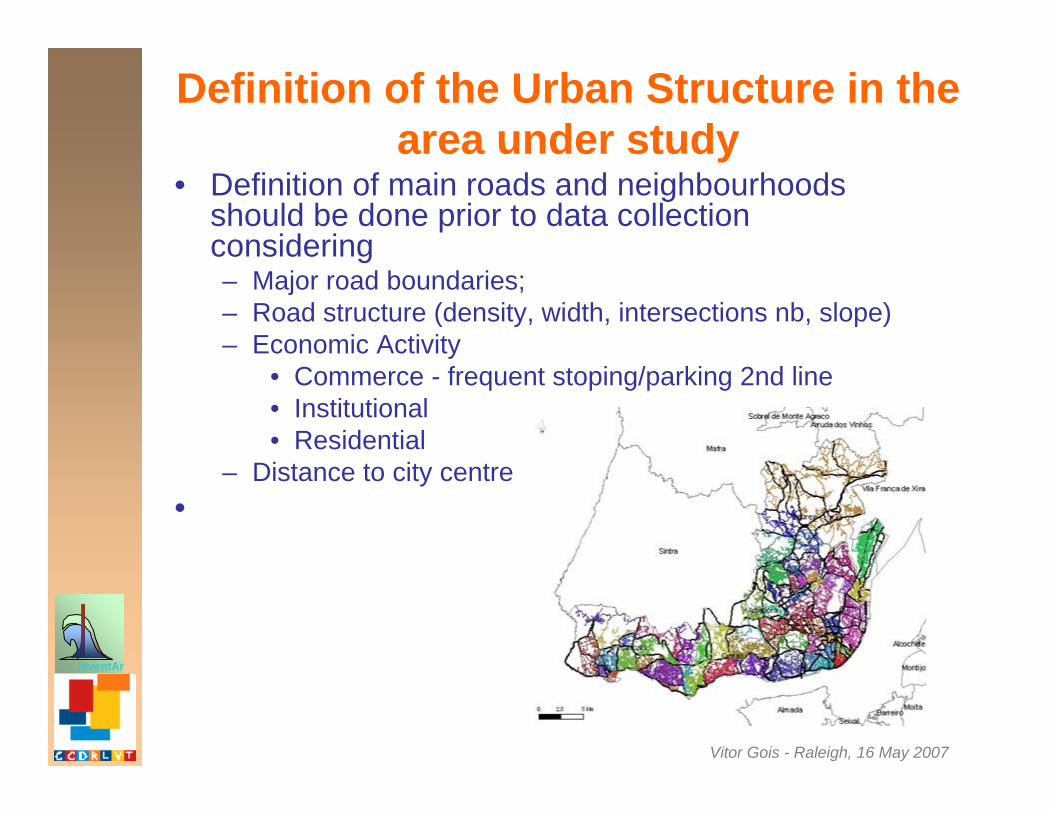
Definition of the Urban Structure in the area under study
• Definition of main roads and neighbourhoods should be done prior to data collection considering– Major road boundaries;– Road structure (density, width, intersections nb, slope)– Economic Activity
• Commerce - frequent stoping/parking 2nd line• Institutional• Residential
– Distance to city centre•

Vitor Gois - Raleigh, 16 May 2007
InventAr
Identification of moving vehicles
Source: Lisbon Municipality

Vitor Gois - Raleigh, 16 May 2007
InventAr
Density of moving vehicles
• 80 000 vehicles identified– 15 % total licenses (Insurance
data) in the area
Vitor Gois - Raleigh, 16 May 2007
InventAr
Speed:Method 1 - Predefined paths
• Path definition– Pre-defined objective points– 3 random paths at 3 different periods
• (Morning, noon, evening)
• Advantages– No special equipment needed– Possible to use in all conditions– Suitable for areas with low car density
• Problems– Low detail– Restricted knowledge of speed variations

Vitor Gois - Raleigh, 16 May 2007
InventAr
Speed: Method 1
1 - Largo do Rato2 - EPAL3 - Cemitério dos Prazeres4 - Cruzamento de Alcântara5 - Palácio das Necessidades6 - Basílica da Estrela
0
10
20
30
40
50
60
0-10
10-2
0
20-3
0
30-4
0
40-5
0
50-6
0
60-7
0
70-8
0
80-9
0
90-1
00
100-
110
110-
120
Spee
d Fr
eque
ncy
%

Vitor Gois - Raleigh, 16 May 2007
InventAr
Speed:Method 2 - GPS
• GPS in vehicle• Rules for test driver
– Keep with main flow– but copy driver behaviour -> objective oriented
travel• E.g. Service Stations, Museums
• Data acquisition problems in narrow roads with tall buildings

Vitor Gois - Raleigh, 16 May 2007
InventAr
Speed HistogramsUrban and Sub-urban areas
Cascais
0.0%
5.0%
10.0%
15.0%
20.0%
0 - 1
0
20 -
30
40 -
50
60 -
70
80 -
90
100
- 110
120
- 130
140
- 150
km/h
Lisboa
0.0%
10.0%
20.0%
30.0%
40.0%
50.0%0
- 10
20 -
30
40 -
50
60 -
70
80 -
90
100
- 110
120
- 130
140
- 150
km/h
Municipality Main roads Secondary roadsCascais 39.4 28.2Oeiras 49.2 28.3Lisboa 25.1 28.1Amadora 48.6 24.4Odivelas 33.9 27.5Loures 52.7 39.8
Vitor Gois - Raleigh, 16 May 2007
InventAr
Emission Factors
• Base - > EMEP/CORINAIR (EEA, 2002)– Based on extensive monitoring and database– Variables
• Vehicle type, age, fuel, technology, engine size• Vehicle speed per link• Road gradient• Vehicle wear• Non-exhaust emissions

Vitor Gois - Raleigh, 16 May 2007
InventAr
Characterization of the Fleet(Moving Vehicles)
• Methodology (Torres et al, 2006)– Survey/questionnaire in
• Traffic lights• Parking
– Questions• Age (license date)• Vehicle type: PC, LDV, HDV, Bus, 2w, mopeds• Fuel type: gasoline, diesel, LPG, Natural Gas• Engine size (c.c.)• Mileage (km)• Mobile Air Conditioner
• 17 800 results (5.6% vehicles registered in insurance companies)

Vitor Gois - Raleigh, 16 May 2007
InventAr
Fleet: Results
PassCar79%
LDV12% HDV
4% Bus2% Moped
1%Moto_4t
2%
0
20
40
60
80
100
120
0-1
1-2
2-3
3-4
4-5
5-6
6-7
7-8
8-9
9-10
10-1
1
11-1
2
12-1
3
13-1
4
14-1
5
15-1
6
16-1
7
17-1
8
18-1
9
19-2
0
20-2
1
21-2
2
22-2
3
23-2
4
24-2
5
>25
age
Per
cen
t of v
ehic
les
Light Vehicles Heavy Vehicles

Vitor Gois - Raleigh, 16 May 2007
InventAr
Emission Factors for a normalized vehicle
y = 0.0000000041991x6 - 0.0000017227623x 5 + 0.0002769847078x4 - 0.0220572694394x3 + 0.9163300293065x2 - 19.6391104069688x + 253.8422015941410
R 2 = 0.9912804495488
0.000
20.000
40.000
60.000
80.000
100.000
120.000
140.000
160.000
180.000
200.000
0 20 40 60 80 100 120 140
vel (km/h )
g/km
F C P oly. (FC)
y = 0.00000000000189745x6 - 0.00000000079325011x5 + 0.00000013102685701x 4 - 0.00001087088226117x 3 + 0. 00049295664148869x2 - 0.01275310043676920x + 0.20095104605219900
R 2 = 0.99866235527923600
0.000
0.020
0.040
0.060
0.080
0.100
0.120
0.140
0.160
0 20 40 60 80 100 120 140
vel (km/h)
g/km
PST Poly. (PST)

Vitor Gois - Raleigh, 16 May 2007
InventAr
Time Variation• tFAC - Hourly to daily traffic volume
– 11h-14 h -> Annual Daily Average– 10 representative GERTRUDE traffic monitoring
stations• Working Days + Weekends
– TFac = TMDA/TMDAw * TMDAw/TMD11h-14h– TFac = 0.88 * 16 = 14.6
0
2
4
6
8
10
12
14
16
00:0
0
02:0
0
04:0
0
06:0
0
08:0
0
10:0
0
12:0
0
14:0
0
16:0
0
18:0
0
20:0
0
22:0
0Hou
rly
Tra
ffic
as p
erce
ntag
e of
dai
ly fl
ow (%
)
Vitor Gois - Raleigh, 16 May 2007
InventAr
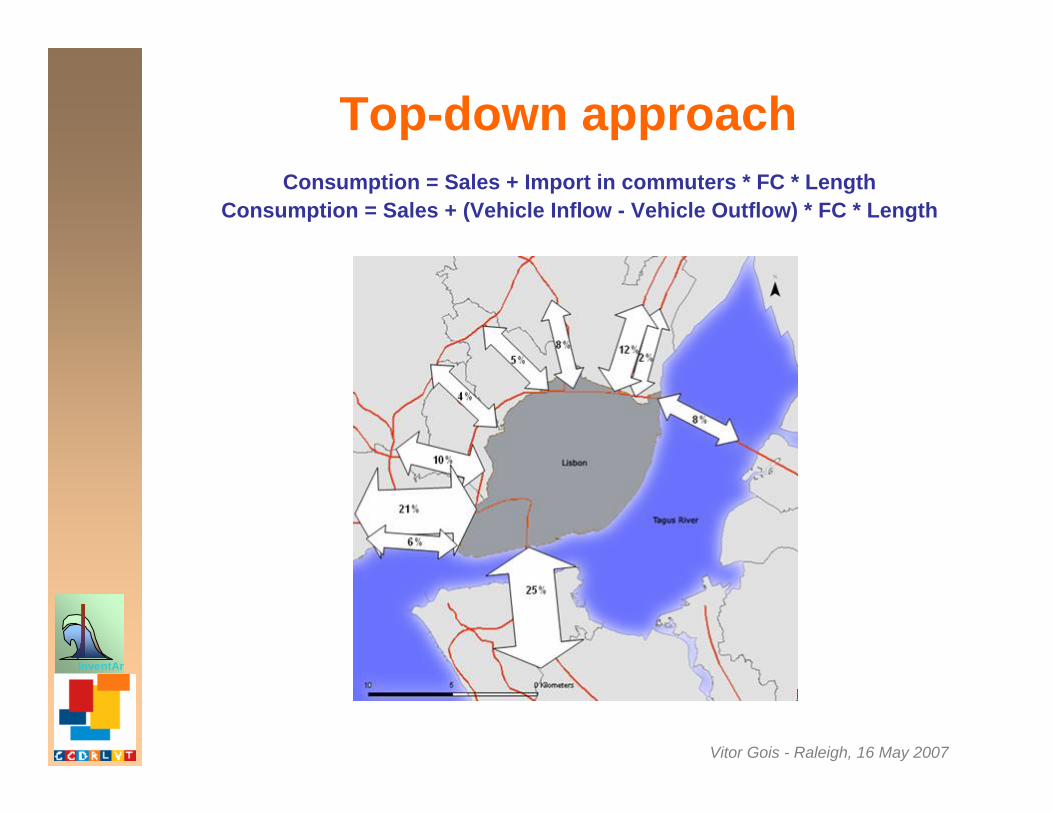
Top-down approachConsumption = Sales + Import in commuters * FC * Length
Consumption = Sales + (Vehicle Inflow - Vehicle Outflow) * FC * Length

Vitor Gois - Raleigh, 16 May 2007
InventAr
Results: NOx
Vitor Gois - Raleigh, 16 May 2007
InventAr
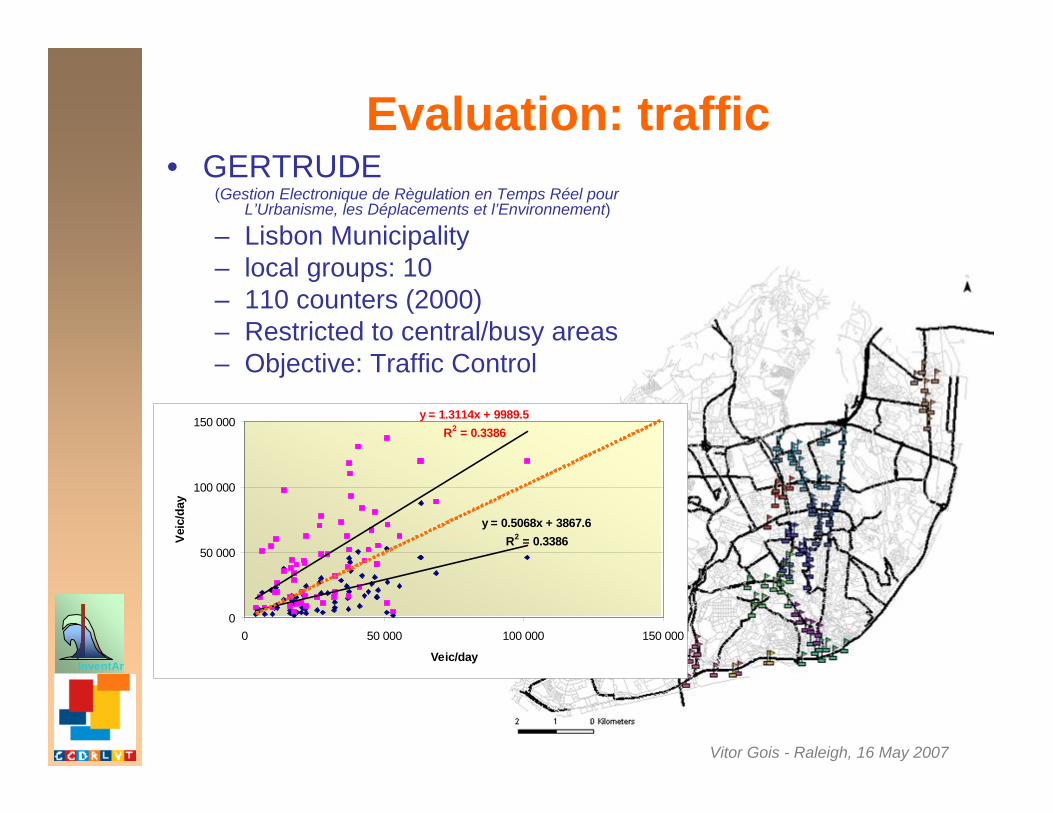
Evaluation: traffic• GERTRUDE
(Gestion Electronique de Règulation en Temps Réel pour L’Urbanisme, les Déplacements et l’Environnement)
– Lisbon Municipality– local groups: 10– 110 counters (2000)– Restricted to central/busy areas– Objective: Traffic Control
y = 0.5068x + 3867.6R2 = 0.3386
y = 1.3114x + 9989.5R2 = 0.3386
0
50 000
100 000
150 000
0 50 000 100 000 150 000
Veic/day
Veic
/day
Vitor Gois - Raleigh, 16 May 2007
InventAr
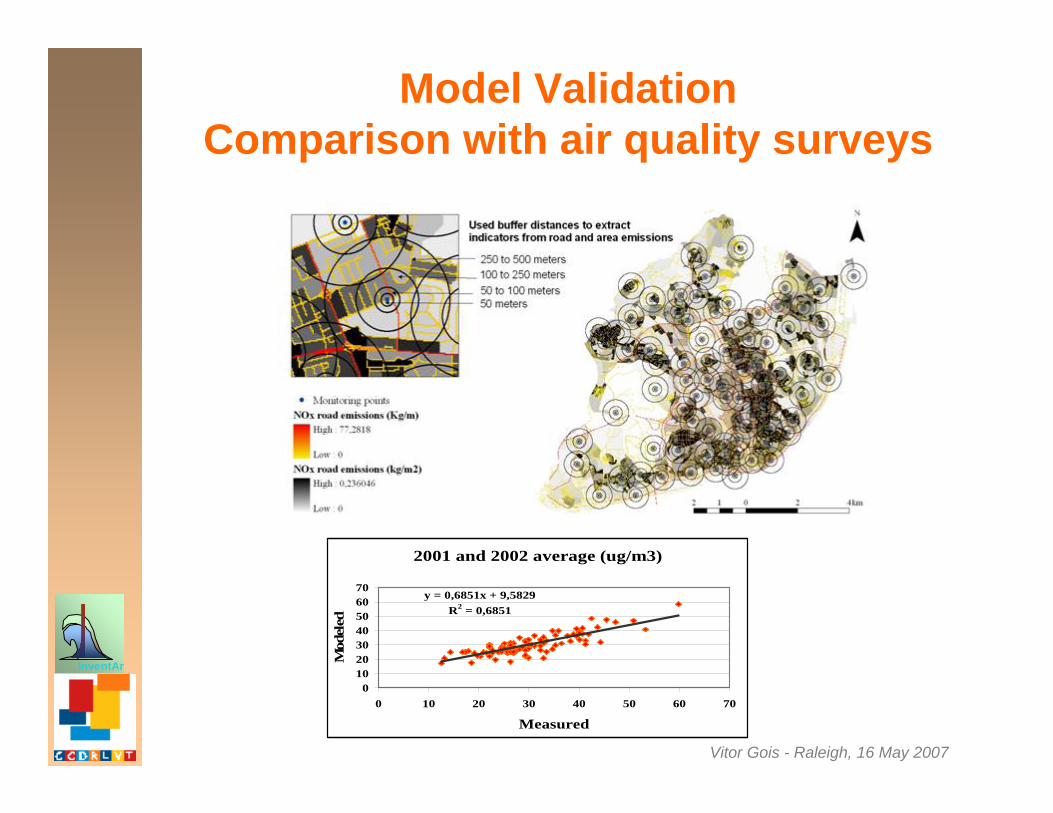
Model Validation Comparison with air quality surveys
2001 and 2002 average (ug/m3)
y = 0,6851x + 9,5829R2 = 0,6851
010203040506070
0 10 20 30 40 50 60 70
Measured
Mod
eled
Vitor Gois - Raleigh, 16 May 2007
InventAr
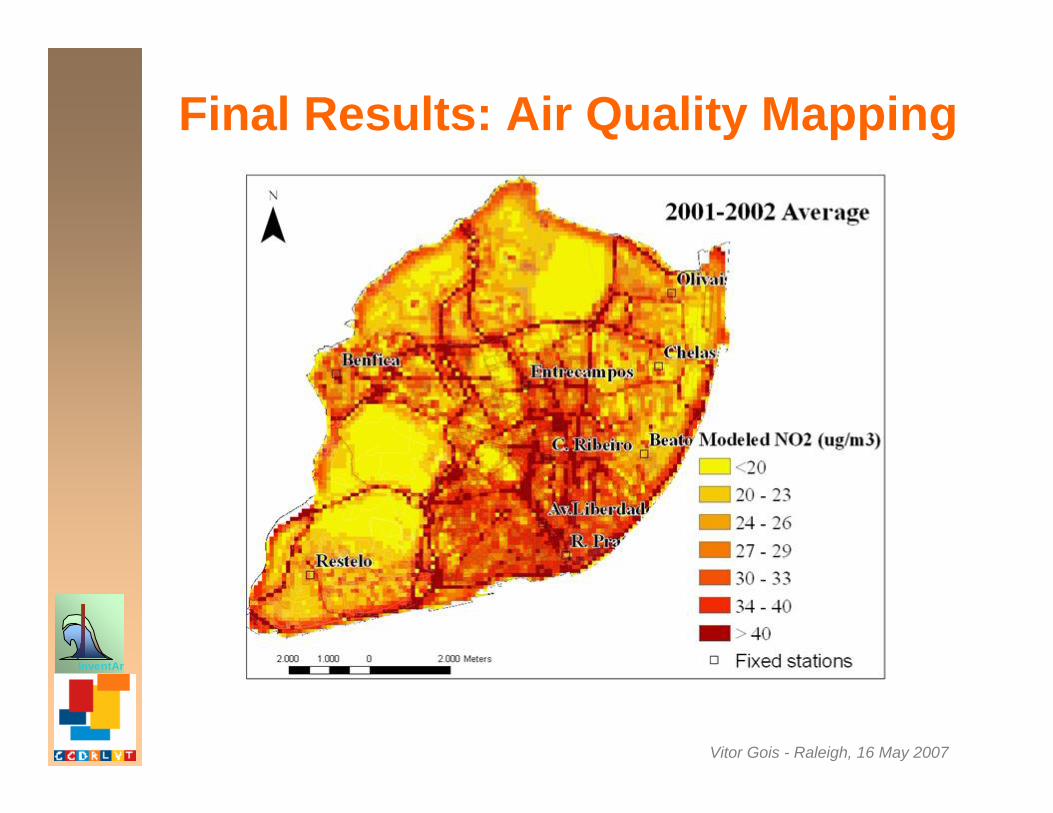
Final Results: Air Quality Mapping

Vitor Gois - Raleigh, 16 May 2007
InventAr
Conclusions• Conclusions
– Methodology is feasible– Comparison to air quality surveys shows good
possibilities– Relatively inexpensive
• Main costs are GPS survey and characterization of the fleet
– Appropriate for diverse media• Central urban areas and sub-urban areas
– Several potential uses beyond air emission inventories

Vitor Gois - Raleigh, 16 May 2007
InventAr
Thank you
InventAr