
A Capacity Planning Model for Microgrids in Rural...
35
A Capacity Planning Model for Microgrids in Rural India Arkasama Bandyopadhyay*, Katrina Ramirez-Meyers, Enakshi D. Wikramanayake, Benjamin D. Leibowicz, Michael E. Webber, Vaibhav Bahadur 41 st IAEE International Conference, Groningen, Netherlands June 12, 2018 *Presenting author
Transcript of A Capacity Planning Model for Microgrids in Rural...
A Capacity Planning Model for
Microgrids in Rural India
Arkasama Bandyopadhyay*, Katrina Ramirez-Meyers,
Enakshi D. Wikramanayake, Benjamin D. Leibowicz,
Michael E. Webber, Vaibhav Bahadur
41st IAEE International Conference, Groningen, Netherlands
June 12, 2018
*Presenting author
Arkasama Bandyopadhyay| A Capacity Planning Model of Microgrids in Rural India 2June 12, 2018
Outline
• Background
• Goals
• Methods
• Results and Discussion
• Future Work
• Conclusion
Arkasama Bandyopadhyay| A Capacity Planning Model of Microgrids in Rural India 3June 12, 2018
Outline
• Background
• Goals
• Methods
• Results and Discussion
• Future Work
• Conclusion
Arkasama Bandyopadhyay| A Capacity Planning Model of Microgrids in Rural India 4June 12, 2018
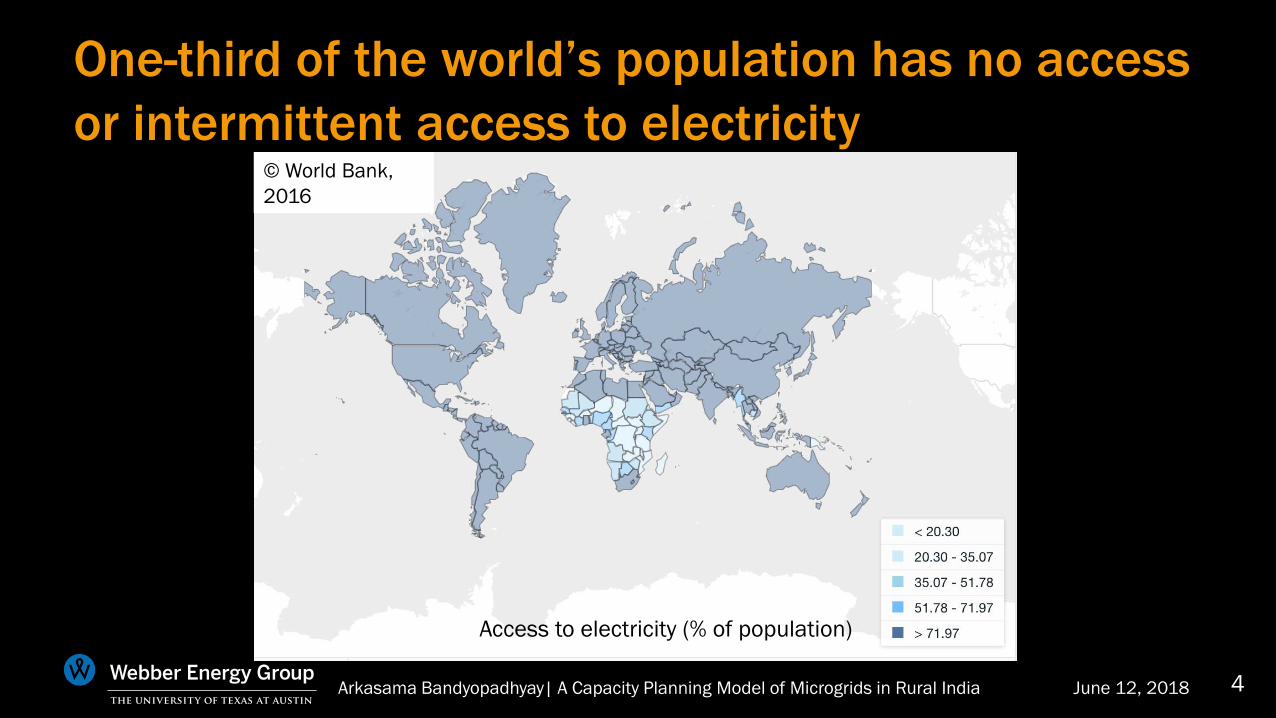
One-third of the world’s population has no access
or intermittent access to electricity© World Bank,
2016
Access to electricity (% of population)
Arkasama Bandyopadhyay| A Capacity Planning Model of Microgrids in Rural India 5June 12, 2018
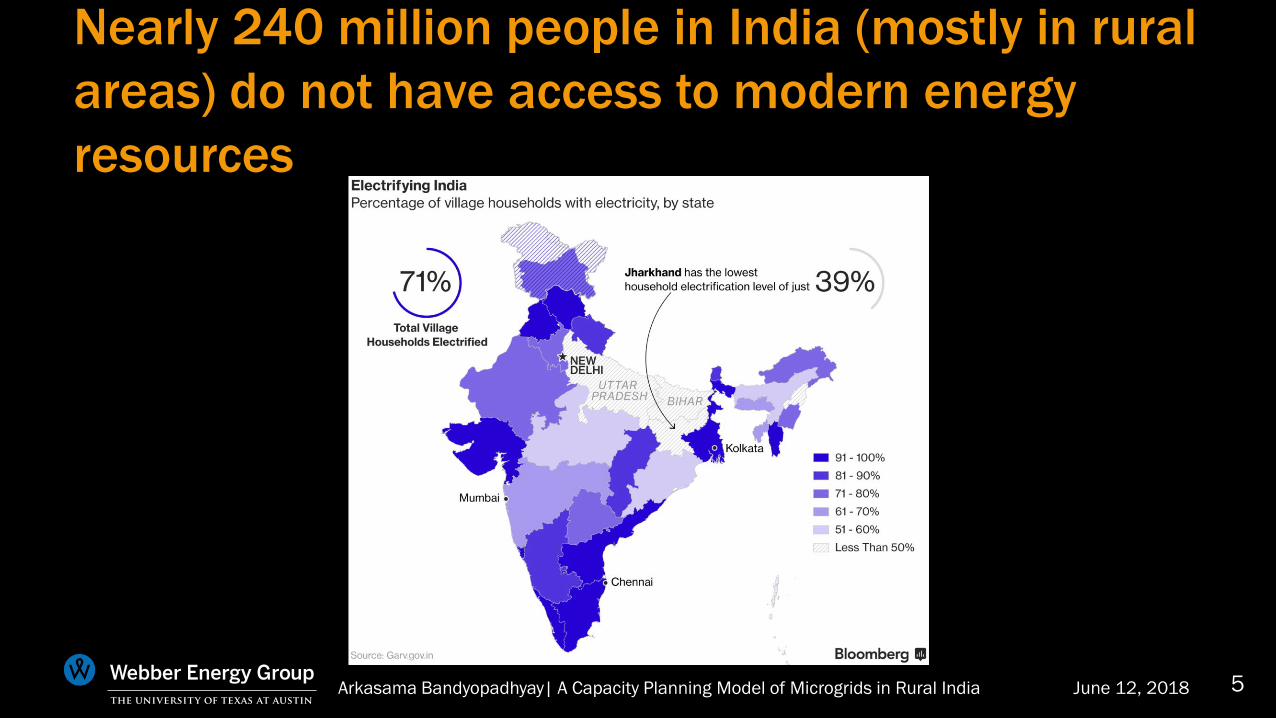
Nearly 240 million people in India (mostly in rural
areas) do not have access to modern energy
resources
Arkasama Bandyopadhyay| A Capacity Planning Model of Microgrids in Rural India 6June 12, 2018
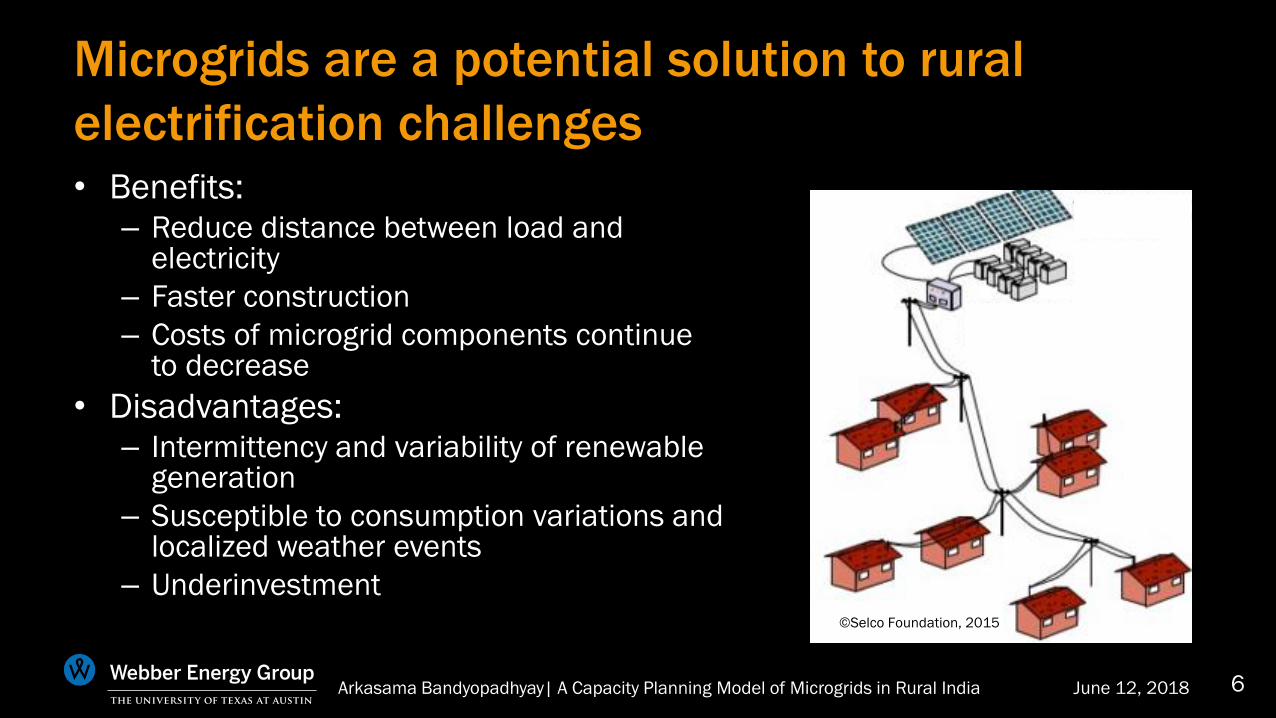
Microgrids are a potential solution to rural
electrification challenges• Benefits:
– Reduce distance between load and electricity
– Faster construction
– Costs of microgrid components continue to decrease
• Disadvantages:– Intermittency and variability of renewable
generation
– Susceptible to consumption variations and localized weather events
– Underinvestment©Selco Foundation, 2015
Arkasama Bandyopadhyay| A Capacity Planning Model of Microgrids in Rural India 7June 12, 2018
Outline
• Background
• Goals
• Methods
• Results and Discussion
• Future Work
• Conclusion
Arkasama Bandyopadhyay| A Capacity Planning Model of Microgrids in Rural India 8June 12, 2018
This study creates a tool for capacity planning
and cost minimization
• Encourages community involvement in planning
• Easily modified monthly bottom-up demand profiles
• Tool developed is not software-specific
• Can be used by private or government investors
• Can be applied to any region with low electrification levels
Arkasama Bandyopadhyay| A Capacity Planning Model of Microgrids in Rural India 9June 12, 2018
Outline
• Background
• Goals
• Methods
• Results and Discussion
• Future Work
• Conclusion
Arkasama Bandyopadhyay| A Capacity Planning Model of Microgrids in Rural India 10June 12, 2018
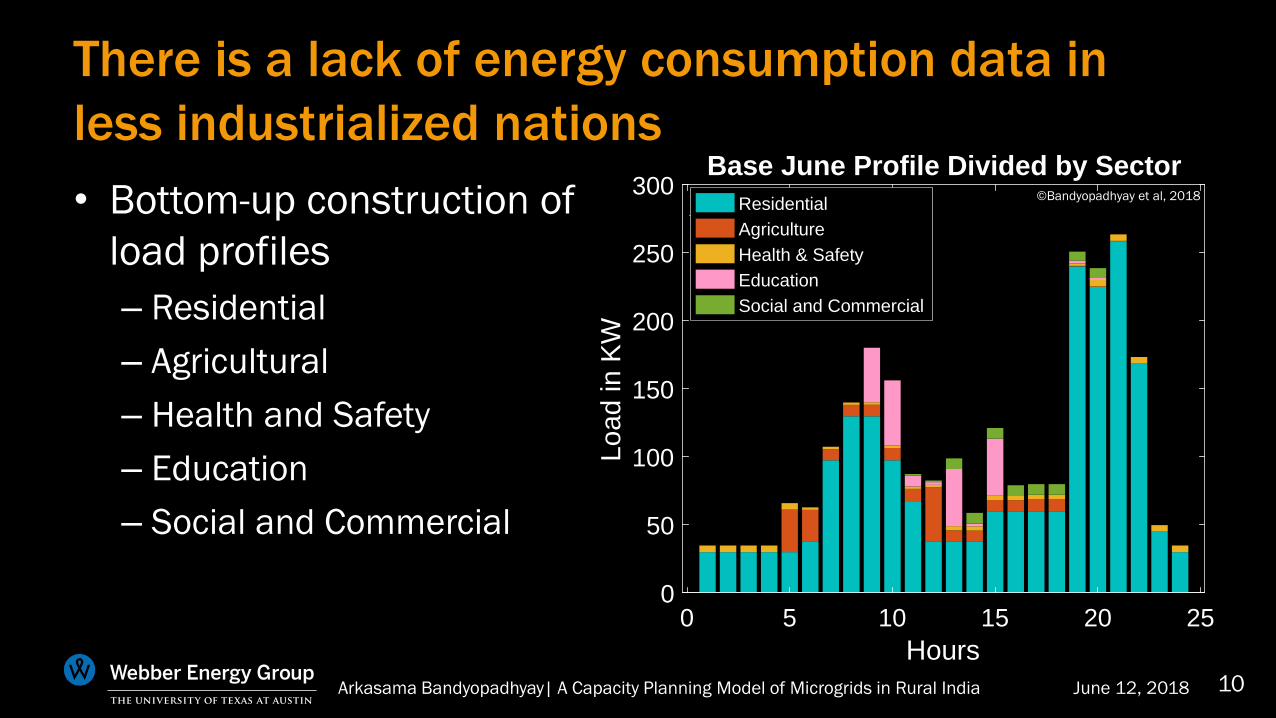
There is a lack of energy consumption data in
less industrialized nations
• Bottom-up construction of
load profiles
– Residential
– Agricultural
– Health and Safety
– Education
– Social and Commercial
Base June Profile Divided by Sector
0 5 10 15 20 25
Hours
0
50
100
150
200
250
300
Lo
ad
in
KW
Residential
Agriculture
Health & Safety
Education
Social and Commercial
©Bandyopadhyay et al, 2018Base June Profile Divided by Sector
0 5 10 15 20 25
Hours
0
50
100
150
200
250
300
Lo
ad
in
KW
Residential
Agriculture
Health & Safety
Education
Social and Commercial
Arkasama Bandyopadhyay| A Capacity Planning Model of Microgrids in Rural India 11June 12, 2018
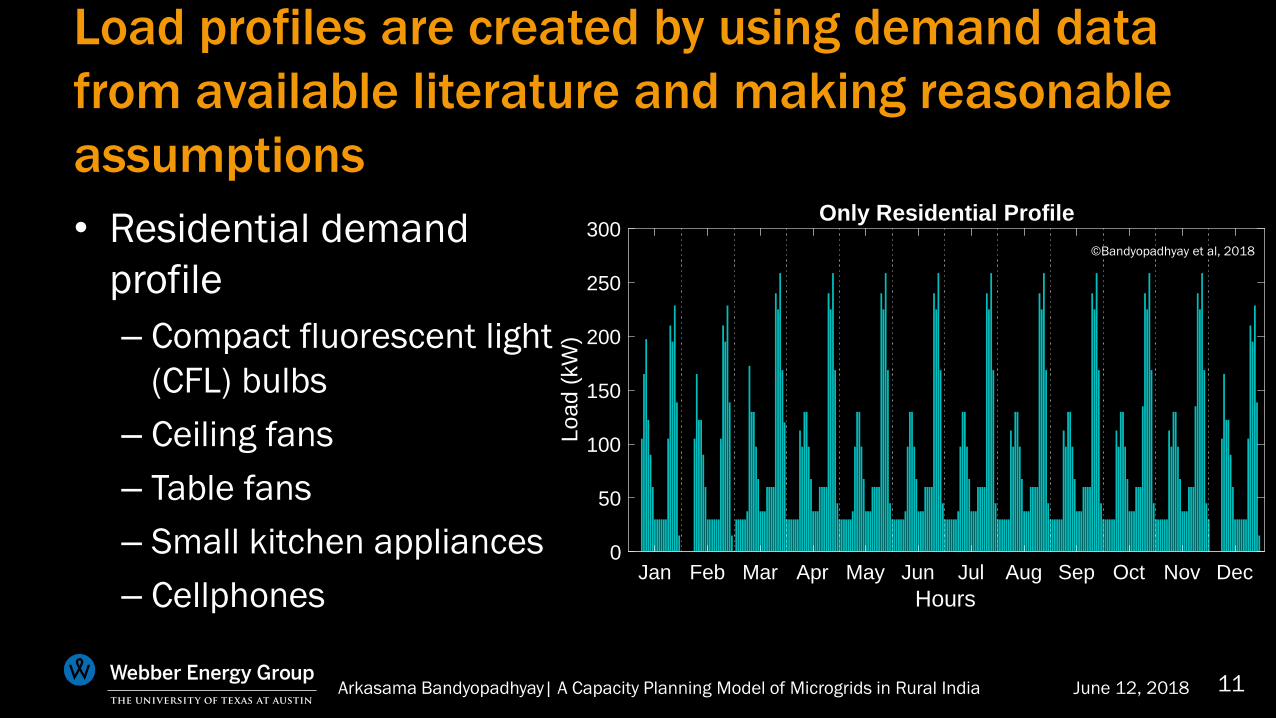
Load profiles are created by using demand data
from available literature and making reasonable
assumptions
• Residential demand
profile
– Compact fluorescent light
(CFL) bulbs
– Ceiling fans
– Table fans
– Small kitchen appliances
– Cellphones
Only Residential Profile
Jan Feb Mar Apr May Jun Jul Aug Sep Oct Nov Dec
Hours
0
50
100
150
200
250
300
Lo
ad
(kW
)
©Bandyopadhyay et al, 2018

Arkasama Bandyopadhyay| A Capacity Planning Model of Microgrids in Rural India 12June 12, 2018
• Agricultural demand
profile
– Water pump
– Irrigation pump
– Medium-sized rice mill
There has been a significant increase in the rate
mechanization of agriculture in rural India over
the past decade Only Agriculture Profile
Jan Feb Mar Apr May Jun Jul Aug Sep Oct Nov Dec
Hours
0
10
20
30
40
Lo
ad
(kW
)
©Bandyopadhyay et al, 2018
Arkasama Bandyopadhyay| A Capacity Planning Model of Microgrids in Rural India 13June 12, 2018
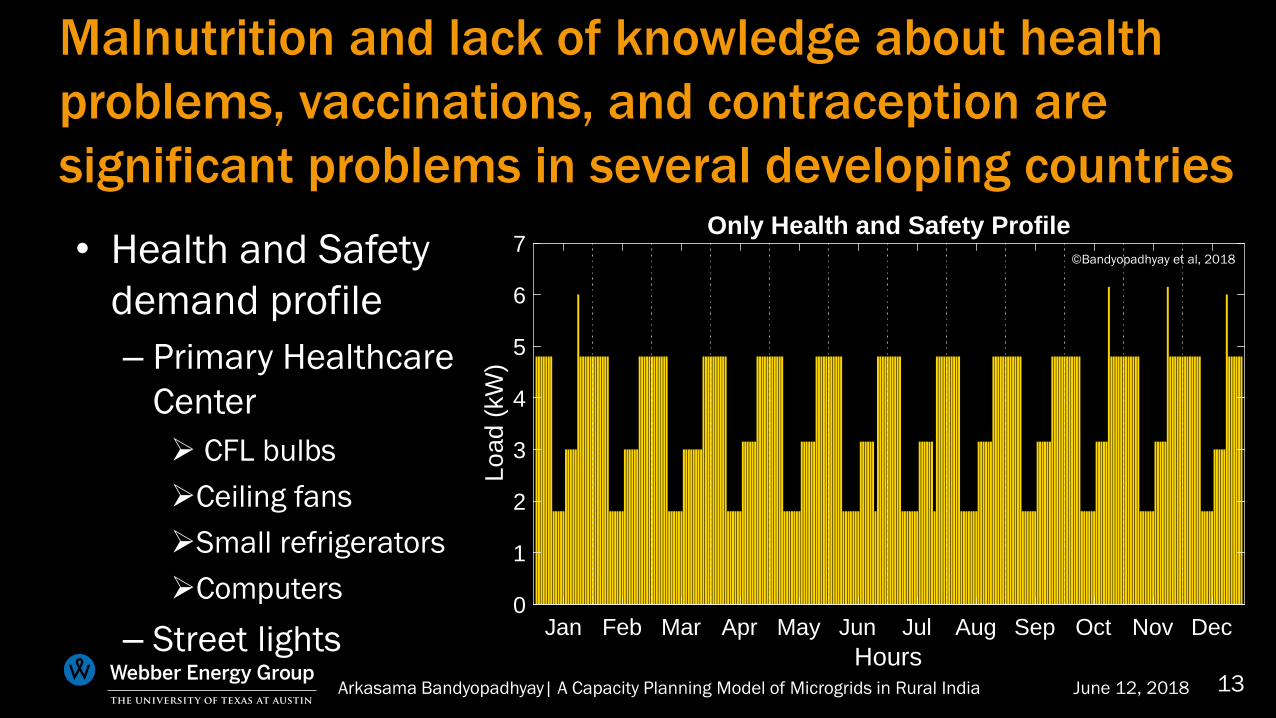
Malnutrition and lack of knowledge about health
problems, vaccinations, and contraception are
significant problems in several developing countries
• Health and Safety
demand profile
– Primary Healthcare
Center
CFL bulbs
Ceiling fans
Small refrigerators
Computers
– Street lights
Only Health and Safety Profile
Jan Feb Mar Apr May Jun Jul Aug Sep Oct Nov Dec
Hours
0
1
2
3
4
5
6
7
Lo
ad
(kW
)
©Bandyopadhyay et al, 2018
Arkasama Bandyopadhyay| A Capacity Planning Model of Microgrids in Rural India 14June 12, 2018
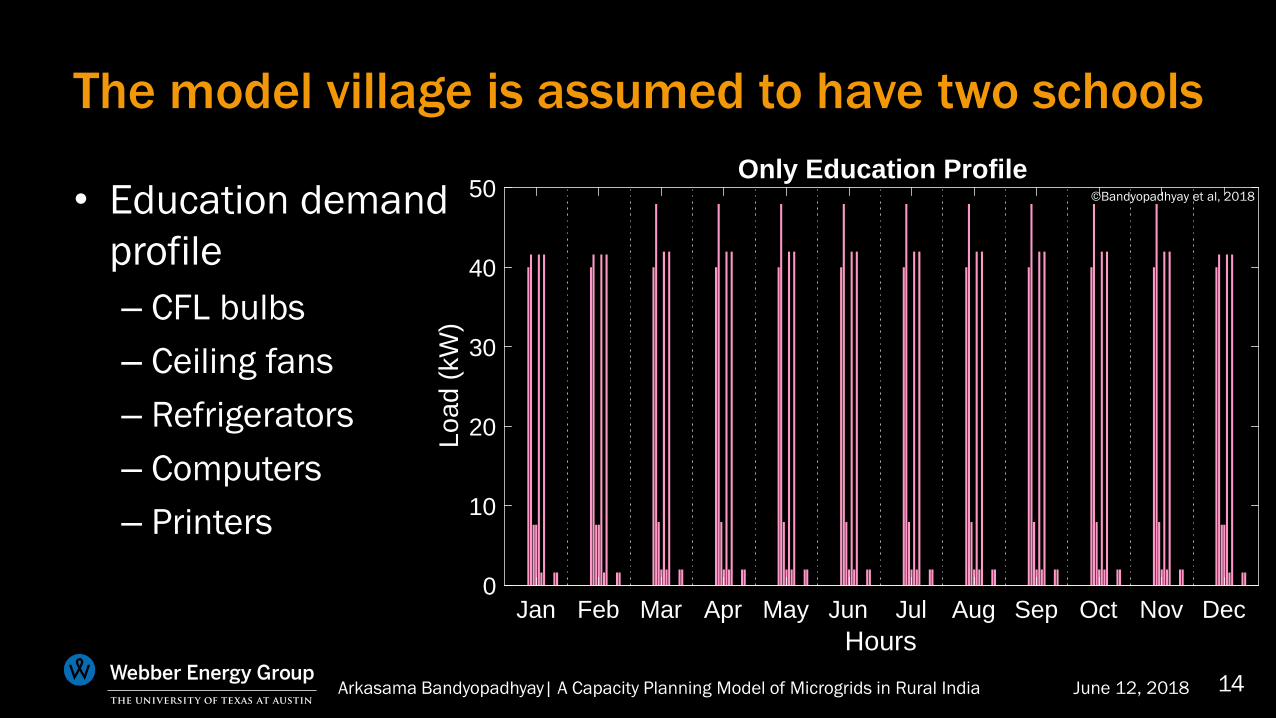
The model village is assumed to have two schools
• Education demand
profile
– CFL bulbs
– Ceiling fans
– Refrigerators
– Computers
– Printers
Only Education Profile
Jan Feb Mar Apr May Jun Jul Aug Sep Oct Nov Dec
Hours
0
10
20
30
40
50
Lo
ad
(kW
)
©Bandyopadhyay et al, 2018
Arkasama Bandyopadhyay| A Capacity Planning Model of Microgrids in Rural India 15June 12, 2018
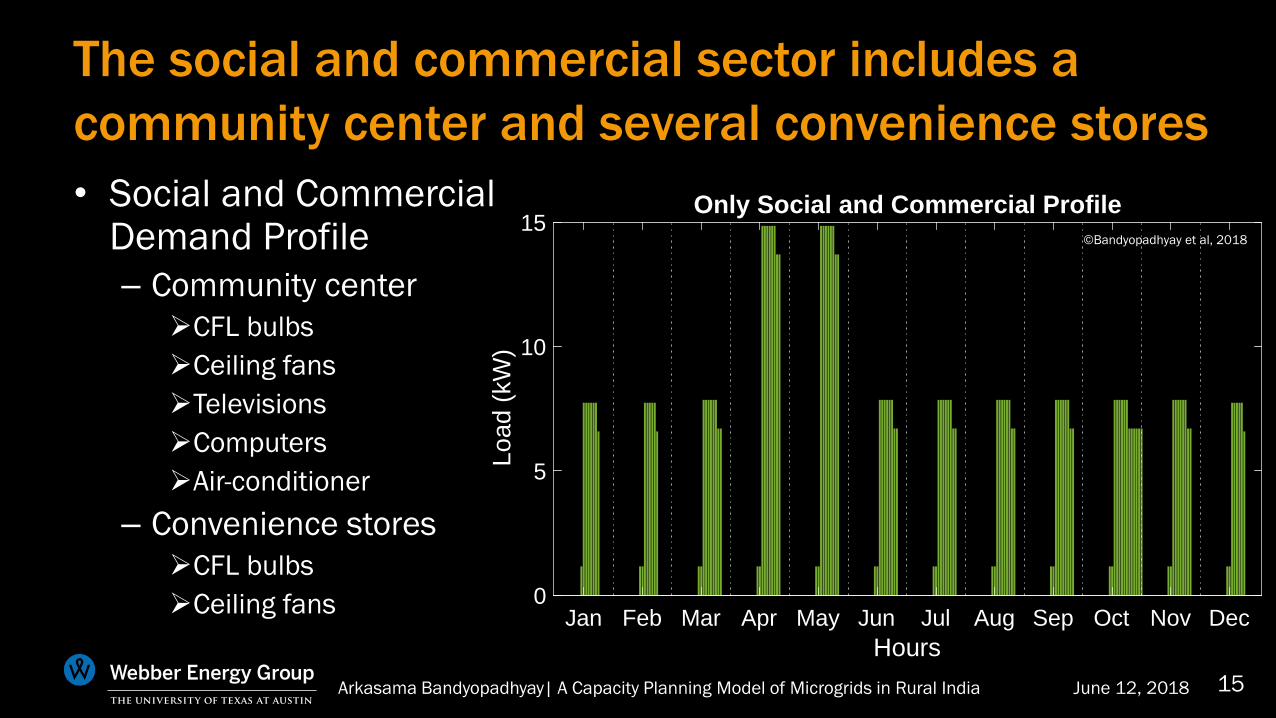
The social and commercial sector includes a
community center and several convenience stores
• Social and Commercial Demand Profile
– Community center
CFL bulbs
Ceiling fans
Televisions
Computers
Air-conditioner
– Convenience stores
CFL bulbs
Ceiling fans
Only Social and Commercial Profile
Jan Feb Mar Apr May Jun Jul Aug Sep Oct Nov Dec
Hours
0
5
10
15
Lo
ad
(kW
)
©Bandyopadhyay et al, 2018
Arkasama Bandyopadhyay| A Capacity Planning Model of Microgrids in Rural India 16June 12, 2018
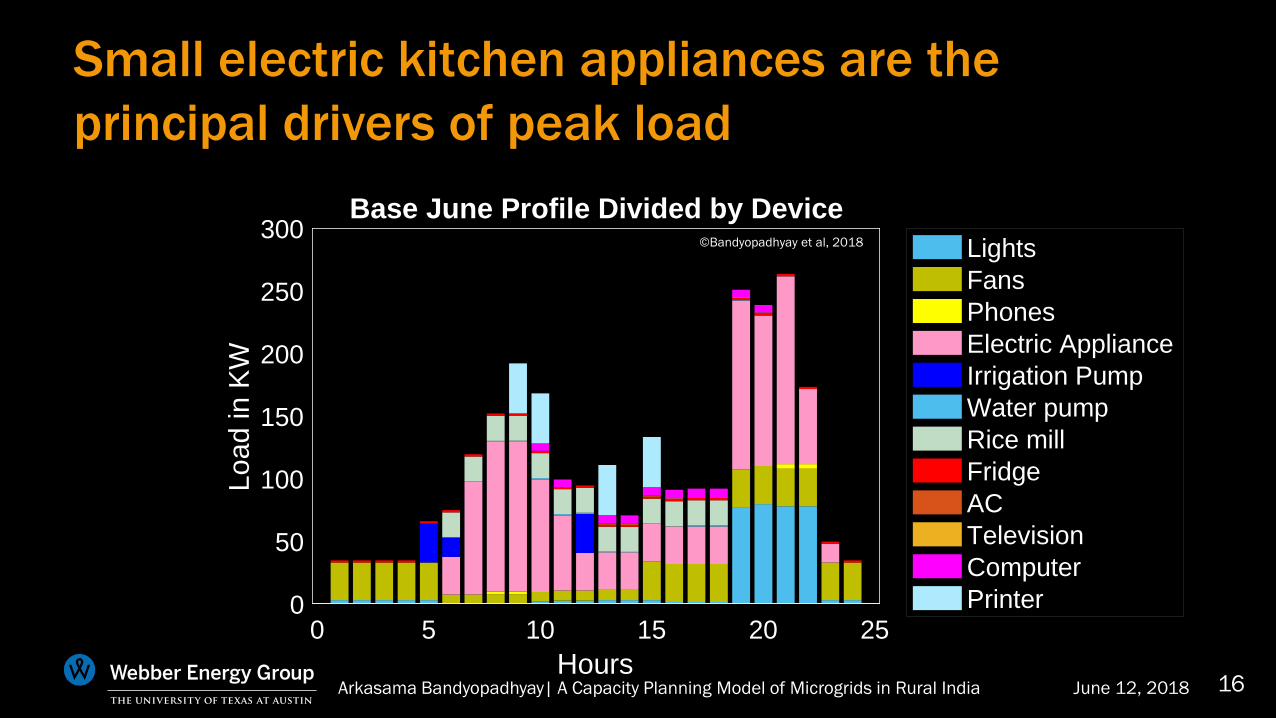
Small electric kitchen appliances are the
principal drivers of peak load
Base June Profile Divided by Device
0 5 10 15 20 25
Hours
0
50
100
150
200
250
300Lo
ad
in K
WLights
Fans
Phones
Electric Appliance
Irrigation Pump
Water pump
Rice mill
Fridge
AC
Television
Computer
Printer
©Bandyopadhyay et al, 2018
Arkasama Bandyopadhyay| A Capacity Planning Model of Microgrids in Rural India 17June 12, 2018
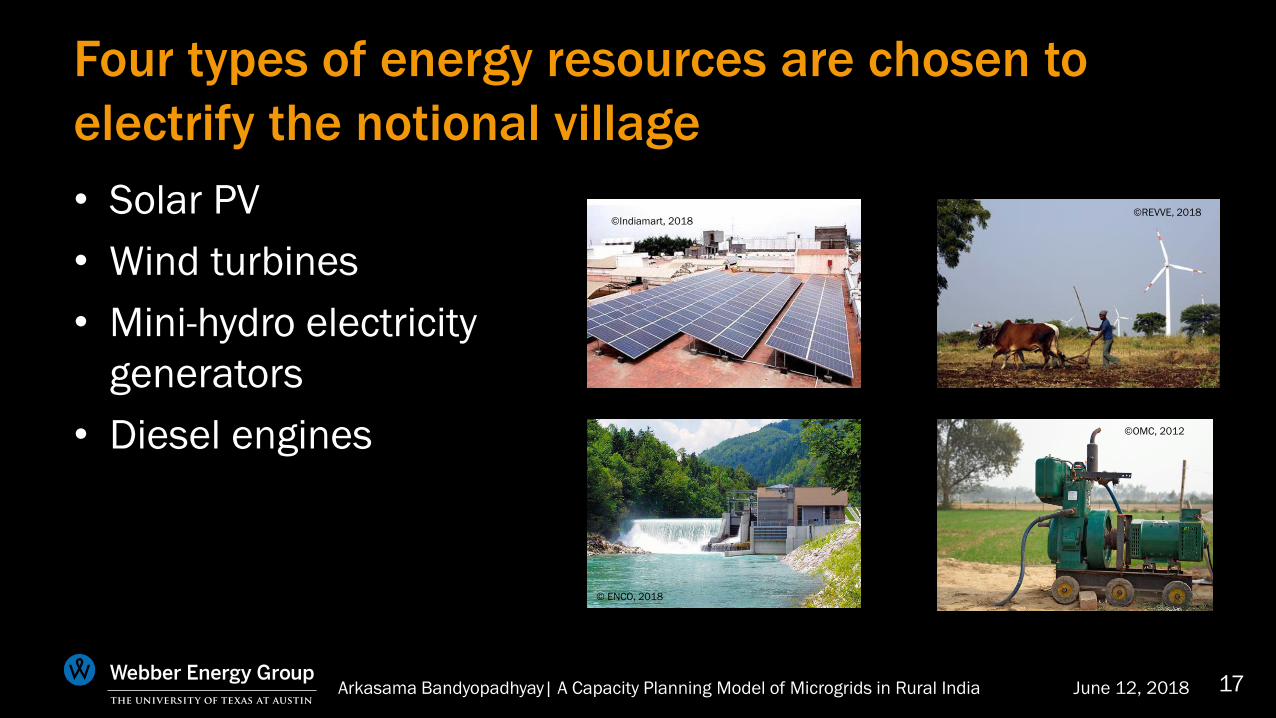
Four types of energy resources are chosen to
electrify the notional village
• Solar PV
• Wind turbines
• Mini-hydro electricity
generators
• Diesel engines ©OMC, 2012
© ENCO, 2018
©Indiamart, 2018©REVVE, 2018
Arkasama Bandyopadhyay| A Capacity Planning Model of Microgrids in Rural India 18June 12, 2018
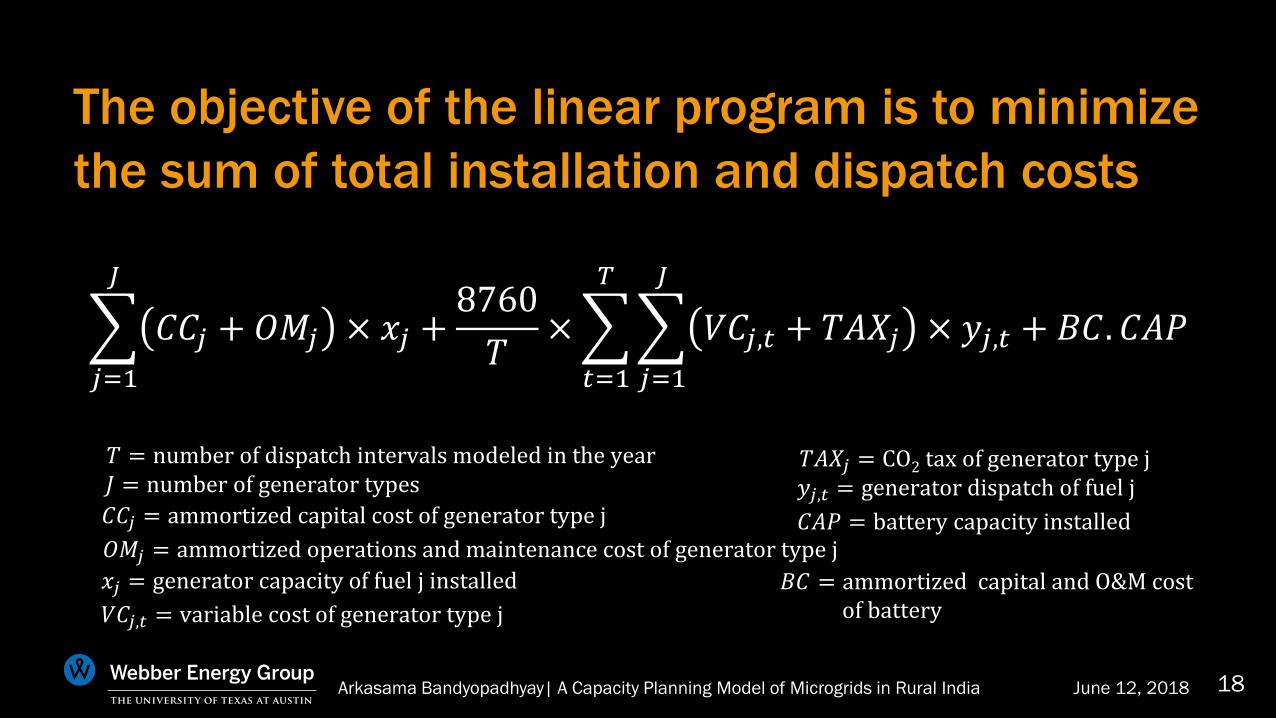
The objective of the linear program is to minimize
the sum of total installation and dispatch costs
𝑗=1
𝐽
𝐶𝐶𝑗 + 𝑂𝑀𝑗 × 𝑥𝑗 +8760
𝑇×
𝑡=1
𝑇
𝑗=1
𝐽
𝑉𝐶𝑗,𝑡 + 𝑇𝐴𝑋𝑗 × 𝑦𝑗,𝑡 + 𝐵𝐶. 𝐶𝐴𝑃
𝑇 = number of dispatch intervals modeled in the year𝐽 = number of generator types
𝐶𝐶𝑗 = ammortized capital cost of generator type j
𝑂𝑀𝑗 = ammortized operations and maintenance cost of generator type j
𝑥𝑗 = generator capacity of fuel j installed
𝑉𝐶𝑗,𝑡 = variable cost of generator type j
𝑇𝐴𝑋𝑗 = CO2 tax of generator type j𝑦𝑗,𝑡 = generator dispatch of fuel j
𝐵𝐶 = ammortized capital and O&M costof battery
𝐶𝐴𝑃 = battery capacity installed
Arkasama Bandyopadhyay| A Capacity Planning Model of Microgrids in Rural India 19June 12, 2018
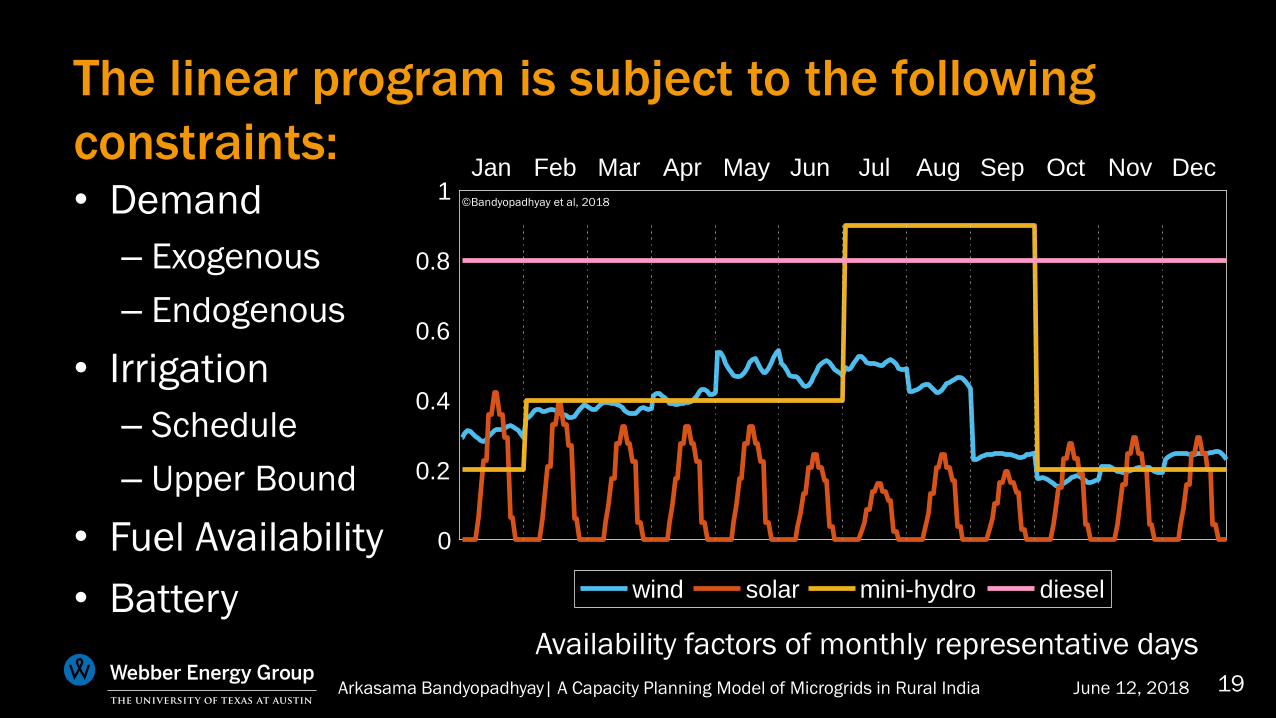
The linear program is subject to the following
constraints:• Demand
– Exogenous
– Endogenous
• Irrigation
– Schedule
– Upper Bound
• Fuel Availability
• BatteryAvailability factors of monthly representative days
Jan Feb Mar Apr May Jun Jul Aug Sep Oct Nov Dec
0
0.2
0.4
0.6
0.8
1
wind solar mini-hydro diesel
©Bandyopadhyay et al, 2018
Arkasama Bandyopadhyay| A Capacity Planning Model of Microgrids in Rural India 20June 12, 2018
Outline
• Background
• Goals
• Methods
• Results and Discussion
• Future Work
• Conclusion
Arkasama Bandyopadhyay| A Capacity Planning Model of Microgrids in Rural India 21June 12, 2018
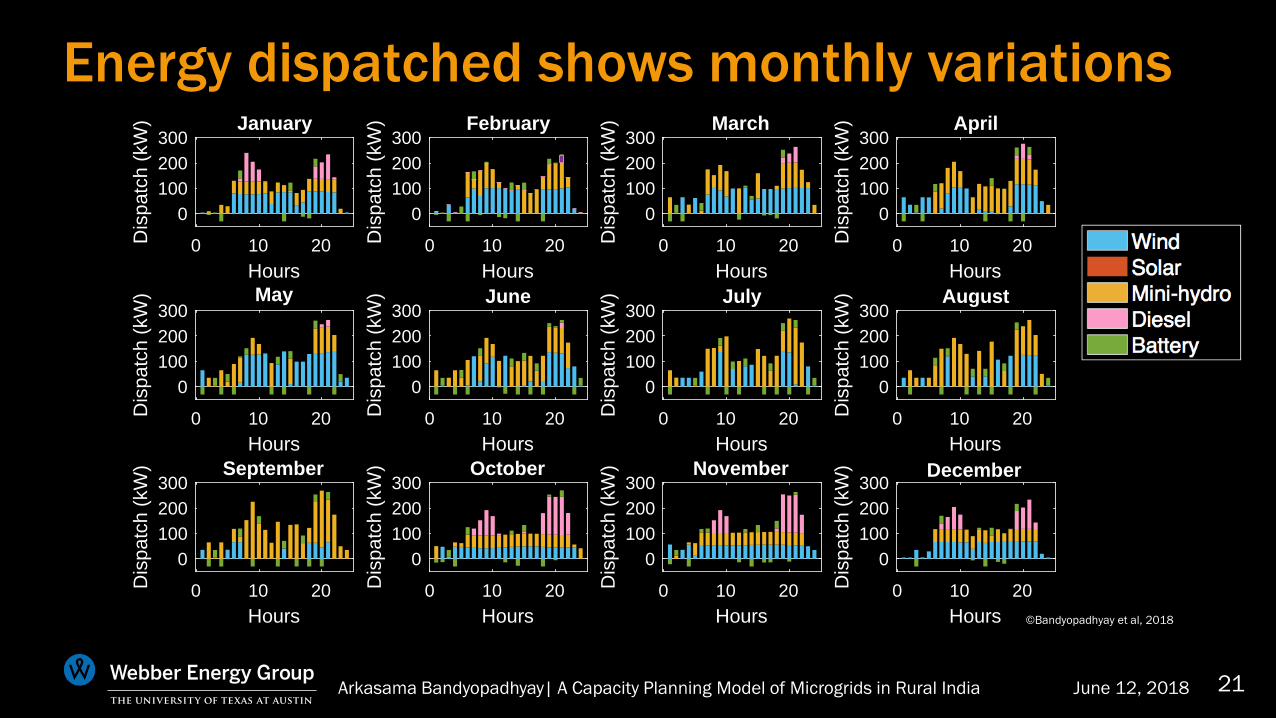
Energy dispatched shows monthly variations January
0 10 20
Hours
0
100
200
300D
isp
atc
h (
kW
) February
0 10 20
Hours
0
100
200
300
Dis
patc
h (
kW
) March
0 10 20
Hours
0
100
200
300
Dis
patc
h (
kW
) April
0 10 20
Hours
0
100
200
300
Dis
patc
h (
kW
)
May
0 10 20
Hours
0
100
200
300
Dis
pa
tch
(kW
) June
0 10 20
Hours
0
100
200
300
Dis
pa
tch
(kW
) July
0 10 20
Hours
0
100
200
300
Dis
pa
tch
(kW
) August
0 10 20
Hours
0
100
200
300
Dis
pa
tch
(kW
)
September
0 10 20
Hours
0
100
200
300
Dis
pa
tch (
kW
) October
0 10 20
Hours
0
100
200
300
Dis
pa
tch (
kW
) November
0 10 20
Hours
0
100
200
300
Dis
pa
tch (
kW
) December
0 10 20
Hours
0
100
200
300
Dis
pa
tch (
kW
)
©Bandyopadhyay et al, 2018
Arkasama Bandyopadhyay| A Capacity Planning Model of Microgrids in Rural India 22June 12, 2018
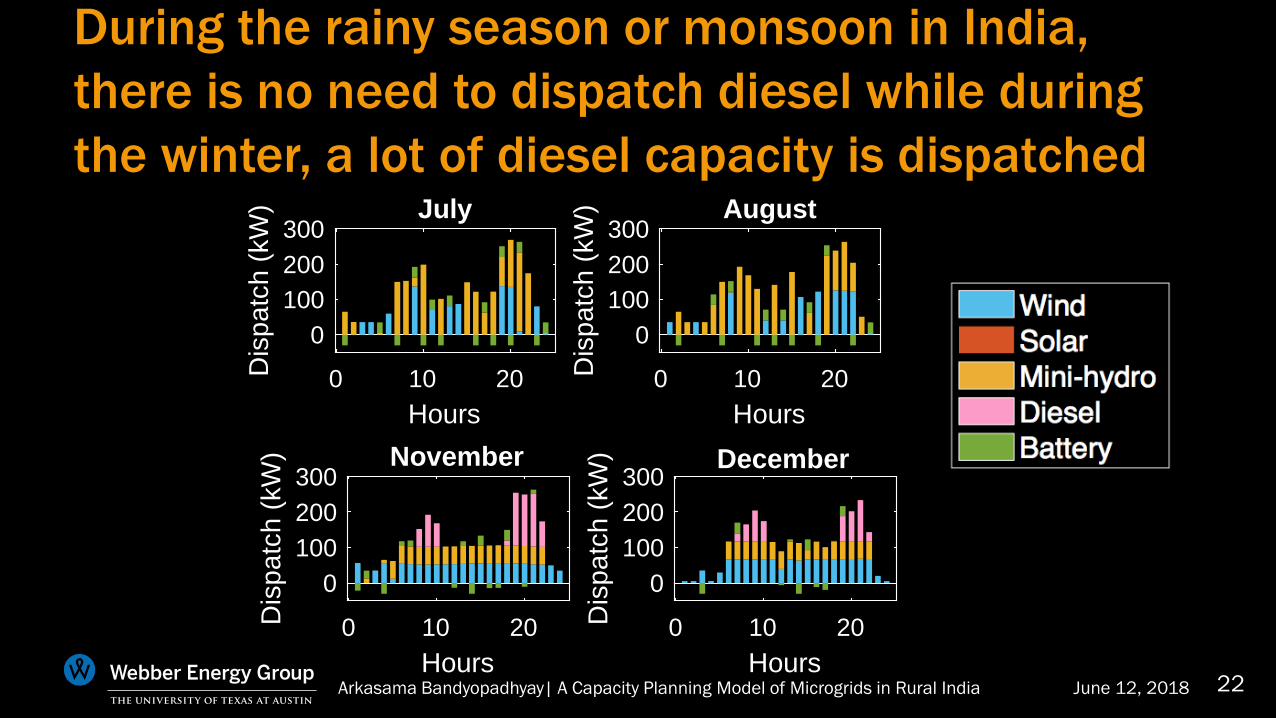
During the rainy season or monsoon in India,
there is no need to dispatch diesel while during
the winter, a lot of diesel capacity is dispatched
January
0 10 20
Hours
0
100
200
300
Dis
patc
h (
kW
) February
0 10 20
Hours
0
100
200
300
Dis
patc
h (
kW
) March
0 10 20
Hours
0
100
200
300
Dis
patc
h (
kW
) April
0 10 20
Hours
0
100
200
300
Dis
patc
h (
kW
)
May
0 10 20
Hours
0
100
200
300
Dis
pa
tch
(kW
) June
0 10 20
Hours
0
100
200
300
Dis
pa
tch
(kW
) July
0 10 20
Hours
0
100
200
300
Dis
pa
tch
(kW
) August
0 10 20
Hours
0
100
200
300
Dis
pa
tch
(kW
)
September
0 10 20
Hours
0
100
200
300
Dis
pa
tch (
kW
) October
0 10 20
Hours
0
100
200
300
Dis
pa
tch (
kW
) November
0 10 20
Hours
0
100
200
300
Dis
pa
tch (
kW
) December
0 10 20
Hours
0
100
200
300
Dis
pa
tch (
kW
)
January
0 10 20
Hours
0
100
200
300
Dis
patc
h (
kW
) February
0 10 20
Hours
0
100
200
300
Dis
patc
h (
kW
) March
0 10 20
Hours
0
100
200
300
Dis
patc
h (
kW
) April
0 10 20
Hours
0
100
200
300
Dis
patc
h (
kW
)
May
0 10 20
Hours
0
100
200
300
Dis
pa
tch (
kW
) June
0 10 20
Hours
0
100
200
300
Dis
pa
tch (
kW
) July
0 10 20
Hours
0
100
200
300
Dis
pa
tch (
kW
) August
0 10 20
Hours
0
100
200
300
Dis
pa
tch (
kW
)
September
0 10 20
Hours
0
100
200
300
Dis
pa
tch (
kW
) October
0 10 20
Hours
0
100
200
300
Dis
pa
tch (
kW
) November
0 10 20
Hours
0
100
200
300
Dis
pa
tch (
kW
) December
0 10 20
Hours
0
100
200
300
Dis
pa
tch (
kW
)
Arkasama Bandyopadhyay| A Capacity Planning Model of Microgrids in Rural India 23June 12, 2018
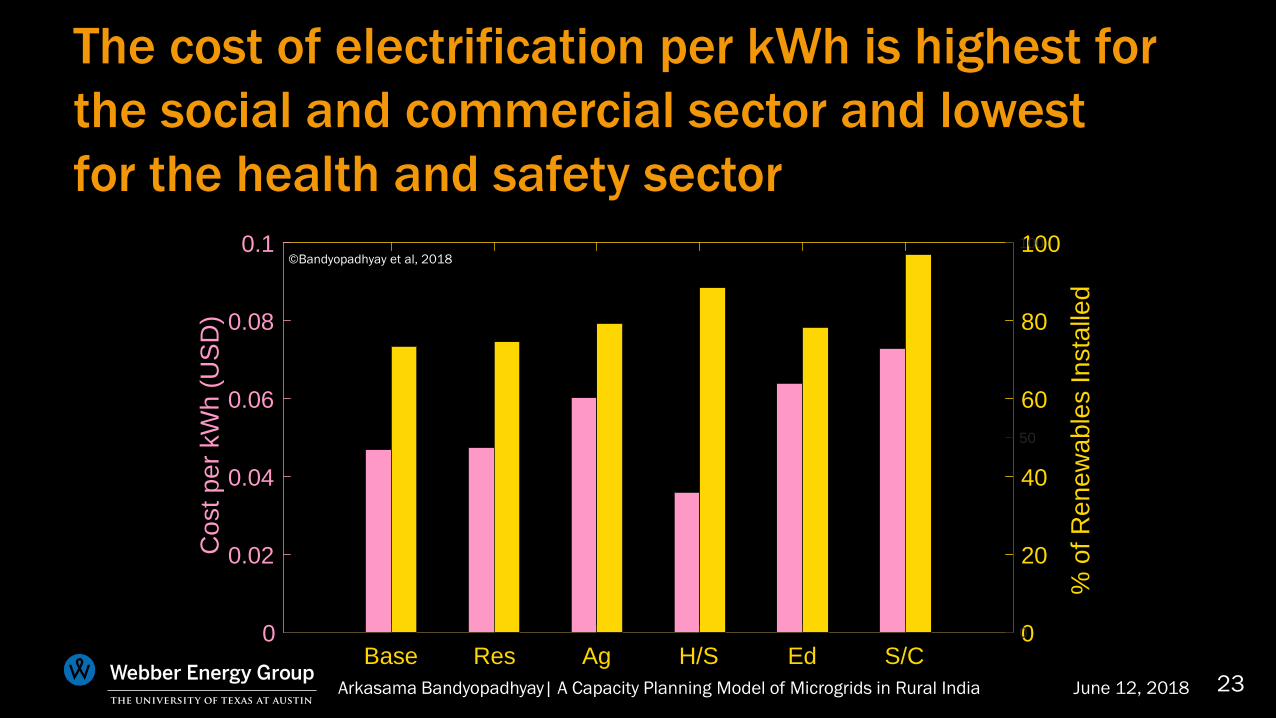
The cost of electrification per kWh is highest for
the social and commercial sector and lowest
for the health and safety sector
0
20
40
60
80
100
% o
f R
ene
wa
ble
s In
sta
lled
Base Res Ag H/S Ed S/C0
0.02
0.04
0.06
0.08
0.1
Co
st
pe
r kW
h (
US
D)
0
50
100©Bandyopadhyay et al, 2018

Arkasama Bandyopadhyay| A Capacity Planning Model of Microgrids in Rural India 24June 12, 2018
Wind generator capacity is only installed for
electrification of the base case and the
residential sectorCapacity Composition per Sector
Base Res Ag H/S Ed S/C0
0.2
0.4
0.6
0.8
1Wind
Solar
Mini-hydro
Diesel
Battery
©Bandyopadhyay et al, 2018

Arkasama Bandyopadhyay| A Capacity Planning Model of Microgrids in Rural India 25June 12, 2018
As CO2 tax is increased, the total capacity
installed also increases
0 50 100 150
CO2 Tax (USD/metric ton)
0
200
400
600
800C
ap
acity I
nsta
lled (
kW
)Wind
Solar
Mini-hydro
Diesel
Battery
©Bandyopadhyay et al, 2018

Arkasama Bandyopadhyay| A Capacity Planning Model of Microgrids in Rural India 26June 12, 2018
Two complimentary trends are observed with
increase in CO2 tax
0 50 100 150
CO2 Tax (USD/metric ton)
0
50
100
150
200
Die
sel C
ap
acity (
kW
)
0
20
40
60
80
100
% R
ene
wa
ble
s In
sta
lled
©Bandyopadhyay et al, 2018
Arkasama Bandyopadhyay| A Capacity Planning Model of Microgrids in Rural India 27June 12, 2018
Outline
• Background
• Goals
• Methods
• Results and Discussion
• Future Work
• Conclusion
Arkasama Bandyopadhyay| A Capacity Planning Model of Microgrids in Rural India 28June 12, 2018
Several avenues for further research exist
• Cost comparison with extending grid to village
• Modification of load profile to include other sectors (e.g.
water treatment facilities, banks, post office)
• Modelling endogenous demand over a period of several
years to include effects of socioeconomic development
• Advanced generation systems (e.g. sun-tracking PV panels)

Arkasama Bandyopadhyay| A Capacity Planning Model of Microgrids in Rural India 29June 12, 2018
Outline
• Background
• Goals
• Methods
• Results and Discussion
• Future Work
• Conclusion
Arkasama Bandyopadhyay| A Capacity Planning Model of Microgrids in Rural India 30June 12, 2018
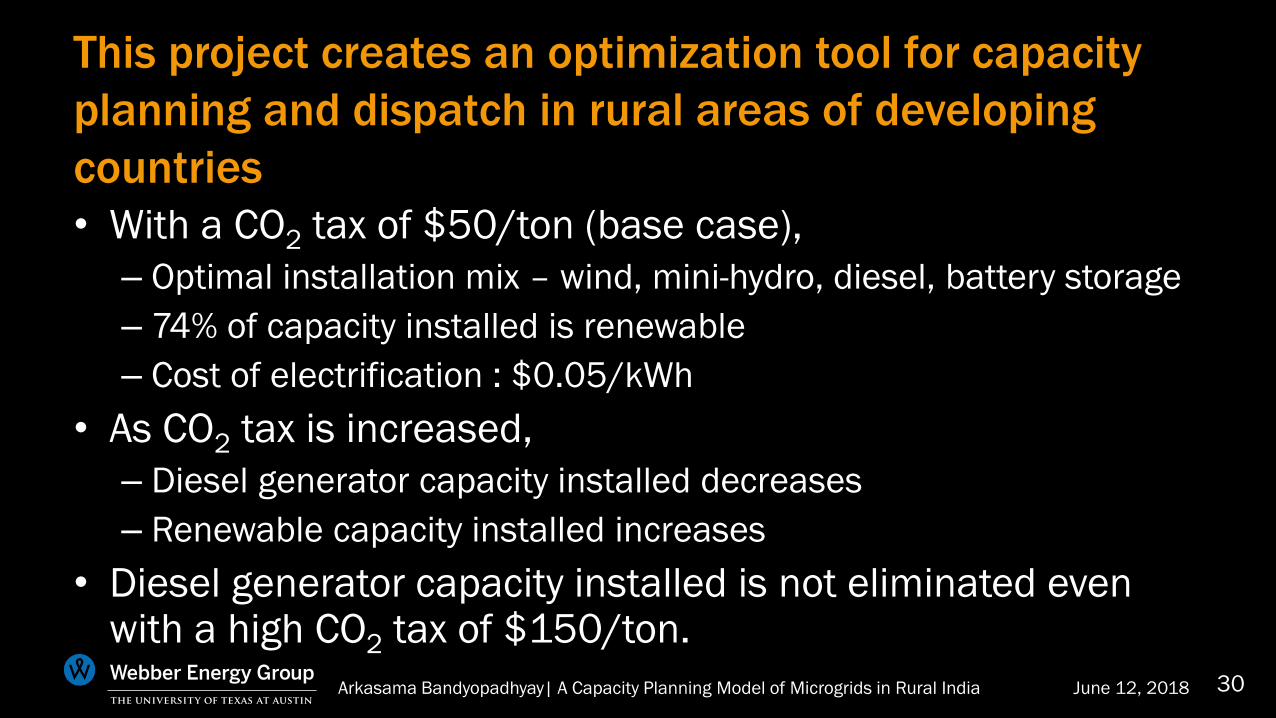
This project creates an optimization tool for capacity
planning and dispatch in rural areas of developing
countries
• With a CO2 tax of $50/ton (base case),
– Optimal installation mix – wind, mini-hydro, diesel, battery storage
– 74% of capacity installed is renewable
– Cost of electrification : $0.05/kWh
• As CO2 tax is increased,
– Diesel generator capacity installed decreases
– Renewable capacity installed increases
• Diesel generator capacity installed is not eliminated even with a high CO2 tax of $150/ton.

www.webberenergygroup.com
Arkasama BandyopadhyayGraduate Research Assistant,
Department of Mechanical Engineering,
The University of Texas at Austin,
USA
Arkasama Bandyopadhyay| A Capacity Planning Model of Microgrids in Rural India 32June 12, 2018
Backup Slides
Arkasama Bandyopadhyay| A Capacity Planning Model of Microgrids in Rural India 33June 12, 2018
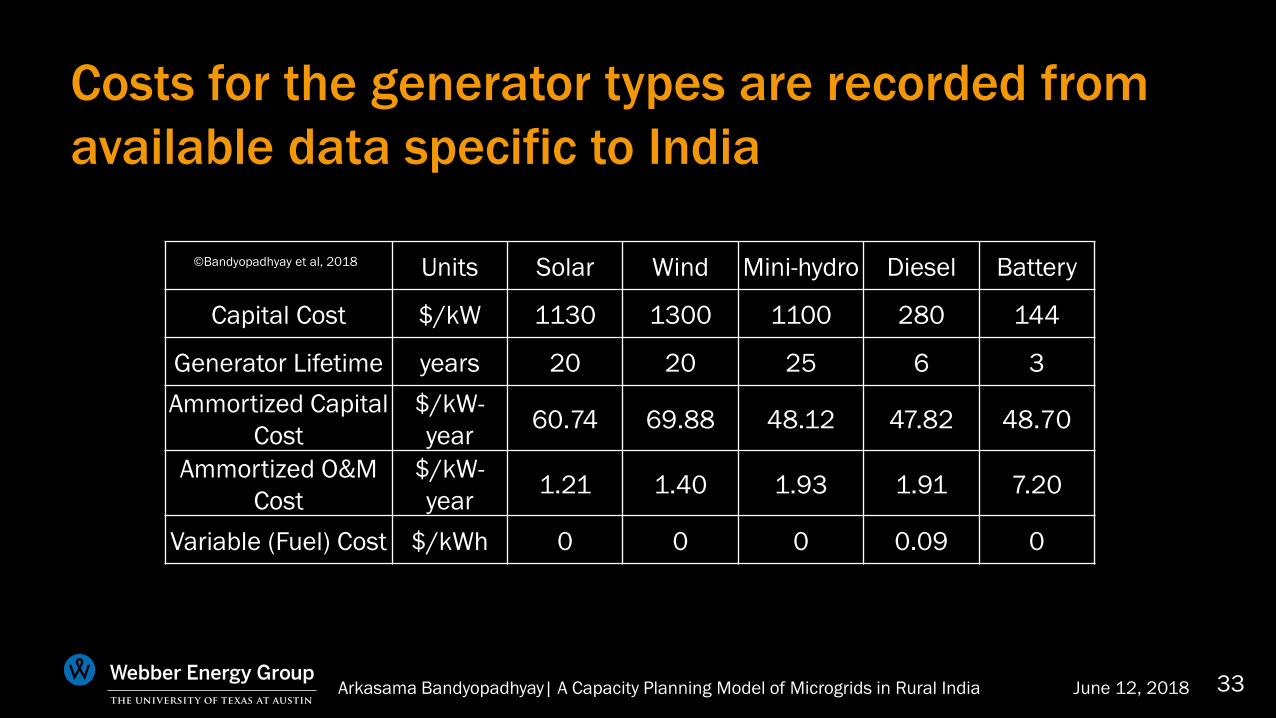
Costs for the generator types are recorded from
available data specific to India
Units Solar Wind Mini-hydro Diesel Battery
Capital Cost $/kW 1130 1300 1100 280 144
Generator Lifetime years 20 20 25 6 3
Ammortized Capital
Cost
$/kW-
year60.74 69.88 48.12 47.82 48.70
Ammortized O&M
Cost
$/kW-
year1.21 1.40 1.93 1.91 7.20
Variable (Fuel) Cost $/kWh 0 0 0 0.09 0
©Bandyopadhyay et al, 2018

Arkasama Bandyopadhyay| A Capacity Planning Model of Microgrids in Rural India 34June 12, 2018
The total annual energy consumption modeled in
the base case is 990 MWhBase Case
0 50 100 150 200 250
No of days
0
50
100
150
200
250
300Lo
ad
(kW
)©Bandyopadhyay et al, 2018
Arkasama Bandyopadhyay| A Capacity Planning Model of Microgrids in Rural India 35June 12, 2018
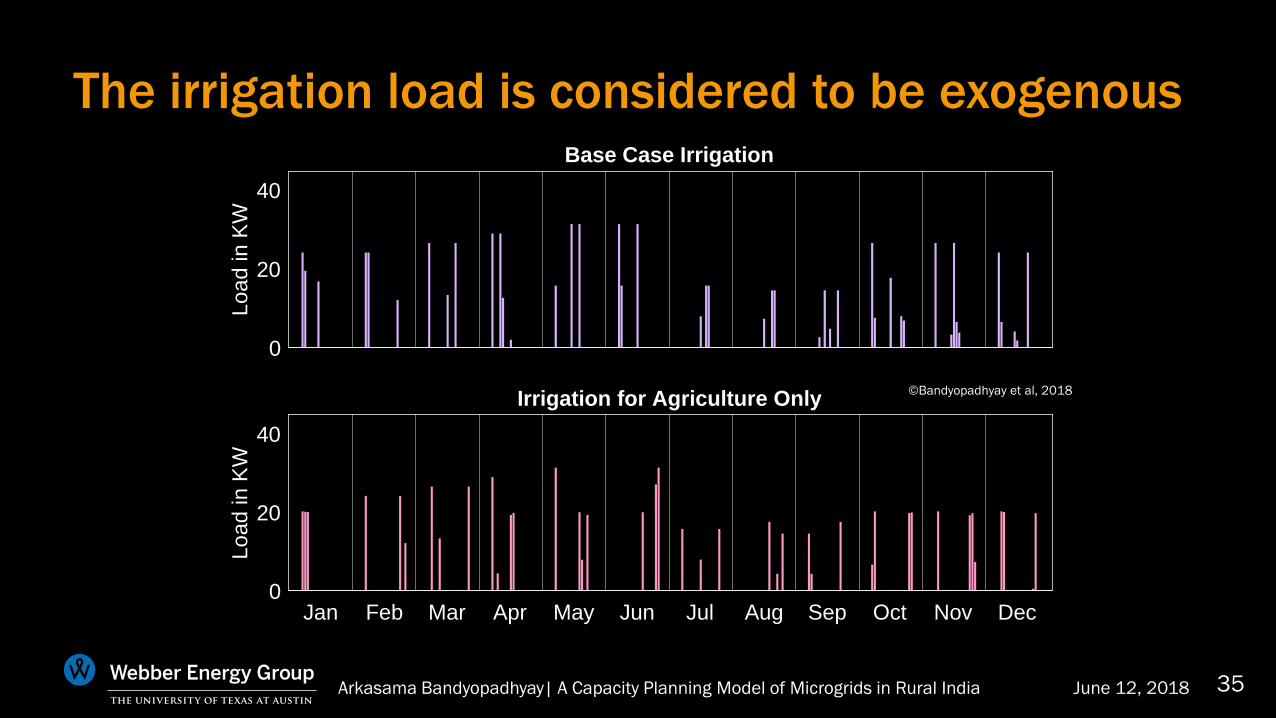
The irrigation load is considered to be exogenousBase Case Irrigation
0
20
40
Lo
ad in
KW
Irrigation for Agriculture Only
Jan Feb Mar Apr May Jun Jul Aug Sep Oct Nov Dec0
20
40
Lo
ad
in
KW
©Bandyopadhyay et al, 2018


![Satyanweshi by Sharadindu Bandyopadhyay [Byomkesh Bakshi]](https://static.fdocument.pub/doc/165x107/55cf918e550346f57b8e75f9/satyanweshi-by-sharadindu-bandyopadhyay-byomkesh-bakshi.jpg)