A Basic Study on Evaluation of Spotted Surface Defects by...
17
RPUG-PDRG 1st Joint Meeting A BASIC STUDY ON EVALUATION OF SPOTTED SURFACE DEFECTS BY A 3D FORMULATING SYSTEM USING TRANSVERSE PROFILE DATA Masayuki Eguchi Akira Kawamura Kazuya Tomiyama Shigeki Takakahashi Shinichiro Omachi
Transcript of A Basic Study on Evaluation of Spotted Surface Defects by...

RPUG-PDRG 1st Joint Meeting
A BASIC STUDY ON EVALUATION OF SPOTTED SURFACE DEFECTS BY A 3D FORMULATING SYSTEM
USING TRANSVERSE PROFILE DATA
Masayuki Eguchi
Akira Kawamura
Kazuya Tomiyama
Shigeki Takakahashi
Shinichiro Omachi

RPUG-PDRG 1st Joint Meeting
Background
Selection of Surface Detector
New 3D Data as Assessment Method
・Data Processing
・Identification of Distress
Validation Study
Conclusions
Contents

RPUG-PDRG 1st Joint Meeting
Drainage
Background: Surface Course in NEXCO
Dense graded asphalt
Porous
asphalt
Interurban expressways are operated by NEXCO.
Rainfall
Void
Standard surface course
:Porous Asphalt (Since 1999)

RPUG-PDRG 1st Joint Meeting
Background: Surface Course in NEXCO
⇒ Accidents on rainy days were significantly reduced.
Dense graded asphalt
Porous
asphalt
RPUG-PDRG 1st Joint Meeting
Background: Deformation of Porous AsphaltFrequent deformation of porous asphalt : Pumping
・Fine-grained fractions on a subbase spurt to the surface from a crack below the binder course.
・Spurting of fine-graded fractions on the subbase causes local settlement.
→In order to select a point to be repaired,it is necessary to measure the amount of local settlement onthe surface course and assess it.
RPUG-PDRG 1st Joint Meeting
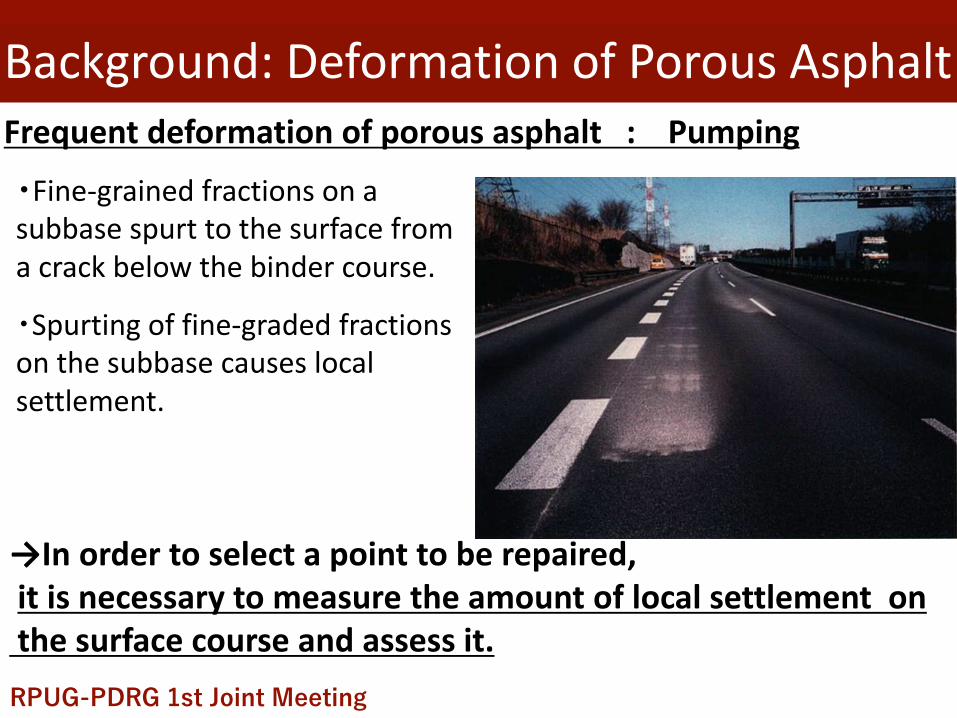
Indicator Cracking rate Amount of rutting
Measured data Road surface image Transverse profile
Acquired data Confirm deformation from an image.
Confirm deformation from height of road surface.
Selection of Surface DetectorNEXCO periodically measures the surface course using a profiler.
→We used this transverse profile to investigate the assessment of local deformation on the surface course.
Transverse profile

RPUG-PDRG 1st Joint Meeting
【Data Processing】Transverse profile arranged in order. →Obtain a series of 3D data plots.
New 3D Data as Assessment Method
Rutting parts
Transverse profile

RPUG-PDRG 1st Joint Meeting
3%
【Data Processing】1. Correction of transverse gradient
Transverse gradient 3%→0%
0%
Transverse profileTransverse profile
New 3D Data as Assessment Method
RPUG-PDRG 1st Joint Meeting
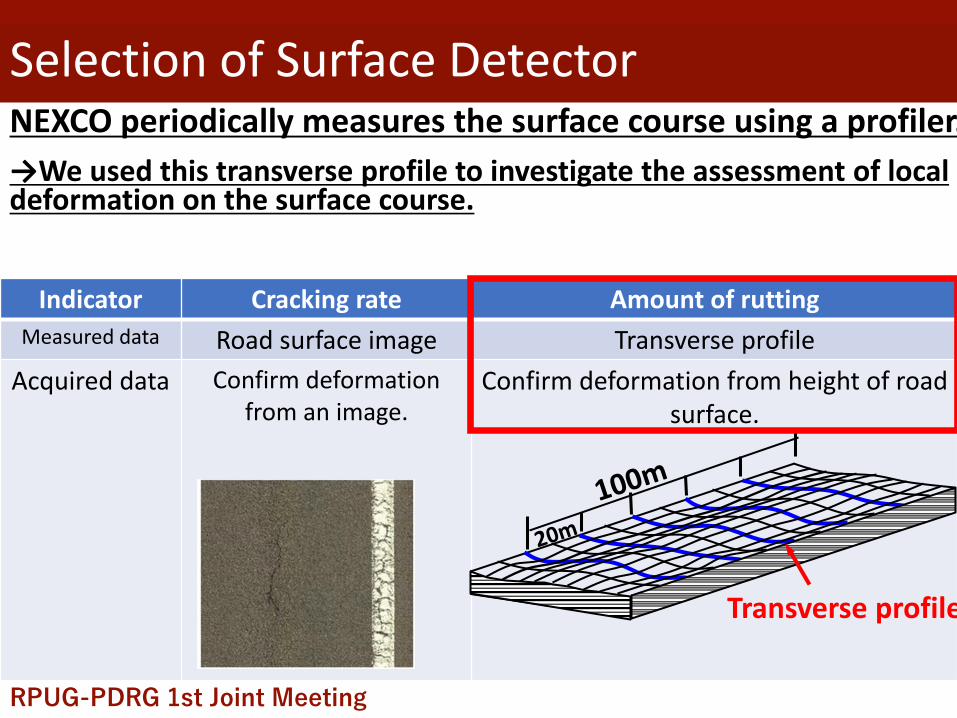
【Data Processing】2. All the transverse
segments are combined
Corrected transverse profile→ Practically used as a quasi-3D profile
New 3D Data as Assessment Method

RPUG-PDRG 1st Joint Meeting
・Section in which local deformation is assessed (occurs)
the scope of assessment→Count section narrowed down to a section width of 50㎝
(Repeated load)Deformation section(Assessment section)
(Repeated load)Deformation section(Assessment section)
50 to 100 cm
【Identification of distress】
50 to 100 cm
New 3D Data as Assessment Method

RPUG-PDRG 1st Joint Meeting
: : : : : : : : :…●……●……●……●……●…●…●………●…●…: : : : : : : : :: ●● : ●● : : : : :
…●…●〇……〇……〇●…●…●…●………●…●…: : : : : : : : :: : 〇〇〇 : : : : : :
…●…●〇…〇〇〇…〇●…●…●…●………●…●…: : 〇〇〇 : : : : : :: : : : : : : : :
…●…●〇……〇……〇●…●…●…●………●…●…: ●● ● ●● : : : : :: : : : : : : : :
…●……●……●……●……●…●…●………●…●…: : : : : : : : :: : : : : : : : :
…●……●……●……●……●…●…●………●…●…: : : : : : : : :
Calculate standard
deviation (σ) of profile
data (〇) within the 50
cm × 50 cm red
square, while it is
entirely covering
around the section
• Quasi 3-D profile Assessment
←
La
ne
wid
th →
→Calculate the standard deviation of profile data within the 50 by 50 cm
・Method for extracting local deformation【Identification of distress】
New 3D Data as Assessment Method

RPUG-PDRG 1st Joint Meeting
・Visualized example of calculation of the standard deviation of the profile height
【Identification of distress】
New 3D Data as Assessment Method
pumping
→Narrow down the count section, thereby enabling assessment of local deformation.

RPUG-PDRG 1st Joint Meeting
For the purpose of validating how this method can be used to identify pumping, rutting data were analysed for several sections of pavement.
• The road profile data were analysed every 10 mm in the transverse direction and every 50 mm in the longitudinal direction.• The transverse gradient was corrected to 0%.• The standard deviation was calculated based on data
collected for 50 cm × 50 cm sections.
Validation Study

RPUG-PDRG 1st Joint Meeting
【Standard Deviation】
Level 3(3 to 4mm)
【Standard Deviation】
Level 5(3mm or higher)
【Standard Deviation】
Level 4(3 to 5mm)
For the purpose of validating how this method can be used to identify pumping.
・The standard deviation data could be identify the areas of pumping.
・Standard deviation Level3 distress could be observed before pumping.
pumping
Validation Study

RPUG-PDRG 1st Joint Meeting
0
1
2
3
4
5
6
7
8
9
-10 -7 -5 -4 -3 -2 -1 0 1 2 3 4 5 6 7 8 9
10
12
13
Standard Deviation 3 mm Over
Month
Ca
se
Detected50%
Predicted43%
Pumping prediction and occurrence in time series
The proposed quasi-3D profile methodcan adequately detect and predict pumping.
・Of the 74 sections identified where pumping had occurred, 93%could be detected.
・ The average prediction rate was three months.
Validation Study
RPUG-PDRG 1st Joint Meeting
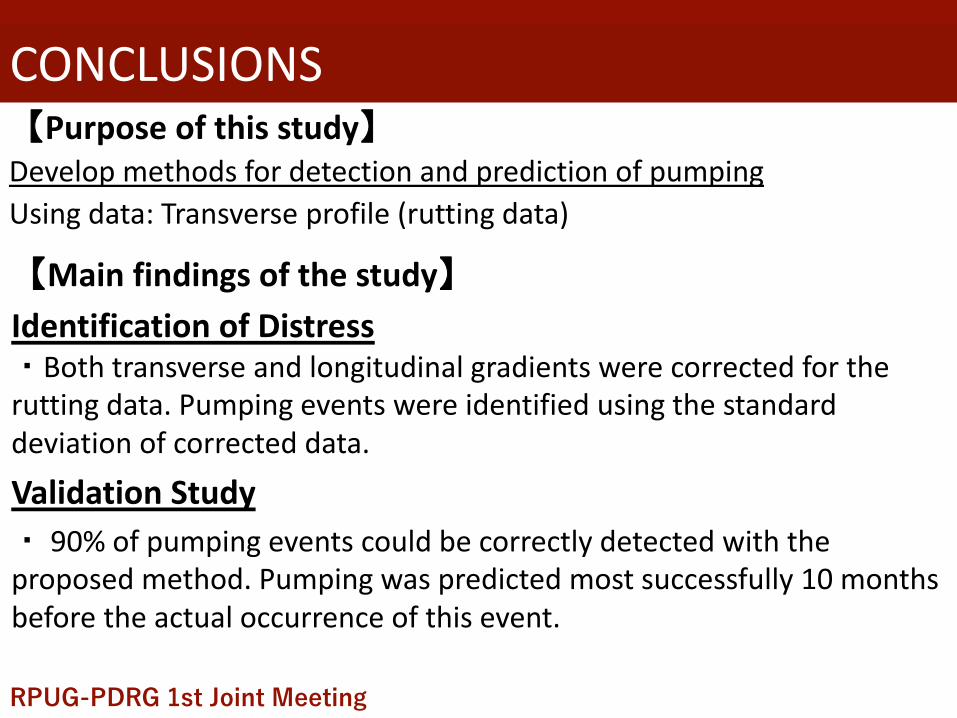
CONCLUSIONS【Purpose of this study】Develop methods for detection and prediction of pumping
Using data: Transverse profile (rutting data)
【Main findings of the study】
Identification of Distress・Both transverse and longitudinal gradients were corrected for the rutting data. Pumping events were identified using the standard deviation of corrected data.
Validation Study
・ 90% of pumping events could be correctly detected with the proposed method. Pumping was predicted most successfully 10 months before the actual occurrence of this event.