6 in Marshes - New Hampshire , that helped ... et al. 2015), we do not know whether marshes will be...
26
Appendix 6 Using Sediment Elevation Tables to Analyze Recent Changes in Surface Elevation of New Hampshire Salt Marshes
Transcript of 6 in Marshes - New Hampshire , that helped ... et al. 2015), we do not know whether marshes will be...

Appendix 6
Using Sediment Elevation Tables to Analyze Recent
Changes in Surface Elevation of New Hampshire Salt
Marshes

UsingSedimentElevationTables(SETs)toAnalyzeRecentChangesinSurfaceElevationofNewHampshireSaltMarshes
U n i v e r s i t y o f N e w H a m p s h i r e
Prepared for:
NEW HAMPSHIRE DEPARTMENT OF ENVIRONMENTAL SERVICES, NEW HAMPSHIRE COASTAL PROGRAM
50 International Drive Portsmouth, NH 03801
AS PART OF: RESILIENT NH COASTS, A SPECIAL MERIT GRANT FROM COASTAL ZONE MANAGEMENT OFFICE, NOAA Silver Spring, MD
Prepared by:
David M. Burdick and Christopher R. Peter
Jackson Estuarine Laboratory, 85 Adams Point Road, Durham, NH 03824

ii
TABLEOFCONTENTSAcknowledgements...................................................................................................................................1Introduction..................................................................................................................................................2ObjectivesandActivities..................................................................................................................6Methods..........................................................................................................................................................6SETLOCATIONSANDMEASUREMENTDATES...........................................................................6MarshElevations.................................................................................................................................8SETandMHMeasurementsandAnalyses................................................................................8Results............................................................................................................................................................9Discussion...................................................................................................................................................17References..................................................................................................................................................20APPENDICES...................................................................................................................................22
Citeas:Burdick,D.M.,andC.R.Peter.2015.UsingSedimentElevationTables(SETs)toAnalyzeRecentChangesinSurfaceElevationofNewHampshireSaltMarshes.FinalReportpreparedforNewHampshireDepartmentofEnvironmentalServices:NewHampshireCoastalProgram.Portsmouth,NH.pp22

1
AcknowledgementsWewouldliketothankSteveCotureandCathyColettioftheNHCoastalProgramoftheNHDepartmentofEnvironmentalServicesforleadingtheprojectofSpecialMerit,ResilientNHCoasts,thathelpedsupportourefforts.TheSETsinHamptonSeabrookEstuarywereinstalledwithfinantialhelpfromapreviousNOAAgrantandtheNewHampshireCharitableFoundation.ThankstoallteammembersoftheCoastalAdaptationWorkgroupforvaluablediscussionsthatimprovedthework.WethankLarryWardforhelpingtoinstalltheoriginalSETsandforsharingsealeveldata.WeareindebtedtoSemmeDijkstraforfieldmeasurementsandpostprocessingtoestablishelevationsofSETbenchmarks.GraduatestudentsSteveGaughanandAshleyNortonhelpedwithsomeofthefieldmeasurements.
2
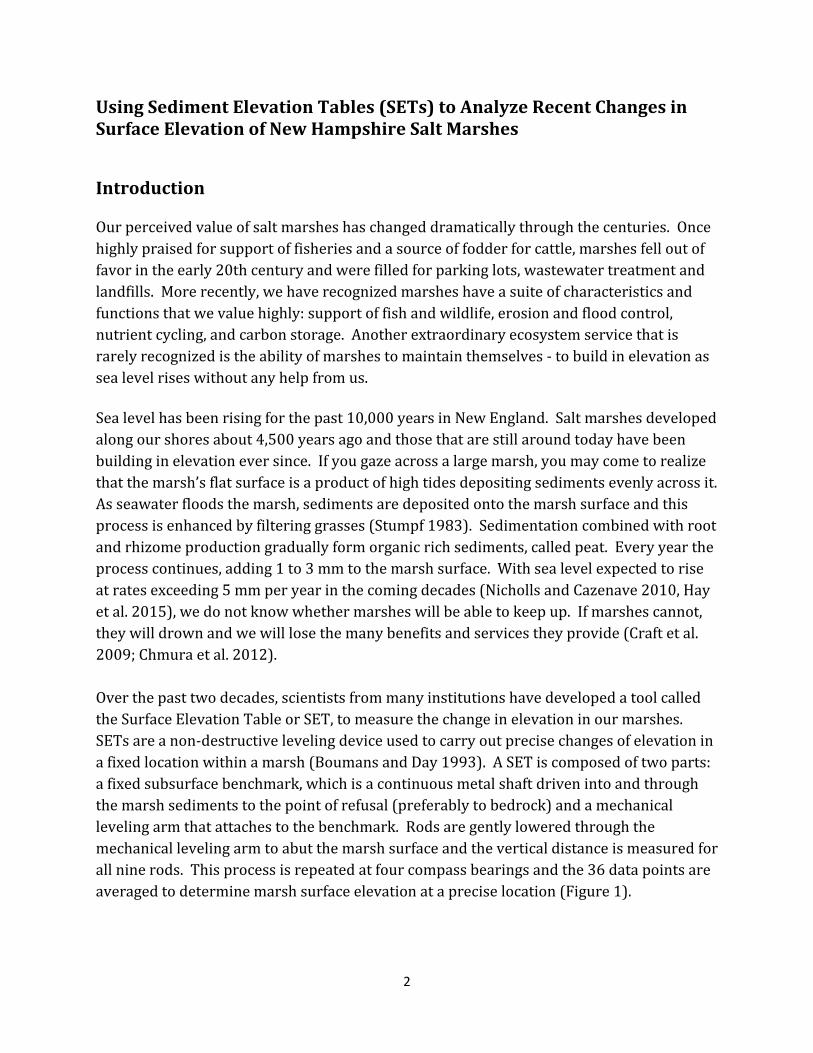
UsingSedimentElevationTables(SETs)toAnalyzeRecentChangesinSurfaceElevationofNewHampshireSaltMarshesIntroductionOurperceivedvalueofsaltmarsheshaschangeddramaticallythroughthecenturies.Oncehighlypraisedforsupportoffisheriesandasourceoffodderforcattle,marshesfelloutoffavorintheearly20thcenturyandwerefilledforparkinglots,wastewatertreatmentandlandfills.Morerecently,wehaverecognizedmarsheshaveasuiteofcharacteristicsandfunctionsthatwevaluehighly:supportoffishandwildlife,erosionandfloodcontrol,nutrientcycling,andcarbonstorage.Anotherextraordinaryecosystemservicethatisrarelyrecognizedistheabilityofmarshestomaintainthemselves‐tobuildinelevationassealevelriseswithoutanyhelpfromus.Sealevelhasbeenrisingforthepast10,000yearsinNewEngland.Saltmarshesdevelopedalongourshoresabout4,500yearsagoandthosethatarestillaroundtodayhavebeenbuildinginelevationeversince.Ifyougazeacrossalargemarsh,youmaycometorealizethatthemarsh’sflatsurfaceisaproductofhightidesdepositingsedimentsevenlyacrossit.Asseawaterfloodsthemarsh,sedimentsaredepositedontothemarshsurfaceandthisprocessisenhancedbyfilteringgrasses(Stumpf1983).Sedimentationcombinedwithrootandrhizomeproductiongraduallyformorganicrichsediments,calledpeat.Everyyeartheprocesscontinues,adding1to3mmtothemarshsurface.Withsealevelexpectedtoriseatratesexceeding5mmperyearinthecomingdecades(NichollsandCazenave2010,Hayetal.2015),wedonotknowwhethermarsheswillbeabletokeepup.Ifmarshescannot,theywilldrownandwewilllosethemanybenefitsandservicestheyprovide(Craftetal.2009;Chmuraetal.2012).Overthepasttwodecades,scientistsfrommanyinstitutionshavedevelopedatoolcalledtheSurfaceElevationTableorSET,tomeasurethechangeinelevationinourmarshes.SETsareanon‐destructivelevelingdeviceusedtocarryoutprecisechangesofelevationinafixedlocationwithinamarsh(BoumansandDay1993).ASETiscomposedoftwoparts:afixedsubsurfacebenchmark,whichisacontinuousmetalshaftdrivenintoandthroughthemarshsedimentstothepointofrefusal(preferablytobedrock)andamechanicallevelingarmthatattachestothebenchmark.Rodsaregentlyloweredthroughthemechanicallevelingarmtoabutthemarshsurfaceandtheverticaldistanceismeasuredforallninerods.Thisprocessisrepeatedatfourcompassbearingsandthe36datapointsareaveragedtodeterminemarshsurfaceelevationatapreciselocation(Figure1).
3
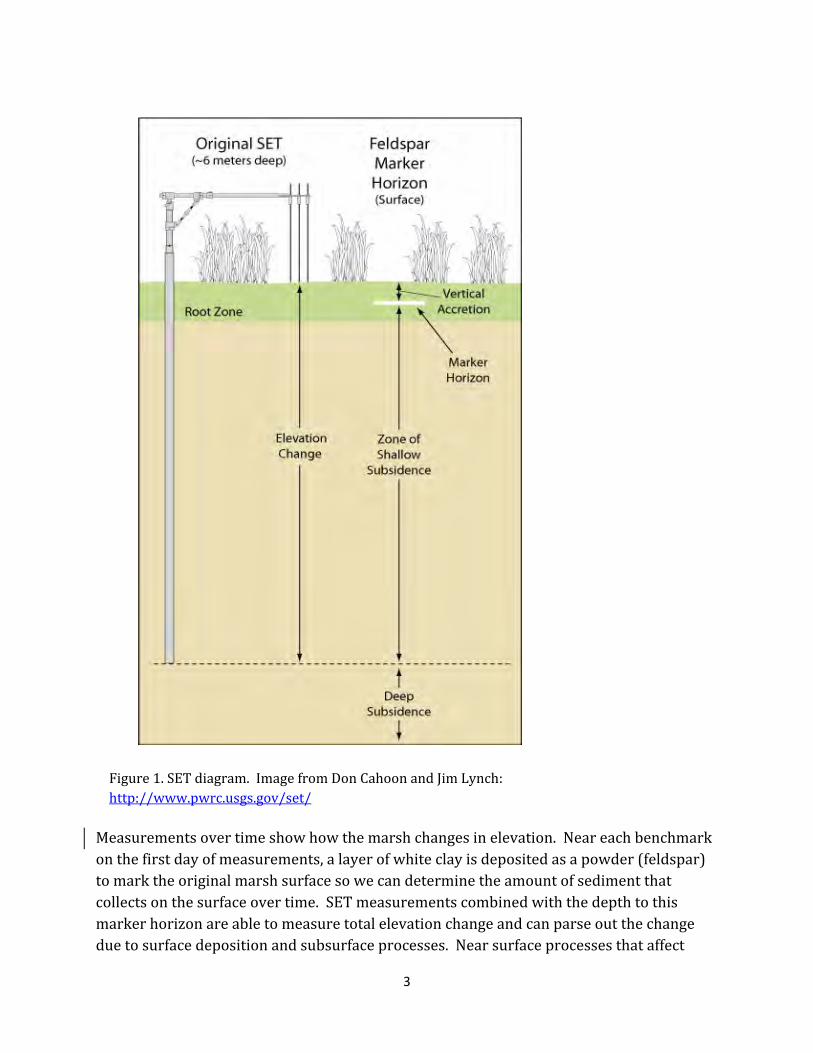
Measurementsovertimeshowhowthemarshchangesinelevation.Neareachbenchmarkonthefirstdayofmeasurements,alayerofwhiteclayisdepositedasapowder(feldspar)tomarktheoriginalmarshsurfacesowecandeterminetheamountofsedimentthatcollectsonthesurfaceovertime.SETmeasurementscombinedwiththedepthtothismarkerhorizonareabletomeasuretotalelevationchangeandcanparseoutthechangeduetosurfacedepositionandsubsurfaceprocesses.Nearsurfaceprocessesthataffect
Figure1.SETdiagram.ImagefromDonCahoonandJimLynch:http://www.pwrc.usgs.gov/set/
4
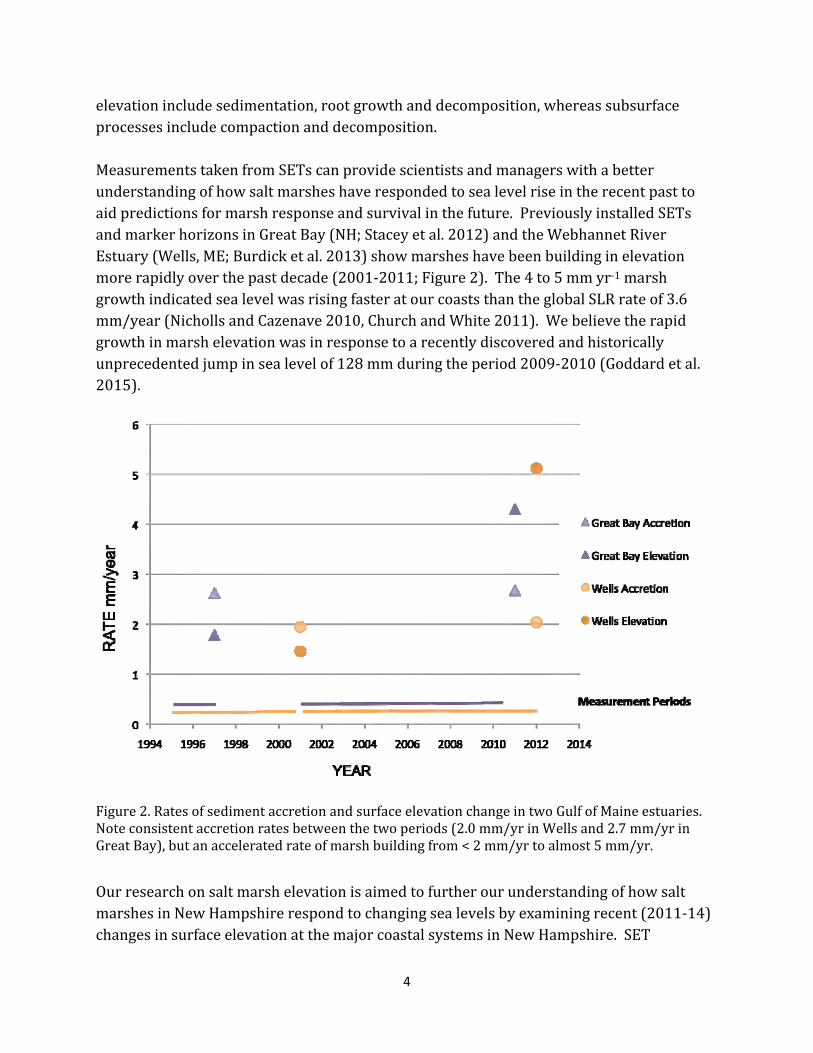
elevationincludesedimentation,rootgrowthanddecomposition,whereassubsurfaceprocessesincludecompactionanddecomposition.MeasurementstakenfromSETscanprovidescientistsandmanagerswithabetterunderstandingofhowsaltmarsheshaverespondedtosealevelriseintherecentpasttoaidpredictionsformarshresponseandsurvivalinthefuture.PreviouslyinstalledSETsandmarkerhorizonsinGreatBay(NH;Staceyetal.2012)andtheWebhannetRiverEstuary(Wells,ME;Burdicketal.2013)showmarsheshavebeenbuildinginelevationmorerapidlyoverthepastdecade(2001‐2011;Figure2).The4to5mmyr‐1marshgrowthindicatedsealevelwasrisingfasteratourcoaststhantheglobalSLRrateof3.6mm/year(NichollsandCazenave2010,ChurchandWhite2011).Webelievetherapidgrowthinmarshelevationwasinresponsetoarecentlydiscoveredandhistoricallyunprecedentedjumpinsealevelof128mmduringtheperiod2009‐2010(Goddardetal.2015).
Figure2.RatesofsedimentaccretionandsurfaceelevationchangeintwoGulfofMaineestuaries.Noteconsistentaccretionratesbetweenthetwoperiods(2.0mm/yrinWellsand2.7mm/yrinGreatBay),butanacceleratedrateofmarshbuildingfrom<2mm/yrtoalmost5mm/yr.
OurresearchonsaltmarshelevationisaimedtofurtherourunderstandingofhowsaltmarshesinNewHampshirerespondtochangingsealevelsbyexaminingrecent(2011‐14)changesinsurfaceelevationatthemajorcoastalsystemsinNewHampshire.SET

5
benchmarksexistedinGreatBayandAwcominMarshfrompreviousresearchefforts,butnotintheHamptonSeabrookEstuary.Therefore,sixnewbenchmarkswererecentlyinstalledinHamptonSeabrookEstuaryinanticipationofthisproject.ThecompletearrayofSETlocationsmonitoringfortheprojectareshowninFigure3.Todetermineifelevationchangewasduetosedimentaccretionatthemarshsurfaceorsubsurfaceprocessesofpeatpreservationordecompositionresultinginsubsidence,markerhorizonsweresampled.NewSETmeasurementswouldallowcomparisonsofaccretionandmarshelevationgrowthamongthethreemajorcoastalsystemsinNewHampshire:DrownedRiverValley(GreatBay),BarrierSystem(HamptonSeabrookEstuary)andsmallercoastalinletsystems(representedbyAwcominMarshatRyeHarbor).
Figure3.LocationsofbenchmarksestablishedforSurfaceElevationTable(SET)measurementsofsedimentaccretionandmarshelevationchangeinNewHampshire.HabitatelevationdataoftidalmarshescombinedwithSETdataareimportantinpredictingwhathabitatmaybeabletoexistunderahypotheticalsealevel.Forexample,SLAMM(SeaLevelAffectingMarshesModel)isamodelthathasbeenrecentlyupgradedsosuchdatacanbeusedtopredictimpactsfromsealevelriseontidalmarshhabitat.TheelevationatandaroundallSETstationsrelativetothetidaldatumwasundertakentodeterminethe
6
rangeofelevationsthatsaltmarshesexistattheHampton‐SeabrookEstuary.Saltmarshescanbedividedintolowmarsh,whichisfloodeddailybytidesanddominatedbysmoothcordgrass,andhighmarsh,whichbeginsatapproximatelytheaveragehightideandextendsupwardtothesurroundinguplands.Inaddition,theelevationsoftheSETscouldbeusedtodetermineifdifferencesintherateofmarshsurfaceelevationchangewasafunctionofitspositionintheintertidalzone(i.e.,Dohigherelevationsitesaccreteatalowerratethanlowerelevationsites?).ObjectivesandActivitiesOurobjectivesforthisprojectincludecollectionandanalysisofSETelevationandmarkerhorizondataforNewHampshiremarshsystemsoverthepast3years.HabitatelevationwouldalsobecollectedthroughouttheHampton‐SeabrookEstuaryandcomparedtolocaltidaldatums.Inaddition,weattendedmeetingstosupportandpromotetheprojectandprovidedadvicetoprojectpartnersonthetypesofhabitatstoincludeincoastalviewerandexaminedcoastalvieweroutputs.
MethodsSETLocationsandMeasurementDatesBenchmarksforSETmeasurementshadpreviouslybeeninstalledseveraldecadesagointhe1990sinGreatBayandRyeHarbor(Table1).Installationofthebenchmarkwasaccomplishedusingavibra‐corerbydrivingaluminumpipeintothemarshtothepointofrefusal(see:http://www.pwrc.usgs.gov/set/SET/original.html).Morerecently,additionalSETswereinstalledinGreatBaysaltmarshesfortheGreatBayNationalEstuarineResearchReserve(GBNERR)sentinelsiteprogram.InanticipationoftheResilientNHcoastsproject,sixSETbenchmarkswereinstalledintheHampton‐SeabrookEstuary(HSE),thelargestcontiguoussaltmarshsysteminNewHampshire(BurdickandPeter2014).NewSETbenchmarkswereestablishedbydrivinginstainlesssteelrodstothepointofrefusal(see:http://www.pwrc.usgs.gov/set/SET/rod.html).MarkerhorizonswereestablishedatthetimeofthefirstSETreadingsbyapplying750mLoffeldsparevenlyovera30by30cmareaattwolocationsaroundeachSET.
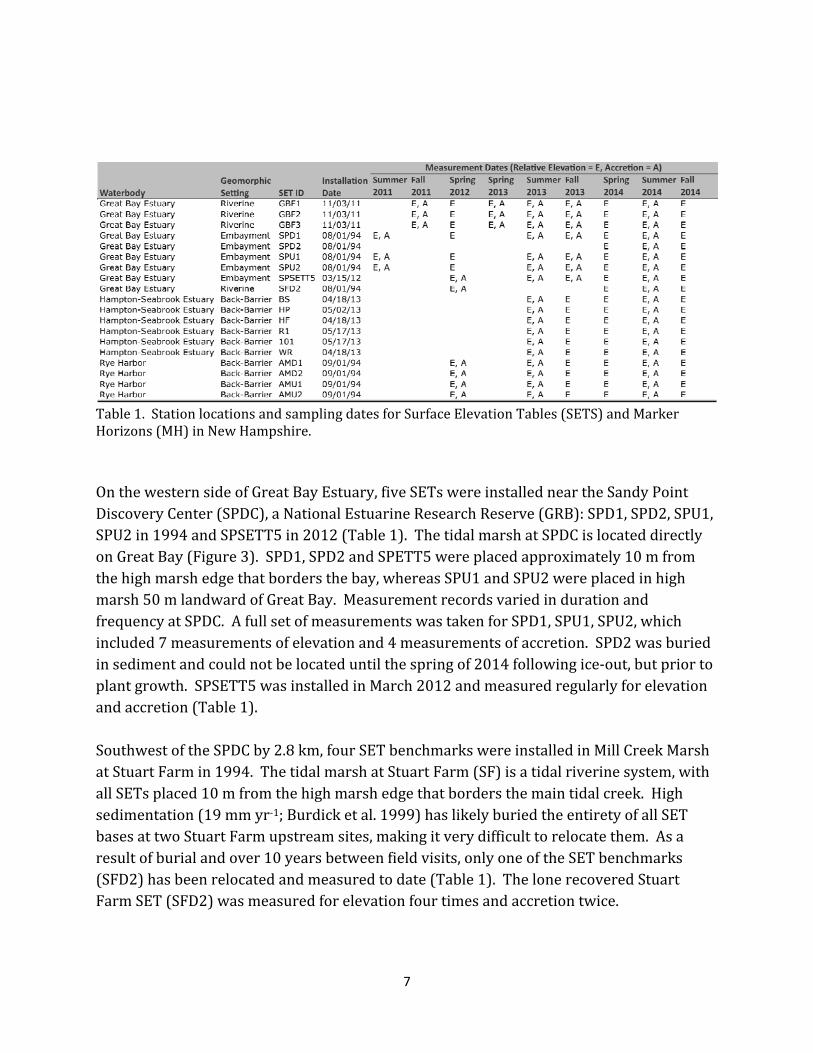
OntheeasternsideoftheGreatBayEstuary,threeSETswereinstalledinlate2011atatidalriverinesystemsurroundedbyforestsandagriculturefieldsnamedGreatBayFarms(GBF)fortheGBNERR(Figure3).SETswereplacedalonganestuarinegradienttenmetersfromthehighmarshedgethatbordersthemaintidalcreek.MarshsurfaceelevationsweremeasuredeighttimesfromDec2011toNov2014,andaccretionfourtimesfromApril2013toJuly2014(Table1).
7
Table1.StationlocationsandsamplingdatesforSurfaceElevationTables(SETS)andMarkerHorizons(MH)inNewHampshire.OnthewesternsideofGreatBayEstuary,fiveSETswereinstalledneartheSandyPointDiscoveryCenter(SPDC),aNationalEstuarineResearchReserve(GRB):SPD1,SPD2,SPU1,SPU2in1994andSPSETT5in2012(Table1).ThetidalmarshatSPDCislocateddirectlyonGreatBay(Figure3).SPD1,SPD2andSPETT5wereplacedapproximately10mfromthehighmarshedgethatbordersthebay,whereasSPU1andSPU2wereplacedinhighmarsh50mlandwardofGreatBay.MeasurementrecordsvariedindurationandfrequencyatSPDC.AfullsetofmeasurementswastakenforSPD1,SPU1,SPU2,whichincluded7measurementsofelevationand4measurementsofaccretion.SPD2wasburiedinsedimentandcouldnotbelocateduntilthespringof2014followingice‐out,butpriortoplantgrowth.SPSETT5wasinstalledinMarch2012andmeasuredregularlyforelevationandaccretion(Table1).SouthwestoftheSPDCby2.8km,fourSETbenchmarkswereinstalledinMillCreekMarshatStuartFarmin1994.ThetidalmarshatStuartFarm(SF)isatidalriverinesystem,withallSETsplaced10mfromthehighmarshedgethatbordersthemaintidalcreek.Highsedimentation(19mmyr‐1;Burdicketal.1999)haslikelyburiedtheentiretyofallSETbasesattwoStuartFarmupstreamsites,makingitverydifficulttorelocatethem.Asaresultofburialandover10yearsbetweenfieldvisits,onlyoneoftheSETbenchmarks(SFD2)hasbeenrelocatedandmeasuredtodate(Table1).ThelonerecoveredStuartFarmSET(SFD2)wasmeasuredforelevationfourtimesandaccretiontwice.
8
In1994,fourSETswereinstalledatAwcominMarsh,abackbarriersaltmarshonthecoastofNewHampshire(Figure2).SETswereinstalled10mfromthehighmarshedgethatborderedatidalcreek.TwoSETsatAwcominwereplacedinanareaoftidalrestoration(AMU1,AMU2)followingdredgedisposalin1941and1962,andtheothertwo(AMD1,AMD2)inareferencearea(Burdicketal.1999).Since2012,marshsurfaceelevationsandaccretionweremeasuredseveraltimes(Table1).Inspringof2013,sixSETswereinstalledintidalmarshesthroughoutHampton‐SeabrookEstuary(HSE;Figure2).Siteswerechosenbasedonaccessibility,avoidingproximitytoditchesandgainingpermission.Permissionwasobtainedfromprivateland‐owners,ownersoftownlands(Seabrook,HamptonFalls,andHampton)andNHFishandGameforlocationsonstatelands.SETswereinstalled10mfromthehighmarshedgeborderingatidalcreek,andmarshsurfaceelevationsweremeasured5timesandaccretiononce(Table1).MarshElevationsAtHamptonSeabrookEstuary,elevationsurveyswereconductedateachSETinthesummerof2014.EllipsoidheightofSETbenchmarks(topedgeofreceivinghead)andsurveydiscs(permanentlyplacedinconcreteadjacenttotheSETbase)weremeasuredusingaRealTimeKinematicsystem(RTKGPS),includingalocalbasestation.MultiplemeasurementsweretakendirectlyontheSETbenchmarksfortwominutesandRTKverticalprecisionrangedfrom0.03to0.09m.EllipsoidheightswereconvertedtoNAVD88(m)withNOAA’sVDatumsoftware,v.34.DataarepreliminaryuntilverifiedusingaknownUSGSelevationmarker.TidalmarshelevationsadjacenttotheSETswerealsosurveyedbyusingalaserlevel,tripodandrod,andthentyingintotheSETbenchmarksin2014and2015.Multiplepointsweremeasuredwithinandatthebordersofdifferentmarshzones(e.g.,lowmarshedge,highmarsh,uplandedge)toestablishtheelevationrangesforlowandhighmarshintheEstuary.SETandMHMeasurementsandAnalysesSETelevationsweredeterminedbyloweringninepinstojusttouchthemarshsurfaceandmeasuringtheverticaldistanceinmmfromthetopofthepintotheSETarmatfourpositionsaroundeachbenchmark.ElevationsrecordedandpresentedarerelativetotheSETbase.Marshsurfaceelevationswereaveragedbybearing(n=9pins)andaveragedtoeachSET(n=4bearings)foralldatesmeasuredfrom2011to2014.ElevationchangeratesforeachSETlocationweredeterminedusinglinearregressionsovertime,includingalldatesrecordedfrom2011to2014.MeanswerecalculatedforeachmarshsystemandoverallforNHseacoast.
9
Surfaceaccretionwasdeterminedbycuttingapie‐shapedwedgeofmarsh(10by5by5‐7cmdeep)fromthemarkerhorizonplot.Thewedgewasextractedandtheverticaldistancebetweenthemarshsurfaceandthetopofthemarkerhorizonwasmeasuredusingverniercalipers(+/‐0.1mm).Variationinmarkerhorizondepthwasmodulatedbyselectingthemodeforeachsideofthewedge(uptothreemeasurements)thatwereaveragedfortheplot.EachSEThad2feldsparmarkerhorizonplotspositioned180oapart–oneithersideoftheSETbase.ThenthetwoplotswereaveragedfortheSETlocation.AccretionratesforeachSETlocationweredeterminedusinglinearregressionsofchangingdepthsovertime,includingalldatesrecordedfrom2011to2014.Thesameaveragingprocesswasconductedforaccretionrates,calculatingaverageratesforeachmarshsystemandNH.Thedatacollectedwereinputtoastandardizeddatabasewhichwasmadeavailabletoothersbycreatingametadatafiletoaccompanyeachdatasetgenerated(SETandMarshElevation)andsubmittingtoNOAAandGBNERR.ThemetadatawasdevelopedtobecompliantwiththeFederalGeographicDataCommittee’sContentStandardforDigitalGeospatialMetadata(CSDGM)andwillbecheckedwithNHCoastalProgramforadherencetostandards.ResultsMarshsurfaceelevationandsedimentaccretionweremeasuredusing19SETstationsonaregularbasissince2011inthetwomajorestuariesandonesmallermarshsystemofNewHampshire.Onaverage,marshesincreasedinsurfaceelevationby2.3±0.7mmyr‐1.Theaveragesedimentaccretionratewasverysimilar(2.4±0.9mmyr‐1)andaccountedforalloftheelevationchangeweobserved(Figure4).Sub‐surfacechangestopeatunderthemarkerhorizon,suchasaccumulationvs.decompostionandcompaction,isdeterminedbysubtractingtheaccretionfromthesurfaceelevationchange.Theoveralldifferenceaveraged‐0.1mmyr‐1forourmeasurements.Sincethedifferenceiscloseto‘0’,itappearstheprocessesthatbuildanddegradepeatwereaboutequalfrom2011to2014.WhenexaminingelevationchangeamongsaltmarshsystemsinNH,mostmarshesbuiltupatsimilarrates(sitesinGreatBayandHSE),rangingfrom2.1to2.6mmyr‐1.However,thesmallbackbarrierAwcominMarshdeviatedfromthisrangeatbothdownstreamandupstreamareasofthemarsh.TheSETandmarkerhorizonresultsareexaminedforeachmarshsystemseparatelyinthefollowingparagraphs.

10
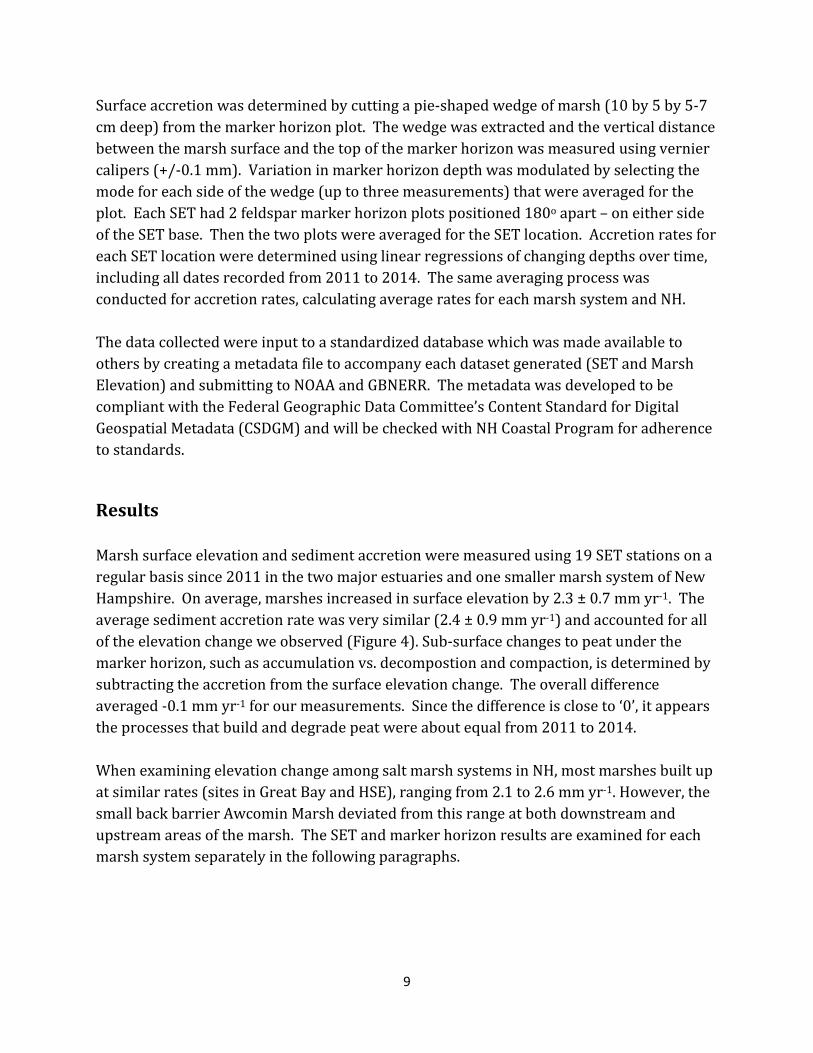
Figure4.Rateofsurfaceelevationgains(circles)andaccretion(triangles)averagedbymarshsystemwithstandarderrorbars(exceptforAwcominMarsh)aswellasfortheentirestate.OntheeasternsideoftheGreatBayEstuary,allthreeSETstationsatGreatBayFarms(2011‐14)showedsimilarincreasesinelevation.AlinearregressionofeachSETwasusedtocalculatetherateofchange(i.e.,slopeovertime),whichaveraged2.2±0.3mmyr‐1(Figure5).Accretionratesshowedconsistentbuildingovertime(r2>0.90),butvariableacrossstations,withthedownstreamstations,GBF1,showinggreateraccretionratesthantheothertwoSETs(Figure6).Sincewefoundtheaverageaccretionratewasconsiderablyhigherthantheelevationchangerate,weinterpretthemarshwasbuildingsolelyfromadditionsofsedimenttothemarshsurface,withbelowgroundprocessesofcompactionanddecompositiondominating.OnthewesternsideofGreatBayatSPDCandStuartFarm,increasesinmarshsurfaceelevationrangedfrom1.1to3.9mmyr‐1andaveraged2.6±0.4mmyr‐1(Figure7).SPSETT5andSFD2hadthelargestincreasesinelevation.SPU1andSPU2,whicharelocatedfartherupthemarshgradientinthehighmarshhadthelowestincreasesinelevation(similartoourresultsforGBFmarsh).Whenexcluded(SPU1andSPU2),theaverageannualchangeinelevationwas3.2±0.3mmyr‐1.SurfaceaccretionwasquitevariableforSPDCandStuartFarmsites,withanaverageof2.9±0.9mmyr‐1(Figure8).Accretionrateswereslightlygreaterthanelevationchange(2.9vs.2.6mm/yr)suggestingpeatcompactionanddecompositionweregreaterthanaccumulationandgrowthduringthissamplingperiod.
11
Figure5.ChangestosurfaceelevationforGreatBayFarmsmarshineasternGreatBay.Note:GBF2elevationswereincreasedby40mmtofacilitatevisualcomparisonwithotherSETs.
Figure6.SedimentaccretionovermarkerhorizonsforGreatBayFarmsmarshineasternGreatBay.

12
Figure7.ChangestosurfaceelevationforSandyPointandStuartFarmmarshesinwesternGreatBay.Note:SPSETT5elevationswereincreasedby225mmtofacilitatevisualcomparisons.
Figure8.SedimentaccretionovermarkerhorizonsforSandyPointandSturartFarmmarshesinwesternGreatBay.NoteSPSETT5accretionlevelswereincreasedby26mmandSPD1andSFD2decreasedby5mmand15mmrespectively,tofacilitatevisualcomparisons.

13
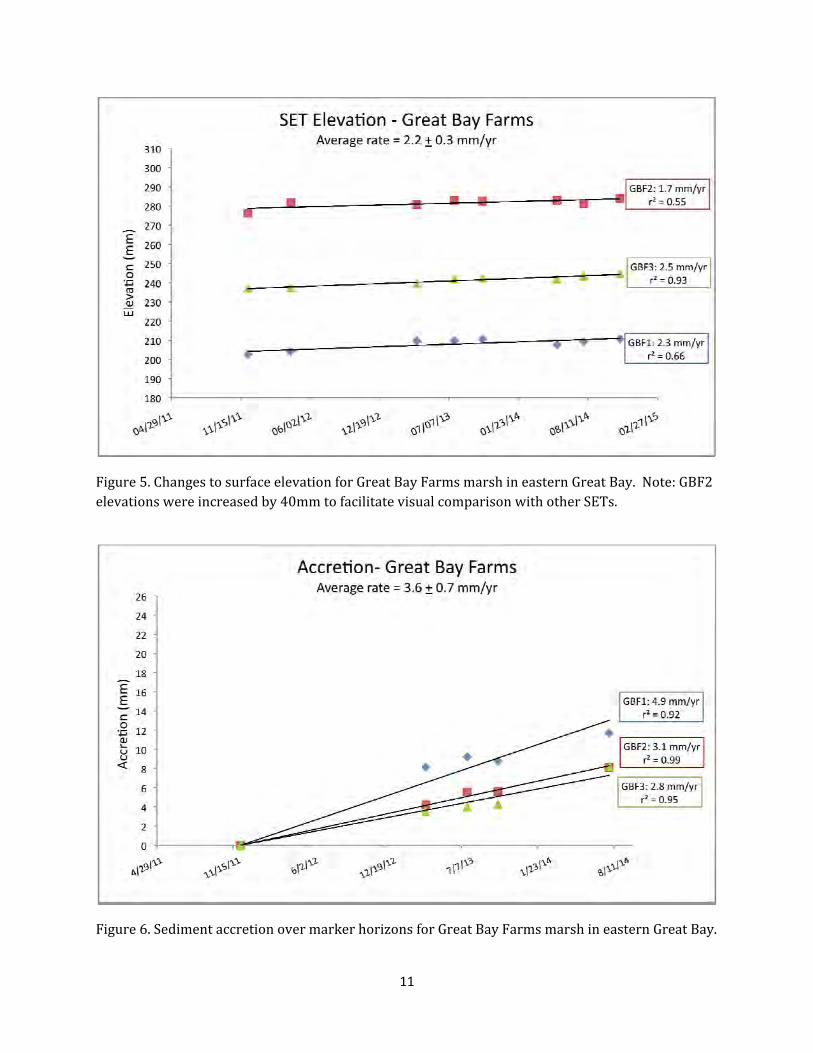
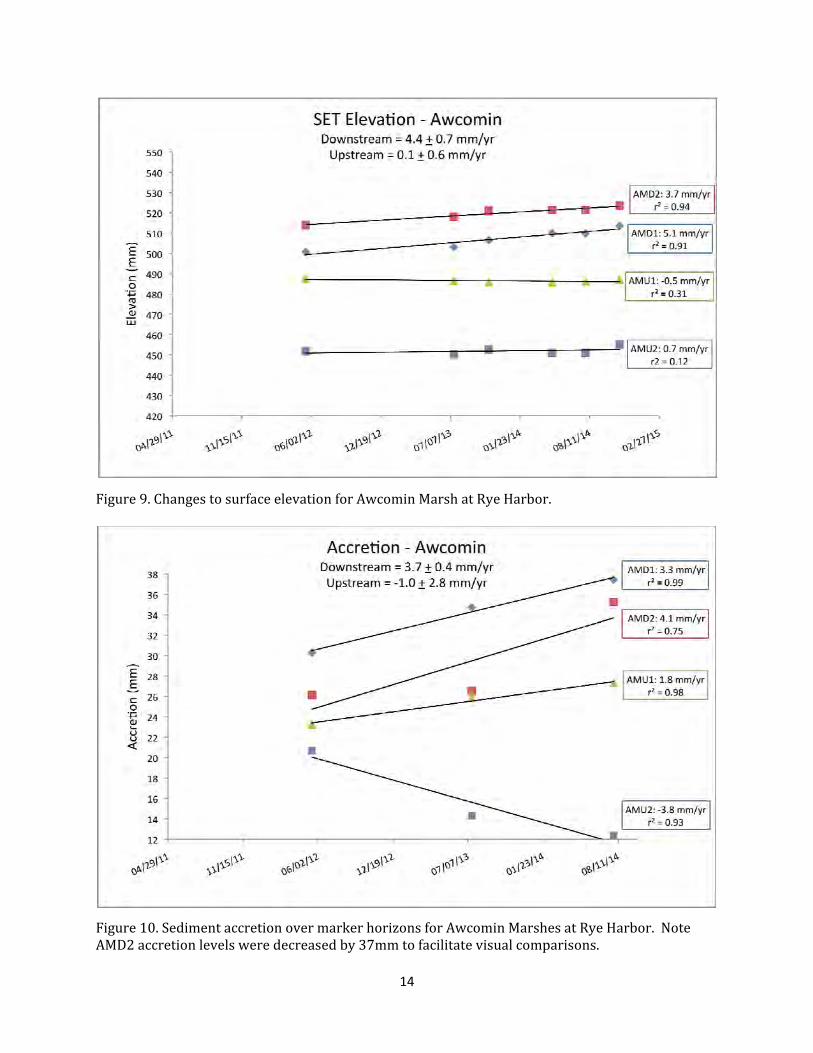
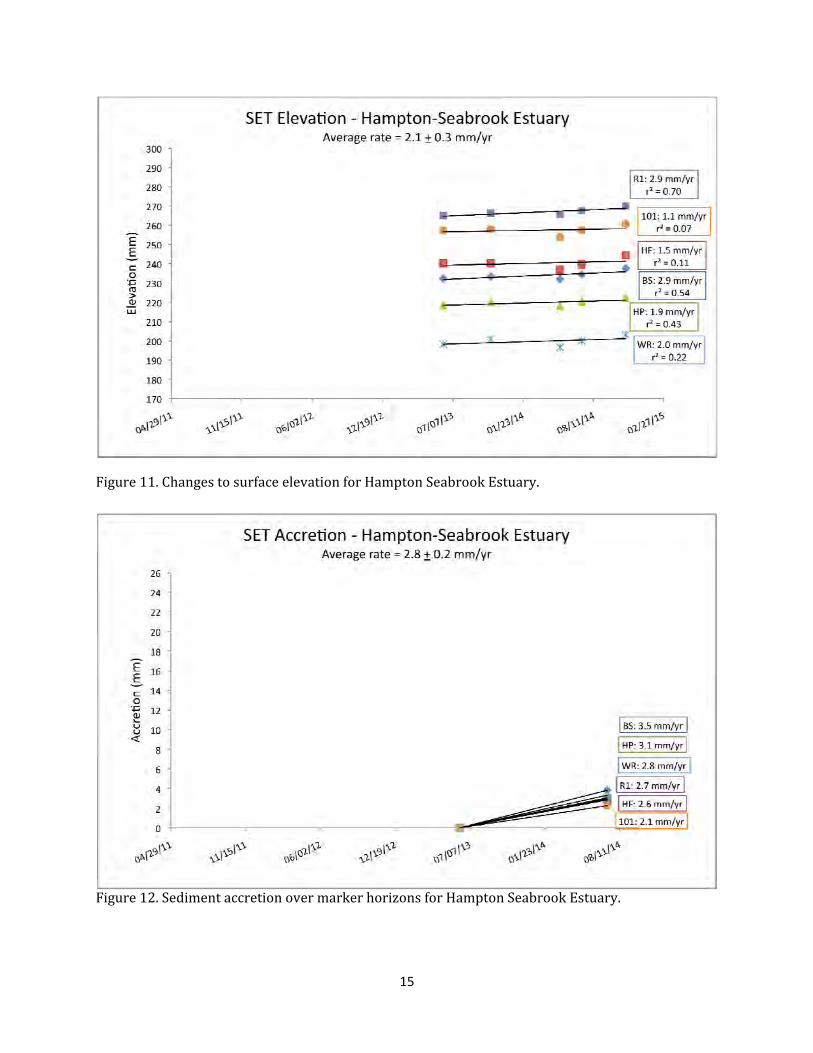
ElevationandaccretionratesnearthecoastatAwcominMarshvariedconsiderablydependinguponlocationandpastrestorationactivities.FordownstreamSETstations(i.e.,inundisturbedmarsh),elevationincreasedatthehighestrateinNH(4.4±0.7mmyr‐1),whereasSETstationsupstreaminatidallyimpactedarea(restoredin1992)wereclosetostatic:only0.1±0.6mmyr‐1(Figure9).Accretionatthedownstreamsite(3.7±0.4mmyr‐1)averagedslightlyhigherthanmostNHsites,andaccountedforapproximately80%ofthetotalelevationchange(Figure10).Onaverage,upstreamSETsdidnotaccreteinthepast3yearsandinsteaderoded(‐1.0±2.8mmyr‐1).AtHampton‐SeabrookEstuarywhereSETstationsaremuchfurtherseparatedthanothermarshsystemsinNH,elevationandaccretionratesshowedlittlevariability,averaging2.1±0.3mmyr‐1and2.8±0.2mmyr‐1,respectively(Figures11and12).Accretionwasgreaterthanelevationchangeandthusaccountedforallofthesurfaceelevationgain.Thisalsosuggestspeatbelowthemarkerhorizonwasdecomposingandcompactingfasterthanitwasaccumulating.IncreasesinelevationwereconsistentovertimeexceptfromlateOct2013toMay2014,wherethemarshsurfaceatallsixstationsactuallydecreasedbyanaverageof2.6mm(Figure11).TheelevationrangesoflowandhighmarshzoneswithinHSEwerecomparedtolocaltidaldatums.Onaverage,theintertidalmarshcommunitiesgrewalonganelevationrangeof1.75m(5.7feet)from0.37to2.12NAVD88m(Figure13).Theseawardedgeofthelowmarshwasfoundtobe0.37m(1.3feet)higherthanmeantidelevel(MTL).Lowmarshextendedupgradientby0.80m(2.7feet)tothetransitionbetweenlowandhighmarsh,whichoccurred,justbelowmeanhighwater(MHW).Theaveragehighmarshelevationoccurred0.10m(4inches)aboveMHWandhighmarshextended0.95m(3.1feet)totheuplandedge,asindicatedbyanabruptchangeinplantspecies.MarshzoneelevationsinHSEwerefurtheranalyzedbetweenthesixsamplingsites.Elevationswereverysimilarforthetransitionfromlowtohighmarshandtheaveragehighmarshelevation.However,thelowerandupperedgesofthemarshappearedtovarybysamplinglocation(0.5mrange;Figure14).R1and101,whicharethetwomostnorthernsitesinHSE,hadthelowestlowedgeandlowestuplandedgeelevations(Figure14).Incontrast,WRandBS,locatedinthesouthernpartoftheEstuary,hadthehighestlowanduplandedges.Ourresults,analyzedasaregressionofthelowandupperedge(p=0.01;r2:0.88),suggestthelowanduplandedgesco‐varied.
14
Figure9.ChangestosurfaceelevationforAwcominMarshatRyeHarbor.
Figure10.SedimentaccretionovermarkerhorizonsforAwcominMarshesatRyeHarbor.NoteAMD2accretionlevelsweredecreasedby37mmtofacilitatevisualcomparisons.
15
Figure11.ChangestosurfaceelevationforHamptonSeabrookEstuary.
Figure12.SedimentaccretionovermarkerhorizonsforHamptonSeabrookEstuary.

16
Figure13.Averageelevationsofmarshboundaries,includinglowmarshloweredgeanduppertransitionzoneandhighmarshtransitionzone(loweredge)andupperedge(atupland).
Figure14.ElevationdistributionofmarshesatSETstationsintheHamptonSeabrookEstuary.

17
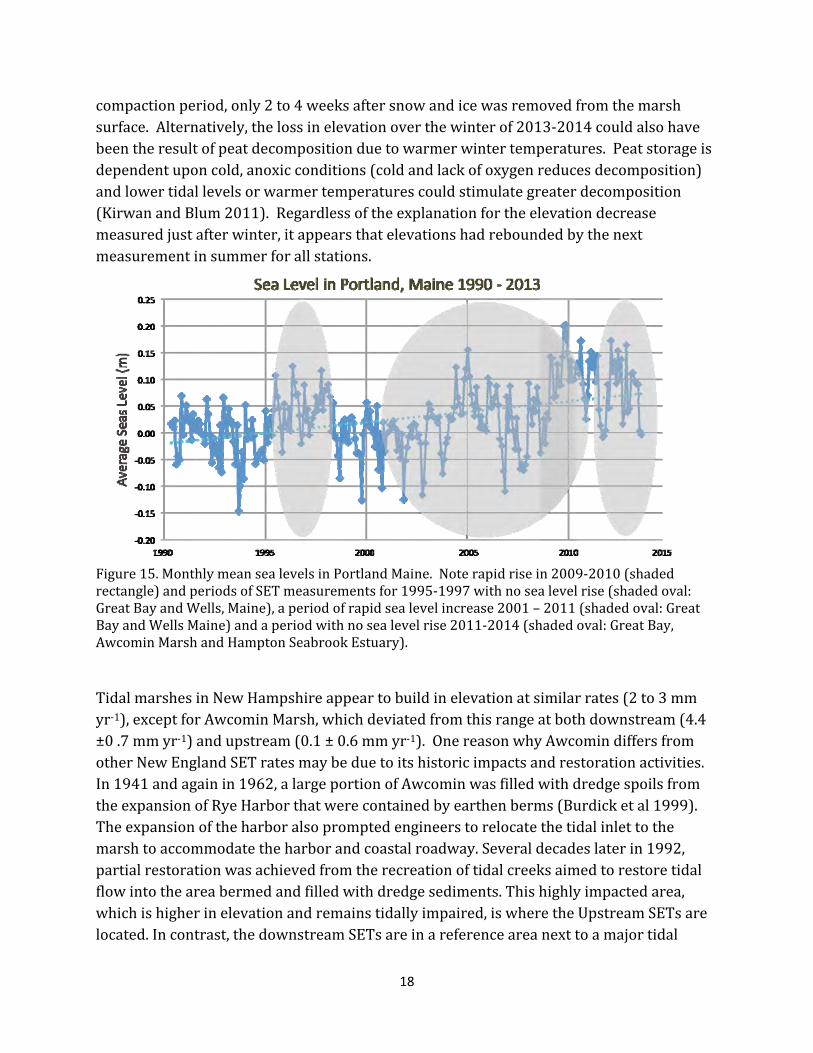
DiscussionOverthepast3years,themajormarshsystemsofNewHampshirehaveincreasedinsurfaceelevationby2.3±0.7mmyr‐1,andmostallofthisincreasecanbeattributedtosurfaceaccretion.Therateofmarshbuildingisslowerthanwhatwefoundfrom2001to2010inGreatBayandWebhannetestuaries,butsimilartoearlierratesatthesesites(1995‐2001;Staceyetal.2012;Burdicketal.2013).Incontrasttothetemporalvariabilityinsurfaceelevation,accretionratesappeartohavelittlevariationovertimeoramongmarshsystems.InNewEngland,accretionrateswereconsistentlybetween2to3mmyr‐1overthepast20years,whichisverysimilartotheratesfoundonaverageforNHoverthepast3years:2.4±0.9mmyr‐1.Aspointedoutearlier,accretionisafunctionofsuspendedsedimentsandmarshpositioninthelandscape,neitherofwhichareexpectedtochangemuchovertime.Processesleadingtopeatgainsandlosses,however,dependonplantproduction,sealevels,temperature,icethicknessandtheirinteractions,whichmayproducevariableresultsinpeataccumulation.BuildingofelevationinNewHampshiremarsheshasappearedtoslowinthepast3years,whichmaybeattributedtoincreasesincompactionanddecompositionprocesses.Ourresultsshownoelevationgainduetopeataccumulationbecauseonaverage,accretionwasgreaterthantotalelevationgainby0.1mmyr‐1(Figure4).Althoughtheresponseofmarshestosealevelisnotcompletelyunderstood,therapidperiodofmarshbuilding(2001‐2010)coincidedwithanunprecedentedriseinsealevelfrom2009and2010(Goddardetal.2015).Subsequenttothisrapidrisewasavariable,butgentledropinsealevelfor2011to2013(Figure15).Suchaperiodoflowersealevelfrom2011‐2013couldhaveremovedtheadvantageofpeatgainingprocessesoverpeatlossprocessesandresultedingainsfromonlyaccretion,asobservedinourstudy.IncreasesinelevationforNHmarshsystemswerefairlyconsistentfrom2011to2014,exceptduringonetimeperiod,whenthemajorityofSETstationsdecreasedinelevation.FromOctober2013toMay2014,halfthestationsatAwcominandGreatBayEstuaryalongwithallofthestationsatHampton‐SeabrookEstuarydecreasedinelevation.Thissystem‐widedecreaseinelevationmayreflectseasonalchanges.DuringthewintermonthsinNewEngland,snowandiceaccumulateonthemarshsurface,addingamassiveweightthatmaytemporarilycompresstheentiremarshplatform.Experimentalresearchthatsimulatedicecompactionsuggeststhehighmarshsedimentsurfacecanbecompactedintheshorttermbyice(46cmthick)upto6.9±0.7mm(Argow&Fitzgerald2006).Inaddition,theyfoundaslittleas10cmoficethicknesscouldcompactthesurfaceofthemarshby2mm.Compactionfromwintericedoesnotappeartohavealastingeffectbeyondseveralweeks.Forourdata,SETsweremeasuredinthespringof2014,rightattheendoftheice
18
compactionperiod,only2to4weeksaftersnowandicewasremovedfromthemarshsurface.Alternatively,thelossinelevationoverthewinterof2013‐2014couldalsohavebeentheresultofpeatdecompositionduetowarmerwintertemperatures.Peatstorageisdependentuponcold,anoxicconditions(coldandlackofoxygenreducesdecomposition)andlowertidallevelsorwarmertemperaturescouldstimulategreaterdecomposition(KirwanandBlum2011).Regardlessoftheexplanationfortheelevationdecreasemeasuredjustafterwinter,itappearsthatelevationshadreboundedbythenextmeasurementinsummerforallstations.
Figure15.MonthlymeansealevelsinPortlandMaine.Noterapidrisein2009‐2010(shadedrectangle)andperiodsofSETmeasurementsfor1995‐1997withnosealevelrise(shadedoval:GreatBayandWells,Maine),aperiodofrapidsealevelincrease2001–2011(shadedoval:GreatBayandWellsMaine)andaperiodwithnosealevelrise2011‐2014(shadedoval:GreatBay,AwcominMarshandHamptonSeabrookEstuary).TidalmarshesinNewHampshireappeartobuildinelevationatsimilarrates(2to3mmyr‐1),exceptforAwcominMarsh,whichdeviatedfromthisrangeatbothdownstream(4.4±0.7mmyr‐1)andupstream(0.1±0.6mmyr‐1).OnereasonwhyAwcomindiffersfromotherNewEnglandSETratesmaybeduetoitshistoricimpactsandrestorationactivities.In1941andagainin1962,alargeportionofAwcominwasfilledwithdredgespoilsfromtheexpansionofRyeHarborthatwerecontainedbyearthenberms(Burdicketal1999).Theexpansionoftheharboralsopromptedengineerstorelocatethetidalinlettothemarshtoaccommodatetheharborandcoastalroadway.Severaldecadeslaterin1992,partialrestorationwasachievedfromtherecreationoftidalcreeksaimedtorestoretidalflowintotheareabermedandfilledwithdredgesediments.Thishighlyimpactedarea,whichishigherinelevationandremainstidallyimpaired,iswheretheUpstreamSETsarelocated.Incontrast,thedownstreamSETsareinareferenceareanexttoamajortidal
19
creek,whichismostlyun‐impactedbyhumanactivities.Webelievethemultiplehumanimpactshavepreventedmarshbuildingattheupstreamsites(0.1mmyr‐1).Thedistributionoftidalmarshesistightlycoupledtotheelevationrangesoverwhichtheythrive,withtheloweredgelimitedbyfloodingstressandtheupperlimitofdominancedeterminedbycompetitionwithhighmarshplants(Levineetal.1998).AmetadataanalysisbyMcKeeandPatrick(1988)examinedtheelevationrangeoflowmarshwheresmoothcordgrassgrewfromMainetoFlorida.Theyfoundtheelevationrangeoflowmarshvariedduetotidalrange,withthelargestrangesatsiteswiththelargesttidalrange.Withanaveragetidalrangeof2.5meters,HSEisattheupperendofthepotentialrangeandmightbeexpectedtotooccurovera1.5meterrange,butwasonlyfoundtobedominantover¾ofameter;beginning0.25metersabovethemeantidelevel(halfwaybetweenmeanhighandmeanlowtides)andextendingalmosttothemeanhighwatermark.Thelowedgeofthelowmarshandhighedgeofthehighmarshwerehighestatthetwosouthernsites,suggestinggreaterfloodinginthesouthernrelativetothenorthernportionoftheestuary.Itisnotclearwhythenorthernportionoftheestuarywouldbefloodedbytidestoalesserextentthanthesouthernportion,butthisresultmightbecausedbywindstress,withstrongnorthernwindsreducingtidesinthenorthandincreasingtidesinthesouth.Inaddition,theonesitewestoftherailroadbermshowedanappreciablyloweredgetothelowmarshaswellasaslightlylowerelevationforthechangefromhighmarshtoupland,indictingthissitemightexperiencelessfloodingthantheotherfiveSETlocationsinHSE.Lessfloodingatthissitecouldbeanindicationoftherailbedposingarestrictiontofulltidalflow.
ConclusionsNewHampshiretidalmarsheshavebeenbuildingatvariableratesoverthepasttwodecades,whichappearstobedrivenbyregionalfluctatingsealevels.EarlierrecordedratesofsurfaceelevationchangeandsealevelsinPortland,ME(Figure15)werebothlow,thenshowedaperiodofrapidrise.Themostrecentmeasurementperiod,2011‐2014,showedslowingofmarshgrowthandlittletonosealevelchange,suggestingasynchronization ofmarshelelvationgrowthandsealeveloverthepasttwentyyears.Thisappearstobemoreevidenceforthepositivefeedbackmechanismthatallowstidalmarshestomaintainthemselveswithgradualfluctuationsinsealevels(CahoonandGuntenspergen2009,BurdickandRoman2012).Additionally,ourdataindicatemarshes

20
areabletocopewithrapidincreasesinsealevels(Goddardetal.2015)atleastintheshortterm(1‐3years),bybuildingatnearlytwicetheirnormalrate.Ascommunitiesplanforclimatechangeandtheincreasesinsealevelpredictedforourcoasts,itwillbevaluabletoalsotrackthechangeinmarshelevation.Significantshorttermchangesinsealevel,suchasthatreportedfor2009‐2010inNewEnglandwaters,areslowtoberecognized(Goddardetal.2015)andusedinplanning,thoughstillveryuseful.Ourmarshdatafrom2011toldusthatsealevelwasrisingfasterthananyofthelatestresultsavailableworldwide(ChurchandWhite2011)orlocally(Goddardetal.2015),thoughwecouldnotestimatehowfastsealevelwasrising.Ourmarshdatacollectedaslateas2014thatarereportedhereshowthatsealevelrisehasabatedforthepresent,withelevationincreasesfueledonlybysedimentaccretiononthesurfaceofthemarsh.

21
REFERENCESArgow,B.A.,D.M.FitzGerald.2006.Winterprocessesonnorthernsaltmarshes:Evaluatingtheimpactofin‐situpeatcompactionduetoiceloading,Wells,ME.Estuarine,CoastalandShelfScience69:360‐369.Boumans,R.,andJ.W.Day,Jr.1993.Highprecisionmeasurementsofsedimentelevationinshallowcoastalareasusingasedimentation‐erosiontable.Estuaries16:375‐380.Burdick,D.M.,S.C.Adamowicz,andC.R.Peter.2013.TrackingelevationchangesinsaltmarshesbyreestablishingSETstations.FinalReportpreparedforUSFishandWildlifeService,Wells,ME11pp.Burdick,D.M.,R.M.Boumans,M.DionneandF.T.Short.1999.Impactstosaltmarshesfromtidalrestrictionsandecologicalresponsestotidalrestoration.FinalReportto:NERRSSilverSpring,MD.Burdick,D.M.,andC.R.Peter.2014.EstablishingSurfaceElevationTablestoSupportSeaLevelAffectingMarshesModel(SLAMM)andAssessVulnerabilityofTidalMarshesinHamptonSeabrookEstuary.FinalReportpreparedforNewHampshireCoastalProgram,Portsmouth,NH9pp.Burdick,D.M.andC.T.Roman.2012.Chapter22:Saltmarshresponsestotidalrestrictionandrestoration.Asummaryofexperiences.pp.373‐382.In:Roman,C.T.andD.M.Burdick(eds.)TidalMarshRestoration:ASynthesisofScienceandPractice.IslandPress.Washington.406pp.Cahoon,D.R.andG.R.Guntenspergen.2009.Climatechange,sea‐levelrise,andcoastalwetlands.NationalWetlandsNewsletter32:8‐12.Chmura,G.L.,D.M.BurdickandG.E.Moore.2012.Chapter15:Recoveringsaltmarshecosystemservicesthroughtidalrestoration.pp.233‐251In:Roman,C.T.andD.M.Burdick(eds.)TidalMarshRestoration:ASynthesisofScienceandPractice.IslandPress.Washington.406pp.Church,J.A.andN.J.White.2011.Sea‐LevelRisefromtheLate19thtotheEarly21stCentury.SurveyofGeophysics32:585–602.Craft,C.,J.Clough,J.Ehman,S.Joye,R.Park,S.Pennings,H.Guo,M.Machmuller.2009.Forecastingtheeffectsofacceleratedseaslevelriseontidalmarshecosystemservices.FrontiersinEcology7:73‐78.Donnelly,J.P.andM.D.Bertness.2001.Rapidshorewardencroachmentofsaltmarshcordgrassinresponsetoacceleratedsea‐levelrise.ProceedingsoftheNationalAcademyofSciences98:14218‐14223.

22
Goddard,P.B.,J.J.Yin,S.M.GriffiesandS.Q.Zang.2015.Anextremeeventofsea‐levelrisealongtheNortheastcoastofNorthAmericain2009‐2010.NatureCommunications6:#6346.DOI:10.1038/ncomms7346.Goodman,J.E.,M.E.Wood,andW.R.Gehrels.2007.A17‐yearrecordofsedimentaccretionin the salt marshes of Maine (USA). Marine Geology 242:109-121. Hay, C.C., E. Morrow, R.E. Kopp, and J.X. Mitrovical. 2015. Probabilistic reanalysis of twentieth-century sea-level rise. Nature. doi:10.1038/nature14093 Levine,J.M.,J.S.BrewerandM.D.Bertness.1998.Nutrients,competitionandplantzonationinaNewEnglandsaltmarsh.JournalofEcology86:285–292.McKee,K.L.andW.H.Patrick,Jr.1988.Therelationshipofsmoothcordgrass(Spartinaalterniflora)totidaldatums:Areview.Estuaries11:143‐151.NichollsR.J.andA.Cazenave2010.Sea-Level Rise and Its Impact on Coastal Zones. Science 328: 1517-1520. DOI: 10.1126/science.1185782 Kirwan,M.K.andL.K.Blum.2011.Enhanceddecompositionoffsetsenhancedproductivityandsoilcarbonaccumulationincoastalwetlandsrespondingtoclimatechange.Biogeosciences8:987–993.Stacey,P.,D.M.Burdick,C.R.Peter.2012.EstablishingMarshesintheGreatBayNationalEstuarineResearchReserveasSentinelSitesforMonitoringEcosystemImpactsofClimateChange.NERRSSystem‐WideMonitoringProgram.SilverSprings,MD.26pp.Stumpf,R.P.1983.Theprocessofsedimentationonthesurfaceofasaltmarsh.Estuarine,CoastalandShelfScience17:495‐508.

23
AppendicesSeeseparatefile