
5GPy: A SimPy-based Simulator for Performance Evaluations ...
28
5GPy: A SimPy-based Simulator for Performance Evaluations in 5G Hybrid Cloud-Fog RAN Architectures Journal Pre-proof 5GPy: A SimPy-based Simulator for Performance Evaluations in 5G Hybrid Cloud-Fog RAN Architectures Rodrigo Izidoro Tinini, Matias Rom ´ Ario Pinheiro dos Santos, Gustavo Bittencourt Figueiredo, Daniel Mac ˆ Edo Batista PII: S1569-190X(19)30161-3 DOI: https://doi.org/10.1016/j.simpat.2019.102030 Reference: SIMPAT 102030 To appear in: Simulation Modelling Practice and Theory Please cite this article as: Rodrigo Izidoro Tinini, Matias Rom ´ Ario Pinheiro dos Santos, Gustavo Bittencourt Figueiredo, Daniel Mac ˆ Edo Batista, 5GPy: A SimPy-based Simulator for Per- formance Evaluations in 5G Hybrid Cloud-Fog RAN Architectures, Simulation Modelling Practice and Theory (2019), doi: https://doi.org/10.1016/j.simpat.2019.102030 This is a PDF file of an article that has undergone enhancements after acceptance, such as the addition of a cover page and metadata, and formatting for readability, but it is not yet the definitive version of record. This version will undergo additional copyediting, typesetting and review before it is published in its final form, but we are providing this version to give early visibility of the article. Please note that, during the production process, errors may be discovered which could affect the content, and all legal disclaimers that apply to the journal pertain. © 2019 Published by Elsevier B.V.
Transcript of 5GPy: A SimPy-based Simulator for Performance Evaluations ...

5GPy: A SimPy-based Simulator for Performance Evaluations in 5G Hybrid Cloud-Fog RAN Architectures
Journal Pre-proof
5GPy: A SimPy-based Simulator for Performance Evaluations in 5GHybrid Cloud-Fog RAN Architectures
Rodrigo Izidoro Tinini, Matias RomArio Pinheiro dos Santos,Gustavo Bittencourt Figueiredo, Daniel MacEdo Batista
PII: S1569-190X(19)30161-3DOI: https://doi.org/10.1016/j.simpat.2019.102030Reference: SIMPAT 102030
To appear in: Simulation Modelling Practice and Theory
Please cite this article as: Rodrigo Izidoro Tinini, Matias RomArio Pinheiro dos Santos,Gustavo Bittencourt Figueiredo, Daniel MacEdo Batista, 5GPy: A SimPy-based Simulator for Per-formance Evaluations in 5G Hybrid Cloud-Fog RAN Architectures, Simulation Modelling Practice andTheory (2019), doi: https://doi.org/10.1016/j.simpat.2019.102030
This is a PDF file of an article that has undergone enhancements after acceptance, such as the additionof a cover page and metadata, and formatting for readability, but it is not yet the definitive version ofrecord. This version will undergo additional copyediting, typesetting and review before it is publishedin its final form, but we are providing this version to give early visibility of the article. Please note that,during the production process, errors may be discovered which could affect the content, and all legaldisclaimers that apply to the journal pertain.
© 2019 Published by Elsevier B.V.

5GPy: A SimPy-based Simulator for 5G Hybrid Cloud-Fog RANArchitecturesRodrigo Izidoro Tininia,∗, Matias Romário Pinheiro dos Santosb, GustavoBittencourt Figueiredob and Daniel Macêdo Batistaa
aDepartment of Computer Science - University of São Paulo - Brazil - Zip Code 05508-090bDepartment of Computer Science - Federal University of Bahia - Brazil - Zip Code 40170-110
ART ICLE INFOKeywords:5G NetworksCloud ComputingFog ComputingCF-RANNFVFOSSSimulator
ABSTRACTThe joint cooperation of cloud and fog computing emerges as a new architectural pattern forfuture 5G networks in order to cope with the increasingly number of mobile elements presentedin such networks. Through the use of the cloud, power efficiency can be achieved through cen-tralization of processing. On the other hand, the use of fog processing nodes increases powerconsumption but helps to decrease the latency of delay-sensitive applications and to increasethe coverage of the network. As the use of cloud and fog presents conflicting characteristics,it is important to accurately study their behaviour in order to define the best way to use such ahybrid architecture. In this work we present a three-fold contribution to the study of joint cloudand fog computing architectures. First, we present a hybrid architecture called Cloud-Fog RAN(CF-RAN) that focus on dynamic activation and deactivation of both network and processingresources in order to maintain a balanced operation between the cloud and the fog. Second, wepresent a performance evaluation model used to analyse the performance of different metricsof CF-RAN. Third, as it is very difficult and costly to build cloud and fog real scenarios, weintroduce 5GPy, a SimPy event-driven simulator, publicly available, used to perform small andlarge scale simulations on architectures such as CF-RAN. We present the architectural detailsof 5GPy and, by using Integer Linear Program (ILP) and graph-based heuristics to allocate re-sources in 5G networks, we performed simulations of CF-RAN operation in a small network andin a large network based on a Brazilian city. The results show interesting aspects and trade-offsbetween cloud and fog computing that were possible to be found with the proposed performanceevaluation model and with the 5GPy simulator.
1. IntroductionCloud Radio Access Networks (CRANs) have emerged as energy-efficient access networks to mobile users in the
upcoming 5G technology. Its energy efficiency comes by the decoupling of BaseBand Units (BBUs) from the antennasto a centralized pool in a cloud processing node. In this regard, all basebandmain processing is moved from the antennafacilities to the cloud, and the antennas are implemented as Remote Radio-Heads (RRHs) that are only responsible toperform simple processing, like Radio Frequency (RF) processing, analog-digital conversion and signal amplification,besides sending the baseband signals to be processed on the BBUs at the cloud.
Although CRAN can greatly reduce energy consumption, the centralization of all baseband processing can lead thecloud to operate above its capacity in scenarios of high traffic demands, which can increase the latency of the basebandprocessing and decrease the Quality of Service (QoS) of latency-sensitive applications [4]. As latency is a crucialaspect of 5G technology, the use of a cloud to process all signals can limit the extension of the implementation of the5G networks, implying that rural or more distant locations can suffer with high latencies or even without access to 5Gservices. As RRHs transmit their signals to the cloud, an optical transport interface, called the fronthaul, is used toimplement these transmissions. In this context, the fronthaul can experience heavy burdens of traffic, which can evenlead to blocking of transmissions [18].
In order to surpass the potential limitations of CRAN, the joint cooperation between Cloud and Fog Computing [19]is expected to play an important role in the development of future 5G networks. To reduce the latency experienced inCRAN in high traffic demand scenarios, fog computing can be used, allowing for instance, the deployment of Internet
∗Corresponding [email protected] (R.I. Tinini); [email protected] (M.R.P.d. Santos); [email protected] (G.B. Figueiredo);
[email protected] (D.M. Batista)ORCID(s): 0000-0002-8356-157X (M.R.P.d. Santos)
Tinini, et. al.: Preprint submitted to Elsevier Page 1 of 27

5GPy: A SimPy-based Simulator for Performance Evaluations in 5G Hybrid Cloud-Fog RAN Architectures
of Things and Smart Cities applications in an energy and latency-efficient manner. In this context, an architecture likeCRAN can be extended by the implementation of local processing nodes that can be used in metropolitan and ruralareas to support low-latency applications and increase the coverage of CRANs.
Such combined architecture of cloud and fog computing has been recently proposed in the literature as a hybridCloud-Fog RAN (CF-RAN) architecture [18]. In CF-RAN, power efficiency is maintained from the centralized char-acteristics of CRAN. However, additional local processing nodes, called fog nodes, are put closer to the RRHs. Thesefog nodes can be used to receive baseband processing when the cloud is experiencing high workloads or to servelatency-sensitive applications. Naturally, these fog nodes will increase the coverage of CRAN but at the cost of anincrease on the power consumption. So, in order to avoid a huge growth in power consumption, the BBUs in CF-RANare implemented as virtual machines called virtual BBUs (vBBUs) by means of Network Functions Virtualization(NFV). In this regard, fog nodes and their vBBUs are dynamically activated only when the network traffic load de-mands. Hence, this cooperation between cloud and fog in CF-RAN can lead to gains in power consumption, networkcoverage, latency reduction and low rates of service blocking probability [18].
Despite the expected gains, the cooperative use of cloud and fog paradigms as in CF-RAN is still in its earlydevelopments and much of its architectural patterns and protocols have not been defined. In this context, a performancemodel that captures each operational aspect of CF-RAN is an important tool for its complete development. Thisperformance model would allow specific performance analysis and the evaluation of different protocols and algorithmsin the architecture. Among all the options to realize performance evaluation in 5G networks, simulators stand outbecause they allow the rapid creation of complex large scale network infrastructures for real-time tests without thehigh costs involved when real deployments or testbeds are used. However, many existing simulators only allow thesimulation of protocols above layer 3 in 5G scenarios. In order to enable computationally efficient evaluations of 5Gnetworks, a general purpose and scalable simulator considering layers 1 and 2 operations is needed.
In this paper we achieved three contributions: (1) a study on the joint collaboration of cloud and fog in CF-RAN,with a focus on the energy and latency aspects of its operation. In order to achieve this, (2) we propose a performanceevaluation model for CF-RAN and a (3) simulator of CF-RAN-based networks called 5GPy, a Python-based simulatorfocused in small and large scale simulations of 5G networks. 5GPy is based on the SimPy library and is implementedunder a process-oriented paradigm, in which the interactions between different parts of the CF-RAN are implementedas process communications. Moreover, 5GPy is a modular simulator, with each important aspect of CF-RANmodeledindependently. Hence, a user is able to implement and evaluate different protocols without having to concern aboutthe complexity of the CF-RAN architecture itself, the simulator or incompatibilities between different protocols. Itis worth mentioning that 5GPy is publicly available as a free and open-source software (FOSS). To demonstrate thefeatures and advantages of 5GPy, we report a set of experiments made in the simulator by implementing an IntegerLinear Programming (ILP) formulation and a graph-based heuristic previously proposed in [18] to allocate resourcesin 5G networks.
The rest of this paper is organized as follows: Section II presents the state-of-the-art in tools to simulate severalaspects of 5G networks. Section III presents the CF-RAN architecture. The performance evaluation model of CF-RANis also presented in Section III, while Section IV presents the architecture and operation of 5GPy. In Section V someexperiments and performance evaluations are presented. Finally, Section VI concludes the paper.
2. Related WorksSeveral aspects of 5G networks have been extensively studied in the literature. Energy-efficient and high speed
mobile networks. The use of simulators became increasingly popular in several studies, like in [6, 14, 13, 1]. However,all those simulators focused only on the LTE and LTE-A networks, not responding to current network requirementsassociated with the requirements of 5G networks like increased bandwidth requirements, spectrum efficiency and lowlatency. Other proposed simulators, like the one proposed in [8], present only a few extensions on the protocols stackof the LTE-A as an additional feature to 5G, not satisfying the overall requirements of these networks.
The system-level C-RAN simulator, presented in [11], is based on Vienna LTE system-level simulator [15] andwas designed, as its main contribution, to test some C-RAN system functionalities, such as centralized user schedulingand aggregation of global carrier per antenna to perform edge-user joint transmission. It also allows the simulation ofnetworks with different cell sizes, the configuration of several cloud parameters and the inclusion of different RRHson the network. However, despite these benefits, there is the necessity of development of general purpose simulatorsto enable efficient computation evaluations of 5G networks with physical (PHY) and link layers assignments. This
Tinini, et. al.: Preprint submitted to Elsevier Page 2 of 27

5GPy: A SimPy-based Simulator for Performance Evaluations in 5G Hybrid Cloud-Fog RAN Architectures
Table 1Comparison of the Related Works with the 5GPy
Simulator Language Type OpenSource
Main Features
C-RAN Sim. [11] MATLAB System/linklevel
No Edge-user joint transmission, global per-antenna carrier aggregation and centralizeduser scheduling, adoption of the TU-Vein Simu-lator to modeling realistic channel environment
mmWave [10] NS-3 Link level Yes 5G system-level simulation, allow modulationof the Physical (PHY) and Medium AccessControl (MAC) layers
GTEC 5G [3] MATLAB Link level Yes link layer simulator for Orthogonal Frequency-Division Multiplexing (OFDM) and Filter BankMulticarrier (FBMC)
Vienna 5G [12] MATLAB System level Yes propagation models simulation, macroscopicpropagation analysis, heterogeneous interfacesand networks
EdgeCloudSim [16] JAVA System level Yes CloudSim-based, implemented to provide net-work delay calculation in a single server queuemodel, XML devices configuration
MyiFogSim [9] JAVA System level Yes mobility support through VMs migrations be-tween cloudlets
5GPy Python System/linklevel
Yes PHY and Link-level simulator with Time-and-Wavelength division multiplexed passive op-tical network (TWDM-PON); uses NFV andFog computing; various statistical analysis
limitation of the system-level C-RAN simulator is circumvented by the 5GPy simulator.Mezzavilla et al. [10] presented a module for the NS-3 simulator called mmWave. The integrated module was
developed to provide discrete event simulation of PHY and Medium Access Control (MAC) layers. Interfaces with theNS-3 Long Term Evolution (LTE) module were also developed. Although it presents features that allow customizationof developed modules for simulating the PHY and MAC layers and the mmWave full-stack, this is a LTE focusedsimulator, not responding to all the needs of 5G networks in terms of the transport of baseband signals through thefronthaul to processing resources.
The GTEC 5G Simulator is another tool developed as a link layer simulator. It considers Orthogonal Frequency-Division Multiplexing (OFDM) and Filter Bank Multicarrier (FBMC) signals [3] in its operation. The simulator codeis organized in modules to facilitate the implementation of new functionalities. Furthermore, it presents the simulationof radio transmitters and receivers, as well as different channel models and baseband processing functions. Even withthe modularity of the simulator, the specific focus on the link layer limits a series of investigations that are necessaryfor the design and evaluation of 5G networks that lies beyond the radio technology domain.
A popular tool used in 5G simulations is Vienna 5G [12]. It is a system-level simulator based on MATLABallowing performance evaluation of multi-tier networks, and supporting connection of different types of nodes. TheVienna 5G simulator provides compatibility with its LTE-A predecessor. It simulates propagation models by meansof variability of macroscopic propagation analysis, the 3GPP 3D channel model and heterogeneous interfaces andnetworks. However, this tool does not support analysis on the optical fronthaul, a fundamental aspect for the operationof 5G networks.
Regarding the simulation of fog computing scenarios, the literature has a wide range of cloud-based simulators.The EdgeCloudSim [9], for example, is based on CloudSim [2] and proposed as a tool to simulate processing in virtualmachines (VMs) in edge computing scenarios. Another simulator is MyiFogSim [16], an extension of iFogSim [5],that was designed for evaluation of resource allocation algorithms in fog computing-based mobile network scenar-ios.Although these presented tools make use of fog computing paradigm, they are not designed for the simulation andevaluation of fog computing operation in 5G networks, especially related to constraints in optical fronthaul networksthat allows communication between users and fog nodes.
Tinini, et. al.: Preprint submitted to Elsevier Page 3 of 27
5GPy: A SimPy-based Simulator for Performance Evaluations in 5G Hybrid Cloud-Fog RAN Architectures
Regarding related works, the objective of 5GPy is to cover simulations of the fronthaul communications amongRRHs, fog nodes and cloud, focusing on the allocation of network and processing resources. Moreover, our tool aimsto promote the evaluation of a wide range of performance metrics in function of the operation and state of fronthauland processing nodes.
Table 1 summarizes all the simulators presented on this section by comparing themwith the 5GPy. Amore detailedqualitative analysis will be provided in subsection 4.3 to compare the objectives of 5GPy with other available tools.
3. CF-RAN Architecture for Collaborative Use of Cloud and Fog ComputingIn this section we present CF-RAN, a 5G network architecture designed to promote energy-efficiency and low-
latency in future mobile networks through the combined use of cloud and fog computing, optical networks and theNFV paradigm. First, we will present the aspects of the architecture and then, its operation.
CF-RAN is a two-tier mobile edge computing architecture, where the first tier comprises a cloud computing layerand the second tier comprises a fog computing layer. In both layers, baseband processing is performed in vBBUs thatare hosted in virtualized containers called Virtual Digital Units (VDUs). Each VDU serves as a virtualized pool ofBBUs that, thanks to the NFV paradigm, are dynamically instantiated.
We assume that both the cloud and fog layer are equipped with the same processing functions, so, relying on theNFV paradigm, processing functions of the network can be activated or deactivated in function of the network demandand on the optimization objectives of the telecommunication operators.3.1. Details of the Processing Nodes
As both cloud and fog nodes share the same processing capabilities, their architecture is similar, except for the cloudnaturally having more processing capacity than fog nodes. Each processing node implements a set of VDUs in whichvBBUs are instantiated to perform the baseband processing of some RRH’s Common Public Radio Interface (CPRI)flow. In this regard, vBBUs are activated by the NFV paradigm in function of the network traffic demand. Moreover,Virtual Private Optical Networks (VPONs) are dynamically created to support CPRI transmissions to active vBBUsconsidering the availability of wavelengths in the fronthaul.
The choice of using only the cloud, only the fog or both cloud and fog nodes relies on the objectives of the networkoperators. For instance, if operator wants the most power efficient operation, the use of the cloud must be prioritizedover the fog nodes. On the other hand, if low-latency is prioritized, the fog processing functions must be activatedprior to the cloud.
Each processing node also implements the virtualized Optical Line Terminal (OLT) and its set of virtualized LineCards (LC). Each LC forwards the CPRI traffic it receives from a VPON directly to the VDU associated to it. Note that,as each VDU has limited capacity, eventually the CPRI traffic in some VPON may exceed the processing capacity ofits associated VDU. In this case, two alternatives arise for CF-RAN. The first is the use of an internal backplane switchto forward a LC/VPON’s surplus CPRI traffic between its associated VDU and another VDU associated to other LC.The second option is to use the technology of elastic Virtual Machines in order to dynamically expand the capacity ofa VDU.3.2. TWDM-PON Fronthaul Architecture
To promote energy-efficiency and low-latency, a TWDM-PON is used to implement the fronthaul and connectRRHs to both cloud and fog nodes. In TWDM-PON, each RRH is directly connected to a single Optical Network Unit(ONU), that is responsible to transmit the CPRI data from that RRH through an optical channel towards a virtualizedOLT deployed in each processing node.
Each OLT comprises a set of virtualized LCs, which are virtualized transceivers responsible to receive the trafficfrom a specific wavelength of the TWDM-PON and forward it to an associated VDU. In this regard, several ONUs canshare a common wavelength to transmit CPRI traffic to a LC in a common processing node in order to form a VPON.A VPON is a dedicated PON between several RRHs and a common processing node, where the PON is shared by theRRHs in a TDM manner.
Regarding the fronthaul fiber architecture, a three-tier optical splitters architecture is used to multiplex traffic fromseveral ONUs towards the cloud and fog nodes. As seen in Figure 1, each ONU connects to a tier-3 optical splitterinternal to a fog node through a dedicated fiber. This tier-3 optical splitter is responsible for reflecting incoming VPONssignals both to the LCs in the fog and to a tier-2 optical splitter that forwards traffic to the cloud. The tier-2 optical
Tinini, et. al.: Preprint submitted to Elsevier Page 4 of 27

5GPy: A SimPy-based Simulator for Performance Evaluations in 5G Hybrid Cloud-Fog RAN Architectures
Figure 1: Overall CF-RAN architecture
splitter multiplex optical signals from several VPONs from another tier-3 optical splitters and forward them to a tier-1optical splitter located in the cloud. Finally, the tier-1 optical splitter is capable of multiplexing the signals from severaltier-2 incoming VPONs and forward them to its set of LCs and consequently to VDUs and vBBUs instantiated at thecloud. Note that each VPON can only transmit to a single processing node in order to avoid that different VPONs thatshare the same wavelength have their optical signals collided in optical links due to optical splitters reflecting.3.3. Overview of CF-RAN Operation
The cooperation between cloud and fog nodes in CF-RAN comes from the capability of dynamically activateprocessing and network resources to support the network demand. So, CF-RAN operation relies on dynamicallyinstantiating vBBUs and creating VPONs to support processing and transmission of CPRI flows, respectively. Weconsider that a centralized controller is responsible to process each incoming CPRI request and properly activate thenetwork resources.
The overall CF-RAN operation can be summarized as the solving of the vBBUs Placement and VPON Formation(VP-VF) problem][17]: For each incoming CPRI request in the network, the centralized controller must allocate thisrequest in a vBBU in the cloud or in a fog node. If the cloud has enough capacity on its VDUs, a vBBU is activate init to receive the CPRI flow. However, if the cloud is experiencing a high workload, the request is allocated in a vBBUin a fog node. However, if neither the cloud nor the fog has enough processing capacity on its VDUs, the request isblocked.
After the processing of the request is determined, a VPON must be used to transmit the request to the allocatedvBBU. If the node which hosts the vBBU already has created VPONs with free capacity, the request is sent throughit. Otherwise, a new VPON is created in this node using a free wavelength that is not being used by any other node.Note that, if no VPON was found to transmit the request, the request is also blocked.
Finally, after the vBBU and the VPONs are allocated to a request, the transmission and processing of the requestis initiated. When the request is processed, the vBBU and the VPON bandwidth allocated to it must be released soother requests can use it.
CF-RAN is also capable of re-configuring its active elements as resources becomes unbalanced due to some re-quests leaving the network or due to changes on the network demand across time. Basically, when requests begin toleave the network and release used resources, a centralized controller checks if the active resources can be minimizedin order to support the traffic being processed. If so, the requests are re-allocated both to vBBUs and VPONs in orderto minimize the amount of active resources.
As the CF-RAN operation considers several network elements and behaviours, in next subsection we will describea mathematical model proposed by us to perform evaluation on important aspects of the CF-RAN operation.
Tinini, et. al.: Preprint submitted to Elsevier Page 5 of 27

5GPy: A SimPy-based Simulator for Performance Evaluations in 5G Hybrid Cloud-Fog RAN Architectures
Table 2vBBU Processing Latency
RRH RF UL/DL Processing Time ∼40�sCPRI Processing Time (RRH + BBU) ∼10�sBBU Processing Time (UL/DL PHY+MAC) ∼2700�s
3.4. Performance Evaluation Model for CF-RANAs CF-RAN operation relies on the cooperation between cloud and fog computing, the evaluation of its perfor-
mance is crucial when designing protocols because, as fog and cloud perform similar but sometimes opposite paradigms(i.e. the cloud resorts to the centralization of processing and the fog resorts to the distribution of the cloud capabilities),several trade-offs may arise during this operation.
For instance, although network coverage can be increased in CF-RAN when the fog is used, this leads to an in-creasingly power consumption [19]. On the other side, if only the cloud is used, power consumption is reduced but atthe cost of an increasingly latency and blocking probability [18].
In this subsection, we present a performance evaluation model for the operation of CF-RAN that can be used inthe design of algorithms and performance evaluations. Following, we present mathematical models for evaluatingimportant CF-RAN performance metrics identified so far:Power consumption: The power consumption in CF-RAN comes from the consumption of the active processing
elements, such as processing nodes, VDUs, vBBUs, the internal backplane switch and LCs activated to receivetraffic from VPONs. We model the overall power consumption by Equation 1, where xn is the set of all Nprocessing nodes, Cn is the set of power costs of each processing node n, zwn is the set of each created VPONw that transmits traffic to processing node n,W is the total number of VPONs, Clc is the power cost to activateeach one of the LCs, en is the set of each backplane ethernet switch in each node n and Ce is the power to activateeach one of them. xn, zwn, and en assume value 1 when activated and 0 when deactivated. Cn, Clc , and Ce canbe provided by the hardware manufacturer or can be previously measured through benchmarks.
Cnetwork = (N∑n=1
xn.Cn) + (W∑w=1
N∑n=1
zwn.Clc) + (N∑n=1
en.Ce) (1)
Fronthaul latency: During vBBU processing, CPRI protocol establishes a strict round-trip latency of at most 3msbetween RRHs and vBBUs. This latency requirement comes from the Hybrid Automatic Retransmit reQuest(HARQ) protocol, used to control frame retransmissions between User Equipments (UEs) and RRHs.The vBBU maximum latencies of processing functions performed prior to the HARQ protocol operation arepresented in Table 2 (UL means Upload and DL means Download). The sum of all latencies is equal to 2750�s,which allows the fronthaul to provide a round-trip propagation latency of at most 250�s between RRHs andvBBUs.As TWDM-PON do not implement active intermediate nodes between RRHs and vBBUs, in our model, thefronthaul latency is only the time that each optical signal from a VPON takes to be transmitted between twoend points expressed by Equation 2, where Flatency is the overall fronthaul propagation latency, Drrℎ−proc is thedistance in km between the RRH and its processing node and Lspeed is the speed of light inside the optical fiber,which is ∼ 2 ∗ 108m/s, considering a multi-mode fiber with a core of size 50�m. The factor of 2 is used tocompute the propagation time for a round-trip between RRHs and vBBUs.
Flatency = 2(Drrℎ−proc∕Lspeed) (2)
Intercommunication latency among vBBUs: This latency comes from the use of the backplane ethernet switch toswitch traffic among VDUs. For instance, if the CPRI traffic transmitted in a VPON is processed in two or more
Tinini, et. al.: Preprint submitted to Elsevier Page 6 of 27

5GPy: A SimPy-based Simulator for Performance Evaluations in 5G Hybrid Cloud-Fog RAN Architectures
different VDUs, the internal switch is activated to commute traffic among these VDUs. To model this switchingoperation, we define the following binary variables:xiwn: = 1 if the traffic demand of RRH i is processed at node n being transmitted at the VPON w. 0 otherwise.uiwn: = 1 if RRH i is processed at the VDU w at node n. 0 otherwise.giwn: = 1 if the traffic from RRH i, transmitted through VPONw, is switched among different VDUs in node n.0 otherwise.In order to account the latencies as result of traffic switching among VDUs, the relations between the aforemen-tioned variables presented on Equations 3, 4, 5, and 6 are proposed. In the equations, R is the total number ofRRHs. The equations impose a XOR operation for variables xiwn and uiwn to equal variable giwn to 1.
giwn ≤ xiwn + uiwn,∀i, w, n ∈ {1,… , R}, {1,… ,W }, {1,… , N} (3)
giwn ≥ xiwn − uiwn,∀i, w, n ∈ {1,… , R}, {1,… ,W }, {1,… , N} (4)
giwn ≥ uiwn − xiwn,∀i, w, n ∈ {1,… , R}, {1,… ,W }, {1,… , N} (5)
giwn ≤ 2 − xiwn − uiwn,∀i, w, n ∈ {1,… , R}, {1,… ,W }, {1,… , N} (6)Finally, the overall network latency from traffic switching among VDUs is given by the Equation 7.
R∑i=1
W∑w=1
N∑n=1
giwn (7)
Note that as we are using binary variables to represent the switching of traffic, the aforementioned variables andrelations can be used as input parameters and restrictions to ILP optimization models.
Blocking probability: The blocking probability shows the amount of RRHs requests that can not be processed due tolack of processing or network resources. It is traditionally given by Rlost∕Rarrived , where Rlost is the amount ofRRHs requests not processed and Rarrived is the total amount of RRHs requests that arrived in the network.
Bandwidth wastage: The efficient use of bandwidth in CF-RAN comes from the transmission of all CPRI flowsthrough the least possible activated VPONs in the network. Regarding the algorithm used to allocate bandwidthon CF-RAN, the rate of wasted bandwidth can be less or more for a given number of CPRI flows. We definethe bandwidth wastage by Equation 8, where Tcpri is the total CPRI flow and Tvpons the amount of availablebandwidth.
1 − (Tcpri∕Tvpons) (8)Usage of vBBUs: The usage of vBBUs can be accounted as a function of the amount of CPRI processing load in some
node and the amount of vBBUs activated to support this load. We define the usage of vBBUs by Equation 9,where Tprocessing is the total CPRI traffic being processed on the network and TvBBUs is the amount of vBBUsactivated in the network.
UvBBU = Tprocessing∕TvBBUs (9)Tinini, et. al.: Preprint submitted to Elsevier Page 7 of 27
5GPy: A SimPy-based Simulator for Performance Evaluations in 5G Hybrid Cloud-Fog RAN Architectures
Percentage of down time of vBBUs during Live Migration process: Considering the average operation time of eachvBBU, this metric evaluates the rate of time that the vBBU service will be down due to a migration from a fognode to the cloud. It is expressed as the ratio presented in Equation 10, where TDownT ime is the average interrup-tion time of the vBBUs services and TOpT ime is the average operation time of the RRHs.
TDownT ime∕TProcT ime (10)Execution time of algorithms: This general metric evaluates the convergence time of the algorithms executed in the
network, probably by the network operator, to take decisions about resources allocation. It is used to evaluatethe time feasibility of proposed algorithms.
4. The 5GPy SimulatorIn this section we present the architecture of the proposed 5GPy simulator1. The 5GPy simulator is a modular
simulator where each relevant aspect of the 5G network is encapsulated in a specific Python module apart from others.The performance evaluation model presented on Subsection 3.4 is implemented inside 5GPy.
The core of 5GPy relies on a core simulation module based on a extension of the SimPy simulator. SimPy is aPython library that implements generic tools for event-driven simulations. In the simulator, active network elements,such as a RRH, are modelled as processes. Processes are a representation of Python generators that are responsibleto create events (for instance, in a event queue) and, regarding a timeout value, yielding them for processing. In thisregard, the timeout itself is another process responsible to control the timeline of the simulation.
When an event is yielded, the process that yields the event is suspended and waits for the processing of the eventto be resumed. For instance, when a CPRI transmission arrives at the network, a RRH yield this event, gets suspendedand waits for any algorithm to handle the transmission of the request so the RRH operation is resumed, e.g. the CPRItraffic was transmitted or not.In 5GPy, SimPy processes are used to model the generation of events of single or multiplenetwork elements, for instance, a single RRH or several RRHs.
In order to implement the event-driven simulation of CF-RAN, 5GPy relies on three main elements: A traffic-generator (TG), a network scheduler and processing elements. The TG is a SimPy process responsible for generatingany kind of events in certain time intervals and providing them to the network scheduler. Given some probabilitydistribution with a certain mean value, e.g. a Poisson distribution, it yields events from an event list. The event listcan contain any type of event related to the operation of a 5G network, e.g. a RRH CPRI traffic, a wireless sensorgenerating data or a smart phone generating applications requests, among others.
In this paper, we consider that the event being generated by the TG is a RRH request, which is retrieved from alist of turned off RRHs that are created prior to the start of the simulation. A RRH request comprises the request fora processing node with a vBBU and a VPON with free capacity to receive and process the baseband signals from aRRH. Each RRH request has also a service time, given by any probability distribution, that indicates how long theRRH will be processed in its vBBU. Similarly to the list of turned off RRHs, our simulator also implements a list forkeeping RRHs that are active and being processed in the network.
Moreover, in order to implement traffic variations during certain periods of time, e.g. a daily, weekly or monthlytraffic pattern, the TG also implements a traffic pattern generator (TPG). The TPG is responsible to feed differentmean values for the probability distribution used by the TG following specific time intervals during a simulation. Forinstance, the TPG can control the TG to increase its traffic generation in a hour-per-hour pattern or in a minute-to-minute pattern.
The network scheduler is implemented via another SimPy tool, the Store resource. A SimPy Store resource is aclass that stores received events in an object queue and provides them to a processing element in the network. In otherwords, SimPy’s Store models the production and consumption of events. The network scheduler stores the eventsgenerated by the TG and, following any policy, removes an event and sends it to its responsible processing element.Finally, the processing elements can be any class created by the user that is responsible to perform the processing ofthe generated events. For instance, a centralized control plane responsible for receiving events of CPRI requests andfinding available processing nodes and bandwidth to these transmissions can be a implementation of a 5GPy processingelement.
1The simulator is available at https://github.com/rodrigo-tinini/5GPy (Last accessed at Jun 30, 2019).
Tinini, et. al.: Preprint submitted to Elsevier Page 8 of 27
5GPy: A SimPy-based Simulator for Performance Evaluations in 5G Hybrid Cloud-Fog RAN Architectures
Figure 2: Relations between modules of 5GPy
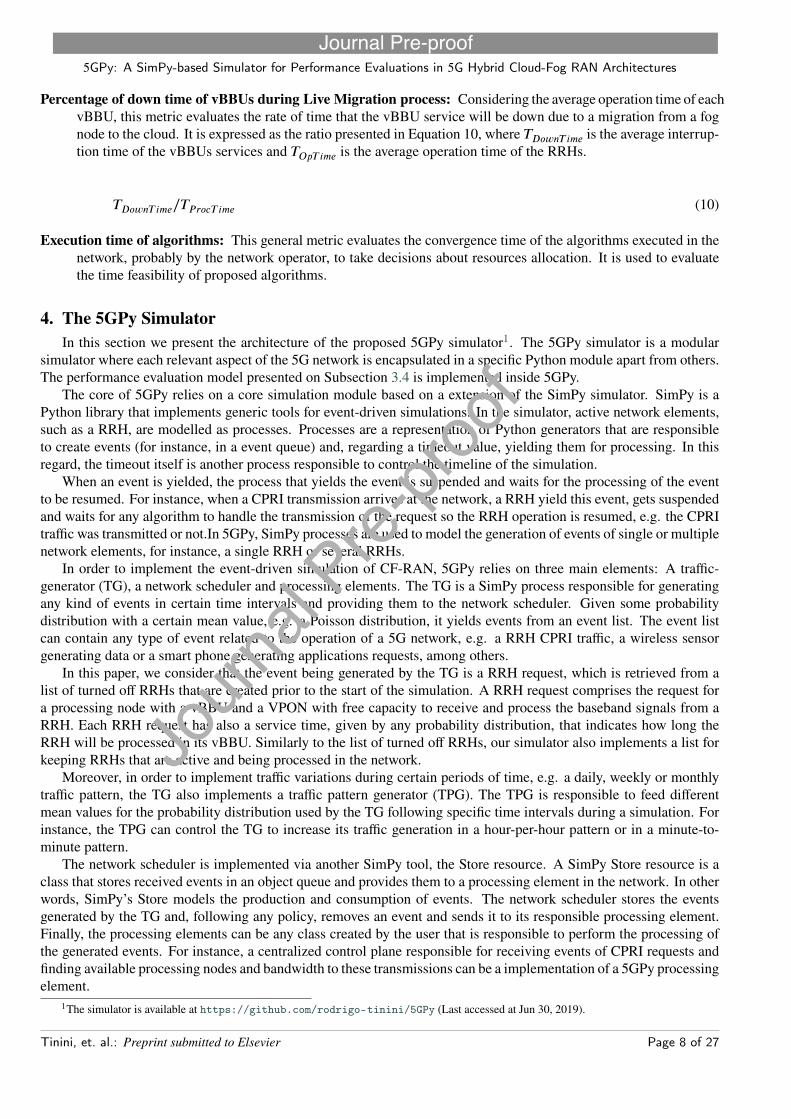
The architecture of 5GPy comprises the following modules: Simulation, Configuration, Network, Algorithm, Per-formance Evaluation, and Log, which will be explained bellow. The relations between these modules are depicted inFigure 2.
SimulationThe Simulationmodule comprises amain class that is responsible to initiate one ormore TGs, the network scheduler
and the processing elements. The values used for this initiation comes from the Configuration Module. It is importantto notice that 5GPy allows the simulation of both dynamic and static traffic scenarios. In static traffic scenarios, for agiven number of simulation runs, a pre-determined load of RRH requests is passed as the input for any algorithm to beevaluated, without randomly arrival or departure of these requests. Although static traffic does not reflect real scenarioslike dynamic traffic simulations, it is often used to evaluate time-consuming optimization models in order to guide thedevelopment of time-efficient heuristics and also to give insights into the dynamic network operation itself [20].
ConfigurationThe Configuration module is used to set the parameters of the simulation (e.g. the details of the topology, the
algorithms to be executed) and invoke the Simulation module to execute one or more simulation runs. It is basically aPython script in which the user set values to built-in variables of the simulator in order to model the topology that he/shewants to simulate. In this module, the user defines the duration of the simulation (e.g. a daily or a weekly operationof a 5G network) and time steps for change of traffic load as the parameters of the TPG to handle the dynamic arrivaland departure of RRH requests. Parameters for the performance evaluation are set in this module, like the confidencelevel used to calculate the confidence interval for the average results of multiple simulation runs.
NetworkThe network module contains attributes that represents the capacities of the elements in the network topology. In
this module, Python 1D and 2D arrays are used to represent the network elements and their capacities. For instance, anetwork with three processing nodes can be represented by the 1D array nodes, where |nodes| = 3, and the capacityof each processing node i can be represented by the 2D array Ii, where, for instance, Ii = (10, 10, 10) tells us that theprocessing node i has 3 vBBUs with the capacity to process 10 CPRI traffic requests. Similarly, the VPONs allocatedto each processing node can be represented by the 2D arrayWn, where, for instance,Wi = (1, 4) indicates that VPONs1 and 4 were created on node i.
The rationale behind the use of basic Python data structures to represent the topology instead of classes is becausein order to scale the simulations to large scenarios, it is less computationally expensive to use simple data structuresthan to create and instantiate several complex classes to represent each element of the topology. Furthermore, for ILPand heuristic-based solutions that will be executed in the simulator to allocate resources, it is more practical to describethe characteristics of a topology in the form of indexed elements of basic data structures, since input parameters anddecision variables are commonly represented as 2D or 3D arrays in ILP and heuristic-based solutions.
Tinini, et. al.: Preprint submitted to Elsevier Page 9 of 27
5GPy: A SimPy-based Simulator for Performance Evaluations in 5G Hybrid Cloud-Fog RAN Architectures
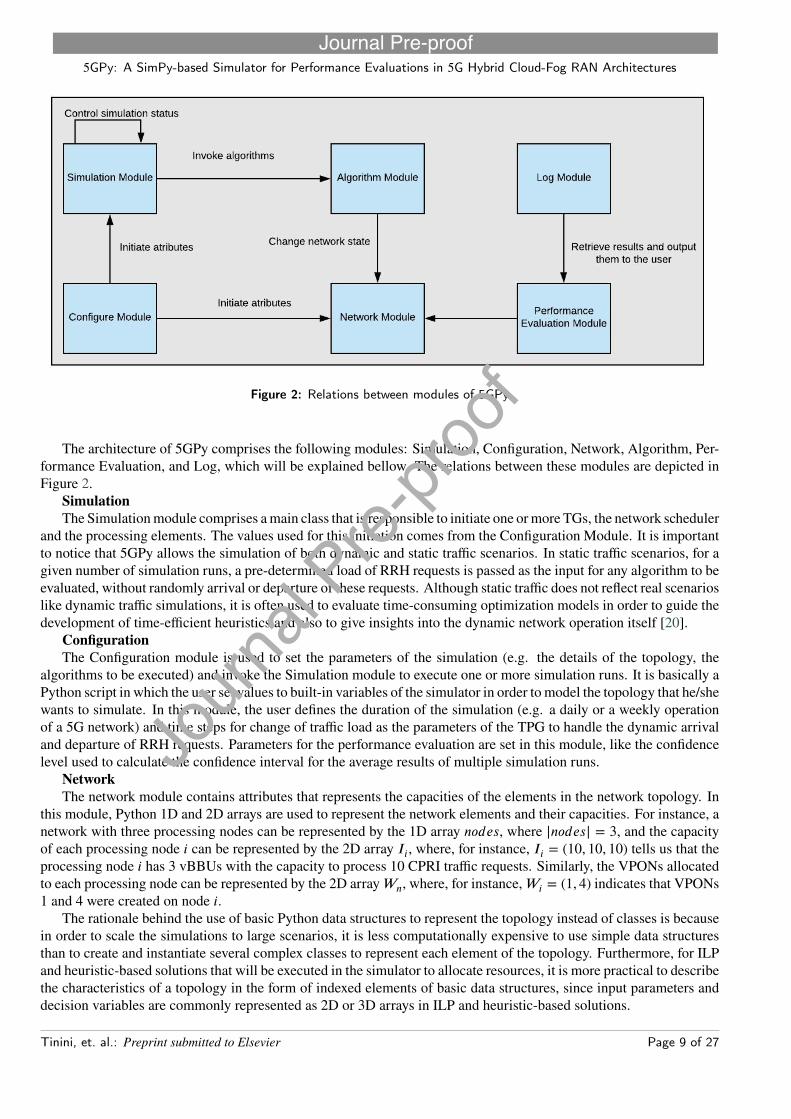
Figure 3: Class diagram of 5GPy
AlgorithmTheAlgorithmmodule comprises the attributes, methods and statements that define an algorithm that can be used to
solve a problem in the 5G network. For each single algorithm developed by the user on the simulator, a single algorithmmodule needs to be created. Hence, the complexity of each algorithm is transparent to the rest of the simulator.
It is the role of the network scheduler to invoke an algorithm to decide the placement of a RRH request. TheAlgorithm module can also iterate with the network scheduler to send an event back to it, e.g. to inform that theprocessing of a CPRI traffic of RRH i is initiated on some processing node or if it is terminated.
As each single algorithm is defined in a single module, the simulator is empowered to operate with any algorithmthat the user wants to develop and evaluate without concerning about its details and complexity.
Performance EvaluationThe Performance Evaluation module implements the set of functions designed to evaluate the performance metrics
of CF-RAN and developed algorithms. Any new evaluated method designed by the user must be placed in this module.This module communicates directly with the Network module in order to read its state and perform evaluations.
LogFinally, the Log module is responsible to access the Performance Evaluation module to generate outputs to the user
with the results of the performance evaluation. The latest version of 5GPy outputs all results as plain text (.txt) files.4.1. Simulation Classes
The current version of 5GPy is composed of the following classes: Simulator, ControlPlane, TrafficGenerator,RRH, Algorithm, Network, Solution and Utility.
As depicted in the class diagram of Figure 3, the Simulator class, which is responsible to initiate the simulation, en-capsulates the TrafficGenerator, ControlPlane, Network and Utility classes. The TrafficGenerator class is responsibleto generate events that represent the incoming requests of RRHs, represented by the class RRH, that is associated byTrafficGenerator through a RRHs list. The TrafficGenerator also aggregates the ControlPlane class, which is respon-
Tinini, et. al.: Preprint submitted to Elsevier Page 10 of 27

5GPy: A SimPy-based Simulator for Performance Evaluations in 5G Hybrid Cloud-Fog RAN Architectures
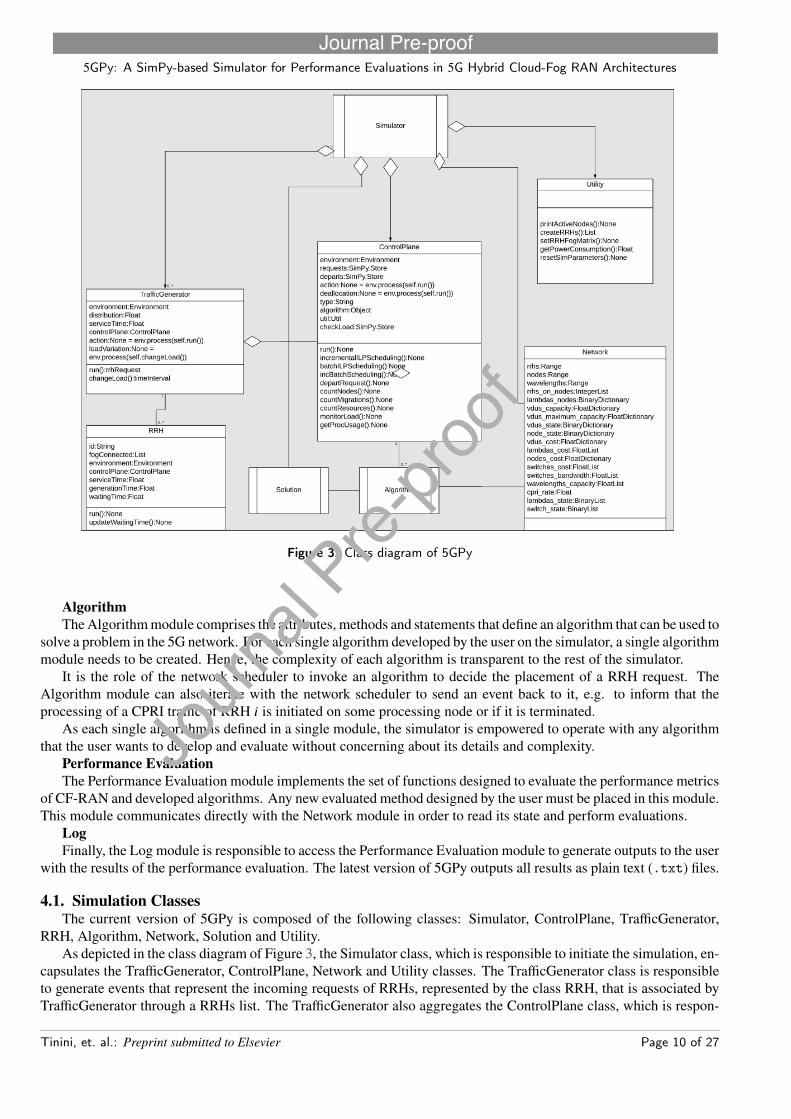
Figure 4: Workflow of a simulation run in 5GPy
sible to receive events from TrafficGenerator and executing them by invoking an algorithm that is aggregated from theclass Algorithm. The Algorithm class is associated to the Network class in order to access the topology state and run itsalgorithm. It is also associated with Solution class, which keeps the outputs of the developed model and aggregates tothe Simulator class. Finally, the Simulation class evaluates the network metrics through the aggregation of the Utilityclass, which contains several methods to evaluate performance.4.2. Simulation Workflow
A single simulation run is depicted on the workflow of Figure 4. In this example, the simulator runs for a determinedsimulation time and has a time step attribute used to update an artificial clock in order to check when the simulationhas timed out.
First, through the configuration script, the Simulation, Network and Algorithm modules are loaded and the simu-lation starts. The Control Plane initiates the TG and then, the TG waits for a time out to yield an event and check ifthere is any turned off RRH, i.e. RRHs that did not generate any CPRI request. If not, the TG waits for the next timeout. If so, it pops an RRH from the RRHs list and generate a CPRI request event for this RRH. Then, it passes thisevent to the control plane for it to invoke some algorithm to handle this request and find a suitable vBBU and VPONto process it.
After the algorithm is executed, two operation are performed. The network state is updated with the output of thealgorithm and the performance is evaluated. The RRH is also put in a list of active RRHs and the request begins tobe processed. The simulation time step is updated. In parallel, the simulator checks if the simulation time or if theTinini, et. al.: Preprint submitted to Elsevier Page 11 of 27

5GPy: A SimPy-based Simulator for Performance Evaluations in 5G Hybrid Cloud-Fog RAN Architectures
processing of the RRH request has timed out.If the simulation has timed out, it invokes the Log module to output results from the performance evaluation. If
not, it waits for another event to be yield by the TG. If the processing time of some RRH request has timed out, theRRH is removed from the list of actives RRHs and put on the list of turned off RRHs. The resources are released andthe simulation time step is updated.
Note that in this workflow example we did not depict the case of a blocking of a RRH request. In this case, theperformance would also be evaluated, the simulation time step would be updated and the RRH would be put again onthe turned off list.4.3. Qualitative Analysis for 5GPy
In this section we will provide a qualitative analysis between our proposed simulator and those refereed in Section 2in order to asset the advantages of 5GPy with the objective of pointing out how one can benefit from 5GPy whensimulating 5G fog-based networks. As the refereed simulators are considerably different in their implementations andobjectives, it is no reasonable to promote a performance evaluation between them and 5GPy.
As noted in the related works, many of the studied simulators have a great focus on the simulation of the PHY andMAC layer of 5G wireless networks, neglecting the transport of baseband signals from RRHs to processing elements.In this regard, the work in [11] presents a simplified framework for both simulation of link and system level, comprisingthe generation of baseband signals from RRHs considering large and small scale fading of signals that are transmittedto be processed in servers in a cloud, which comprises the system level simulation. The system level simulation allowsthe simulation of base stations containing RRHs of macro or micro size and the generation of mobile users that areserved by these RRHs. This model allows the simulation of interference between RRHs considering its size, which alsogenerates requests from interference mitigation processing through Coordinated Multi-Point (CoMP) techniques [7].However, all the complexity of the fronthaul is abstracted as latency values that are given in function of the basebandsignals generated by the RRHs. Regarding the processing resources, the simulator presents a round-robin and the BestChannel Quality Indicator (CQI) algorithms to perform this task. Besides its simplicity, it allows the users to evaluatespectral efficiency through Cloud Frequency Reuse (CFR), CoMP and carrier aggregation techniques.
In [12], the proposed simulator is heavily focused on system level simulators of the radio transmissions of 5Gnetworks. It considers the geometry of the base stations and several propagation models. The performance evaluationis focused on the strength of the signal, accumulated interference and signal to interference plus noise ratio (SINR).It also simulates sophisticated channel models, as Full Dimension MIMO (FD MIMO). The tool in [3] is focused onlink level simulators of radio transmissions. It is specialized in generating radio signals, since from the generation ofpreamble, data bits, and pilot symbols to the insertion of data in a frequency/time grid. Operations such as clippingand filtering are also implemented and at the receiver side it allows operations such as channel estimation, equalizationand hard symbol detection, among others. Several channel models are implemented, such as Additive White GaussianNoise (AWGN), Flat Rayleigh fading, Standardized channel models, such as ITU-R Outdoor-to-Indoor and PedestrianA (ITU-R M.1225 (1997-2)), 3GPP Typical Urban channel model (3GPP TR 25.943 V6.0.0 (2004-12)), etc. The toolin [10] simulates the full-stack of mmWave, focusing on end-to-end radio communiations since the frame generationuntil the transmission and reception, considering signal attenuations and interference. The following channel modelsare implemented: 3GPP Statistical Channel Model, Ray-tracing Model and NYU Statistical Model.
Considering these simulators, both [3] and [10] can be considered the most sophisticated because they provide awide range of channel models for radio communications simulations. In comparison to our tool, they simplified theoperation of the fronthaul, which is a focus of our simulation. However, as they provide good estimates of the radiocommunications operation, their outputs could be used by 5GPy in order to consider more scenarios of performanceevaluation. As they are modular simulators, a module could be proposed to integrate one of them with 5GPy.
Regarding the simulation of communications between RRHs and cloud/fog nodes, the tool in [9], provides to userssimulations related to the placement and migration of VMs in cloud/fog scenarios. Different from the simulationsfocused on radio communications, in this tool the radio segment of the network and its complexity are abstracted andthe focus is on the simulation of users mobility that triggers VMs migration among processing nodes. The tool pro-vides measures on latency, network utilization and power consumption. However, this simulator completely abstractsthe operation of the fronthaul, which is an important aspect of operation when measuring the utilization of networkresources.
Similar to [9], the tool in [16] also promotes the simulation of communications between mobile users and VMs incloud/fog nodes. This tool models segments of Wireless Local Area Networks (WLANs) and Wide Area Networks
Tinini, et. al.: Preprint submitted to Elsevier Page 12 of 27

5GPy: A SimPy-based Simulator for Performance Evaluations in 5G Hybrid Cloud-Fog RAN Architectures
(WAN), however, the complexity of these networks are once again abstracted and only the delay generated in theirlinks is considered. There is no detailed simulation of the layer 1 and 2 of the transport networks. So, the impact inthe cloud/fog operation regarding strategies for bandwidth allocation on the fronthaul is not measured. In this aspect,5GPy is dedicated to simulate the fronthaul considering the allocation of its resources. Hence, it can provide accurateestimates on network performance by considering restrictions on the transport network and on processing resourcesboth in static and dynamic scenarios when VMs migration can also be performed.
5GPy shows itself as a simulation tool that provides more details and capabilities on the simulation of 5G fog-based networks. By using the proposed performance model presented on subsection 3.4, our tool offers the evaluationof several important metrics that consider much more details of the transmission of data through the fronthaul, whichwas neglected on some aforementioned simulators. However, as already pointed, to be more general than it is, ourtool needs to be extended to support the management of radio resources, because this is abstracted in the currentimplementation, or, at least, be integrated to some of the aforementioned radio communication-focused simulators.
Finally, regarding details of implementation and ease of use and even extend, the code of all evaluated tools areorganized in modules, so any extension to the original tool can be written in new modules that can be integrated withold ones. Moreover, they also provide simplified configuration of simulation scenarios through dedicated configurationfiles, which avoids the user to change the code itself to create simulation scenarios.
5. SimulationsIn this section we will conduct some experiments to show the simulation and performance evaluation capabilities
of 5GPy. In order to perform the simulations, we will use two algorithms already proposed in our previous works tosolve the VP-VF problem.
ILP model for power consumption minimization in VP-VFThe first algorithm [18], is an ILP model used to allocate vBBUs and VPON to RRH requests in a energy-efficient
way. Its objective function seeks to minimize the power consumption equation 1.The ILP takes as parameters the following sets and variables: R: set of RRH traffic demands i,N : set of processing
nodes (cloud of fog nodes) n, Fin: set of binary values representing fog nodes n connected to RRH i, Vwn: set of binaryvalues that represent the availability of each VPON w to be placed on node n,W : set of available wavelengths w andVDUs, Bi: bandwidth demand of RRH i, Bw: capacity of wavelength w, Iw: processing capacity of VDU w, Ben :bandwidth of the backplane switch e at node n, Cn: power cost of node n, Clc : power cost of a LC, Ce: power cost ofthe backplane switch, B: a very big positive number, �, � and �: binary weights used to prioritize the minimization ofspecific components.
As decision variables, the ILP consider the following binary variables: xiwn: = 1 if the traffic demand of RRH i isprocessed at node n being transmitted at the VPON w, uiwn: = 1 if RRH i is processed at the VDU w at node n, yin:= 1 if i was allocated to node n, xn: = 1 if node n is active, zwn: = 1 if wavelength w transmits to node n, kin: = 1 iftraffic from RRH i was redirected to VDU w at node n, rwn: = 1 if VDU w was activated to receive a redirected RRHat node n, swn: = 1 if VDU w is active at node n, en: = 1 if the backplane switch e is active at node n, giwn: auxiliaryvariable that equals 1 if traffic of RRH i is redirected to VDU w at node n.
As constraints, it ensures that each RRH request is allocated to only one processing node, vBBU and VPON andthat each wavelength is used to create a VPON in a single processing node, via the following constraints (11-16):
W∑w=1
N∑n=1
xiwn = 1,∀i ∈ {1,… , R} (11)
W∑w=1
N∑n=1
uiwn = 1,∀i ∈ {1,… , R} (12)
R∑i=1
uiwn ≥ 0,∀w, n ∈ {1,… ,W }, {1,… , N} (13)
Tinini, et. al.: Preprint submitted to Elsevier Page 13 of 27

5GPy: A SimPy-based Simulator for Performance Evaluations in 5G Hybrid Cloud-Fog RAN Architectures
N∑n=1
yin = 1,∀i ∈ {1,… , R} (14)
N∑n=1
zwn ≤ 1,∀w ∈ {1,… ,W } (15)
zwn ≤ Vwn,∀w, n ∈ {1,… ,W }, {1,… , N} (16)Regarding the connectivity of each RRH to one or more fog nodes, the following constraint 17 ensures that each
RRH request can only be processed in the cloud or in a fog node that it is connected to:
yin ≤ Fin,∀i, n ∈ {1,… , R}, {1,… , N} (17)The capacities constraints of VDUs, VPONs and the backplane switch is guaranteed by constraints 18-20.
R∑i=1
N∑n=1
xiwn.Bi ≤ Bw,∀w ∈ {1,… ,W } (18)
R∑i=1
N∑n=1
uiwn ≤ Iw,∀w ∈ {1,… ,W } (19)
R∑i=1
kin.Bi ≤ Ben ,∀n ∈ {1,… , N} (20)
The following constraints (21-30) use the auxiliary decision variables to account when processing nodes, VDUs,VPONs and backplane switches are activated by the ILP solution:
B.xn ≥R∑i=1
W∑w=1
xiwn,∀n ∈ {1,… , N} (21)
xn ≤R∑i=1
W∑w=1
xiwn,∀n ∈ {1,… , N} (22)
B.zwn ≥R∑i=1
N∑n=1
xiwn,∀w ∈ {1,… ,W } (23)
zwn ≤R∑i=1
N∑n=1
xiwn,∀w ∈ {1,… ,W } (24)
Tinini, et. al.: Preprint submitted to Elsevier Page 14 of 27

5GPy: A SimPy-based Simulator for Performance Evaluations in 5G Hybrid Cloud-Fog RAN Architectures
B.yin ≥W∑w=1
xiwn,∀i, n ∈ {1,… , R}, {1,… , N} (25)
yin ≤W∑w=1
xiwn,∀i, n ∈ {1,… , R}, {1,… , N} (26)
B.yin ≥W∑w=1
uiwn,∀i, n ∈ {1,… , R}, {1,… , N} (27)
yin ≤W∑w=1
uiwn,∀i, n ∈ {1,… , R}, {1,… , N} (28)
B.swn ≥R∑i=1
uiwn,∀w, n ∈ {1,… ,W }, {1,… , N} (29)
swn ≤R∑i=1
uiwn,∀w, n ∈ {1,… ,W }, {1,… , N} (30)
Finally, the following constraints (31-40) uses auxiliary variables kin, rwn, en and giwn to evidence and accountthe redirection of traffic among VDUs. Note that constraints 24 to 31 are the same expressions of traffic redirectionpresented in Section 3.4.
B.kin ≥W∑w=1
giwn,∀i, n ∈ {1,… , R}, {1,… , N} (31)
kin ≤W∑w=1
giwn,∀i, n ∈ {1,… , R}, {1,… , N} (32)
B.rw ≥ R∑i=1
N∑n=1
giwn,∀w ∈ {1,… ,W } (33)
rw ≤ R∑i=1
N∑n=1
giwn,∀w ∈ {1,… ,W } (34)
B.en ≥R∑i=1
kin,∀n ∈ {1,… , N} (35)
Tinini, et. al.: Preprint submitted to Elsevier Page 15 of 27

5GPy: A SimPy-based Simulator for Performance Evaluations in 5G Hybrid Cloud-Fog RAN Architectures
en ≤R∑i=1
kin,∀n ∈ {1,… , N} (36)
giwn ≤ xiwn + uiwn,∀i, w, n ∈ {1,… , R}, {1,… ,W }, {1,… , N} (37)
giwn ≥ xiwn − uiwn,∀i, w, n ∈ {1,… , R}, {1,… ,W }, {1,… , N} (38)
giwn ≥ uiwn − xiwn,∀i, w, n ∈ {1,… , R}, {1,… ,W }, {1,… , N} (39)
giwn ≤ 2 − xiwn − uiwn,∀i, w, n ∈ {1,… , R}, {1,… ,W }, {1,… , N} (40)Graph-model heuristic for power and latency-efficient VP-VFThe second algorithm is a graph-based model and heuristic used to perform the placement of vBBUs and formation
of VPONs in a power and latency-efficient way.In this algorithm, CF-RAN is modelled as a flow graph. RRHs and processing nodes are modelled as vertices and
the fronthaul links that connect them are represented by the arcs connecting them with a capacity value that representsthe amount of free bandwidth on that link. A source vertexS that inputs flow into the network is connected to each RRHvertex and each processing node connects to a output destination vertex D The objective is to maintain the maximumflow between a source and destination vertices, inputing flow through all RRHs and processing nodes through thefronthaul links/arcs.
Initially, the fronthaul links/arcs have capacity 0. Hence, the algorithm is break into two procedures: First, anwavelength dimensioning algorithm is used to increase the capacity of the arcs in order to support incoming flow fromRRH vertices. Then, a max flow-min cost is executed to input flow into the network arcs.
For the complete definition of this algorithm, we welcome the readers to refer to publication [18], where the graph-based model is explained with deep details.5.1. Static Traffic Scenario
The first scenario is a static traffic scenario where the total demand of CPRI requests is known before-hand andthere is no dynamicity on the arrival and departure of CPRI requests in the network. In this static traffic scenario weonly considered the execution of the ILP formulation to solve the VP-VF problem. Using the proposed ILP formulation,we compared two different minimization objectives: the minimization of the VPONs, referred as minVPON policy,and the minimization of traffic switching among VDUs, referred as minRedir policy.
As ILP formulations are known to not scale well with the size of the problem, we considered a relative smalltopology for this scenario. The simulated CF-RAN is composed of 1 cloud node, 2 fog nodes and a TWDM-PONfronthaul composed of 4 wavelengths of 10Gbps capacity each one. The maximum traffic load in the network isachieved by the amount of 60 RRHs, however, we slotted the network operation as in a daily traffic pattern slotted in24 periods of 1 hour. Each RRHs generates a basic CPRI flow of 614.4Mbps. The operation begins with the amount of5 activated RRHs, and, hour by hour this amount is increased in 5 RRHs until the period of noon, after that, the amountof activated RRHs is decreased in 5 hour by hour. Using the performance evaluation model proposed in Section 3.4, weevaluated the following performance metrics: power consumption, the wastage of network and processing resources,the number of activated resources (VPONs, vBBUs and switches), the switching of traffic amongVDUs, themigrationsof vBBUs as traffic increases or decreases and the execution time of the algorithms. To execute the simulation we useda computer equipped with an Intel i7 processor with 16GB of RAM running on top of Ubuntu 18. The ILP formulationis implemented in 5GPy using the DOCPLEX library, that provides access to the IBM CPLEX Optimization Tool inorder to get the optimal solutions from the ILP formulation.
Tinini, et. al.: Preprint submitted to Elsevier Page 16 of 27
5GPy: A SimPy-based Simulator for Performance Evaluations in 5G Hybrid Cloud-Fog RAN Architectures
Figure 5: Power Consumption in CF-RAN
Figure 6: VDUs processing resources wastage
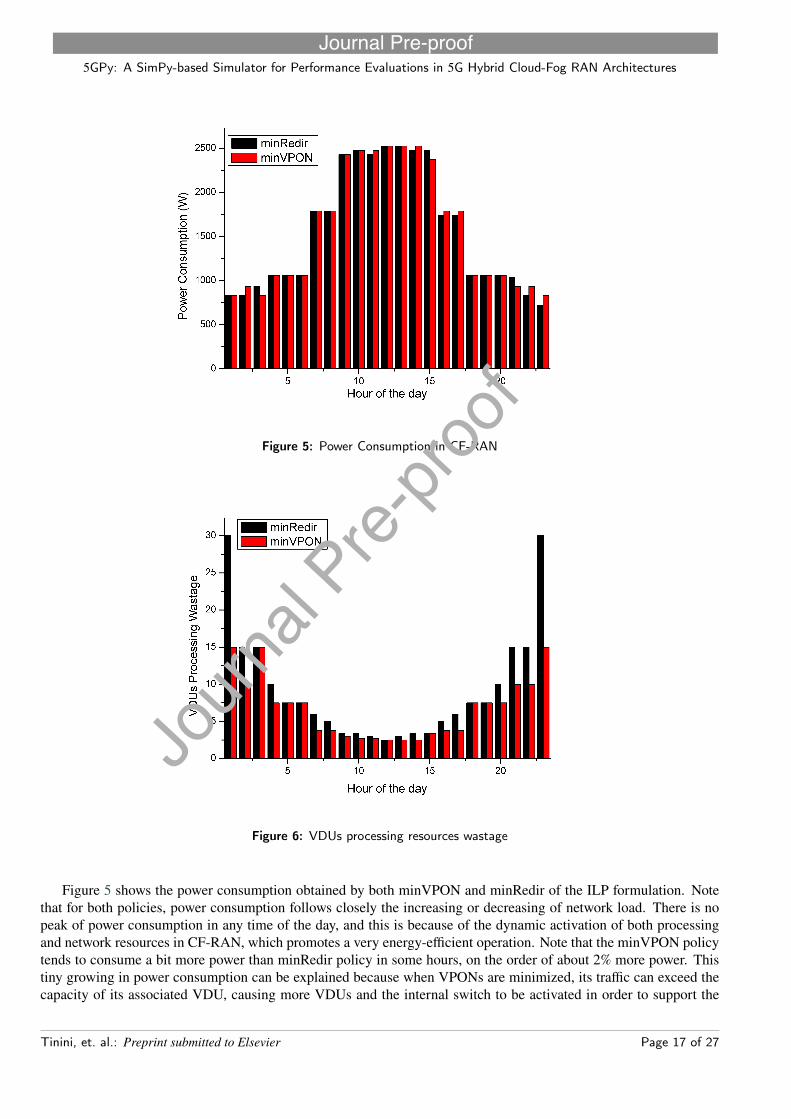
Figure 5 shows the power consumption obtained by both minVPON and minRedir of the ILP formulation. Notethat for both policies, power consumption follows closely the increasing or decreasing of network load. There is nopeak of power consumption in any time of the day, and this is because of the dynamic activation of both processingand network resources in CF-RAN, which promotes a very energy-efficient operation. Note that the minVPON policytends to consume a bit more power than minRedir policy in some hours, on the order of about 2% more power. Thistiny growing in power consumption can be explained because when VPONs are minimized, its traffic can exceed thecapacity of its associated VDU, causing more VDUs and the internal switch to be activated in order to support the
Tinini, et. al.: Preprint submitted to Elsevier Page 17 of 27
5GPy: A SimPy-based Simulator for Performance Evaluations in 5G Hybrid Cloud-Fog RAN Architectures
Figure 7: Bandwidth wastage rate
demands of each VPON. It is interesting to note that sometimes when the traffic changes, minVPON provides betterpower performance than minRedir. It happens when the time transitions from 2 to 3 a.m., from 2 to 3 p.m. and from 8to 9 p.m., when minRedir increases the power consumption in about 10% in comparison to minVPON. This happensbecause in that time the minimization of VPONs provide a better network scheduling to the upcoming traffic demands.
Following, in Figure 6 we investigate the impact of both minimization policies in the wastage of processing re-sources. Note that, mostly, minVPON provides a better usage of the VDUs, specially for lower traffic demands. In themoments of low workloads, the minimization of the activated wavelengths provides an optimization of about 50% inthe processing resources usage in comparison to minRedir. When traffic increases, minVPON optimizes the usage ofVDUs in at most 37.5%. This happens because, when minimizing VPONs, the system will try to fully use the VDUsassociated with the activated VPONs before activating additional VDUs. So, we find that the an optimal usage of theprocessing resources is closely related to an optimal use of the network/fronthaul resources.
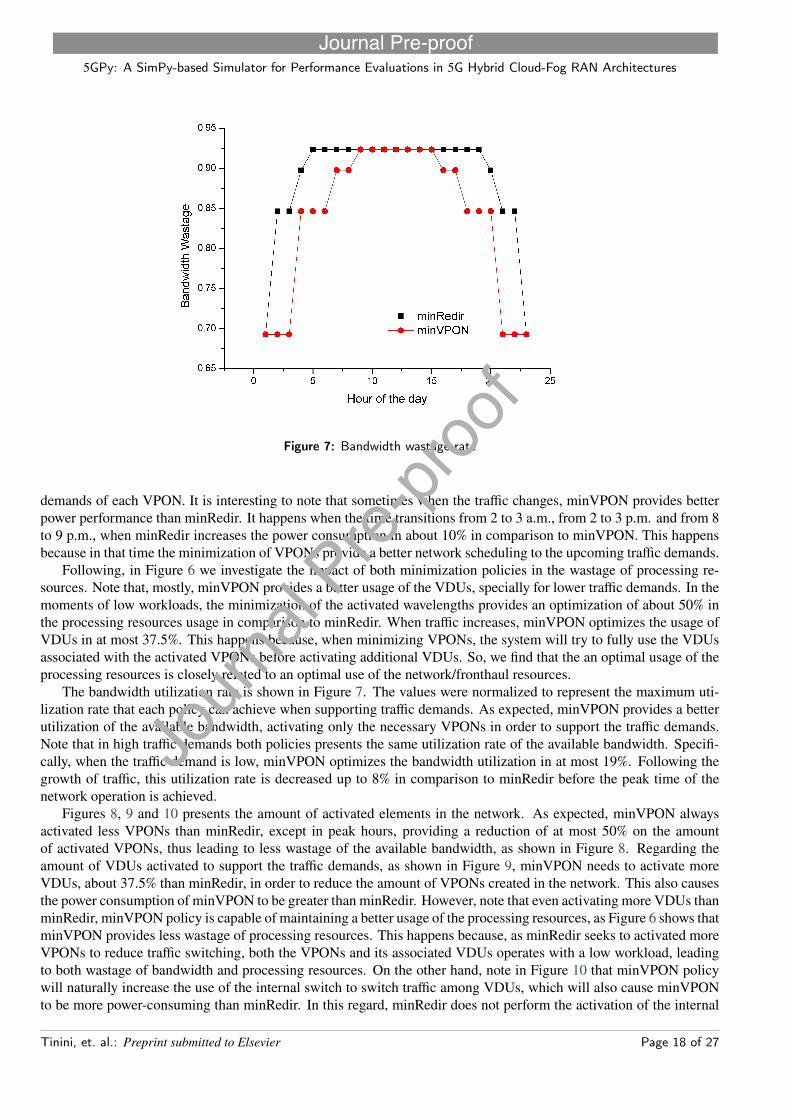
The bandwidth utilization rate is shown in Figure 7. The values were normalized to represent the maximum uti-lization rate that each policy can achieve when supporting traffic demands. As expected, minVPON provides a betterutilization of the available bandwidth, activating only the necessary VPONs in order to support the traffic demands.Note that in high traffic demands both policies presents the same utilization rate of the available bandwidth. Specifi-cally, when the traffic demand is low, minVPON optimizes the bandwidth utilization in at most 19%. Following thegrowth of traffic, this utilization rate is decreased up to 8% in comparison to minRedir before the peak time of thenetwork operation is achieved.
Figures 8, 9 and 10 presents the amount of activated elements in the network. As expected, minVPON alwaysactivated less VPONs than minRedir, except in peak hours, providing a reduction of at most 50% on the amountof activated VPONs, thus leading to less wastage of the available bandwidth, as shown in Figure 8. Regarding theamount of VDUs activated to support the traffic demands, as shown in Figure 9, minVPON needs to activate moreVDUs, about 37.5% than minRedir, in order to reduce the amount of VPONs created in the network. This also causesthe power consumption of minVPON to be greater than minRedir. However, note that even activating more VDUs thanminRedir, minVPON policy is capable of maintaining a better usage of the processing resources, as Figure 6 shows thatminVPON provides less wastage of processing resources. This happens because, as minRedir seeks to activated moreVPONs to reduce traffic switching, both the VPONs and its associated VDUs operates with a low workload, leadingto both wastage of bandwidth and processing resources. On the other hand, note in Figure 10 that minVPON policywill naturally increase the use of the internal switch to switch traffic among VDUs, which will also cause minVPONto be more power-consuming than minRedir. In this regard, minRedir does not perform the activation of the internal
Tinini, et. al.: Preprint submitted to Elsevier Page 18 of 27

5GPy: A SimPy-based Simulator for Performance Evaluations in 5G Hybrid Cloud-Fog RAN Architectures
Figure 8: Amount of activated VPONs
Figure 9: Amount of activated VDUs
switch in any processing node of the network between 6p.m. and 6a.m.. The internal switch begins to be activatedonly at 7a.m., when minRedir activates only 50% of internal switches in comparison to minVPON. During the peaktime of network operation, both policies provides the same amount of switches activated and when traffic begins to bedecreased at 5p.m., minRedir will again activate half of the switches in comparison to minVPON.
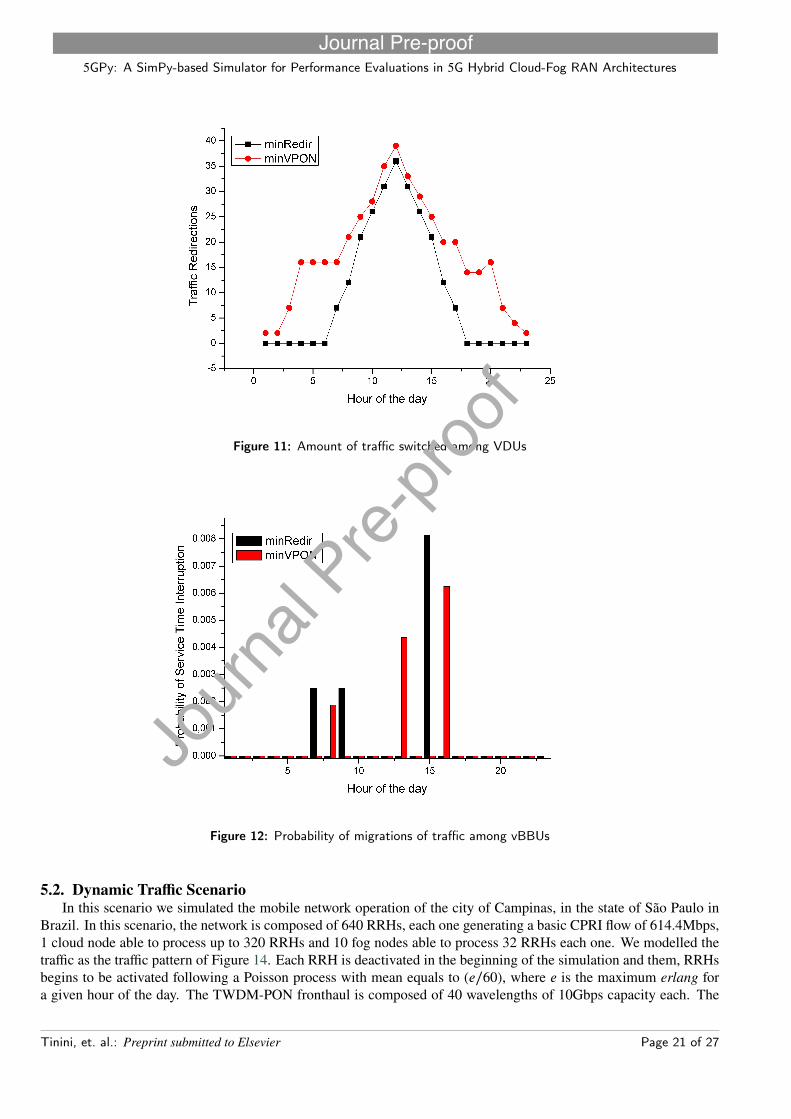
Regarding the amount of traffic switching among VDUs, as expected, minVPON presents much more inter VDUstraffic switching, as shown in Figure 11. Between 6 p.m. and 6 a.m. the traffic switching is completely mitigated by
Tinini, et. al.: Preprint submitted to Elsevier Page 19 of 27

5GPy: A SimPy-based Simulator for Performance Evaluations in 5G Hybrid Cloud-Fog RAN Architectures
Figure 10: Amount of activated Switches
minRedir. Themaximumdifference of traffic switching betweenminRedir andminVPON is of about 56%, that happenswhen traffic begins to be increased at 7 a.m.. This shows that, even using both network and processing resources in amore optimal way, minVPON can cause the network latency to be increased. However, note that an increased differenceon the number of redirected traffic occurs mostly in low traffic periods. At the peak network operation, one can decideto take the advantages provided by minVPON as the amount of redirected traffic is slightly greater than minRedir, onthe order of about 6%. Nevertheless, for a more accurate conclusion on what policy is the best regarding latency, theuse of different applications in the network must be investigated. For some kind of applications, like messengers ofany kind of social media, latency is not a big problem, however, when some latency-driven applications such remotemedical procedures or autonomous vehicles need to be supported by CF-RAN, the littlest variation in latency canimpact those applications.
We also investigated the probability of traffic migrations among VDUs for both minVPON and minRedir policies.A migration occurs when the ILP formulation decides that some CPRI requests must be migrated from fog nodes tothe cloud in order to save energy. As shown in Figure 12, in almost all times there is no migration, which shows thatboth policies of the ILP formulation are able to provide scheduling of CPRI requests in a way that prevents migrationswhen traffic increases or decreases. However, note that there is occurrence of traffic migrations in 5 hours of the day.In the migrations that occurred at early hours of the day, this can be explained by the fact that in that times, the fogcan be used to support low traffic loads as the activation of only one fog node is cheaper than the use of the cloud.However, as traffic demand is slightly increased, migrations are performed to move traffic of several fog nodes to thecloud. This also explains why the amount of migrations reaches its peak at the peak load of the network. Note thatwhen the traffic load decreases in nightly hours, migration is completely mitigated. In general, minRedir provided anaverage of about 2% more probabilities of traffic migrations than minVPON during the day.
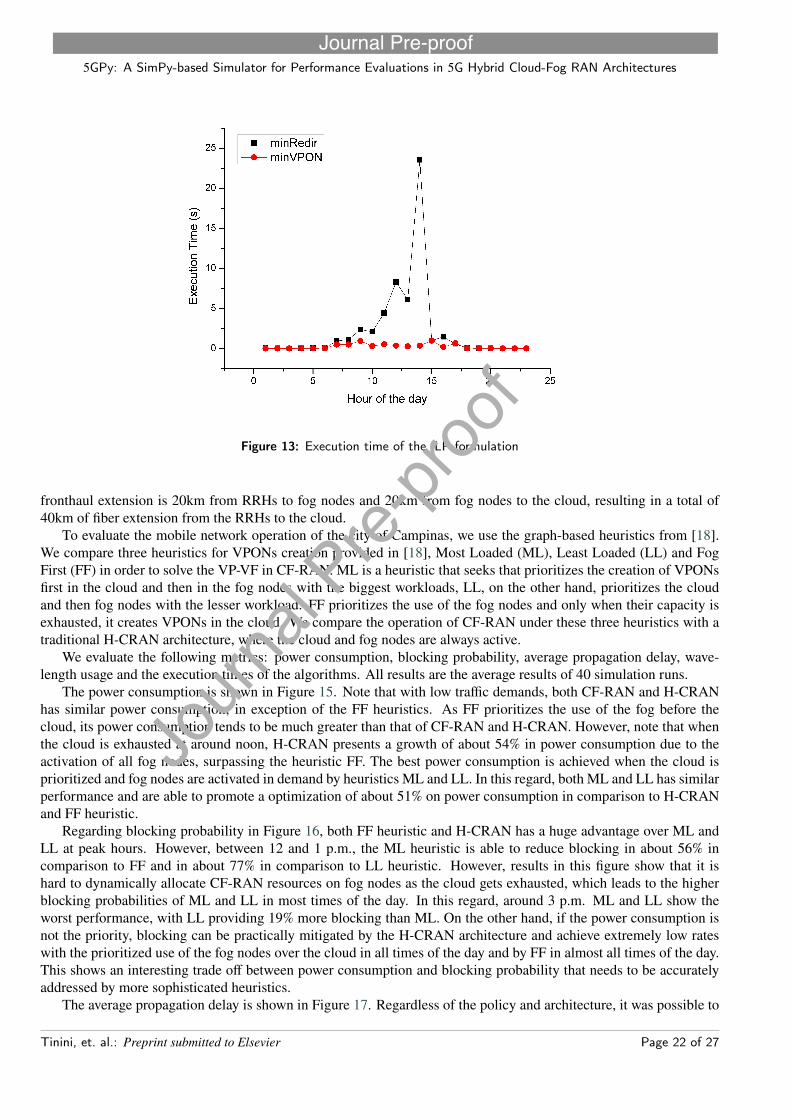
Finally, the execution times provided by the ILP formulation and the simulator execution are provided in Figure 13.We can observe that minVPON, besides providing a better use of the network and processing resources, also providesits solutions in times very closer to 0. On the other hand, minRedir takes additional computing time in order to decidethe allocation of resources while minimizing the traffic switching among VDUs. Specifically, minVPON provides aminimum andmaximum reduction of the execution time in about 25%, or 1.3x, and in about 98.5%, or 65x, respectively,in comparison to minRedir.
Tinini, et. al.: Preprint submitted to Elsevier Page 20 of 27
5GPy: A SimPy-based Simulator for Performance Evaluations in 5G Hybrid Cloud-Fog RAN Architectures
Figure 11: Amount of traffic switched among VDUs
Figure 12: Probability of migrations of traffic among vBBUs
5.2. Dynamic Traffic ScenarioIn this scenario we simulated the mobile network operation of the city of Campinas, in the state of São Paulo in
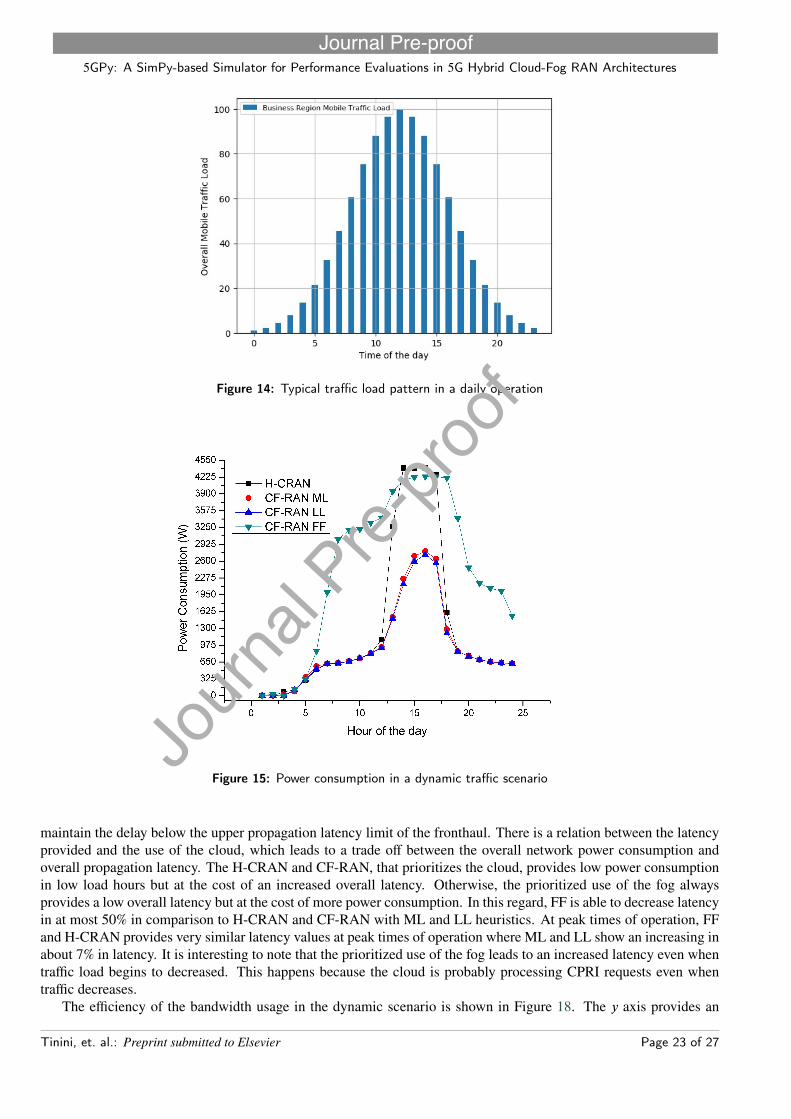
Brazil. In this scenario, the network is composed of 640 RRHs, each one generating a basic CPRI flow of 614.4Mbps,1 cloud node able to process up to 320 RRHs and 10 fog nodes able to process 32 RRHs each one. We modelled thetraffic as the traffic pattern of Figure 14. Each RRH is deactivated in the beginning of the simulation and them, RRHsbegins to be activated following a Poisson process with mean equals to (e∕60), where e is the maximum erlang fora given hour of the day. The TWDM-PON fronthaul is composed of 40 wavelengths of 10Gbps capacity each. The
Tinini, et. al.: Preprint submitted to Elsevier Page 21 of 27
5GPy: A SimPy-based Simulator for Performance Evaluations in 5G Hybrid Cloud-Fog RAN Architectures
Figure 13: Execution time of the ILP formulation
fronthaul extension is 20km from RRHs to fog nodes and 20km from fog nodes to the cloud, resulting in a total of40km of fiber extension from the RRHs to the cloud.
To evaluate the mobile network operation of the city of Campinas, we use the graph-based heuristics from [18].We compare three heuristics for VPONs creation provided in [18], Most Loaded (ML), Least Loaded (LL) and FogFirst (FF) in order to solve the VP-VF in CF-RAN. ML is a heuristic that seeks that prioritizes the creation of VPONsfirst in the cloud and then in the fog nodes with the biggest workloads, LL, on the other hand, prioritizes the cloudand then fog nodes with the lesser workload. FF prioritizes the use of the fog nodes and only when their capacity isexhausted, it creates VPONs in the cloud. We compare the operation of CF-RAN under these three heuristics with atraditional H-CRAN architecture, where the cloud and fog nodes are always active.
We evaluate the following metrics: power consumption, blocking probability, average propagation delay, wave-length usage and the execution times of the algorithms. All results are the average results of 40 simulation runs.
The power consumption is shown in Figure 15. Note that with low traffic demands, both CF-RAN and H-CRANhas similar power consumption, in exception of the FF heuristics. As FF prioritizes the use of the fog before thecloud, its power consumption tends to be much greater than that of CF-RAN and H-CRAN. However, note that whenthe cloud is exhausted at around noon, H-CRAN presents a growth of about 54% in power consumption due to theactivation of all fog nodes, surpassing the heuristic FF. The best power consumption is achieved when the cloud isprioritized and fog nodes are activated in demand by heuristics ML and LL. In this regard, both ML and LL has similarperformance and are able to promote a optimization of about 51% on power consumption in comparison to H-CRANand FF heuristic.
Regarding blocking probability in Figure 16, both FF heuristic and H-CRAN has a huge advantage over ML andLL at peak hours. However, between 12 and 1 p.m., the ML heuristic is able to reduce blocking in about 56% incomparison to FF and in about 77% in comparison to LL heuristic. However, results in this figure show that it ishard to dynamically allocate CF-RAN resources on fog nodes as the cloud gets exhausted, which leads to the higherblocking probabilities of ML and LL in most times of the day. In this regard, around 3 p.m. ML and LL show theworst performance, with LL providing 19% more blocking than ML. On the other hand, if the power consumption isnot the priority, blocking can be practically mitigated by the H-CRAN architecture and achieve extremely low rateswith the prioritized use of the fog nodes over the cloud in all times of the day and by FF in almost all times of the day.This shows an interesting trade off between power consumption and blocking probability that needs to be accuratelyaddressed by more sophisticated heuristics.
The average propagation delay is shown in Figure 17. Regardless of the policy and architecture, it was possible to
Tinini, et. al.: Preprint submitted to Elsevier Page 22 of 27
5GPy: A SimPy-based Simulator for Performance Evaluations in 5G Hybrid Cloud-Fog RAN Architectures
Figure 14: Typical traffic load pattern in a daily operation
Figure 15: Power consumption in a dynamic traffic scenario
maintain the delay below the upper propagation latency limit of the fronthaul. There is a relation between the latencyprovided and the use of the cloud, which leads to a trade off between the overall network power consumption andoverall propagation latency. The H-CRAN and CF-RAN, that prioritizes the cloud, provides low power consumptionin low load hours but at the cost of an increased overall latency. Otherwise, the prioritized use of the fog alwaysprovides a low overall latency but at the cost of more power consumption. In this regard, FF is able to decrease latencyin at most 50% in comparison to H-CRAN and CF-RAN with ML and LL heuristics. At peak times of operation, FFand H-CRAN provides very similar latency values at peak times of operation where ML and LL show an increasing inabout 7% in latency. It is interesting to note that the prioritized use of the fog leads to an increased latency even whentraffic load begins to decreased. This happens because the cloud is probably processing CPRI requests even whentraffic decreases.
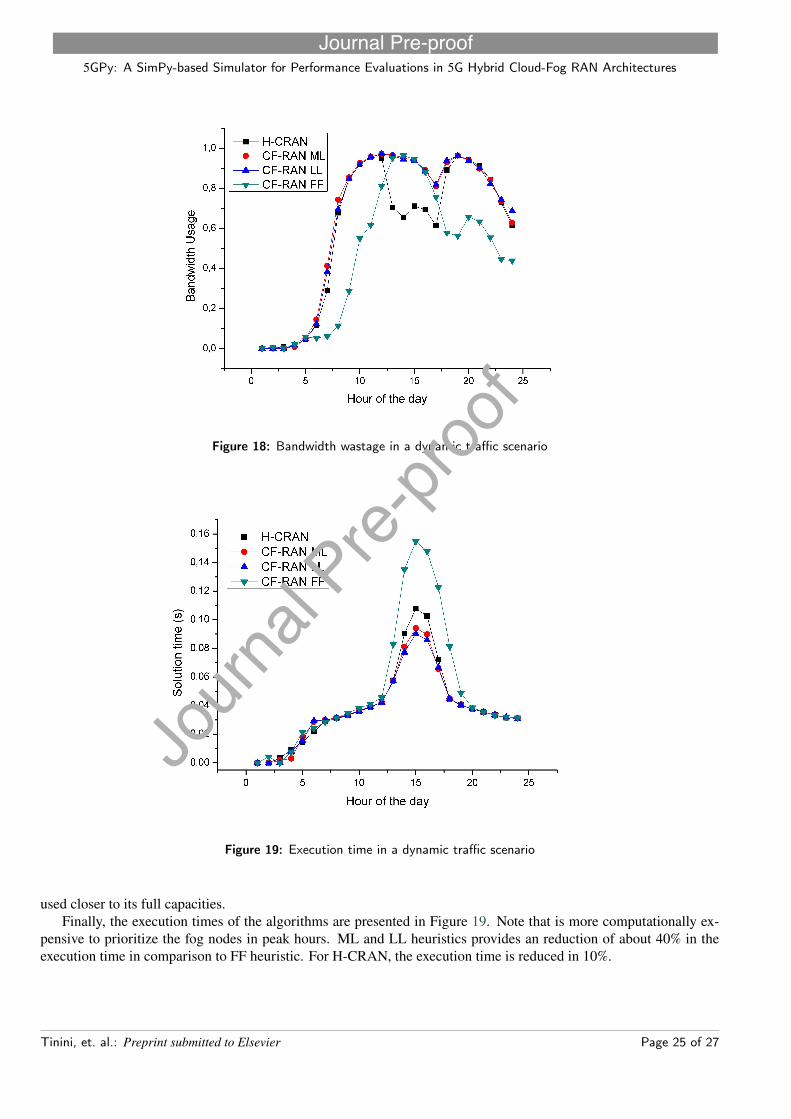
The efficiency of the bandwidth usage in the dynamic scenario is shown in Figure 18. The y axis provides anTinini, et. al.: Preprint submitted to Elsevier Page 23 of 27

5GPy: A SimPy-based Simulator for Performance Evaluations in 5G Hybrid Cloud-Fog RAN Architectures
Figure 16: Blocking probability in a dynamic traffic scenario
Figure 17: Average propagation delay in a dynamic traffic scenario
scale that measures the efficient use of the available wavelengths in the network. CF-RAN with ML and LL policiesprovides a better usage of the network resources than FF for almost all traffic loads of the day. Note that H-CRAN failsto maintain a performance closer to the optimal usage of the bandwidth in peak hours, where its performance is about32% worst than CF-RAN. However, around 7 p.m., H-CRAN shows a performance similar to CF-RAN, being able tooptimize the use of bandwidth in at most 42% in comparison to FF. For CF-RAN with FF, the prioritized use of fognodes provides a worst usage of the bandwidth in almost all the day, except in peak hours where created VPONs are
Tinini, et. al.: Preprint submitted to Elsevier Page 24 of 27
5GPy: A SimPy-based Simulator for Performance Evaluations in 5G Hybrid Cloud-Fog RAN Architectures
Figure 18: Bandwidth wastage in a dynamic traffic scenario
Figure 19: Execution time in a dynamic traffic scenario
used closer to its full capacities.Finally, the execution times of the algorithms are presented in Figure 19. Note that is more computationally ex-
pensive to prioritize the fog nodes in peak hours. ML and LL heuristics provides an reduction of about 40% in theexecution time in comparison to FF heuristic. For H-CRAN, the execution time is reduced in 10%.
Tinini, et. al.: Preprint submitted to Elsevier Page 25 of 27

5GPy: A SimPy-based Simulator for Performance Evaluations in 5G Hybrid Cloud-Fog RAN Architectures
6. Discussion and ConclusionsIn this paper we investigated the joint collaboration of cloud and fog computing on the support of 5G networks
through an architecture called CF-RAN. We also proposed a performance evaluation model to CF-RAN and a 5Gnetwork simulator focused on simulations of CF-RAN called 5GPy. 5GPy uses SimPy library to implement an process-oriented environment in order to model the behaviours of the components of a CF-RAN architecture. We performedevaluations in a small static traffic network scenario and in a large scale dynamic scenario based on the Brazilian city ofCampinas. With the use of the simulator, interesting conclusions could be drawn about the cooperative use of cloud andfog computing. We found that the minimization of the wavelengths used in the network can promote a better usage ofthe processing resources, as more CPRI requests are transmitted on each wavelength and processed on a few number ofvBBUs. The minimization of the wavelengths also reduces the switching of traffic between vBBUs in different VDUs,thus reducing switching latencies that could harm latency-sensitive applications that request communication betweentwo or more vBBUs. We also found that a combined use of cloud and fog with dynamic activation of processingresources leads to remarkable savings in power consumption and in the bandwidth usage, however, we also found thatwhen power consumption and bandwidth are optimized, the network may suffer from an increased blocking probabilityand propagation latency. On the other hand, we found that there is a trade off between the prioritized use of the fogand the cloud, because, when fog nodes are activated, the power consumption is increased, but on the other hand theblocking probability and propagation latency can be decreased. This points out the necessity of more sophisticatedheuristics that seeks to balance the trade off found in this paper.
AcknowledgementsThis work was supported in part by CAPES - Finance Code 001, the INCT of the Future Internet for Smart
Cities (CNPq 465446/2014-0, CAPES 88887.136422/2017-00, and FAPESP 14/50937-1 and 15/24485-9) and CNPq311608/2017-5, 420907/2016-5, and 312324/2015-4.
References[1] Baldo, N., Miozzo, M., Requena-Esteso, M., Nin-Guerrero, J., 2011. An open source product-oriented lte network simulator based on ns-3,
in: Proceedings of the 14th ACM International Conference on Modeling, Analysis and Simulation of Wireless and Mobile Systems, ACM,New York, NY, USA. pp. 293–298. URL: http://doi.acm.org/10.1145/2068897.2068948, doi:10.1145/2068897.2068948.
[2] Calheiros, R.N., Ranjan, R., Beloglazov, A., De Rose, C.A., Buyya, R., 2011. Cloudsim: a toolkit for modeling and simulation of cloudcomputing environments and evaluation of resource provisioning algorithms. Software: Practice and experience 41, 23–50.
[3] Dominguez-Bolano, T., Rodriguez-Pineiro, J., Garcia-Naya, J.A., Castedo, L., 2016. The gtec 5g link-level simulator, in: 2016 1st InternationalWorkshop on Link- and System Level Simulations (IWSLS), pp. 1–6. doi:10.1109/IWSLS.2016.7801585.
[4] Figueiredo, G.B., Wang, X., Meixner, C.C., Tornatore, M., Mukherjee, B., 2016. Load balancing and latency reduction in multi-user compover twdm-vpons, in: 2016 IEEE International Conference on Communications (ICC), IEEE. pp. 1–6.
[5] Gupta, H., Vahid Dastjerdi, A., Ghosh, S.K., Buyya, R., 2017. ifogsim: A toolkit for modeling and simulation of resource managementtechniques in the internet of things, edge and fog computing environments. Software: Practice and Experience 47, 1275–1296.
[6] Ikuno, J.C., Wrulich, M., Rupp, M., 2010. System level simulation of lte networks, in: 2010 IEEE 71st Vehicular Technology Conference,pp. 1–5. doi:10.1109/VETECS.2010.5494007.
[7] Irmer, R., Droste, J., Marsch, P., Grieger, M., Fettweis, G., Brueck, S., Mayer, H.P., Thiele, L., Jungnickel, V., 2011. Coordinated multipoint:Concepts, performance, and field trial results. IEEE Communications Magazine 49, 102–111.
[8] Liu, M., Ren, P., Du, Q., Ou, W., Xiong, X., Li, G., 2016. Design of system-level simulation platform for 5g networks, in: 2016 IEEE/CICInternational Conference on Communications in China (ICCC), pp. 1–6. doi:10.1109/ICCChina.2016.7636796.
[9] Lopes, M.M., Higashino, W.A., Capretz, M.A., Bittencourt, L.F., 2017. Myifogsim: A simulator for virtual machine migration in fog com-puting, in: Companion Proceedings of the10th International Conference on Utility and Cloud Computing, ACM, New York, NY, USA. pp.47–52. URL: http://doi.acm.org/10.1145/3147234.3148101, doi:10.1145/3147234.3148101.
[10] Mezzavilla, M., Zhang, M., Polese, M., Ford, R., Dutta, S., Rangan, S., Zorzi, M., 2017. End-to-end simulation of 5g mmwave networks.CoRR abs/1705.02882. URL: http://arxiv.org/abs/1705.02882, arXiv:1705.02882.
[11] Mohsen, N., Hassan, K.S., 2015. C-ran simulator: A tool for evaluating 5g cloud-based networks system-level performance, in: 2015 IEEE11th International Conference on Wireless and Mobile Computing, Networking and Communications (WiMob), pp. 302–309. doi:10.1109/WiMOB.2015.7347976.
[12] Müller, M.K., Ademaj, F., Dittrich, T., Fastenbauer, A., Elbal, B.R., Nabavi, A., Nagel, L., Schwarz, S., Rupp, M., 2018. Flexible multi-nodesimulation of cellular mobile communications: the Vienna 5G System Level Simulator. EURASIP Journal on Wireless Communications andNetworking 2018, 17. doi:10.1186/s13638-018-1238-7.
[13] Piro, G., Baldo, N., Miozzo, M., 2011. An lte module for the ns-3 network simulator, in: Proceedings of the 4th International ICST Conferenceon Simulation Tools and Techniques, ICST (Institute for Computer Sciences, Social-Informatics and Telecommunications Engineering), ICST,Brussels, Belgium, Belgium. pp. 415–422. URL: http://dl.acm.org/citation.cfm?id=2151054.2151129.
Tinini, et. al.: Preprint submitted to Elsevier Page 26 of 27

5GPy: A SimPy-based Simulator for Performance Evaluations in 5G Hybrid Cloud-Fog RAN Architectures
[14] Piro, G., Grieco, L.A., Boggia, G., Capozzi, F., Camarda, P., 2011. Simulating lte cellular systems: An open-source framework. IEEETransactions on Vehicular Technology 60, 498–513. doi:10.1109/TVT.2010.2091660.
[15] Rupp, M., Schwarz, S., Taranetz, M., 2016. The Vienna LTE-Advanced Simulators: Up and Downlink, Link and System Level Simulation.1st ed., Springer Publishing Company, Incorporated.
[16] Sonmez, C., Ozgovde, A., Ersoy, C., 2017. Edgecloudsim: An environment for performance evaluation of edge computing systems, in: 2017Second International Conference on Fog and Mobile Edge Computing (FMEC), pp. 39–44. doi:10.1109/FMEC.2017.7946405.
[17] Tinini, R.I., Batista, D.M., Figueiredo, G.B., 2018. Energy-Efficient VPON Formation andWavelength Dimensioning in Cloud-Fog RAN overTWDM-PON, in: 2018 IEEE Symposium on Computers and Communications (ISCC), pp. 521–526. doi:10.1109/ISCC.2018.8538610.
[18] Tinini, R.I., Batista, D.M., Figueiredo, G.B., Tornatore, M., Mukherjee, B., 2019. Low-latency and energy-efficient bbu placement and vponformation in virtualized cloud-fog ran. Journal of Optical Communications and Networking 11, B37–B48.
[19] Tinini, R.I., Reis, L.C.M., Batista, D.M., Figueiredo, G.B., Tornatore, M., Mukherjee, B., 2017. Optimal placement of virtualized bbuprocessing in hybrid cloud-fog ran over twdm-pon, in: GLOBECOM 2017 - 2017 IEEEGlobal Communications Conference, pp. 1–6. doi:10.1109/GLOCOM.2017.8254770.
[20] Wang, X., Thota, S., Tornatore, M., Chung, H.S., Lee, H.H., Park, S., Mukherjee, B., 2016. Energy-efficient virtual base station formation inoptical-access-enabled cloud-ran. IEEE Journal on Selected Areas in Communications 34, 1130–1139.
Tinini, et. al.: Preprint submitted to Elsevier Page 27 of 27