
3rd Meeting of Task Force 2 on “Advancement of ... · Power Market Outlook ... This was followed...
90
1 icfi.com | Presentation on the progress and preliminary findings of the study on “Assessment of the Electricity Trading Potential in the South Asia region” 25 th February 2015 3 rd Meeting of Task Force 2 on “Advancement of Transmission Systems Interconnection”
Transcript of 3rd Meeting of Task Force 2 on “Advancement of ... · Power Market Outlook ... This was followed...

1icfi.com |
Presentation on the progress and preliminary findings of the study on “Assessment of the Electricity Trading Potential in the South Asia region”
25th February 2015
3rd Meeting of Task Force 2 on “Advancement of Transmission Systems Interconnection”
2icfi.com |
• Project objective and scope of work as per Terms of Reference
• Project approach and methodology
• Methodology for estimation of unrestricted electricity demand, electricity
supply and peak demand forecast for South Asian Nations
• Findings/analysis on Demand-Supply projections of the South Asian Nations
• Introduction to ICF’s Integrated Planning Model (IPM®)
• Model assumptions and model run results for India
• Data support needed from Task Force members
• Way Forward
• Appendices
Presentation Outline
3icfi.com |
Project Objective
To identify the electricity trading potential of the South Asian nations (India, Bangladesh,
Bhutan, Nepal, Sri Lanka, Pakistan, Maldives and Afghanistan) over a period of next 20 years
by reviewing the existing long term Demand-Supply projections of the participating
countries.

4icfi.com |
Project Scope of Work
1. The study to account all types of generating plants viz Hydro, Thermal, Nuclear and Renewable.
2. Collect, compile, review and analyze the existing/prevailing long term Demand-Supply (D-S)projections/data available in respect of each South Asian country. This shall include differentgeneration capacity addition scenarios.
3. Assess whether existing D-S projections have adequately been taken up and have explored theCross Border Electricity Trade (CBET) potentials of each South Asian country from the tradingperspectives and in the time horizon of 10-20 years.
4. If the data including the perspective generation capacity addition projections are not availablefrom various sources for the time horizon of 10-20 years, a proper methodology* to be adoptedto arrive at reasonable D-S projections to explore the CBET potential of each South Asian country.
5. The above D-S projections shall include the year wise trading opportunities that arise out ofseasonal variations, time zone difference, difference in load curve, different weekends andholidays being followed in each South Asian nation.
*Methodology to be adopted for arriving at these projections shall be finalized in consultation with the respective Task Force 2 countrymembers and shall include a ‘sensitivity analysis’ of the same. Based on the approved methodology, country wise projections shall be madein respect of the various seasonal scenarios (including peak/off-peak conditions) and in terms of both MW and MWhr for the specified timehorizon of next 10-20 years.
5icfi.com |
Project Deliverables
1. (a) Submit a Draft report on the Findings/Analysis on the existing Demand-Supply projections (MW, MWh) of each South Asian Nation.
(b) Wherever data projections are not available upto the specified time horizon, a separate draft report shall be submitted, identifying the shortcomings and the projections (including assumptions) made in respect of the Demand-Supply (MW, MWh) for a period of next 10-20 years covering plantwise breakup of generation and the fuel being used etc.
2. Make presentation(s) on the above Draft reports to the Task Force 2 members as and whenrequired
3. Submit an interim report, incorporating all suggestions/recommendations to the respectiveprovisions by the Task Force 2 members and IRADe.
4. Make presentation(s) before the Task Force 2 members, Project Steering Committee (PSC),IRADe and USAID on the interim report, as and when required.
5. Submit the Final report based on the feedback received from all stakeholders.

6icfi.com |
Project Approach & Methodology
The overall project approach has been divided into following three parts:
1. Power Sector Historical Analysis and Current Overview:a) Review of historical Demand-Supply trends. Collation of data on historical –
i. Peak load and energy demandii. Capacity addition and generationiii. Energy and peak deficits
b) Analysis of Existing and Future Transmission Capacity
2. Power Market Outlook (2014 to 2034 – 20 Years): Base case development using ICF’s IPM® (Integrated Planning Model). Towards populating the modeling framework, ICF will build develop assumptions on demand, supply, future generation and transmission builds, fuel supply and renewable forecasts besides other areas.
3. Scenario Analysis: Analysis around the base case to assess the impact of variables for same timeframe as base case
IPM® is a long-term capacity expansion and production costing model for electric power systems including generation and transmission. It is a multi-regional, deterministic, dynamic, linear programming model.
Deliverable 1 (a) + partly 1 (b)
7icfi.com |
Methodology for estimation of unrestricted electricitydemand, electricity supply and peak demand forecast
Unrestricted electricity demand (GWh) forecast for all countries (except Sri Lanka#) has been estimatedusing the following methodology:
• The actual electricity demand for 2013 has been used as the as base Energy Demand
• For the period 2014-34, the electricity demand has been computed as the product of GDP andelectricity elasticity* for each year
• GDP forecast for each country has been developed by using The World Bank’s GDP growth forecast
• Electricity Elasticity for each country has been calculated by studying the relationship between theelectricity demand and the GDP over last 10 years. Same elasticity value has been considered forall the future years for calculating the electricity demand
Electricity supply (GWh) forecast (upto 2034), if unavailable in the respective national power plandocument, has been developed by either estimating generation from upcoming power plants** orassuming the generation of the last year upto which forecast is available to be constant for future years.
Peak demand (MW) forecast, if unavailable in the respective national power plan document, has beenestimated by using 5 year compound annual growth rate (CAGR).
#In case of Sri Lanka, demand forecast is available in Ceylon Electricity Board’s Generation Expansion Plan 2013*Electricity Elasticity refers to the percentage change in energy demand to achieve one per cent change in national GDP**if data on the same is available
8icfi.com |
Findings/Analysis on the existing Demand-Supply projections of the South Asian Nations
Deliverable 1 (a) + partly 1(b) as per Project Terms of Reference
9icfi.com |
Afghanistan – Findings & Analysis on Electricity Demand, Electricity Supply and Peak Demand
10icfi.com |
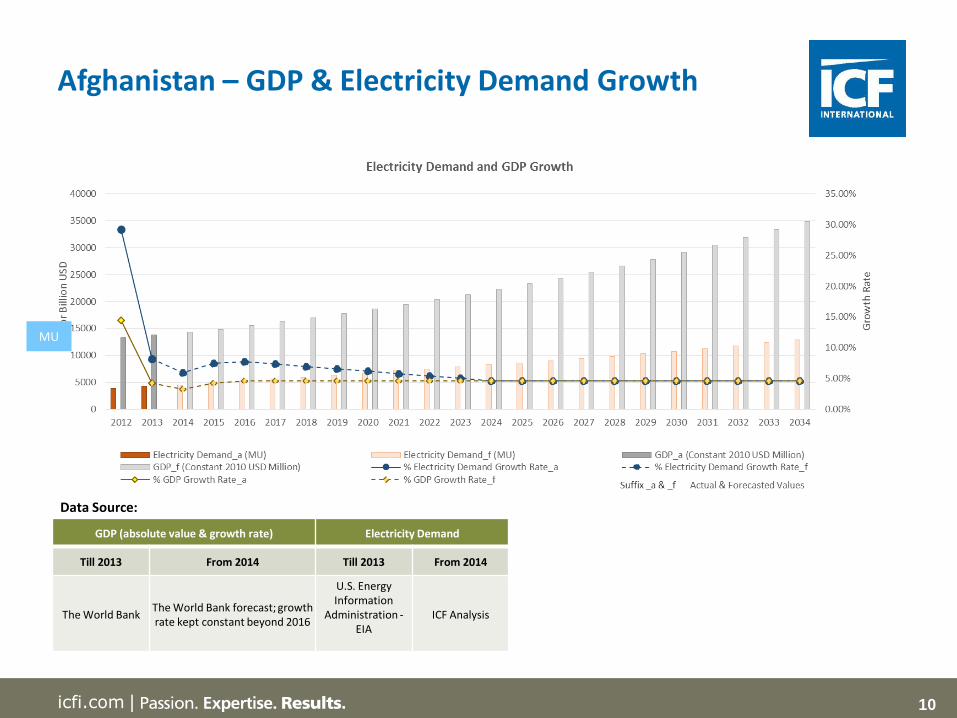
Afghanistan – GDP & Electricity Demand Growth
Data Source:
GDP (absolute value & growth rate) Electricity Demand
Till 2013 From 2014 Till 2013 From 2014
The World BankThe World Bank forecast; growth rate kept constant beyond 2016
U.S. Energy Information
Administration -EIA
ICF Analysis
MU
11icfi.com |
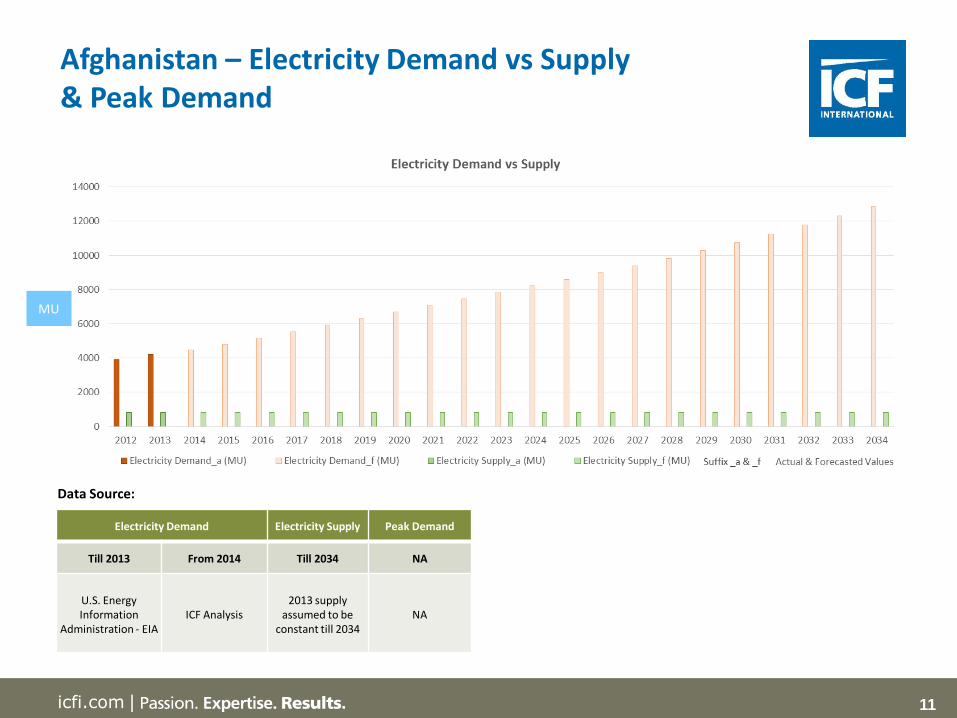
Afghanistan – Electricity Demand vs Supply & Peak Demand
Data Source:
Electricity Demand Electricity Supply Peak Demand
Till 2013 From 2014 Till 2034 NA
U.S. Energy Information
Administration - EIAICF Analysis
2013 supply assumed to be
constant till 2034NA
MU
12icfi.com |
Afghanistan – Load Profile 2013
Data for Afghanistan Load Profile (8760 hours) is Not Available

13icfi.com |
Bangladesh – Findings & Analysis on Electricity Demand, Electricity Supply and Peak Demand

14icfi.com |
Bangladesh – GDP & Electricity Demand Growth
Data Source:
BPDP - Bangladesh Power Development Board
GDP (absolute value & growth rate) Electricity Demand
Till 2013 From 2014 Till 2013 From 2014
The World Bank The World Bank forecast; growth rate kept constant
2016 onwardsBPDP ICF Analysis
15icfi.com |
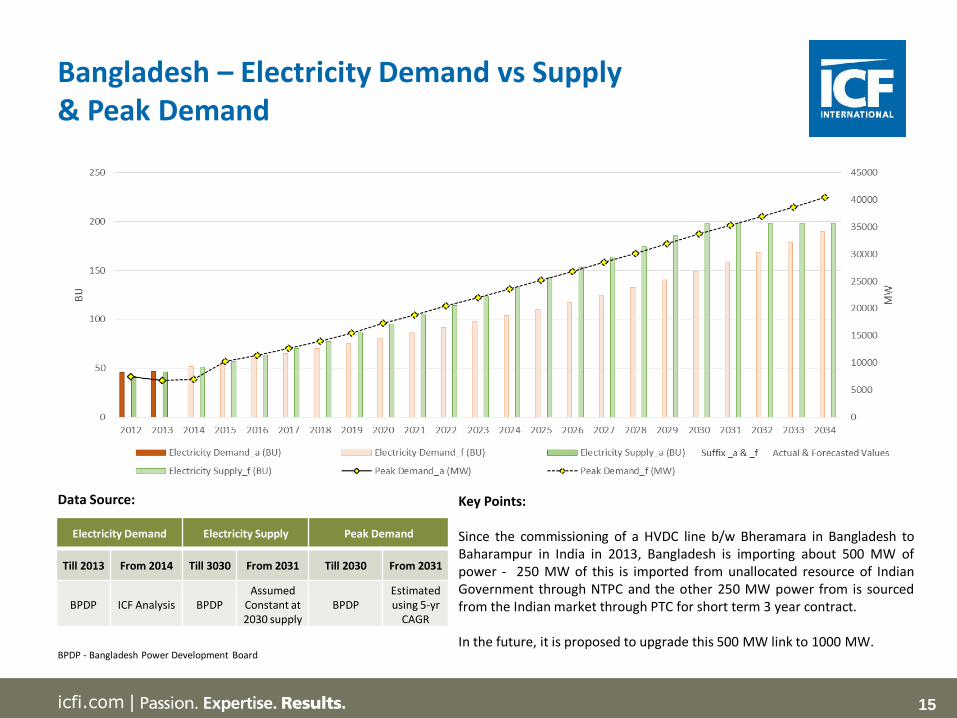
Bangladesh – Electricity Demand vs Supply & Peak Demand
Data Source:
BPDP - Bangladesh Power Development Board
Electricity Demand Electricity Supply Peak Demand
Till 2013 From 2014 Till 3030 From 2031 Till 2030 From 2031
BPDP ICF Analysis BPDPAssumed
Constant at 2030 supply
BPDPEstimated using 5-yr
CAGR
Key Points:
Since the commissioning of a HVDC line b/w Bheramara in Bangladesh toBaharampur in India in 2013, Bangladesh is importing about 500 MW ofpower - 250 MW of this is imported from unallocated resource of IndianGovernment through NTPC and the other 250 MW power from is sourcedfrom the Indian market through PTC for short term 3 year contract.
In the future, it is proposed to upgrade this 500 MW link to 1000 MW.
16icfi.com |
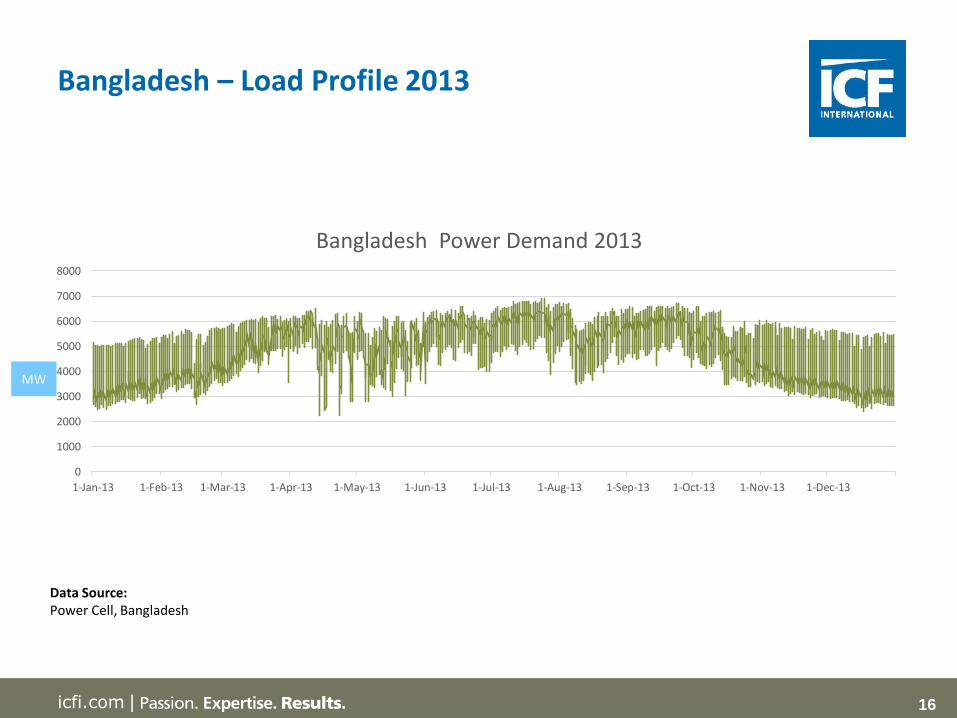
Bangladesh – Load Profile 2013
Data Source:Power Cell, Bangladesh
0
1000
2000
3000
4000
5000
6000
7000
8000
1-Jan-13 1-Feb-13 1-Mar-13 1-Apr-13 1-May-13 1-Jun-13 1-Jul-13 1-Aug-13 1-Sep-13 1-Oct-13 1-Nov-13 1-Dec-13
Bangladesh Power Demand 2013
MW

17icfi.com |
Bhutan – Findings & Analysis on Electricity Demand, Electricity Supply and Peak Demand

18icfi.com |
Bhutan – GDP & Electricity Demand Growth
Data Source:
GDP (absolute value & growth rate) Electricity Demand
Till 2013 From 2014 Till 2013 From 2014
The World BankThe World Bank forecast; growth rate kept constant
2016 onwards
Bhutan AnnualStatistical Yearbook
ICF Analysis
MU

19icfi.com |
Bhutan – Electricity Demand vs Supply & Peak Demand
Data Source:
NTGMP – National Transmission Grid Master Plan for BhutanCEA – Central Electricity Authority
Electricity Demand Electricity Supply Peak Demand
Till 2013 From 2014 Till 2013 From 2014 Till 2030 From 2031
Bhutan Annual
Statistical Yearbook
ICF Analysis
Bhutan Annual
Statistical Yearbook
NTGMP by CEA, India
NTGMP by CEA, India
Estimatedusing
5-yr CAGR
Key Points:
Electricity trade b/w India and Bhutan was initiated in 1961 when Bhutanstarted sourcing power from the Jaldhaka HPP set up in West Bengal, India.This was followed by construction of mini/micro hydel project in Bhutan withGrant Assistance from Government of India (GoI).
Currently Bhutan is exporting about 1300 MW power from Chhukha, Kurichhu,Tala, Basochhu – I&II Power Plants in the peak Monsoon season. The 126 MWDagachhu Power Plant (built under PPP mode) in Bhutan is now commissionedand will soon participate in the open Power Markets operational in India.
MU
20icfi.com |
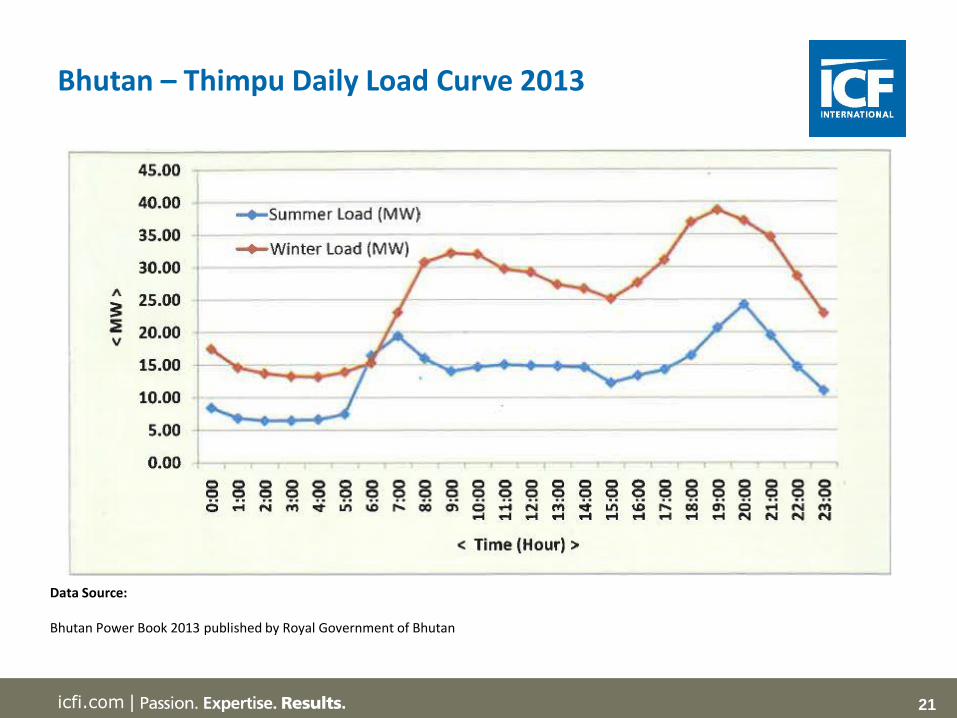
Data for Bhutan Load Profile (8760 hours) is Not Available
However, Power Data Book 2013 published by Bhutan Power Corporation Limited (BPCL) provides Load Curve for a typical day in 2013 summer and winter for Thimpu and Phuntsholing, as shown in the following slides:
Bhutan – Load Profile 2013
21icfi.com |
Bhutan – Thimpu Daily Load Curve 2013
Data Source:
Bhutan Power Book 2013 published by Royal Government of Bhutan

22icfi.com |
Bhutan – Phuntsholing Daily Load Curve 2013
Data Source:
Bhutan Power Book 2013 published by Royal Government of Bhutan
23icfi.com |
India - Findings & Analysis on Electricity Demand, Electricity Supply and Peak Demand
24icfi.com |
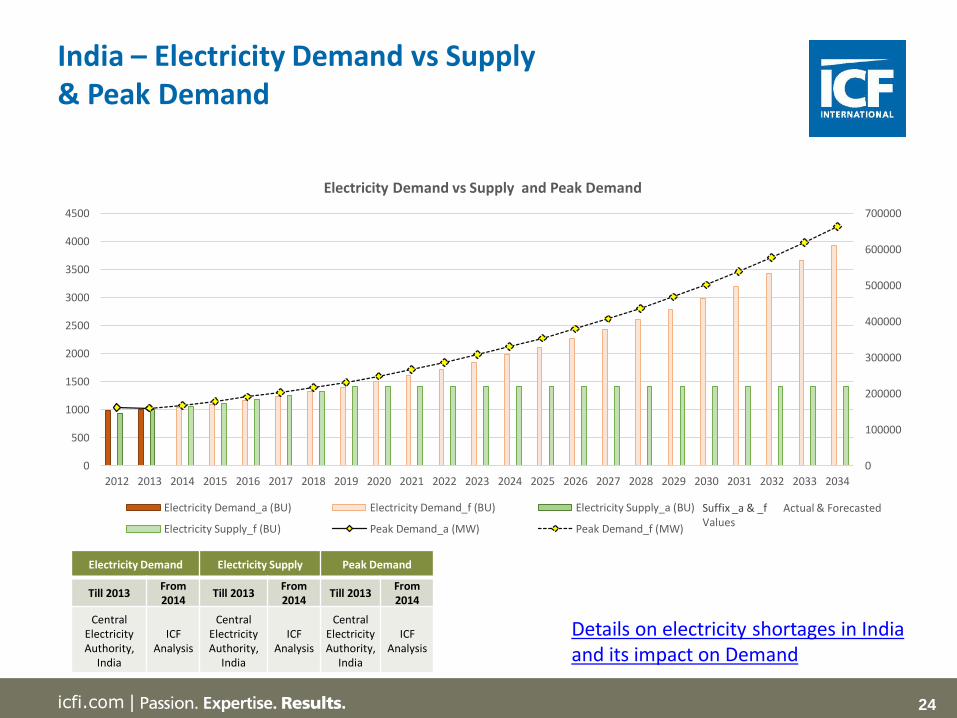
India – Electricity Demand vs Supply & Peak Demand
0
100000
200000
300000
400000
500000
600000
700000
0
500
1000
1500
2000
2500
3000
3500
4000
4500
2012 2013 2014 2015 2016 2017 2018 2019 2020 2021 2022 2023 2024 2025 2026 2027 2028 2029 2030 2031 2032 2033 2034
Electricity Demand vs Supply and Peak Demand
Electricity Demand_a (BU) Electricity Demand_f (BU) Electricity Supply_a (BU)
Electricity Supply_f (BU) Peak Demand_a (MW) Peak Demand_f (MW)
Suffix _a & _f Actual & Forecasted Values
Details on electricity shortages in India and its impact on Demand
Electricity Demand Electricity Supply Peak Demand
Till 2013From 2014
Till 2013From2014
Till 2013From 2014
Central ElectricityAuthority,
India
ICF Analysis
Central ElectricityAuthority,
India
ICF Analysis
Central ElectricityAuthority,
India
ICF Analysis
25icfi.com |
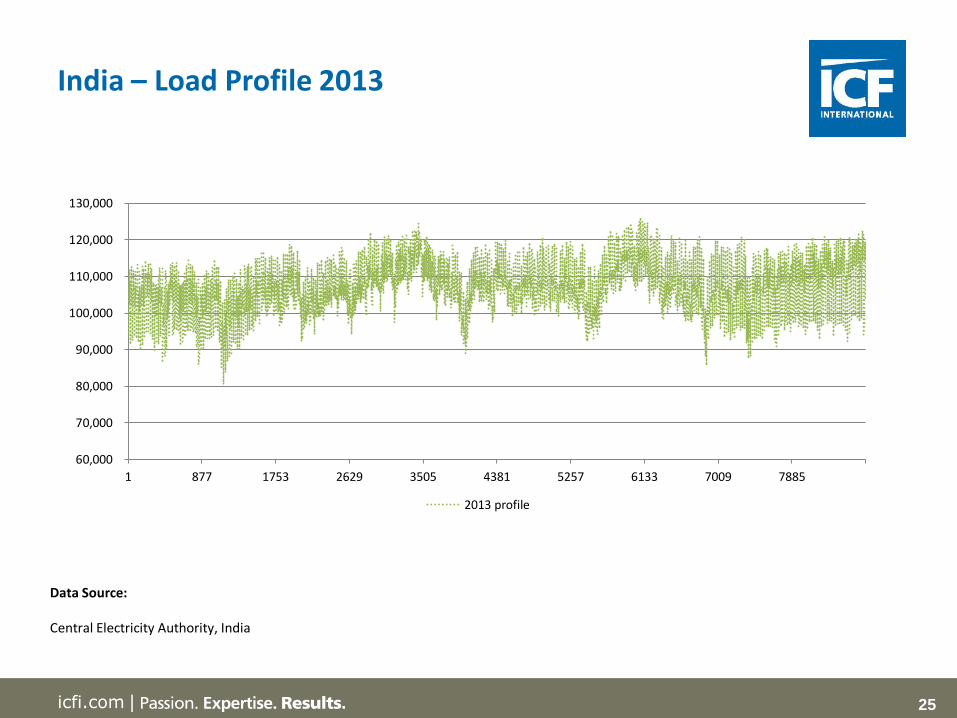
India – Load Profile 2013
Data Source:
Central Electricity Authority, India
60,000
70,000
80,000
90,000
100,000
110,000
120,000
130,000
1 877 1753 2629 3505 4381 5257 6133 7009 7885
2013 profile
26icfi.com |
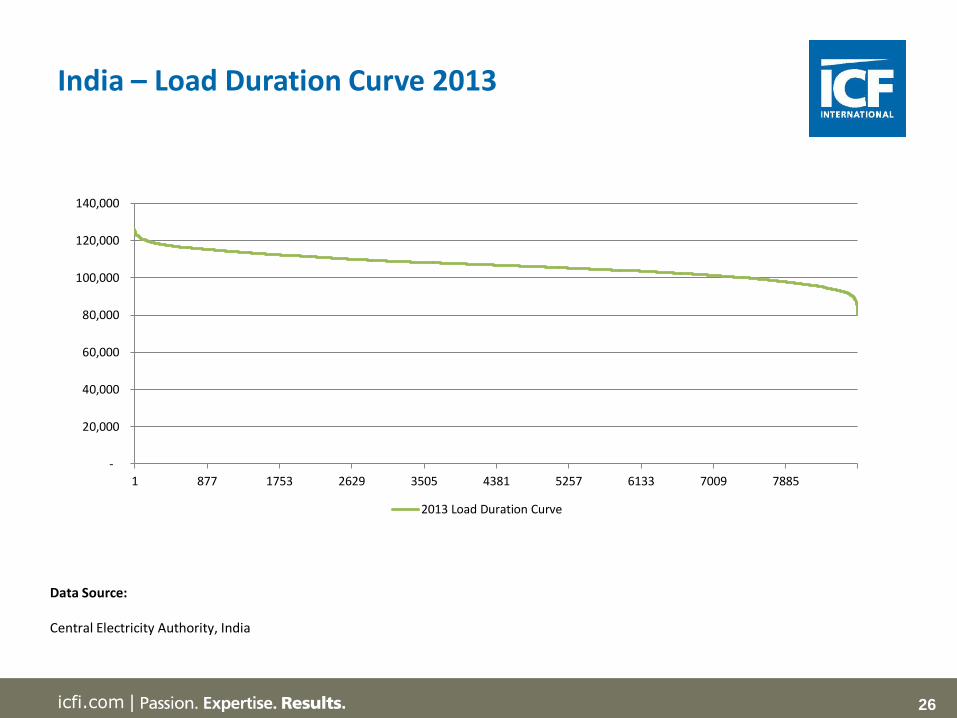
India – Load Duration Curve 2013
Data Source:
Central Electricity Authority, India
-
20,000
40,000
60,000
80,000
100,000
120,000
140,000
1 877 1753 2629 3505 4381 5257 6133 7009 7885
2013 Load Duration Curve

27icfi.com |
Maldives – Findings & Analysis on Electricity Demand, Electricity Supply and Peak Demand
28icfi.com |
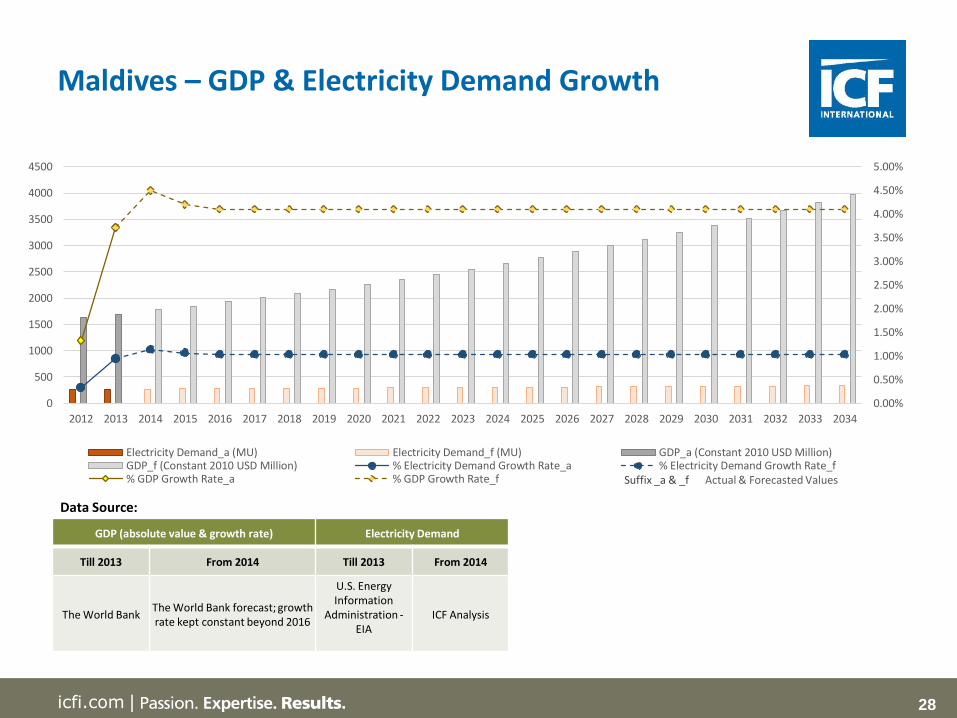
Maldives – GDP & Electricity Demand Growth
Data Source:
GDP (absolute value & growth rate) Electricity Demand
Till 2013 From 2014 Till 2013 From 2014
The World BankThe World Bank forecast; growth rate kept constant beyond 2016
U.S. Energy Information
Administration -EIA
ICF Analysis
0.00%
0.50%
1.00%
1.50%
2.00%
2.50%
3.00%
3.50%
4.00%
4.50%
5.00%
0
500
1000
1500
2000
2500
3000
3500
4000
4500
2012 2013 2014 2015 2016 2017 2018 2019 2020 2021 2022 2023 2024 2025 2026 2027 2028 2029 2030 2031 2032 2033 2034
Electricity Demand_a (MU) Electricity Demand_f (MU) GDP_a (Constant 2010 USD Million)GDP_f (Constant 2010 USD Million) % Electricity Demand Growth Rate_a % Electricity Demand Growth Rate_f% GDP Growth Rate_a % GDP Growth Rate_f Suffix _a & _f Actual & Forecasted Values
29icfi.com |
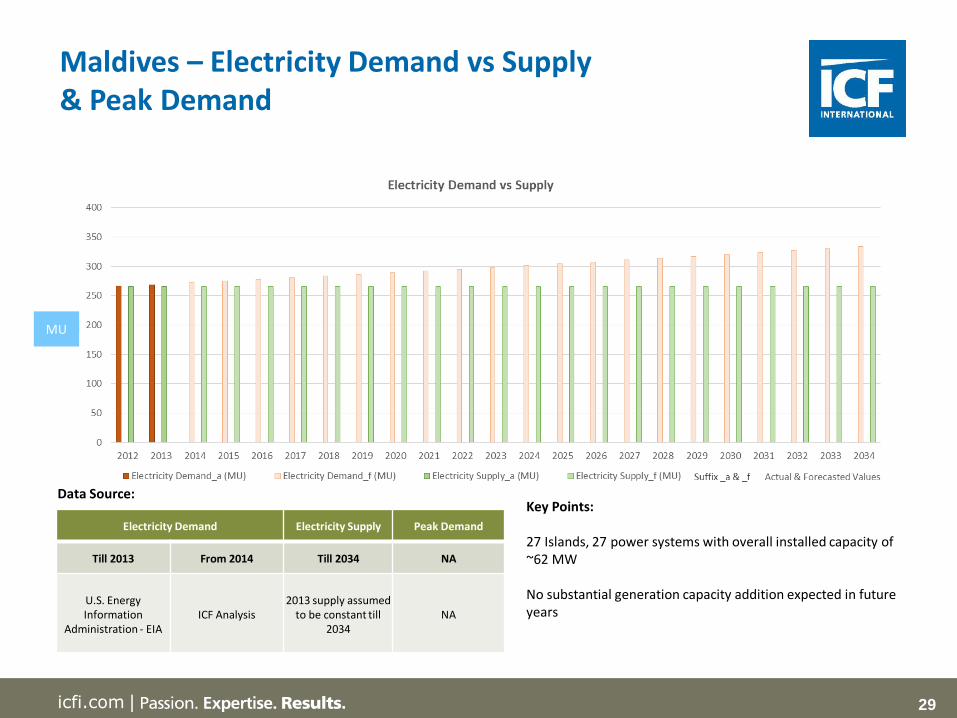
Maldives – Electricity Demand vs Supply & Peak Demand
Data Source:
LTGEP – Long Term Generation Expansion Plan
Electricity Demand Electricity Supply Peak Demand
Till 2013 From 2014 Till 2034 NA
U.S. Energy Information
Administration - EIAICF Analysis
2013 supply assumed to be constant till
2034NA
Key Points:
27 Islands, 27 power systems with overall installed capacity of ~62 MW
No substantial generation capacity addition expected in future years
MU

30icfi.com |
Maldives – Load Profile 2013
Data for Maldives Load Profile (8760 hours) is Not Available

31icfi.com |
Nepal – Findings & Analysis on Electricity Demand, Electricity Supply and Peak Demand

32icfi.com |
Nepal – GDP & Electricity Demand Growth
Data Source:
GDP (absolute value & growth rate) Electricity Demand
Till 2013 From 2014 Till 2033 2034
The World BankThe World Bank forecast; growth rate kept constant
2016 onwards
Nepal ElectricityAuthority
Annual Report 2014
ICF Analysis
Key Points:
• Nepal has very high electricity shortages • Unrestricted Demand data for past 3 years has been used to
forecast future demand
MU
33icfi.com |
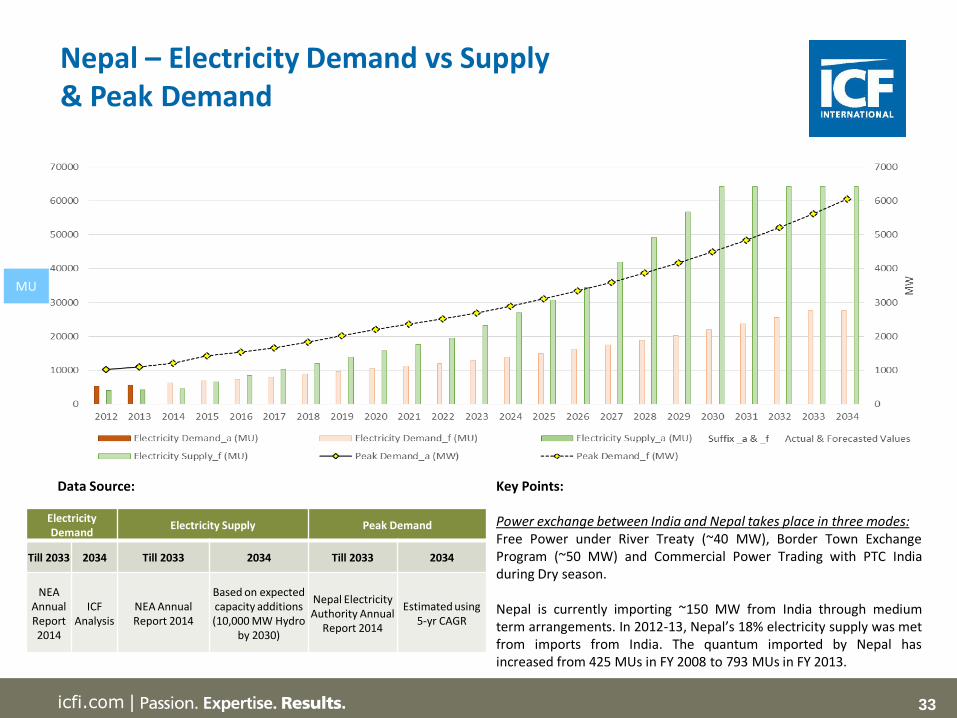
Nepal – Electricity Demand vs Supply & Peak Demand
Data Source:
Electricity Demand
Electricity Supply Peak Demand
Till 2033 2034 Till 2033 2034 Till 2033 2034
NEA Annual Report 2014
ICF Analysis
NEA Annual Report 2014
Based on expected capacity additions(10,000 MW Hydro
by 2030)
Nepal ElectricityAuthority Annual
Report 2014
Estimated using 5-yr CAGR
Key Points:
Power exchange between India and Nepal takes place in three modes:Free Power under River Treaty (~40 MW), Border Town ExchangeProgram (~50 MW) and Commercial Power Trading with PTC Indiaduring Dry season.
Nepal is currently importing ~150 MW from India through mediumterm arrangements. In 2012-13, Nepal’s 18% electricity supply was metfrom imports from India. The quantum imported by Nepal hasincreased from 425 MUs in FY 2008 to 793 MUs in FY 2013.
MU
34icfi.com |
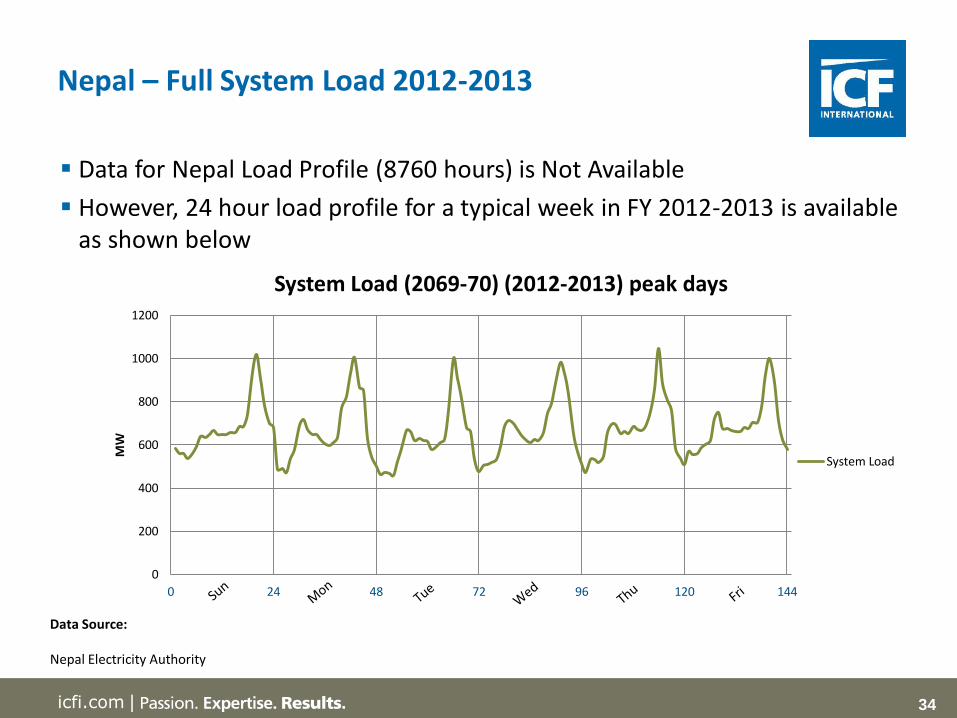
Nepal – Full System Load 2012-2013
Data Source:
Nepal Electricity Authority
0
200
400
600
800
1000
1200
0 24 48 72 96 120 144
MW
System Load (2069-70) (2012-2013) peak days
System Load
Data for Nepal Load Profile (8760 hours) is Not Available
However, 24 hour load profile for a typical week in FY 2012-2013 is available as shown below
35icfi.com |
Pakistan – Findings & Analysis on Electricity Demand, Electricity Supply and Peak Demand

36icfi.com |
Pakistan – GDP & Electricity Demand Growth
Data Source:
GDP (absolute value & growth rate) Electricity Demand
Till 2013 From 2014 Till 2034
The World Bank
The World Bank forecast; growth rate kept constant 2016
onwards
ICF Analysis using Electricity Demand Data from National Power
System Expansion Plan prepared by the National Transmission and
Despatch Company, Pakistan
Key Points:
Electricity demand in Pakistan follows an asymmetric pattern. The demand has strongly been influenced by GDP during high growth period 1999-2006
37icfi.com |
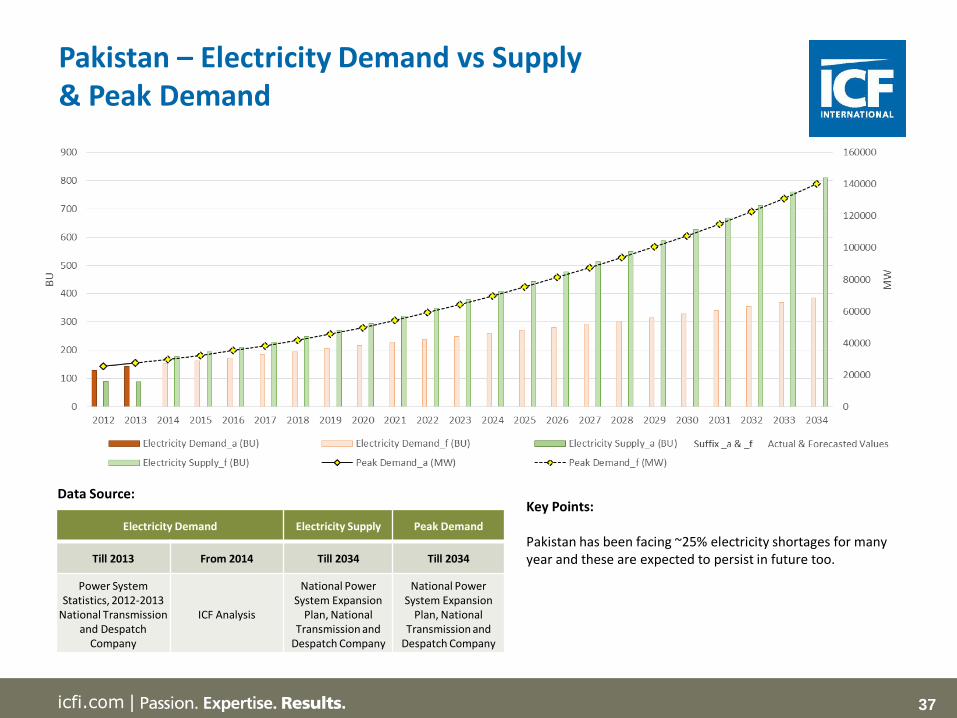
Pakistan – Electricity Demand vs Supply & Peak Demand
Data Source:
LTGEP – Long Term Generation Expansion Plan
Electricity Demand Electricity Supply Peak Demand
Till 2013 From 2014 Till 2034 Till 2034
Power System Statistics, 2012-2013
National Transmission and Despatch
Company
ICF Analysis
National Power System Expansion
Plan, National Transmission and
Despatch Company
National Power System Expansion
Plan, National Transmission and
Despatch Company
Key Points:
Pakistan has been facing ~25% electricity shortages for many year and these are expected to persist in future too.

38icfi.com |
Pakistan – Load Profile 2013
Data for Pakistan Load Profile (8760 hours) is Not Available

39icfi.com |
Sri Lanka – Findings & Analysis on Electricity Demand, Electricity Supply and Peak Demand

40icfi.com |
Sri Lanka – Electricity Demand vs Supply & Peak Demand
Data Source:
LTGEP – Long Term Generation Expansion Plan
Electricity Demand Electricity Supply Peak Demand
Till 2034 Till 2034 Till 2034
LTGEP,Ceylon Electricity Board
LTGEP,Ceylon Electricity Board
LTGEP,Ceylon Electricity Board
0
1000
2000
3000
4000
5000
6000
7000
8000
0
5
10
15
20
25
30
35
40
2012 2013 2014 2015 2016 2017 2018 2019 2020 2021 2022 2023 2024 2025 2026 2027 2028 2029 2030 2031 2032 2033 2034
Electricity Demand_a (BU) Electricity Demand_f (BU) Electricity Supply_a (BU)
Electricity Supply_f (BU) Peak Demand_a (MW) Peak Demand_f (MW)
Suffix _a & _f Actual & Forecasted Values

41icfi.com |
Sri Lanka – Full System Load 2012-2013
Data Source:
Sri Lanka Sustainable Energy Authority
Data for Sri Lanka Load Profile (8760 hours) is Not Available
However, 24 hour load profile for a system maximum night peak in 2013 is available as shown below
42icfi.com |
Conclusion: Demand-Supply Scenario for South Asian Nations
43icfi.com |
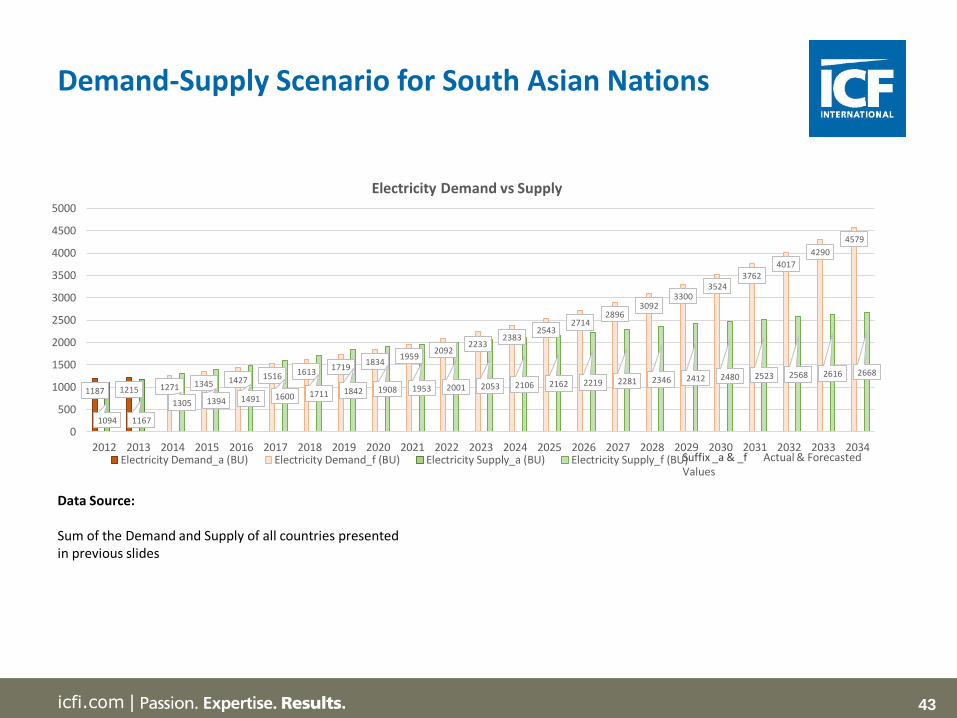
Demand-Supply Scenario for South Asian Nations
Data Source:
Sum of the Demand and Supply of all countries presented in previous slides
1187 1215 1271 1345 1427 1516 16131719
18341959
20922233
23832543
27142896
30923300
35243762
4017
4290
4579
1094 1167
1305 1394 1491 1600 1711 1842 1908 1953 2001 2053 2106 2162 2219 2281 2346 2412 2480 2523 2568 2616 2668
0
500
1000
1500
2000
2500
3000
3500
4000
4500
5000
2012 2013 2014 2015 2016 2017 2018 2019 2020 2021 2022 2023 2024 2025 2026 2027 2028 2029 2030 2031 2032 2033 2034
Electricity Demand vs Supply
Electricity Demand_a (BU) Electricity Demand_f (BU) Electricity Supply_a (BU) Electricity Supply_f (BU)Suffix _a & _f Actual & Forecasted Values

44icfi.com |
ICF’s Integrated Planning Model (IPM®)
45icfi.com |
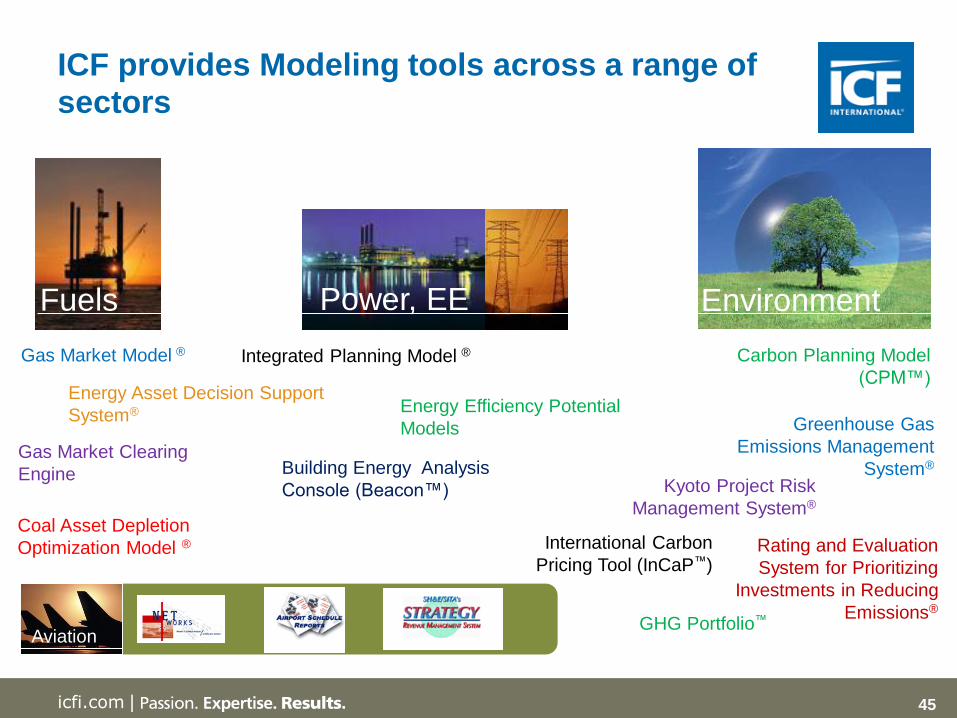
ICF provides Modeling tools across a range of sectors
Fuels Power, EE Environment
Integrated Planning Model ®Gas Market Model ®
Energy Asset Decision Support
System®
Gas Market Clearing
Engine Building Energy Analysis
Console (Beacon™)
Energy Efficiency Potential
Models
Carbon Planning Model
(CPM™)
Greenhouse Gas
Emissions Management
System®
GHG Portfolio™
International Carbon
Pricing Tool (InCaP™)
Kyoto Project Risk
Management System®
Rating and Evaluation
System for Prioritizing
Investments in Reducing
Emissions®
Coal Asset Depletion
Optimization Model ®
Aviation

46icfi.com |
IPM® is an excellent and versatile long range
planning model
IPM® is a long-term capacity expansion and production costing model forelectric power systems including generation, transmission, andprocess/district heat production from co-generation and stand-aloneboilers
It is a multi-regional, deterministic, dynamic, linear programming model
Utilizes Dynamic Optimization Framework with an Objective Function ofMinimizing the Present Value of Total System Cost subject to:
• Electricity & Steam Demand Constraints
• Reserve Margin Constraints
• Environmental Constraints
• Transmission Constraints
• Fuel Constraints
• Other Operational Constraints
Simulates rational expectations for perfect foresight providing theframework for inter-temporal decision making
46

47icfi.com |
Integrated Planning Model (IPM®)
47
More details on IPM in Appendix
48icfi.com |
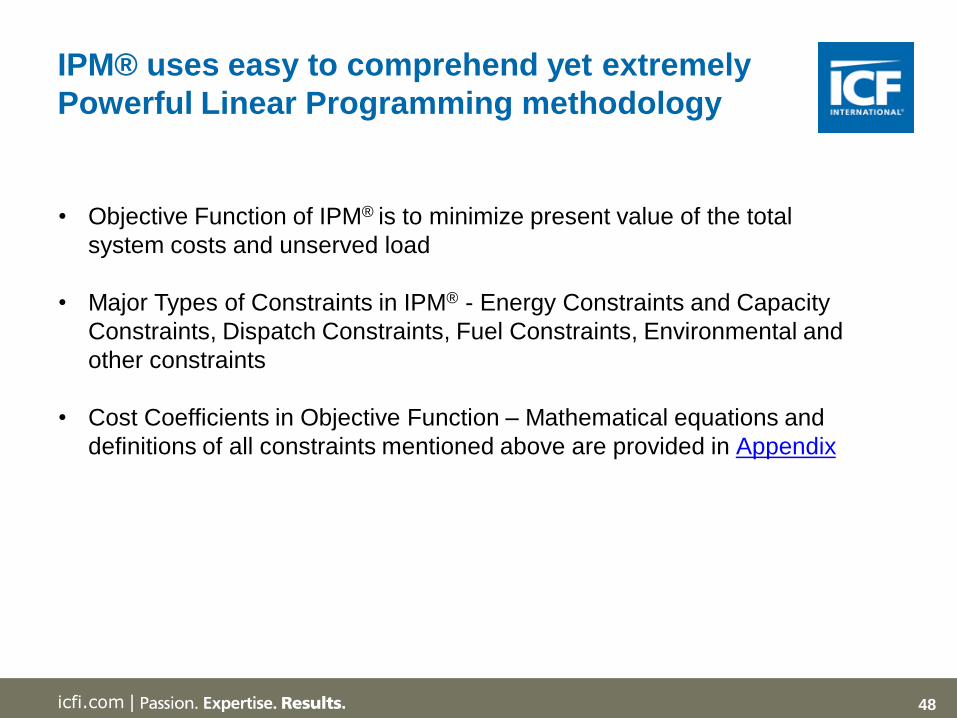
IPM® uses easy to comprehend yet extremely
Powerful Linear Programming methodology
• Objective Function of IPM® is to minimize present value of the total
system costs and unserved load
• Major Types of Constraints in IPM® - Energy Constraints and Capacity
Constraints, Dispatch Constraints, Fuel Constraints, Environmental and
other constraints
• Cost Coefficients in Objective Function – Mathematical equations and
definitions of all constraints mentioned above are provided in Appendix
49icfi.com |
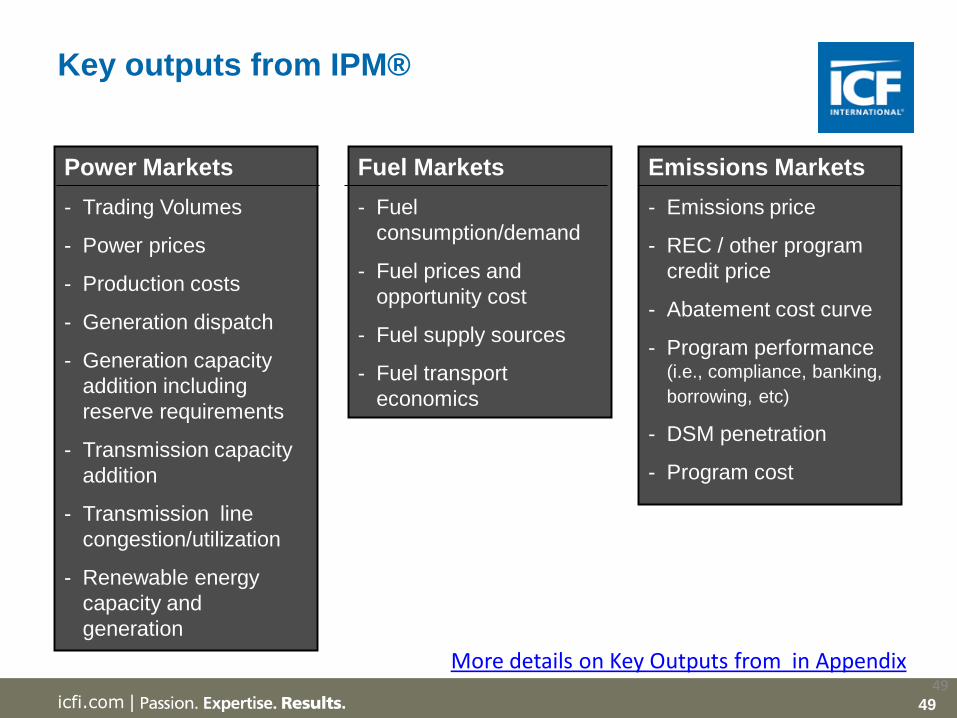
Power Markets
- Trading Volumes
- Power prices
- Production costs
- Generation dispatch
- Generation capacity
addition including
reserve requirements
- Transmission capacity
addition
- Transmission line
congestion/utilization
- Renewable energy
capacity and
generation
Fuel Markets
- Fuel
consumption/demand
- Fuel prices and
opportunity cost
- Fuel supply sources
- Fuel transport
economics
Emissions Markets
- Emissions price
- REC / other program
credit price
- Abatement cost curve
- Program performance (i.e., compliance, banking,
borrowing, etc)
- DSM penetration
- Program cost
Key outputs from IPM®
49
More details on Key Outputs from in Appendix

50icfi.com |
India - Key assumptions for IPM modeling

51icfi.com |
Indian economy expected to show strong recovery
YearICF
assumption
2014 5.50%
2015 6.30%
2016 6.60%
2017 6.88%
2018 7.16%
2019 7.44%
2020 7.72%
2021 onwards 8.00%
Average (2014-2031) 7.53%
Indian economy expected to recover in next fewyears on the back of strong reform agenda of thecurrent Government.
A high growth of ~8% is being targeted by Indiangovernment with the objective of reducing thepoverty levels significantly by 2050
In the long-term, the Planning Commission ofIndia targets Indian economy to reach andstabilize at a GDP growth rate of ~8%. The WorldBank has also estimated the long term GDPgrowth of India to remain ~8%.
India was able to sustain high GDP growth ratesin past on the back of strong reform measurestaken by the Government during that period.Same measures are expected from the currentGovernment.

52icfi.com |
Electricity Demand growth of 6.65% is expected during 2014-31 period
2014 to 2031 – average demand growth rate of 6.65% against average GDP growth of 7.53% assuming a constant energy elasticity of 0.89
By 2031, per capita consumption reaches 2,200 kWh/person which is similar to that of Eastern European countries
53icfi.com |
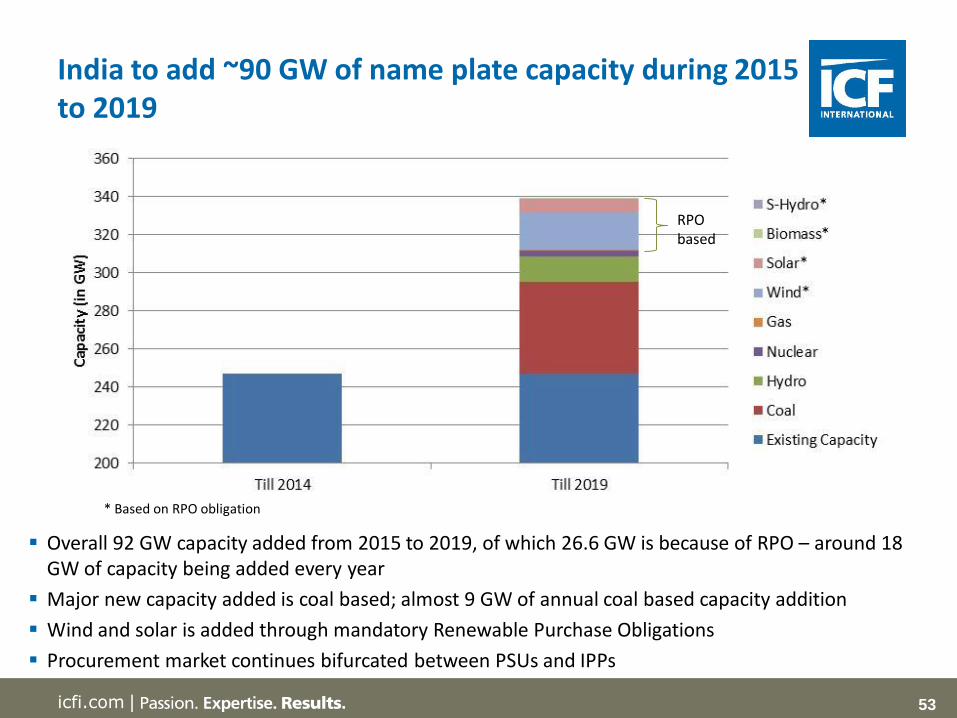
India to add ~90 GW of name plate capacity during 2015 to 2019
RPO based
* Based on RPO obligation
Overall 92 GW capacity added from 2015 to 2019, of which 26.6 GW is because of RPO – around 18 GW of capacity being added every year
Major new capacity added is coal based; almost 9 GW of annual coal based capacity addition
Wind and solar is added through mandatory Renewable Purchase Obligations
Procurement market continues bifurcated between PSUs and IPPs

54icfi.com |
Firm hydro capacity additions (2015 to 2019)
State Capacity
NR 5.7
SR 0.6
WR 0.6
NER 2.6
ER 3.1
Total 12.7
800 MW (RoR: 5 (800 MW))
2,500 MW (RoR: 10 (1,800 MW); Storage: 3 (700 MW))
2,400 MW (RoR: 11 (2000 MW); Storage: 2 (400 MW))
55icfi.com |
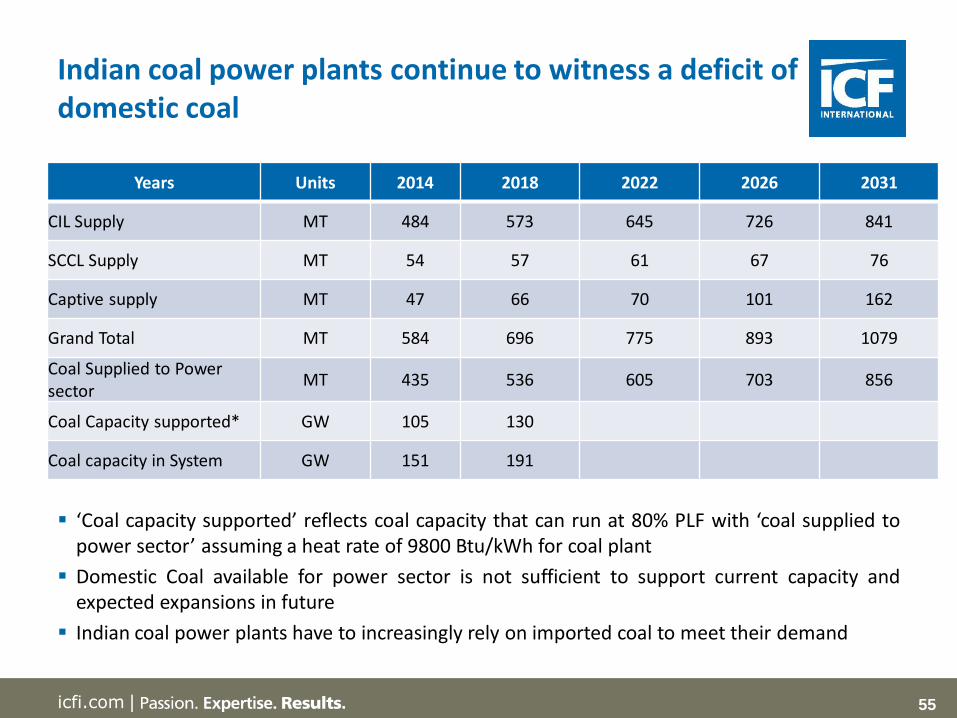
Indian coal power plants continue to witness a deficit of domestic coal
Years Units 2014 2018 2022 2026 2031
CIL Supply MT 484 573 645 726 841
SCCL Supply MT 54 57 61 67 76
Captive supply MT 47 66 70 101 162
Grand Total MT 584 696 775 893 1079
Coal Supplied to Power sector
MT 435 536 605 703 856
Coal Capacity supported* GW 105 130
Coal capacity in System GW 151 191
‘Coal capacity supported’ reflects coal capacity that can run at 80% PLF with ‘coal supplied topower sector’ assuming a heat rate of 9800 Btu/kWh for coal plant
Domestic Coal available for power sector is not sufficient to support current capacity andexpected expansions in future
Indian coal power plants have to increasingly rely on imported coal to meet their demand
56icfi.com |
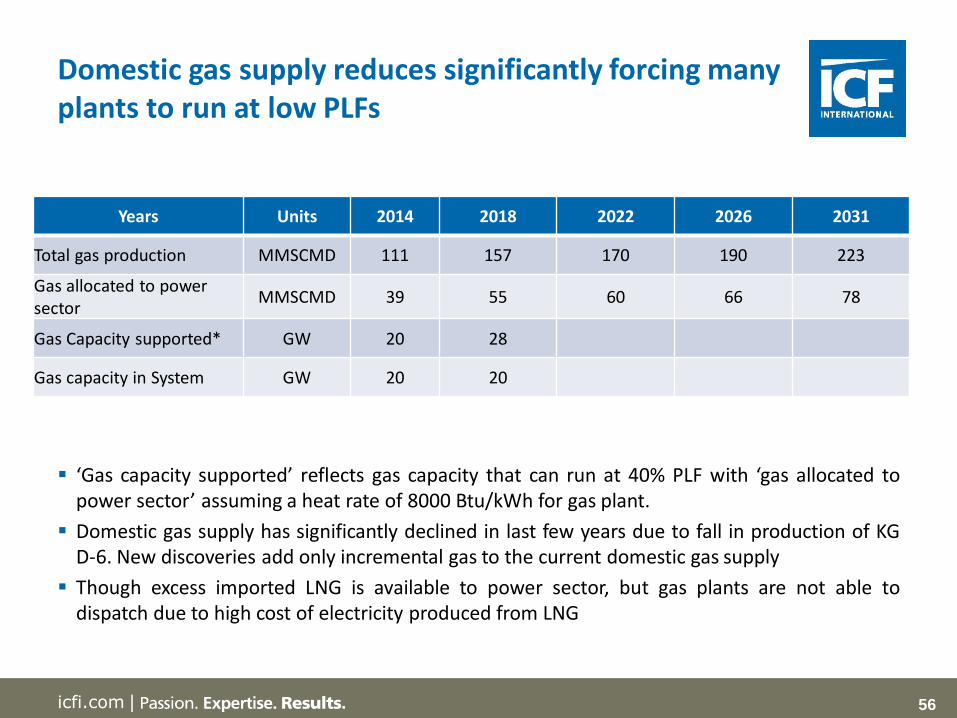
Domestic gas supply reduces significantly forcing many plants to run at low PLFs
Years Units 2014 2018 2022 2026 2031
Total gas production MMSCMD 111 157 170 190 223
Gas allocated to power sector
MMSCMD 39 55 60 66 78
Gas Capacity supported* GW 20 28
Gas capacity in System GW 20 20
‘Gas capacity supported’ reflects gas capacity that can run at 40% PLF with ‘gas allocated topower sector’ assuming a heat rate of 8000 Btu/kWh for gas plant.
Domestic gas supply has significantly declined in last few years due to fall in production of KGD-6. New discoveries add only incremental gas to the current domestic gas supply
Though excess imported LNG is available to power sector, but gas plants are not able todispatch due to high cost of electricity produced from LNG
57icfi.com |
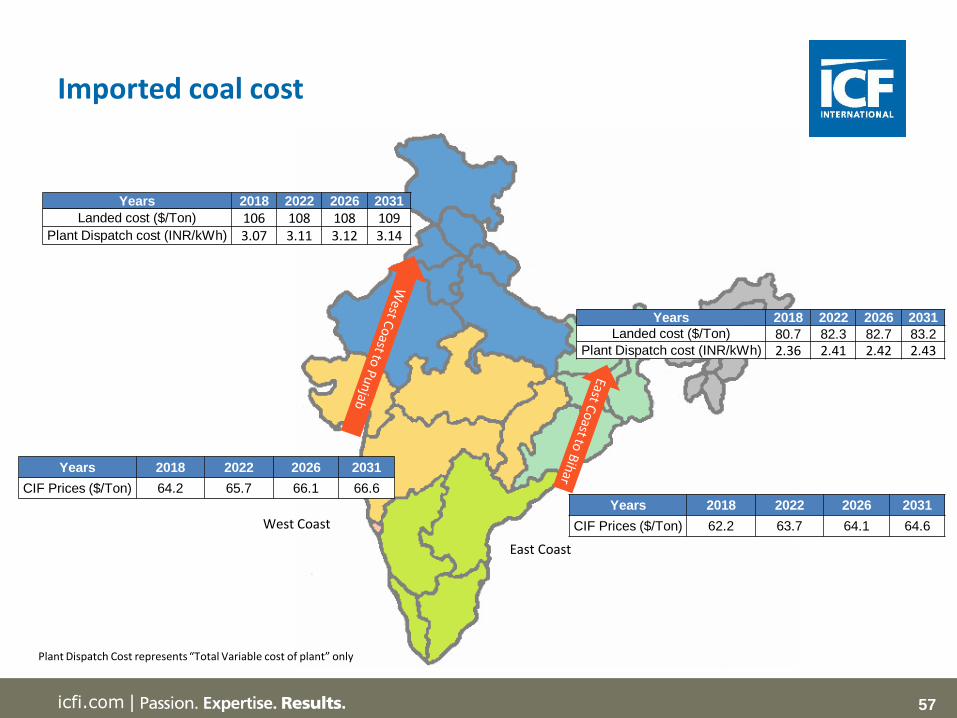
Imported coal cost
Years 2018 2022 2026 2031
CIF Prices ($/Ton) 62.2 63.7 64.1 64.6
Years 2018 2022 2026 2031
Landed cost ($/Ton) 80.7 82.3 82.7 83.2
Plant Dispatch cost (INR/kWh) 2.36 2.41 2.42 2.43
Years 2018 2022 2026 2031
CIF Prices ($/Ton) 64.2 65.7 66.1 66.6
Years 2018 2022 2026 2031
Landed cost ($/Ton) 106 108 108 109Plant Dispatch cost (INR/kWh) 3.07 3.11 3.12 3.14
East Coast
West Coast
Plant Dispatch Cost represents “Total Variable cost of plant” only

58icfi.com |
Domestic gas prices ($/MMBtu)
Tamil Nadu 2018 2022 2026 2031
Delivered cost (USD/MMBtu) 6.66 9.19 12.44 16.50Plant Dispatch cost (INR/kWh) 3.24 4.41 5.92 7.81
Delhi 2018 2022 2026 2031
Delivered cost (USD/MMBtu) 6.84 9.37 12.62 16.68Plant Dispatch cost (INR/kWh) 3.32 4.50 6.00 7.89Gujarat 2018 2022 2026 2031
Delivered cost (USD/MMBtu) 6.28 8.80 12.05 16.11Plant Dispatch cost (INR/kWh) 3.06 4.23 5.74 7.63
Maharashtra 2018 2022 2026 2031
Delivered cost (USD/MMBtu) 6.24 8.77 12.02 16.08Plant Dispatch cost (INR/kWh) 3.05 4.22 5.73 7.61
Andhra Pradesh 2018 2022 2026 2031
Delivered cost (USD/MMBtu) 6.15 8.68 11.93 15.99Plant Dispatch cost (INR/kWh) 3.00 4.18 5.68 7.57
Plant Dispatch Cost represents “Total Variable cost of plant” only
59icfi.com |
India – IPM Modeling Results
60icfi.com |
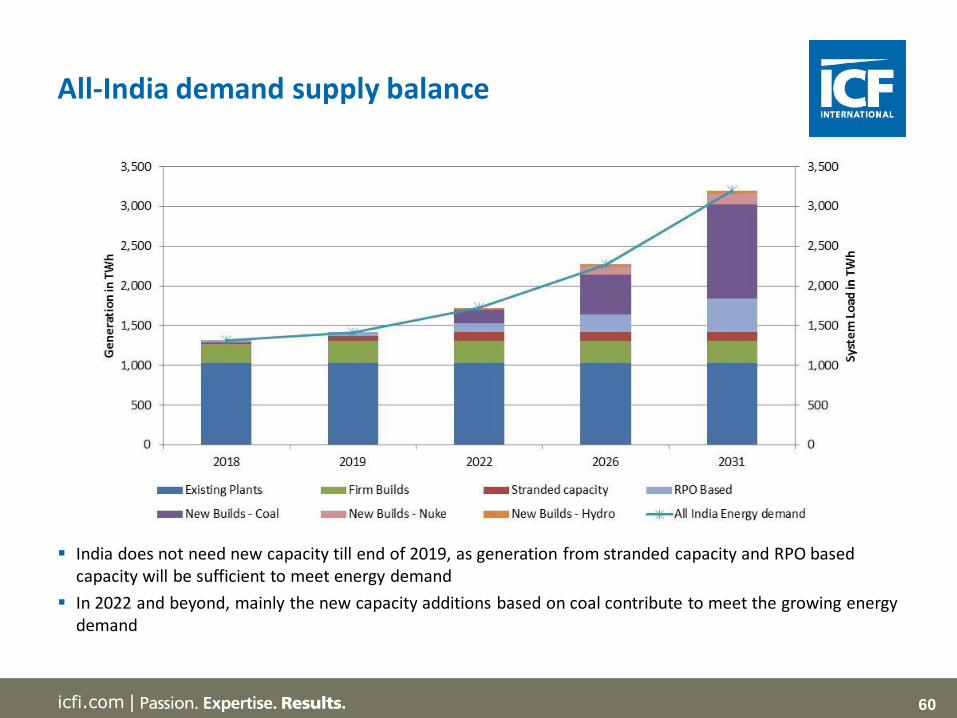
All-India demand supply balance
India does not need new capacity till end of 2019, as generation from stranded capacity and RPO based capacity will be sufficient to meet energy demand
In 2022 and beyond, mainly the new capacity additions based on coal contribute to meet the growing energy demand

61icfi.com |
Share of Imported coal based generation reaches ~36% in 2031
In long-term, generation from imported coal is expected to play an important role in meeting increasing demand of system
Of the total coal generation in the system, generation from imported coal contributes ~36% by 2031
Generation from RE sources (Wind, Solar, Small-Hydro and biomass) are primarily driven by RPO
62icfi.com |
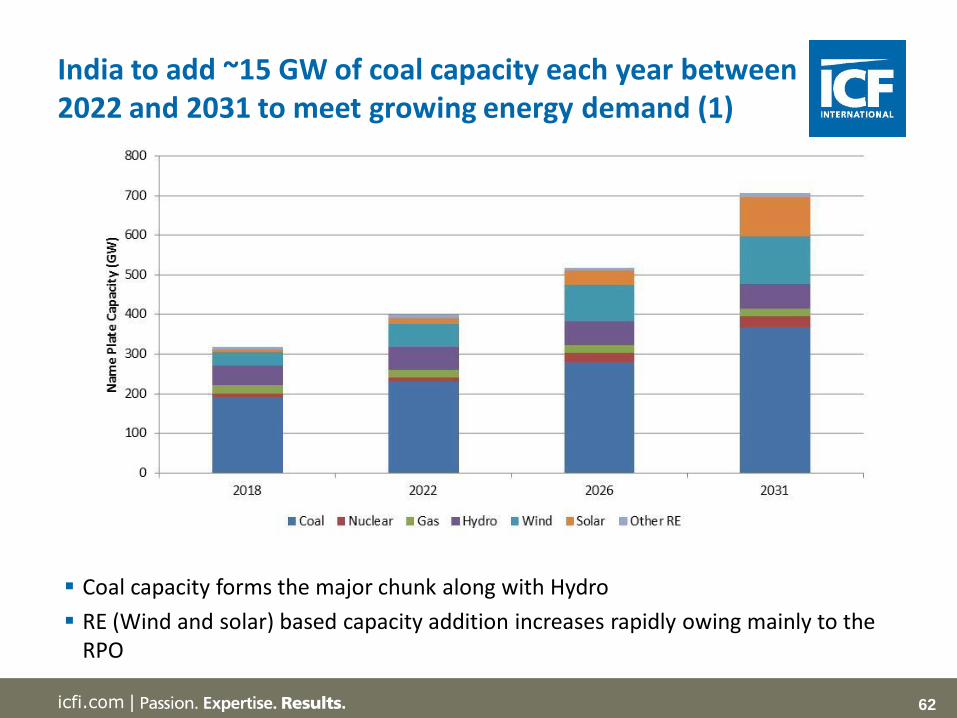
India to add ~15 GW of coal capacity each year between 2022 and 2031 to meet growing energy demand (1)
Coal capacity forms the major chunk along with Hydro
RE (Wind and solar) based capacity addition increases rapidly owing mainly to the RPO

63icfi.com |
India to add ~15 GW of coal capacity each year between 2022 and 2031 to meet growing energy demand (2)
India needs to add just 15 GW of coal capacity every year which should be fairly achievable given that India is already adding similar coal capacities every year
As such there may not be any capacity constraints going forward in the system as witnessed in 2007-2010 period
in GW 2018 2022 2026 2031
Coal 191 230 279 367
Nuclear 9.2 9.9 23 28
Gas 20 20 20 20
Hydro 50 57 60 62
Wind 34 58 91 119
Solar 6.5 16.5 37 100
Other RE 7.2 7.2 7.3 10
Total 318 399 518 706

64icfi.com |
Year 2022Capacity
FactorHeat Rate
Non-Fuel Variable cost
Fuel Cost
Total Variable cost
Fixed costTotal Fixed
costTotal Cost
(Variable &Fixed)
Units % Btu /kWh INR/ kWhINR/ kWh
INR/ kWh INR/ kW-yr INR/ kWh INR/ kWh
Existing Coal Plant -Domestic
80% 9,500 0.13 0.97 1.10 2800 0.40 1.50
New Coal Plant -Domestic
80% 9,200 0.13 0.94 1.07 8224 1.17 2.24
Existing Coal Plant -Imported
80% 9,500 0.13 2.78 2.91 2800 0.40 3.31
New Coal Plant -Imported
80% 9,200 0.13 2.69 2.82 8224 1.17 3.99
Existing Gas Plant -Domestic
40% 8,000 0.11 5.06 5.17 2550 0.73 5.90
New Gas Plant -Domestic
40% 7,500 0.11 4.75 4.86 7940 2.27 7.12
New Wind 25% 0 0.01 0.00 0.01 7651 3.49 3.50
New Solar 24% 0 0.01 0.00 0.01 8763 4.25 4.26
New Hydro - RoR 40% 0 0.01 0.00 0.01 13775 3.93 3.94
New Hydro - Storage 45% 0 0.01 0.00 0.01 16530 4.19 4.20
All in generation cost of new imported coal based plant to drive overall market prices
In 2022, the new coal based plant running on imported coal will be at margin with an all inclusive cost of generation of ~ Rs 4.0 per kWh
65icfi.com |
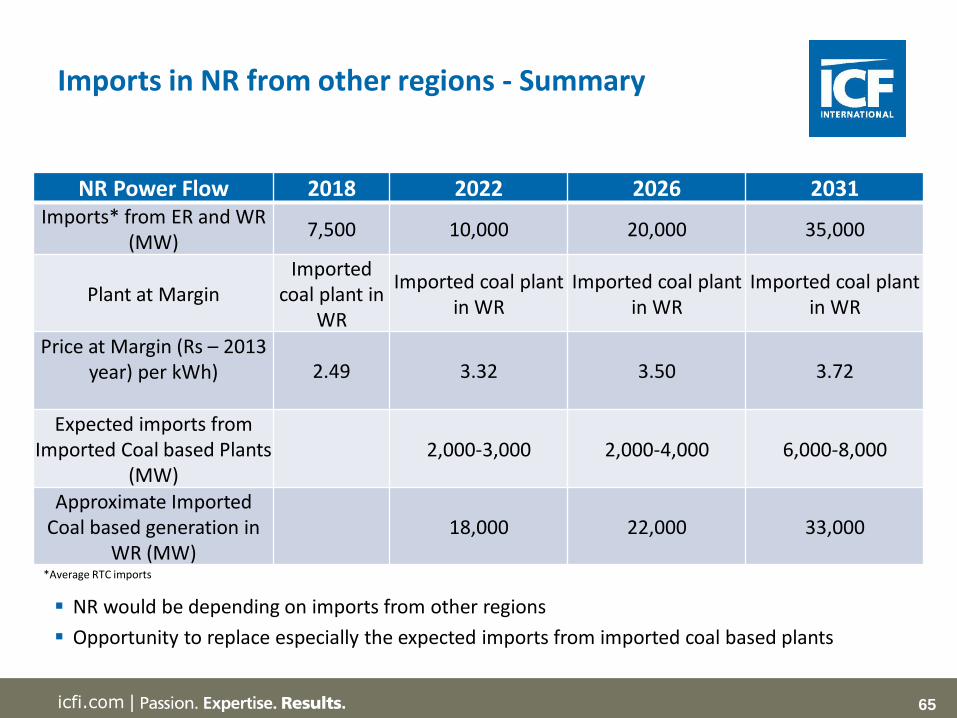
NR would be depending on imports from other regions
Opportunity to replace especially the expected imports from imported coal based plants
Imports in NR from other regions - Summary
NR Power Flow 2018 2022 2026 2031Imports* from ER and WR
(MW)7,500 10,000 20,000 35,000
Plant at MarginImported
coal plant in WR
Imported coal plant in WR
Imported coal plant in WR
Imported coal plant in WR
Price at Margin (Rs – 2013 year) per kWh) 2.49 3.32 3.50 3.72
Expected imports from Imported Coal based Plants
(MW)2,000-3,000 2,000-4,000 6,000-8,000
Approximate Imported Coal based generation in
WR (MW)18,000 22,000 33,000
*Average RTC imports

66icfi.com |
Northern Region is a major importer from the Eastern and Western region
The prices in NR will be in the range of INR 3.25-3.50 per KWh in year 2022 with the possibilityof additional benefit due to congestion charges in later years
Assumptions suggest that it is economical to generate at pithead and transmit electricity ratherthan transporting coal to the load centre. This indicates heavy reliance on timely constructionof transmission capacities – both planned and unplanned
• Development of transmission links is key
Imported Coal remains the marginal fuel and with large capacity additions, it removes anyseasonality caused by hydro supply
• Coal based capacity addition is unlikely to be a constraint
There is hardly any difference in the seasonal pricing due to (i) flattening load profile, and (ii)coal capacity additions based on imported coal
It appears unlikely that there will be any peaking power market in India in the near future
• Prices are unlikely to change unless the nature of the demand curve changes
Key Insights

67icfi.com |
In the short term, the Trading potential exists between India-Nepal, India-Bhutan and
India-Bangladesh based on the seasonality of demand. ICF is in the process of
collecting load profile data from all the countries which would form the basis for
calculating short term trading potential.
In the longer term, the setting up of new capacities can be avoided by the countries if
there is a potential of buying power from other countries. However this would be
subject to constraints on transmission, resource availability and the power prices in
each market.
ICF is in the process of populating the integrated resource model for South Asia region
using its proprietary IPM® model for calculating the actual trading potential.
Way Forward
68icfi.com |
ICF has developed the data sheet for capturing information and assumptions from each
country. ICF along with IRADe team is following up to capture this information
IPM® database has been already populated with Indian power sector database. The
data from each of remaining South Asian nations would be populated to make the Base
case
For the Base case, the IPM® run would be set up to calculate the year wise trading
potential between each the South Asian countries. In this case, no transmission
constraint is considered between any countries. In fact, the required cross border
transmission required would be the output of the model
For the Changed case, actual transmission would be built in the base model. New runs
would be subsequently executed.
Way Forward (cntd.)
69icfi.com |
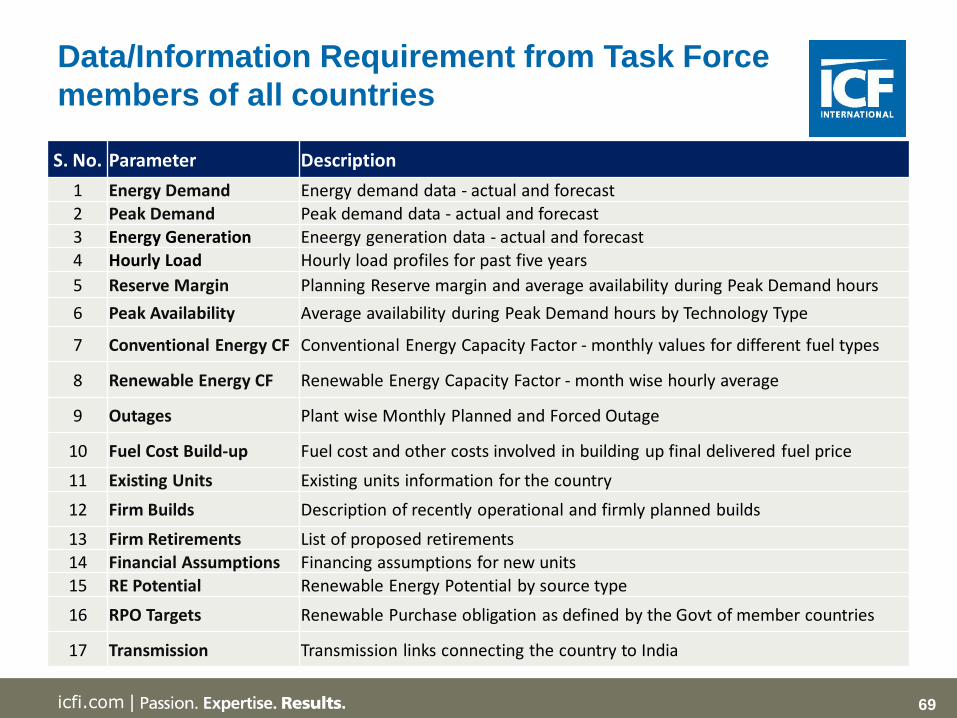
Data/Information Requirement from Task Force
members of all countries
S. No. Parameter Description
1 Energy Demand Energy demand data - actual and forecast
2 Peak Demand Peak demand data - actual and forecast
3 Energy Generation Eneergy generation data - actual and forecast
4 Hourly Load Hourly load profiles for past five years
5 Reserve Margin Planning Reserve margin and average availability during Peak Demand hours
6 Peak Availability Average availability during Peak Demand hours by Technology Type
7 Conventional Energy CF Conventional Energy Capacity Factor - monthly values for different fuel types
8 Renewable Energy CF Renewable Energy Capacity Factor - month wise hourly average
9 Outages Plant wise Monthly Planned and Forced Outage
10 Fuel Cost Build-up Fuel cost and other costs involved in building up final delivered fuel price
11 Existing Units Existing units information for the country
12 Firm Builds Description of recently operational and firmly planned builds
13 Firm Retirements List of proposed retirements
14 Financial Assumptions Financing assumptions for new units
15 RE Potential Renewable Energy Potential by source type
16 RPO Targets Renewable Purchase obligation as defined by the Govt of member countries
17 Transmission Transmission links connecting the country to India

70icfi.com |
Appendix
Electricity Shortages in India
Details on ICF’s Integrated Planning Model (IPM®)
Key outputs from IPMM®
Mathematical details on Modeling framework
71icfi.com |
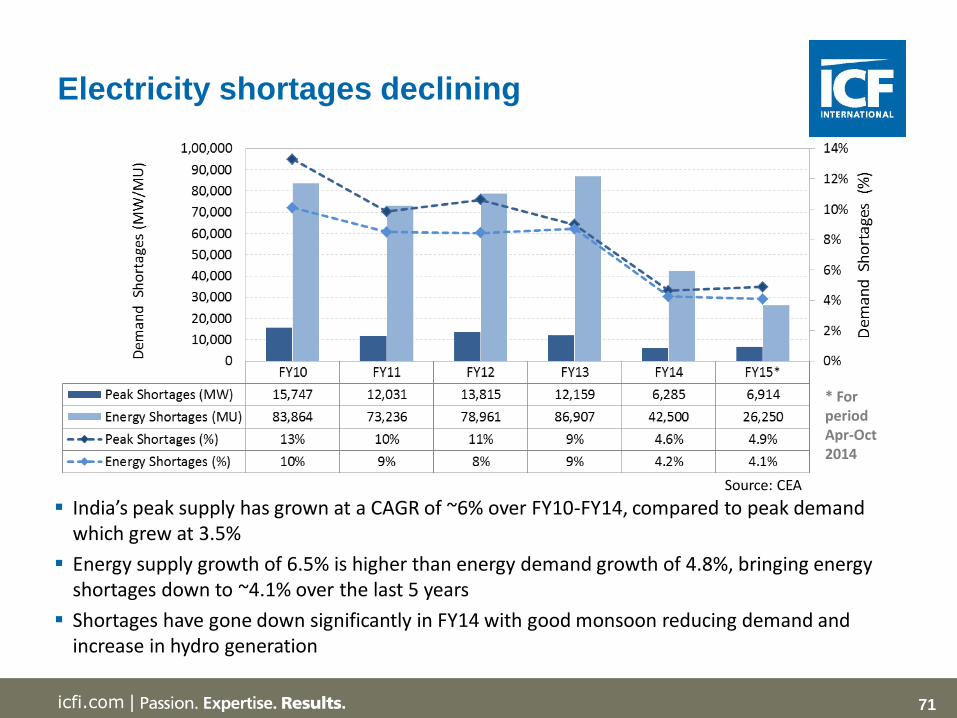
Electricity shortages declining
* For period Apr-Oct 2014
India’s peak supply has grown at a CAGR of ~6% over FY10-FY14, compared to peak demand which grew at 3.5%
Energy supply growth of 6.5% is higher than energy demand growth of 4.8%, bringing energy shortages down to ~4.1% over the last 5 years
Shortages have gone down significantly in FY14 with good monsoon reducing demand and increase in hydro generation
Source: CEA

72icfi.com |
Plant Load Factors Witnessed an Overall Decline
(Source: CEA)
All India PLF* FY13 FY14 FY15
April 75.24 69.97 69.38
May 74.45 71.55 68.15
June 72.24 63.4 68.01
July 66.96 60.86 64.87
August 61.58 55.94 60.83
September 61.41 64.65 60.86
October 71.04 61.85 65.93
November 71.02 65.44
December 72.41 69.05
January 74.33 69.82
February 70.67 68.44
March 71.96 66.58
Annual 70.28 65.63 65.35
* For Coal and Lignite Based Plants
Aggregate PLF for the gas based plants declined primarily due gas supply shortage
PLFs of coal based power plants declined due to
Accelerated capacity addition coupled with lower demand growth
lower coal availability for each MW in system
transmission constraints in W3 region which made dispatch of coal plants difficult
Despite the decline, generation overall increase in generation was enough to reduce shortages

73icfi.com |
Overall short term market is around 7% - 8% of the total supply
Share of bilaterally bought power has increased from ~2.6% to ~5.5% over the last few years
Share of exchange traded power has increased from ~0.4% to ~3% in the same period
Remaining energy has been met through long term PPAs and the UI balancing market
Depth of short term market (Bilateral and
Exchange Markets) is increasing
Share of Bilateral, Exchange and Long Term + UI in Energy Met
* FY15 Data till September 2014 Source: CERC
8% only
Back to India Electricity D-S

74icfi.com |
IPM® has evolved over 30 years of helping evaluate
complex energy, fuel and environmental markets
1970s: Started as Coal Electric Utility Model (CEUM) to support US Clean Air Act (CAA) regulations
1980s: Expanded to IPM® after complete power sector integrated to support US Environmental Protection Agency (EPA) in CAA rule making
1990s: Model used in building several utilities with integrated resource planning, including DSM
1990s: Model used to support EPA with CAA Amendments, cap-and-trade program for NOx, SOx and later mercury regulation; main modeling framework used by EPA in environmental planning for power sector
1990s: Used by US Federal Regulatory Electricity Commission for rule making
2000s: Widely used by states and regional agencies in power, environmental and renewable energy program development (e.g., western states renewable energy portfolio, regional haze, western climate initiative; midwest regional greenhouse gas initiative)
2000s: Widely used for power market forecasting, correctly used in forecast California power market crash and mid-west over build price crash
2000s: Widely used to support GHG analyses of power and non power sectors
2004: ICF launched the India Integrated Planning Model (I-IPM®); supported clients in evaluating Indian power sector fundamentals
75icfi.com |
Licensed by leading power companies for
power market analysis
MidAmerican Energy
Pacificorp
Exelon
Nyserda
International Power
BP
Polish Power and Generation Company

76icfi.com |76
ICF India Engagements in Asia-Pacific and
international fuel market
India:
• Power Market Study
• Power Sale Strategy
• Renewable market study and
analysis
• Technical Due Diligence for Coal Plant
• Asset Valuation
• Coal Mine Valuation
• Transmission & Evacuation
Strategy
• Gas Market Analysis
• Natural Gas Grid Design
Sri Lanka
• Power & Gas Market Assessment
Nepal:
• Transmission & Evacuation
Strategy
China:
• Power Market Analysis
Singapore:
• Asset Valuation
• Power Market Analysis
Vietnam:
• Power & Gas Market Analysis
South Korea:
• Power Market Analysis
• GHG Mitigation Strategy
Australia:
• Power Sale Strategies for Wind
• REC Price forecast and sales
strategy
• Carbon Price Forecast
• Asset Valuation
• Power Market Analysis
Bangladesh:
• Energy Efficiency and
Management
Philippines:
• Asset Valuation
• Power Market Analysis
Indonesia:
• Power Market Analysis
• Marginal Abatement Cost Curves
(MACC) for Power Sector
Japan:
• Power Market Analysis
ICF has helped support over $40 billion of power plant financing around the world

77icfi.com |
Model Components
Optimization/Simulation ENGINE
Data Base
Other Tools and
Data Bases
Transmission Flow Model
Demand Forecasting
Tool
Analyst 1
Output –Excel and text files
Analyst 2
Graphical Interface Front
End
78icfi.com |
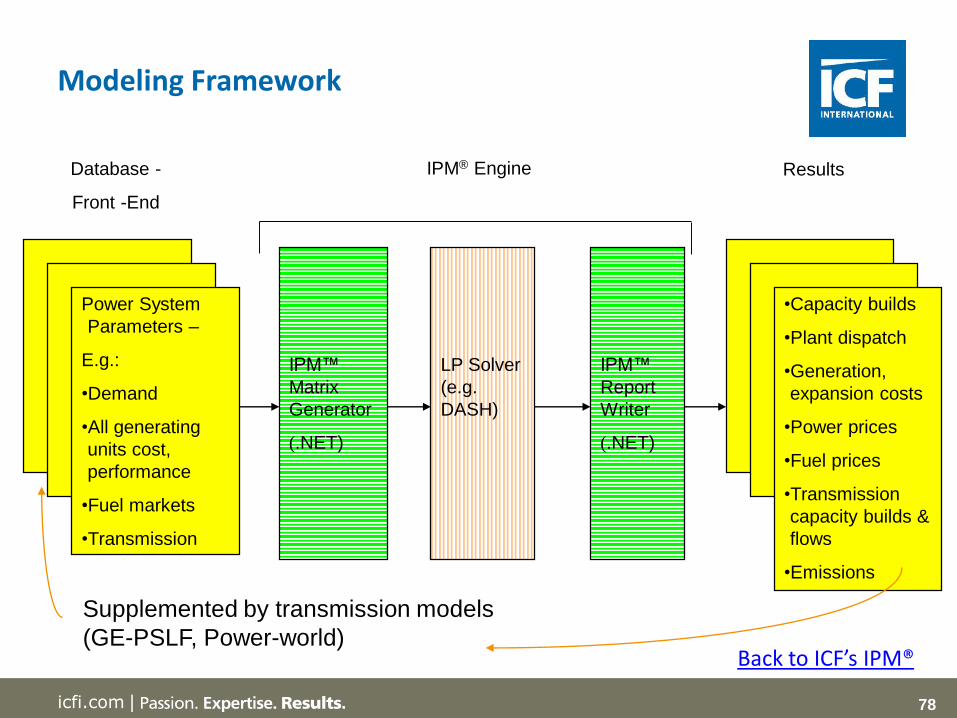
Modeling Framework
Power System
Parameters –
E.g.:
•Demand
•All generating
units cost,
performance
•Fuel markets
•Transmission
Database -
Front -End
IPM™
Matrix
Generator
(.NET)
LP Solver
(e.g.
DASH)
IPM™
Report
Writer
(.NET)
IPM® Engine
•Capacity builds
•Plant dispatch
•Generation,
expansion costs
•Power prices
•Fuel prices
•Transmission
capacity builds &
flows
•Emissions
Results
Supplemented by transmission models
(GE-PSLF, Power-world)Back to ICF’s IPM®

79icfi.com |
Power Price forecast reflects operational considerations, system dynamics and market fundamentals
Prices based on marginal cost with merit order dispatch
Simultaneously available for all states regions and at regional and national level
Available for all hours and years of the planning horizon
Plant specific generation costs can be used to derive “cost plus” regulated price
Segmental prices mapped to chronological hourly prices
0.0
2.0
4.0
6.0
8.0
10.0
12.0
2009 2010 2011 2012 2013 2014 2015 2016 2017 2018 2019 2020P
ow
er
Pri
ces
(No
min
al R
s./k
Wh
)
Round The Clock Peak Prices Off-Peak Price
0.0
2.0
4.0
6.0
8.0
10.0
12.0
2009 2010 2011 2012 2013 2014 2015 2016 2017 2018 2019 2020
Pow
er P
rice
s (N
omin
al R
s./k
Wh)
Round The Clock Peak Prices Off-Peak Price
Illustrative wholesale forward power price curves – National Level
0.0
1.0
2.0
3.0
4.0
5.0
6.0
7.0
8.0
-
5,000
10,000
15,000
20,000
25,000
1 201 401 601 801 1001 1201 1401 1601 1801 2001
Pri
ce (R
s./k
Wh
)
Load
(MW
)
Hour
Illustrative Load Duration and Price Duration Curve for Winter –Maharashtra (2013)
Detailed power price forecast

80icfi.com |
Detailed results on dispatch, merit order and marginal prices
0
1
2
3
4
5
6
7
8
0 50 100 150 200 250
Dis
pa
tch
Co
st (R
s./k
Wh
)
Cumulative Capacity (GW)
System - 2010
CC
Potential Build CC-F
CT
Potential Build CT-LM
Potential Build Hydro
Hydro
PS
Potential Build Diesel
Oil
Potential Build Nuclear
Nuclear
Potential Build Small Hydro
Small Hydro
Potential Build Wind
Wind
Retierment
Potential Build Biomass
Biomass
Potential Build Coal
Coal
Retrofit Coal0
1
2
3
4
5
6
7
8
9
0 50 100 150 200 250 300
Dis
pa
tch
Co
st (R
s./k
Wh
)
Cumulative Capacity (GW)
System - 2015
CC
Potential Build CC-F
CT
Potential Build CT-LM
Potential Build Hydro
Hydro
PS
Potential Build Diesel
Oil
Potential Build Nuclear
Nuclear
Potential Build Small Hydro
Small Hydro
Potential Build Wind
Wind
Retierment
Potential Build Biomass
Biomass
Potential Build Coal
Coal
Retrofit Coal
All India Dispatch Stack - Illustrative for Year 2010 All India Dispatch Stack - Illustrative for Year 2015
Oil
CC & CT
Coal
Hydro, Renewables and Nuclear
Oil
CC & CT
Coal
Hydro, Renewables and Nuclear
Shortages,Shortages,

81icfi.com |
Transmission flows and Energy transfers available
for all lines and years of planning horizon
Forecast based on I-IPM®. India Wholesale Power Outlook 2005
82icfi.com |
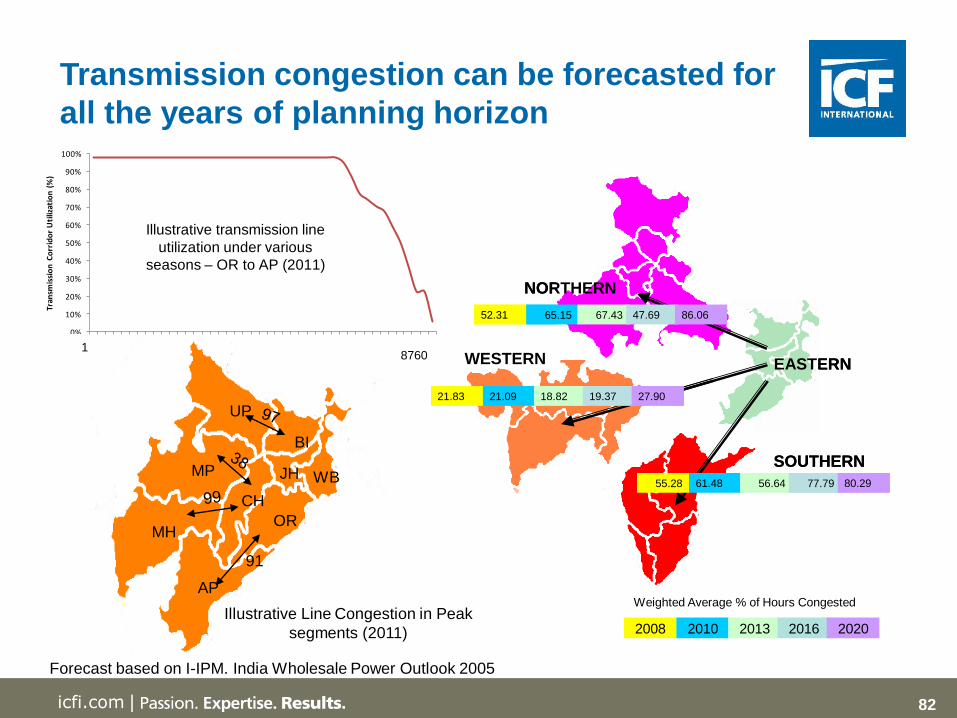
Transmission congestion can be forecasted for
all the years of planning horizon
1
8760
Hours
BI
WB
OR
AP
MH
MP
CH
UP
JH
91
Illustrative Line Congestion in Peak
segments (2011)
Illustrative transmission line
utilization under various
seasons – OR to AP (2011)
0%
10%
20%
30%
40%
50%
60%
70%
80%
90%
100%
1 3 5 7 9 11 13 15 17 19 21 23 25 27 29 31 33 35 37 39 41 43
Tran
smis
sio
n C
orr
ido
r U
tiliz
atio
n (
%)
Forecast based on I-IPM. India Wholesale Power Outlook 2005
1
2008 2010 2013 2016 2020
Weighted Average % of Hours Congested
WESTERN EASTERN
SOUTHERN
NORTHERN
55.28 61.48 56.64 77.79 80.29
21.83 21.09 18.82 19.37 27.90
52.31 65.15 67.43 47.69 86.06
WESTERN EASTERN
SOUTHERN
NORTHERN
55.28 61.48 56.64 77.79 80.2955.28 61.48 56.64 77.79 80.29
21.83 21.09 18.82 19.37 27.9021.83 21.09 18.82 19.37 27.90
52.31 65.15 67.43 47.69 86.0652.31 65.15 67.43 47.69 86.06
83icfi.com |
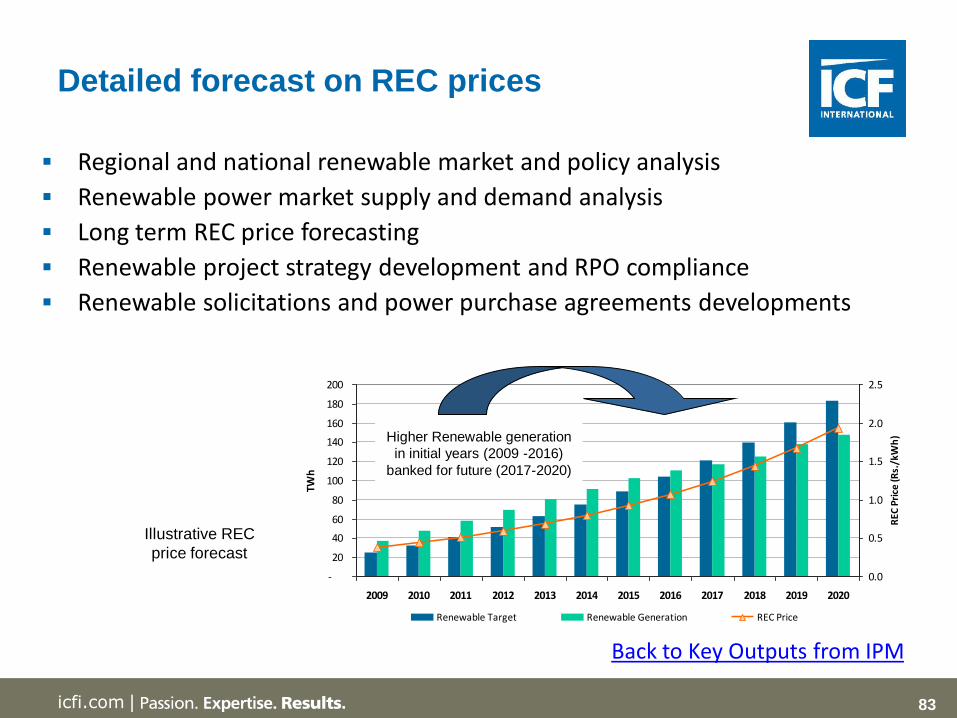
Detailed forecast on REC prices
-
20
40
60
80
100
120
140
160
180
200
2009 2010 2011 2012 2013 2014 2015 2016 2017 2018 2019 2020
TWh
0.0
0.5
1.0
1.5
2.0
2.5
REC
Pri
ce (R
s./k
Wh
)
Renewable Target Renewable Generation REC Price
Illustrative REC
price forecast
Regional and national renewable market and policy analysis
Renewable power market supply and demand analysis
Long term REC price forecasting
Renewable project strategy development and RPO compliance
Renewable solicitations and power purchase agreements developments
Higher Renewable generation
in initial years (2009 -2016)
banked for future (2017-2020)
Back to Key Outputs from IPM
84icfi.com |
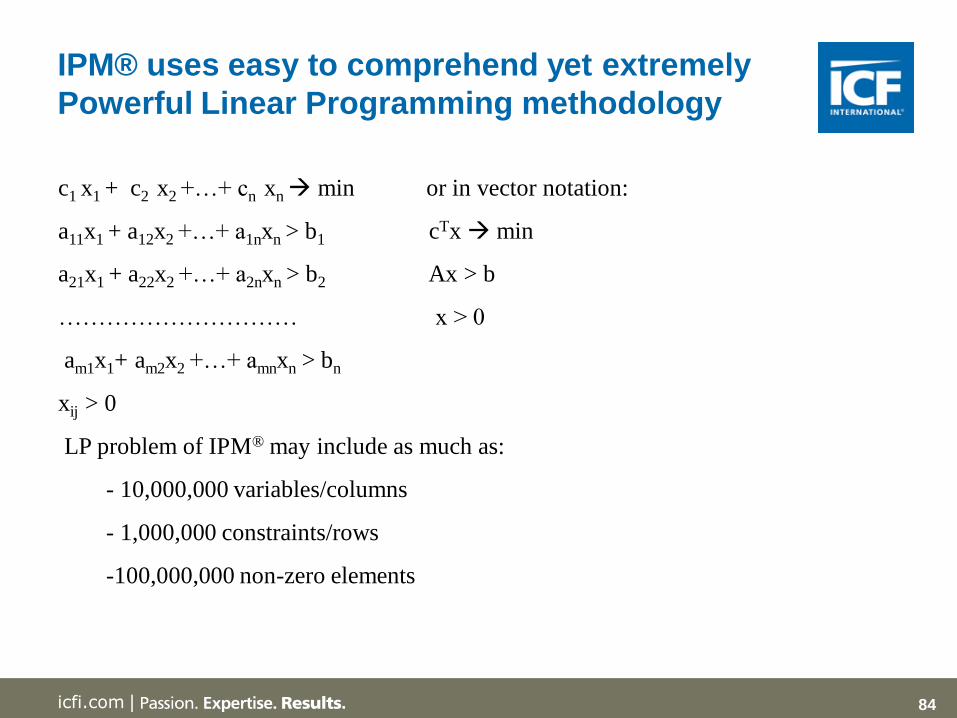
IPM® uses easy to comprehend yet extremely
Powerful Linear Programming methodology
c1 x1 + c2 x2 +…+ cn xn min or in vector notation:
a11x1 + a12x2 +…+ a1nxn > b1 cTx min
a21x1 + a22x2 +…+ a2nxn > b2 Ax > b
………………………… x > 0
am1x1+ am2x2 +…+ amnxn > bn
xij > 0
LP problem of IPM® may include as much as:
- 10,000,000 variables/columns
- 1,000,000 constraints/rows
-100,000,000 non-zero elements
85icfi.com |
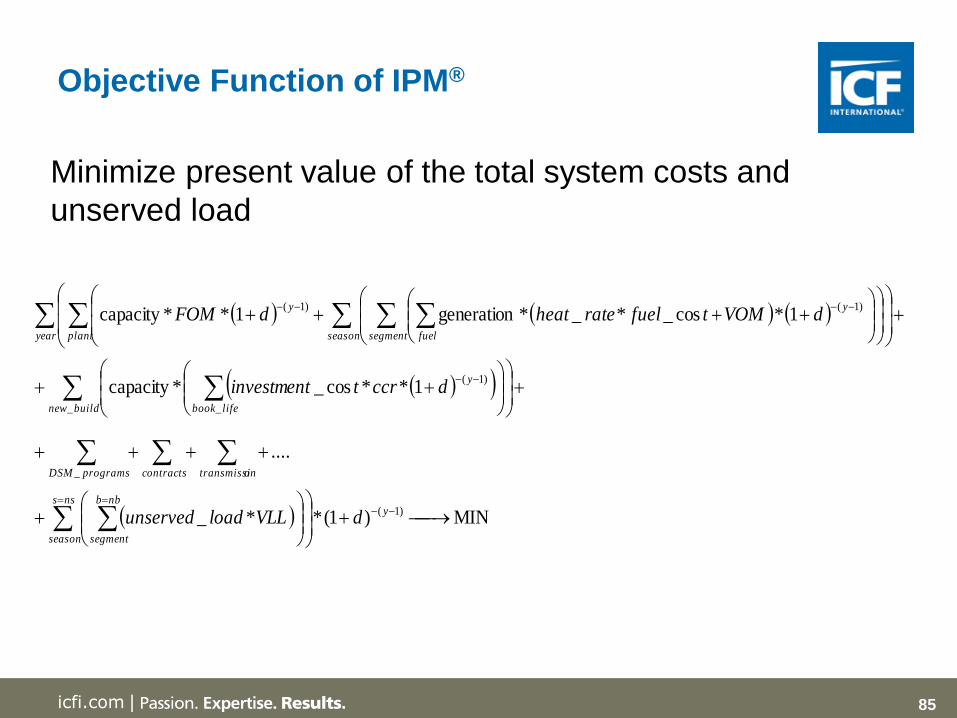
Objective Function of IPM®
MIN )1(**_
....
1**cos_*capacity
1*cos_*_*generation1**capacity
)1(
_
_ _
)1(
)1()1(
ynss
season
nbb
segment
ontransmissicontractsprogramsDSM
buildnew lifebook
y
year plant season segment fuel
yy
dVLLloadunserved
dccrtinvestment
dVOMtfuelrateheatdFOM
Minimize present value of the total system costs and
unserved load
86icfi.com |
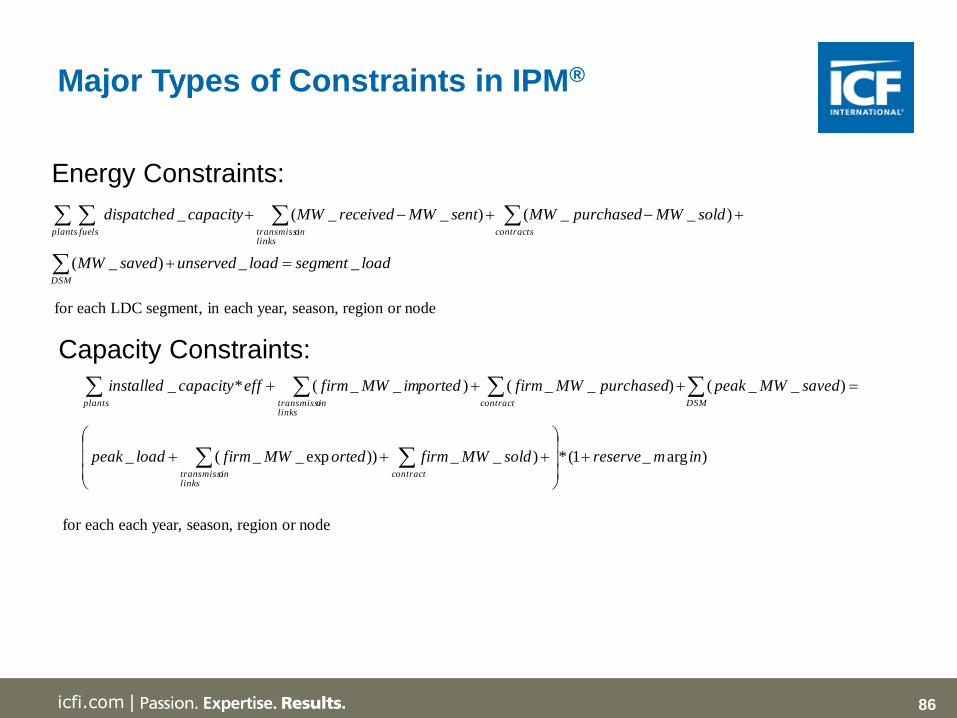
Major Types of Constraints in IPM®
Energy Constraints:
DSM
contractsplantslinks
ontransmissifuels
loadsegmentloadunservedsavedMW
soldMWpurchasedMWsentMWreceivedMWcapacitydispatched
__)_(
)__()__(_
for each LDC segment, in each year, season, region or node
Capacity Constraints:
)arg_1(*)__))exp__(_
)__()__()__(*_
inmreservesoldMWfirmortedMWfirmloadpeak
savedMWpeakpurchasedMWfirmimportedMWfirmeffcapacityinstalled
contractlinks
ontransmissi
DSMcontractplantslinks
ontransmissi
for each each year, season, region or node
87icfi.com |
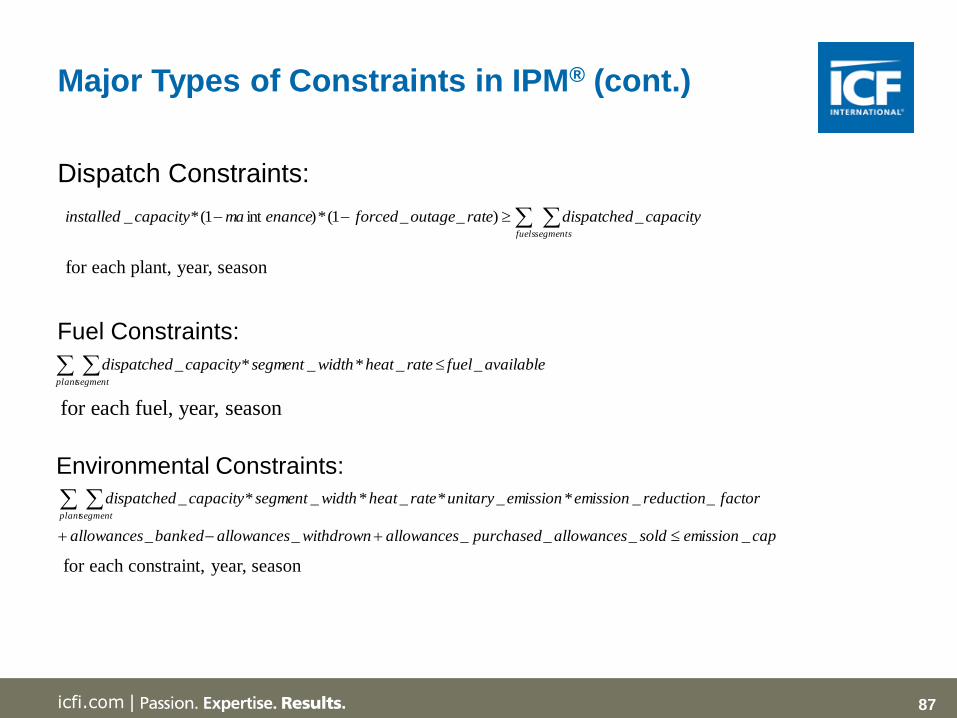
Major Types of Constraints in IPM® (cont.)
Fuel Constraints:
availablefuelrateheatwidthsegmentcapacitydispatchedplantsegment
__*_*_
for each fuel, year, season
Environmental Constraints:
for each constraint, year, season
capemissionsoldallowancespurchasedallowanceswithdrownallowancesbankedallowances
factorreductionemissionemissionunitaryrateheatwidthsegmentcapacitydispatchedplantsegment
______
__*_*_*_*_
Dispatch Constraints:
fuelssegments
capacitydispatchedrateoutageforcedenancemacapacityinstalled _)__1(*)int1(*_
for each plant, year, season
88icfi.com |
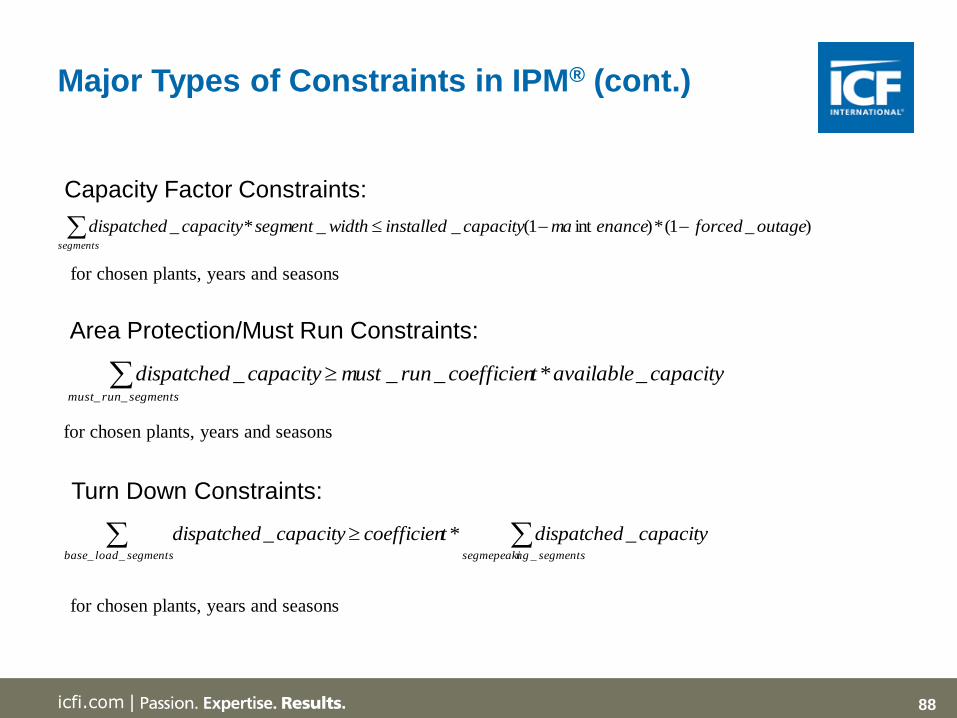
Major Types of Constraints in IPM® (cont.)
Capacity Factor Constraints:
segments
outageforcedenancemacapacityinstalledwidthsegmentcapacitydispatched )_1(*)int1(__*_
for chosen plants, years and seasons
Area Protection/Must Run Constraints:
segmentsrunmust
capacityavailabletcoefficienrunmustcapacitydispatched__
_*___
for chosen plants, years and seasons
Turn Down Constraints:
segmentsloadbase segmentsngsegmepeaki
capacitydispatchedtcoefficiencapacitydispatched__ _
_*_
for chosen plants, years and seasons

89icfi.com |
Cost Coefficients in Objective Function
Variable cost coefficients – assigned to dispatch operates
1))(1(
1*
)),(),(cos_(*),,s,(
),,,(
year
mappedyears yeardiscseasonfueladderyearfueltfuelyearseasonegmentplantHR
yearseasonsegmentplantVOM
horizontime
yearyeardiscyearplantCCRyearplanttCapitalyearplantFOM
1))(1(
1*),(*),(cos_),(
Fixed cost coefficients – assigned to capacity vectors
),(_),(11
),(),(
yearplantlifebook)yearplantr(
yearplantryearplantCCR
where:
Back to Modeling Framework

90icfi.com |


![Leszek Orzechowski - architectus.arch.pwr.wroc.pl · Kardashev [1] while creating the scale of a civilisation’s technological advancement based on the amount of ener gy used. The](https://static.fdocument.pub/doc/165x107/5fc58f5bba184a381b18f4ba/leszek-orzechowski-kardashev-1-while-creating-the-scale-of-a-civilisationas.jpg)