3G Technical Evolution as an evolving broadband … Technical Evolution as an evolving broadband...
27
International Telecommunication Union Yogyakarta, Indonesia, 27-29 July 2009 3G Technical Evolution as an evolving broadband solution Dr Patrick Tsie Senior Director – Technical Marketing Qualcomm International Inc ITU-D Regional Development Forum for the Asia Pacific Region “NGN and Broadband, Opportunities and Challenges” Yogyakarta, Indonesia, 27 – 29 July 2009
Transcript of 3G Technical Evolution as an evolving broadband … Technical Evolution as an evolving broadband...
InternationalTelecommunicationUnionYogyakarta, Indonesia, 27-29 July 2009
3G Technical Evolution as an evolving broadband solution
Dr Patrick Tsie
Senior Director – Technical Marketing
Qualcomm International Inc
ITU-D Regional Development Forum for the Asia Pacific Region
“NGN and Broadband, Opportunities and Challenges” Yogyakarta, Indonesia, 27 – 29 July 2009
2
Agenda
3G Market Situation
3GPP & 3GPP2 Technology Evolutional Roadmap
LTE
What’s Next?
3
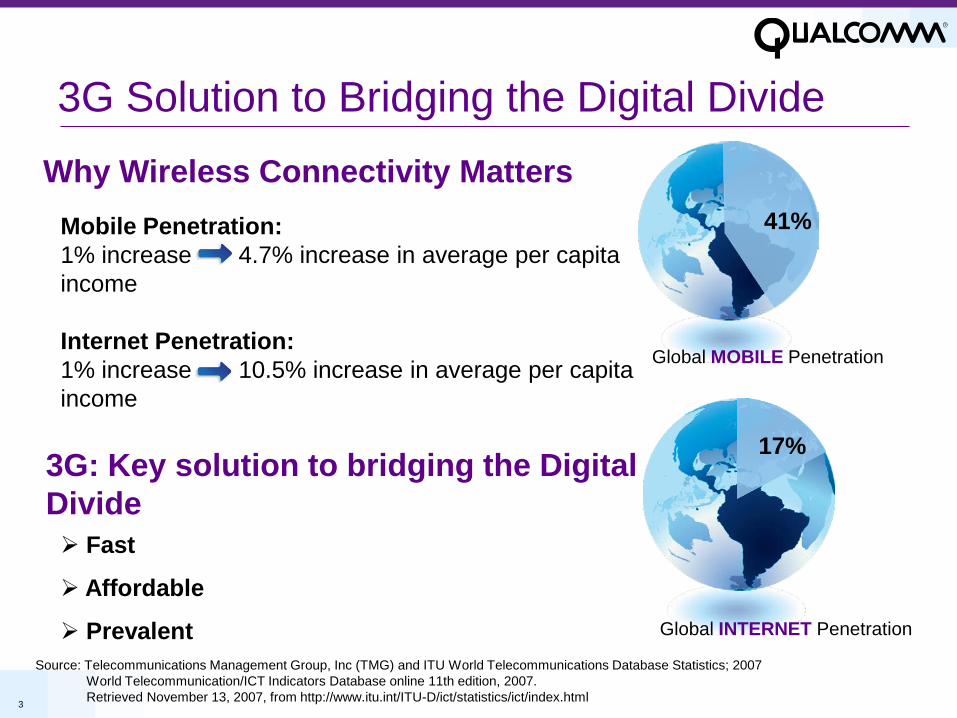
Mobile Penetration:1% increase 4.7% increase in average per capita income
Internet Penetration:1% increase 10.5% increase in average per capita income
Fast
Affordable
Prevalent
Why Wireless Connectivity Matters
3G Solution to Bridging the Digital Divide
3G: Key solution to bridging the Digital Divide
Source: Telecommunications Management Group, Inc (TMG) and ITU World Telecommunications Database Statistics; 2007World Telecommunication/ICT Indicators Database online 11th edition, 2007. Retrieved November 13, 2007, from http://www.itu.int/ITU-D/ict/statistics/ict/index.html
41%
Global MOBILE Penetration
41%
15.7%17.4%
Global INTERNET Penetration
17%
4Source: Wireless Intelligence estimates as of April 24, 2009)
CDG as of March 2009 & GSA as of April 2009)
3G
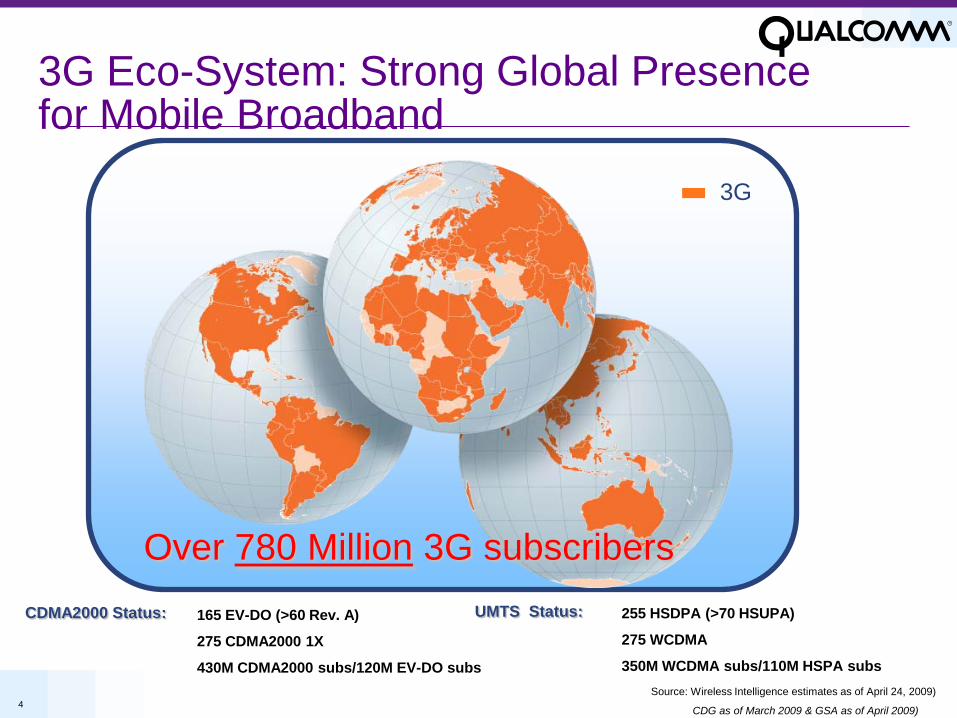
3G Eco-System: Strong Global Presence for Mobile Broadband
CDMA2000 Status: 165 EV-DO (>60 Rev. A)
275 CDMA2000 1X
430M CDMA2000 subs/120M EV-DO subs
255 HSDPA (>70 HSUPA)
275 WCDMA
350M WCDMA subs/110M HSPA subs
Over 780 Million 3G subscribersUMTS Status:
5
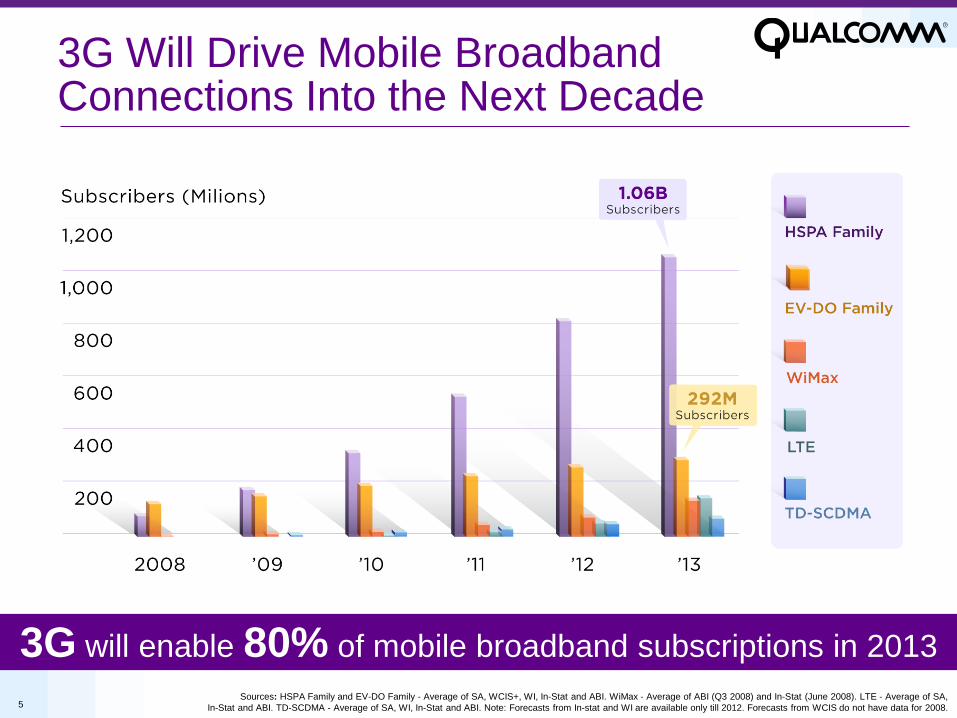
3G Will Drive Mobile Broadband Connections Into the Next Decade
Sources: HSPA Family and EV-DO Family - Average of SA, WCIS+, WI, In-Stat and ABI. WiMax - Average of ABI (Q3 2008) and In-Stat (June 2008). LTE - Average of SA, In-Stat and ABI. TD-SCDMA - Average of SA, WI, In-Stat and ABI. Note: Forecasts from In-stat and WI are available only till 2012. Forecasts from WCIS do not have data for 2008.
3G will enable 80% of mobile broadband subscriptions in 2013

6
Cloud Computing3GPP2 Technology
Evolutional Roadmap
6
7
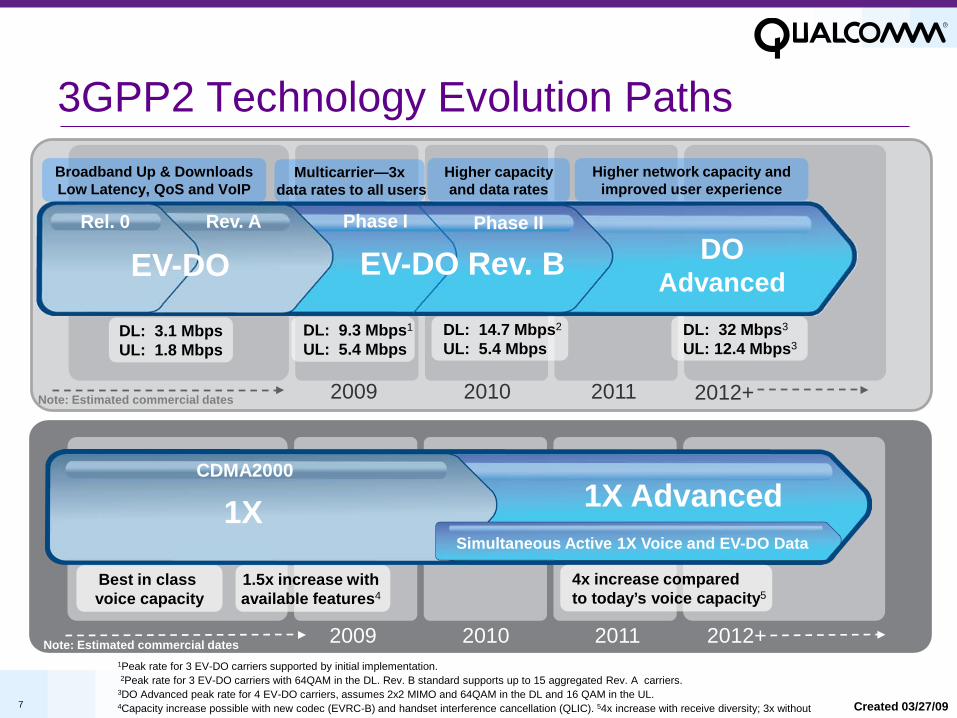
3GPP2 Technology Evolution Paths
Created 03/27/09
1Peak rate for 3 EV-DO carriers supported by initial implementation.2Peak rate for 3 EV-DO carriers with 64QAM in the DL. Rev. B standard supports up to 15 aggregated Rev. A carriers.
3DO Advanced peak rate for 4 EV-DO carriers, assumes 2x2 MIMO and 64QAM in the DL and 16 QAM in the UL.4Capacity increase possible with new codec (EVRC-B) and handset interference cancellation (QLIC). 54x increase with receive diversity; 3x without
DL: 3.1 MbpsUL: 1.8 Mbps
DL: 9.3 Mbps1
UL: 5.4 MbpsDL: 14.7 Mbps2
UL: 5.4 Mbps
Broadband Up & Downloads Low Latency, QoS and VoIP
DL: 32 Mbps3
UL: 12.4 Mbps3
Higher network capacity and improved user experience
Multicarrier—3xdata rates to all users
EV-DO DOAdvanced
Phase IIPhase I
2010 20112009 2012+
Higher capacity and data rates
EV-DO Rev. BRel. 0 Rev. A
Note: Estimated commercial dates
4x increase compared to today’s voice capacity5
Best in class voice capacity
1XCDMA2000
1X Advanced
1.5x increase with available features4
2010 20112009 2012+Note: Estimated commercial dates
Simultaneous Active 1X Voice and EV-DO Data
8
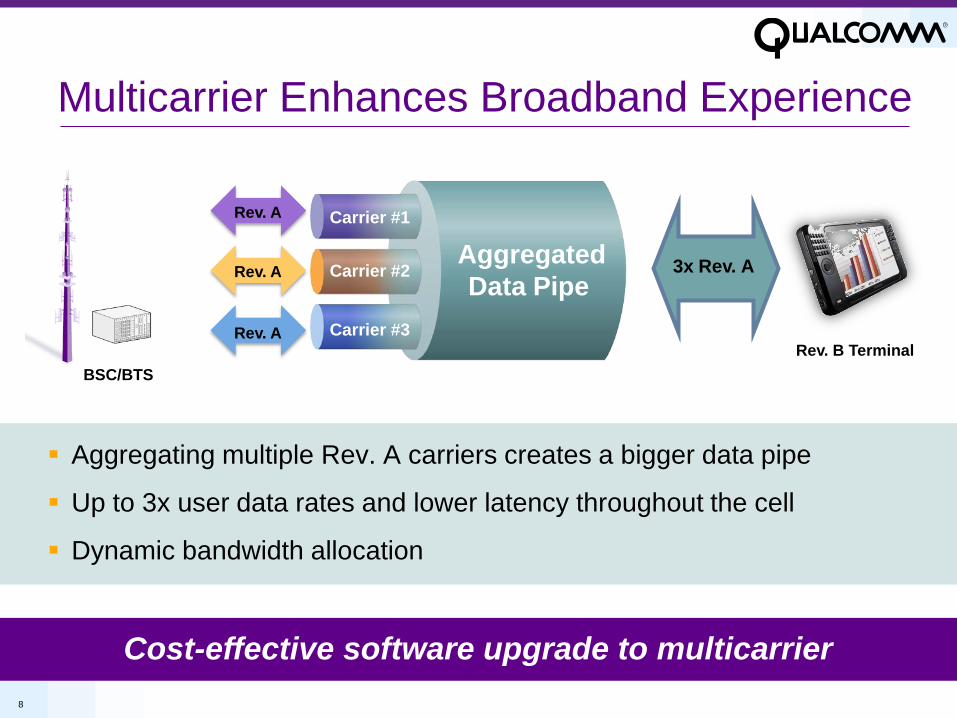
Cost-effective Software Only Upgrade To Multicarrier
Multicarrier Enhances Broadband Experience
Aggregating multiple Rev. A carriers creates a bigger data pipe
Up to 3x user data rates and lower latency throughout the cell
Dynamic bandwidth allocation
Rev. A
Rev. B Terminal
Rev. A
Rev. A
Carrier #1
Carrier #2
Carrier #3
Aggregated Data Pipe
BSC/BTS
3x Rev. A
Cost-effective software upgrade to multicarrier
9
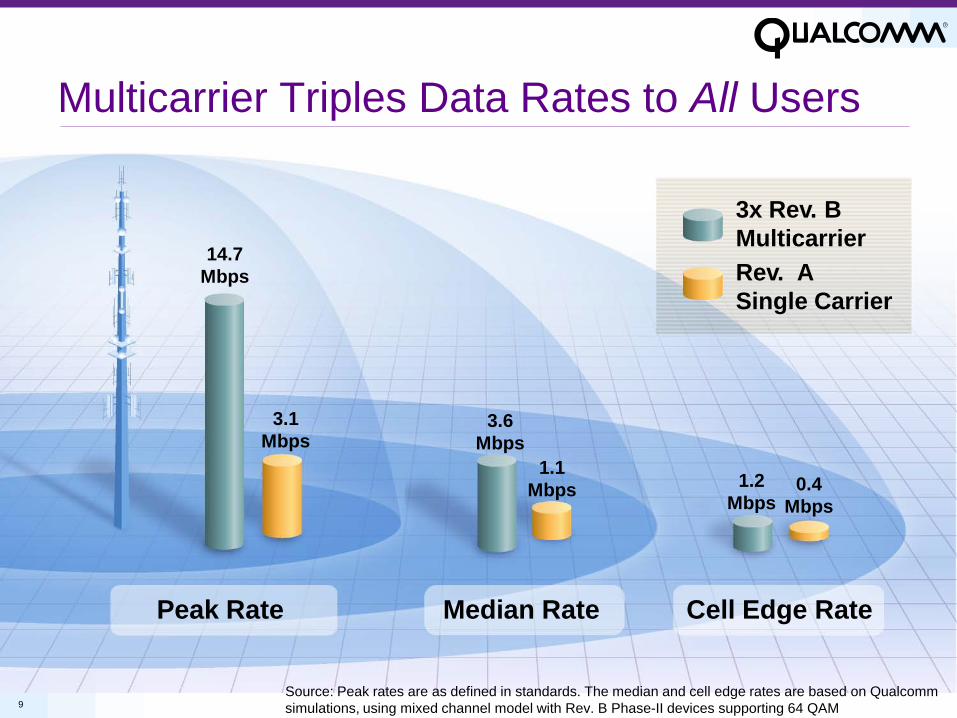
Multicarrier Triples Data Rates to All Users
3x Rev. B MulticarrierRev. ASingle Carrier
Peak Rate Median Rate Cell Edge Rate
14.7 Mbps
3.1 Mbps
3.6Mbps
1.1Mbps 1.2
Mbps0.4
Mbps
Source: Peak rates are as defined in standards. The median and cell edge rates are based on Qualcomm simulations, using mixed channel model with Rev. B Phase-II devices supporting 64 QAM

10
Cloud Computing3GPP Technology
Evolutional Roadmap
10
11
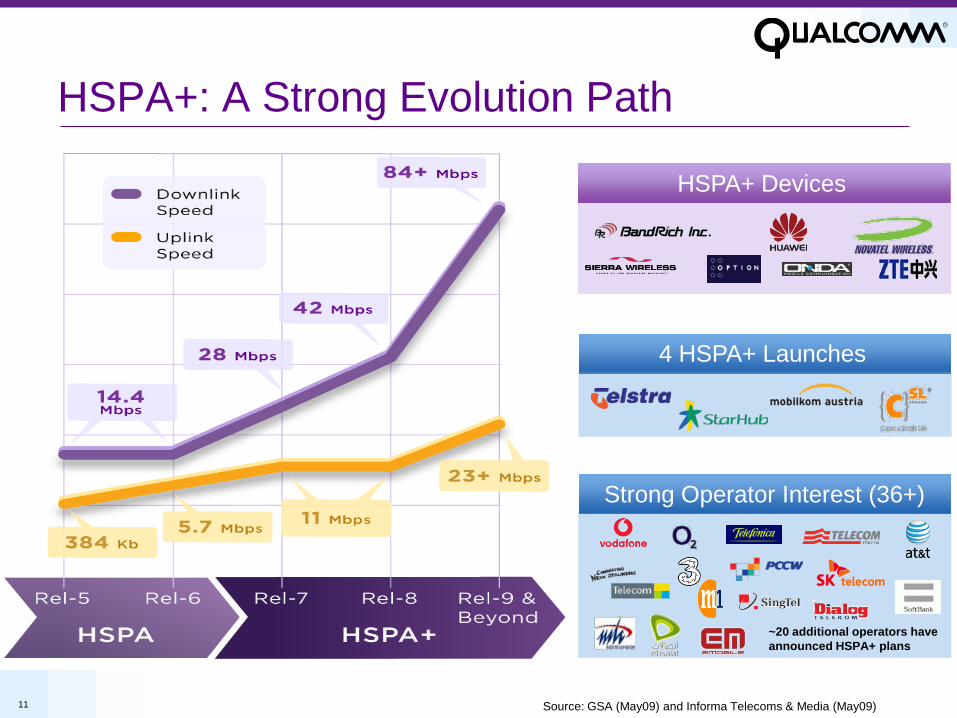
HSPA+: A Strong Evolution Path
HSPA+ Devices
4 HSPA+ Launches
Strong Operator Interest (36+)
~20 additional operators have announced HSPA+ plans
Source: GSA (May09) and Informa Telecoms & Media (May09)

12
HSPA+ R7 Doubles HSPA Data Capacity
Downlink Uplink
HSPA
HSPA+
HSPA
HSPA+
R6(RxDiv+ Rake)
R7(EQ.+ 2x2 MIMO)
R6 (Rake+1x2 SIMO)
R7 (IC+1x2 SIMO)
Data Capacity Per Sector (5 MHz)
1x(3.5 Mbps)
1.8x(6.2 Mbps) 1.7x
(3.7 Mbps)
1x(2.2 Mbps)
1 Source: Qualcomm Simulation, details in 3GPP R1-070674. NGMN D1 500m ISD. 16QAM not considered for the UL and UE IC not considered for the DL. HSPA+ multicarrier and DL Interference Cancellation would further increase the capacity.
When also leveraging advanced receivers(Handset Equalizer & Node B Interference cancellation)
13
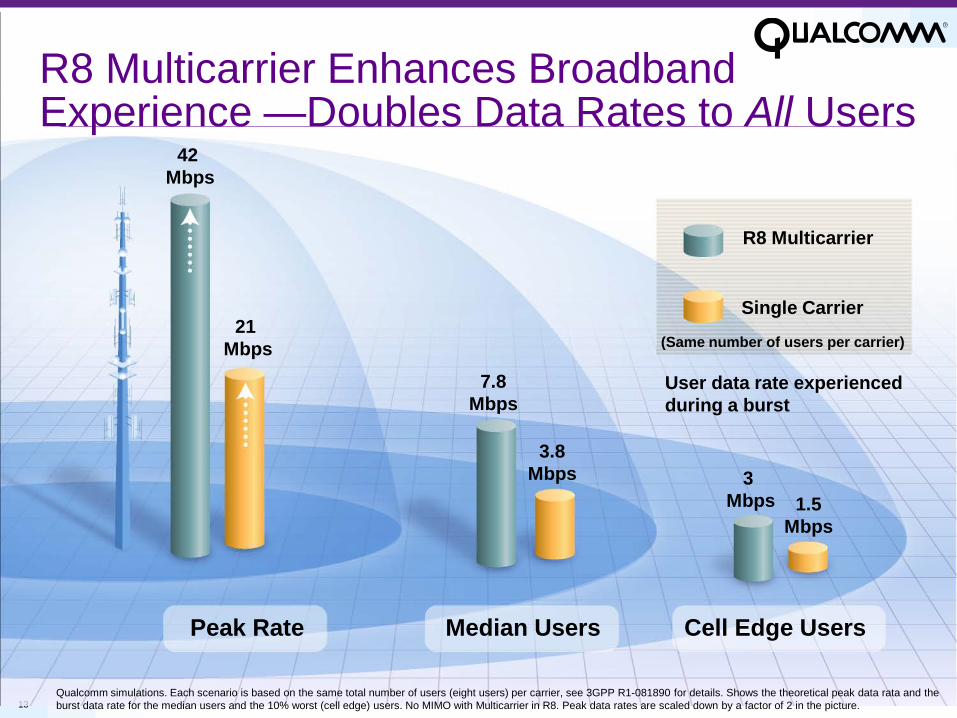
R8 Multicarrier Enhances Broadband Experience —Doubles Data Rates to All Users
Peak Rate Median Users Cell Edge Users
42 Mbps
21 Mbps
7.8Mbps
3.8Mbps 3
Mbps 1.5Mbps
Single Carrier
R8 Multicarrier
(Same number of users per carrier)
User data rate experienced during a burst
Qualcomm simulations. Each scenario is based on the same total number of users (eight users) per carrier, see 3GPP R1-081890 for details. Shows the theoretical peak data rata and the burst data rate for the median users and the 10% worst (cell edge) users. No MIMO with Multicarrier in R8. Peak data rates are scaled down by a factor of 2 in the picture.
14
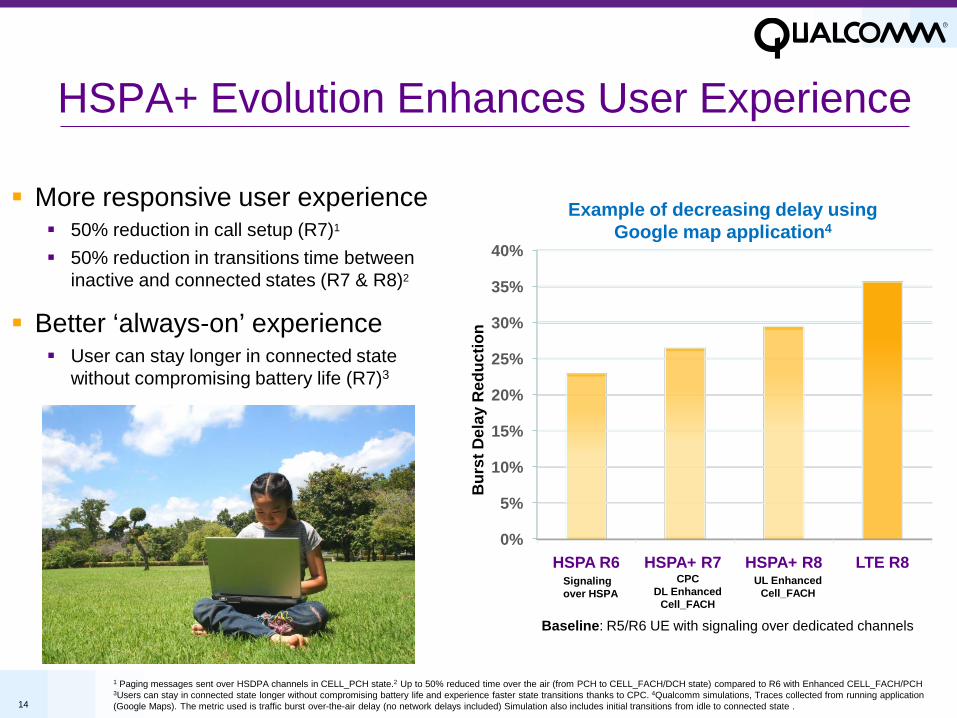
HSPA+ Evolution Enhances User Experience
1 Paging messages sent over HSDPA channels in CELL_PCH state.2 Up to 50% reduced time over the air (from PCH to CELL_FACH/DCH state) compared to R6 with Enhanced CELL_FACH/PCH 3Users can stay in connected state longer without compromising battery life and experience faster state transitions thanks to CPC. 4Qualcomm simulations, Traces collected from running application (Google Maps). The metric used is traffic burst over-the-air delay (no network delays included) Simulation also includes initial transitions from idle to connected state .
More responsive user experience 50% reduction in call setup (R7)1
50% reduction in transitions time between inactive and connected states (R7 & R8)2
Better ‘always-on’ experience User can stay longer in connected state
without compromising battery life (R7)3
Example of decreasing delay using Google map application4
Signaling over HSPA
CPCDL Enhanced
Cell_FACH
UL Enhanced Cell_FACH
Baseline: R5/R6 UE with signaling over dedicated channels
0%
5%
10%
15%
20%
25%
30%
35%
40%
HSPA R6 HSPA+ R7 HSPA+ R8 LTE R8
Bur
st D
elay
Red
uctio
n
15
Cloud ComputingLTE
15
16
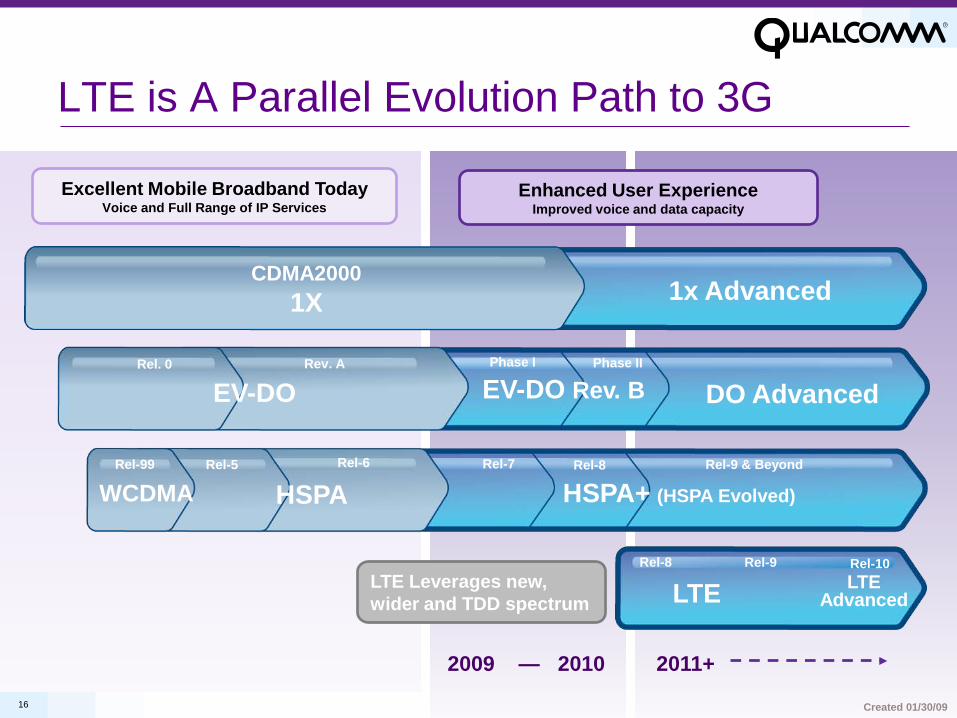
LTE is A Parallel Evolution Path to 3G
Rel-9 & Beyond
LTE
Phase I
HSPA+ (HSPA Evolved)
Rel-7 Rel-8
Phase II
Rel-8
EV-DO
CDMA20001X
HSPAWCDMARel-99 Rel-5
DO Advanced
1x Advanced
Rev. ARel. 0
Rel-6
Rel-10LTE
Advanced
Rel-9
EV-DO Rev. B
2009 — 2010 2011+
Excellent Mobile Broadband TodayVoice and Full Range of IP Services
LTE Leverages new, wider and TDD spectrum
Enhanced User ExperienceImproved voice and data capacity
Created 01/30/09

17
LTE: An Optimized OFDMA Solution
Continuing 3G’s track record of mobility and high spectral efficiency
Low Latency
Leverages 3G’s
Technology Expertise
FDD and TDD Support
Mobility Support
Leverages 3G’s
Ecosystem
Seamless 3G Interoperability
All-IP System
with QoS
Low Overhead
18
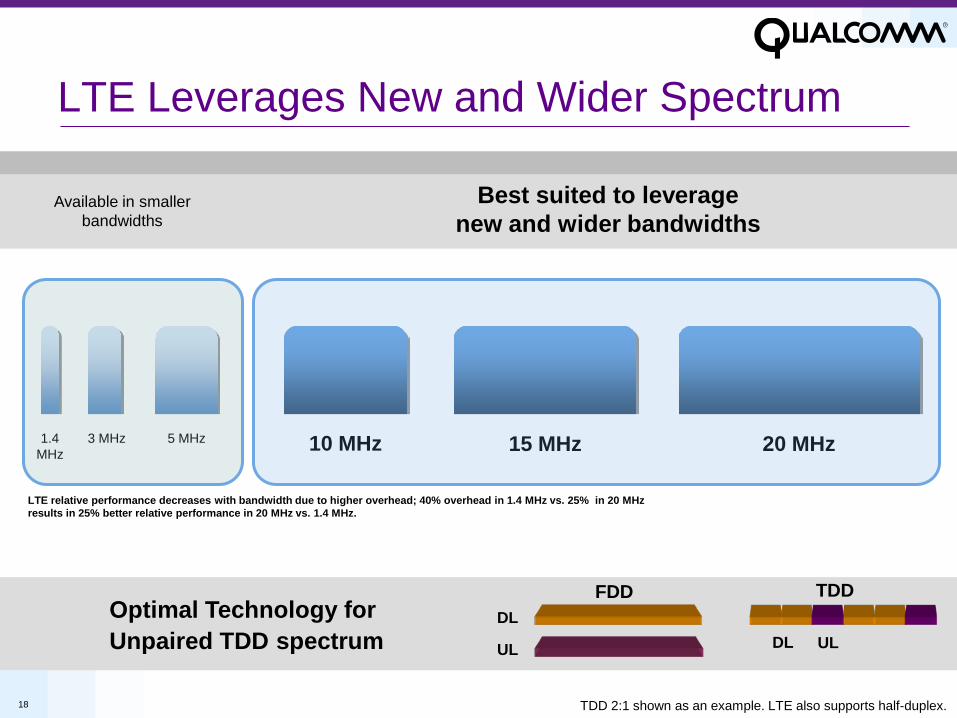
LTE Leverages New and Wider Spectrum
Best suited to leverage new and wider bandwidths
TDD 2:1 shown as an example. LTE also supports half-duplex.
DL
UL
FDDTDD
DL UL
Optimal Technology forUnpaired TDD spectrum
TDD
20 MHz15 MHz1.4MHz 10 MHz5 MHz3 MHz
Available in smaller bandwidths
LTE relative performance decreases with bandwidth due to higher overhead; 40% overhead in 1.4 MHz vs. 25% in 20 MHz results in 25% better relative performance in 20 MHz vs. 1.4 MHz.
19
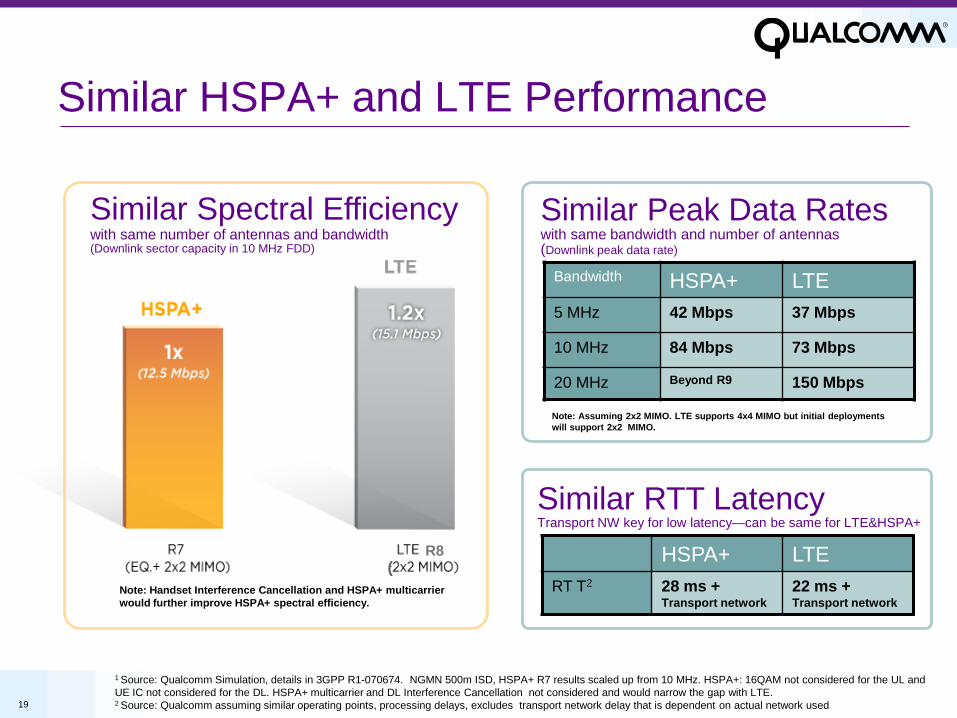
Similar HSPA+ and LTE Performance
Bandwidth HSPA+ LTE5 MHz 42 Mbps 37 Mbps
10 MHz 84 Mbps 73 Mbps
20 MHz Beyond R9 150 Mbps
Similar Peak Data Rates with same bandwidth and number of antennas(Downlink peak data rate)
Note: Assuming 2x2 MIMO. LTE supports 4x4 MIMO but initial deployments will support 2x2 MIMO.
Note: Handset Interference Cancellation and HSPA+ multicarrier would further improve HSPA+ spectral efficiency.
(R8
Similar Spectral Efficiency with same number of antennas and bandwidth(Downlink sector capacity in 10 MHz FDD)
Similar RTT LatencyTransport NW key for low latency—can be same for LTE&HSPA+
HSPA+ LTERT T2 28 ms +
Transport network22 ms + Transport network
1 Source: Qualcomm Simulation, details in 3GPP R1-070674. NGMN 500m ISD, HSPA+ R7 results scaled up from 10 MHz. HSPA+: 16QAM not considered for the UL and UE IC not considered for the DL. HSPA+ multicarrier and DL Interference Cancellation not considered and would narrow the gap with LTE. 2 Source: Qualcomm assuming similar operating points, processing delays, excludes transport network delay that is dependent on actual network used
20
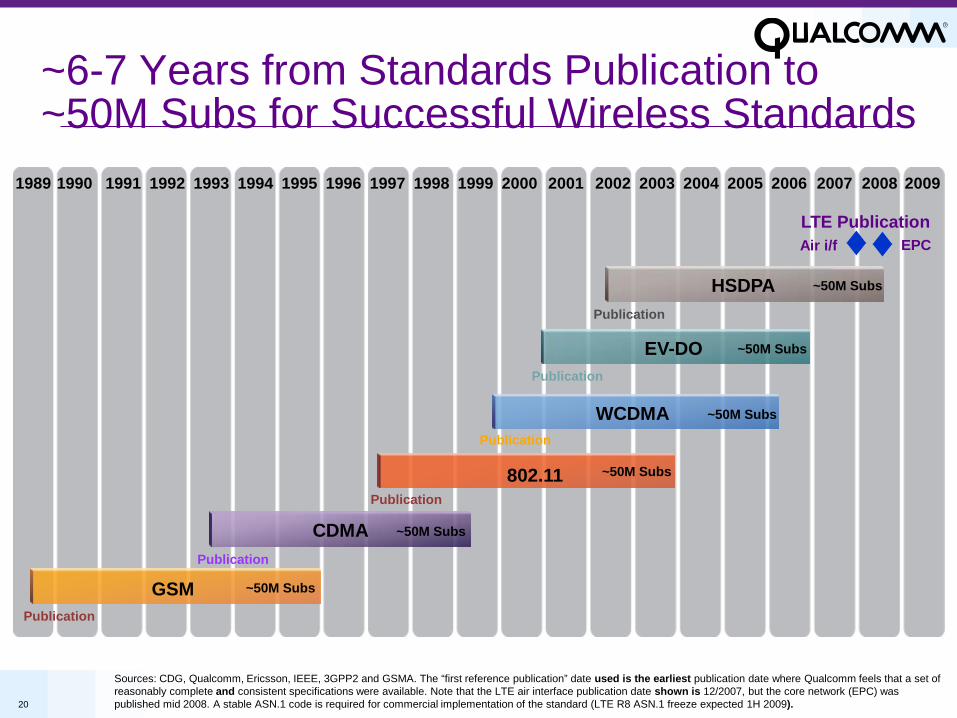
~6-7 Years from Standards Publication to ~50M Subs for Successful Wireless Standards
Air i/f
Publication
Publication
Publication
Publication
Publication
1990 1991 1992 1993 1994 1995 1996 1997 1998 1999 2000 2001 2002 2003 2004 2005 2006 2007 2008 2009
Sources: CDG, Qualcomm, Ericsson, IEEE, 3GPP2 and GSMA. The “first reference publication” date used is the earliest publication date where Qualcomm feels that a set of reasonably complete and consistent specifications were available. Note that the LTE air interface publication date shown is 12/2007, but the core network (EPC) was published mid 2008. A stable ASN.1 code is required for commercial implementation of the standard (LTE R8 ASN.1 freeze expected 1H 2009).
Publication
1989
WCDMA
EV-DO
GSM ~50M Subs
~50M Subs
~50M Subs
CDMA ~50M Subs
802.11 ~50M Subs
HSDPA ~50M Subs
LTE PublicationEPC

21
Cloud Computing
What’s Next ?
21
22
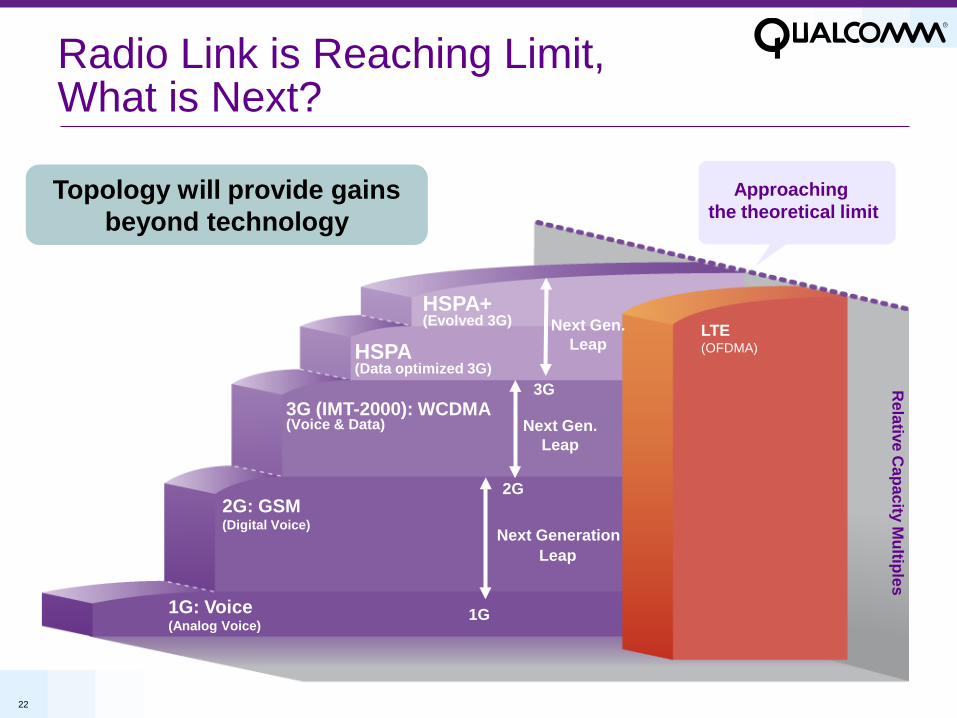
Radio Link is Reaching Limit, What is Next?
Relative C
apacity Multiples
HSPA+(Evolved 3G)
HSPA(Data optimized 3G)
3G (IMT-2000): WCDMA (Voice & Data)
2G: GSM(Digital Voice)
1G: Voice(Analog Voice)
LTE(OFDMA)
Next Gen.Leap
Next Gen.Leap
Next GenerationLeap
2G
3G
1G
Approaching the theoretical limit
Topology will provide gains beyond technology
23
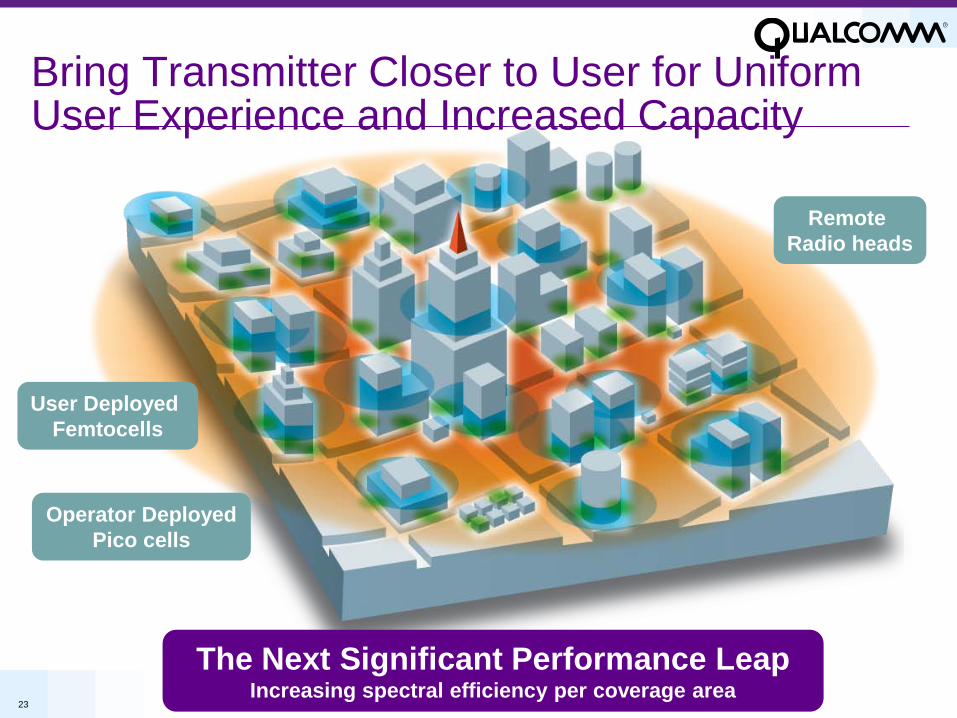
Bring Transmitter Closer to User for Uniform User Experience and Increased Capacity
The Next Significant Performance LeapIncreasing spectral efficiency per coverage area
Remote Radio heads
Operator DeployedPico cells
User Deployed Femtocells
24
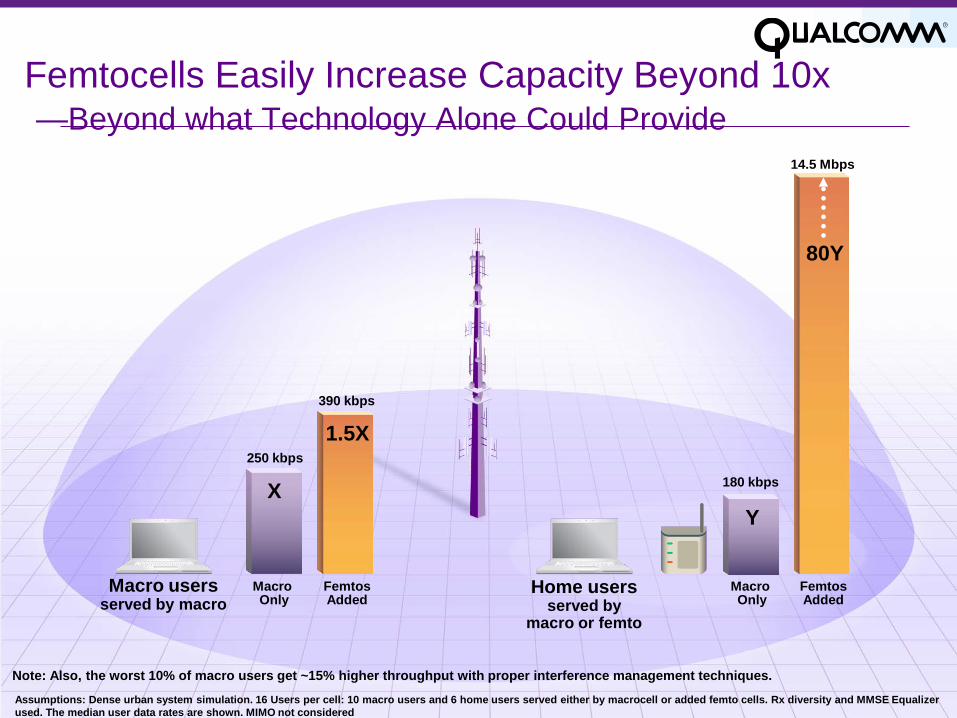
Macro usersserved by macro
Home usersserved by
macro or femto
Macro Only
180 kbps
Y
250 kbps
X
Macro Only
1.5X
80Y
390 kbps
14.5 Mbps
FemtosAdded
FemtosAdded
Femtocells Easily Increase Capacity Beyond 10x—Beyond what Technology Alone Could Provide
Assumptions: Dense urban system simulation. 16 Users per cell: 10 macro users and 6 home users served either by macrocell or added femto cells. Rx diversity and MMSE Equalizer used. The median user data rates are shown. MIMO not considered
Note: Also, the worst 10% of macro users get ~15% higher throughput with proper interference management techniques.
25
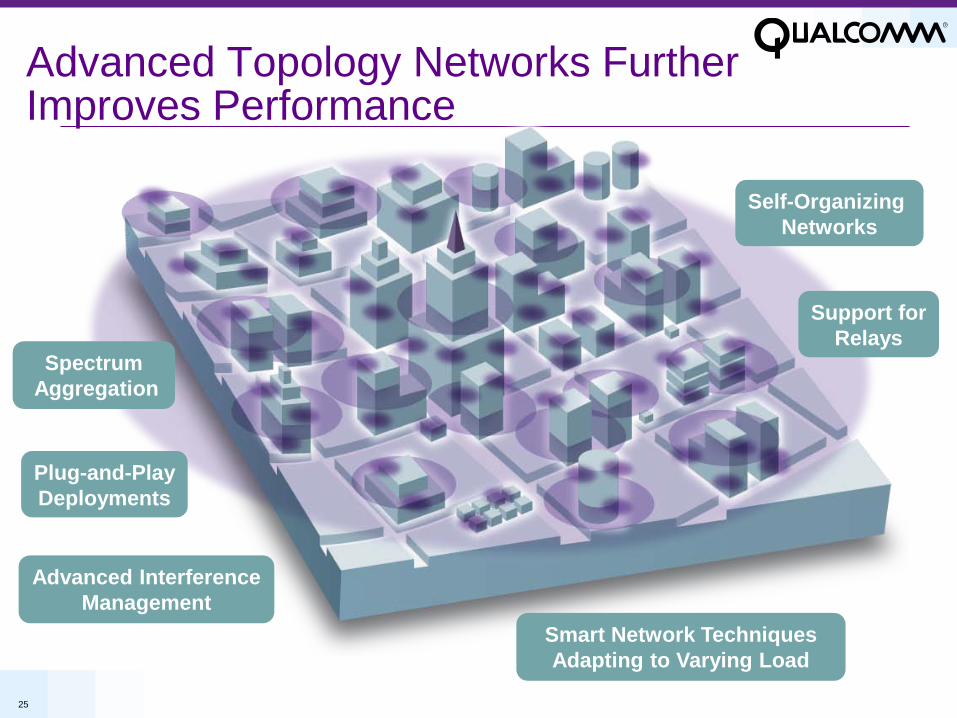
Advanced InterferenceManagement
Advanced Topology Networks Further Improves Performance
Self-Organizing Networks
Support forRelays
Smart Network Techniques Adapting to Varying Load
Plug-and-PlayDeployments
SpectrumAggregation
26
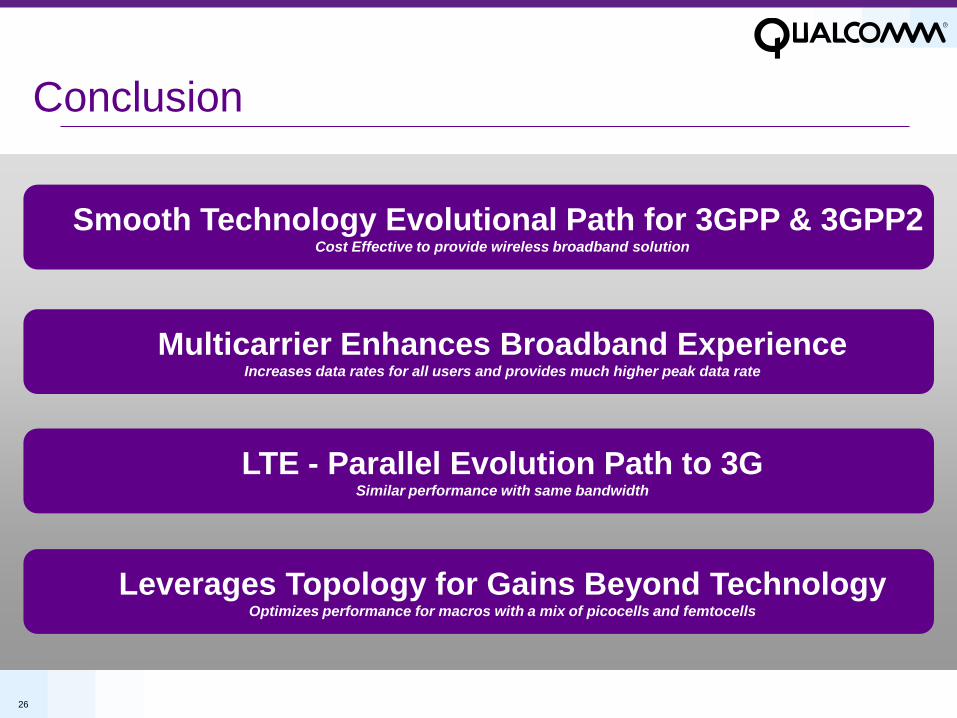
Conclusion
Smooth Technology Evolutional Path for 3GPP & 3GPP2 Cost Effective to provide wireless broadband solution
Multicarrier Enhances Broadband ExperienceIncreases data rates for all users and provides much higher peak data rate
LTE - Parallel Evolution Path to 3GSimilar performance with same bandwidth
Leverages Topology for Gains Beyond TechnologyOptimizes performance for macros with a mix of picocells and femtocells

Thank You