2016 Edelman Trust Barometer - California Results
48
2016 California Trust Survey
Transcript of 2016 Edelman Trust Barometer - California Results
2016 CaliforniaTrust Survey
2
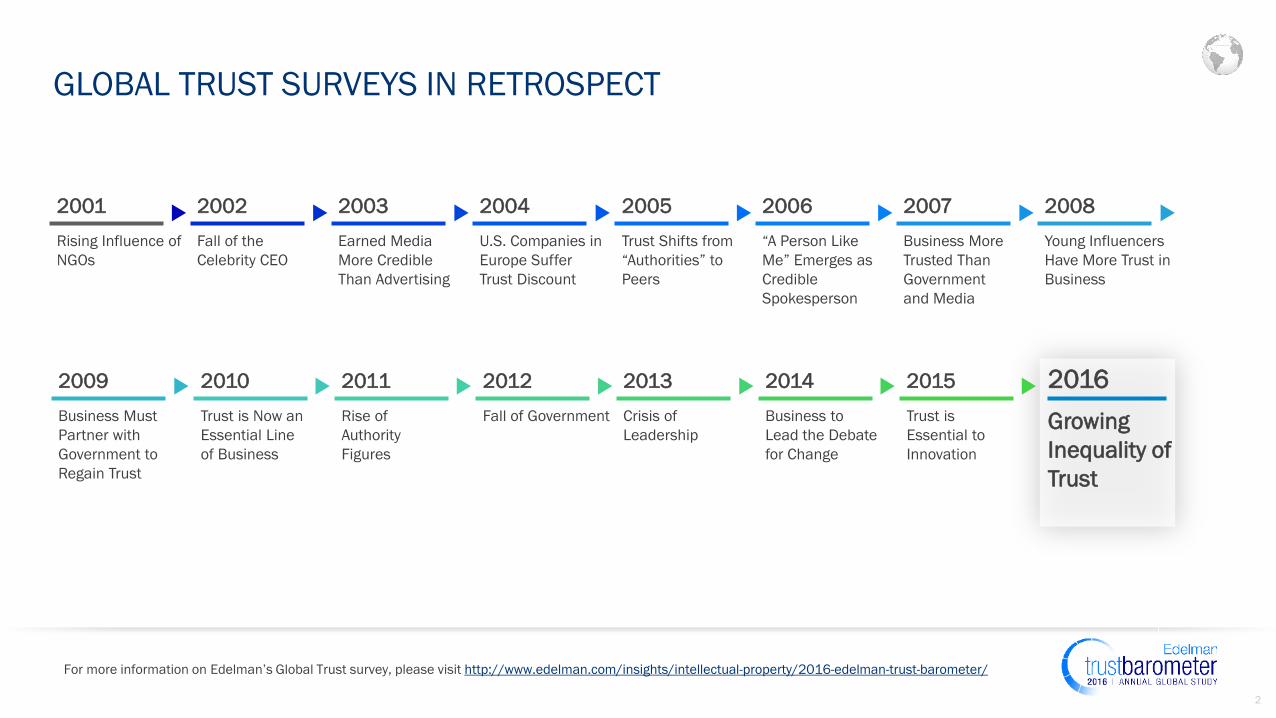
GLOBAL TRUST SURVEYS IN RETROSPECT
Rising Influence of
NGOs
2001
Business Must
Partner with
Government to
Regain Trust
2009
Fall of the
Celebrity CEO
2002
Earned Media
More Credible
Than Advertising
2003
U.S. Companies in
Europe Suffer
Trust Discount
2004
Trust Shifts from
“Authorities” to
Peers
2005
“A Person Like
Me” Emerges as
Credible
Spokesperson
2006
Business More
Trusted Than
Government
and Media
2007
Young Influencers
Have More Trust in
Business
2008
Trust is Now an
Essential Line
of Business
2010
Rise of
Authority
Figures
2011
Fall of Government
2012
Crisis of
Leadership
2013
Business to
Lead the Debate
for Change
2014
Trust is
Essential to
Innovation
2015
Growing
Inequality of
Trust
2016
For more information on Edelman’s Global Trust survey, please visit http://www.edelman.com/insights/intellectual-property/2016-edelman-trust-barometer/
3
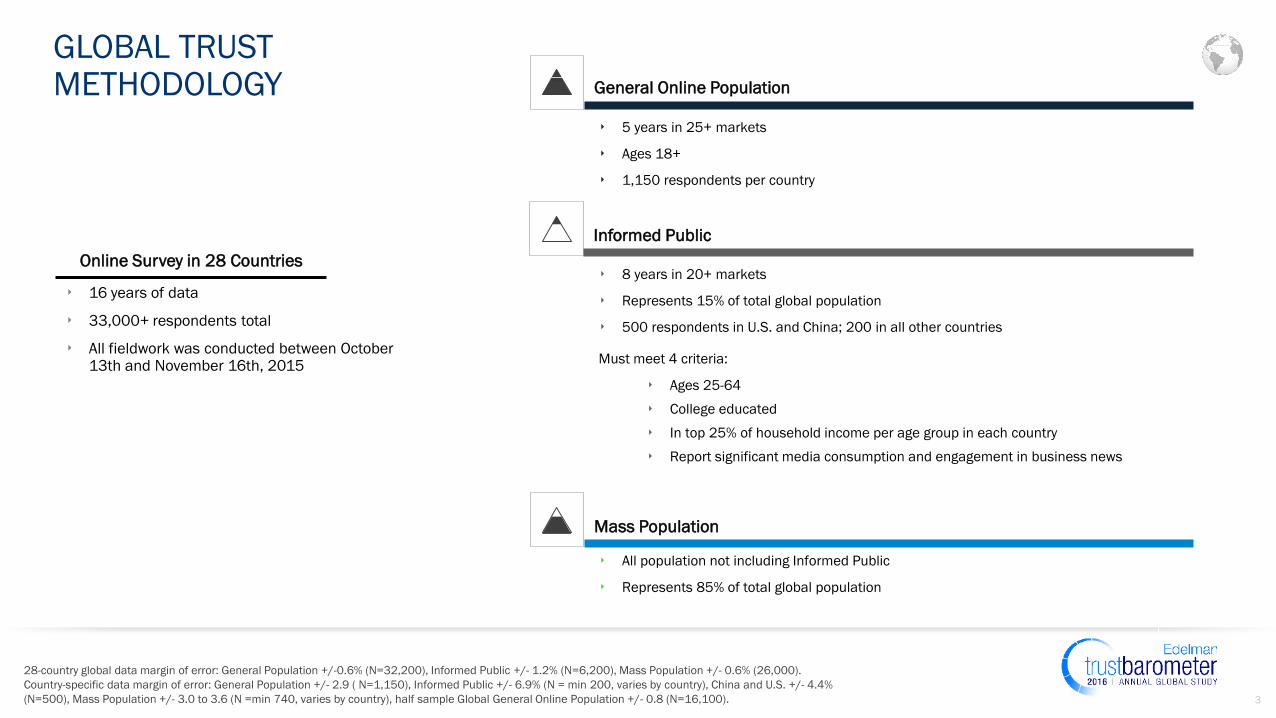
Informed Public
‣ 8 years in 20+ markets
‣ Represents 15% of total global population
‣ 500 respondents in U.S. and China; 200 in all other countries
Must meet 4 criteria:
‣ Ages 25-64
‣ College educated
‣ In top 25% of household income per age group in each country
‣ Report significant media consumption and engagement in business news
General Online Population
‣ 5 years in 25+ markets
‣ Ages 18+
‣ 1,150 respondents per country
GLOBAL TRUST METHODOLOGY
28-country global data margin of error: General Population +/-0.6% (N=32,200), Informed Public +/- 1.2% (N=6,200), Mass Population +/- 0.6% (26,000).
Country-specific data margin of error: General Population +/- 2.9 ( N=1,150), Informed Public +/- 6.9% (N = min 200, varies by country), China and U.S. +/- 4.4%
(N=500), Mass Population +/- 3.0 to 3.6 (N =min 740, varies by country), half sample Global General Online Population +/- 0.8 (N=16,100).
‣ 16 years of data
‣ 33,000+ respondents total
‣ All fieldwork was conducted between October 13th and November 16th, 2015
Online Survey in 28 Countries
Mass Population
‣ All population not including Informed Public
‣ Represents 85% of total global population
STATE OF TRUST
5
5148
4541
55 53
4742
6357
5148
6763
5751
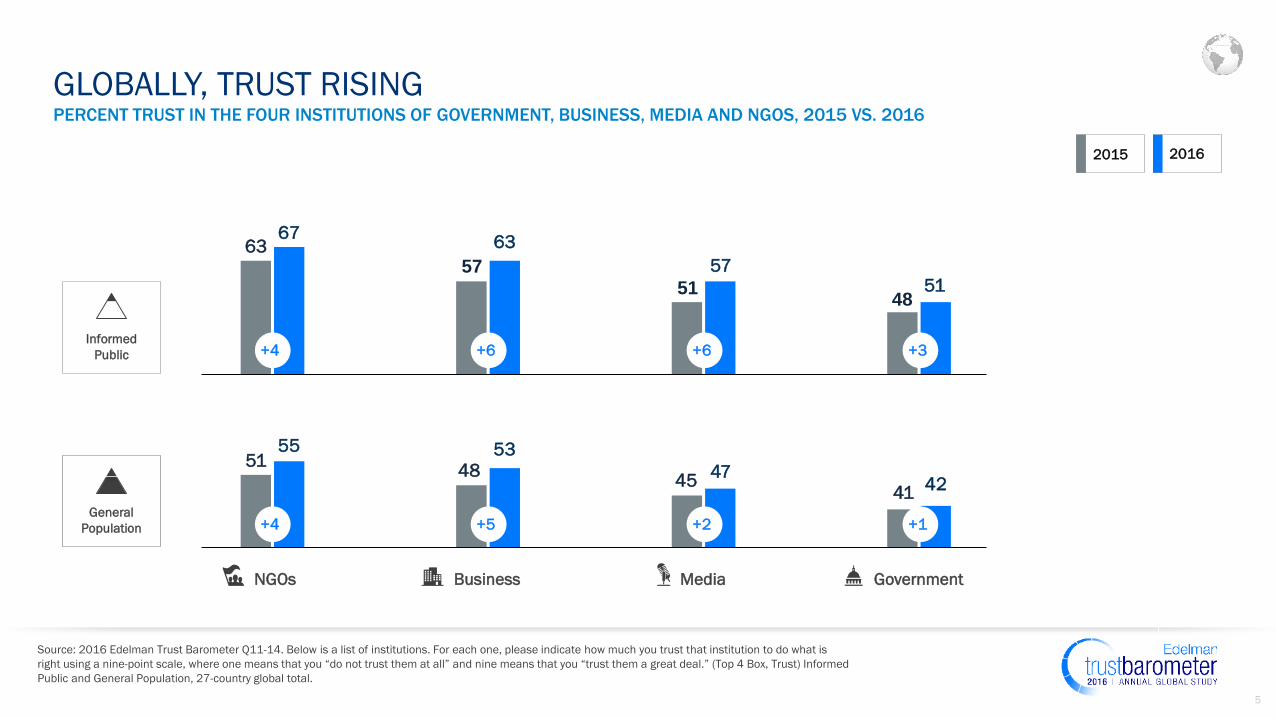
GLOBALLY, TRUST RISING
Source: 2016 Edelman Trust Barometer Q11-14. Below is a list of institutions. For each one, please indicate how much you trust that institution to do what is
right using a nine-point scale, where one means that you “do not trust them at all” and nine means that you “trust them a great deal.” (Top 4 Box, Trust) Informed
Public and General Population, 27-country global total.
PERCENT TRUST IN THE FOUR INSTITUTIONS OF GOVERNMENT, BUSINESS, MEDIA AND NGOS, 2015 VS. 2016
NGOs Business Media Government
+4 +6 +6 +3Informed
Public
General
Population
2015 2016
+4 +5 +2 +1
TRUST INEQUALITY
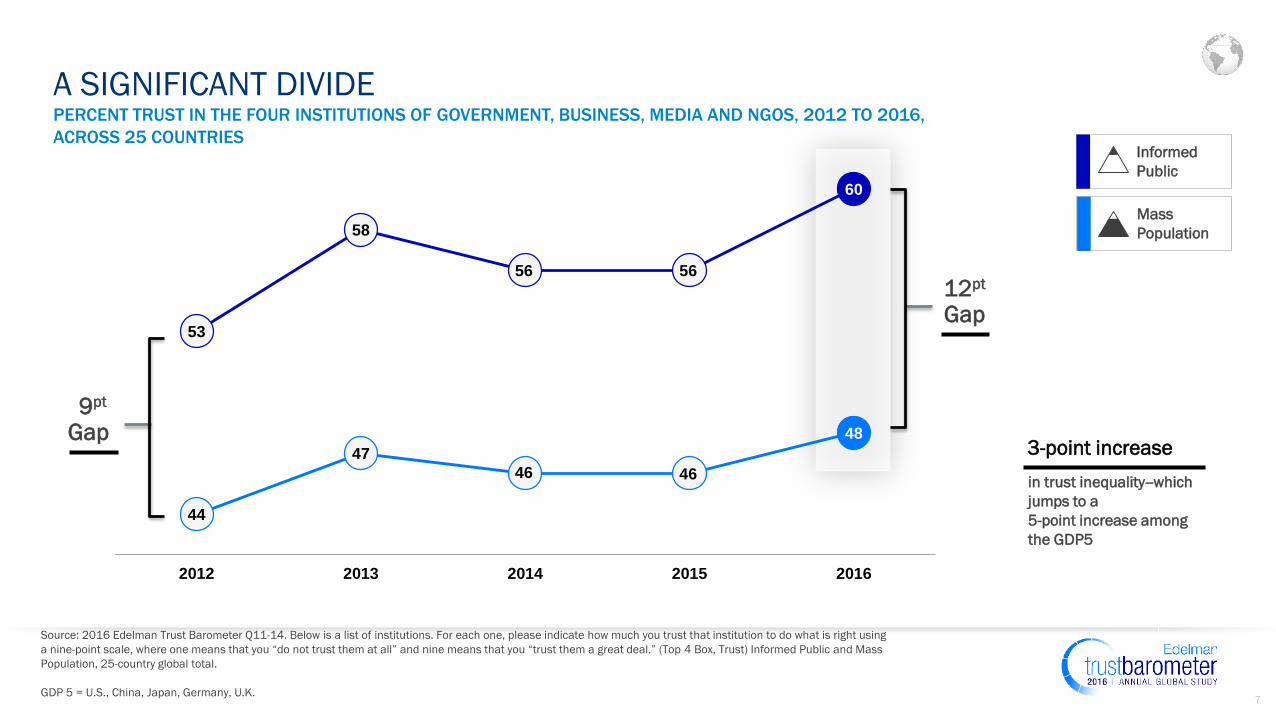
7
53
58
56 56
60
44
47
46 46
48
2012 2013 2014 2015 2016
A SIGNIFICANT DIVIDE
Source: 2016 Edelman Trust Barometer Q11-14. Below is a list of institutions. For each one, please indicate how much you trust that institution to do what is right using
a nine-point scale, where one means that you “do not trust them at all” and nine means that you “trust them a great deal.” (Top 4 Box, Trust) Informed Public and Mass
Population, 25-country global total.
GDP 5 = U.S., China, Japan, Germany, U.K.
PERCENT TRUST IN THE FOUR INSTITUTIONS OF GOVERNMENT, BUSINESS, MEDIA AND NGOS, 2012 TO 2016,
ACROSS 25 COUNTRIESInformed
Public
Mass
Population
12pt
Gap
9pt
Gap
in trust inequality--which
jumps to a
5-point increase among
the GDP5
3-point increase
8
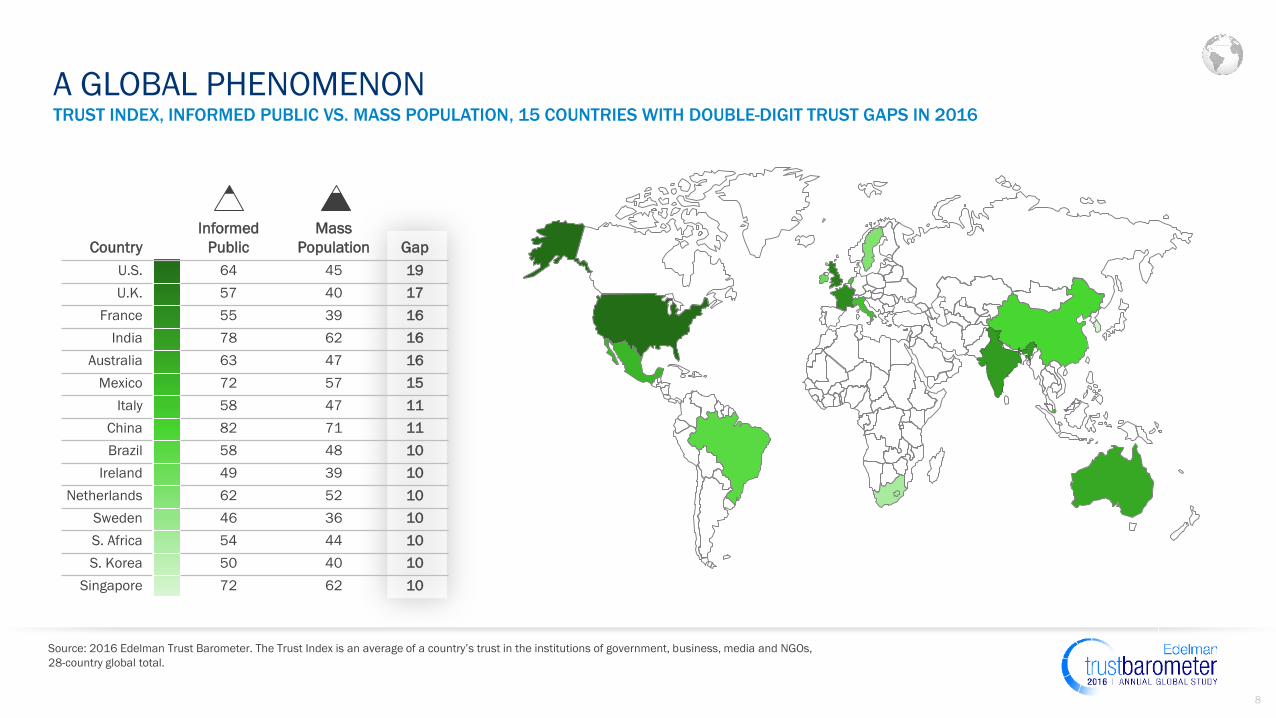
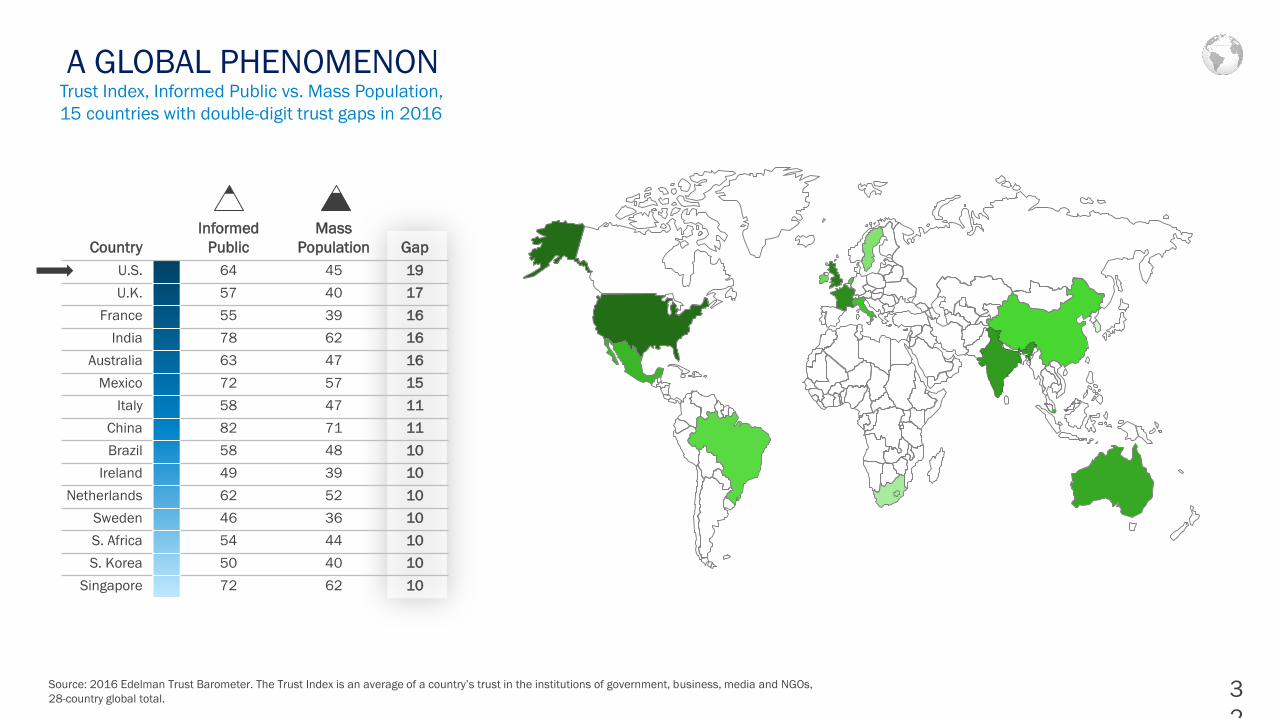
A GLOBAL PHENOMENON
Source: 2016 Edelman Trust Barometer. The Trust Index is an average of a country’s trust in the institutions of government, business, media and NGOs,
28-country global total.
TRUST INDEX, INFORMED PUBLIC VS. MASS POPULATION, 15 COUNTRIES WITH DOUBLE-DIGIT TRUST GAPS IN 2016
Country
Informed
Public
Mass
Population Gap
U.S. 64 45 19
U.K. 57 40 17
France 55 39 16
India 78 62 16
Australia 63 47 16
Mexico 72 57 15
Italy 58 47 11
China 82 71 11
Brazil 58 48 10
Ireland 49 39 10
Netherlands 62 52 10
Sweden 46 36 10
S. Africa 54 44 10
S. Korea 50 40 10
Singapore 72 62 10
INVERSION OF INFLUENCE
10
MassPopulation
THE INVERSION OF INFLUENCE
Authority
& Influence
Influence
Authority
Source: 2016 Edelman Trust Barometer Q11-14. Below is a list of institutions. For each one, please indicate how much you trust that institution to do what is right using
a nine-point scale, where one means that you “do not trust them at all” and nine means that you “trust them a great deal.” (Top 4 Box, Trust) Informed Public and Mass
Population, 28-country global total.
85%of population
48 Trust Index
15%of population
60 Trust IndexInformed
Public
11
6364
57
5048
41
50
39
33
67
6463
5352
4948
44
35
PEERS, EMPLOYEES MORE CREDIBLE THAN LEADERS
Source: 2016 Edelman. Trust Barometer Q130-587. Below is a list of people. In general, when forming an opinion of a company, if you heard information about a
company from each person, how credible would the information be—extremely credible, very credible, somewhat credible, or not credible at all? (Top 2 Box,
Very/Extremely Credible) General Population, 27-country global total.
PERCENT WHO RATE EACH SPOKESPERSON AS EXTREMELY/VERY CREDIBLE
2015 2016
+8
Technical
expert
Academic
expert
A person
like yourself
Financial
industry
analyst
Employee CEO NGO
representative
Board of
Directors
Government
official/regulator
CEO credibility
increased the most
General
Population
+6
AN OPPORTUNITY FOR BUSINESS
13
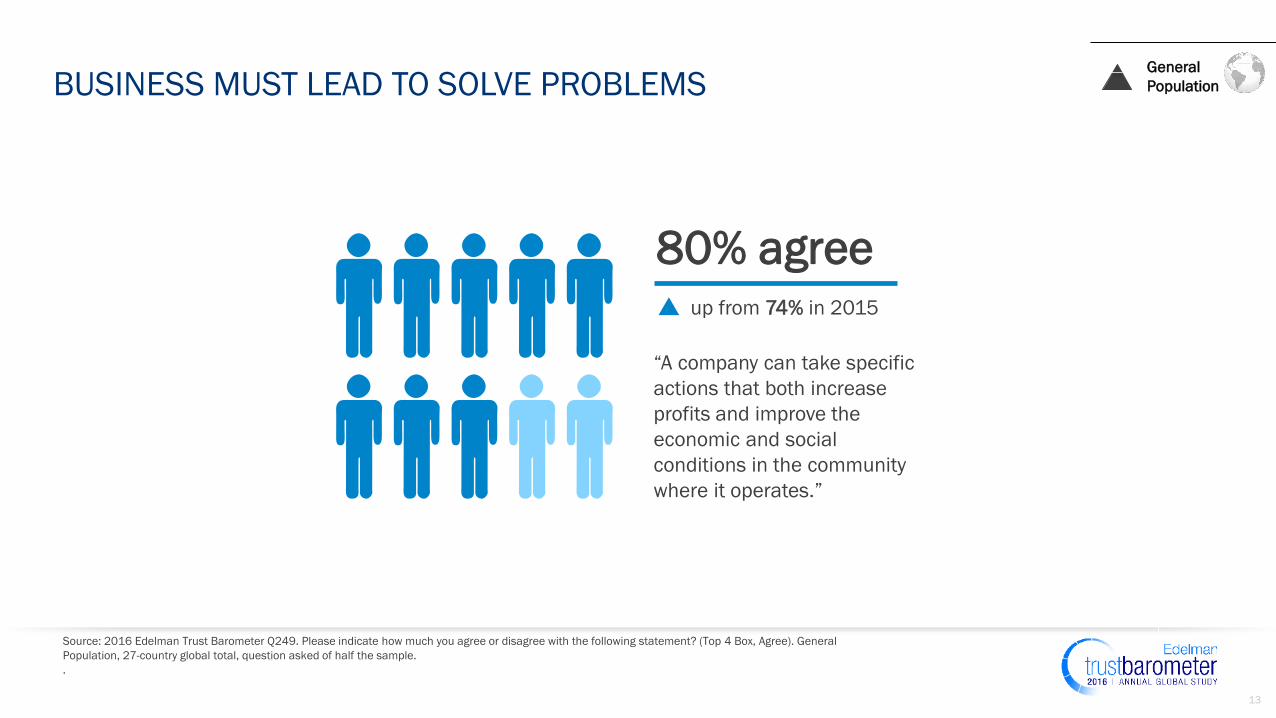
BUSINESS MUST LEAD TO SOLVE PROBLEMS
Source: 2016 Edelman Trust Barometer Q249. Please indicate how much you agree or disagree with the following statement? (Top 4 Box, Agree). General
Population, 27-country global total, question asked of half the sample.
.
80% agree
“A company can take specific
actions that both increase
profits and improve the
economic and social
conditions in the community
where it operates.”
up from 74% in 2015
General
Population
14
15
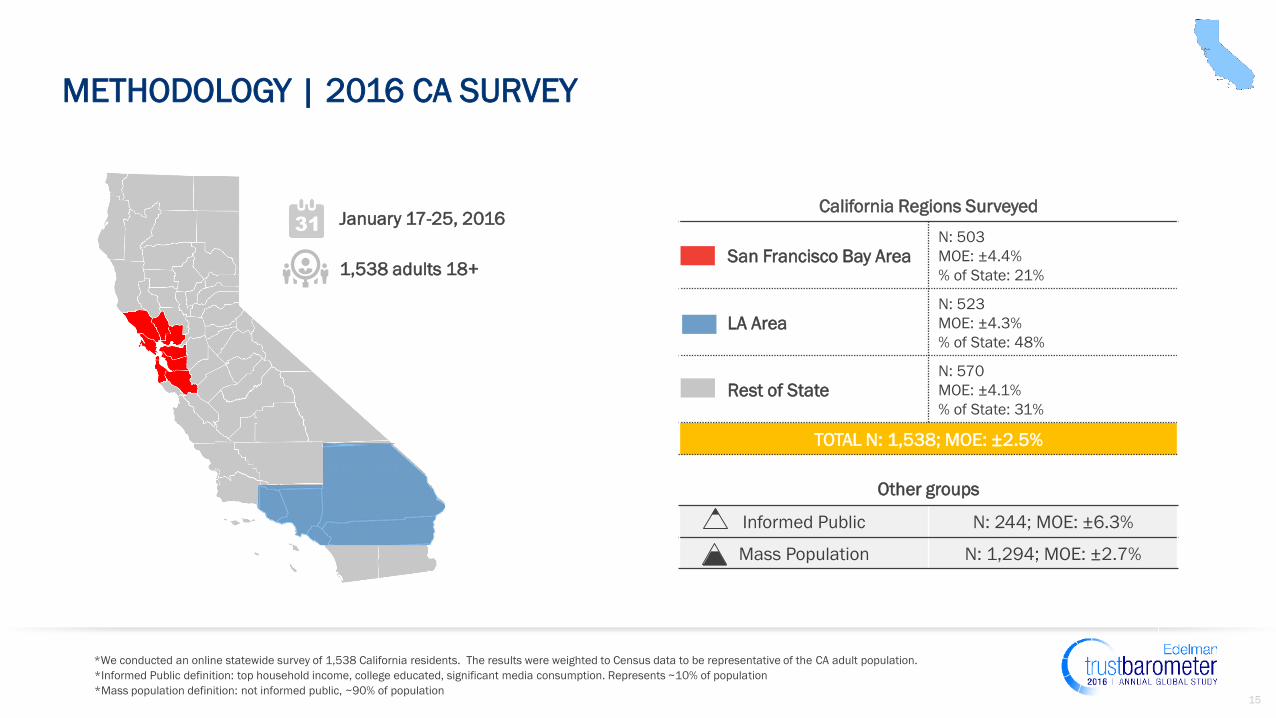
Informed Public N: 244; MOE: ±6.3%
Mass Population N: 1,294; MOE: ±2.7%
METHODOLOGY | 2016 CA SURVEY
*We conducted an online statewide survey of 1,538 California residents. The results were weighted to Census data to be representative of the CA adult population.
California Regions Surveyed
San Francisco Bay AreaN: 503
MOE: ±4.4%
% of State: 21%
LA AreaN: 523
MOE: ±4.3%
% of State: 48%
Rest of StateN: 570
MOE: ±4.1%
% of State: 31%
TOTAL N: 1,538; MOE: ±2.5%
*Informed Public definition: top household income, college educated, significant media consumption. Represents ~10% of population
*Mass population definition: not informed public, ~90% of population
Other groups
January 17-25, 2016
1,538 adults 18+
16
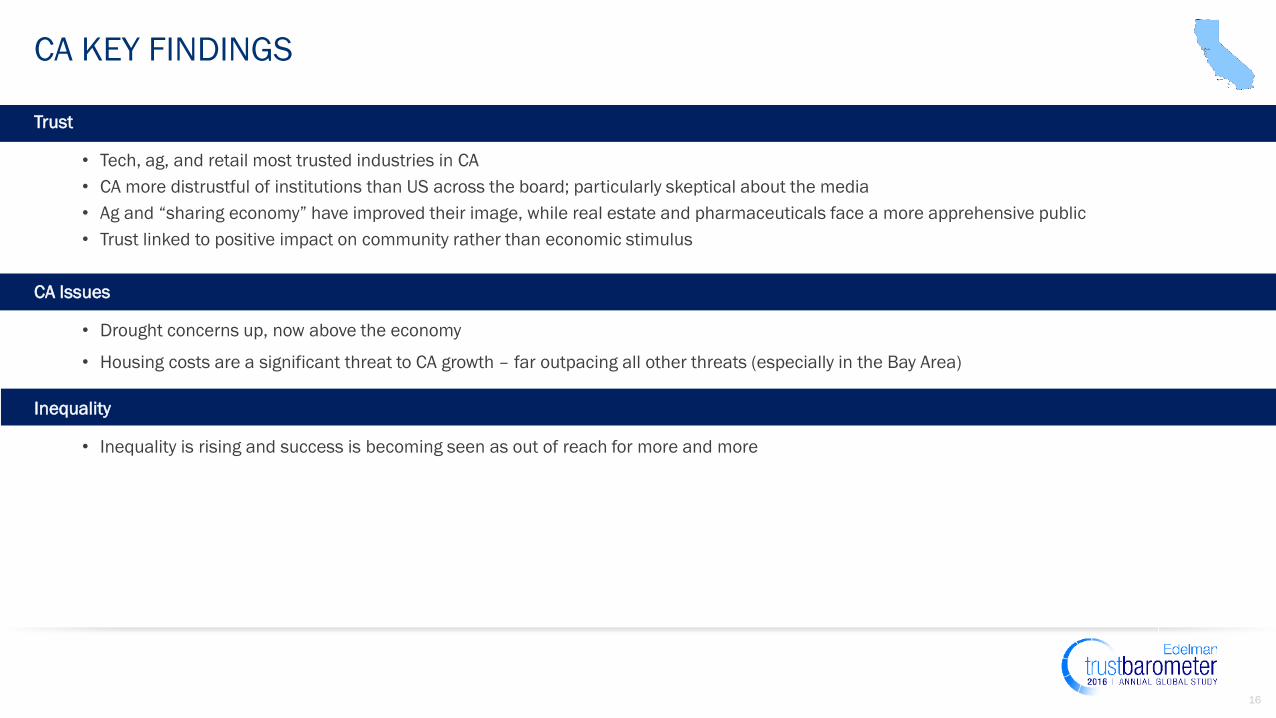
CA KEY FINDINGS
Trust
• Tech, ag, and retail most trusted industries in CA
• CA more distrustful of institutions than US across the board; particularly skeptical about the media
• Ag and “sharing economy” have improved their image, while real estate and pharmaceuticals face a more apprehensive public
• Trust linked to positive impact on community rather than economic stimulus
CA Issues
• Drought concerns up, now above the economy
• Housing costs are a significant threat to CA growth – far outpacing all other threats (especially in the Bay Area)
Inequality
• Inequality is rising and success is becoming seen as out of reach for more and more
17
CA KEY FINDINGS
Business role
• License to lead on societal issues - business most trusted entity
• However, public-private partnership preferred over going it alone
• Highest interest in business getting involved on issues relevant to the business or its workers (i.e. economy, inequality, housing,
and transportation)
CEOs
• CEOs have lost their sheen
• Most widely seen as greedy, arrogant and phony – but Tech CEOs, like their industry, seen more positively
• Tech CEOs provide a lesson to all CEOs: honesty and sincerity are critical…and lacking among many CEOs
Media

18
TRUST
19
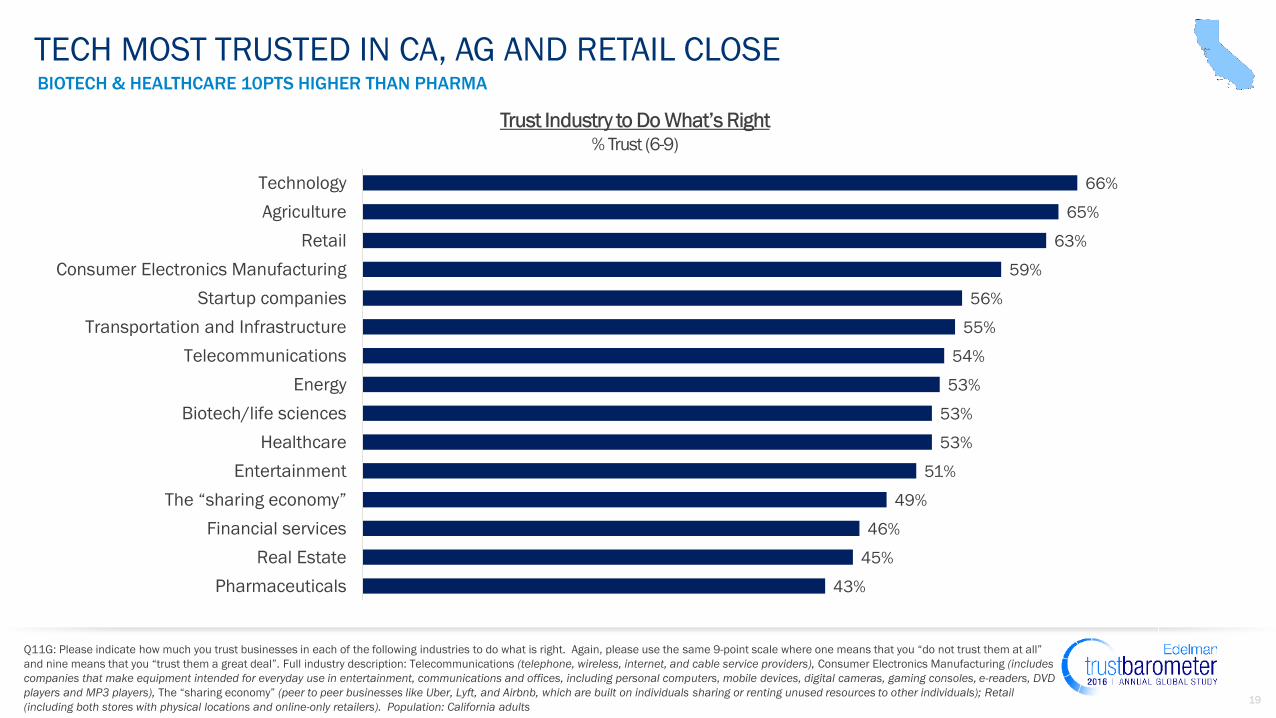
Q11G: Please indicate how much you trust businesses in each of the following industries to do what is right. Again, please use the same 9-point scale where one means that you “do not trust them at all”
and nine means that you “trust them a great deal”. Full industry description: Telecommunications (telephone, wireless, internet, and cable service providers), Consumer Electronics Manufacturing (includes
companies that make equipment intended for everyday use in entertainment, communications and offices, including personal computers, mobile devices, digital cameras, gaming consoles, e-readers, DVD
players and MP3 players), The “sharing economy” (peer to peer businesses like Uber, Lyft, and Airbnb, which are built on individuals sharing or renting unused resources to other individuals); Retail
(including both stores with physical locations and online-only retailers). Population: California adults
66%
65%
63%
59%
56%
55%
54%
53%
53%
53%
51%
49%
46%
45%
43%
Technology
Agriculture
Retail
Consumer Electronics Manufacturing
Startup companies
Transportation and Infrastructure
Telecommunications
Energy
Biotech/life sciences
Healthcare
Entertainment
The “sharing economy”
Financial services
Real Estate
Pharmaceuticals
BIOTECH & HEALTHCARE 10PTS HIGHER THAN PHARMA
TECH MOST TRUSTED IN CA, AG AND RETAIL CLOSE
20
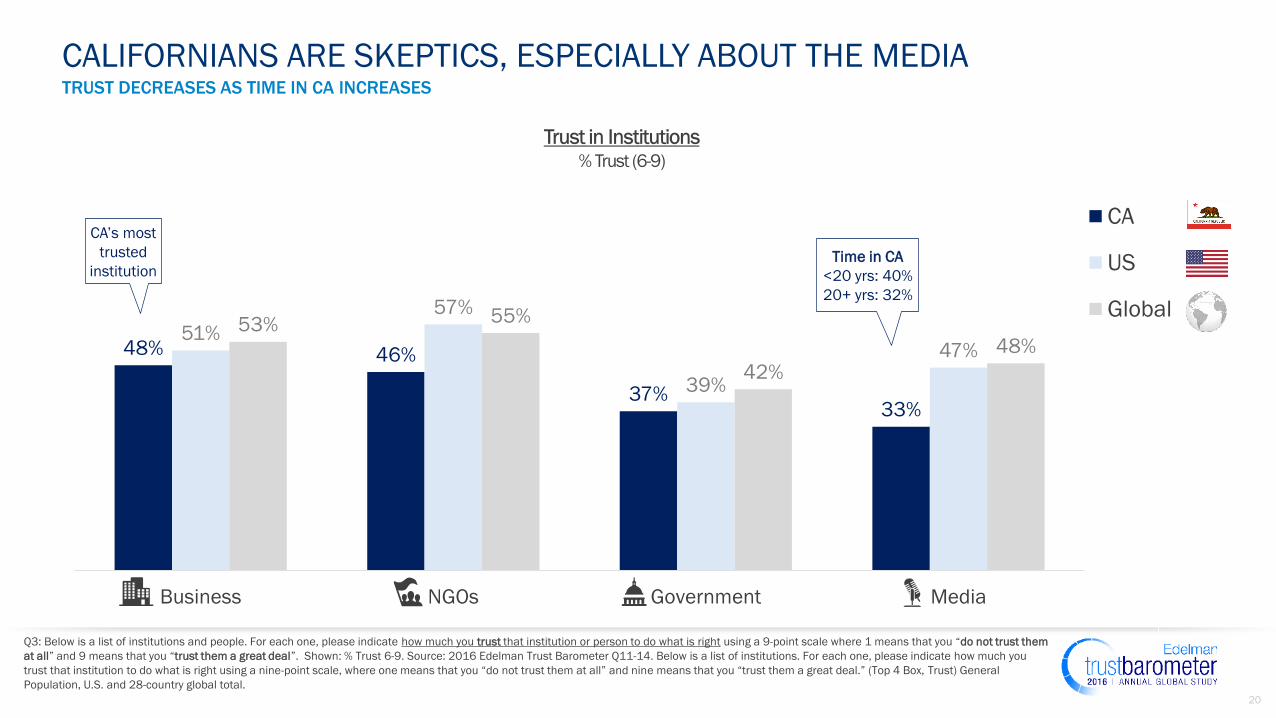
TRUST DECREASES AS TIME IN CA INCREASES
CALIFORNIANS ARE SKEPTICS, ESPECIALLY ABOUT THE MEDIA
Q3: Below is a list of institutions and people. For each one, please indicate how much you trust that institution or person to do what is right using a 9-point scale where 1 means that you “do not trust them
at all” and 9 means that you “trust them a great deal”. Shown: % Trust 6-9. Source: 2016 Edelman Trust Barometer Q11-14. Below is a list of institutions. For each one, please indicate how much you
trust that institution to do what is right using a nine-point scale, where one means that you “do not trust them at all” and nine means that you “trust them a great deal.” (Top 4 Box, Trust) General
Population, U.S. and 28-country global total.
48% 46%
37%33%
51%
57%
39%
47%
53% 55%
42%
48%
Business NGOs Government Media
CA
US
Global
Time in CA
<20 yrs: 40%
20+ yrs: 32%
CA’s most
trusted
institution
21
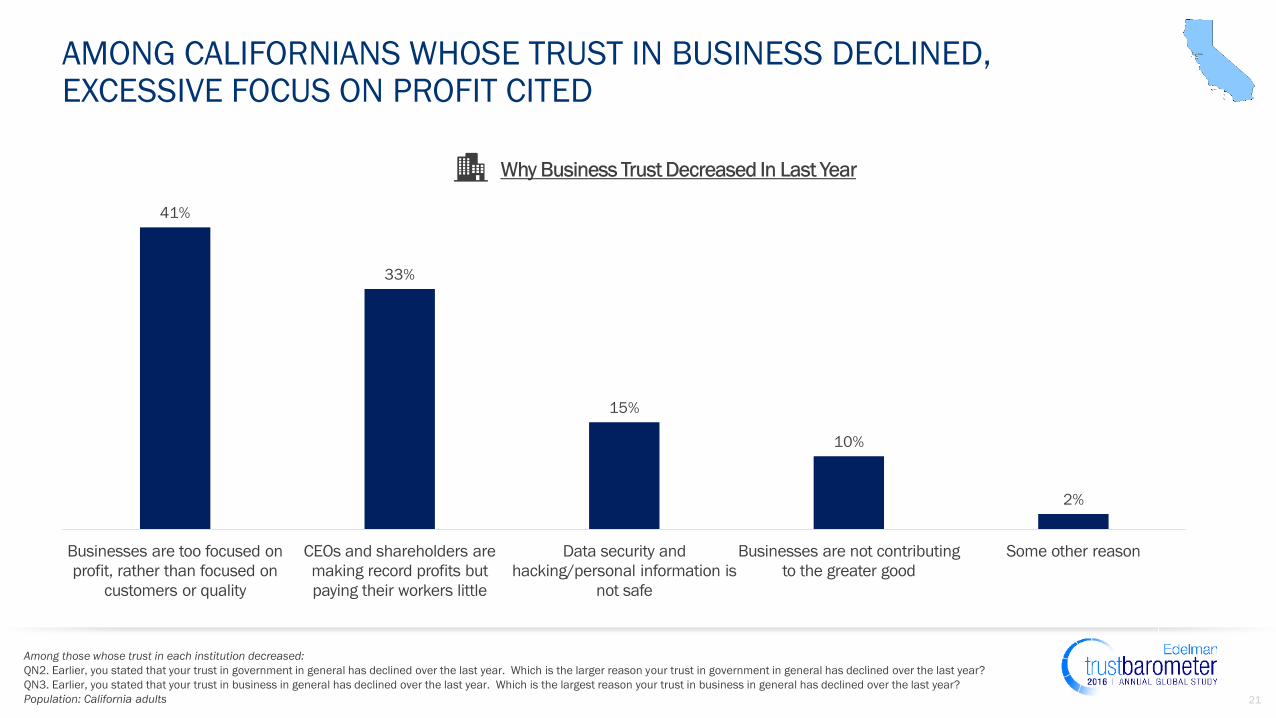
AMONG CALIFORNIANS WHOSE TRUST IN BUSINESS DECLINED, EXCESSIVE FOCUS ON PROFIT CITED
Among those whose trust in each institution decreased:
QN2. Earlier, you stated that your trust in government in general has declined over the last year. Which is the larger reason your trust in government in general has declined over the last year?
QN3. Earlier, you stated that your trust in business in general has declined over the last year. Which is the largest reason your trust in business in general has declined over the last year?
Population: California adults
41%
33%
15%
10%
2%
Businesses are too focused on
profit, rather than focused on
customers or quality
CEOs and shareholders are
making record profits but
paying their workers little
Data security and
hacking/personal information is
not safe
Businesses are not contributing
to the greater good
Some other reason
22
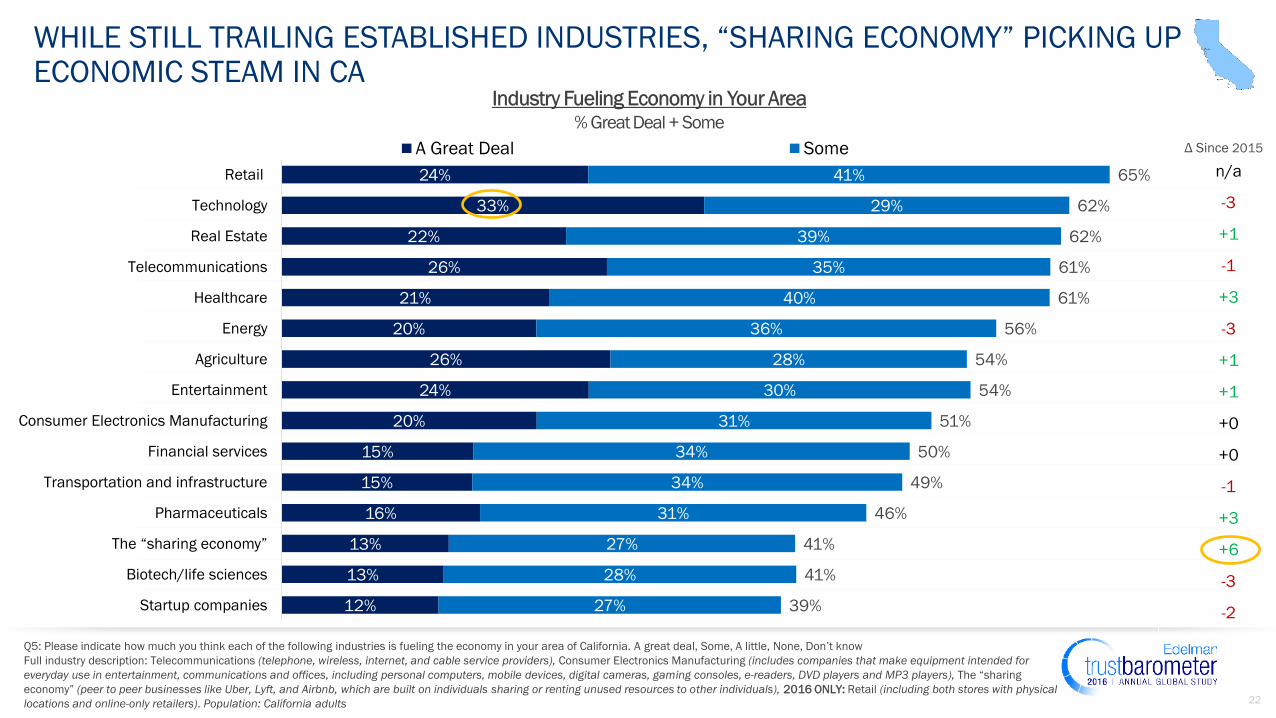
Q5: Please indicate how much you think each of the following industries is fueling the economy in your area of California. A great deal, Some, A little, None, Don’t know
Full industry description: Telecommunications (telephone, wireless, internet, and cable service providers), Consumer Electronics Manufacturing (includes companies that make equipment intended for
everyday use in entertainment, communications and offices, including personal computers, mobile devices, digital cameras, gaming consoles, e-readers, DVD players and MP3 players), The “sharing
economy” (peer to peer businesses like Uber, Lyft, and Airbnb, which are built on individuals sharing or renting unused resources to other individuals), 2016 ONLY: Retail (including both stores with physical
locations and online-only retailers). Population: California adults
WHILE STILL TRAILING ESTABLISHED INDUSTRIES, “SHARING ECONOMY” PICKING UP ECONOMIC STEAM IN CA
24%
33%
22%
26%
21%
20%
26%
24%
20%
15%
15%
16%
13%
13%
12%
41%
29%
39%
35%
40%
36%
28%
30%
31%
34%
34%
31%
27%
28%
27%
65%
62%
62%
61%
61%
56%
54%
54%
51%
50%
49%
46%
41%
41%
39%
Retail
Technology
Real Estate
Telecommunications
Healthcare
Energy
Agriculture
Entertainment
Consumer Electronics Manufacturing
Financial services
Transportation and infrastructure
Pharmaceuticals
The “sharing economy”
Biotech/life sciences
Startup companies
A Great Deal Some
n/a
-3
+1
-1
+3
-3
+1
+1
+0
+0
-1
+3
+6
-3
-2
Δ Since 2015
23
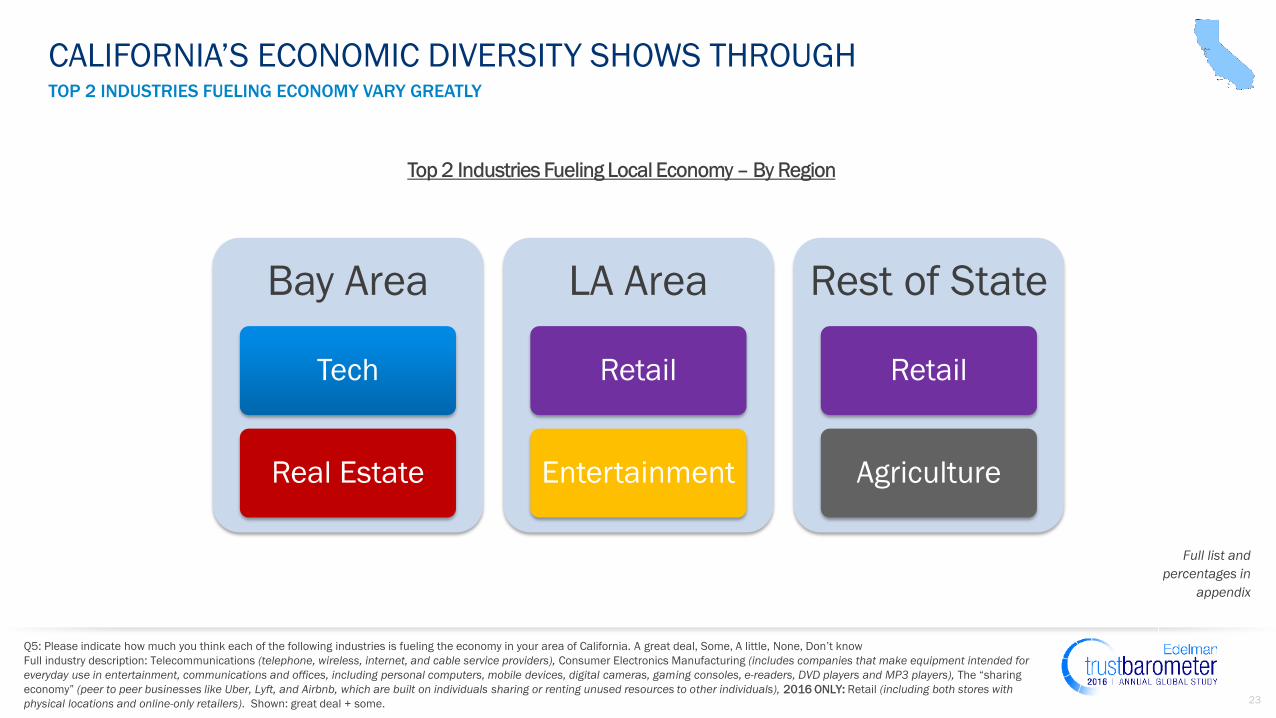
TOP 2 INDUSTRIES FUELING ECONOMY VARY GREATLY
Q5: Please indicate how much you think each of the following industries is fueling the economy in your area of California. A great deal, Some, A little, None, Don’t know
Full industry description: Telecommunications (telephone, wireless, internet, and cable service providers), Consumer Electronics Manufacturing (includes companies that make equipment intended for
everyday use in entertainment, communications and offices, including personal computers, mobile devices, digital cameras, gaming consoles, e-readers, DVD players and MP3 players), The “sharing
economy” (peer to peer businesses like Uber, Lyft, and Airbnb, which are built on individuals sharing or renting unused resources to other individuals), 2016 ONLY: Retail (including both stores with
physical locations and online-only retailers). Shown: great deal + some.
CALIFORNIA’S ECONOMIC DIVERSITY SHOWS THROUGH
Bay Area
Tech
Real Estate
LA Area
Retail
Entertainment
Rest of State
Retail
Agriculture
Full list and
percentages in
appendix
24
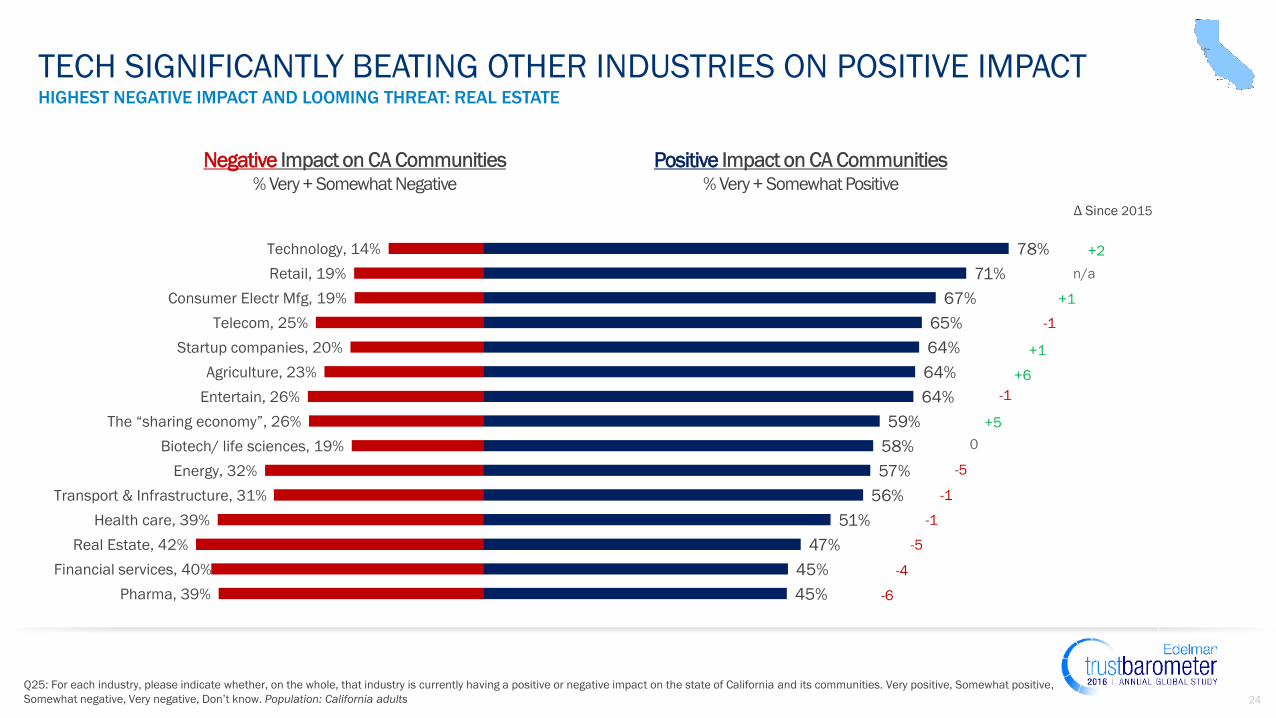
HIGHEST NEGATIVE IMPACT AND LOOMING THREAT: REAL ESTATE
Q25: For each industry, please indicate whether, on the whole, that industry is currently having a positive or negative impact on the state of California and its communities. Very positive, Somewhat positive,
Somewhat negative, Very negative, Don’t know. Population: California adults
TECH SIGNIFICANTLY BEATING OTHER INDUSTRIES ON POSITIVE IMPACT
Pharma, 39%
Financial services, 40%
Real Estate, 42%
Health care, 39%
Transport & Infrastructure, 31%
Energy, 32%
Biotech/ life sciences, 19%
The “sharing economy”, 26%
Entertain, 26%
Agriculture, 23%
Startup companies, 20%
Telecom, 25%
Consumer Electr Mfg, 19%
Retail, 19%
Technology, 14%
45%
45%
47%
51%
56%
57%
58%
59%
64%
64%
64%
65%
67%
71%
78%
Negative Positive
Δ Since 2015
+2
+1
+1
+6
+5
n/a
0
-1
-1
-1
-1
-5
-5
-4
-6
25
Q25: For each industry, please indicate whether, on the whole, that industry is currently having a positive or negative impact on the state of California and its communities. Very positive, Somewhat positive,
Somewhat negative, Very negative, Don’t know. Population: California adults
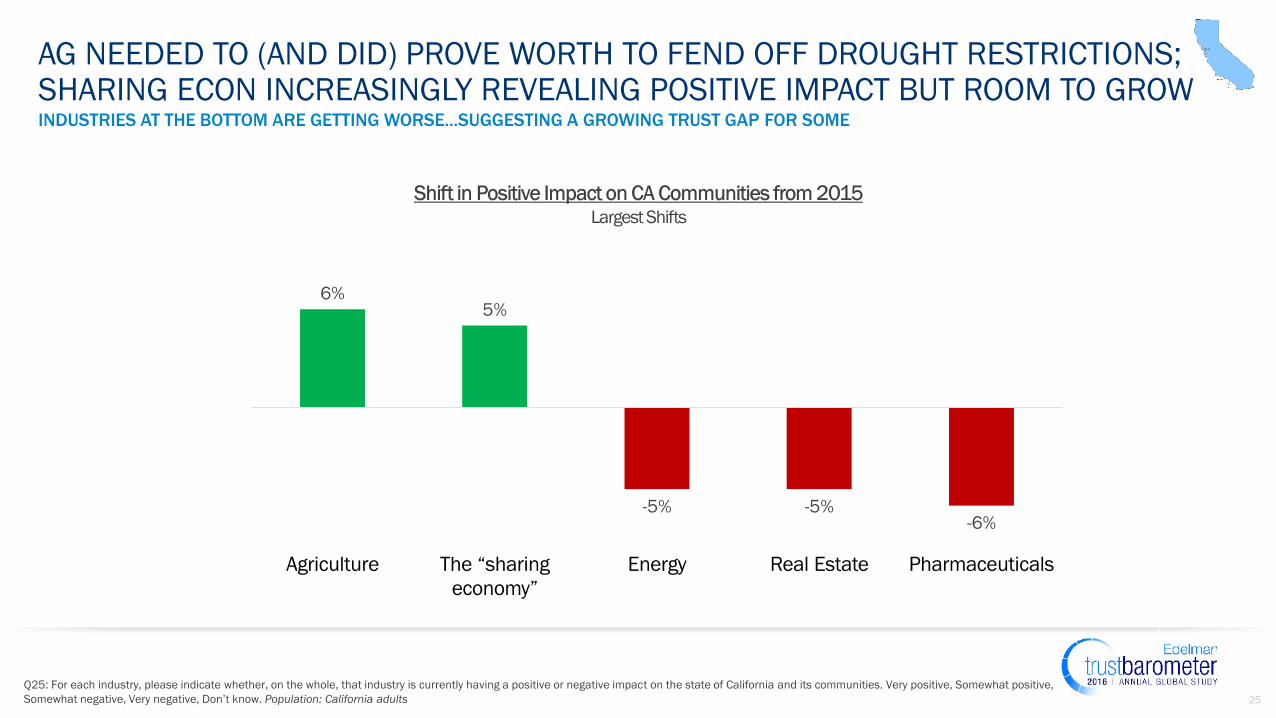
AG NEEDED TO (AND DID) PROVE WORTH TO FEND OFF DROUGHT RESTRICTIONS;SHARING ECON INCREASINGLY REVEALING POSITIVE IMPACT BUT ROOM TO GROW
6%5%
-5% -5%-6%
Agriculture The “sharing
economy”
Energy Real Estate Pharmaceuticals
INDUSTRIES AT THE BOTTOM ARE GETTING WORSE...SUGGESTING A GROWING TRUST GAP FOR SOME
26
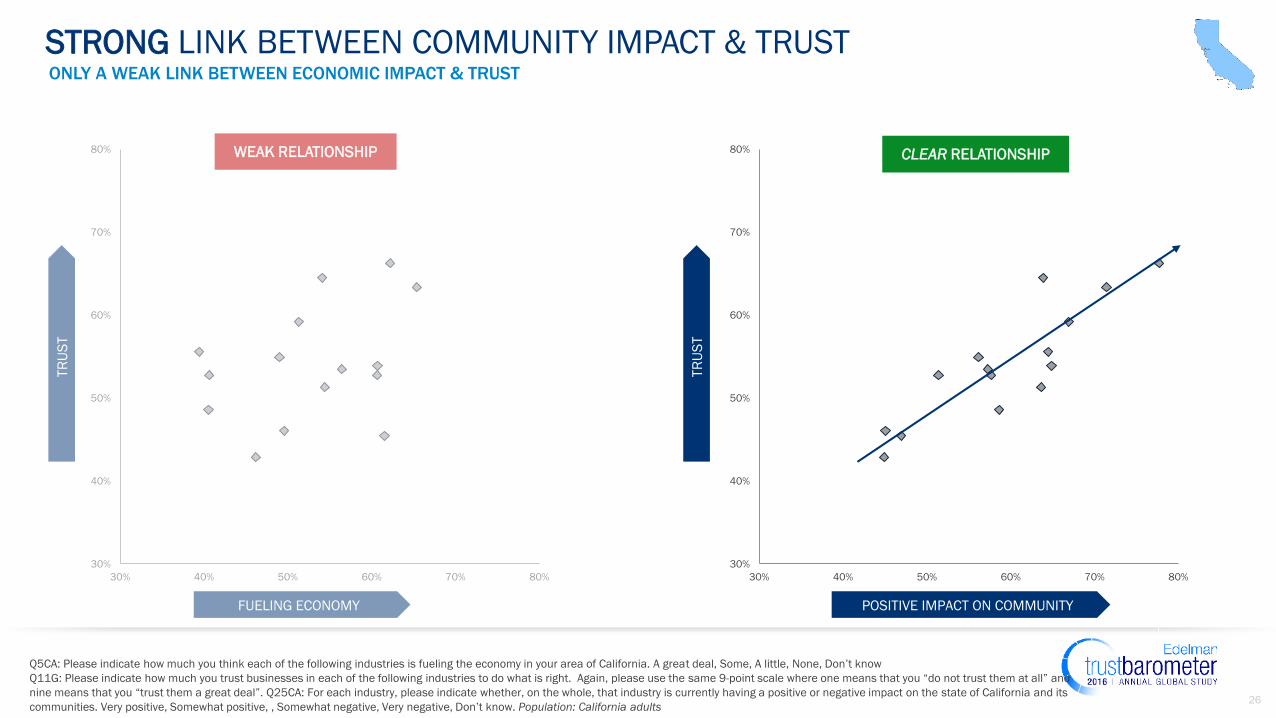
WEAK RELATIONSHIP
FUELING ECONOMY
TR
US
TONLY A WEAK LINK BETWEEN ECONOMIC IMPACT & TRUST
STRONG LINK BETWEEN COMMUNITY IMPACT & TRUST
Q5CA: Please indicate how much you think each of the following industries is fueling the economy in your area of California. A great deal, Some, A little, None, Don’t know
Q11G: Please indicate how much you trust businesses in each of the following industries to do what is right. Again, please use the same 9-point scale where one means that you “do not trust them at all” and
nine means that you “trust them a great deal”. Q25CA: For each industry, please indicate whether, on the whole, that industry is currently having a positive or negative impact on the state of California and its
communities. Very positive, Somewhat positive, , Somewhat negative, Very negative, Don’t know. Population: California adults
30%
40%
50%
60%
70%
80%
30% 40% 50% 60% 70% 80%
30%
40%
50%
60%
70%
80%
30% 40% 50% 60% 70% 80%
TR
US
T
POSITIVE IMPACT ON COMMUNITY
CLEAR RELATIONSHIP
27
CALIFORNIA ISSUES
28Q2: Which of the following state issues do you think is the most important for California’s Governor and State Legislature to address? Population: California adults
THE DROUGHT LOOMS LARGE IN CA POLITICS, SURPASSING THE ECONOMY
19%
18%
9%
7%
7%
6%
6%
5%
5%
4%
3%
3%
3%
2%
2%
1%
Water/drought
The economy
Immigration
The state budget
Education
Taxes
Homelessness
Health care
Crime
Housing
Income inequality
Infrastructure
Public trust in law enforcement
Other
Mental illness
Innovation
+8 since 2015
Economy < drought because
few in the Bay Area cite the
economy as a problem to fix,
while drought concerns are
high across the board
ECONOMY PERCEIVED TO BE MORE PROBLEMATIC OUTSIDE THE BAY AREA
29
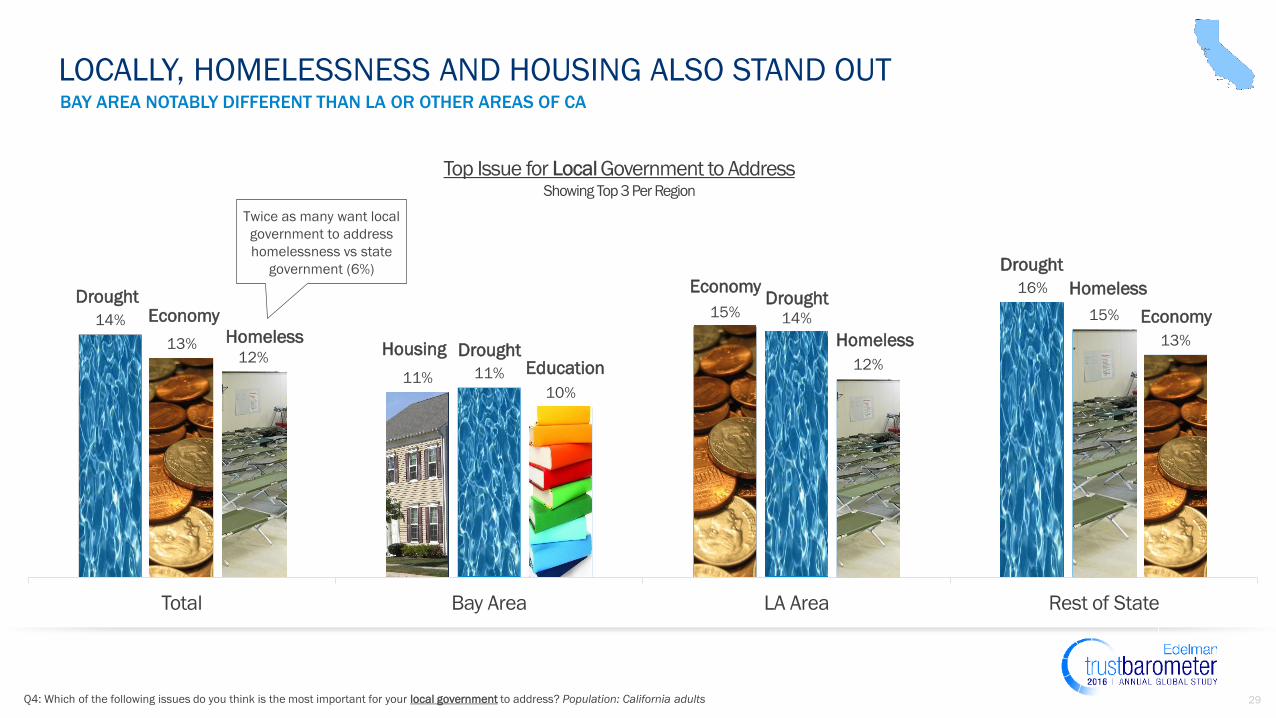
BAY AREA NOTABLY DIFFERENT THAN LA OR OTHER AREAS OF CA
Q4: Which of the following issues do you think is the most important for your local government to address? Population: California adults
LOCALLY, HOMELESSNESS AND HOUSING ALSO STAND OUT
14%
11%
15%
16%
13%
11%
14% 15%
12%
10%
12%
13%
Total Bay Area LA Area Rest of State
EconomyDrought
Economy
Homeless HomelessDrought
Drought
Drought
Homeless
Economy
HousingEducation
Twice as many want local
government to address
homelessness vs state
government (6%)
30
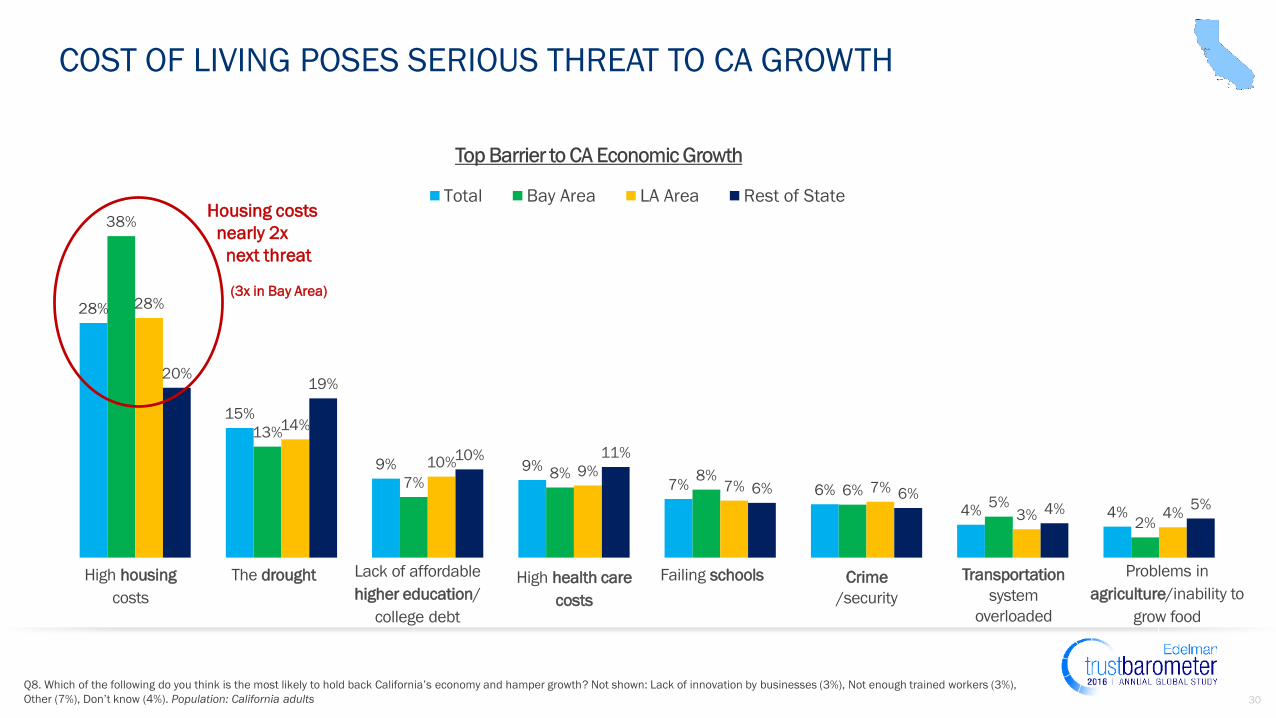
Q8. Which of the following do you think is the most likely to hold back California’s economy and hamper growth? Not shown: Lack of innovation by businesses (3%), Not enough trained workers (3%),
Other (7%), Don’t know (4%). Population: California adults
COST OF LIVING POSES SERIOUS THREAT TO CA GROWTH
28%
15%
9% 9%
7% 6%
4% 4%
38%
13%
7%8% 8%
6%5%
2%
28%
14%
10%9%
7% 7%
3% 4%
20%19%
10% 11%
6% 6%4% 5%
Total Bay Area LA Area Rest of State
Crime
/security
High housing
costs
The drought Lack of affordable
higher education/
college debt
High health care
costs
Failing schools Transportation
system
overloaded
Problems in
agriculture/inability to
grow food
Housing costs
nearly 2x
next threat
(3x in Bay Area)
31
INEQUALITY
A GLOBAL PHENOMENON
Source: 2016 Edelman Trust Barometer. The Trust Index is an average of a country’s trust in the institutions of government, business, media and NGOs,
28-country global total. 3
2
Trust Index, Informed Public vs. Mass Population,
15 countries with double-digit trust gaps in 2016
Country
Informed
Public
Mass
Population Gap
U.S. 64 45 19
U.K. 57 40 17
France 55 39 16
India 78 62 16
Australia 63 47 16
Mexico 72 57 15
Italy 58 47 11
China 82 71 11
Brazil 58 48 10
Ireland 49 39 10
Netherlands 62 52 10
Sweden 46 36 10
S. Africa 54 44 10
S. Korea 50 40 10
Singapore 72 62 10
33
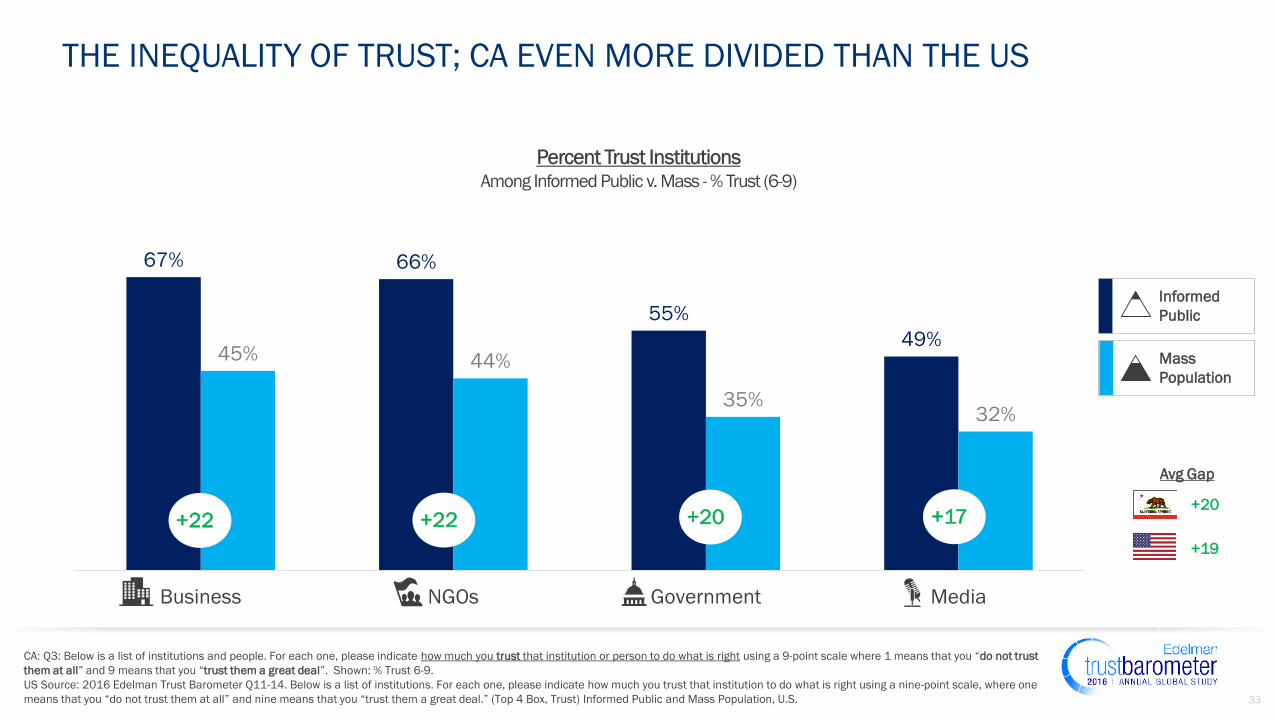
THE INEQUALITY OF TRUST; CA EVEN MORE DIVIDED THAN THE US
CA: Q3: Below is a list of institutions and people. For each one, please indicate how much you trust that institution or person to do what is right using a 9-point scale where 1 means that you “do not trust
them at all” and 9 means that you “trust them a great deal”. Shown: % Trust 6-9.
US Source: 2016 Edelman Trust Barometer Q11-14. Below is a list of institutions. For each one, please indicate how much you trust that institution to do what is right using a nine-point scale, where one
means that you “do not trust them at all” and nine means that you “trust them a great deal.” (Top 4 Box, Trust) Informed Public and Mass Population, U.S.
67% 66%
55%
49%45% 44%
35%32%
Business NGOs Government Media
+22 +22 +20 +17
Informed
Public
Mass
Population
Avg Gap
+20
+19
34
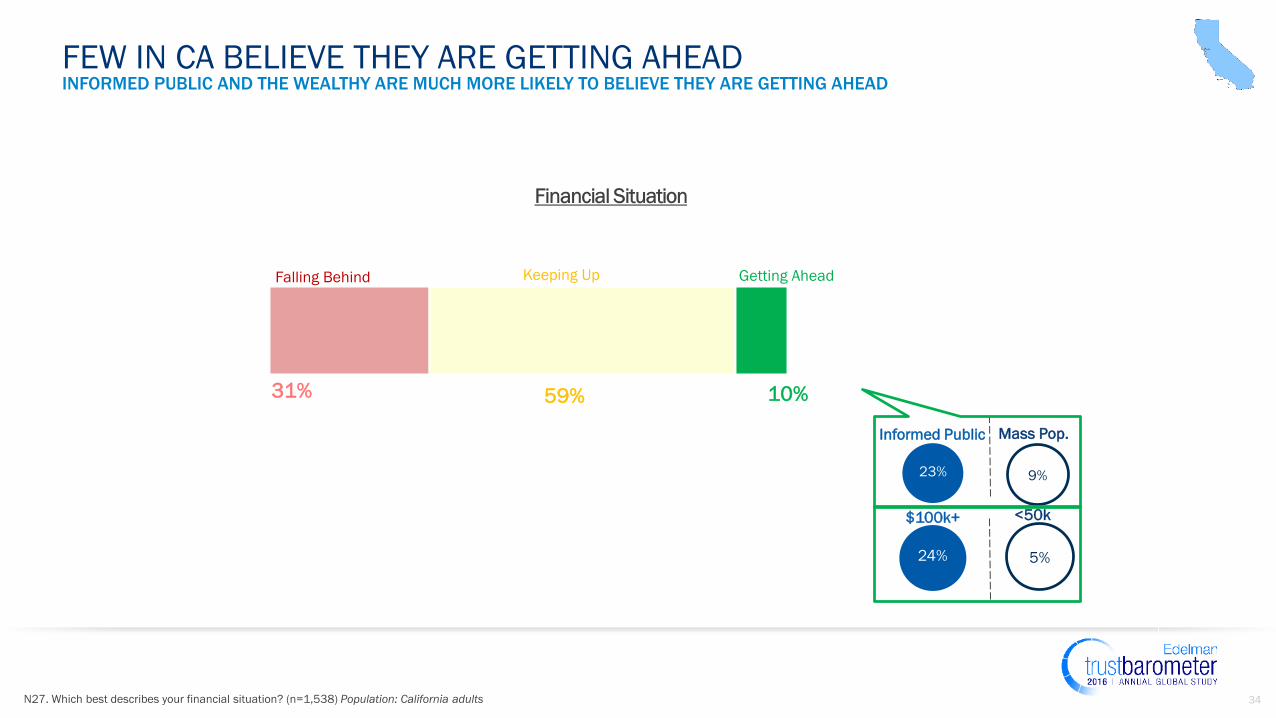
10%59%31%
N27. Which best describes your financial situation? (n=1,538) Population: California adults
FEW IN CA BELIEVE THEY ARE GETTING AHEAD
Falling Behind
INFORMED PUBLIC AND THE WEALTHY ARE MUCH MORE LIKELY TO BELIEVE THEY ARE GETTING AHEAD
Keeping Up Getting Ahead
9%
Informed Public Mass Pop.
5%
$100k+ <50k
35
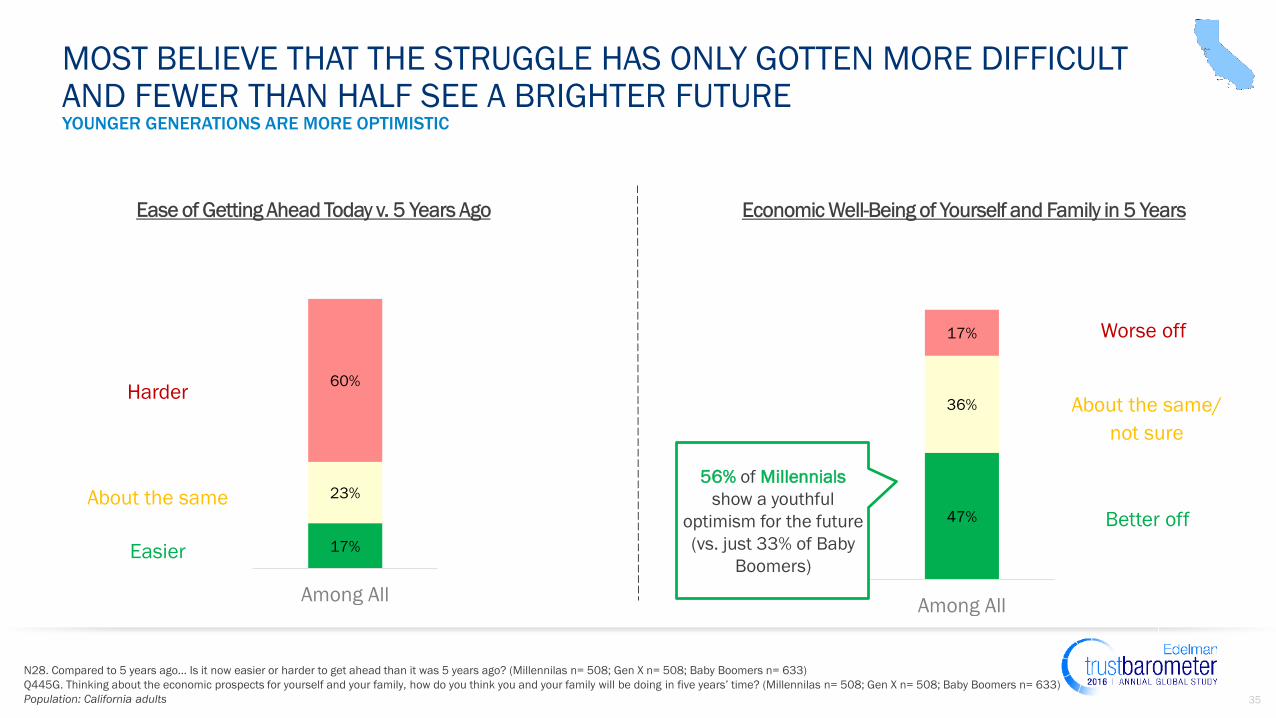
N28. Compared to 5 years ago… Is it now easier or harder to get ahead than it was 5 years ago? (Millennilas n= 508; Gen X n= 508; Baby Boomers n= 633)
Q445G. Thinking about the economic prospects for yourself and your family, how do you think you and your family will be doing in five years’ time? (Millennilas n= 508; Gen X n= 508; Baby Boomers n= 633)
Population: California adults
MOST BELIEVE THAT THE STRUGGLE HAS ONLY GOTTEN MORE DIFFICULT AND FEWER THAN HALF SEE A BRIGHTER FUTURE
17%
23%
60%
Among All
Harder
About the same
Easier
47%
36%
17%
Among All
Worse off
About the same/
not sure
Better off
56% of Millennials
show a youthful
optimism for the future
(vs. just 33% of Baby
Boomers)
YOUNGER GENERATIONS ARE MORE OPTIMISTIC
36
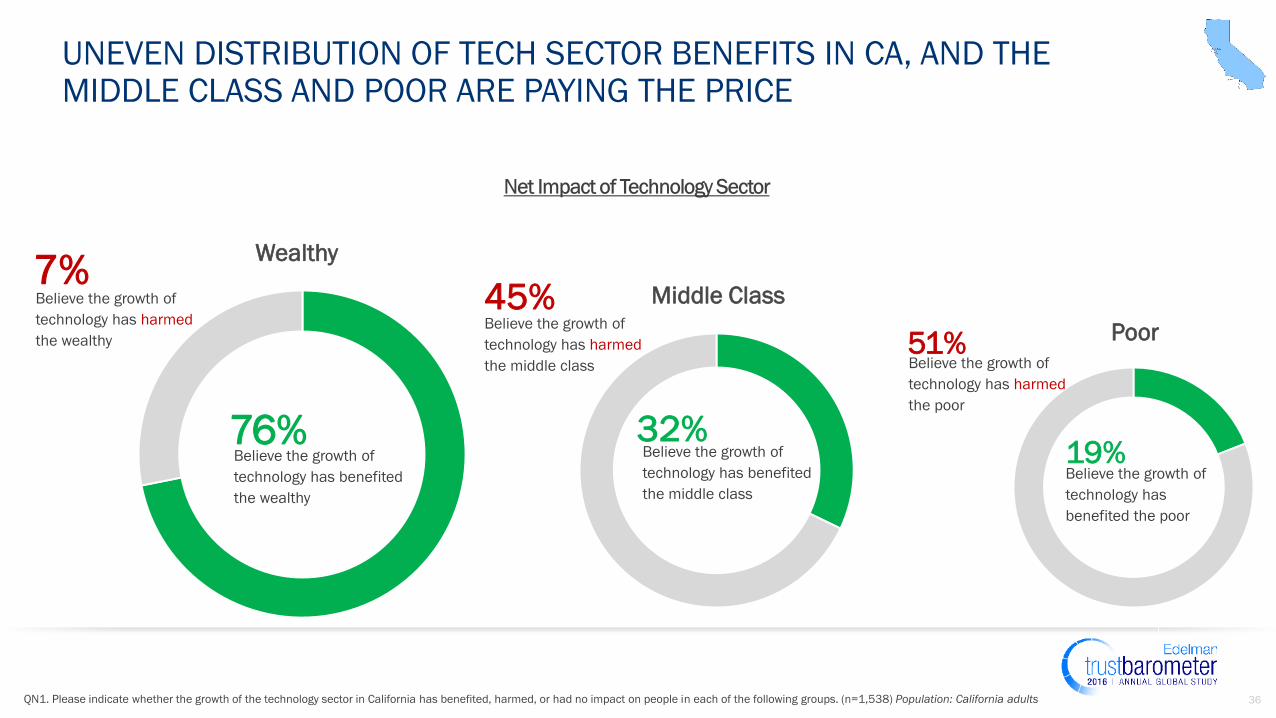
UNEVEN DISTRIBUTION OF TECH SECTOR BENEFITS IN CA, AND THE MIDDLE CLASS AND POOR ARE PAYING THE PRICE
HARMED
QN1. Please indicate whether the growth of the technology sector in California has benefited, harmed, or had no impact on people in each of the following groups. (n=1,538) Population: California adults
Wealthy
76%Believe the growth of
technology has benefited
the wealthy
Middle Class
Poor
32%19%Believe the growth of
technology has
benefited the poor
51%Believe the growth of
technology has harmed
the poor
Believe the growth of
technology has benefited
the middle class
45%Believe the growth of
technology has harmed
the middle class
7%Believe the growth of
technology has harmed
the wealthy
37
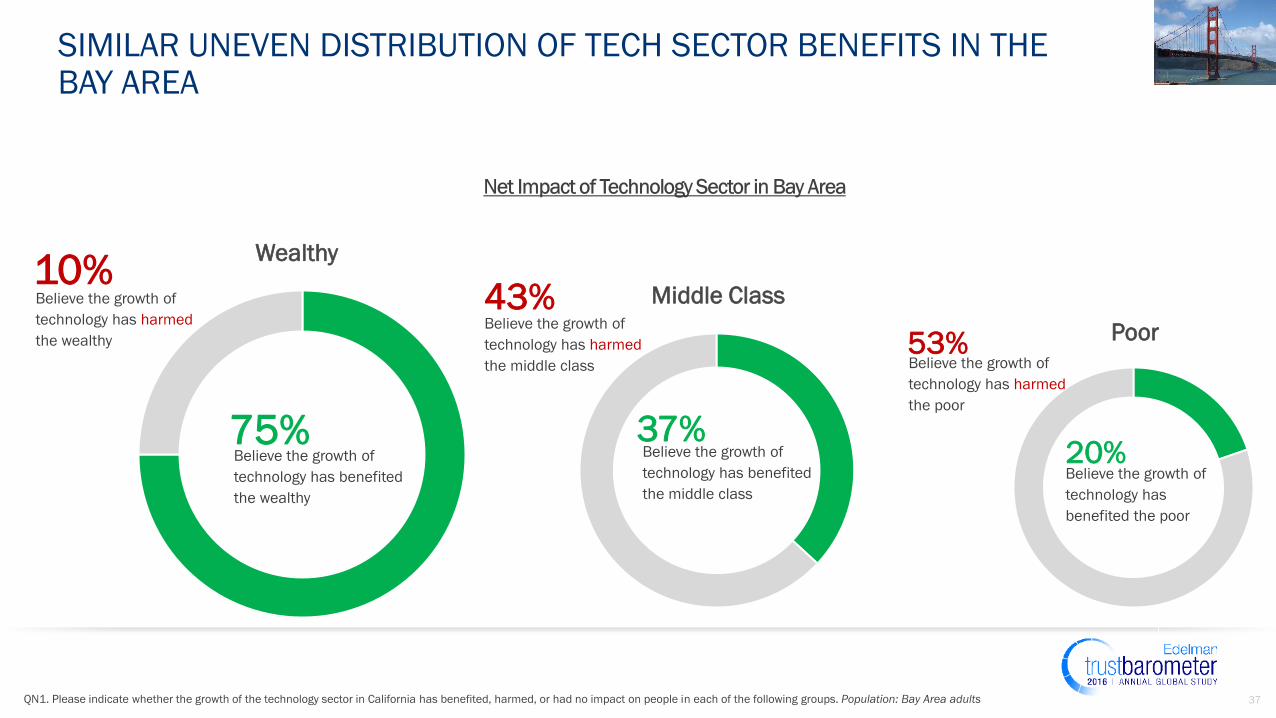
SIMILAR UNEVEN DISTRIBUTION OF TECH SECTOR BENEFITS IN THE BAY AREA
HARMED
QN1. Please indicate whether the growth of the technology sector in California has benefited, harmed, or had no impact on people in each of the following groups. Population: Bay Area adults
Wealthy
75%Believe the growth of
technology has benefited
the wealthy
Middle Class
Poor
37%20%Believe the growth of
technology has
benefited the poor
53%Believe the growth of
technology has harmed
the poor
Believe the growth of
technology has benefited
the middle class
43%Believe the growth of
technology has harmed
the middle class
10%Believe the growth of
technology has harmed
the wealthy
38
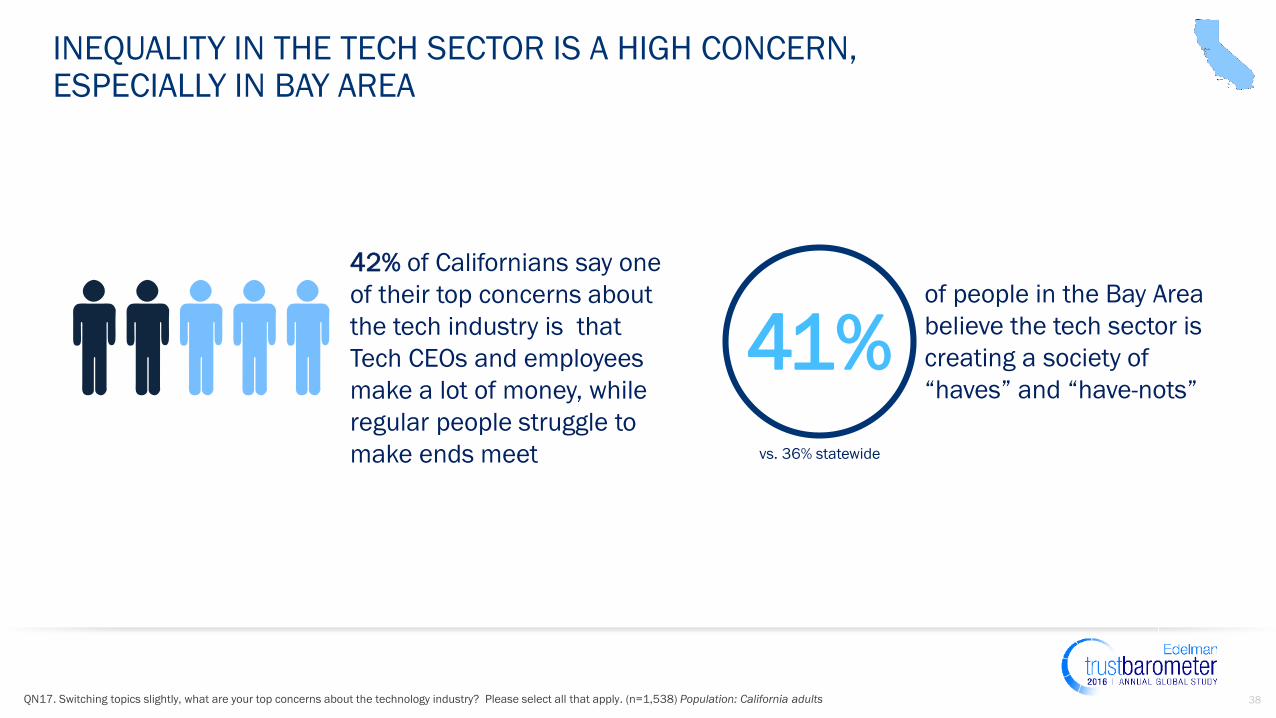
INEQUALITY IN THE TECH SECTOR IS A HIGH CONCERN, ESPECIALLY IN BAY AREA
QN17. Switching topics slightly, what are your top concerns about the technology industry? Please select all that apply. (n=1,538) Population: California adults
42% of Californians say one
of their top concerns about
the tech industry is that
Tech CEOs and employees
make a lot of money, while
regular people struggle to
make ends meet
41%of people in the Bay Area
believe the tech sector is
creating a society of
“haves” and “have-nots”
vs. 36% statewide
39
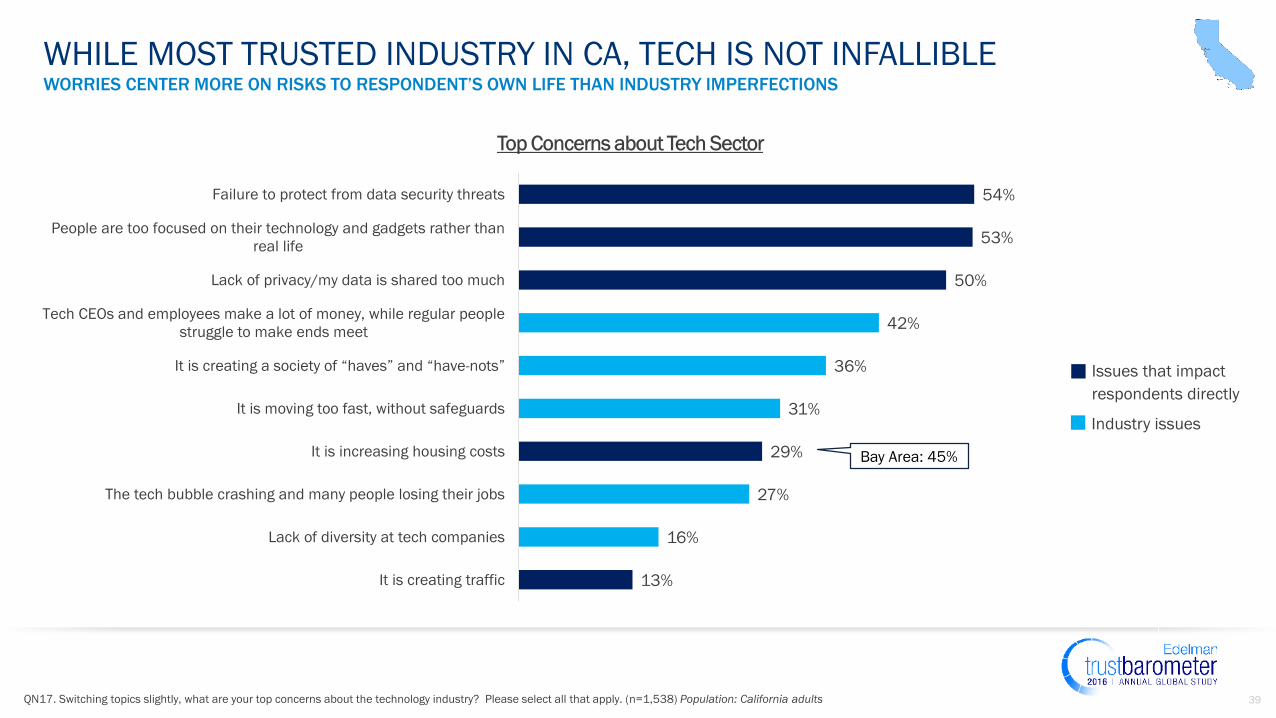
WHILE MOST TRUSTED INDUSTRY IN CA, TECH IS NOT INFALLIBLE
54%
53%
50%
42%
36%
31%
29%
27%
16%
13%
Failure to protect from data security threats
People are too focused on their technology and gadgets rather than
real life
Lack of privacy/my data is shared too much
Tech CEOs and employees make a lot of money, while regular people
struggle to make ends meet
It is creating a society of “haves” and “have-nots”
It is moving too fast, without safeguards
It is increasing housing costs
The tech bubble crashing and many people losing their jobs
Lack of diversity at tech companies
It is creating traffic
QN17. Switching topics slightly, what are your top concerns about the technology industry? Please select all that apply. (n=1,538) Population: California adults
Industry issues
Issues that impact
respondents directly
Bay Area: 45%
WORRIES CENTER MORE ON RISKS TO RESPONDENT’S OWN LIFE THAN INDUSTRY IMPERFECTIONS

40
ROLE OF BUSINESS
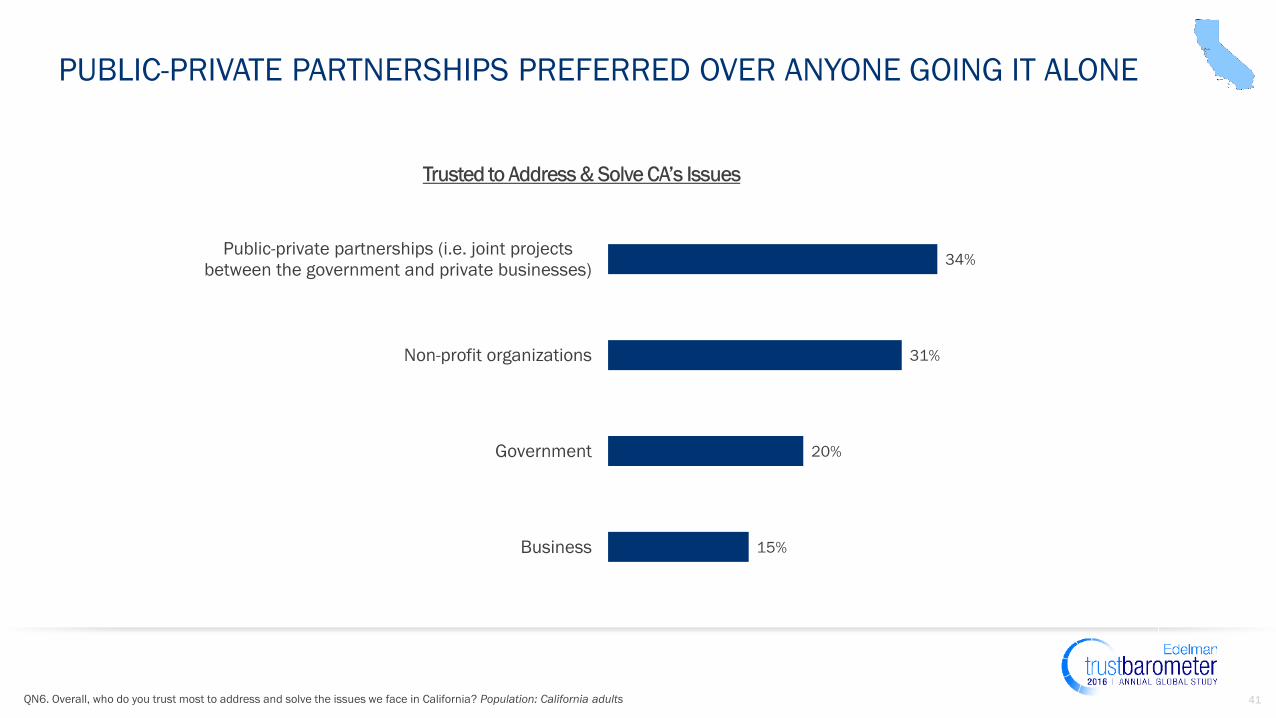
41QN6. Overall, who do you trust most to address and solve the issues we face in California? Population: California adults
PUBLIC-PRIVATE PARTNERSHIPS PREFERRED OVER ANYONE GOING IT ALONE
34%
31%
20%
15%
Public-private partnerships (i.e. joint projects
between the government and private businesses)
Non-profit organizations
Government
Business
42
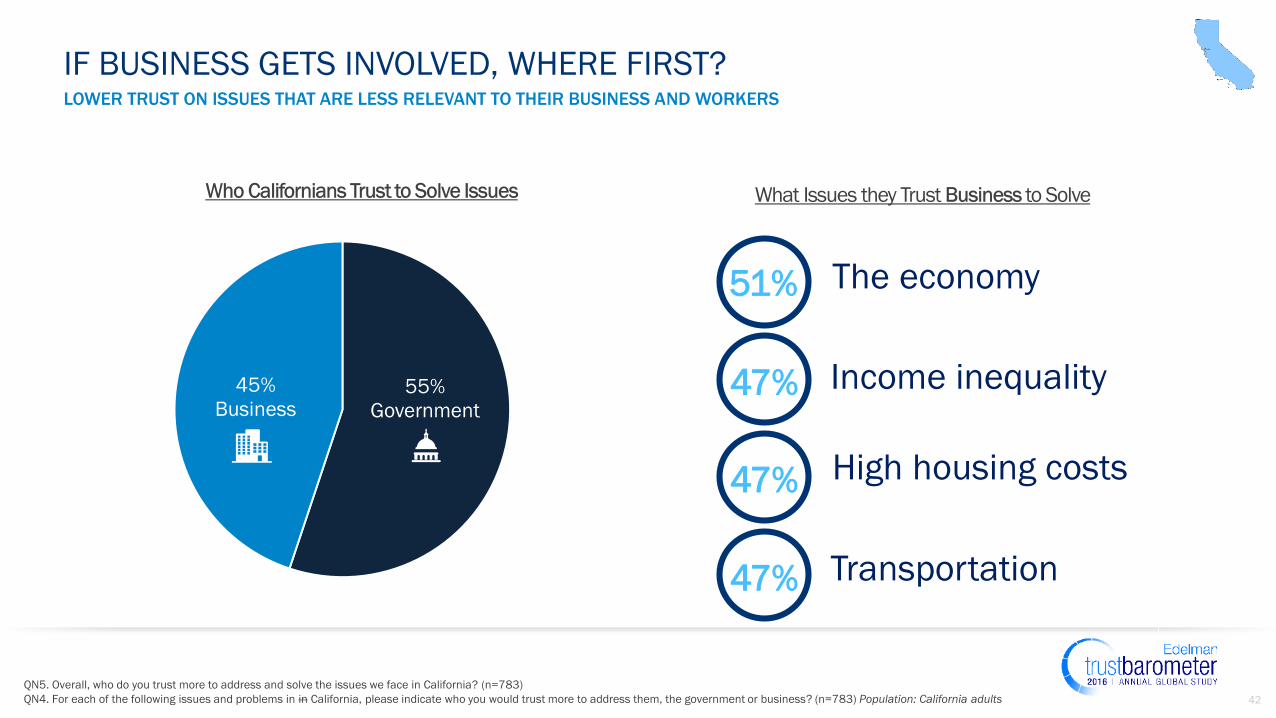
LOWER TRUST ON ISSUES THAT ARE LESS RELEVANT TO THEIR BUSINESS AND WORKERS
QN5. Overall, who do you trust more to address and solve the issues we face in California? (n=783)
QN4. For each of the following issues and problems in in California, please indicate who you would trust more to address them, the government or business? (n=783) Population: California adults
IF BUSINESS GETS INVOLVED, WHERE FIRST?
55%
Government
45%
Business
47%
47%
51%
47%
The economy
Income inequality
High housing costs
Transportation

43
CEOS
44
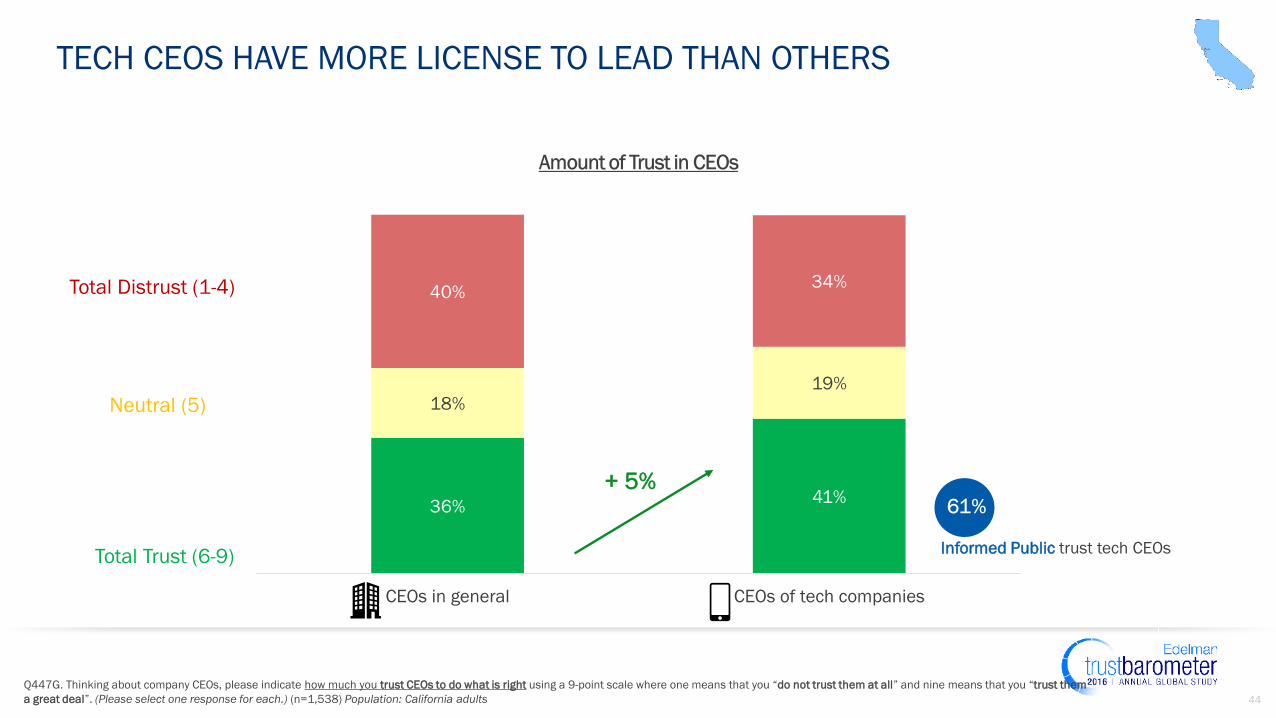
TECH CEOS HAVE MORE LICENSE TO LEAD THAN OTHERS
Q447G. Thinking about company CEOs, please indicate how much you trust CEOs to do what is right using a 9-point scale where one means that you “do not trust them at all” and nine means that you “trust them
a great deal”. (Please select one response for each.) (n=1,538) Population: California adults
36%41%
18%19%
40%34%
CEOs in general CEOs of tech companies
+ 5%
Total Distrust (1-4)
Neutral (5)
Total Trust (6-9)Informed Public trust tech CEOs
45
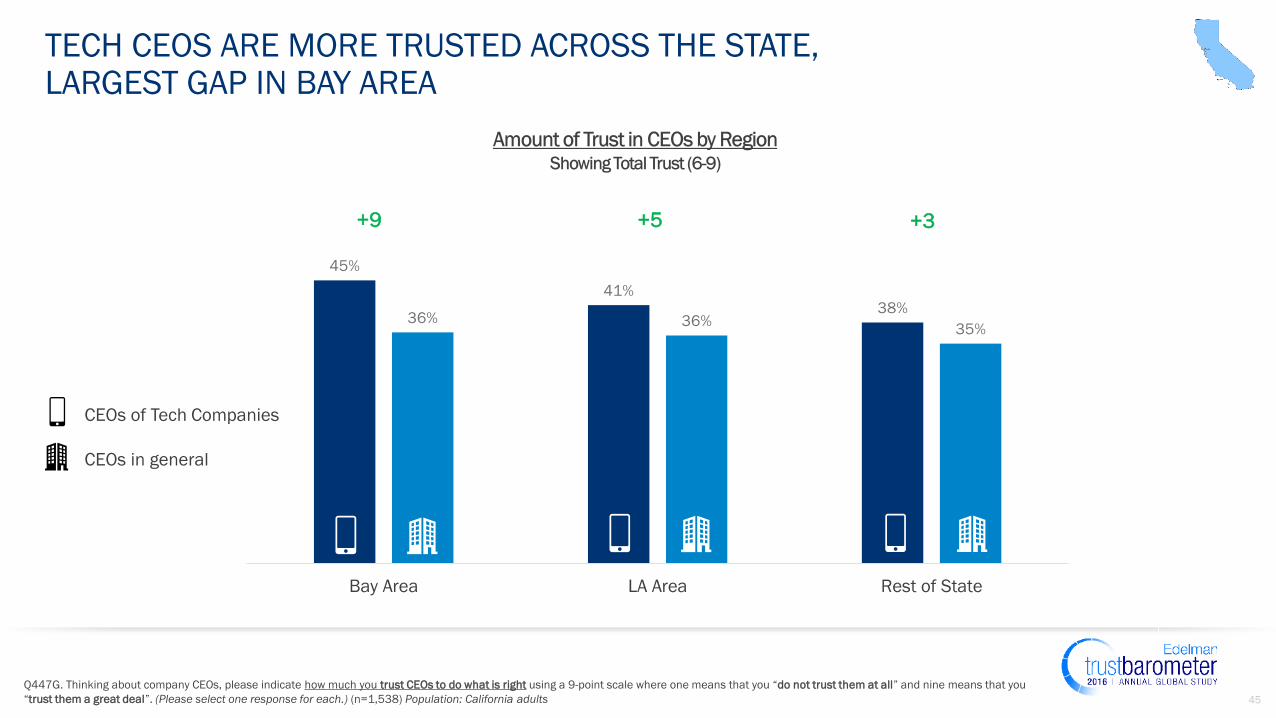
TECH CEOS ARE MORE TRUSTED ACROSS THE STATE, LARGEST GAP IN BAY AREA
Q447G. Thinking about company CEOs, please indicate how much you trust CEOs to do what is right using a 9-point scale where one means that you “do not trust them at all” and nine means that you
“trust them a great deal”. (Please select one response for each.) (n=1,538) Population: California adults
45%
41%38%
36% 36%35%
Bay Area LA Area Rest of State
CEOs in general
CEOs of Tech Companies
+9 +5 +3
46
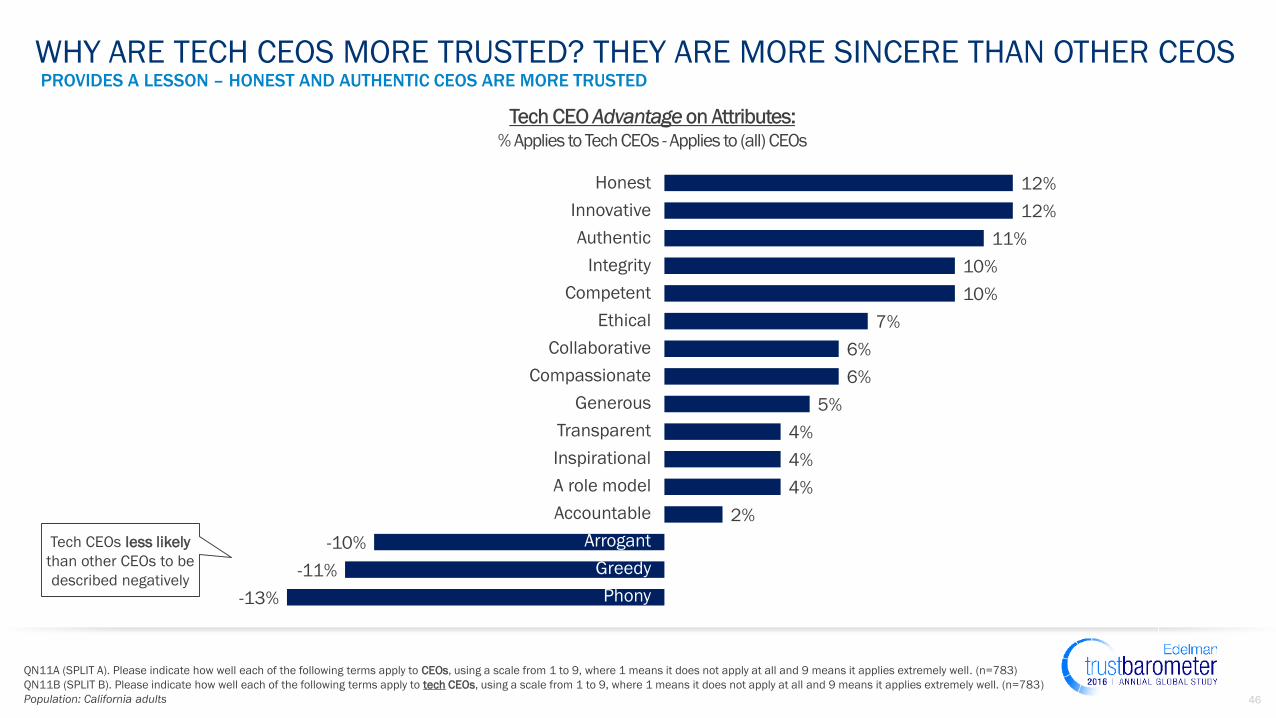
WHY ARE TECH CEOS MORE TRUSTED? THEY ARE MORE SINCERE THAN OTHER CEOS
QN11A (SPLIT A). Please indicate how well each of the following terms apply to CEOs, using a scale from 1 to 9, where 1 means it does not apply at all and 9 means it applies extremely well. (n=783)
QN11B (SPLIT B). Please indicate how well each of the following terms apply to tech CEOs, using a scale from 1 to 9, where 1 means it does not apply at all and 9 means it applies extremely well. (n=783)
Population: California adults
12%
12%
11%
10%
10%
7%
6%
6%
5%
4%
4%
4%
2%
-10%
-11%
-13%
Tech CEOs less likely
than other CEOs to be
described negatively
Honest
Innovative
Authentic
Integrity
Competent
Ethical
Collaborative
Compassionate
Generous
Transparent
Inspirational
A role model
Accountable
Arrogant
Greedy
Phony
PROVIDES A LESSON – HONEST AND AUTHENTIC CEOS ARE MORE TRUSTED
47
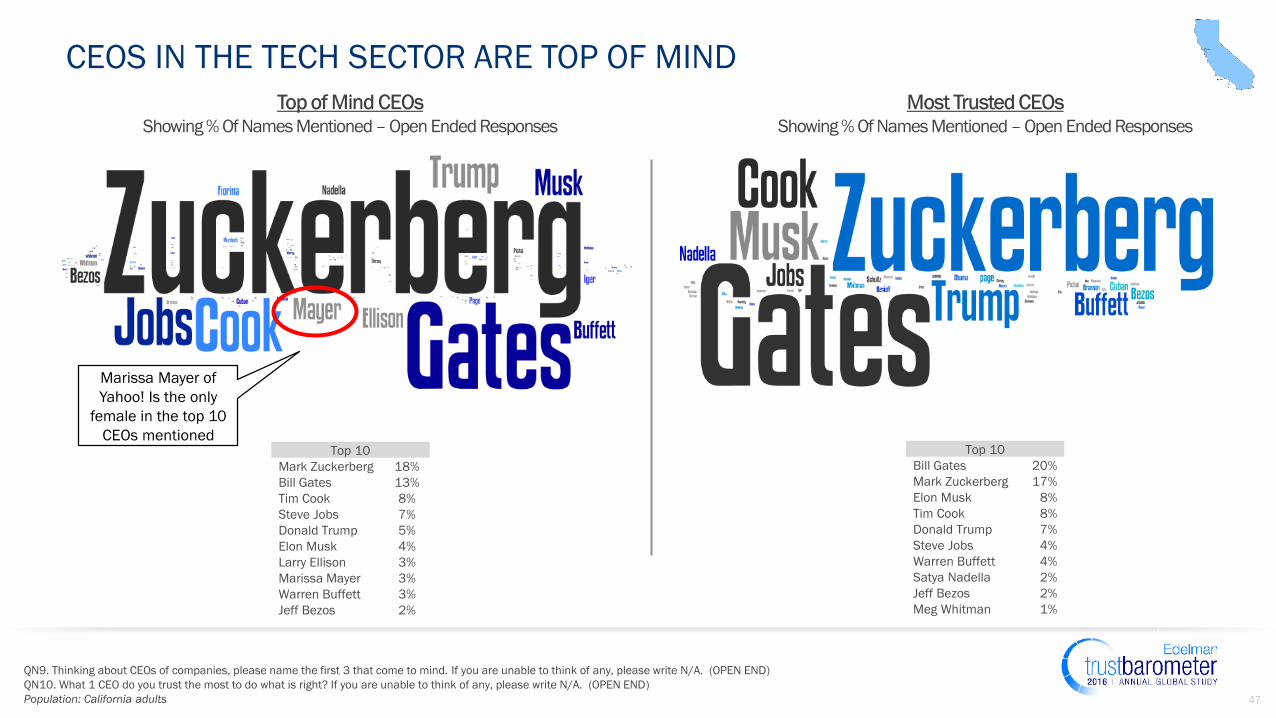
CEOS IN THE TECH SECTOR ARE TOP OF MIND
QN9. Thinking about CEOs of companies, please name the first 3 that come to mind. If you are unable to think of any, please write N/A. (OPEN END)
QN10. What 1 CEO do you trust the most to do what is right? If you are unable to think of any, please write N/A. (OPEN END)
Population: California adults
Marissa Mayer of
Yahoo! Is the only
female in the top 10
CEOs mentioned Top 10
Mark Zuckerberg 18%
Bill Gates 13%
Tim Cook 8%
Steve Jobs 7%
Donald Trump 5%
Elon Musk 4%
Larry Ellison 3%
Marissa Mayer 3%
Warren Buffett 3%
Jeff Bezos 2%
Top 10
Bill Gates 20%
Mark Zuckerberg 17%
Elon Musk 8%
Tim Cook 8%
Donald Trump 7%
Steve Jobs 4%
Warren Buffett 4%
Satya Nadella 2%
Jeff Bezos 2%
Meg Whitman 1%
48
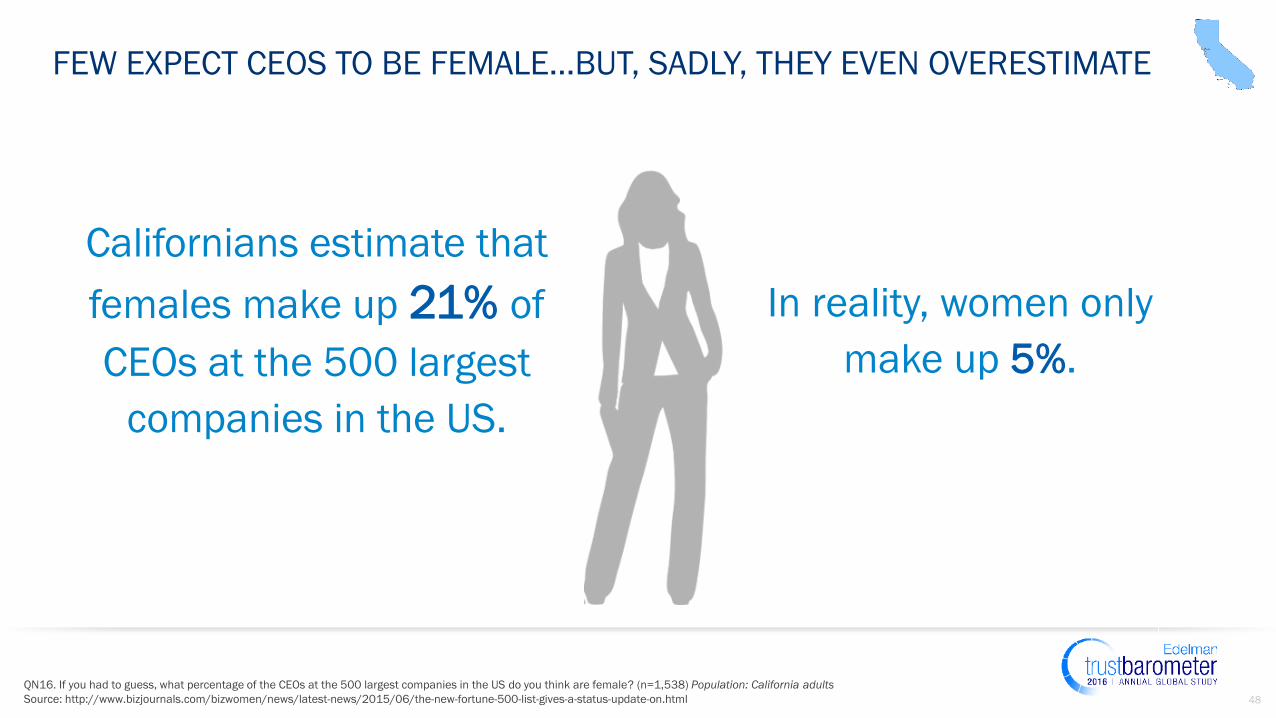
FEW EXPECT CEOS TO BE FEMALE…BUT, SADLY, THEY EVEN OVERESTIMATE
QN16. If you had to guess, what percentage of the CEOs at the 500 largest companies in the US do you think are female? (n=1,538) Population: California adults
Source: http://www.bizjournals.com/bizwomen/news/latest-news/2015/06/the-new-fortune-500-list-gives-a-status-update-on.html
Californians estimate that
females make up 21% of
CEOs at the 500 largest
companies in the US.
In reality, women only
make up 5%.