2 Specifications of National Reporting Tables€¦ · Web viewUN ECONOMIC COMMISSION FOR EUROPE....
125
UN ECONOMIC COMMISSION FOR EUROPE FOOD AND AGRICULTURE ORGANIZATION MINISTERIAL CONFERENCE ON THE PROTECTION OF FORESTS IN EUROPE —————————————————————————————————————————— —————————————————————————————————————————— Enquiry State of Forests and Sustainable Forest Management in Europe 2011 NATIONAL DATA REPORTING FORMS on PAN-EUROPEAN INDICATORS FOR SUSTAINABLE FOREST MANAGEMENT Quantitative indicators collected and/or validated through UNECE/FAO, Geneva 1
Transcript of 2 Specifications of National Reporting Tables€¦ · Web viewUN ECONOMIC COMMISSION FOR EUROPE....
UN ECONOMIC COMMISSION FOR EUROPE FOOD AND AGRICULTURE ORGANIZATION
MINISTERIAL CONFERENCE ON THE PROTECTION OF FORESTS IN EUROPE——————————————————————————————————————————
——————————————————————————————————————————
Enquiry State of Forests and Sustainable Forest Management in Europe 2011
NATIONAL DATA REPORTING FORMS on
PAN-EUROPEAN INDICATORS FOR SUSTAINABLE FOREST MANAGEMENT
Quantitative indicatorscollected and/or validated through UNECE/FAO, Geneva
COUNTRY:
Date of submission:
United Nations, Geneva5 February 2010
1
Enquiry on improved Pan-European Indicators for Sustainable Forest Management - 2011 final
National correspondent:Name:
Organisation:Address:
Phone/Fax:E-mail:
Other professionals involved in the reporting process:Name:
Organisation:E-mail:
Name:
Organisation:E-mail:Name:
Organisation:E-mail:
Name:
Organisation:E-mail:
Name:
Organisation:E-mail:
2
Enquiry on improved Pan-European Indicators for Sustainable Forest Management - 2011 final
Table of contentsIntroduction...............................................................................................................................................................4
Summary Table for Improved Pan-European Indicators for SFM - quantitative indicators...................................7
Reporting Form 1.1a: Forest area...........................................................................................................................11
Reporting Form 1.1b: Forest area by forest types...................................................................................................12
Reporting Form 1.2a: Growing stock.....................................................................................................................13
Reporting Form 1.2b: Growing stock on forest by forest type...............................................................................14
Reporting Form 1.3a: Age structure.......................................................................................................................15
Reporting Form 1.3b: Diameter distribution...........................................................................................................16
Reporting Form 1.4: Carbon stock..........................................................................................................................17
Indicator 2.1: Deposition of air pollutants..............................................................................................................19
Indicator 2.2: Soil condition....................................................................................................................................19
Indicator 2.3: Defoliation........................................................................................................................................19
Reporting Form 2.4: Forest damage.......................................................................................................................20
Reporting Form 3.1: Increment and fellings...........................................................................................................22
Reporting Form 3.2: Roundwood...........................................................................................................................23
Reporting Form 3.3: Non-wood goods...................................................................................................................25
Reporting Form 3.4: Services.................................................................................................................................27
Reporting Form 3.5: Forests under management plans..........................................................................................29
Reporting Form 4.1: Tree species composition......................................................................................................30
Reporting Form 4.2: Regeneration..........................................................................................................................31
Reporting Form 4.3: Naturalness............................................................................................................................33
Reporting Form 4.4: Introduced tree species..........................................................................................................34
Reporting Form 4.5: Deadwood..............................................................................................................................36
Indicator 4.6: Genetic resources..............................................................................................................................38
Indicator 4.7: Landscape pattern.............................................................................................................................38
Reporting Form 4.8: Threatened forest species......................................................................................................39
Reporting Form 4.9: Protected forests....................................................................................................................41
Reporting Form 5.1: Protective forests – soil, water and other ecosystem functions.............................................43
Reporting Form 5.2: Protective forests – infrastructure and managed natural resources......................................44
Reporting Form 6.1: Forest holdings......................................................................................................................45
Reporting Form 6.2: Contribution of forest sector to GDP....................................................................................47
Reporting Form 6.3: Net revenue...........................................................................................................................49
Reporting Form 6.4: Expenditures for services......................................................................................................50
Reporting Form 6.5: Forest sector workforce.........................................................................................................52
Reporting Form 6.6: Occupational safety and health..............................................................................................54
Indicator 6.7: Wood consumption...........................................................................................................................55
Indicator 6.8: Trade in wood...................................................................................................................................55
Reporting Form 6.9: Energy from wood.................................................................................................................56
Reporting Form 6.10: Accessibility for recreation.................................................................................................58
Reporting Form 6.11: Cultural and spiritual values................................................................................................59
Terms and definitions..............................................................................................................................................60
Annex - Guidelines on new European Forest Types and set of tables for voluntary pilot reporting......................77
3
Enquiry on improved Pan-European Indicators for Sustainable Forest Management - 2011 final
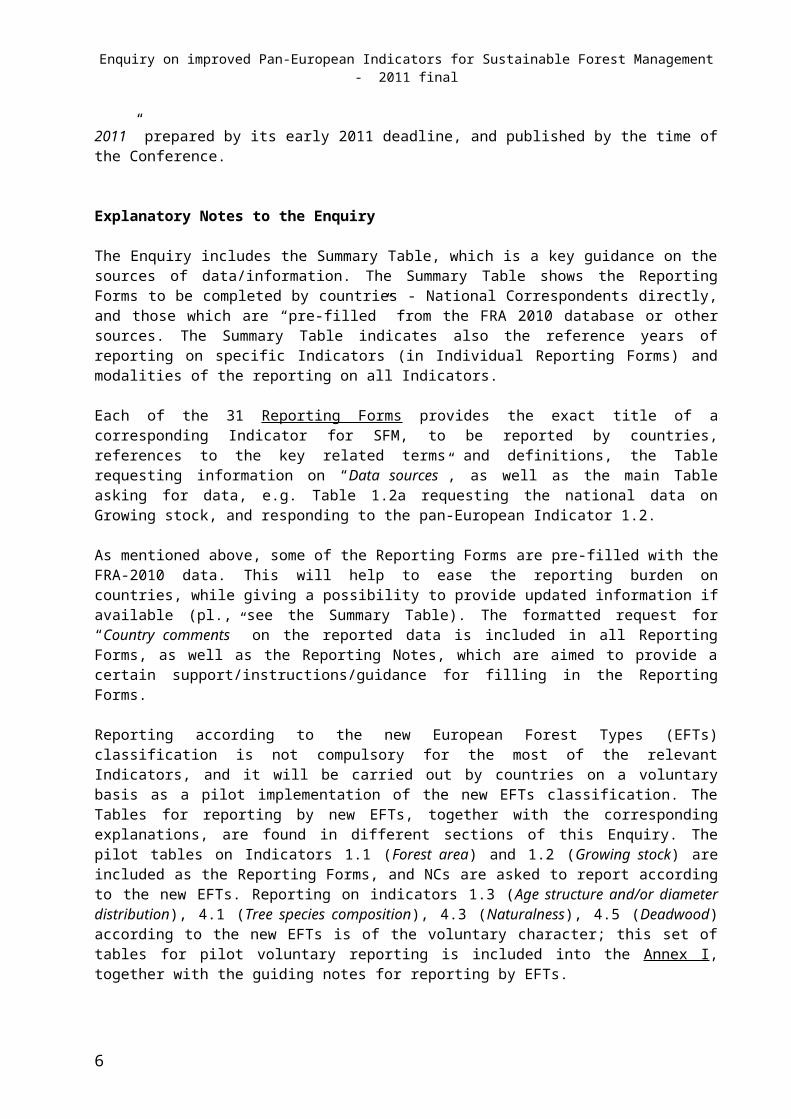
Introduction
The next Ministerial Conference on the Protection of Forests in Europe1 is planned to be held in June 2011 in Oslo, Norway. Traditionally, the comprehensive Report on Sustainable Forest Management (SFM) in Europe “State of Europe’s Forests” – SoEF 2011 will be presented to the Conference. The Report is to be elaborated on the basis of the data and information received from countries (National Correspondents), as well as from UNECE/FAO and FAO databases and from other International Data Providers (IDPs). The main instrument for the data collection (quantitative indicators) for this round of reporting on the pan-European Criteria and Indicators (C&I) for SFM2 will be the present Enquiry, as well as the information received from IDPs to be prepared along the agreed Technical Specifications (available in the secretariat and corresponding IDPs).
The currently proposed Enquiry (Main Questionnaire) addresses all the pan-European C&I, taking into account that the data/information on Indicators 2.1, 2.2, 2.3, 4.6, 4.7, 6.7, and 6.8 will be provided by the International Data Providers (EC JRC, ICP Forests, Bioversity International, EUROSTAT, FAO, UNECE - JFSQ and JWEE, others). The set of Terms and Definitions supporting the Enquiry and its Reporting Forms are included.
The deadline for responses from countries with the completed Reporting Forms is the 1 May 2010. After the process of careful checking and validation of data/information, the SoEF Report writing will be started in the fall 2010, so that to have the publication “State of Europe’s Forests 2011” prepared by its early 2011 deadline, and published by the time of the Conference.
Explanatory Notes to the Enquiry
The Enquiry includes the Summary Table, which is a key guidance on the sources of data/information. The Summary Table shows the Reporting Forms to be completed by countries - National Correspondents directly, and those which are “pre-filled” from the FRA 2010 database or other sources. The Summary Table indicates also the reference years of reporting on specific Indicators (in Individual Reporting Forms) and modalities of the reporting on all Indicators.
Each of the 31 Reporting Forms provides the exact title of a corresponding Indicator for SFM, to be reported by countries, references to the key related terms and definitions, the Table requesting information on “Data sources”, as well as the main Table asking for data, e.g. Table 1.2a requesting the national data on Growing stock, and responding to the pan-European Indicator 1.2.
As mentioned above, some of the Reporting Forms are pre-filled with the FRA-2010 data. This will help to ease the reporting burden on countries, while giving a possibility to provide updated information if available (pl., see the Summary Table). The formatted request for “Country comments” on the reported data is included in all Reporting Forms, as well as the Reporting Notes, which are aimed to provide a certain support/instructions/guidance for filling in the Reporting Forms.
Reporting according to the new European Forest Types (EFTs) classification is not compulsory for the most of the relevant Indicators, and it will be carried out by countries on a voluntary basis as a pilot implementation of the new EFTs classification. The Tables for reporting by new EFTs, together with the corresponding explanations, are found in different sections of this Enquiry. The pilot tables on Indicators 1.1 (Forest area) and 1.2 (Growing stock) are included as the Reporting Forms, and NCs are asked to report according to the new EFTs. Reporting on indicators 1.3 (Age structure and/or diameter distribution), 4.1 (Tree species composition), 4.3 (Naturalness), 4.5 (Deadwood) according to the new
1 The abbreviation “MCPFE” has recently been replaced by “Forest Europe” as the brand name of the Ministerial Conference on the Protection of Forests in Europe2 „Improved Pan-European Indicators For Sustainable Forest Management”, as adopted by the MCPFE Expert Level Meeting, 7-8 October 2002, Vienna, Austria
4
Enquiry on improved Pan-European Indicators for Sustainable Forest Management - 2011 final
EFTs is of the voluntary character; this set of tables for pilot voluntary reporting is included into the Annex I, together with the guiding notes for reporting by EFTs.
When filling in a reporting table, no fields must be left blank. If an entire table is not reported upon, all fields can be left blank and the reason for not reporting should be noted under “Country comments”. When filling in a reporting table for a category where national data are missing or so weak that they cannot be used for generating some of the requested information, countries may write “n.a.” (not available) in corresponding fields in the reporting table. Knowing that no national data are available is in itself very important information and should be documented in the country report. Do not leave a table or a field blank if the requested category is not applicable for your country. In such cases “0” (zero) should be reported.
The total forest area is to be reported in Table 1.1a. For a number of other tables the distribution of total forest area by various categories is requested (Tables 1.3a & 1.3b, 4.1a, 4.2, 4.3a, 6.1, also Pilot Tables 1.1b, 1.3c & 1.3d, 4.1b and 4.3b). According to the forest definition, the forest area also includes temporarily unstocked areas (e.g. clearcuts) and smaller, more or less permanently unstocked areas (e.g. forest roads, firebreaks). There may sometimes be a problem to assign these areas to the categories in the mentioned tables, since basic forest characteristics are missing. It is still recommended that unstocked areas should be included, to obtain the same total forest area for all of these tables. In some cases it may be possible to estimate what forest type, species composition etc. existed on the location before the removal of the stand, in other cases information may be obtained about the surrounding area. If no other information is available, one solution may be to distribute the area of unstocked areas proportionally to the table categories, according to the current distribution of stocked forest area. The same problem may also apply to “other wooded land” for some of these tables. Please indicate under “Country comments” how these adjustments have been carried out, if applicable.
The data/information received directly from International Data Providers will be sent to National Correspondents for verification before the above reporting deadline (except the information on Indicators 2.2 and 4.7, which will not be reported on a country basis; they will be presented in the publication in the form of maps and/or other graphics).
Should you have any questions in the process of preparation of your country response to this Enquiry, or specific question(s) on individual Reporting Forms, please do not hesitate to contact the UNECE/FAO secretariat (pl., see the contact address below)
Documentation of data sources
References to sources of information - references to all reporting categories must be documented in each reporting form.
Data Quality: High: Excellent data quality (e.g. empirically, robust data from systematic data collection with
established routines)Medium: Good data quality (e.g. not systematic, periodic studies with widely recognized precision), high
data quality with partial coverage or good expert estimate - based on more than one source)Low: Rough estimate (about right order of magnitude)
Year(s) – reference year(s) for the inventory or other data collection, not necessarily the year of publication.
Type of inventory – National correspondents are requested to provide information on the way in which the reported data was collected, by choosing one from the following categories: national forest inventory (NFI), stand inventory (SI), managerial records (MR), mixed (M), other (O) – please specify in comments.
5
Enquiry on improved Pan-European Indicators for Sustainable Forest Management - 2011 final
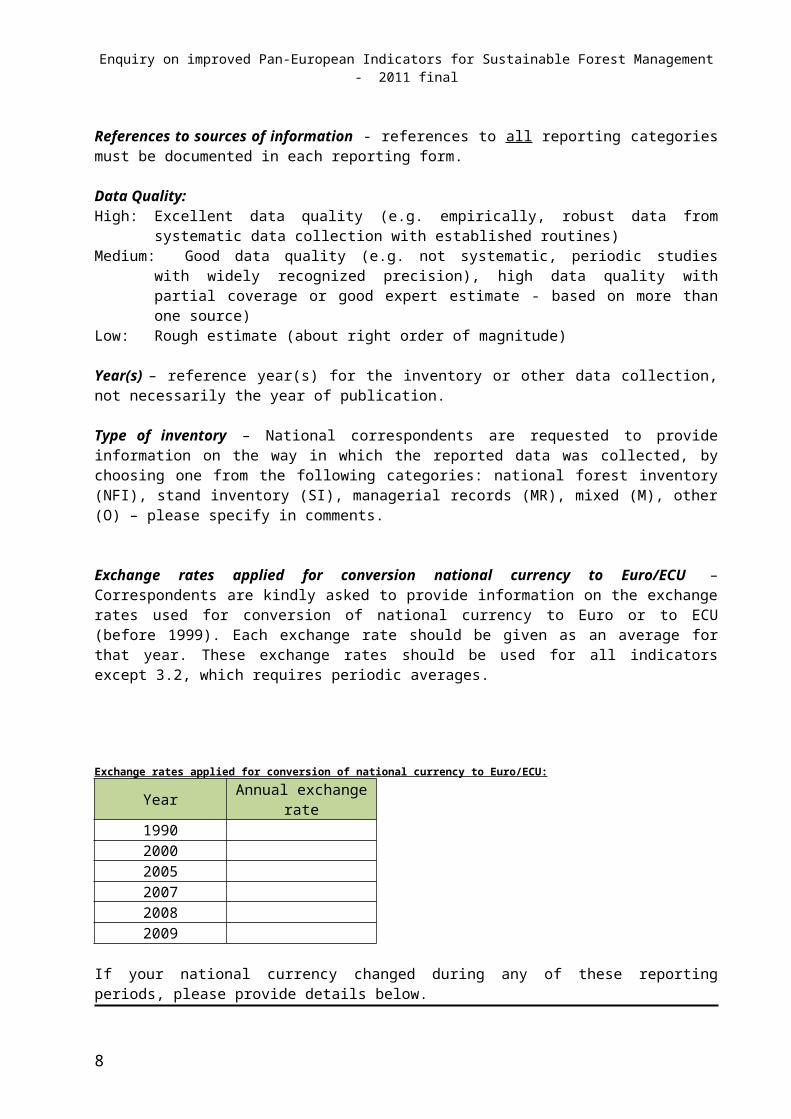
Exchange rates applied for conversion national currency to Euro/ECU – Correspondents are kindly asked to provide information on the exchange rates used for conversion of national currency to Euro or to ECU (before 1999). Each exchange rate should be given as an average for that year. These exchange rates should be used for all indicators except 3.2, which requires periodic averages.
Exchange rates applied for conversion of national currency to Euro/ECU:Year Annual exchange rate1990 2000 2005 2007 2008 2009
If your national currency changed during any of these reporting periods, please provide details below.______________________________________________________________________________________________________________________________________________________________________________________________________________________________________________________________________________________________________________________________________________________________________________________________________________________________________________________________________________________________________________________________
*************************
Contact: Mr. Roman MichalakForest Resources Officer, Timber SectionUN Economic Commission for Europe/Food and Agriculture OrganizationAddress: UNECE Trade and Timber Division,Palais des Nations, CH 1211 Geneva 10, SwitzerlandE-mail: [email protected]. + 41 22 917 2879Fax: + 41 22 917 0041Web: www.unece.org/timber
6
Enquiry on improved Pan-European Indicators for Sustainable Forest Management - 2011 final
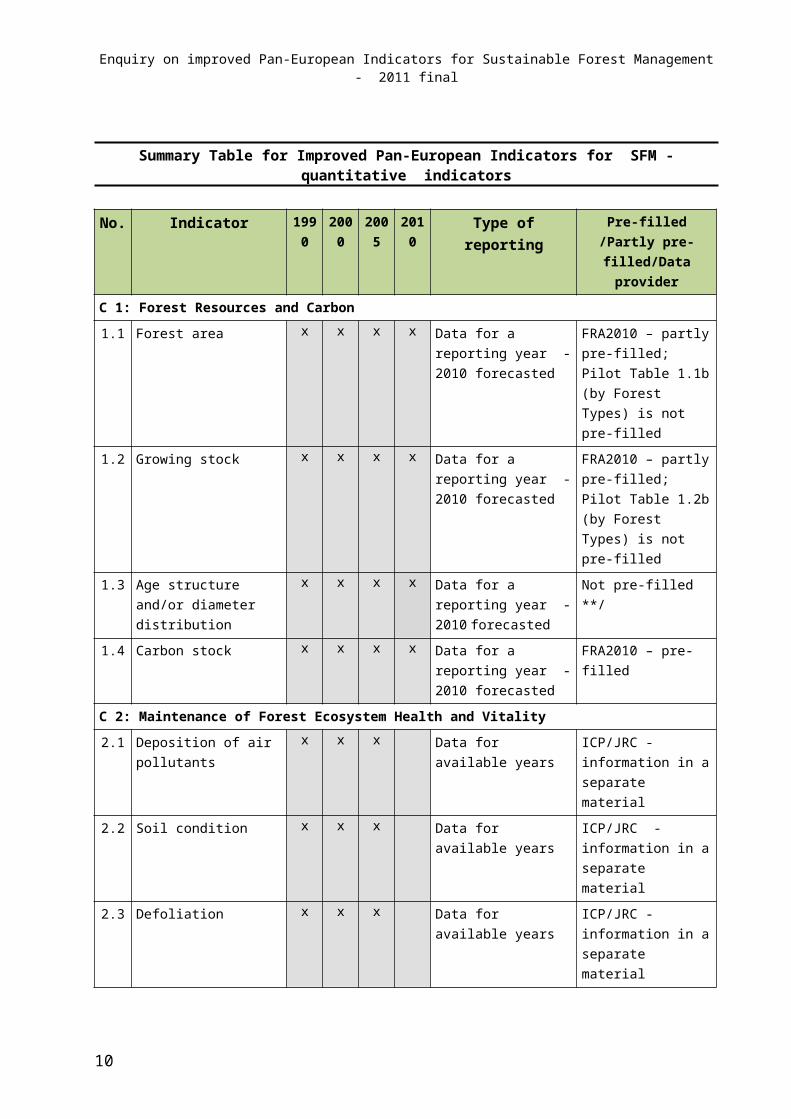
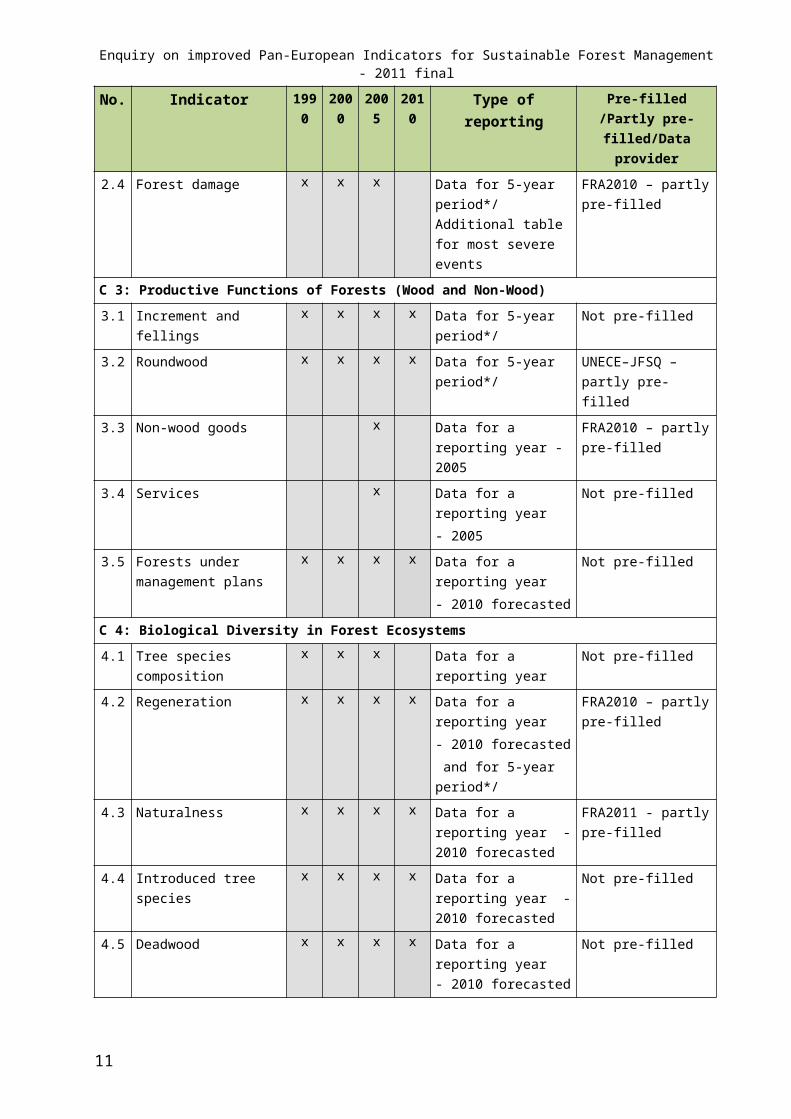
Summary Table for Improved Pan-European Indicators for SFM - quantitative indicators
No. Indicator 1990 2000 2005 2010 Type of reporting Pre-filled /Partly pre-filled/Data provider
C 1: Forest Resources and Carbon
1.1 Forest area x x x x Data for a reporting year - 2010 forecasted
FRA2010 – partly pre-filled; Pilot Table 1.1b (by Forest Types) is not pre-filled
1.2 Growing stock x x x x Data for a reporting year - 2010 forecasted
FRA2010 – partly pre-filled; Pilot Table 1.2b (by Forest Types) is not pre-filled
1.3 Age structure and/or diameter distribution
x x x x Data for a reporting year - 2010 forecasted
Not pre-filled **/
1.4 Carbon stock x x x x Data for a reporting year - 2010 forecasted
FRA2010 – pre-filled
C 2: Maintenance of Forest Ecosystem Health and Vitality
2.1 Deposition of air pollutants x x x Data for available years ICP/JRC - information in a separate material
2.2 Soil condition x x x Data for available years ICP/JRC - information in a separate material
2.3 Defoliation x x x Data for available years ICP/JRC - information in a separate material
2.4 Forest damage x x x Data for 5-year period*/ Additional table for most severe events
FRA2010 – partly pre-filled
C 3: Productive Functions of Forests (Wood and Non-Wood)
3.1 Increment and fellings x x x x Data for 5-year period*/ Not pre-filled
3.2 Roundwood x x x x Data for 5-year period*/ UNECE–JFSQ – partly pre-filled
3.3 Non-wood goods x Data for a reporting year - 2005
FRA2010 – partly pre-filled
3.4 Services x Data for a reporting year- 2005
Not pre-filled
3.5 Forests under management plans
x x x x Data for a reporting year- 2010 forecasted
Not pre-filled
C 4: Biological Diversity in Forest Ecosystems
4.1 Tree species composition x x x Data for a reporting year Not pre-filled
4.2 Regeneration x x x x Data for a reporting year- 2010 forecasted and for 5-year period*/
FRA2010 – partly pre-filled
4.3 Naturalness x x x x Data for a reporting year - 2010 forecasted
FRA2011 - partly pre-filled
4.4 Introduced tree species x x x x Data for a reporting year - 2010 forecasted
Not pre-filled
7
Enquiry on improved Pan-European Indicators for Sustainable Forest Management - 2011 final
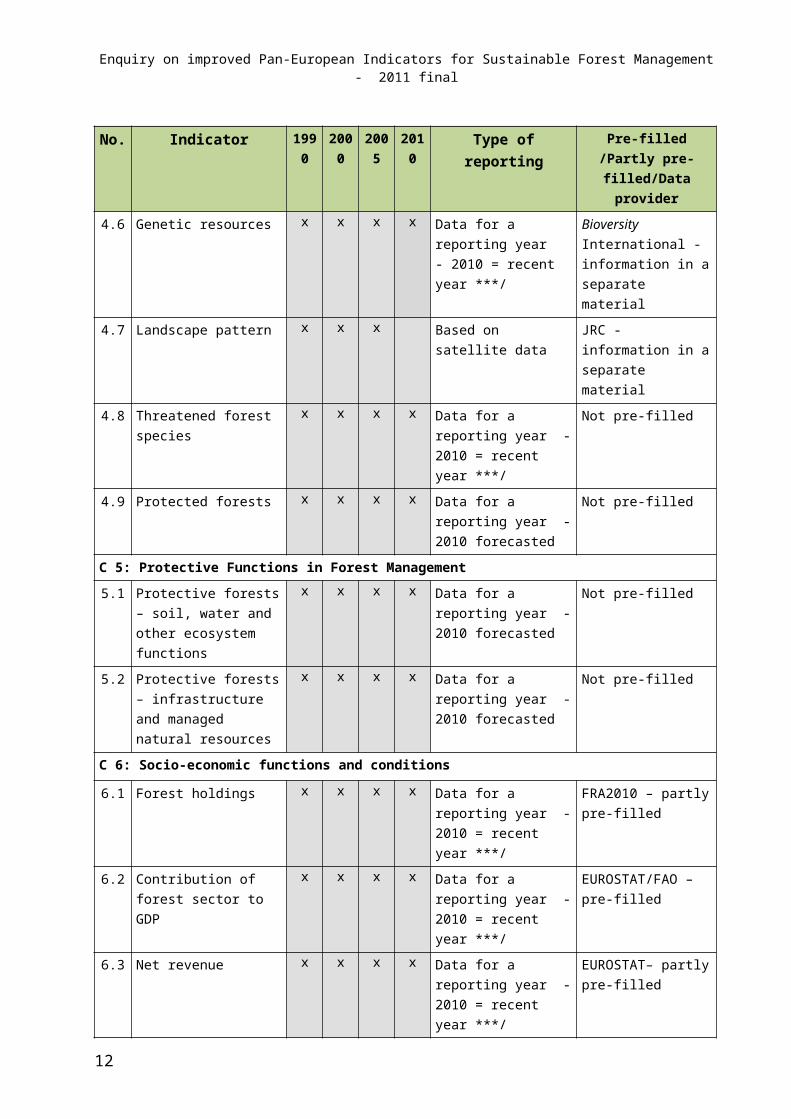
No. Indicator 1990 2000 2005 2010 Type of reporting Pre-filled /Partly pre-filled/Data provider
4.5 Deadwood x x x x Data for a reporting year - 2010 forecasted
Not pre-filled
4.6 Genetic resources x x x x Data for a reporting year - 2010 = recent year ***/
Bioversity International - information in a separate material
4.7 Landscape pattern x x x Based on satellite data JRC - information in a separate material
4.8 Threatened forest species x x x x Data for a reporting year - 2010 = recent year ***/
Not pre-filled
4.9 Protected forests x x x x Data for a reporting year - 2010 forecasted
Not pre-filled
C 5: Protective Functions in Forest Management
5.1 Protective forests – soil, water and other ecosystem functions
x x x x Data for a reporting year - 2010 forecasted
Not pre-filled
5.2 Protective forests – infrastructure and managed natural resources
x x x x Data for a reporting year - 2010 forecasted
Not pre-filled
C 6: Socio-economic functions and conditions
6.1 Forest holdings x x x x Data for a reporting year - 2010 = recent year ***/
FRA2010 – partly pre-filled
6.2 Contribution of forest sector to GDP
x x x x Data for a reporting year - 2010 = recent year ***/
EUROSTAT/FAO – pre-filled
6.3 Net revenue x x x x Data for a reporting year - 2010 = recent year ***/
EUROSTAT– partly pre-filled
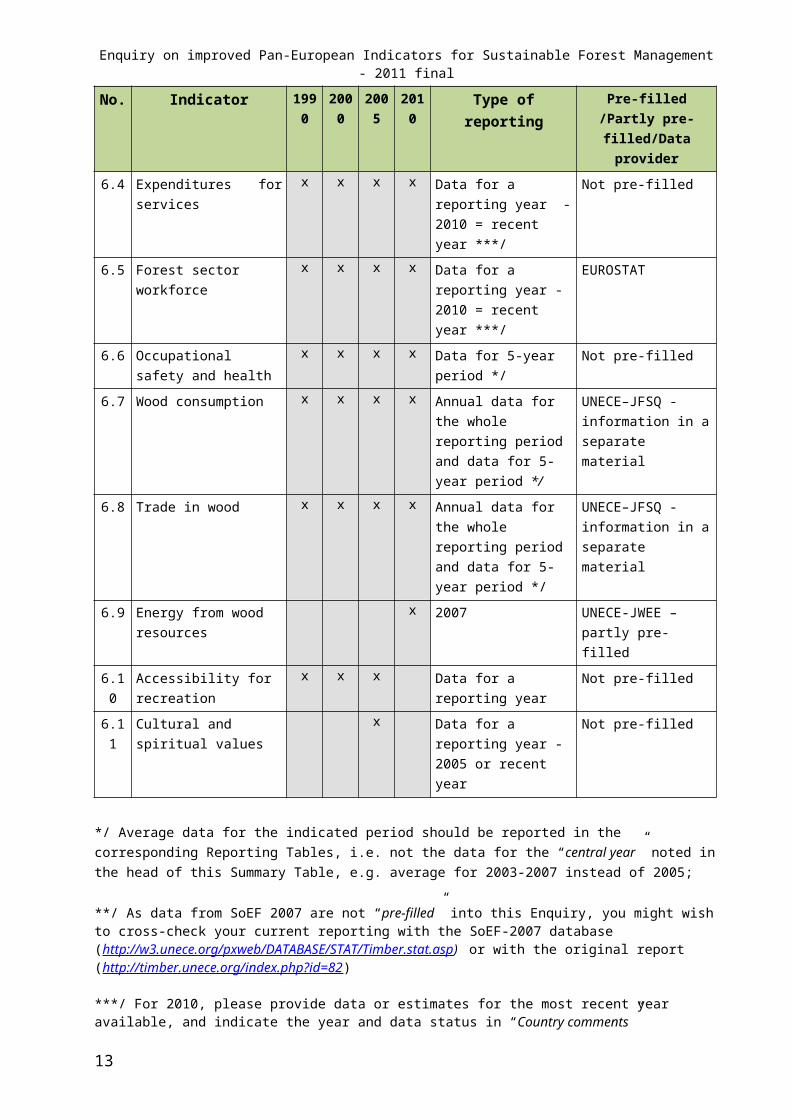
6.4 Expenditures for services x x x x Data for a reporting year - 2010 = recent year ***/
Not pre-filled
6.5 Forest sector workforce x x x x Data for a reporting year - 2010 = recent year ***/
EUROSTAT
6.6 Occupational safety and health
x x x x Data for 5-year period */ Not pre-filled
6.7 Wood consumption x x x x Annual data for the whole reporting period and data for 5-year period */
UNECE–JFSQ - information in a separate material
6.8 Trade in wood x x x x Annual data for the whole reporting period and data for 5-year period */
UNECE–JFSQ - information in a separate material
6.9 Energy from wood resources
x 2007 UNECE-JWEE – partly pre-filled
6.10 Accessibility for recreation x x x Data for a reporting year Not pre-filled
6.11 Cultural and spiritual values
x Data for a reporting year - 2005 or recent year
Not pre-filled
8
Enquiry on improved Pan-European Indicators for Sustainable Forest Management - 2011 final
*/ Average data for the indicated period should be reported in the corresponding Reporting Tables, i.e. not the data for the “central year” noted in the head of this Summary Table, e.g. average for 2003-2007 instead of 2005;
**/ As data from SoEF 2007 are not “pre-filled” into this Enquiry, you might wish to cross-check your current reporting with the SoEF-2007 database (http://w3.unece.org/pxweb/DATABASE/STAT/Timber.stat.asp) or with the original report (http://timber.unece.org/index.php?id=82)
***/ For 2010, please provide data or estimates for the most recent year available, and indicate the year and data status in “Country comments”
Note: For Indicators marked by „x“ for corresponding years the National Reporting is required, also checking, completing and/or up-dating if the data were pre-filled from FRA 2010
9
Enquiry on improved Pan-European Indicators for Sustainable Forest Management - 2011 final
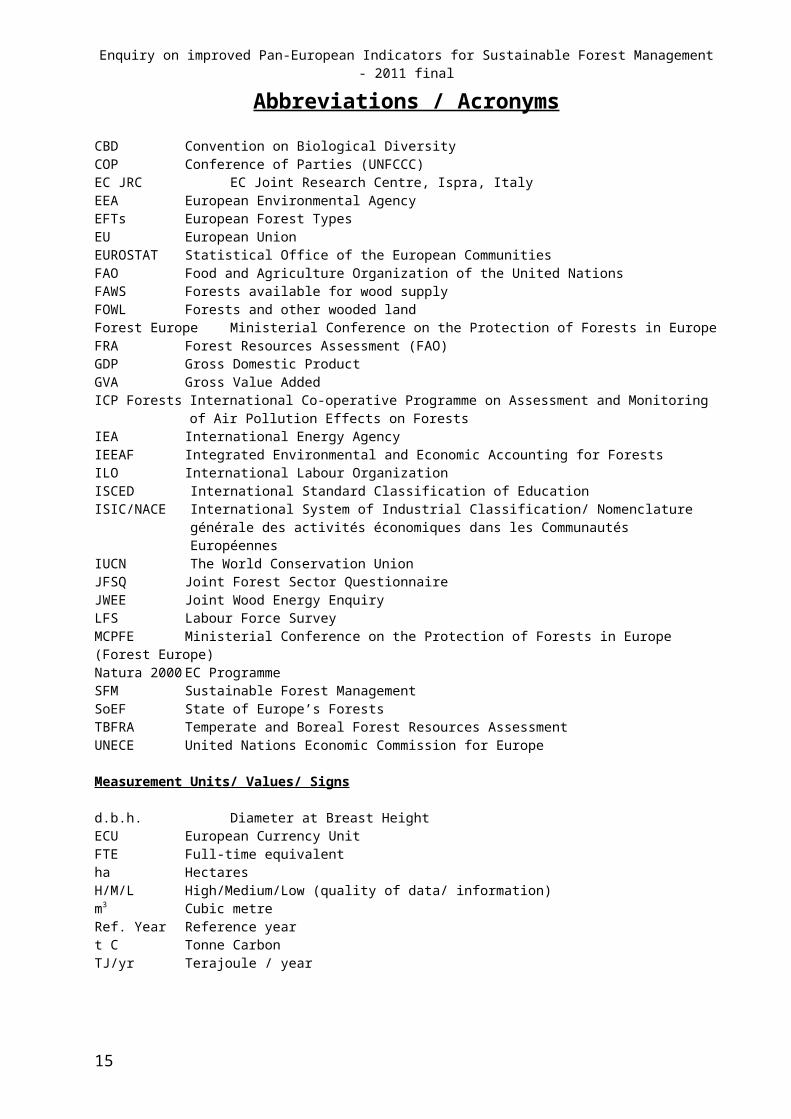
Abbreviations / Acronyms
CBD Convention on Biological DiversityCOP Conference of Parties (UNFCCC)EC JRC EC Joint Research Centre, Ispra, ItalyEEA European Environmental AgencyEFTs European Forest TypesEU European UnionEUROSTAT Statistical Office of the European CommunitiesFAO Food and Agriculture Organization of the United Nations FAWS Forests available for wood supplyFOWL Forests and other wooded landForest Europe Ministerial Conference on the Protection of Forests in EuropeFRA Forest Resources Assessment (FAO)GDP Gross Domestic ProductGVA Gross Value AddedICP Forests International Co-operative Programme on Assessment and Monitoring of Air Pollution Effects on
ForestsIEA International Energy AgencyIEEAF Integrated Environmental and Economic Accounting for ForestsILO International Labour OrganizationISCED International Standard Classification of Education ISIC/NACE International System of Industrial Classification/ Nomenclature générale des activités
économiques dans les Communautés EuropéennesIUCN The World Conservation UnionJFSQ Joint Forest Sector QuestionnaireJWEE Joint Wood Energy EnquiryLFS Labour Force Survey MCPFE Ministerial Conference on the Protection of Forests in Europe (Forest Europe)Natura 2000 EC ProgrammeSFM Sustainable Forest ManagementSoEF State of Europe’s ForestsTBFRA Temperate and Boreal Forest Resources AssessmentUNECE United Nations Economic Commission for Europe
Measurement Units/ Values/ Signs
d.b.h. Diameter at Breast HeightECU European Currency UnitFTE Full-time equivalent ha HectaresH/M/L High/Medium/Low (quality of data/ information)m3 Cubic metreRef. Year Reference yeart C Tonne CarbonTJ/yr Terajoule / year
10
Enquiry on improved Pan-European Indicators for Sustainable Forest Management - 2011 final
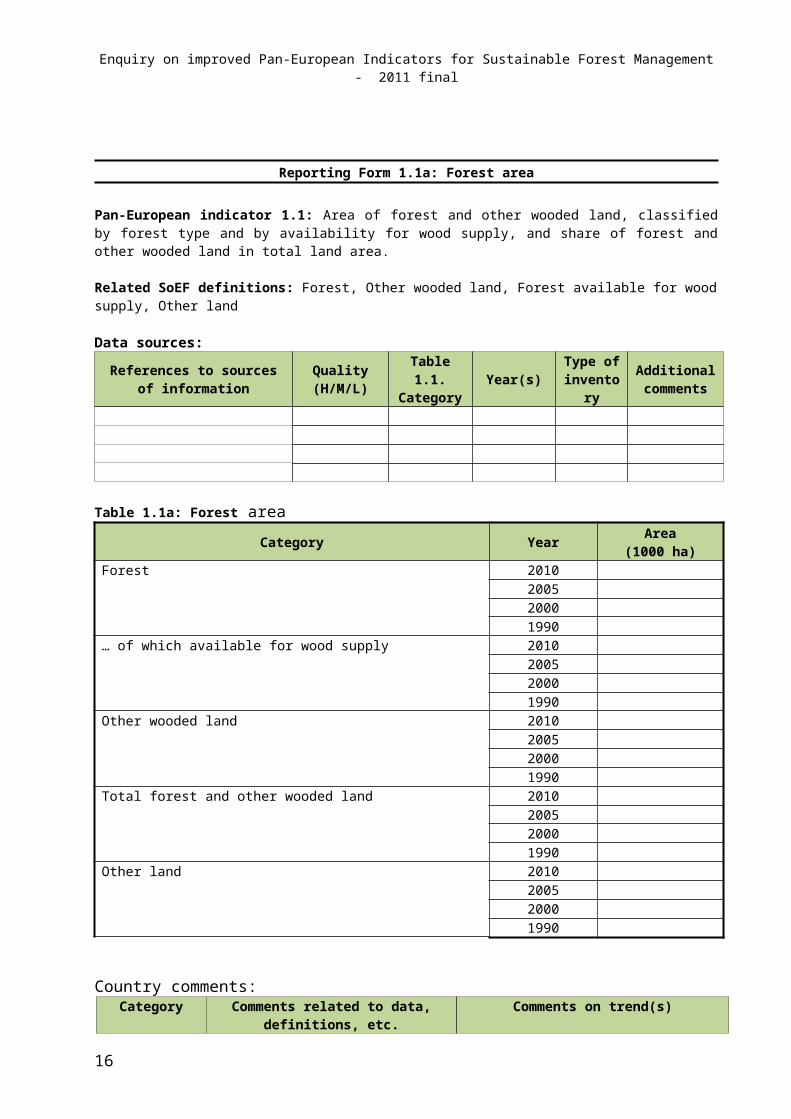
Reporting Form 1.1a: Forest area
Pan-European indicator 1.1: Area of forest and other wooded land, classified by forest type and by availability for wood supply, and share of forest and other wooded land in total land area.
Related SoEF definitions: Forest, Other wooded land, Forest available for wood supply, Other land
Data sources: References to sources of
informationQuality (H/M/L)
Table 1.1. Category Year(s) Type of
inventoryAdditional comments
Table 1.1a: Forest areaCategory Year Area
(1000 ha)Forest 2010
200520001990
… of which available for wood supply 2010200520001990
Other wooded land 2010200520001990
Total forest and other wooded land 2010200520001990
Other land 2010200520001990
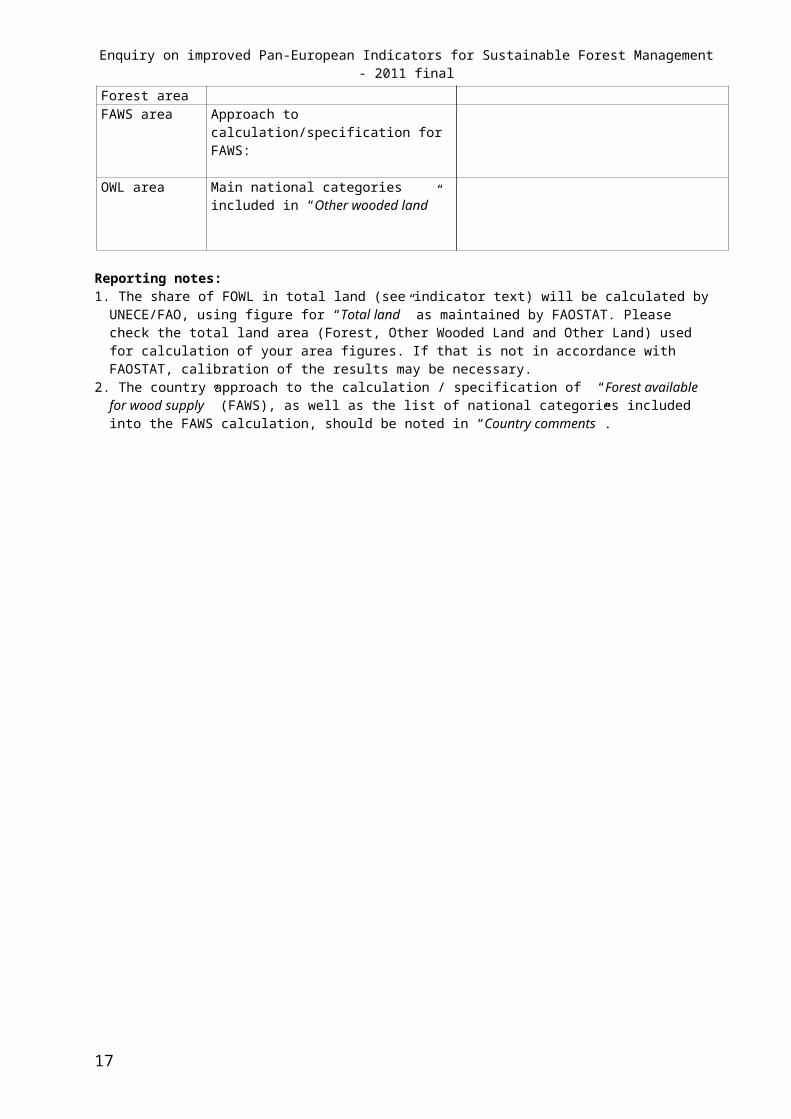
Country comments:Category Comments related to data, definitions, etc. Comments on trend(s)
Forest area FAWS area Approach to calculation/specification for
FAWS: OWL area Main national categories included in “Other
wooded land”
Reporting notes: 1. The share of FOWL in total land (see indicator text) will be calculated by UNECE/FAO, using figure for “Total
land” as maintained by FAOSTAT. Please check the total land area (Forest, Other Wooded Land and Other Land) used for calculation of your area figures. If that is not in accordance with FAOSTAT, calibration of the results may be necessary.
2. The country approach to the calculation / specification of “Forest available for wood supply” (FAWS), as well as the list of national categories included into the FAWS calculation, should be noted in “Country comments”.
11
Enquiry on improved Pan-European Indicators for Sustainable Forest Management - 2011 final
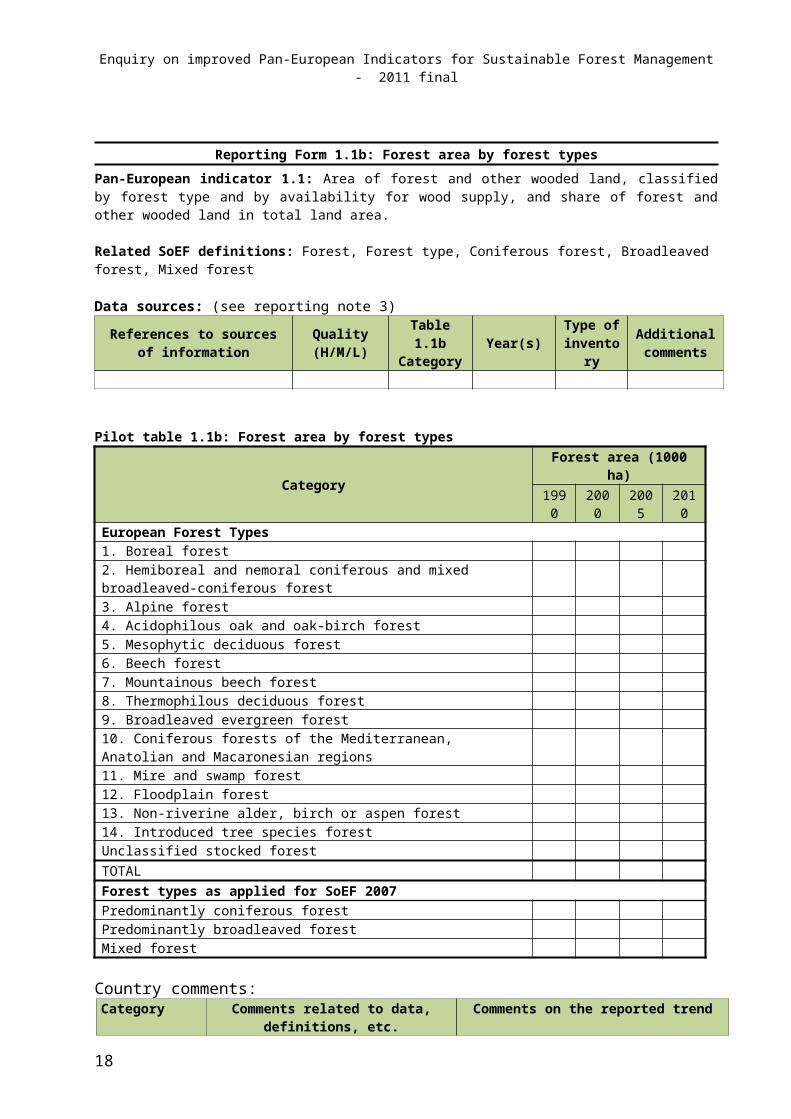
Reporting Form 1.1b: Forest area by forest typesPan-European indicator 1.1: Area of forest and other wooded land, classified by forest type and by availability for wood supply, and share of forest and other wooded land in total land area.
Related SoEF definitions: Forest, Forest type, Coniferous forest, Broadleaved forest, Mixed forest
Data sources: (see reporting note 3)References to sources of
informationQuality (H/M/L)
Table 1.1bCategory Year(s) Type of
inventoryAdditional comments
Pilot table 1.1b: Forest area by forest types
CategoryForest area (1000 ha)
1990 2000 2005 2010
European Forest Types1. Boreal forest2. Hemiboreal and nemoral coniferous and mixed broadleaved-coniferous forest 3. Alpine forest4. Acidophilous oak and oak-birch forest5. Mesophytic deciduous forest6. Beech forest 7. Mountainous beech forest8. Thermophilous deciduous forest9. Broadleaved evergreen forest10. Coniferous forests of the Mediterranean, Anatolian and Macaronesian regions11. Mire and swamp forest12. Floodplain forest13. Non-riverine alder, birch or aspen forest14. Introduced tree species forestUnclassified stocked forestTOTALForest types as applied for SoEF 2007Predominantly coniferous forestPredominantly broadleaved forestMixed forest
Country comments:Category Comments related to data, definitions, etc. Comments on the reported trend
Reporting notes: 1. Breakdown by the European Forest Types of total forest area, as reported in Table 1.1a, is required; guidance for
the application of European Forest Types is provided in the Annex.2. Data sources: please specify sources separately only if sources differ for reported European Forest Types.3. The total area under Category 14 of European Forest Types should correspond to the forest area dominated by
introduced tree species in Table 4.4a.4. EFTs classification covers only stocked forest areas; it is recommended however, to assign unstocked forest areas
to EFTs, based on best available information (cf. p.5). If country had problems to assign some specific stocked forest areas to EFTs, please report those areas under “Unclassified stocked forest area” and provide explanation in “Country comments” in order to help introducing refinements/new forest types in the future updates of EFTs: e.g. biogeographical region, regional location within the country, assemblages of dominant tree species.
12
Enquiry on improved Pan-European Indicators for Sustainable Forest Management - 2011 final
5. Please also report the forest area according to the old classification system; predominantly coniferous, predominantly broadleaved and mixed forest. These groups should sum up to the same total forest area as for the new EFTs.
13
Enquiry on improved Pan-European Indicators for Sustainable Forest Management - 2011 final
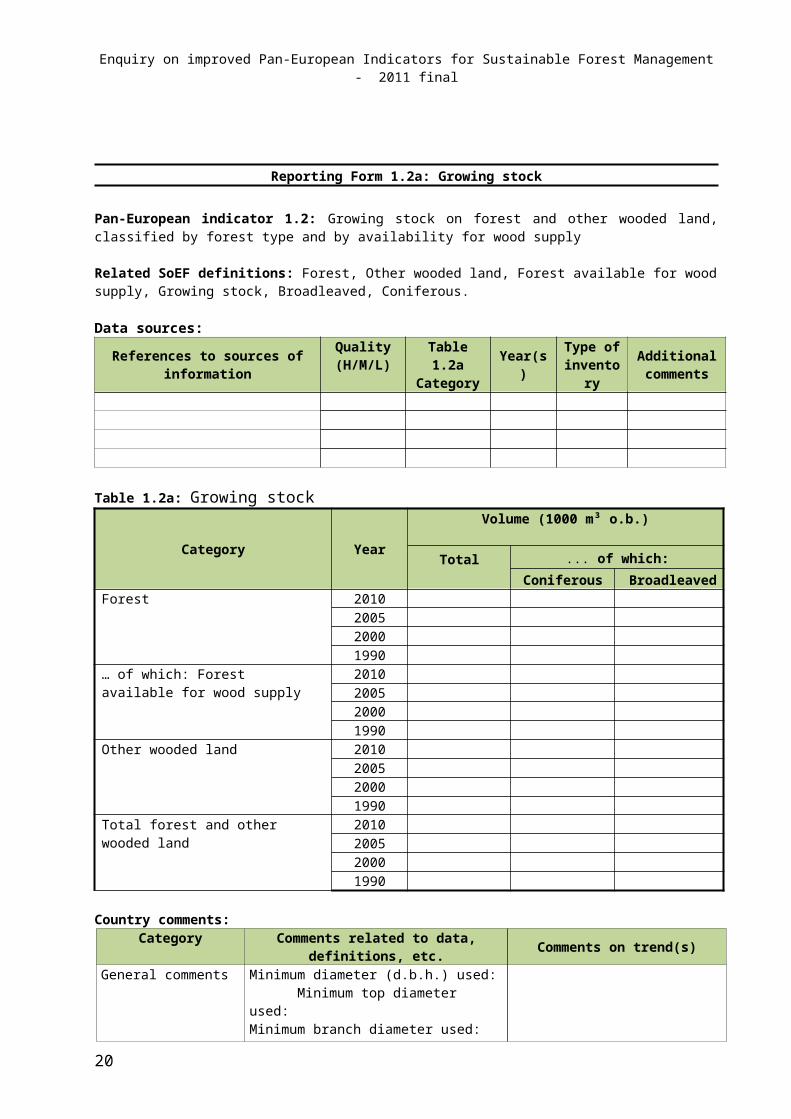
Reporting Form 1.2a: Growing stock
Pan-European indicator 1.2: Growing stock on forest and other wooded land, classified by forest type and by availability for wood supply
Related SoEF definitions: Forest, Other wooded land, Forest available for wood supply, Growing stock, Broadleaved, Coniferous.
Data sources:
References to sources of informationQuality (H/M/L)
Table 1.2a Category Year(s) Type of
inventoryAdditional comments
Table 1.2a: Growing stock
Category Year
Volume (1000 m³ o.b.)
Total ... of which:Coniferous Broadleaved
Forest 2010200520001990
… of which: Forest available for wood supply
2010200520001990
Other wooded land 2010200520001990
Total forest and other wooded land 2010200520001990
Country comments:Category Comments related to data, definitions, etc. Comments on trend(s)
General comments Minimum diameter (d.b.h.) used: Minimum top diameter used: Minimum branch diameter used: Is volume above ground (AG) or above stump (AS)?:
Growing stock on forest area Growing stock on FAWS Growing stock on OWL Growing stock on FOWL
Reporting notes:
14
Enquiry on improved Pan-European Indicators for Sustainable Forest Management - 2011 final
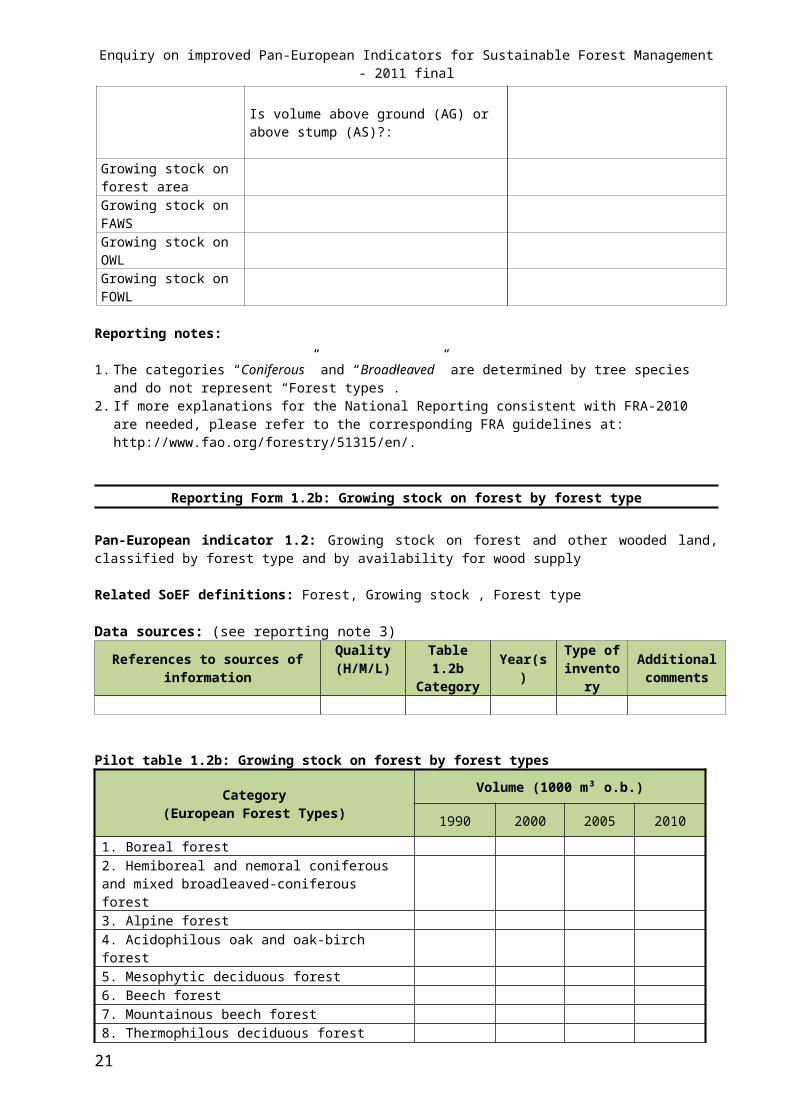
1. The categories “Coniferous” and “Broadleaved” are determined by tree species and do not represent “Forest types”.
2. If more explanations for the National Reporting consistent with FRA-2010 are needed, please refer to the corresponding FRA guidelines at: http://www.fao.org/forestry/51315/en/.
Reporting Form 1.2b: Growing stock on forest by forest type
Pan-European indicator 1.2: Growing stock on forest and other wooded land, classified by forest type and by availability for wood supply
Related SoEF definitions: Forest, Growing stock , Forest type
Data sources: (see reporting note 3)
References to sources of informationQuality (H/M/L)
Table 1.2b Category Year(s) Type of
inventoryAdditional comments
Pilot table 1.2b: Growing stock on forest by forest types
Category(European Forest Types)
Volume (1000 m³ o.b.)
1990 2000 2005 2010
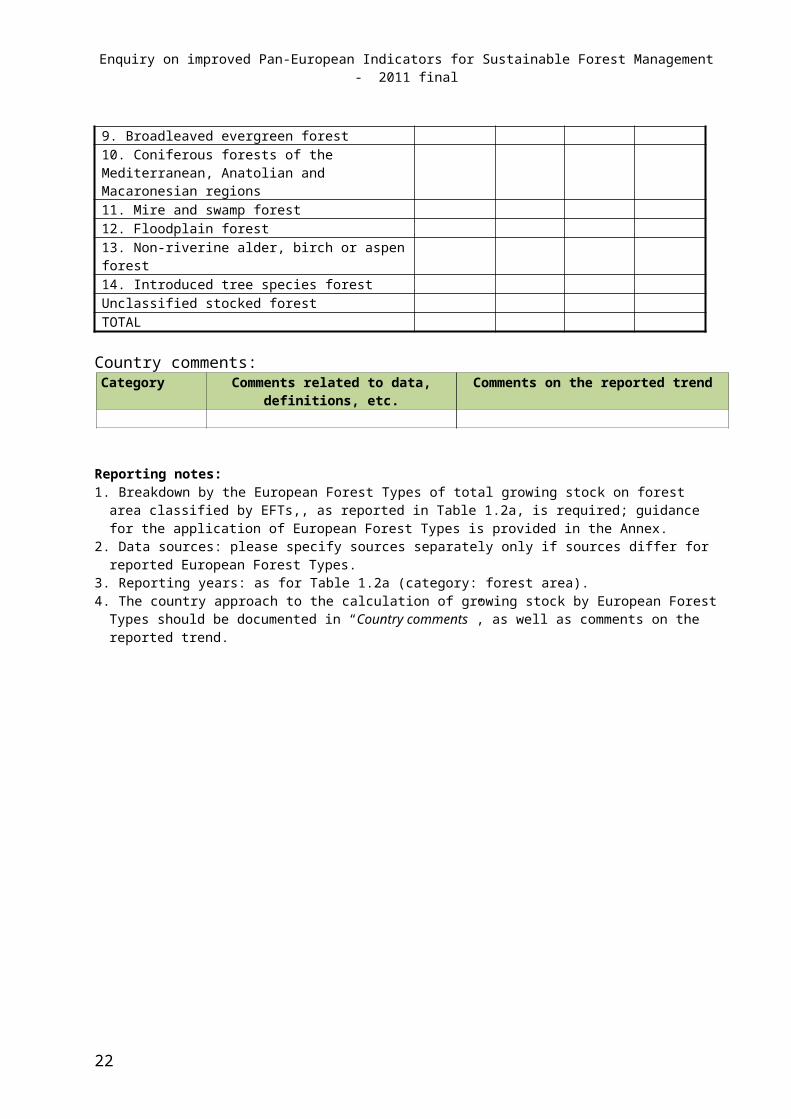
1. Boreal forest2. Hemiboreal and nemoral coniferous and mixed broadleaved-coniferous forest 3. Alpine forest4. Acidophilous oak and oak-birch forest5. Mesophytic deciduous forest6. Beech forest 7. Mountainous beech forest8. Thermophilous deciduous forest9. Broadleaved evergreen forest10. Coniferous forests of the Mediterranean, Anatolian and Macaronesian regions11. Mire and swamp forest12. Floodplain forest13. Non-riverine alder, birch or aspen forest14. Introduced tree species forestUnclassified stocked forestTOTAL
Country comments:Category Comments related to data, definitions, etc. Comments on the reported trend
Reporting notes: 1. Breakdown by the European Forest Types of total growing stock on forest area classified by EFTs,, as reported in
Table 1.2a, is required; guidance for the application of European Forest Types is provided in the Annex.2. Data sources: please specify sources separately only if sources differ for reported European Forest Types.3. Reporting years: as for Table 1.2a (category: forest area). 4. The country approach to the calculation of growing stock by European Forest Types should be documented in
“Country comments”, as well as comments on the reported trend.
15
Enquiry on improved Pan-European Indicators for Sustainable Forest Management - 2011 final
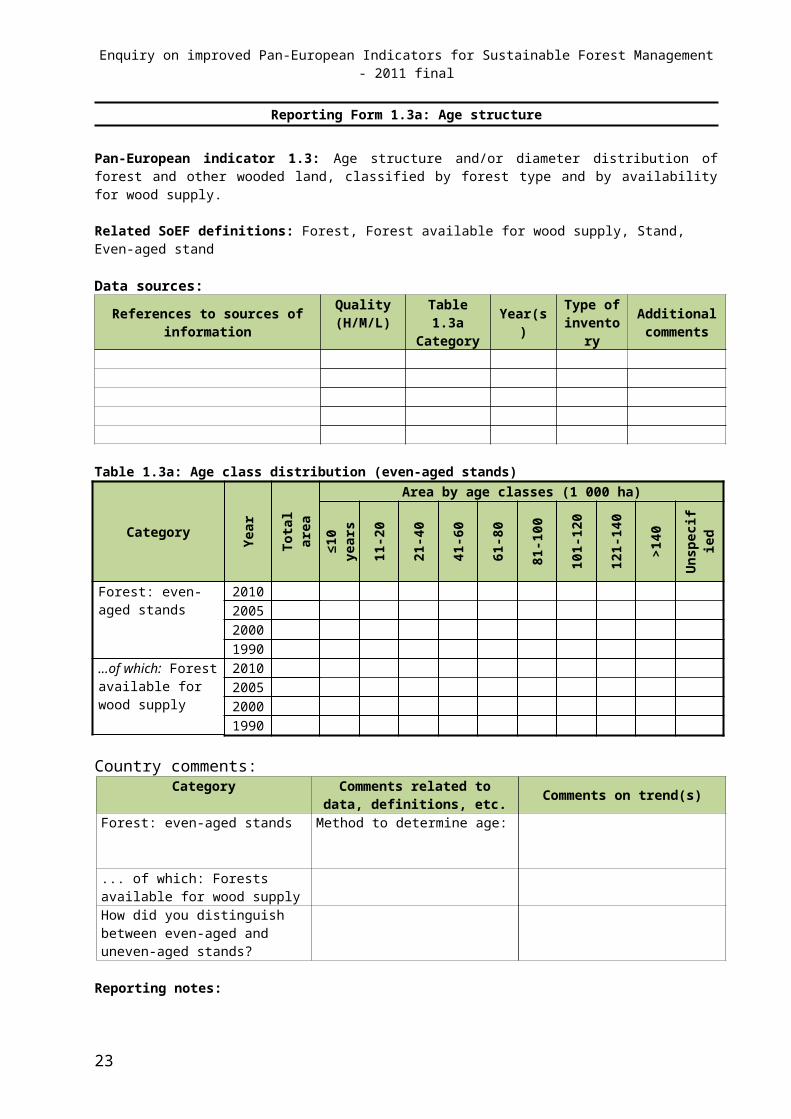
Reporting Form 1.3a: Age structure
Pan-European indicator 1.3: Age structure and/or diameter distribution of forest and other wooded land, classified by forest type and by availability for wood supply.
Related SoEF definitions: Forest, Forest available for wood supply, Stand, Even-aged stand
Data sources:
References to sources of informationQuality (H/M/L)
Table 1.3a Category Year(s) Type of
inventoryAdditional comments
Table 1.3a: Age class distribution (even-aged stands)
Category
Yea
r
Tot
alar
ea
Area by age classes (1 000 ha)
≤10
year
s
11-2
0
21-4
0
41-6
0
61-8
0
81-1
00
101-
120
121-
140
>140
Uns
peci
fied
Forest: even-aged stands
2010200520001990
...of which: Forest available for wood supply
2010200520001990
Country comments:Category Comments related to data,
definitions, etc. Comments on trend(s)
Forest: even-aged stands Method to determine age:
... of which: Forests available for wood supply How did you distinguish between even-aged and uneven-aged stands?
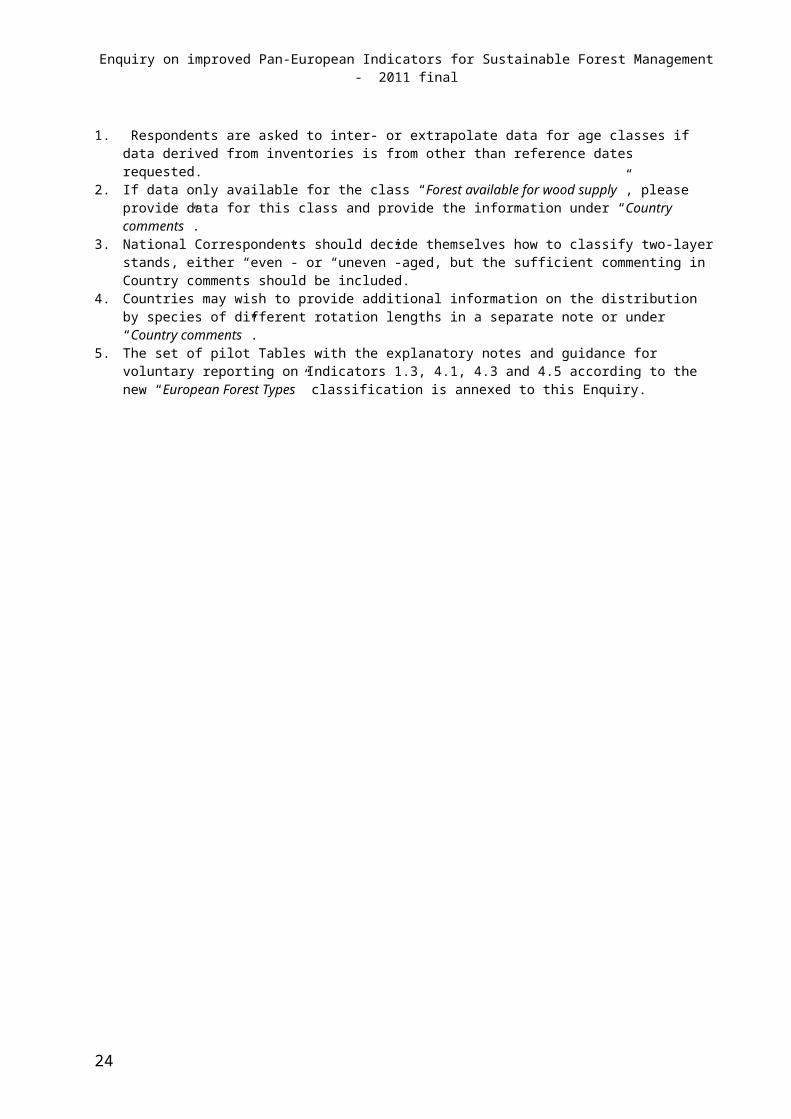
Reporting notes: 1. Respondents are asked to inter- or extrapolate data for age classes if data derived from inventories is from
other than reference dates requested.2. If data only available for the class “Forest available for wood supply”, please provide data for this class and
provide the information under “Country comments”.3. National Correspondents should decide themselves how to classify two-layer stands, either “even”- or
“uneven”-aged, but the sufficient commenting in Country comments should be included.4. Countries may wish to provide additional information on the distribution by species of different rotation
lengths in a separate note or under “Country comments”.5. The set of pilot Tables with the explanatory notes and guidance for voluntary reporting on Indicators 1.3, 4.1,
4.3 and 4.5 according to the new “European Forest Types” classification is annexed to this Enquiry.
16
Enquiry on improved Pan-European Indicators for Sustainable Forest Management - 2011 final
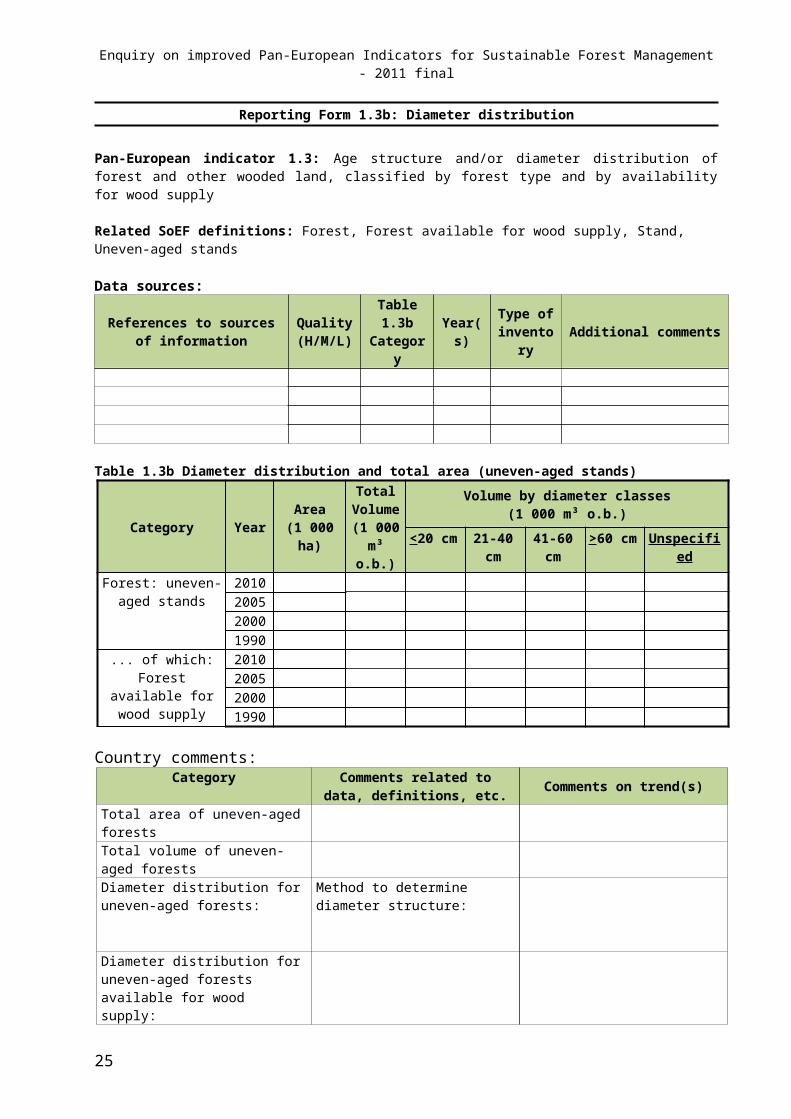
Reporting Form 1.3b: Diameter distribution
Pan-European indicator 1.3: Age structure and/or diameter distribution of forest and other wooded land, classified by forest type and by availability for wood supply
Related SoEF definitions: Forest, Forest available for wood supply, Stand, Uneven-aged stands
Data sources:
References to sources of information
Quality (H/M/L)
Table 1.3b
CategoryYear(s) Type of
inventory Additional comments
Table 1.3b Diameter distribution and total area (uneven-aged stands)
Category Year Area(1 000 ha)
Total Volume (1 000
m³ o.b.)
Volume by diameter classes(1 000 m³ o.b.)
<20 cm 21-40 cm 41-60 cm >60 cm UnspecifiedForest: uneven-aged
stands2010200520001990
... of which: Forest available for wood
supply
2010200520001990
Country comments:Category Comments related to data,
definitions, etc. Comments on trend(s)
Total area of uneven-aged forestsTotal volume of uneven-aged forestsDiameter distribution for uneven-aged forests:
Method to determine diameter structure:
Diameter distribution for uneven-aged forests available for wood supply:
Reporting notes: 1. Diameter classes refer to diameter at breast height (d.b.h.) measured (cm over bark) at a height of 1.3 m above
ground.2. If your country has different diameter classes in the national reporting system, please re-group accordingly with a
sufficient explanation.3. If data is only available for the class “Forest available for wood supply”, please provide data for this class and
provide the information under “Country comments”.4. The upper limits of classes are inclusive, i.e. in the diameter class ≤20 - the 20cm diameter is included, in the
diameter class 21-40cm – the 40 cm diameter is included in this class, etc.5. The set of pilot Tables with the explanatory notes and guidance for voluntary reporting on Indicators 1.3, 4.1, 4.3
and 4.5 according to the new “European Forest Types” classification is annexed to this Enquiry.
17
Enquiry on improved Pan-European Indicators for Sustainable Forest Management - 2011 final
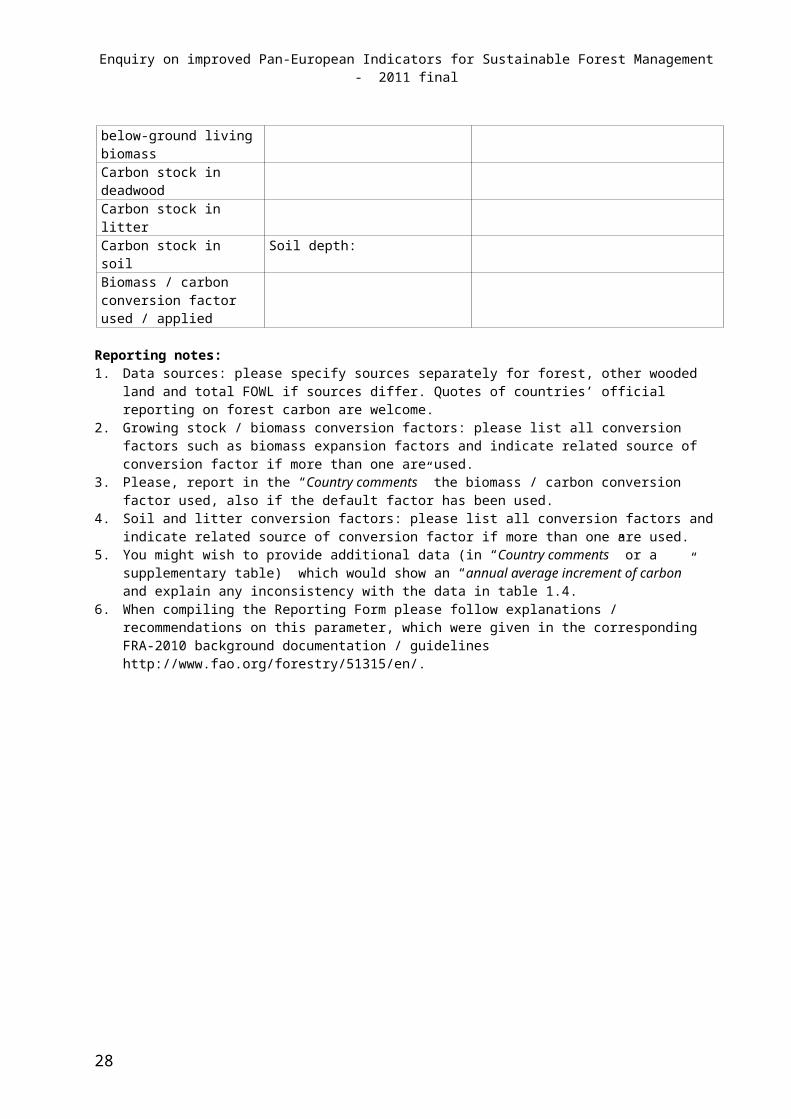
Reporting Form 1.4: Carbon stock
Pan-European indicator 1.4: Carbon stock of woody biomass on forest and other wooded land.
Related SoEF definitions: Forest, Other wooded land, Carbon in above ground biomass, Carbon in below-ground biomass, Carbon in deadwood, Carbon in litter, Soil carbon.
Data sources:
References to sources of information Quality (H/M/L)
Table 1.4 Category Year(s) Type of
inventoryAdditional comments
Table 1.4: Carbon stock
Category Year
Carbon in above-ground and below-ground living biomass
Carbon in deadwood and litter
Soil carbonAbove-ground
Below-ground
Deadwood Litter
Million metric tonnesForest 2010
200520001990
Other wooded land
2010200520001990
Total forest and other wooded land
2010200520001990
Country comments: Category Comments related to data,
definitions, conversion factors used, etc.
Comments on trend(s)
Total carbon stockCarbon stock in above-ground living biomassCarbon stock in below-ground living biomassCarbon stock in deadwood Carbon stock in litterCarbon stock in soil Soil depth:Biomass / carbon conversion factor used / applied
Reporting notes: 1. Data sources: please specify sources separately for forest, other wooded land and total FOWL if sources differ.
Quotes of countries’ official reporting on forest carbon are welcome.2. Growing stock / biomass conversion factors: please list all conversion factors such as biomass expansion
factors and indicate related source of conversion factor if more than one are used.3. Please, report in the “Country comments” the biomass / carbon conversion factor used, also if the default factor
has been used.
18
Enquiry on improved Pan-European Indicators for Sustainable Forest Management - 2011 final
4. Soil and litter conversion factors: please list all conversion factors and indicate related source of conversion factor if more than one are used.
5. You might wish to provide additional data (in “Country comments” or a supplementary table) which would show an “annual average increment of carbon” and explain any inconsistency with the data in table 1.4.
6. When compiling the Reporting Form please follow explanations / recommendations on this parameter, which were given in the corresponding FRA-2010 background documentation / guidelines http://www.fao.org/forestry/51315/en/.
19
Enquiry on improved Pan-European Indicators for Sustainable Forest Management - 2011 final
Indicator 2.1: Deposition of air pollutants
Indicator 2.2: Soil condition
Indicator 2.3: Defoliation
The information for these Indicators will be provided separately by other International Data Providers (IDPs); ICP Forests and EU JRC. Information for Indicators 2.1 and 2.3 will be presented to National Correspondents. If the National Correspondent wishes to request any changes to the data provided, these changes must be agreed with the country’s ICP Forests focal point and transmitted to ICP Forests Co-ordinating Centre. Information for Indicator 2.2. will not be presented on a country basis; in the publication it will be in the form of maps and/or other graphics. Technical Specifications for reporting by IDPs is available in a separate document prepared for your information.
20
Enquiry on improved Pan-European Indicators for Sustainable Forest Management - 2011 final
Reporting Form 2.4: Forest damage
Pan-European indicator 2.4: Forest and other wooded land with damage, classified by primary damaging agent (abiotic, biotic and human induced) and by forest type
Related SoEF definitions: Forest, Other wooded land, Damage to forest, Primarily damaged by insects and disease, Primarily damaged by wildlife and grazing, Primarily damaged by storm, wind, snow or other identifiable abiotic factors, Primarily human induced, Primarily damaged by fire
Data sources:
References to sources of information Quality (H/M/L)
Table 2.4 Category Year(s) Type of
inventoryAdditional comments
Table 2.4a: Forest damage
Category
Year
Area damaged by different agents
Primarily damaged by fireTotal
area
Primarily damaged bybiotic agents
Damage primarily
human induced
Primarily damaged by abiotic
agents
Inse
cts
and
dise
ase
Wild
life
and
graz
ing
Fore
st
oper
atio
ns
Oth
er
Stor
m, w
ind,
sn
ow, e
tc.
1000 ha 1000ha
No. of fires
Forest 200520001990
Other wooded land
200520001990
Total forest and other wooded
land
200520001990
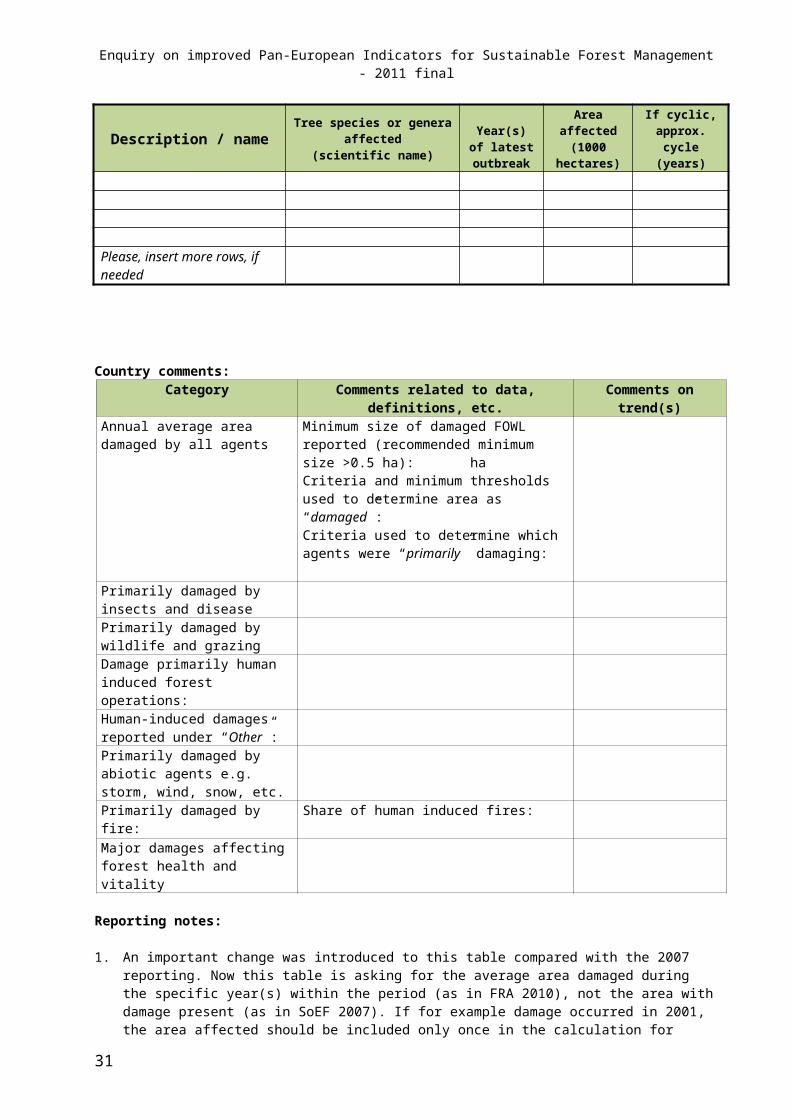
Table 2.4b: Major damages affecting forest health and vitality
Description / name Tree species or genera affected(scientific name)
Year(s) of latest
outbreak
Area affected (1000
hectares)
If cyclic, approx. cycle
(years)
Please, insert more rows, if needed
Country comments:
21
Enquiry on improved Pan-European Indicators for Sustainable Forest Management - 2011 final
Category Comments related to data, definitions, etc. Comments on trend(s)Annual average area damaged by all agents
Minimum size of damaged FOWL reported (recommended minimum size >0.5 ha): haCriteria and minimum thresholds used to determine area as “damaged”: Criteria used to determine which agents were “primarily” damaging:
Primarily damaged by insects and diseasePrimarily damaged by wildlife and grazingDamage primarily human induced forest operations:Human-induced damages reported under “Other”:Primarily damaged by abiotic agents e.g. storm, wind, snow, etc.Primarily damaged by fire: Share of human induced fires: Major damages affecting forest health and vitality
Reporting notes:
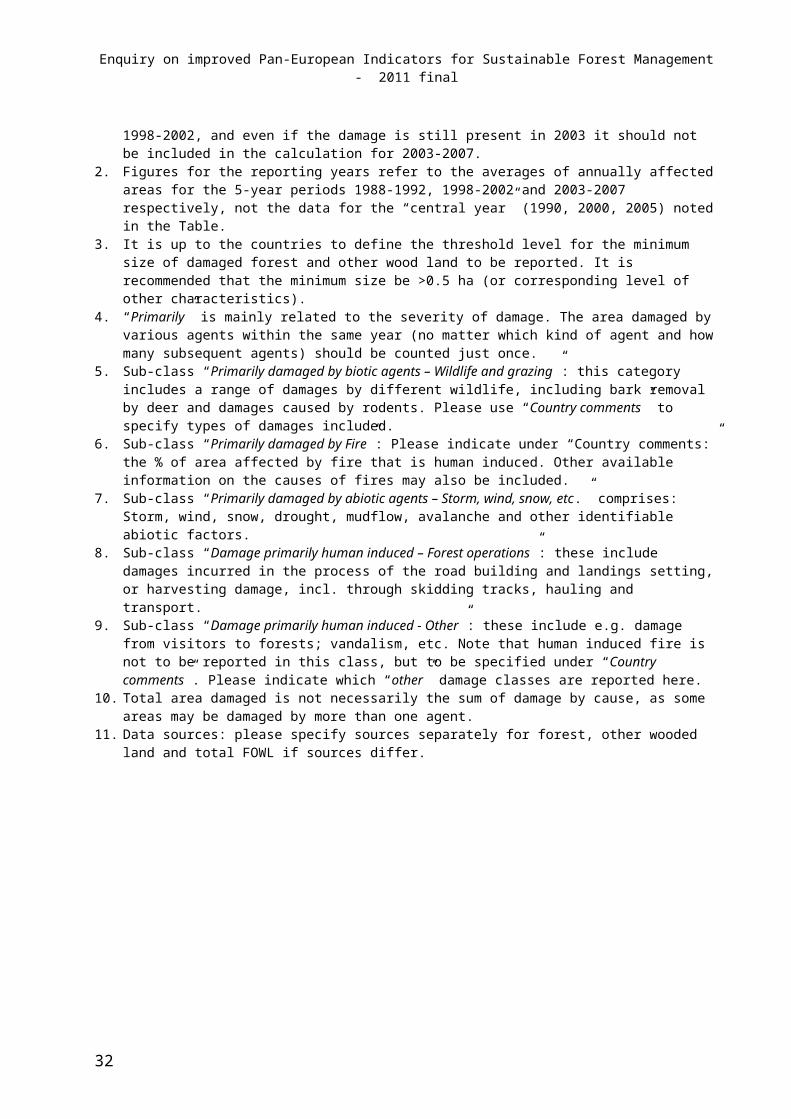
1. An important change was introduced to this table compared with the 2007 reporting. Now this table is asking for the average area damaged during the specific year(s) within the period (as in FRA 2010), not the area with damage present (as in SoEF 2007). If for example damage occurred in 2001, the area affected should be included only once in the calculation for 1998-2002, and even if the damage is still present in 2003 it should not be included in the calculation for 2003-2007.
2. Figures for the reporting years refer to the averages of annually affected areas for the 5-year periods 1988-1992, 1998-2002 and 2003-2007 respectively, not the data for the “central year” (1990, 2000, 2005) noted in the Table.
3. It is up to the countries to define the threshold level for the minimum size of damaged forest and other wood land to be reported. It is recommended that the minimum size be >0.5 ha (or corresponding level of other characteristics).
4. “Primarily” is mainly related to the severity of damage. The area damaged by various agents within the same year (no matter which kind of agent and how many subsequent agents) should be counted just once.
5. Sub-class “Primarily damaged by biotic agents – Wildlife and grazing”: this category includes a range of damages by different wildlife, including bark removal by deer and damages caused by rodents. Please use “Country comments” to specify types of damages included.
6. Sub-class “Primarily damaged by Fire”: Please indicate under “Country comments:” the % of area affected by fire that is human induced. Other available information on the causes of fires may also be included.
7. Sub-class “Primarily damaged by abiotic agents – Storm, wind, snow, etc.” comprises: Storm, wind, snow, drought, mudflow, avalanche and other identifiable abiotic factors.
8. Sub-class “Damage primarily human induced – Forest operations”: these include damages incurred in the process of the road building and landings setting, or harvesting damage, incl. through skidding tracks, hauling and transport.
9. Sub-class “Damage primarily human induced - Other”: these include e.g. damage from visitors to forests; vandalism, etc. Note that human induced fire is not to be reported in this class, but to be specified under “Country comments”. Please indicate which “other” damage classes are reported here.
10. Total area damaged is not necessarily the sum of damage by cause, as some areas may be damaged by more than one agent.
11. Data sources: please specify sources separately for forest, other wooded land and total FOWL if sources differ.
22
Enquiry on improved Pan-European Indicators for Sustainable Forest Management - 2011 final
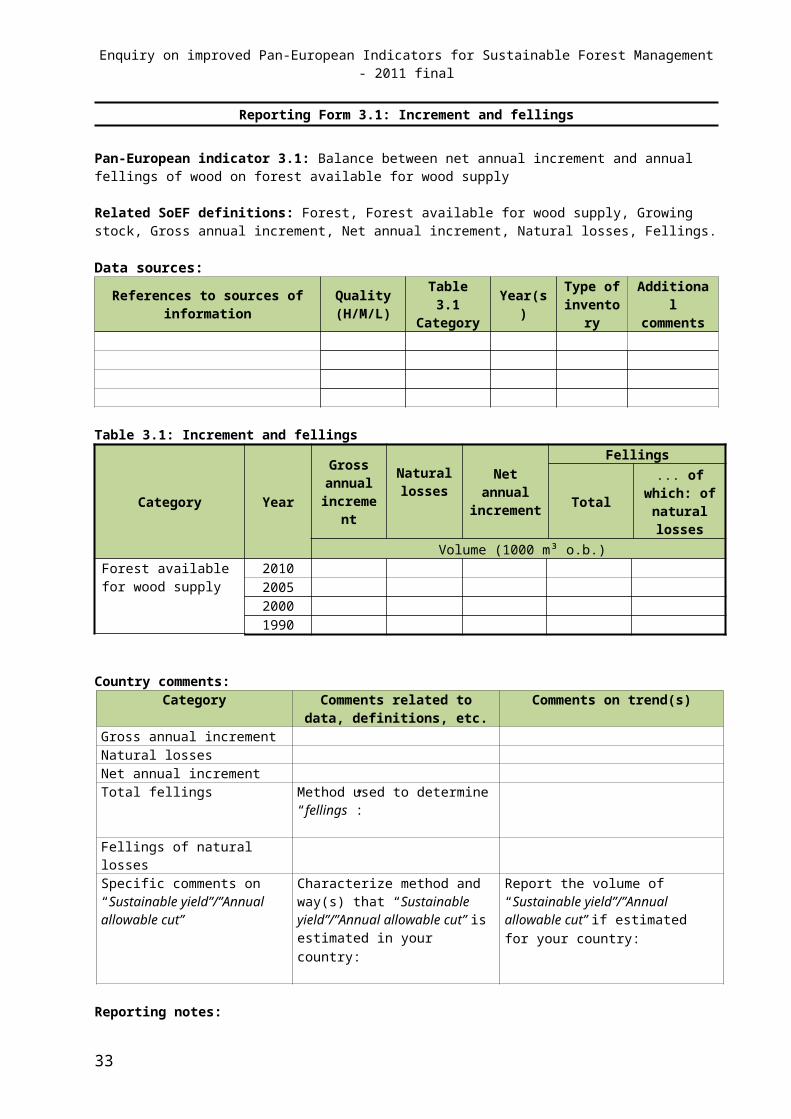
Reporting Form 3.1: Increment and fellings
Pan-European indicator 3.1: Balance between net annual increment and annual fellings of wood on forest available for wood supply
Related SoEF definitions: Forest, Forest available for wood supply, Growing stock, Gross annual increment, Net annual increment, Natural losses, Fellings.
Data sources:
References to sources of information Quality (H/M/L)
Table 3.1 Category Year(s) Type of
inventoryAdditional comments
Table 3.1: Increment and fellings
Category Year
Gross annual
increment
Natural losses
Net annual increment
Fellings
Total ... of which: of natural losses
Volume (1000 m³ o.b.)Forest available for wood supply
2010200520001990
Country comments: Category Comments related to data,
definitions, etc.Comments on trend(s)
Gross annual increment Natural losses Net annual incrementTotal fellings Method used to determine “fellings”:
Fellings of natural lossesSpecific comments on “Sustainable yield”/”Annual allowable cut”
Characterize method and way(s) that “Sustainable yield”/”Annual allowable cut” is estimated in your country:
Report the volume of “Sustainable yield”/”Annual allowable cut” if estimated for your country:
Reporting notes: 1. Growing stock, increment, natural losses and fellings are reported over bark.2. Figures for the reporting years refer to the averages for the 5-year periods 1988-1992, 1998-2002 and 2003-
2007 respectively, i.e. not the data for the “central year” (1990, 2000, 2005) noted in the Table above, e.g. 2003-2007 instead of 2005. For 2010 - average values from 2008 and 2009 should be used.
3. If no data on “Natural losses” exists, the country may provide reporting of NAI, with the accompanying comments.
4. Fellings of natural losses include felling of dead trees and cutting of trees already brought down by natural cause, e.g. by storm.
23
Enquiry on improved Pan-European Indicators for Sustainable Forest Management - 2011 final
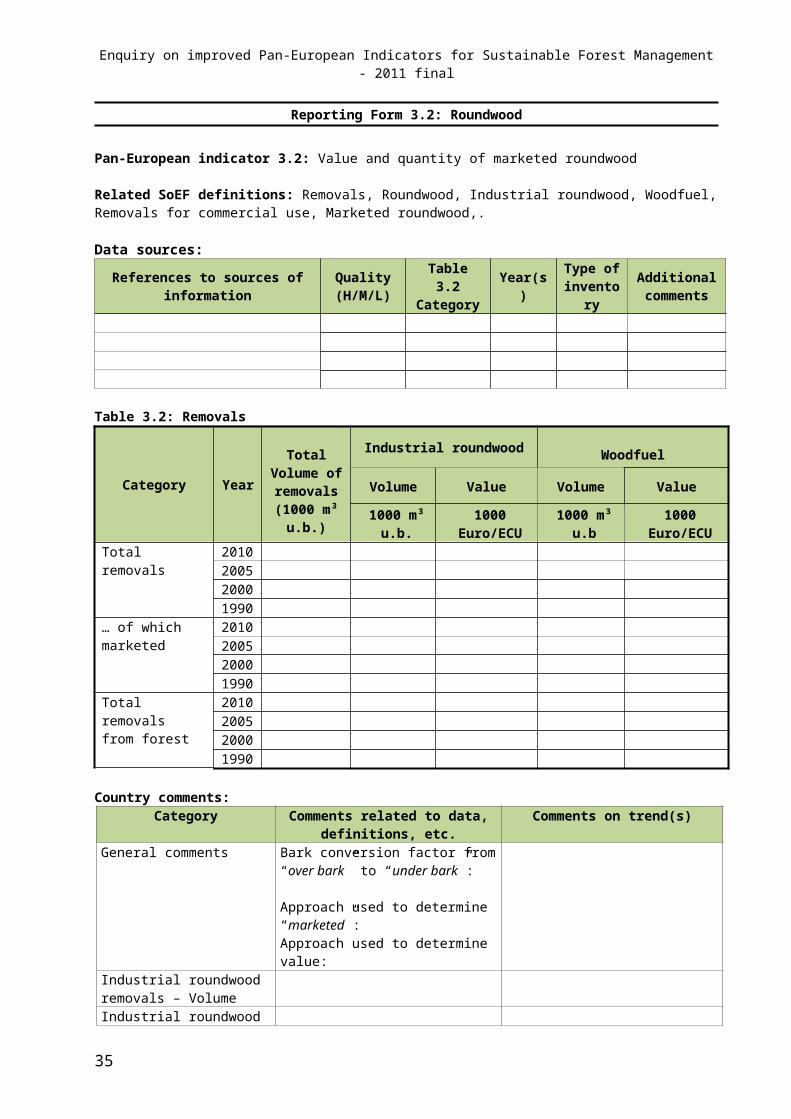
Reporting Form 3.2: Roundwood
Pan-European indicator 3.2: Value and quantity of marketed roundwood
Related SoEF definitions: Removals, Roundwood, Industrial roundwood, Woodfuel, Removals for commercial use, Marketed roundwood,.
Data sources:
References to sources of information Quality (H/M/L)
Table 3.2 Category Year(s) Type of
inventoryAdditional comments
Table 3.2: Removals
Category Year
Total Volume of removals(1000 m³
u.b.)
Industrial roundwood Woodfuel
Volume Value Volume Value
1000 m³ u.b. 1000 Euro/ECU 1000 m³ u.b 1000 Euro/ECUTotal removals 2010
200520001990
… of which marketed
2010200520001990
Total removalsfrom forest
2010200520001990
Country comments: Category Comments related to data,
definitions, etc.Comments on trend(s)
General comments Bark conversion factor from “over bark” to “under bark”: Approach used to determine “marketed”: Approach used to determine value:
Industrial roundwood removals – Volume Industrial roundwood removals – Value Woodfuel removals – VolumeWoodfuel removals - Value
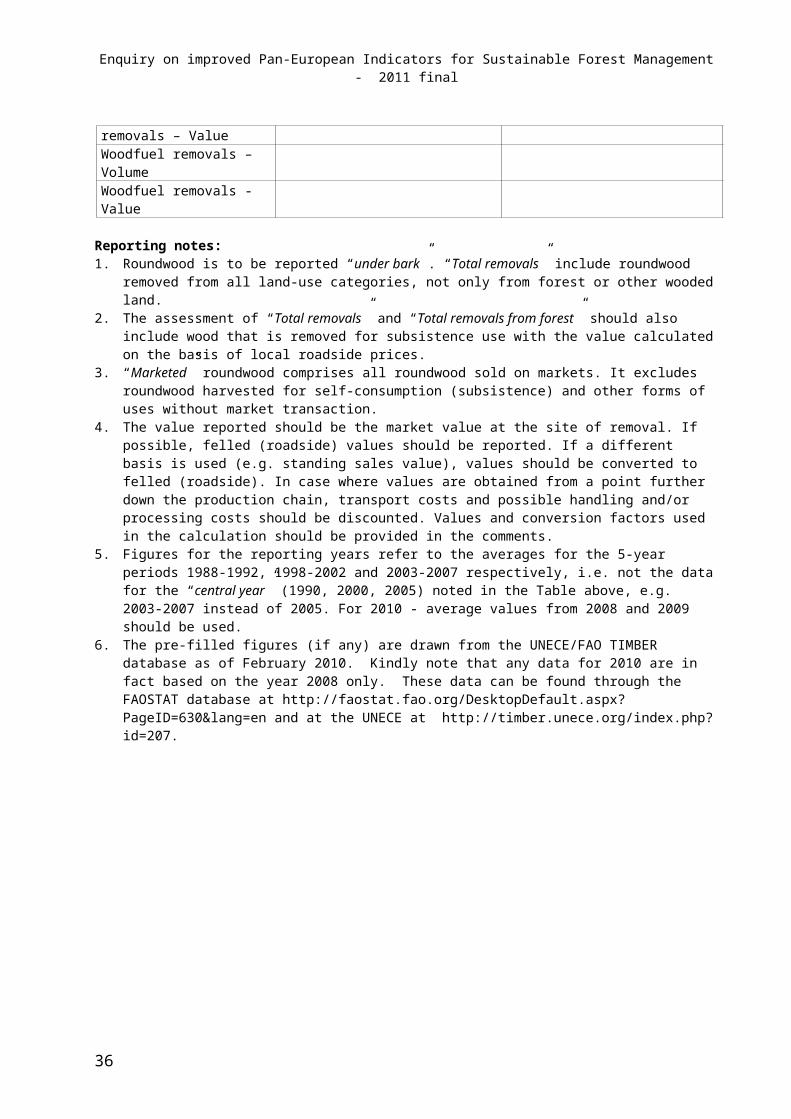
Reporting notes: 1. Roundwood is to be reported “under bark”. “Total removals” include roundwood removed from all land-use
categories, not only from forest or other wooded land.2. The assessment of “Total removals” and “Total removals from forest” should also include wood that is
removed for subsistence use with the value calculated on the basis of local roadside prices.
24
Enquiry on improved Pan-European Indicators for Sustainable Forest Management - 2011 final
3. “Marketed” roundwood comprises all roundwood sold on markets. It excludes roundwood harvested for self-consumption (subsistence) and other forms of uses without market transaction.
4. The value reported should be the market value at the site of removal. If possible, felled (roadside) values should be reported. If a different basis is used (e.g. standing sales value), values should be converted to felled (roadside). In case where values are obtained from a point further down the production chain, transport costs and possible handling and/or processing costs should be discounted. Values and conversion factors used in the calculation should be provided in the comments.
5. Figures for the reporting years refer to the averages for the 5-year periods 1988-1992, 1998-2002 and 2003-2007 respectively, i.e. not the data for the “central year” (1990, 2000, 2005) noted in the Table above, e.g. 2003-2007 instead of 2005. For 2010 - average values from 2008 and 2009 should be used.
6. The pre-filled figures (if any) are drawn from the UNECE/FAO TIMBER database as of February 2010. Kindly note that any data for 2010 are in fact based on the year 2008 only. These data can be found through the FAOSTAT database at http://faostat.fao.org/DesktopDefault.aspx?PageID=630&lang=en and at the UNECE at http://timber.unece.org/index.php?id=207.
25

Enquiry on improved Pan-European Indicators for Sustainable Forest Management - 2011 final
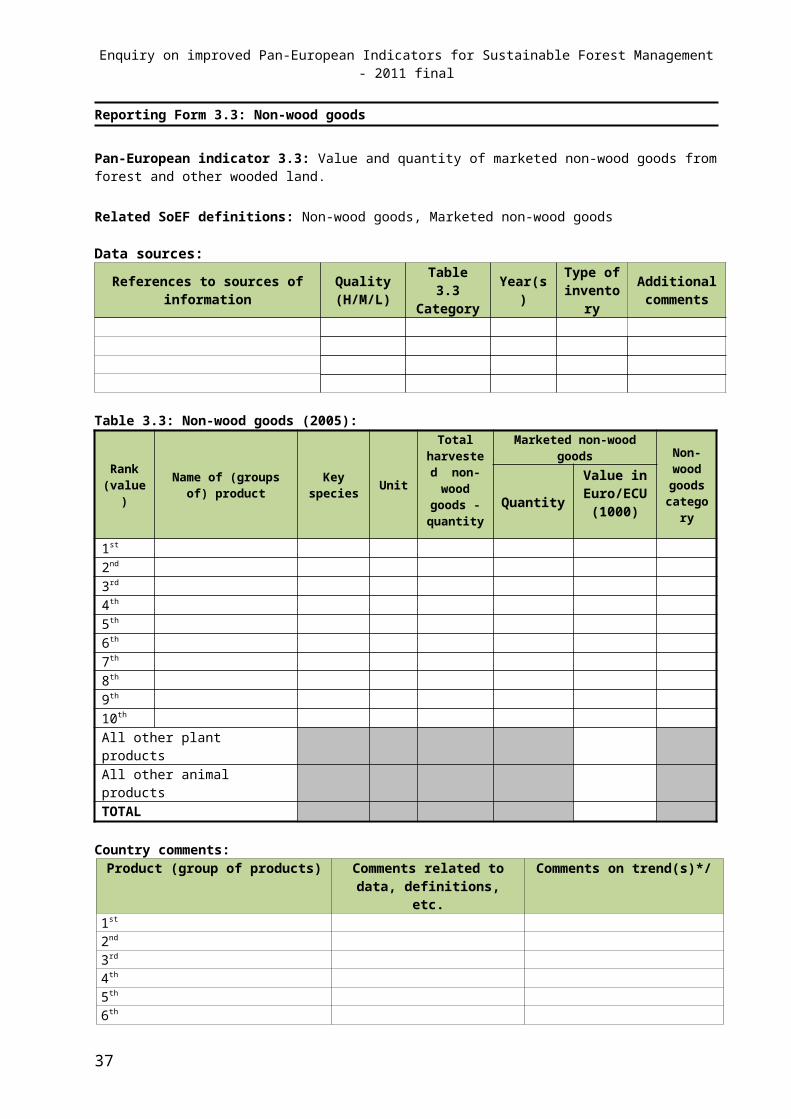
Reporting Form 3.3: Non-wood goods
Pan-European indicator 3.3: Value and quantity of marketed non-wood goods from forest and other wooded land.
Related SoEF definitions: Non-wood goods, Marketed non-wood goods
Data sources:
References to sources of information Quality (H/M/L)
Table 3.3 Category Year(s) Type of
inventoryAdditional comments
Table 3.3: Non-wood goods (2005):
Rank(value)
Name of (groups of) product
Key species Unit
Total harvested non-wood
goods -quantity
Marketed non-wood goods Non-wood goods
categoryQuantity
Value in Euro/ECU
(1000)
1st
2nd
3rd
4th 5th 6th 7th 8th 9th 10th
All other plant productsAll other animal productsTOTAL
Country comments: Product (group of products) Comments related to data,
definitions, etc.Comments on trend(s)*/
1st
2nd
3rd
4th 5th 6th 7th 8th 9th 10th
All other plant productsAll other animal products
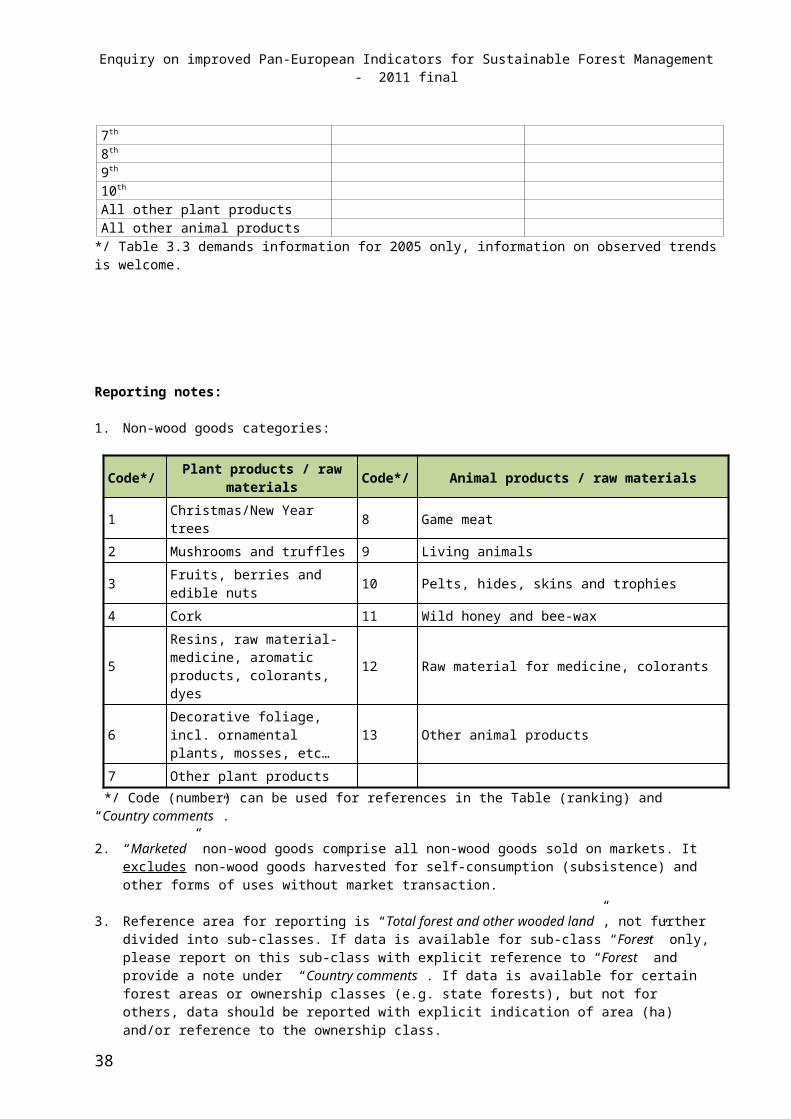
*/ Table 3.3 demands information for 2005 only, information on observed trends is welcome.
26

Enquiry on improved Pan-European Indicators for Sustainable Forest Management - 2011 final
Reporting notes:
1. Non-wood goods categories:
Code*/ Plant products / raw materials Code*/ Animal products / raw materials1 Christmas/New Year trees 8 Game meat2 Mushrooms and truffles 9 Living animals 3 Fruits, berries and edible nuts 10 Pelts, hides, skins and trophies4 Cork 11 Wild honey and bee-wax
5 Resins, raw material- medicine, aromatic products, colorants, dyes 12 Raw material for medicine, colorants
6 Decorative foliage, incl. ornamental plants, mosses, etc… 13 Other animal products
7 Other plant products*/ Code (number) can be used for references in the Table (ranking) and “Country comments”.
2. “Marketed” non-wood goods comprise all non-wood goods sold on markets. It excludes non-wood goods harvested for self-consumption (subsistence) and other forms of uses without market transaction.
3. Reference area for reporting is “Total forest and other wooded land”, not further divided into sub-classes. If data is available for sub-class “Forest” only, please report on this sub-class with explicit reference to “Forest” and provide a note under “Country comments”. If data is available for certain forest areas or ownership classes (e.g. state forests), but not for others, data should be reported with explicit indication of area (ha) and/or reference to the ownership class.
4. The non-wood good categories “Christmas/New Year trees”, “Living animals” as well as “Pelts, hides, skins and trophies” are to be reported in 1000 pieces, all other categories in tonnes. If goods are reported in different measurement units than those recommended, please specify under “Country comments”.
5. “Mushrooms and truffles” and “Fruits, berries and nuts”: Products from mushroom farms or fruits from trees outside forests, such as orchards, are to be excluded.
6. “Resins, raw material for medicine, aromatic products, colorants and dyes” includes extracts e.g. tannins, raw material for industrial extracts, essential and cosmetic oils.
7. “Other plant products” includes other products collected from forest and other wooded land, such as fodder, reproductive material (e.g. seeds, parts of plants) or other plant-based raw material for food and beverages. Note that grazing in the forest should be excluded. Please specify further categories if necessary.
8. “Game meat” (in tonnes) and “Living animals” (in 1000 pieces) “from forest and other wooded land” is to be understood to include game whose habitat is forest-related or –dependent. Please use expert judgment in classifications and provide information on game classes included under “country comments”. Meat and harvest from game farms are to be excluded. Note that marketed game only is to be included. Licenses for hunting are to be reported as “Marketed Service” under Reporting Form 9 “Services”. Only those marketed living animals that were caught in their natural habitat, should be reported under category “Living animals”.
27
Enquiry on improved Pan-European Indicators for Sustainable Forest Management - 2011 final
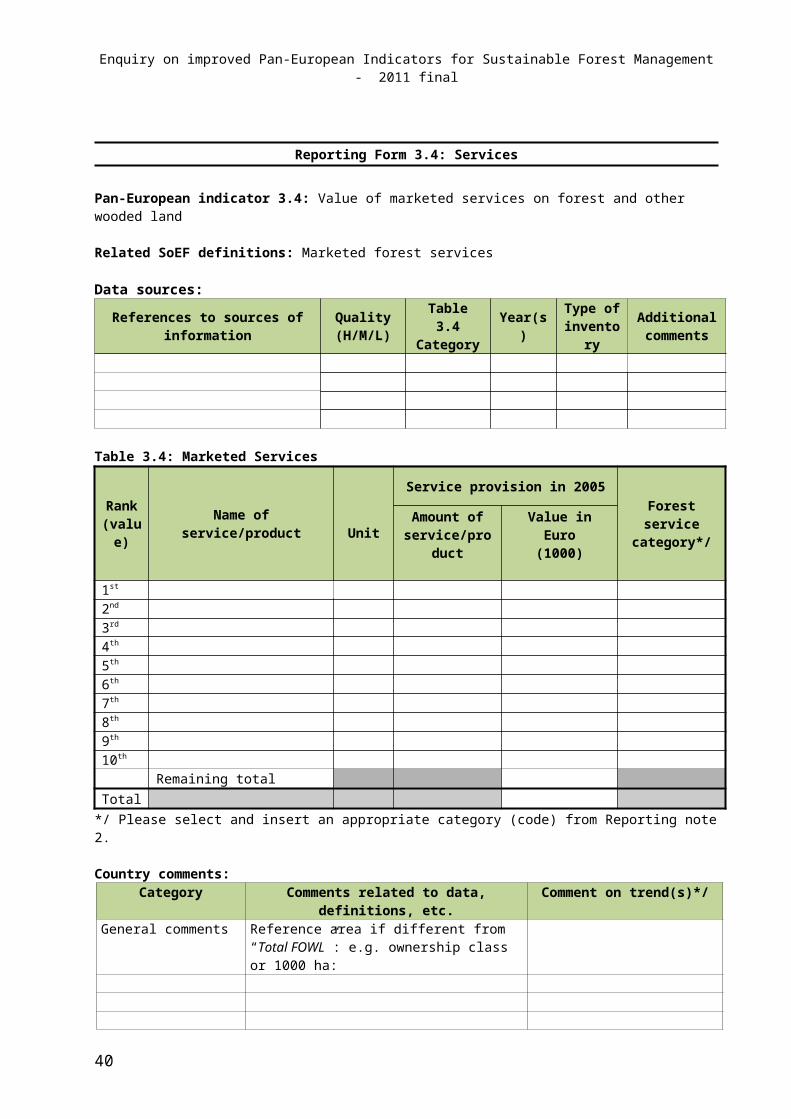
Reporting Form 3.4: Services
Pan-European indicator 3.4: Value of marketed services on forest and other wooded land
Related SoEF definitions: Marketed forest services
Data sources:
References to sources of information Quality (H/M/L)
Table 3.4 Category Year(s) Type of
inventoryAdditional comments
Table 3.4: Marketed Services
Rank(value) Name of service/product Unit
Service provision in 2005Forest service
category*/Amount of service/product
Value in Euro (1000)
1st
2nd
3rd
4th 5th 6th 7th 8th 9th 10th
Remaining totalTotal
*/ Please select and insert an appropriate category (code) from Reporting note 2.
Country comments: Category Comments related to data, definitions, etc. Comment on trend(s)*/
General comments Reference area if different from “Total FOWL”: e.g. ownership class or 1000 ha:
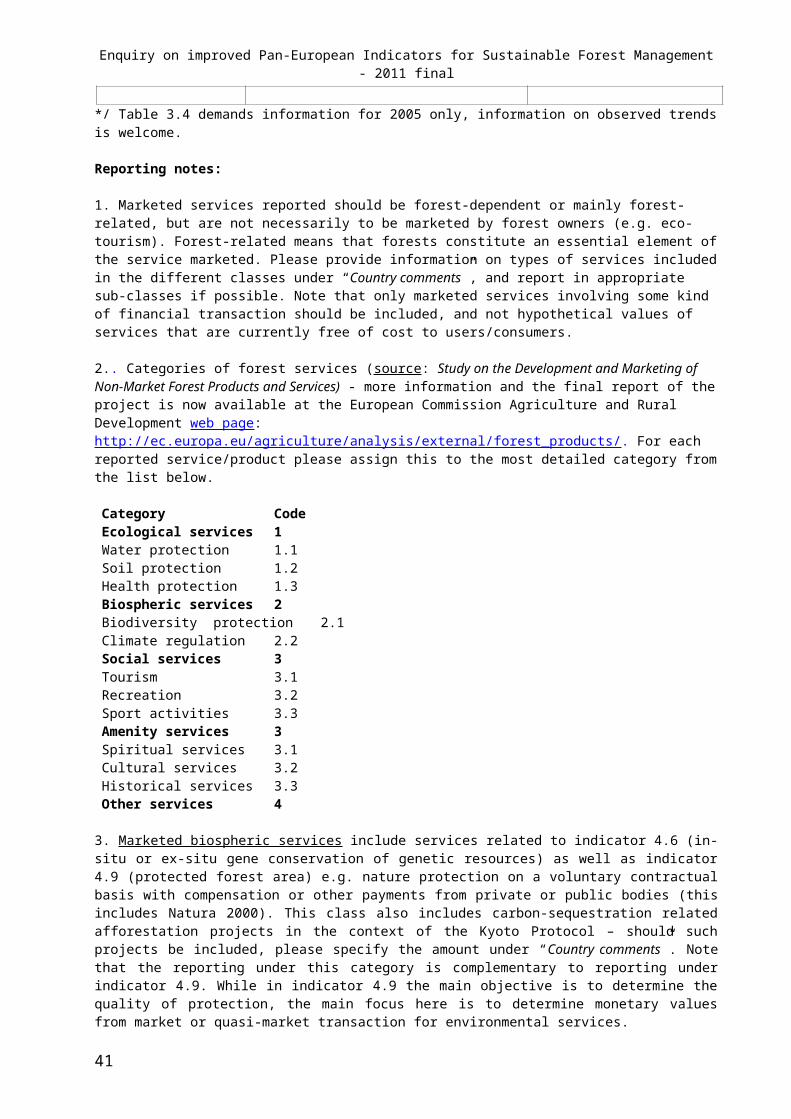
*/ Table 3.4 demands information for 2005 only, information on observed trends is welcome.
Reporting notes:
1. Marketed services reported should be forest-dependent or mainly forest-related, but are not necessarily to be marketed by forest owners (e.g. eco-tourism). Forest-related means that forests constitute an essential element of the service marketed. Please provide information on types of services included in the different classes under “Country comments”, and report in appropriate sub-classes if possible. Note that only marketed services involving some kind of financial transaction should be included, and not hypothetical values of services that are currently free of cost to users/consumers.
2.. Categories of forest services (source: Study on the Development and Marketing of Non-Market Forest Products and Services) - more information and the final report of the project is now available at the European Commission
28
Enquiry on improved Pan-European Indicators for Sustainable Forest Management - 2011 final
Agriculture and Rural Development web page: http://ec.europa.eu/agriculture/analysis/external/forest_products/. For each reported service/product please assign this to the most detailed category from the list below.
Category CodeEcological services 1Water protection 1.1Soil protection 1.2Health protection 1.3Biospheric services 2Biodiversity protection 2.1Climate regulation 2.2Social services 3Tourism 3.1Recreation 3.2Sport activities 3.3Amenity services 3Spiritual services 3.1Cultural services 3.2Historical services 3.3Other services 4
3. Marketed biospheric services include services related to indicator 4.6 (in-situ or ex-situ gene conservation of genetic resources) as well as indicator 4.9 (protected forest area) e.g. nature protection on a voluntary contractual basis with compensation or other payments from private or public bodies (this includes Natura 2000). This class also includes carbon-sequestration related afforestation projects in the context of the Kyoto Protocol – should such projects be included, please specify the amount under “Country comments”. Note that the reporting under this category is complementary to reporting under indicator 4.9. While in indicator 4.9 the main objective is to determine the quality of protection, the main focus here is to determine monetary values from market or quasi-market transaction for environmental services.
4. Marketed ecological services include those related to indicators 5.1 and 5.2 (protection of soil, water and other environmental functions as well as infrastructure and managed natural resources) on a voluntary contractual basis with compensation or other payments from private or public bodies.
5. Marketed social services include e.g. hunting or fishing licenses, renting of huts and houses as well as forest-based leisure, sport and outdoor adventure activities and educational services that are not free of cost to consumers (the public, schools,..). Please use “Country comments” to report on further criteria used for including different services. Recreational services not exchanged via market transaction are not to be reported. (see also indicator 6.10).
6. Amenity services include those related to spiritual, cultural and historical functions, e.g. sacred, religious, or other forms of spiritual inspiration, sites of worship, landscape features (mountains and waterfalls), “memories’’ in the landscape from past cultural ties, aesthetic enjoyment and inspiration, historic artifacts.
7. Other marketed services include e.g. payments to woodland owners for licenses for gravel extraction, telecommunication masts, wind farms and electricity distribution.
8. The reference area for reporting is “Total FOWL”, not further divided into sub-classes “Forest” and “Other wooded land”. If data is available for some forest areas, e.g. for state forests or sub-class “Forest”, please give an expert judgment on the likely value for ”Total forest and other wooded land”. Please report on actually available data on which expert judgment is based under “Country comments”.
29

Enquiry on improved Pan-European Indicators for Sustainable Forest Management - 2011 final
Reporting Form 3.5: Forests under management plans
Pan-European indicator 3.5: Proportion of forest and other wooded land under a management plan or equivalent
Related SoEF definitions: Forest management plan, Equivalent of forest management plan
Data sources:
References to sources of information Quality (H/M/L)
Table 3.5 Category Year(s) Type of
inventoryAdditional comments
Table 3.5: Forests under management plans
Category YearManagement plans Equivalents Total
(%)Forest 2010
200520001990
Other wooded land 2010200520001990
Total forest and other wooded land 2010200520001990
Country comments: Category Comments related to data, definitions, etc. Comment on trend(s)
Management plans: Types of documents included in category “management plan”: Other comments:
Equivalents: Types of documents included in category “equivalents”: Other comments:
Reporting notes: 1. Figures are to be reported separately and exclusively for the two categories. The percentages of forest land and
of other wooded land covered by the following categories should be reported:a) forest management plans , defined by the MCPFE as “ Information (in the form of text, maps, tables and
graphs) collected during (periodic) forest inventories at operational forest units level (stands, compartments), and operations planned for individual stands or compartments to reach the management goals (MCPFE, 2002)”;
b) equivalents , defined by the MCPFE as “Information collected on forest area, at forest management or aggregated forest management unit level (forest blocks, farms, enterprises, watersheds, municipalities, or wider units), and strategies/management activities planned to reach the management or development goals” (MCPFE, 2002).
2. The maximum sum of area covered is up to 100% of total FOWL. Areas covered by a management plan and an equivalent should thus be counted only once, and reported in category “Management plans”.
3. Data sources: please specify sources separately for forest, other wooded land and total FOWL if sources differ.
30
Enquiry on improved Pan-European Indicators for Sustainable Forest Management - 2011 final
Reporting Form 4.1: Tree species composition
Pan-European indicator 4.1: Area of forest and other wooded land, classified by number of tree species occurring and by forest type
Related SoEF definitions: Forest, Other wooded land, Stand, Tree
Data sources:
References to sources of information Quality (H/M/L)
Table 4.1a Category Year(s) Type of
inventoryAdditional comments
Table 4.1a: Tree species composition
Category YearArea with number of tree species occurring
(1000 ha)1 2-3 4-5 6-10 >10
Forest 200520001990
Other wooded land 200520001990
Total forest and other wooded land 200520001990
Country comments: Category Comments related to data,
definitions, etc.Comments on trend(s)
General comments Minimum size of trees to be included: Reference area for the assessment (stand or sample plot):
Area with number of tree species occurring on forest: Area with number of tree species occurring on OWL: Area with number of tree species occurring on forest and OWL:
Reporting notes: 1. Threshold to include a certain tree species: >5% of basal area by this tree species. 2. Whenever possible, the reference area for the assessment should be the forest stand. 3. Data sources: please specify sources separately for forest, other wooded land and total FOWL if sources differ.4. The set of pilot Tables with the explanatory notes and guidance for voluntary reporting on Indicators 1.3, 4.1,
4.3 and 4.5 according to the new “European Forest Types” classification is annexed to this Enquiry.
31
Enquiry on improved Pan-European Indicators for Sustainable Forest Management - 2011 final
Reporting Form 4.2: Regeneration
Pan-European indicator 4.2: Area of regeneration within even-aged stands and uneven-aged stands, classified by regeneration type
Related SoEF definitions: Forest, Even-aged stand, Uneven-aged stand, Regeneration (natural, by planting and/or seeding, coppice sprouting), Afforestation, Natural expansion of forest
Data sources:
References to sources of information Quality (H/M/L)
Table 4.2 Category Year(s) Type of
inventoryAdditional comments
Table 4.2: Regeneration
Category Year
Natural regeneration and natural expansion
of forest
Afforestation and regeneration by planting and/or seeding and/or coppice
total of which: coppice sprouting
Area of forest land by regeneration type (1000 ha)Forest 2010
200520001990
of which:even-aged stands
2010200520001990
of which:uneven-aged stands
2010200520001990
Annual forest regeneration (1000 ha)*/Afforestation 2005Natural expansion of forest 2005Regeneration** 2005
*/ Reporting on five year average 2003-2007 **/For the purpose of this table the term “Regeneration” implies the meaning is the same as “Reforestation” in FRA2010, i.e. re-establishment of forest stand, please see definitions.
Country comments:Category Comments related to data,
definitions, etc.Comments on trend(s)
Origin of total forest area by regeneration typeNatural regeneration and expansion of forest
Characteristics used to determine the class
Afforestation and regeneration by planting and/or seeding
Characteristics used to determine the class
Coppice sprouting Characteristics used to determine the class
32
Enquiry on improved Pan-European Indicators for Sustainable Forest Management - 2011 final
Category Comments related to data, definitions, etc.
Comments on trend(s)
Annual forest regenerationAfforestationNatural expansion of forest Regeneration
Reporting notes:
1. The term “regeneration” used in this reporting should be understood as a synonym of the term “reforestation” used in the FAO global Forest Resources Assessment 2010, which also includes coppice (http://www.fao.org/forestry/51315/en/).
Part I: Origin of total forest area by regeneration type 2. The mixed forms of regeneration (“natural regeneration enhanced by planting” and “regeneration by planting
and/or seeding enhanced by natural regeneration”) should be reported according to the prevailing form of regeneration. Please describe, how mixed forms of regeneration were reported for this form in “Country comments”.
3. The forest area by regeneration categories should sum up to the value of total forest area as this reported in the Table 1.1.
4. The figures for the reporting years refer to the situation in the reporting year, figures for the 2010 should reflect a status forecasted for this year.
Part II: Annual forest regeneration5. In the table “Country comments” countries are requested to provide information on the criteria that were
applied to assess annual values of regeneration. 6. In case of those forms of regeneration, where assessment of regenerated area is unfeasible (some partial or
selective final fellings) please report the area that corresponds to the share (volume, basal area or crown cover) of felled trees in the regenerated stand. Please explain in comments.
7. The figures for the reporting year refer to the average for the 5-year period 2003-2007.
33
Enquiry on improved Pan-European Indicators for Sustainable Forest Management - 2011 final
Reporting Form 4.3: Naturalness
Pan-European indicator 4.3: Area of forest and other wooded land, classified by “undisturbed by man”, by “semi-natural” or by “plantations”, each by forest type
Related SoEF definitions: Forest, Other wooded land, Naturalness, Undisturbed by man, Semi-natural, Plantation
Data sources:
References to sources of information Quality (H/M/L)
Table 4.3a Category Year(s) Type of
inventoryAdditional comments
Table 4.3a: Naturalness
Category Year
Area (1000 ha)
Undisturbed by man Semi-natural Plantations
Forest 2010200520001990
Other wooded land 2010200520001990
Total forest and other wooded land
2010200520001990
Country comments:Category Comments related to data, definitions, etc. Comments on trend(s)
FOWL: undisturbed by man Criteria or thresholds used to delimit “undisturbed by man” from “semi-natural”
FOWL: semi-natural
FOWL: plantations Criteria or thresholds used to delimit “semi-natural” from “plantations”
Reporting notes: 1. Data sources: please specify sources separately for forest, other wooded land and total FOWL if sources differ.2. The set of pilot Tables with the explanatory notes and guidance for voluntary reporting on Indicators 1.3, 4.1,
4.3 and 4.5 according to the new “European Forest Types” classification is annexed to this Enquiry. 3. For cross-checking with the FRA-2010 reported data, please see the MCPFE definition “Undisturbed by man”,
and FAO FRA-2010 definition “Primary forest” at http://www.fao.org/forestry/51315/en/.4. Please ensure that the areas of introduced species included in the category “plantations” for this indicator are
consistent with the areas reported as “dominated by introduced tree species” in Reporting Form 4.4 and in Category 14 of European Forest Types.
34
Enquiry on improved Pan-European Indicators for Sustainable Forest Management - 2011 final
Reporting Form 4.4: Introduced tree species
Pan-European indicator 4.4: Area of stands of forest and other wooded land dominated by introduced tree species
Related SoEF definitions: Forest, Other wooded land, Introduced tree species, Invasive introduced tree species
Data sources:
References to sources of information Quality (H/M/L)
Table 4.4a, 4.4b and
4.4c Category
Year(s) Type of inventory
Additional comments
Table 4.4a: Introduced tree species
Category Year
Area of stands dominated by introduced tree species(1000 ha)
Total …of which: invasiveForest 2010
200520001990
Other wooded land 2010200520001990
Total forest and other wooded land 2010200520001990
Table 4.4b. Introduced tree speciesScientific name of introduced tree species Rank of occupied area (1, 2, 3…
etc.)
Table 4.4c. Invasive tree speciesScientific name of invasive tree species Rank of occupied area (1, 2, 3…
etc.)
35
Enquiry on improved Pan-European Indicators for Sustainable Forest Management - 2011 final
Country comments:Category Comments related to data,
definitions, etc.Comments on trend(s)
General Reference area for assessment (size of sample plot/average stand): ha
FOWL: area dominated by introduced tree species
Reference period used to classify as “introduced” (years since introduction): years
FOWL: area dominated by invasive tree species
Criteria or thresholds used to classify species as “invasive”:
Reporting notes: 1. Threshold for stands dominated by introduced tree species is >50 % of basal area by tree species introduced.2. Introduced tree species (synonyms: non-indigenous species, exotic species, alien species): A species,
subspecies or lower taxon, occurring outside its natural range (past or present) and dispersal potential (i.e. outside the range it occupies naturally or could occupy without direct or indirect introduction or care by humans) (FRA 2010).
3. The forest area dominated by introduced tree species, as reported in Table 4.4a, should correspond to the total area under Category 14 of European Forest Types (Pilot Tables 1.1b, 4.1b and 4.3b).
4. Please specify under “Country comments” whether your concept of “introduced” implies “introduced to your country” (the species does not occur naturally within the country borders) or “introduced to another region within the country”.
5. Data sources: please specify sources separately for forest, other wooded land and total FOWL if sources differ.
36
Enquiry on improved Pan-European Indicators for Sustainable Forest Management - 2011 final
Reporting Form 4.5: Deadwood
Pan-European indicator 4.5: Volume of standing and of lying deadwood on forest and other wooded land, classified by forest type
Related SoEF definitions: Forest, Other wooded land, Deadwood
Data sources: (see Reporting note 4)
References to sources of information Quality (H/M/L)
Table 4.5a Category Year(s) Type of
inventoryAdditional comments
Table 4.5a: DeadwoodCategory Year Volume of deadwood
(m³/ha)
Total Standing LyingForest 2010
200520001990
Other wooded land 2010200520001990
Total forest and other wooded land 2010200520001990
Volume of deadwood in FOWL by species groups:Coniferous 2005Broadleaved 2005
Country comments:Category Comments related to data, definitions, etc. Comments on trend(s)
Standing deadwood Minimum height of standing deadwood reported: (m)Minimum diameter of standing deadwood reported: (cm)Is volume above ground (AG) or above stump (AS)?
Lying deadwood Minimum length of lying deadwood reported: (m)
Minimum diameter of lying deadwood reported: (cm)
Reporting notes: 1. Total volume = sum of standing and lying volume.2. Recommended minimum length of lying dead trees is 1.0 m.3. Minimum diameter of standing and lying dead trees: It is up to the countries to define the threshold level for the
minimum size of diameter to be reported. It is recommended that the minimum size should be: Standing deadwood: 10 cm of d.b.h.; Lying deadwood: the threshold 10 cm measured 1.0 m from the thicker end of a piece of lying deadwood.
4. Data sources: please specify sources separately for forest, other wooded land and total FOWL if sources differ.
37
Enquiry on improved Pan-European Indicators for Sustainable Forest Management - 2011 final
5. The required breakdown by “Coniferous” and “Broadleaved” (non-coniferous) refers to the deadwood volume (i.e. not to “forest type”).
6. The set of pilot Tables with the explanatory notes and guidance for voluntary reporting on Indicators 1.3, 4.1, 4.3 and 4.5 according to the new “European Forest Types” classification is annexed to this Enquiry.
38
Enquiry on improved Pan-European Indicators for Sustainable Forest Management - 2011 final
Indicator 4.6: Genetic resources
Indicator 4.7: Landscape pattern
The data/information for these Indicators will be provided separately by International Data Providers (Bioversity International and EC JRC). Data/information for Indicator 4.6 will be presented to National Correspondents before it is published, and data/information for Indicator 4.7. will be presented in the Publication in the form of maps. Technical Specifications for reporting by IDPs is available in a separate document prepared for your information.
39
Enquiry on improved Pan-European Indicators for Sustainable Forest Management - 2011 final
Reporting Form 4.8: Threatened forest species
Pan-European indicator 4.8: Number of threatened forest species, classified according to IUCN Red List categories in relation to total number of forest species
Related SoEF definitions: Forest species, Vulnerable, Endangered, Critically endangered, Extinct in the wild
Data sources:
References to sources of information Quality (H/M/L)
Table 4.8 Category Year(s) Type of
inventoryAdditional comments
Table 4.8: Threatened forest species
Category Year Total of taxaThreatened forest species
Vulnerable Endangered Critically endangered
Extinct in the wild
Absolute numberTrees 2010
200520001990
Birds 2010200520001990
Mammals 2010200520001990
Other vertebrates
2010200520001990
Invertebrates 2010200520001990
Vascular plants 2010200520001990
Cryptogams and fungi
2010200520001990
40
Enquiry on improved Pan-European Indicators for Sustainable Forest Management - 2011 final
Country comments:Category Comments related to data,
definitions, etc.Comments on trend(s)
General comments Please specify which main taxa in the table and reporting notes are not assessed in your country:
Endangered trees Endangered birds Endangered mammalsEndangered other vertebratesEndangered invertebratesEndangered vascular plantsEndangered cryptogams and fungiThe year and data reported for 2010
Reporting notes:1. Data sources: please report data sources separately for threat classes in case sources differ; 2. For 2010, please provide data or estimates for the most recent year available, and indicate the year and data status in “Country comments”;3. Detailed national Red Lists should be used whenever possible.
41
Enquiry on improved Pan-European Indicators for Sustainable Forest Management - 2011 final
Reporting Form 4.9: Protected forests
Pan-European indicator 4.9: Area of forest and other wooded land protected to conserve biodiversity, landscapes and specific natural elements, according to MCPFE Assessment Guidelines
Related SoEF definitions: Forest, Other wooded land, MCPFE Classes 1.1, 1.2, 1.3, and Class 2
Data sources:
References to sources of information Quality (H/M/L)
Table 4.9 Category Year(s) Type of
inventoryAdditional comments
Table 4.9: Protected forests
Category YearMCPFEClass 1.1
MCPFEClass 1.2
MCPFEClass 1.3
MCPFEClass 2
(1000 ha)Forest 2010
200520001990
Other wooded land 2010200520001990
Total forest and other wooded land 2010200520001990
Table 4.9b: Natura 2000 forest areas
Category Year
Natura2000 - total area
MCPFE Protected Forest Areas overlapping with Natura2000 areas
Natura 2000 areas with landscape
management outside MCPFE Class 2
MCPFEClass 1.1
MCPFEClass 1.2
MCPFEClass 1.3
MCPFEClass 2
(1000 ha)Forest 2010
20052000
Other wooded land 201020052000
Total forest and other wooded land
201020052000
Country comments:Category Comments related to data,
definitions, etc.Comments on trend(s)
FOWL: MCPFE Class 1.1FOWL: MCPFE Class 1.2FOWL: MCPFE Class 1.3
42
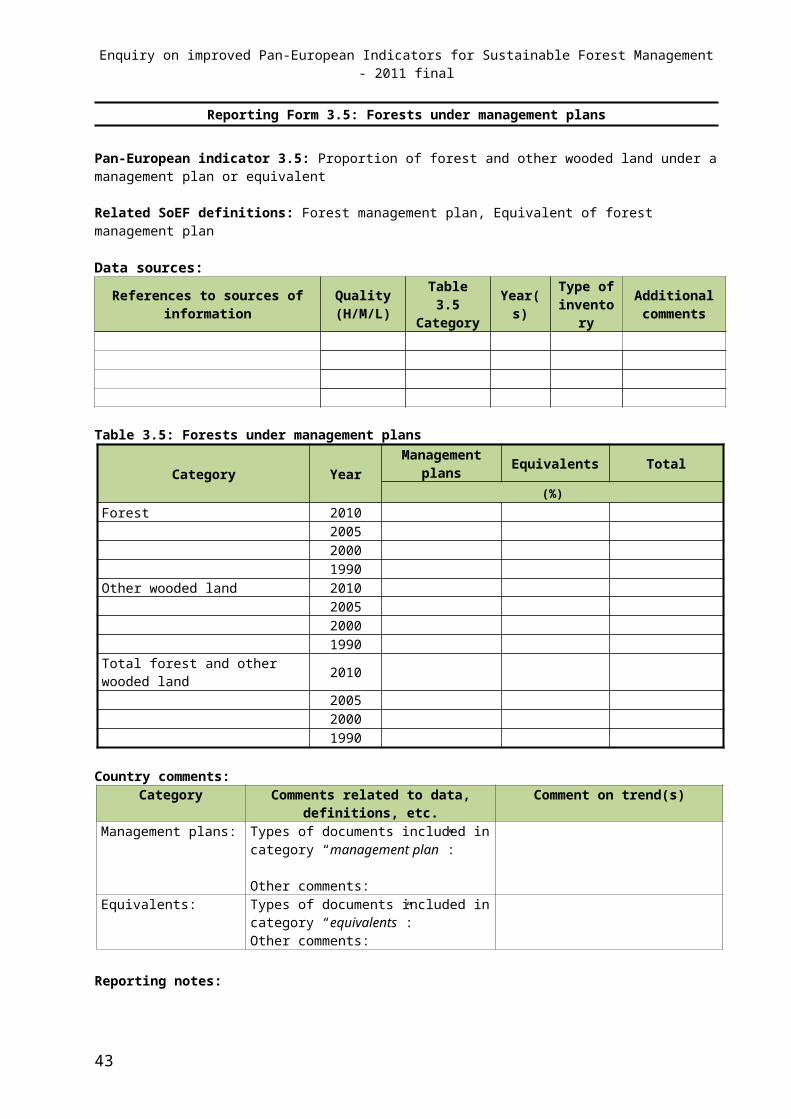
Enquiry on improved Pan-European Indicators for Sustainable Forest Management - 2011 final
FOWL: MCPFE Class 2FOWL: Natura 2000 areas with landscape management outside MCPFE Class 2
Reporting notes: 1. MCPFE classes: see “Terms and Definitions”, and MCPFE Assessment Guidelines as well as the relevant
Explanatory Note.2. Using the data reported for the “State of Europe’s Forest s 2007” (http://www.unece.org/timber/tc-publ.htm) as the
basis, please determine status of protection of the areas reported in the different protection classes in your country for the years 1990, 2000 and 2005 as far as possible. Please document the process for further reference and use “Country comments” for reporting on major aspects. Please also indicate the reason for changing the figures, if new data will replace previously reported results.
3. Data for 2010 may require the use of extrapolation, if updated information is not available. Determining state for “Reference year 2010”: please assess status of each sub-class for the most recent year as far as possible.
4. Data sources: please specify sources separately for forest, other wooded land and total FOWL if sources differ.5. For reporting of Natura 2000 areas by EU countries, pl., see the Explanatory Note.6. In the first reporting column of Table 4.9b “Natura 2000 - total area” should be reported total areas of forest,
OWL and FOWL, respectively, under Natura 2000 and should not be limited to areas in MCPFE classes 1.1, 1.2, 1.3 and 2 and other Natura 2000 areas with landscape management shown in the rest of the table.
43
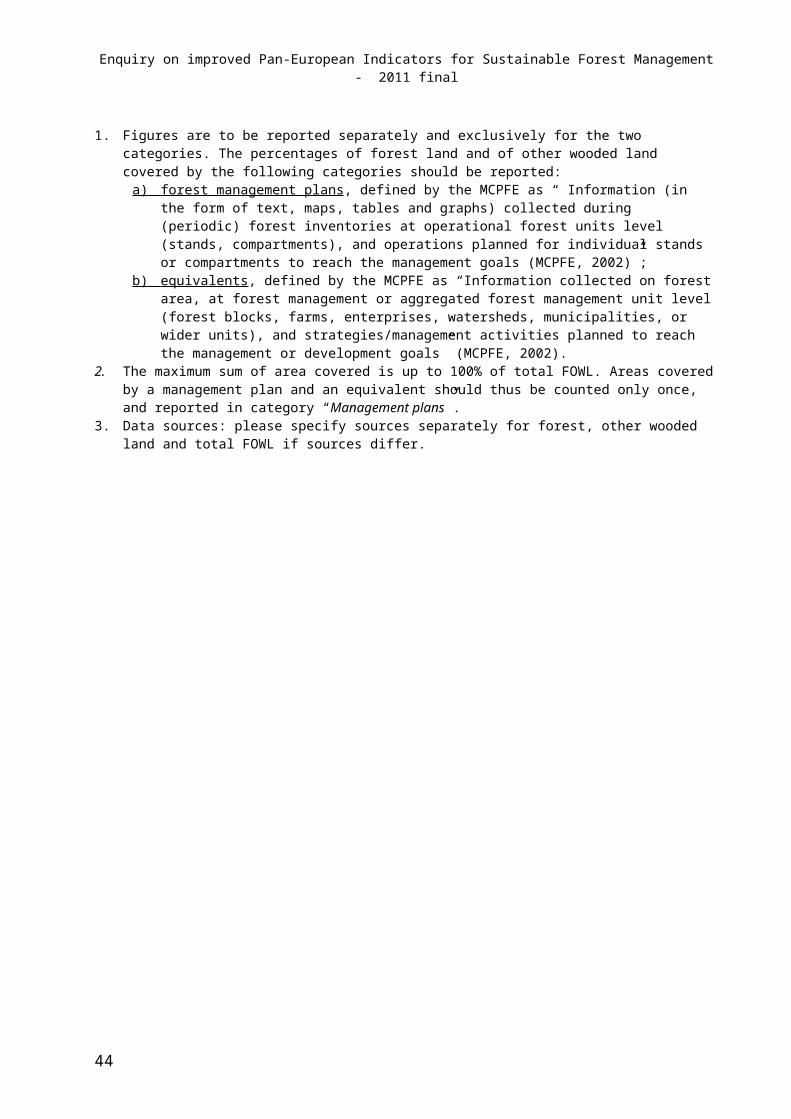
Enquiry on improved Pan-European Indicators for Sustainable Forest Management - 2011 final
Reporting Form 5.1: Protective forests – soil, water and other ecosystem functions
Pan-European indicator 5.1: Area of forest and other wooded land designated to prevent soil erosion, to preserve water resources, or to maintain other forest ecosystem functions, part of MCPFE Class “Protective Functions”
Related SoEF definitions: Forest, Other wooded land, MCPFE Class 3
Data sources:
References to sources of information Quality (H/M/L)
Table 5.1 Category Year(s) Type of
inventoryAdditional comments
Table 5.1: Protective forests – soil, water and other ecosystem functions
Category Year
Soil, water and other forest ecosystem functions
Subclass of MCPFE Class 3
Natura-2000 areas with protective functions outside
MCPFE Class 3
(1000 ha)Forest 2010
200520001990
Other wooded land 2010200520001990
Total forest and other wooded land
2010200520001990
Country comments:Category Comments related to data,
definitions, etc.Comments on trend(s)
Soil, water and other forest ecosystem functionsSubclass of MCPFE Class 3Natura-2000 areas with protective functions outside MCPFE Class 3
Reporting notes: 1. MCPFE classes: see “Terms and Definitions”, and MCPFE Assessment Guidelines as well as the relevant
Explanatory Note.2. Using the data reported for the “State of Europe’s Forest s 2007” (http://www.unece.org/timber/tc-publ.htm) as
the basis, please determine status of protection of the areas reported in the different protection classes in your country for the years 1990, 2000 and 2005 as far as possible. Please document the process for further reference and use “Country comments” for reporting on major aspects. Please also indicate the reason for changing the figures, if new data will replace previously reported results.
3. Data for 2010 may require the use of extrapolation, if updated information is not available. Determining state for “Reference year 2010”: please assess status of each sub-class for the most recent year as far as possible.
4. Data sources: please specify sources separately for forest, other wooded land and total FOWL if sources differ.
5. For reporting of Natura 2000 areas by EU countries, pl., see the Explanatory Note.
44
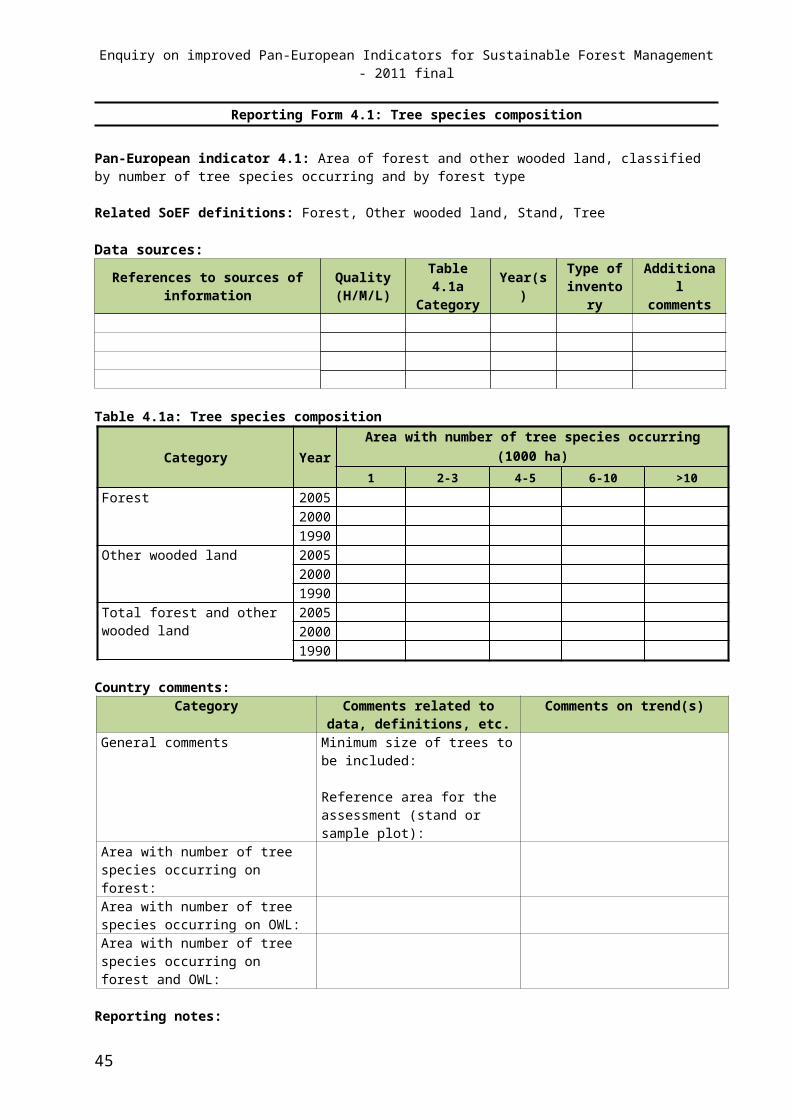
Enquiry on improved Pan-European Indicators for Sustainable Forest Management - 2011 final
Reporting Form 5.2: Protective forests – infrastructure and managed natural resources
Pan-European indicator 5.2: Area of forest and other wooded land designated to protect infrastructure and managed natural resources against natural hazards, part of MCPFE Class “Protective Functions”.
Related SoEF definitions: Forest, Other wooded land, MCPFE Class 3
Data sources:
References to sources of information Quality (H/M/L)
Table 5.2 Category Year(s) Type of
inventoryAdditional comments
Table 5.2: Protective forests – infrastructure and managed natural resources
Category Year
Infrastructure and managed natural resources
Subclass of MCPFE Class 3
Natura-2000 areas with protective functions outside
MCPFE Class 3
(1000 ha)Forest 2010
200520001990
Other wooded land 2010200520001990
Total forest and other wooded land
2010200520001990
Country comments:Category Comments related to data,
definitions, etc.Comments on trend(s)
Infrastructure and managed natural resources Subclass of MCPFE Class 3Natura 2000 areas with protective functions outside MCPFE Class 3
Reporting notes: 1. The intention of this indicator is to identify those forests where protection of infrastructure and managed
natural resources is the primary management objective. “Infrastructure” includes roads, railways, settlements, buildings, etc. “Natural resources” includes e.g. agricultural land, vineyards, orchards. This class also includes protective forests with the primary management objective being the protection of humans (e.g. from noise or visibility protection).
2. MCPFE classes: see “Terms and Definitions”, and MCPFE Assessment Guidelines as well as the relevant Explanatory Note.
3. Using the data reported for the “State of Europe’s Forest s 2007” (http://www.unece.org/timber/tc-publ.htm) as the basis, please determine status of protection of the areas reported in the different protection classes in your country for the years 1990, 2000 and 2005 as far as possible. Please document the process for further reference and use “Country comments” for reporting on major aspects. Please also indicate the reason for changing the figures, if new data will replace previously reported results.
4. Data for 2010 may require the use of extrapolation, if updated information is not available. Determining state for “Reference year 2010”: please assess status of each sub-class for the most recent year as far as possible.
45
Enquiry on improved Pan-European Indicators for Sustainable Forest Management - 2011 final
5. Data sources: please specify sources separately for forest, other wooded land and total FOWL if sources differ.
6. For reporting of Natura 2000 areas by EU countries, pl., see the Explanatory Note.
Reporting Form 6.1: Forest holdings
Pan-European indicator 6.1: Number of forest holdings, classified by ownership categories and size classes
Related SoEF definitions: Forest, Forest holding, Forms of ownership, Forest ownership, Public ownership, Private ownership, Other ownership.
Data sources:
References to sources of information Quality (H/M/L)
Table 6.1 Category Year(s) Type of
inventoryAdditional comments
Table 6.1: Forest holdings
Category Year
Total forest area
(1000 ha)
Total number
of holdings
Number of forest holdings in size classes
<10 ha 11 -100 ha
101 - 500 ha
501 - 10,000
ha>10,000 ha
In public ownership 2010200520001990
In private ownership 2010200520001990
Other ownership 2010200520001990
Country comments:Category Comments related to data, definitions, etc Comments on trend(s)
General comments Minimum size of forest holding reported:
Number of holdings in public ownership Number of holdings in private ownershipNumber of holdings in other ownership: The year and data reported for 2010
Reporting notes: 1. Report holdings of forest, not holdings of other wooded land.2. For 2010, please provide data or estimates for the most recent year available, and indicate the year and data
status in “Country comments”.3. Countries where OWL is a significant part of FOWL area may supply information on Forest and OWL
holdings structure under “Country comments”.
46
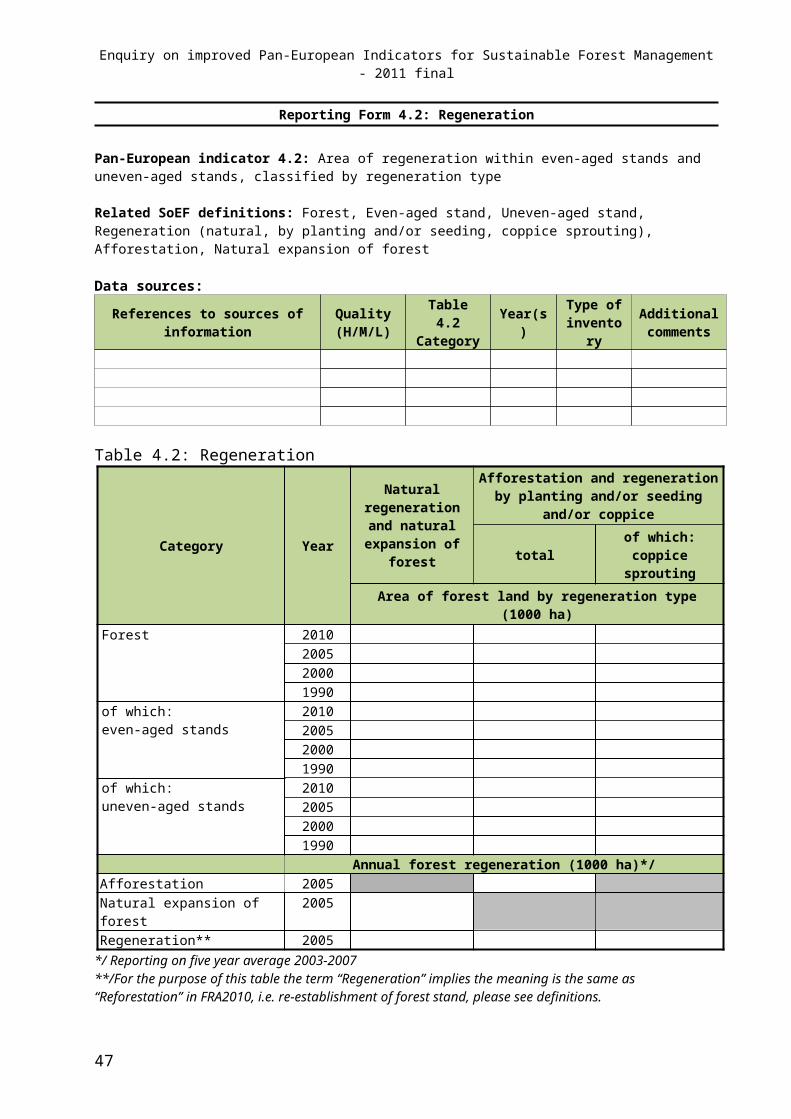
Enquiry on improved Pan-European Indicators for Sustainable Forest Management - 2011 final
47
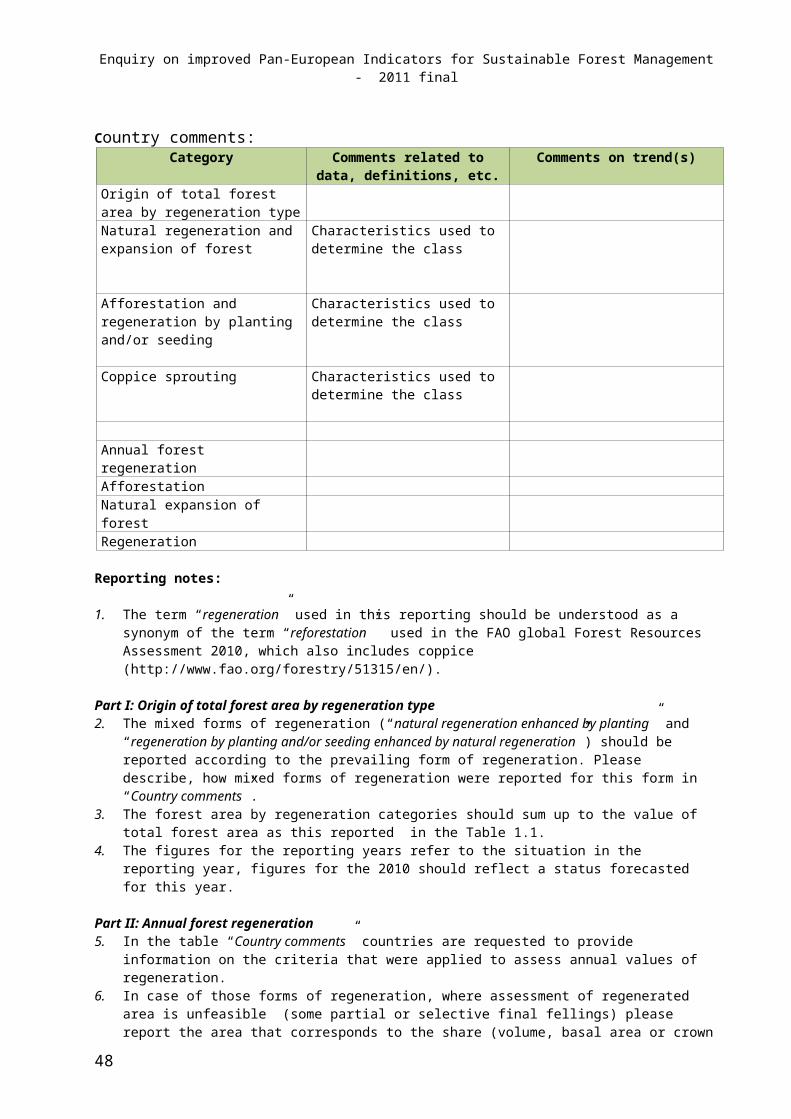
Enquiry on improved Pan-European Indicators for Sustainable Forest Management - 2011 final
Reporting Form 6.2: Contribution of forest sector to GDP
Pan-European indicator 6.2: Contribution of forestry and manufacturing of wood and paper products to gross domestic product
Related SoEF definitions: Gross Domestic Product, Gross Value Added, ISIC/NACE
Data sources:
References to sources of information Quality (H/M/L)
Table 6.2Category Year(s) Additional comments
Table 6.2: Gross Value Added
Category Year
Gross Value Added
Euro/ECU(million) % of total GVA
Forestry (ISIC/NACE 02)
2010200520001990
Manufacture of wood and articles in wood (ISIC/NACE 20) 2010200520001990
Manufacture of paper and paper products (ISIC/NACE 21) 2010200520001990
Country comments:Category Comments related to data, definitions, etc. Comments on trend(s)
General commentsForestry Manufacture of wood and articles in woodManufacture of paper and paper productsThe year and data reported for 2010
Reporting notes: 1. For the estimation of contribution to Gross Domestic Product (GDP), data on Gross Value Added (GVA) should
be used. GVA measures the contribution to the economy of each individual producer, industry or sector in the country. The link between GVA and GDP can be defined as: GVA + taxes on products - subsidies on products = GDP.
2. For 2010, please provide data or estimates for the most recent year available, and indicate the year and data status in “Country comments”.
3. Data on GVA for each economic activity should be available from the National Accounts prepared by the country’s national statistical authority. If a different source is used, please explain in comments.
4. Figures for each year should be converted from national currency to Euro (or ECU for 1990) using average exchange rate for that year (as reported in the table in the introduction).
48
Enquiry on improved Pan-European Indicators for Sustainable Forest Management - 2011 final
5. The main sources for value-added are the following: 1) For EU/EFTA countries
a. Eurostat - National accounts ( http://epp.eurostat.ec.europa.eu/portal/page/portal/national_accounts/data/database ) b. Eurostat - Annual detailed enterprise statistics - industry and construction (http://epp.eurostat.ec.europa.eu/portal/page/portal/european_business/data/database )
2) For other countries (non-EU): a. UNIDO International Yearbook of Industrial Statistics (http://www.unido.org/index.php?id=o3472 ) b. UNdata - National Accounts Official Country Data (http://data.un.org/Explorer.aspx?d=SNA )
3) For all countries (in case statistics cannot be found in Eurostat & UNIDO), statistics available from national Statistics Offices should be checked; main links to the list of sources by country are listed in the publications below:
a. http://www.fao.org/docrep/011/k4588e/k4588e00.htm (see pages 61 to 65) b. SoEF 2007, see page 158
6. Sources of pre-filled data:Eurostat Database on National Accounts (2010).*/ Eurostat Integrated Environmental and Economic Accounting for Forests (IEEAF).
49
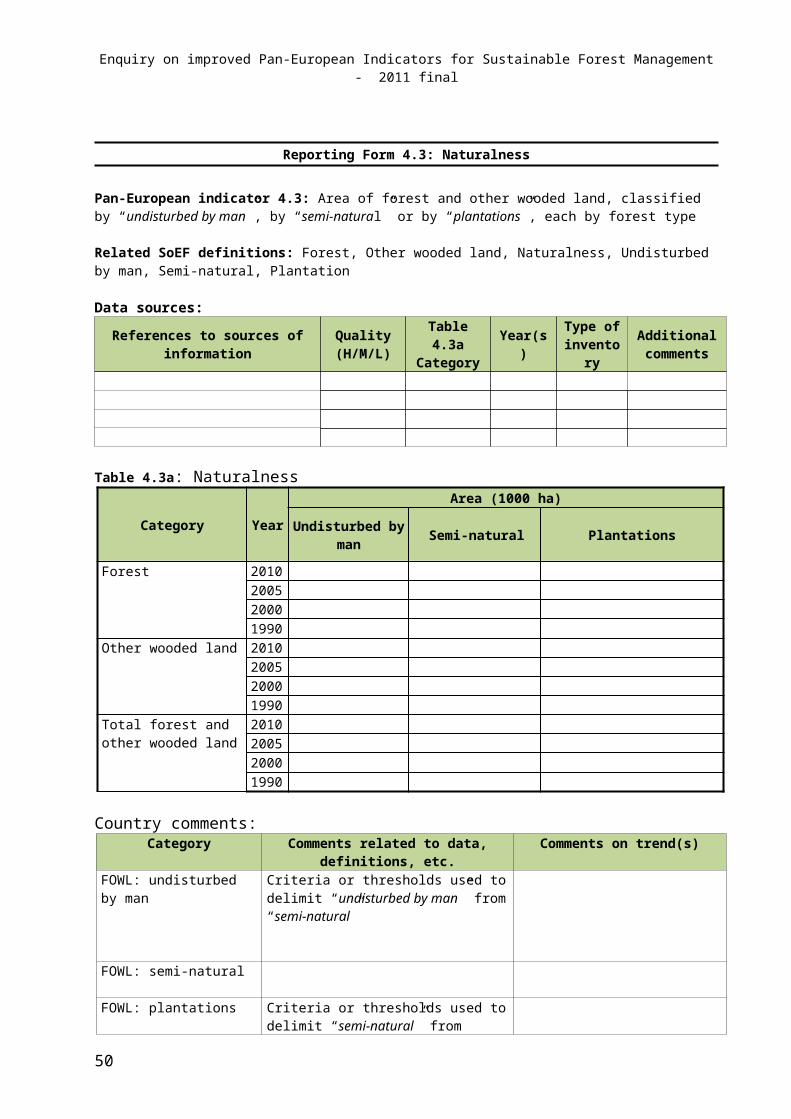
Enquiry on improved Pan-European Indicators for Sustainable Forest Management - 2011 final
Reporting Form 6.3: Net revenue
Pan-European indicator 6.3: Net revenue of forest enterprises
Related SoEF definitions: Factor income, Net entrepreneurial income
Data sources:
References to sources of information Quality (H/M/L)
Table 6.3 Category Year(s) Additional comments
Table 6.3: Factor income and entrepreneurial income
CategoryYear Factor income Net entrepreneurial income
Euro/ECU(million)
Euro/ECU(million)
Forestry (ISIC/NACE 02)
2010200520001990
Country comments:Category Comments related to data, definitions, etc. Comments on trend(s)
General commentsFactor incomeEntrepreneurial incomeThe year and data reported for 2010
Reporting notes:1. For countries that completed EUROSTAT Economic Accounts for Forestry, or the economic accounts table in
IEEAF, this table has been pre-filled to the extent possible using data from EUROSTAT. These should be validated by the national correspondent, consulting with the person responsible for reporting to EUROSTAT. If information is not available from this source, please consult a statistician responsible for National Accounts, who may be able to assist.
2. Factor income measures the remuneration of all factors of production (land, capital, labour) and represents all the value generated by a unit engaged in a production activity. It can be derived from Gross Value Added (GVA) by deducting fixed capital consumption (depreciation) to get net value added, and then adjusting from basic prices to factor cost by subtracting any taxes on production and adding any subsidies on production.
3. Net entrepreneurial income measures the return to the forestry business owner, and consists of the compensation of unpaid labour, remuneration from land belonging to units and the yield arising from the use of capital. It can be derived from factor income by subtracting compensation of employees to get operating surplus, and then adding any interest received by forestry units organized as companies and deducting any rent and interest payments.
4. For 2010, please provide data or estimates for the most recent year available, and indicate the year and data status in “Country comments”.
5. Figures for each year should be converted from national currency to Euro (or ECU for 1990) using average exchange rate for that year (as reported in the table in the introduction).
6. Source of definitions: Manual on the economic accounts for Agriculture and Forestry EAA/EAF 97 (Rev. 1.1.)http://europa.eu.int/estatref/info/sdds/en/cosa/eaa_eaf_rev1_1.pdf
7. Sources of pre-filled data:1990, 2000: Eurostat Economic Accounts for Agriculture and Forestry.*/ National figures2005, 2010: Eurostat Integrated Environmental and Economic Accounting for Forests.
50
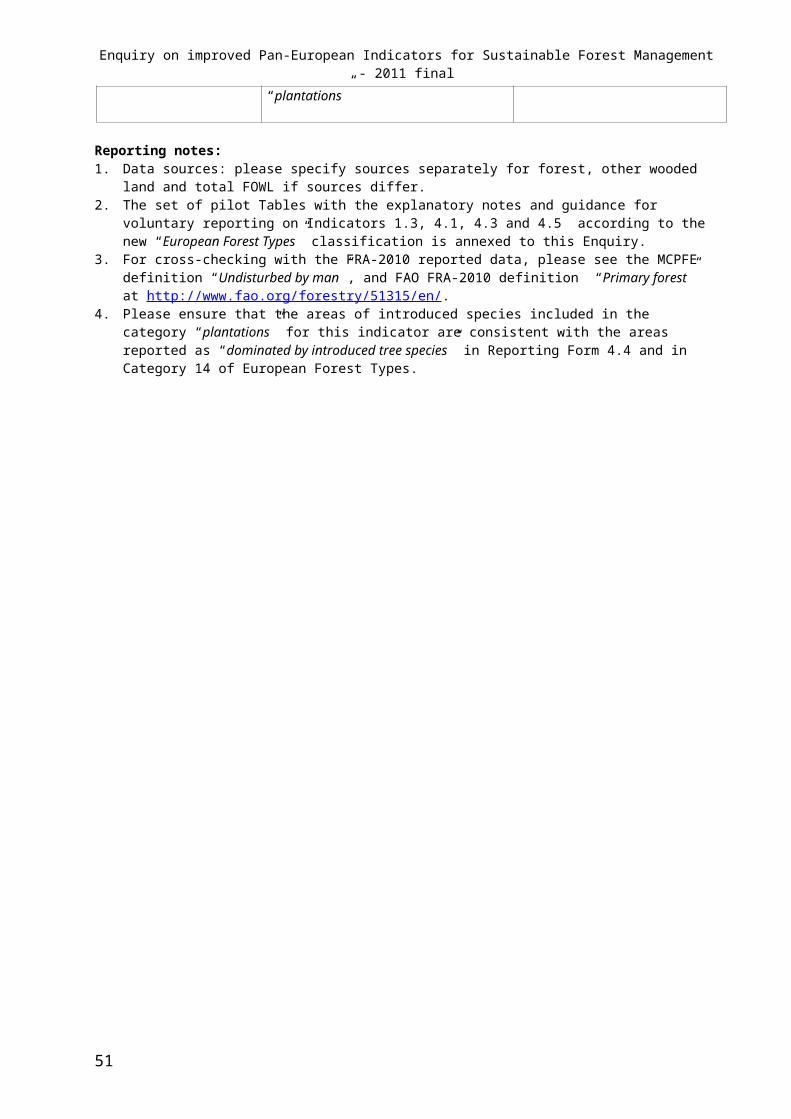
Enquiry on improved Pan-European Indicators for Sustainable Forest Management - 2011 final
51
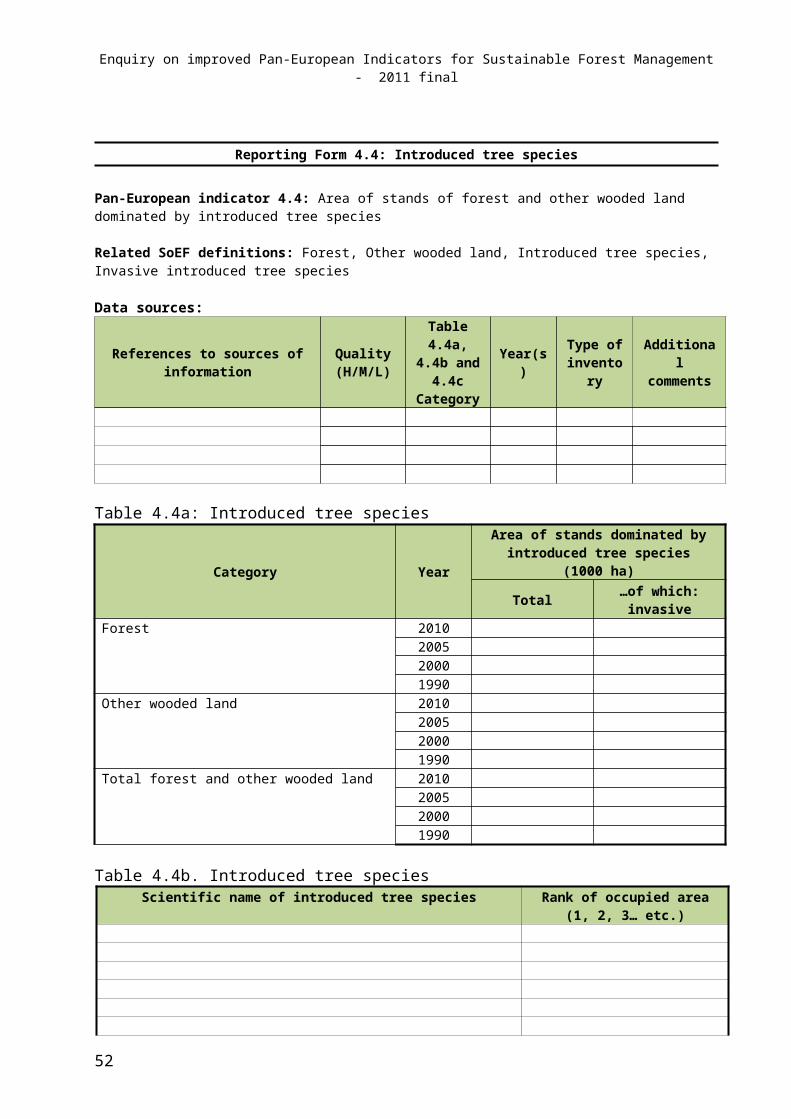
Enquiry on improved Pan-European Indicators for Sustainable Forest Management - 2011 final
Reporting Form 6.4: Expenditures for services
Pan-European indicator 6.4: Total expenditures for long-term sustainable services from forests
Related SoEF definitions: Forest, Other wooded land, Government expenditures
Data sources:
References to sources of information Quality (H/M/L)
Table 6.4 Category Year(s) Additional comments
Table 6.4: Government expenditures for forest services
Category Year Euro/ECU(million)
Ecological services 2010200520001990
Biospheric services 2010200520001990
Social and amenity services 2010200520001990
Other services 2010200520001990
Country comments:Category Comments related to data, definitions, etc. Comments on trend(s)
General commentsEcological servicesBiospheric servicesSocial and amenity servicesOther servicesThe year and data reported for 2010
Reporting notes:
1. For more information about forest services classification please look at reporting note 2 in “Reporting form 3.4”.
2. The reported expenditures should consist of government expenditures to provide or to stimulate others to provide long-term forest services. They should be limited to expenditures applied directly to forests, to enhance or to maintain the environmental capital. They should exclude any related expenditures on research or education, and should also exclude any current expenditures involved in delivering services (e.g. staff to look after visitors). If information is only available on a different basis, please provide whatever data best matches this description and provide details in “Country comments”.
3. Reference area for reporting is “Total FOWL”, not further divided into sub-classes “Forest” and “Other wooded land”. If data are available for sub-class “Forest” only, please report on this sub-class and provide note under “Country comments”.
52
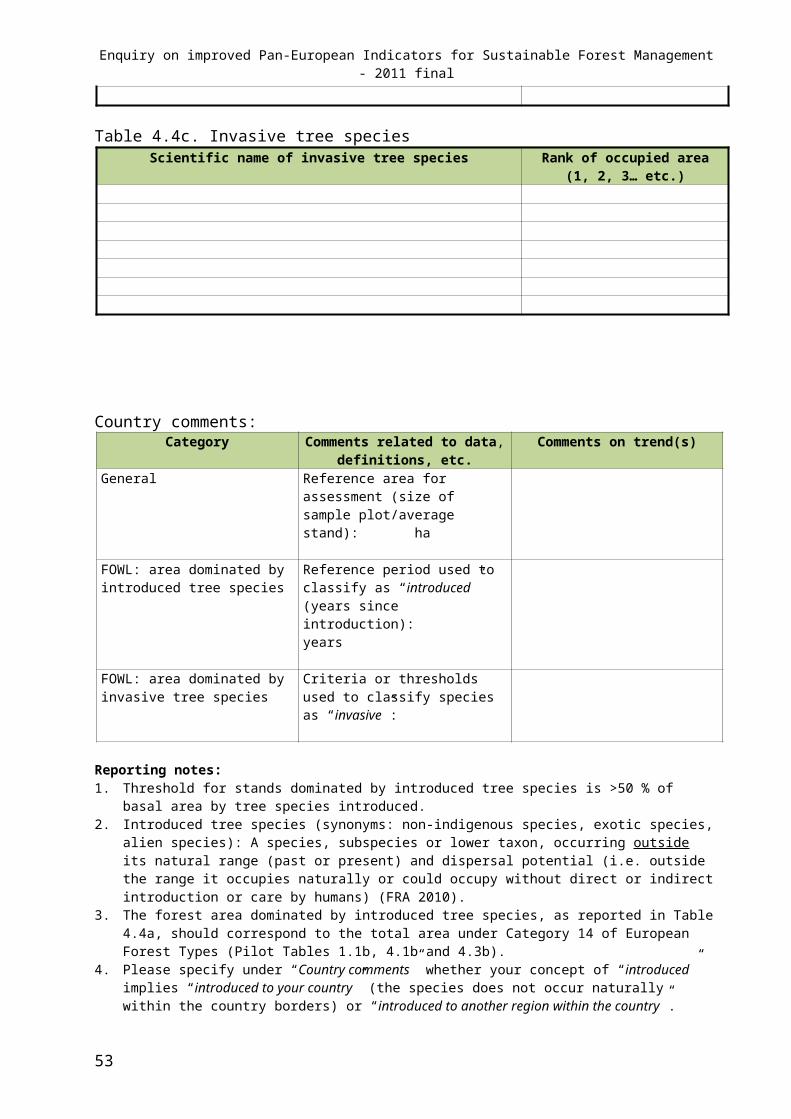
Enquiry on improved Pan-European Indicators for Sustainable Forest Management - 2011 final
4. If data are available only for certain forest areas or ownership classes (e.g. state forests), but not for others, data should be reported for these areas or classes, which should be specified in “Country comments”.
5. The class “Ecological Services” includes expenditures for maintaining and enhancing the natural habitat and biological diversity and contracts for conservation.
6. The class “Biospheric Services” includes expenditures to maintain protective forests against natural hazards, for preventing soil erosion or for protecting water quality.
7. The class “Social and amenity services” includes expenditures for developing or managing outdoor recreation areas or trails for mountain biking, horse riding, skiing and other recreational activities.
8. The class “Other services” includes expenditures on any aspects not covered above, e.g. to maintain cultural or spiritual values.
9. For 2010, please provide data or estimates for the most recent year available, and indicate the year and data status in “Country comments”.
10. Figures for each year should be converted from national currency to Euro (or ECU for 1990) using average exchange rate for that year (as reported in the table in the introduction).
53
Enquiry on improved Pan-European Indicators for Sustainable Forest Management - 2011 final
Reporting Form 6.5: Forest sector workforce
Pan-European indicator 6.5: Number of persons employed and labour input in the forest sector, classified by gender and age group, education and job characteristics
Related SoEF definitions: Labour Force Survey, Education, Job characteristics
Data sources:
References to sources of information Quality (H/M/L)
Table 6.5a and 6.5b Category
Year(s)Additional comments on the
reliability of the data (data collection procedure)
Table 6.5a: Employment (thousand FTE) by gender and age
CategoryYear Total Gender Age group
Male Female 15-49 50+Forestry (ISIC/NACE 02)
2010200520001990
Manufacture of wood and articles in wood (ISIC/NACE 20)
2010200520001990
Manufacture of paper and paper products (ISIC/NACE 21)
2010200520001990
Table 6.5b: Employment (thousand FTE) by education and job characteristics
Category
Year Education(Categories ISCED 1997) Job characteristics
0-2 3-4 5-6 Employees Self-employed
Forestry (ISIC/NACE 02)
2010200520001990
Manufacture of wood and articles in wood (ISIC/NACE 20)
2010200520001990
Manufacture of paper and paper products (ISIC/NACE 21)
2010200520001990
54

Enquiry on improved Pan-European Indicators for Sustainable Forest Management - 2011 final
Category Comments related to data, definitions, etc Comments on trend(s)General comments Scope of employment reported (if not from
LFS):
Comments on employment which is not covered by the sources used:
Total employment Employment by genderEmployment by age groupEmployment by education levelEmployment by job characteristicsThe year and data reported for 2010
Reporting notes:1. The recommended source for all data is the Labour Force Survey (LFS), which provides all the breakdowns
requested. If LFS data are not available, please provide the best statistics or estimates from other sources. If using other sources, e.g. survey of businesses, note that the desired scope includes the self-employed, and that forestry (ISIC/NACE 02) is limited to those working primarily in forestry, so excludes e.g. agricultural workers who undertakes some forestry work, or government employees classified as public administration.
2. Countries should extrapolate from the available data to provide estimates for all years requested in the table. For countries in which sample data are based on relatively small numbers in forest sectors, it is recommended to pool data and calculate averages for 3 or 5-year periods around the reporting dates. EUROSTAT will provide the annual data available, with an indication of sample sizes or other indicators of reliability, to enable national correspondents to judge how best to present the data.
3. Report numbers as thousands of full-time equivalent (FTE).4. If estimating the breakdown by education level using other sources, note that categories 0-2 covers those with
no more than lower secondary education, categories 5-6 cover those with tertiary (higher) education, and categories 3-4 cover all others ( other secondary and post-secondary), for more details see terms and definitions.
5. The category ‘self-employed’ should also include unpaid family workers.6. For 2010, please provide data or estimates for the most recent year available, and indicate the year and data
status in “Country comments”.7. In order to obtain more reliable data, average values from three years have been calculated for pre-filling:
1990: 1992-19942000: 1999-20012005: 2004-20062010. 2006-2008
8. Source of pre-filled data: Eurostat Labour Force Survey
55
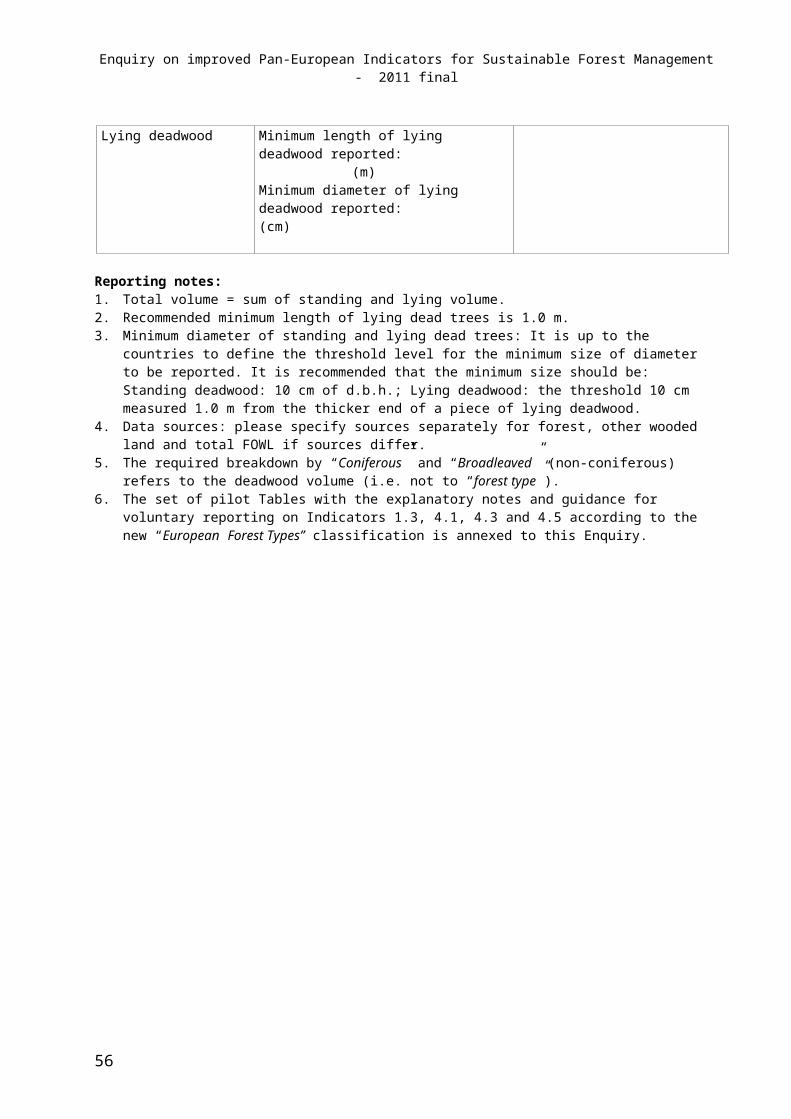
Enquiry on improved Pan-European Indicators for Sustainable Forest Management - 2011 final
Reporting Form 6.6: Occupational safety and health
Pan-European indicator 6.6: Frequency of occupational accidents and occupational diseases in forestry
Related SoEF definitions: Occupational accident, Occupational disease
Data sources:
References to sources of information Quality (H/M/L)
Table 6.6 Category Year(s) Additional comments
Table 6.6: Occupational accidents
CategoryYear Fatal occupational accidents Non-fatal occupational accidents
Number Annual rate per 1000 workers Number Annual rate per 1000
workersForestry (ISIC/NACE 02)
2010200520001990
Country comments:Category Comments related to data,
definitions, etc.Comments on trend(s)
General comments Threshold for reporting non-fatal accidents: days of absence
Fatal accidents Non-fatal accidentsAny comments on occupational diseases
Reporting notes: 1. Note that rates are expressed per 1000 workers. This is a change from SoEF 2007, which gave rates per 100
workers.2. Occupational accidents are occurrences arising out of or in the course of work which result in fatal or non-fatal
occupational injury.3. Figures to be reported are for forestry (ISIC/NACE 02). Do not include injuries in wood processing or injuries
to the public visiting forests.4. A possible threshold for reporting a non-fatal accident is whether it results in over 3 days absence from work,
but different thresholds may be used for national reporting. Please indicate the threshold used in country specifications.
5. Figures are not requested for occupational diseases, because of the lack of data. If information is available for occupational diseases, please include and explain this in country comments.
6. Figures for the reporting years refer to the averages for the 5-year periods 1988-1992, 1998-2002 and 2003-2007 respectively, i.e. not the data for the “central year” (1990, 2000, 2005) noted in the Table above, e.g. 2003-2007 instead of 2005. For 2010 - average values from 2008 and 2009 (if available) should be used.
56
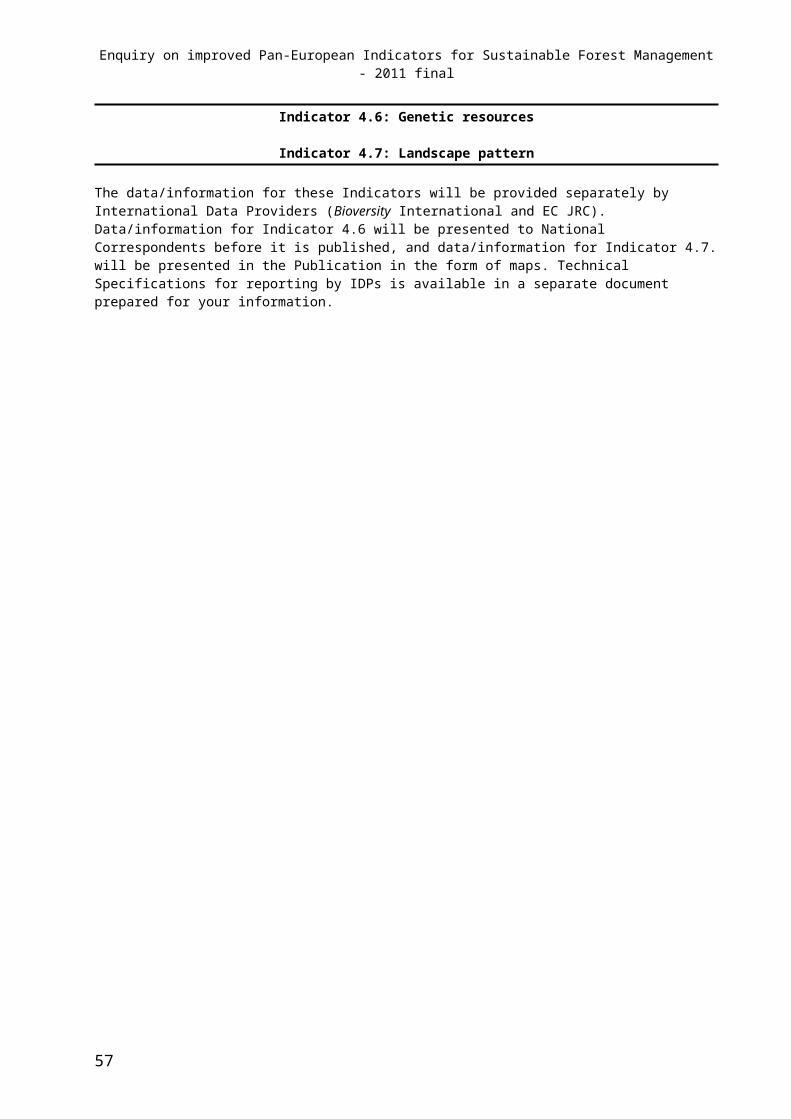
Enquiry on improved Pan-European Indicators for Sustainable Forest Management - 2011 final
Indicator 6.7: Wood consumption
Indicator 6.8: Trade in wood
The data / information for these Indicators will be provided separately by the International Data Provider (UNECE-JFSQ), and it will be presented to National Correspondents before it is published. Technical Specifications for reporting by IDPs is available in a separate document prepared for your information.
57

Enquiry on improved Pan-European Indicators for Sustainable Forest Management - 2011 final
Reporting Form 6.9: Energy from wood
Pan-European indicator 6.9: Share of wood energy in total energy consumption, classified by origin of wood
Related SoEF definitions: Forest, Other wooded land, Forest available for wood supply, Trees outside forests, Total Primary (energy) production, Gross inland (energy) consumption, Direct wood fibre sources, Chips and particles, Wood residues, Black liquor, Energy from processed wood-based fuels, Wood pellets, Briquettes, Charcoal, Wood-based ethanol, Wood-based biodiesel, Post consumer recovered wood
Data sources:
References to sources of information
Quality (H/M/L)
Table 6.9 Categories
Original reporting
unit*/
Year(s) / annual Additional comments
*/TJ, m3, metric tonnes dry matter, etc.
Table 6.9: Total energy production from wood
Category
Reference year 2007
(TJ/yr)(million metric
tonnes dry matter/yr)
Total national primary energy consumption:
Total national primary energy production:
Total energy production from wood:
Energy from direct wood fibre sources:
Forests & other wooded land:
Other land (trees outside forests):
Energy from co-products and residues of the wood processing industries:
Solid residues (chips, particles, wood residues, bark, excluding processed wood-based fuels):
Liquid residues from pulp and paper industry (mainly black liquors)
Energy from processed wood-based fuels (pellets, briquettes, charcoal, wood-based ethanol and wood-based biodiesel):
Energy from post consumer recovered wood:
Country comments:References to
sources of information
Comments related to data, definitions, etcComments on trend(s)*/
General comments
Approach to calculate or estimate wood directly from forests and outside forests (marketed and self-consumption): Conversion factors used to convert to energy/from energy units:
*/ Table 6.9 demands information for 2007 only, information on observed trends is welcome.
58
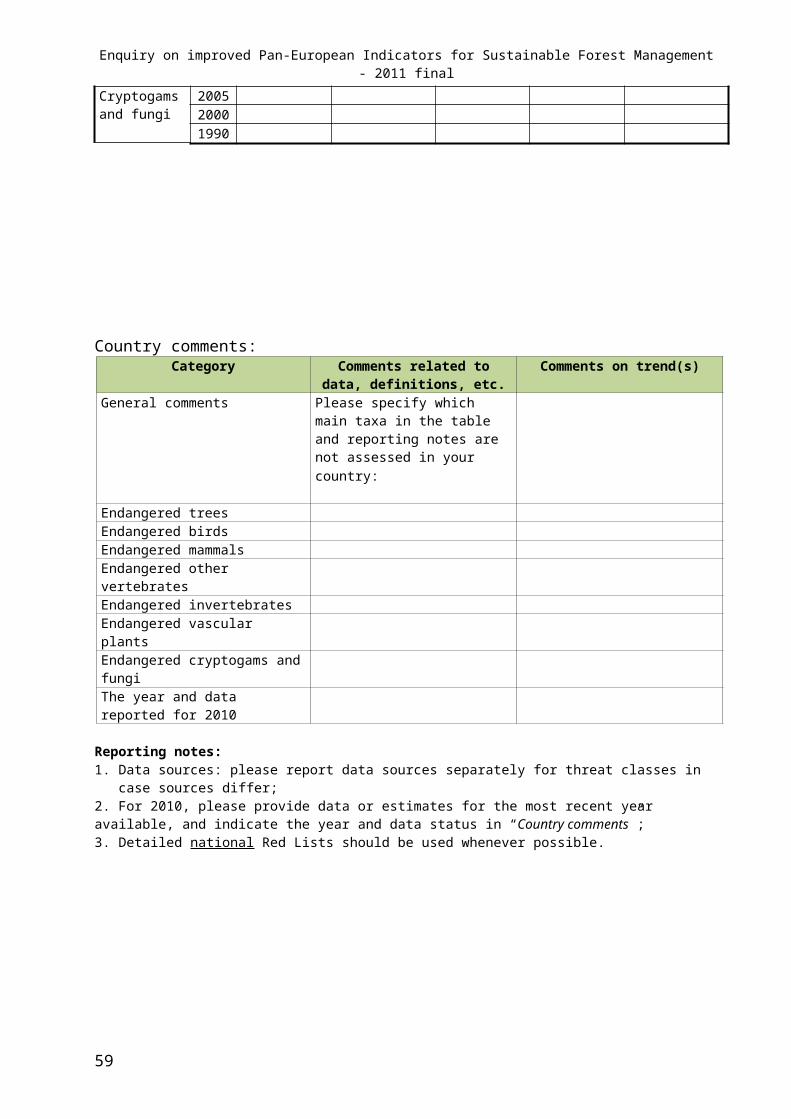
Enquiry on improved Pan-European Indicators for Sustainable Forest Management - 2011 final
Reporting notes: 1. Post consumer recovered wood: Used wood arising from construction of buildings or from civil engineering
works. Recovered wood from transport (pallets), private households, as well as used wood arising from construction or demolition of buildings or from civil engineering works. (source: UNECE Joint Wood Energy Enquiry 2007).
2. The categories in the reporting form are fully consistent with the main categories requested by the Joint Wood Energy Enquiry (JWEE). Countries that responded to the JWEE are requested to provide consistent values for indicator 6.9 and for the JWEE. Note that the total Energy from direct wood fibre sources may include energy produced from wood from unspecified source; the total value for this category could be larger than the sum of energy from Forests & other wooded land and Other land (trees outside forests).
3. Reporting on wood energy is also requested by the European Union - National Renewable Energy Action Plan (NREAP). The Reporting form 6.9 categories are consistent with NREAP reporting, countries are encouraged to use data reported for the Commission's template for the national renewable energy action plans (http://ec.europa.eu/energy/renewables/transparency_platform_en.htm), if applicable.
59
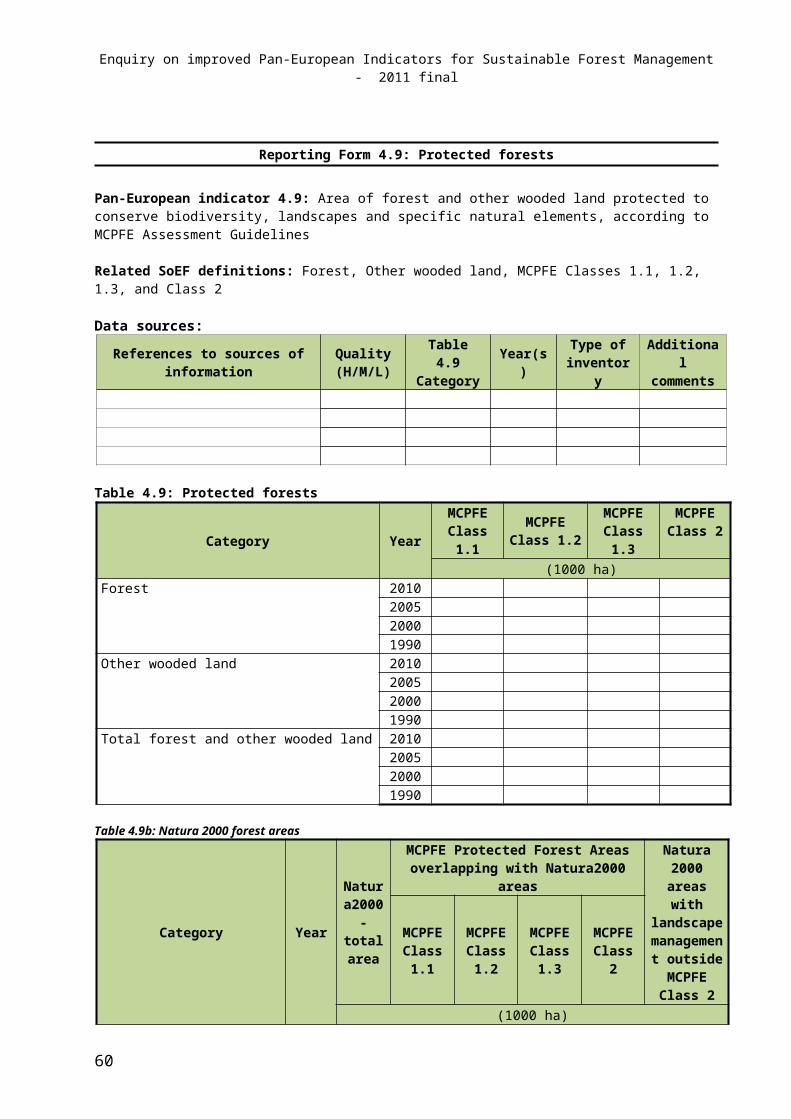
Enquiry on improved Pan-European Indicators for Sustainable Forest Management - 2011 final
Reporting Form 6.10: Accessibility for recreation
Pan-European indicator 6.10: Area of forest and other wooded land where public has a right of access for recreational purposes and indication of intensity of use
Related SoEF definitions: Forest, Other wooded land, Access for recreation, Main management goal, Visit
Data sources:
References to sources of information Quality (H/M/L)
Table 6.10 Category Year(s) Additional comments
Table 6.10: Accessibility for recreation and intensity of use
Category Year
Area with access available to the public for
recreational purposes
Area with recreational use as one main management
goal
Intensity of use
Total (1000 ha)
% of total Total (1000 ha)
% of total Annual number of visits (million)
Total forest and other wooded land
200520001990
Country comments:Category Comments related to data, definitions,
etc. Comments on trend(s)
Area with access available to the public for recreational purposes
Criteria used to include areas in “Access available to the public for recreational purposes”:
Area with recreational use as one main management goal
Criteria used to include areas in “Area with recreation as one main management goal”:
Intensity of use
Reporting notes: 1. The area in category “Access available to the public for recreational purposes” comprises area with a legal
right of access as well as areas with no formal legal right, but with customary rights or other de-facto forms of access available to the public.
2. For “Area with recreational use as one of main management goal”, if information is not available for the scope described in the definition, please provide information for whatever area can be identified that best matches this scope, and describe the basis in country comments.
3. For intensity of use, if information on national numbers of visits is only available for a wider scope (e.g. all countryside) or a narrower scope (e.g. forest parks or state forests), please provide numbers for whatever scope best matches the definition and describe the scope under “Country comments”. If a different definition of visits is used in national data, please also describe this. Where information is not available on national numbers of forest visits, please provide other information on participation in forest recreation under “Country comments”.
4. If the information is available only for forest please report this in the Table 6.10 and explain this in “Country comments”.
60
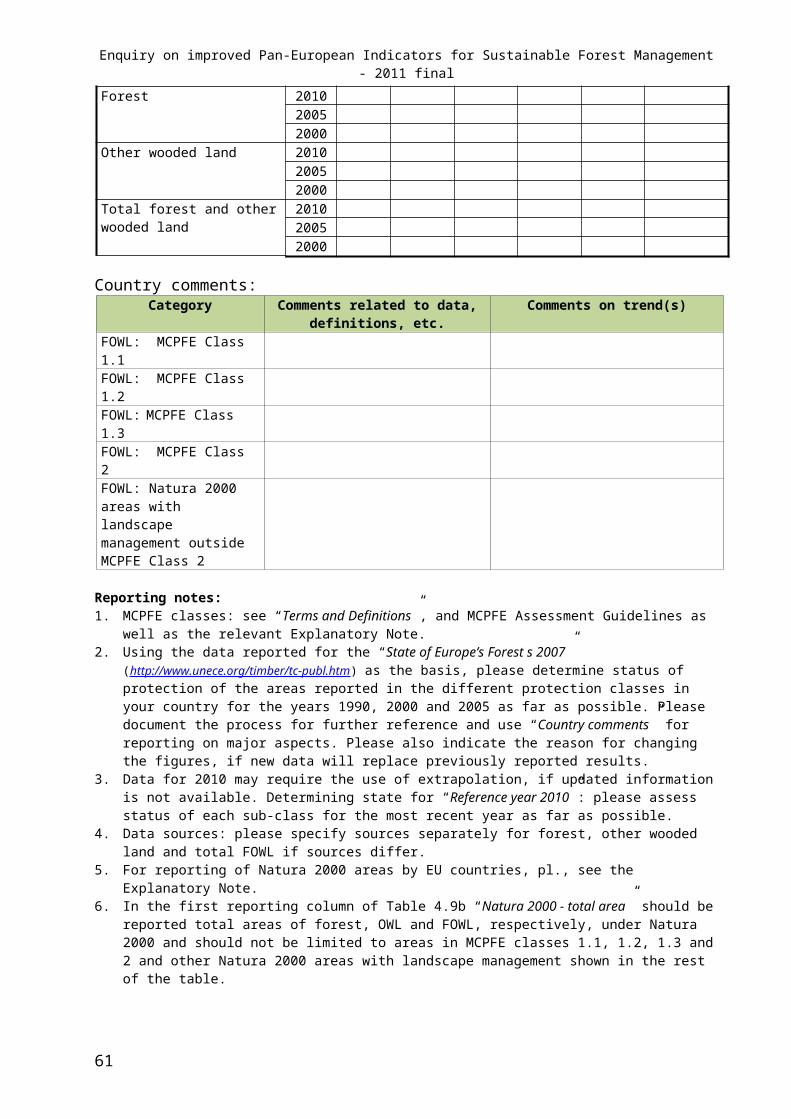
Enquiry on improved Pan-European Indicators for Sustainable Forest Management - 2011 final
Reporting Form 6.11: Cultural and spiritual values
Pan-European indicator 6.11: Number of sites within forest and other wooded land designated as having cultural or spiritual values
Related SoEF definitions: Forest, Other wooded land, Cultural and spiritual values, Cultural heritage, Forested landscapes with cultural & spiritual values, Trees with cultural & spiritual values, Other sites with cultural and spiritual values
Data sources:
References to sources of informationQuality (H/M/L)
Table 6.11
CategoryYear(s) Type of
inventory Additional comments
Table 6.11: Cultural and spiritual values
Category Year
Cultural heritage
Forested landscapes Trees Other sites
Total
of which: associated
with historic forest
management
(number of sites)Sites with recognized cultural & spiritual values in forest and other wooded land
2005
Country comments:Category Comments related to data, definitions and trends
Number of cultural heritage sites
Number of forested landscapes with cultural & spiritual values
Number of trees with cultural & spiritual values
Number of other sites with cultural & spiritual values
Reporting notes: 1. Sites reported here should be sites that are officially and explicitly designated for the protection of cultural and spiritual values and/or are officially recognized for such values, e.g. through governmental bodies, and/or are formally recorded, e.g. in a national database of veteran trees. Please provide a note under “Country comments” to indicate which type of recognition applies to the data in each category;2. The reference area for reporting is “Total FOWL” only, not further divided into sub-classes “Forest” and “Other wooded land”. If data are available for sub-class “Forest” only, please report on this sub-class and provide note under “Country comments”; 3. If data are only available for certain forest areas or ownership classes (e.g. state forests), please report these data and provide a note in “Country comments” to indicate the area (ha) and/or reference to the ownership class; 4. The reporting year is 2005, although data for other recent years may be used if considered to be more accurate. Please record the year that the data applies to under “Country comments”;5. Please record each site only once under the category that best reflects its recognized value or designation. Sites may overlap; for example a cultural heritage feature may be located within a larger site recorded under “Forested landscapes;.6. Please provide details under “Country comments” on which types of sites are included for each category.
61
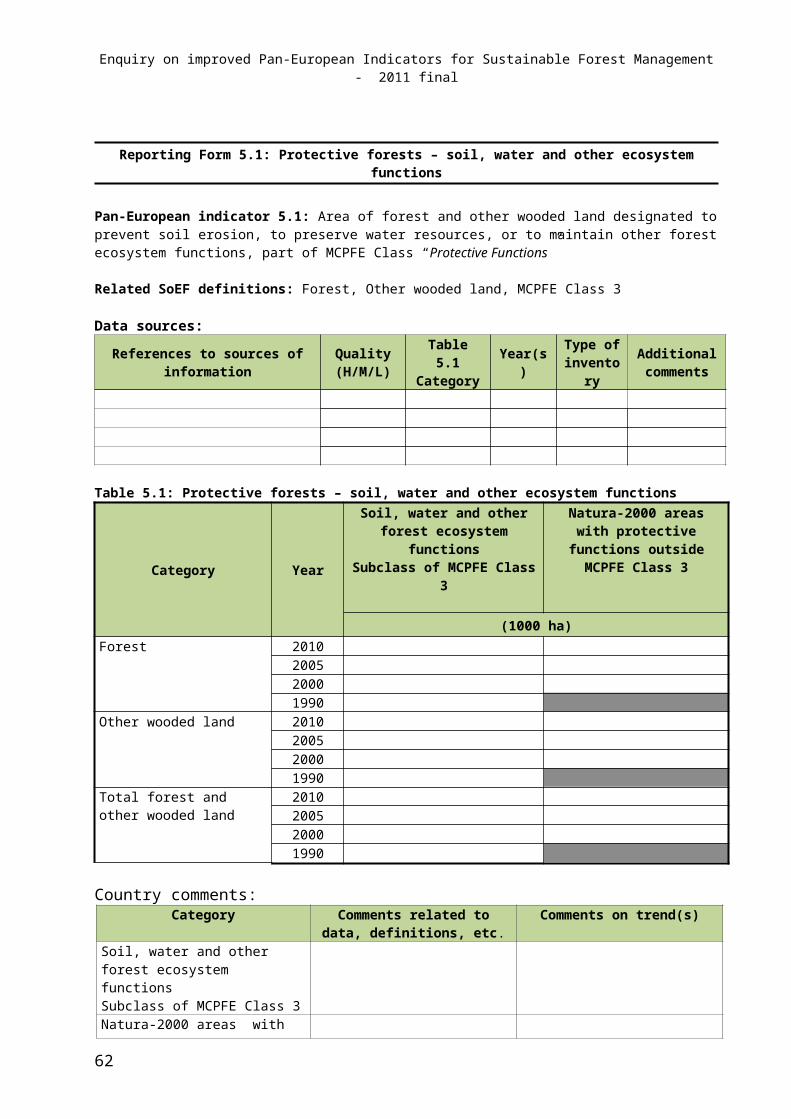
Enquiry on improved Pan-European Indicators for Sustainable Forest Management - 2011 final
Terms and definitions(Sorted in order of SFM indicators, not in alphabetical order)
Criterion I
Indicator 1.1
ForestLand spanning more than 0.5 hectares with trees higher than 5 meters and a canopy cover of more than 10 percent, or trees able to reach these thresholds in situ. It does not include land that is predominantly under agricultural or urban land use.Explanatory notes:1. Forest is determined both by the presence of trees and the absence of other predominant land uses. The trees should be able to reach a minimum height of 5 meters in situ.2. Includes areas with young trees that have not yet reached but which are expected to reach a canopy cover of 10 percent and tree height of 5 meters. It also includes areas that are temporarily unstocked due to clearcutting as part of a forest management practice or natural disasters, and which are expected to be regenerated within 5 years. Local conditions may, in exceptional cases, justify that a longer time frame is used.3. Includes forest roads, firebreaks and other small open areas; forest in national parks, nature reserves and other protected areas such as those of specific environmental, scientific, historical, cultural or spiritual interest.4. Includes windbreaks, shelterbelts and corridors of trees with an area of more than 0.5 hectares and width of more than 20 meters. 5. Includes abandoned shifting cultivation land with a regeneration of trees that have, or is expected to reach, a canopy cover of 10 percent and tree height of 5 meters.6. Includes areas with mangroves in tidal zones, regardless whether this area is classified as land area or not. 7. Includes rubber-wood, cork oak, energy wood and Christmas tree plantations. 8. Includes areas with bamboo and palms provided that land use, height and canopy cover criteria are met.9. Excludes tree stands in agricultural production systems, such as fruit tree plantations (incl. olive orchards) and agroforestry systems when crops are grown under tree cover. Note: Some agroforestry systems where crops are grown only during the first years of the forest rotation should be classified as forest. (Source: FRA 2010, modified)
Forest available for wood supply
Forest where any legal, economic, or specific environmental restrictions do not have a significant impact on the supply of wood.
Includes: areas where, although there are no such restrictions, harvesting is not taking place, for example areas included in long-term utilization plans or intentions (Source: MCPFE 2003, from TBFRA 2000).
Other wooded land
Land not classified as “Forest”, spanning more than 0.5 hectares; with trees higher than 5 meters and a canopy cover of 5-10 percent, or trees able to reach these thresholds in situ; or with a combined cover of shrubs, bushes and trees above 10 percent. It does not include land that is predominantly under agricultural or urban land use.
Explanatory notes:
1. The definition above has two options:
• The canopy cover of trees is between 5 and 10 percent; trees should be higher than 5 meters or able to reach 5 meters in situ. or
• The canopy cover of trees is less than 5 percent but the combined cover of shrubs, bushes and trees is more than 10 percent. Includes areas of shrubs and bushes where no trees are present.
62
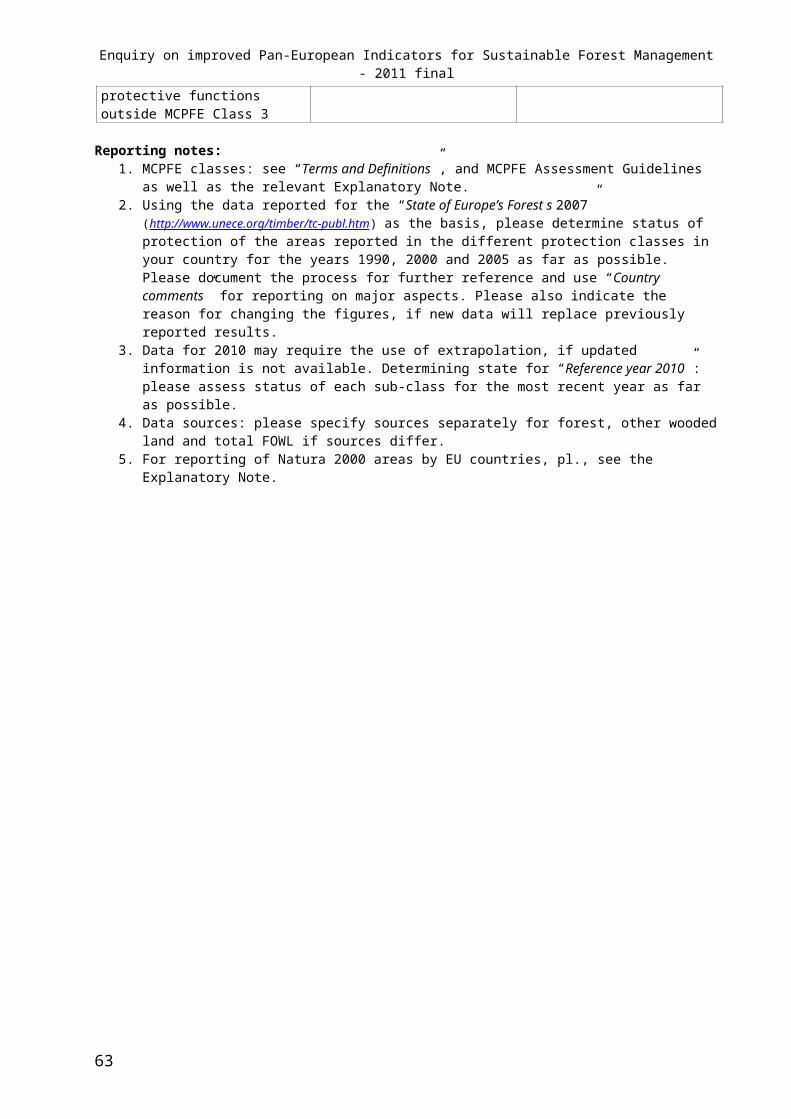
Enquiry on improved Pan-European Indicators for Sustainable Forest Management - 2011 final
2. Includes areas with trees that will not reach a height of 5 meters in situ and with a canopy cover of 10 percent or more, e.g. some alpine tree vegetation types, arid zone mangroves, etc.3. Includes areas with bamboo and palms provided that land use, height and canopy cover criteria are met. (Source: FRA 2010)
Other land
All land that is not classified as “Forest” or “Other wooded land”.
Explanatory notes:
1. Includes agricultural land, meadows and pastures, built-up areas, barren land, land under permanent ice, etc.2. Includes all areas classified under the sub-category “Other land with tree cover”. (Source: FRA 2010)
European Forest Types
Forest types are classified based on new European Forest Types scheme documented in Annex 1. The new European Forest Types is a system for the classification of “Forest” land, based on a two-level system of nomenclature: ca 80 forest types grouped into 14 main forest categories.
Explanatory notes:
1. The European Forest Type classification covers only “Forest” as defined above; it excludes tree stands in agricultural production systems (e.g. olive groves).
2. The 14 categories are applied for reporting by forest types for selected indicators.
3. The European Forest Types scheme classifies actual forest vegetation not potential forest communities; potential forest communities are not necessarily aligned with actual forest vegetation, as surveyed by forest inventory systems (e.g. national forest inventory, stand inventory, forest management plans). (Source: EEA 2006, modified)
Forest type classification applied for SoEF2007Forest types are classified as follows, based on EUNIS Top Level and TBFRA 2000: - predominantly broadleaved woodland: Forest/other wooded land on which more than 75 percent of the tree
crown cover consists of broadleaved species- predominantly coniferous woodland: Forest/other wooded land on which more than 75 percent of the tree crown
cover consists of coniferous species- mixed broadleaved and coniferous woodland: Forest/other wooded land on which neither coniferous, nor
broadleaved species account for more than 75 percent of the tree crown cover.(Source: MCPFE 2003)Note: “other wooded land” is excluded from this definition for the SoEF 2010 reporting.
Indicator 1.2
Growing stockThe living tree component of the standing volume (MCPFE 2003, from TBFRA 2000). Volume over bark of all living trees more than X cm in diameter at breast height (or above buttress if these are higher). Includes the stem from ground level or stump height up to a top diameter of Y cm, and may also include branches to a minimum diameter of W cm.Explanatory notes:1. Countries must indicate the three thresholds (X, Y, W in cm) and the parts of the tree that are not included in the volume. They must also indicate whether the reported figures refer to volume above ground or above stump. These specifications should be applied consistently through the time series.2. Includes windfallen living trees.3. Excludes smaller branches, twigs, foliage, flowers, seeds, and roots. (Source: FRA 2010)
Broadleaved
63
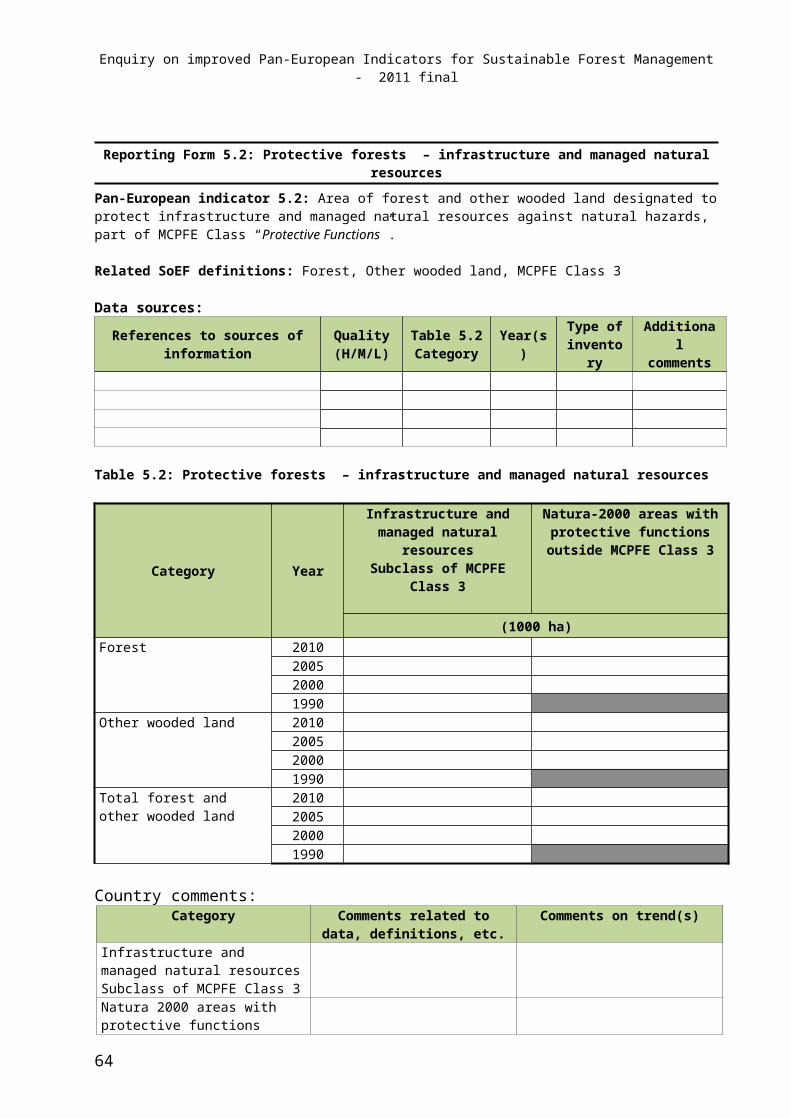
Enquiry on improved Pan-European Indicators for Sustainable Forest Management - 2011 final
All trees classified botanically as Angiospermae They are sometimes referred to as “non-coniferous” or “hardwoods” (Source: TBFRA 2000).
ConiferousAll trees classified botanically as Gymnospermae They are sometimes referred to as “softwoods” (Source: TBFRA 2000).
Indicator 1.3
StandA community of trees possessing sufficient uniformity in composition, age, arrangement or condition to be distinguishable from the forest or other growth on adjoining areas, thus forming a temporary silvicultural or management entity (Source: IUFRO, 2000).
Even-aged standA stand or forest type, in which no or relatively small age differences exist among individual trees within it, usually less than 20% of rotation length (Source: IUFRO, 2000).
Uneven-aged standConsisting of trees of a range of age classes, with age differences which are significant in relation to the stand structure management and rotation length (Source: IUFRO, 2000).
Indicator 1.4Carbon in above ground biomassCarbon in all living biomass above the soil, including stem, stump, branches, bark, seeds, and foliage.Explanatory note:1. In cases where forest understorey is a relatively small component of the aboveground biomass carbon pool, it is acceptable to exclude it, provided this is done in a consistent manner throughout the time series. (Source: FRA 2010)
Carbon in below-ground biomassCarbon in all biomass of live roots. Fine roots of less than 2 mm diameter are excluded, because these often cannot be distinguished empirically from soil organic matter or litter.Explanatory notes:1. Includes the below-ground part of the stump.2. The country may use another threshold value than 2 mm for fine roots, but in such a case the threshold value used must be documented. (Source: FRA 2010)
Carbon in deadwoodCarbon in all non-living woody biomass not contained in the litter either standing, lying on the ground, or in the soil. Deadwood includes wood lying on the surface, dead roots, and stumps; larger than or equal to 10 cm in diameter or any other diameter used by the country.Explanatory note:1. The country may use another threshold value than 10 cm, but in such a case the threshold value used must be documented. (Source: FRA 2010)
Carbon in litterCarbon in all non-living biomass with a diameter less than the minimum diameter for deadwood (e.g. 10 cm), lying dead in various states of decomposition above the mineral or organic soil.
Explanatory note:
64

Enquiry on improved Pan-European Indicators for Sustainable Forest Management - 2011 final
1. Fine roots of less than 2 mm (or other value chosen by the country as diameter limit for below-ground biomass) above the mineral or organic soil are included in the litter because they cannot be distinguished from it empirically.(Source: FRA 2010)
Soil carbonOrganic carbon in mineral and organic soils (including peat) to a specified depth chosen by the country and applied consistently through the time series.Explanatory notes:1. Fine roots of less than 2 mm (or other value chosen by the country as diameter limit for below-ground biomass) are included with soil organic matter because they cannot be distinguished from it empirically.2. Includes carbon in dead roots below the chosen diameter limit for deadwood (e.g. 10 cm). (Source: FRA 2010)
Criterion II
Indicator 2.1 - 2.3Definitions for these indicators are in the Technical Specifications for reporting by IDP, which is available in separate document prepared for your information.
Indicator 2.4
Damage to forestDisturbance to the forest which may be caused by biotic or abiotic agents, resulting in death, or a significant loss of vitality, productivity or value of trees and other components of the forest ecosystem (Source: MCPFE 2003, TBFRA 2000).
Primarily damaged by insects and diseaseForest and other wooded land where insect attack or disease has been identified as the primary cause of damage (Source: MCPFE 2003, TBFRA 2000).
Primarily damaged by wildlife and grazingForest and other wooded land where damage has been caused by wildlife or grazing by domestic animals. Includes: Grazing or browsing of young plants, preventing or delaying the establishment or regeneration of the stand (Source: MCPFE 2003, TBFRA 2000).
Primarily damaged by storm, wind, snow or other identifiable abiotic factorsForest and other wooded land on which the trees have been felled or damaged by storm, wind, snow or other abiotic factors such as avalanches, landslides or flooding (Source: MCPFE 2003, TBFRA 2000).
Primarily damaged by fireForest and other wooded land, the vegetation on which, including the trees, has been wholly or largely destroyed by fire (Source: MCPFE 2003, TBFRA 2000).
Primarily human induced Damage primarily human induced – Forest operations: these include damages incurred in the process of the road building and landings setting, or harvesting damage, incl. through skidding tracks, hauling and transport. Damage primarily human induced - Other: these include e.g. damage from visitors to forests; vandalism, etc. Note that human induced fire is not to be reported in this class (Source: MCPFE 2003, TBFRA 2000).
65
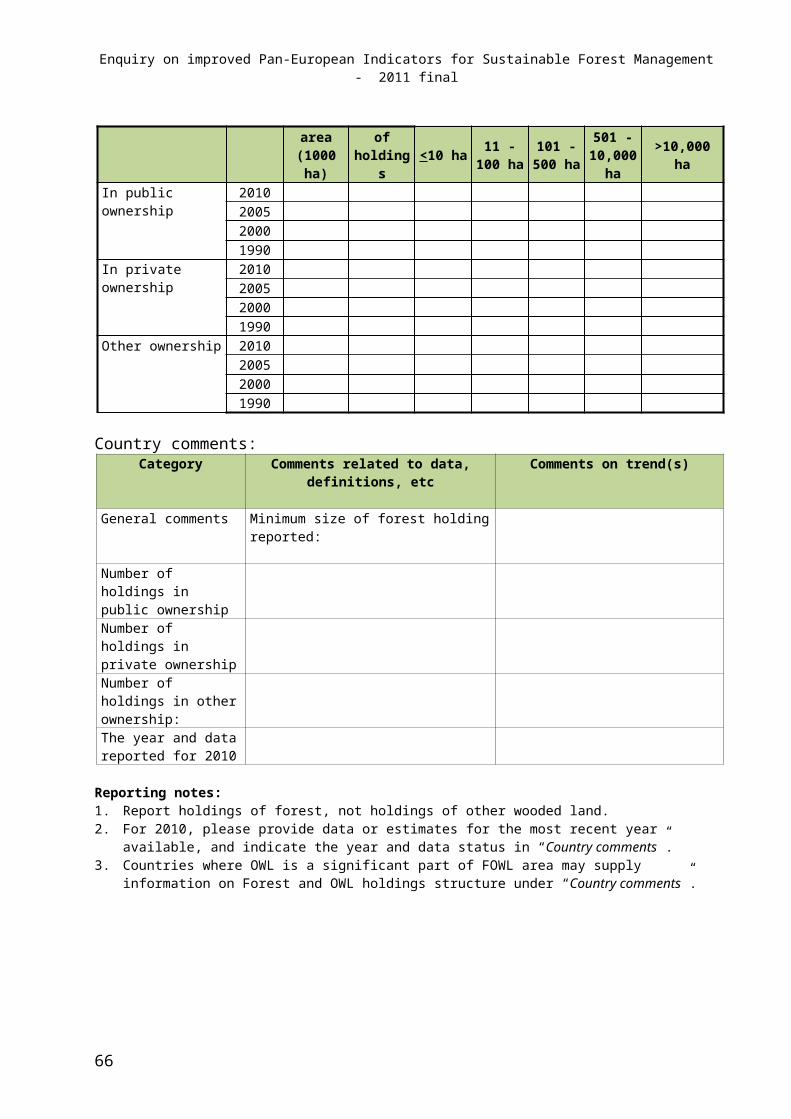
Enquiry on improved Pan-European Indicators for Sustainable Forest Management - 2011 final
Criterion III
Indicator 3.1
Fellings (annual)Average standing volume of all trees, living or dead, measured overbark to minimum diameters as defined for “Growing stock” that are felled during the given reference period, including the volume of trees or parts of trees that are not removed from the forest, other wooded land or other felling site. Includes: silvicultural and pre-commercial thinnings and cleanings left in the forest; and natural losses that are recovered (harvested) (Source: MCPFE 2003, from TBFRA 2000, modified).
Gross (annual) incrementAverage annual volume of increment over the reference period of all trees measured to minimum diameters as defined for “Growing stock” Explanatory note1. Includes the increment on trees which have been felled or die during the reference period. (Source: TBFRA 2000, modified).
Natural (annual) lossesAverage annual losses to the growing stock during the given reference period, measured to minimum diameters as defined for “Growing stock” , due to mortality from causes other than cutting by man, e.g. natural mortality, diseases, insects attacks, fire, windthrow or other physical damage. (Source: TBFRA 2000, modified).
Net (annual) incrementAverage annual volume of gross increment over the given reference period less that of natural losses on all trees, measured to minimum diameters as defined for “Growing stock” (Source: TBFRA 2000, modified). Indicator 3.2
RemovalsAverage annual of those fellings that are removed from the forest, other wooded land or other felling site during the given reference period.Explanatory note:Includes: Removals during the given reference period of trees felled during an earlier period and removal of trees killed or damaged by natural causes (natural losses) , e.g. fire, wind-blow, insects and diseases. (Source: TBFRA 2000)
RoundwoodAll roundwood felled or otherwise harvested and removed. It comprises all wood obtained from removals, i.e. the quantities removed from forests and from trees outside the forest, including wood recovered from natural, felling and logging losses during the period, calendar year or forest year. It includes all wood removed with or without bark, including wood removed in its round form, or split, roughly squared or in other form (e.g. branches, roots, stumps and burls (where these are harvested) and wood that is roughly shaped or pointed. It is an aggregate comprising wood fuel (including wood for charcoal) and industrial roundwood (wood in the rough). It is reported in cubic metres solid volume underbark (i.e. excluding bark) (Source: Joint UNECE/FAO/Eurostat/ITTO Forest Sector Questionnaire, 2001). For the purpose of this table, value is defined as the market value at the site of harvest or forest border. (Source: FRA 2010, modified)
Marketed roundwood“Marketed” roundwood comprises all roundwood sold on markets. It excludes round wood harvested for self-consumption (subsistence) and other forms of uses without market transaction. (Source: SoEF2007). For the purpose of this table, value is defined as the market value at the site of harvest or forest border.
66
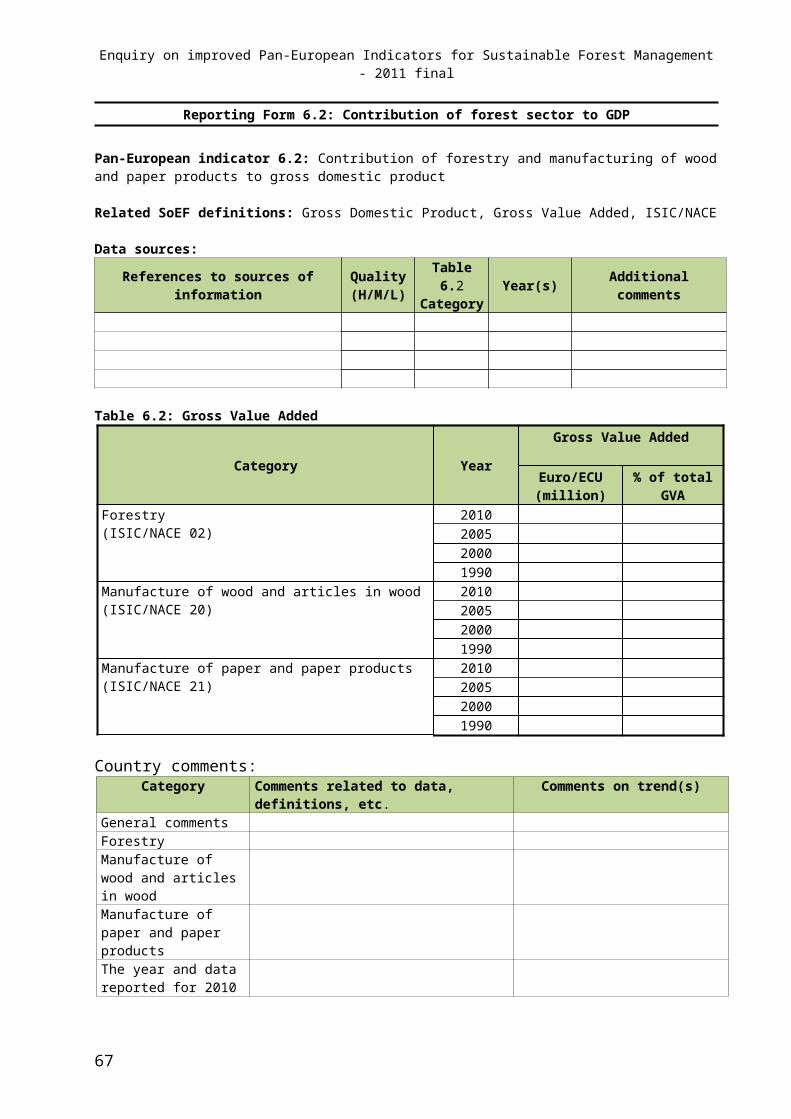
Enquiry on improved Pan-European Indicators for Sustainable Forest Management - 2011 final
Explanatory note:1. If values are obtained from a point further down the production chain, transport costs and possible handling and/or processing costs should be subtracted whenever possible. (Source: FRA 2010, Non-wood forest products, modified)Industrial roundwoodThe wood removed (volume of roundwood under bark) for production of goods and services other than energy production (woodfuel).
Explanatory notes:1. The term “removal” differs from "felling" as it excludes trees that were felled but not removed.2. Includes removals from fellings in an earlier period and from trees killed or damaged by natural causes.(Source: FRA 2010)
WoodfuelThe wood removed for energy production purposes, regardless whether for industrial, commercial or domestic use.
Explanatory notes:1. Includes all wood collected or removed for energy purposes, such as fuelwood, wood for charcoal production, harvesting residues, stumps, etc.2. Includes removals from fellings in an earlier period and from trees killed or damaged by natural causes.3. Excludes woodfuel which is produced as a by-product or residual matter from industrial processing of roundwood.(Source: FRA 2010)
Indicator 3.3
Non-wood goodsGoods derived from forests that are tangible and physical objects of biological origin other than wood.
Explanatory notes:1. Generally includes non-wood plant and animal products collected from areas defined as forest (see definition of forest in table T1).2. Specifically includes the following regardless of whether from natural forests or plantations:
- gum arabic, rubber/latex and resin;- Christmas trees, cork, bamboo and rattan.
3. Generally excludes products collected in tree stands in agricultural production systems, such as fruit tree plantations and agroforestry systems when crops are grown under tree cover.4. Specifically excludes the following:
- woody raw materials and products, such as chips, charcoal, fuelwood and wood used for tools, household equipment and carvings;
- grazing in the forest;- fish and shellfish.
(Source: FRA 2010, Non-wood forest products, modified)
Marketed non-wood goods“Marketed” roundwood comprises all non-wood goods sold on markets. It excludes goods harvested for self-consumption (subsistence) and other forms of uses without market transaction. (based on SoEF2007). For the purpose of this table, value is defined as the market value at the site of collection or forest border.Explanatory note:1. If values are obtained from a point further down the production chain, transport costs and possible handling and/or processing costs should be subtracted whenever possible. (Source: FRA 2010, Non-wood forest products)
67
Enquiry on improved Pan-European Indicators for Sustainable Forest Management - 2011 final
Indicator 3.4
Marketed forest services Marketed forest services comprise recreational, environmental and protective services that are forest-dependent or mainly forest-related, but are not necessarily marketed by forest owners.
Marketed biospheric servicesMarketed biospheric services include services related to indicator 4.6 (in-situ or ex-situ gene conservation of genetic resources) as well as indicator 4.9 (protected forest area) e.g. nature protection on a voluntary contractual basis with compensation or other payments from private or public bodies (this includes Natura 2000). This class also includes carbon-sequestration related afforestation projects in the context of the Kyoto Protocol – should such projects be included, please specify the amount under “country comments”.
Marketed ecological servicesMarketed ecological services include those related to indicators 5.1 and 5.2 (soil, water and other environmental functions as well as infrastructure and managed natural resources) on a voluntary contractual basis with compensation or other payments from private or public bodies.
Marketed social servicesMarketed social services include e.g. hunting or fishing licences, renting of huts and houses as well as forest-based leisure, sport and outdoor adventure activities and educational services that are not free of cost to consumers (the public, schools,..).
Marketed amenity servicesAmenity services include those related to spiritual, cultural and historical functions, e.g. sacred, religious, or other forms of spiritual inspiration, sites of worship , landscape features (mountains and waterfalls), “memories’’ in the landscape from past cultural ties, aesthetic enjoyment and inspiration, historic artefacts.
Other marketed servicesOther marketed services include e.g. payments to woodland owners for licences for gravel extraction, telecommunication masts, wind farms and electricity distribution.
Note: the above terms & definitions were formulated in the process of the elaboration of the MCPFE 2007 Enquiry on the basis of existing definitions in different processes.
Indicator 3.5
Management plan or equivalentA written, long-term (ten years or more) documented scheme of forest management, aiming at defined management goals, which is periodically revised. These include:
Forest management plansInformation (in the form of text, maps, tables and graphs) collected during (periodic) forest inventories at operational forest units level (stands, compartments), and operations planned for individual stands or compartments to reach the management goals.Equivalents Information collected on forest area, at forest management or aggregated forest management unit level (forest blocks, farms, enterprises, watersheds, municipalities, or wider units), and strategies/management activities planned to reach the management or development goals.
Explanatory note:1. Includes forest area in protected areas with management plan. (Source: SoEF 2007, FRA 2010)
68
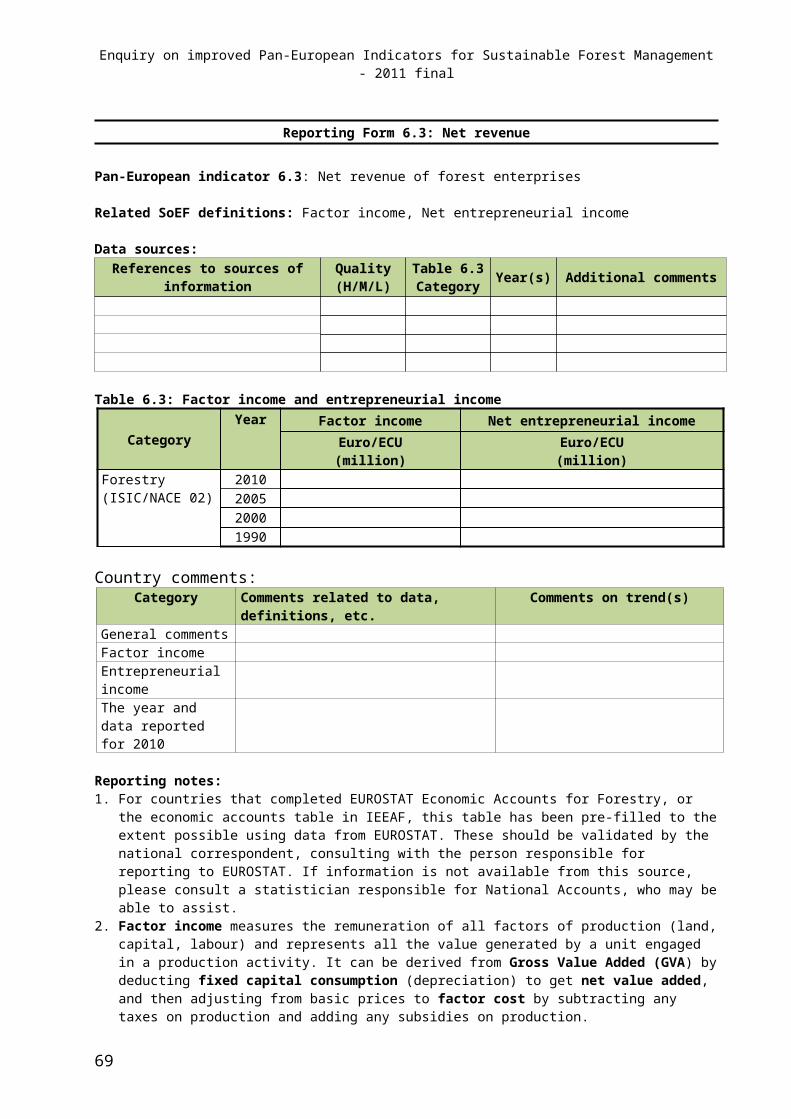
Enquiry on improved Pan-European Indicators for Sustainable Forest Management - 2011 final
Criteria IV-V
Indicator 4.1TreeA woody perennial with a single main stem or, in the case of coppice, with several stems, having a more or less definite crown.Includes: Bamboos, palms and other woody plants meeting the above criterion. (Source: TBFRA 2000)
Indicator 4.2
Regeneration (natural, by planting and/or seeding, coppice sprouting)
RegenerationRe-establishment of a forest stand by natural or artificial means following the removal of the previous stand by felling or as a result of natural causes, e.g. fire or storm (Source: TBFRA 2000).
Natural regenerationRe-establishment of a forest stand by natural means, i.e. by natural seeding or vegetative regeneration. It may be assisted by human intervention, e.g. by scarification or fencing to protect against wildlife damage or domestic animal grazing (Source: TBFRA 2000).
Regeneration by planting and/or seedingThe act of establishing a forest stand (e.g. plantation) or re-establishing a forest stand by artificial means, either by planting of seedlings or by scattering seed. The material used may be of indigenous or introduced origin. Planting and seeding may take place on forest, other wooded land or other land (Source: TBFRA 2000).
Coppice sproutingThe re-growth from coppice stools after the previous stand has been cut (Source: TBFRA 2000).
AfforestationEstablishment of forest through planting and/or deliberate seeding on land that, until then, was not classified as forest.Explanatory note:1. Implies a transformation of land use from non-forest to forest. (Source: FRA 2010)
Natural expansion of forestExpansion of forests through natural succession on land that, until then, was under another land use (e.g. forest succession on land previously used for agriculture).Explanatory note:1. Implies a transformation of land use from non-forest to forest. (Source: FRA 2010)
Indicator 4.3
NaturalnessNaturalness is specified in the following classes:
Undisturbed by man (forest/other wooded land)Forest/other wooded land which shows natural forest dynamics, such as natural tree composition, occurrence of deadwood, natural age structure and natural regeneration processes, the area of which is large enough to maintain its natural characteristics and where there has been no known significant human intervention or where the last
69

Enquiry on improved Pan-European Indicators for Sustainable Forest Management - 2011 final
significant human intervention was long enough ago to have allowed the natural species composition and processes to have become re-established (Source: MCPFE 2003, from TBFRA 2000).Semi-natural forest/other wooded landForest/other wooded land which is neither “forest/other wooded land undisturbed by man” nor “plantation” as defined separately (Source: MCPFE 2003, from TBFRA 2000).
PlantationForest stands established by planting or/and seeding in the process of afforestation or reforestation. They are either:
of introduced species (all planted stands), or intensively managed stands of indigenous species which meet all the following criteria: one or two species
at plantation, even age class, regular spacing. Excludes: Stands which were established as plantations but which have been without intensive management for a significant period of time. These should be considered semi-natural (Source: TBFRA 2000).
Indicator 4.4
Introduced tree species(synonyms: non-indigenous species, exotic species, alien species)A species, subspecies or lower taxon, occurring outside its natural range (past or present) and dispersal potential (i.e. outside the range it occupies naturally or could occupy without direct or indirect introduction or care by humans) (Source : FRA 2010).
Invasive introduced tree speciesInvasive introduced tree refers to an alien tree species whose introduction and spread threaten ecosystems, habitats or species with socio-cultural, economic and/or environmental harm, and/or harm to human health (Source: MCPFE 2003, definition of invasive alien species from UNEP/CBD/COP/6/18/Add.1/Rev.1; 2002. The word “tree” was added). Alien or alien species refers to a species, subspecies or lower taxon, introduced outside its normal past or present normal distribution; includes any part, gametes, seeds, eggs, or propagates of such species that might survive and subsequently reproduce (Source: UNEP/CBD/COP/6/18/Add.1/Rev.1; 2002).
Indicator 4.5
DeadwoodAll non-living woody biomass not contained in the litter, either standing, lying on the ground, or in the soil. Deadwood includes wood lying on the surface, dead roots, and stumps larger than or equal to diameter defined by the country (Source: FAO 2004, modified). Explanatory note:1. It is up to the countries to define the threshold level for the minimum size of diameter to be reported. Thresholds used should be documented and reported.
Indicators 4.6 and 4.7 Definitions for these indicators are in the Technical Specifications for reporting by IDP, which is available in a separate document prepared for your information.
Indicator 4.8
Forest speciesA forest species is a species that is dependent on a forest for part or all of its day to day living requirements, or for its reproductive requirements. Therefore, an animal species may be considered a forest species even if it does not live
70
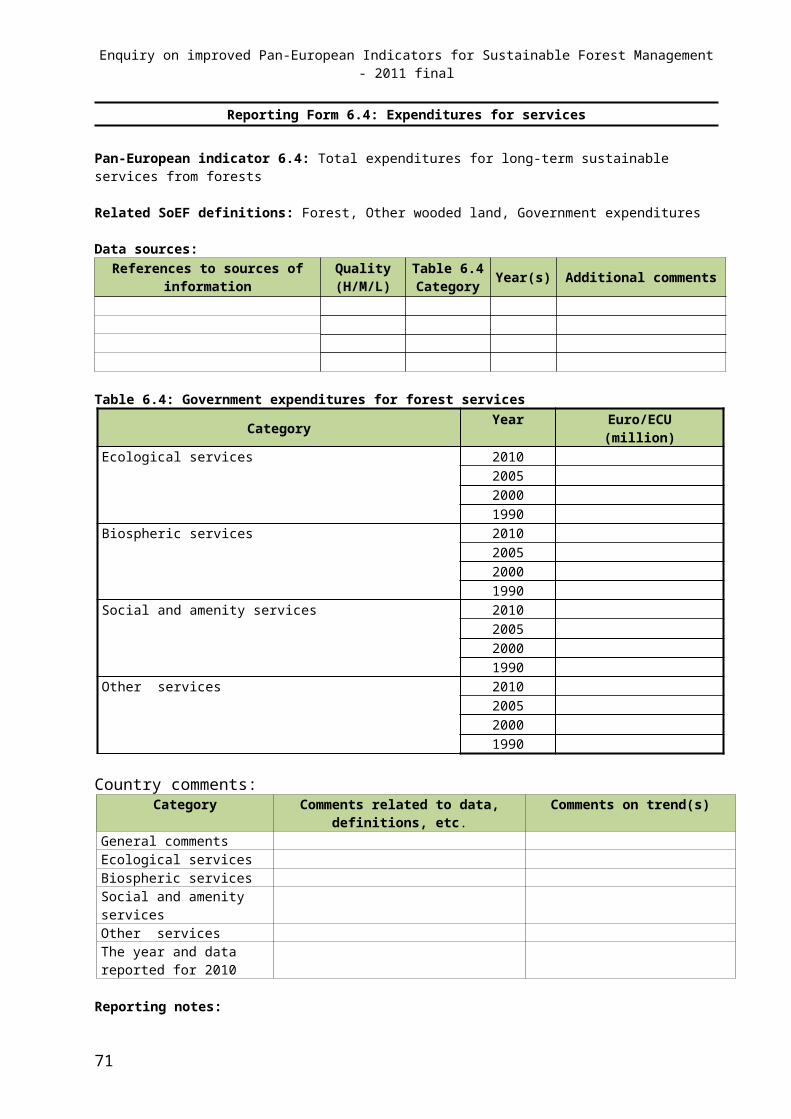
Enquiry on improved Pan-European Indicators for Sustainable Forest Management - 2011 final
most of its life in a forest (Source: MCPFE 2003, from AD HOC Technical Expert Group on Forest Biological Diversity, convened by the Secretariat of the CBD to prepare a report for SBSTTA-7, 2001).
VulnerableA taxon is vulnerable when it is not critically endangered or endangered but is facing a high risk of extinction in the wild in the medium-near future, as defined by any of the criteria A to E of IUCN (1998) (Source: MCPFE 2003, from IUCN, 1998).
EndangeredA taxon is endangered when it is not critically endangered but is facing a very high risk of extinction in the wild in the near future, as defined by any of the criteria A to E of IUCN (1998) (Source: MCPFE 2003, from IUCN, 1998).
Critically endangeredA taxon is critically endangered when it is facing an extremely high risk of extinction in the wild in the immediate future, as defined by any of the criteria A to E of IUCN (1998) (Source: MCPFE 2003, from IUCN, 1998).
Extinct in the wildA taxon is extinct in the wild when it is known only to survive in cultivation, in captivity or as a naturalised population (or populations) well outside the past range. A taxon is presumed extinct in the wild when exhaustive surveys in known and/or expected habitat, at appropriate times (diurnal, seasonal, annual), throughout its historic range have failed to record an individual. Surveys should be over a time frame appropriate to the taxons’s life cycle and life form (Source: MCPFE 2003, from IUCN, 1998).
Indicators 4.9, 5.1, 5.2
MCPFE Classas defined by the MCPFE Assessment Guidelines for Protected and Protective Forest and Other Wooded Land in Europe
MCPFE Class 1.1: Main Management Objective Biodiversity “No Active Intervention” The main management objective is biodiversity No active, direct human intervention is taking place Activities other than limited public access and non-destructive research not detrimental to the management
objective are prevented in the protected area
MCPFE Class 1.2: Main Management Objective Biodiversity “Minimum Intervention” The main management objective is biodiversity Human intervention is limited to a minimum Activities other than listed below are prevented in the protected area: Ungulate/game control Control of diseases/insect outbreaks3/ Public access Fire intervention Non-destructive research not detrimental to the management objective Subsistence resource use4/
3/ In case of expected large diseases/insect outbreaks control measures using biological methods are allowed provided that no other adequate control possibilities in buffer zones are feasible.
4/ Subsistence resource use to cover the needs of indigenous people and local communities, in so far as it will not adversely affect the objectives of management.
71
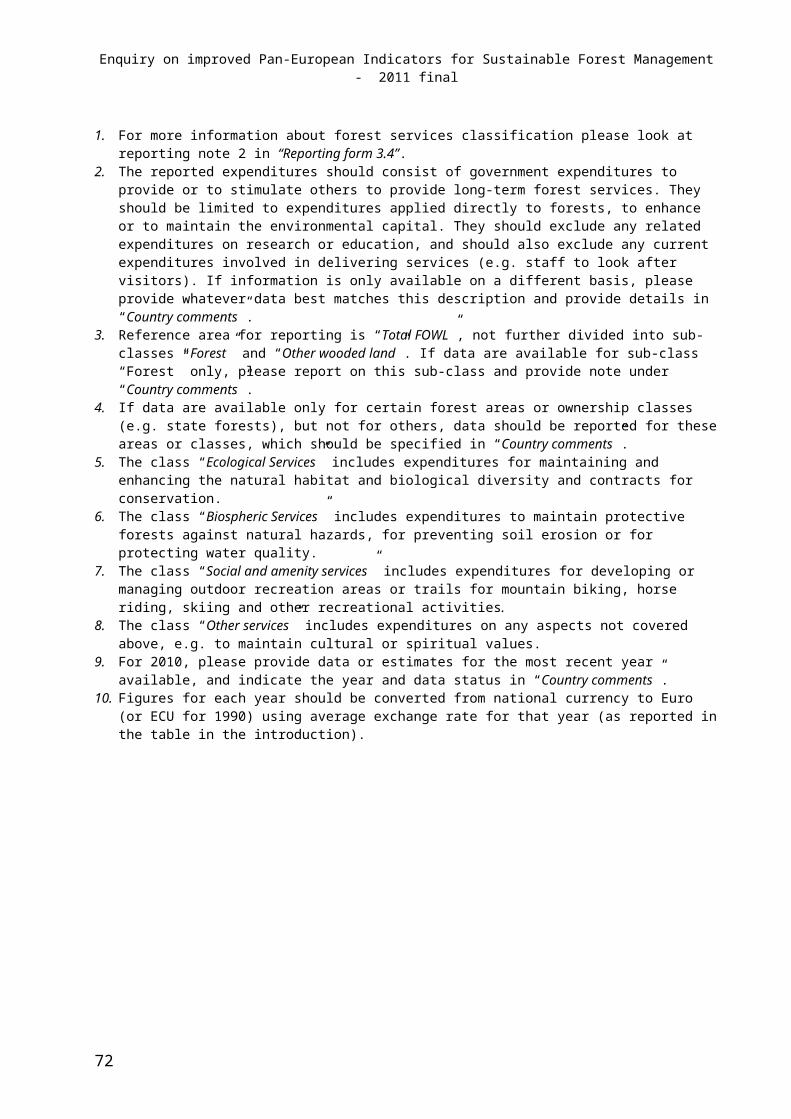
Enquiry on improved Pan-European Indicators for Sustainable Forest Management - 2011 final
MCPFE Class 1.3: Main Management Objective Biodiversity “Conservation Through Active Management” The main management objective is biodiversity A management with active interventions directed to achieve the specific conservation goal of the protected
area is taking place Any resource extraction, harvesting, silvicultural measures detrimental to the management objective as well
as other activities negatively affecting the conservation goal are prevented in the protected area
MCPFE Class 2: Main Management Objective “Protection of Landscapes and Specific Natural Elements” Interventions are clearly directed to achieve the management goals landscape diversity, cultural, aesthetic,
spiritual and historical values, recreation, specific natural elements The use of forest resources is restricted A clear long-term commitment and an explicit designation as specific protection regime defining a limited
area is existing Activities negatively affecting characteristics of landscapes or/and specific natural elements mentioned are
prevented in the protected area
MCPFE Class 3: Main Management Objective “Protective Functions” The management is clearly directed to protect soil and its properties or water quality and quantity or other
forest ecosystem functions, or to protect infrastructure and managed natural resources against natural hazards Forests and other wooded lands are explicitly designated to fulfil protective functions in management plans
or other legally authorised equivalents Any operation negatively affecting soil or water or the ability to protect other ecosystem functions, or the
ability to protect infrastructure and managed natural resources against natural hazards is prevented(Source: MCPFE 2003)
Criterion VIIndicator 6.1
Forms of ownership Generally refers to the legal right to freely and exclusively use, control, transfer, or otherwise benefit from a forest. Ownership can be acquired through transfers such as sales, donations, and inheritance.Explanatory note:1. For this reporting table, forest ownership refers to the ownership of the trees growing on land classified as forest, regardless of whether or not the ownership of these trees coincides with the ownership of the land itself. (Source: FRA 2010)
Public ownership Forest owned by the State; or administrative units of the Public Administration; or by institutions or corporations owned by the Public Administration.Explanatory notes: 1. Includes all the hierarchical levels of Public Administration within a country, e.g. State, Province and Municipality.2. Shareholder corporations that are partially State-owned, are considered as under public ownership when the State holds a majority of the shares.3. Public ownership may exclude the possibility to transfer. (Source: FRA 2010)
Private ownershipForest owned by individuals, families, communities, private cooperatives, corporations and other business entities, private religious and educational institutions, pension or investment funds, NGOs, nature conservation associations and other private institutions. (Source: FRA 2010)
Other ownershipForest ownership which cannot be classified as private or public.Explanatory note: 1. Includes land where ownership is not defined, unknown or disputed.
72
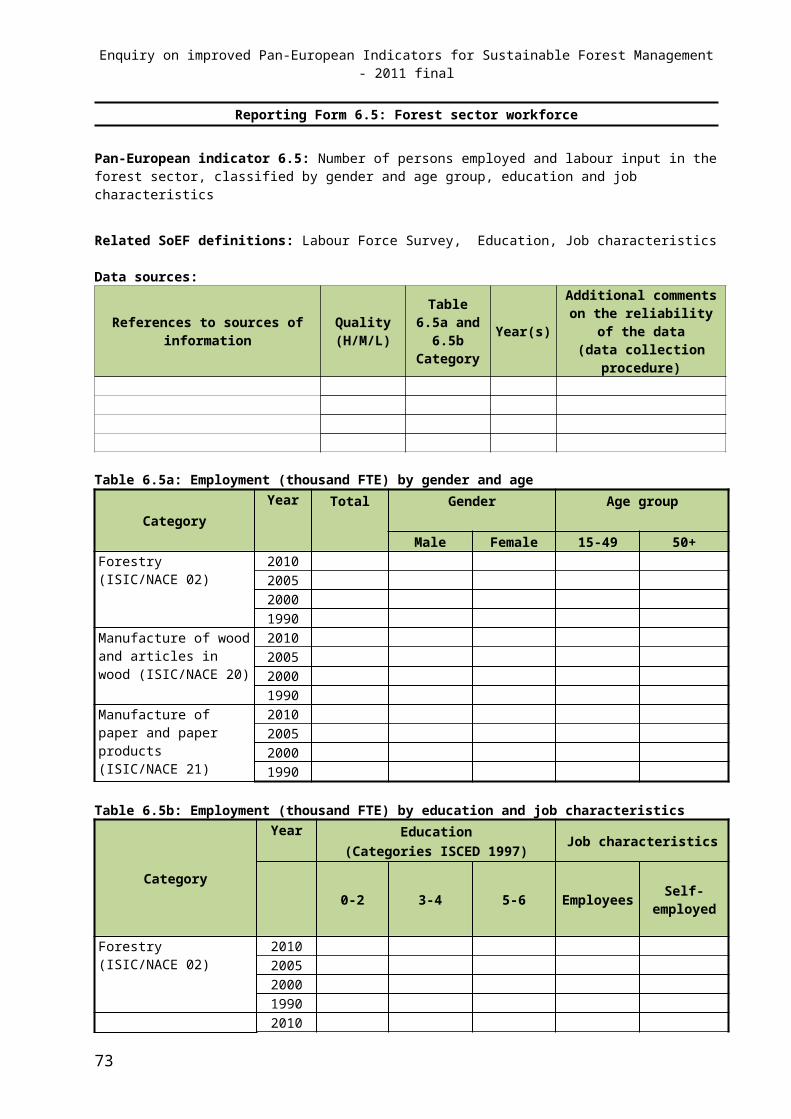
Enquiry on improved Pan-European Indicators for Sustainable Forest Management - 2011 final
Forest holding One or more parcels of forest and other wooded land which constitute a single unit from the point of view of management or utilization. For State-owned forest and other wooded land a holding may be defined as the area forming a major management unit administered by a senior official, e.g. a Regional Forestry Officer. For forest and other wooded land that is owned publicly, other than by the State, or owned by large-scale forest owners, e.g. forest industries, a holding may constitute a number of separated properties which are, however, managed according to one corporate strategy. Under any category of ownership, other than State-owned, one holding may be the property of one or several owners (Source: TBFRA 2000, definition as published in SoEF 2007).
Indicator 6.2
Gross Domestic Product
Gross Domestic Product (GDP) is the total market value of all final goods and services produced in a country in a given year. It is equal to total consumer, investment and government spending, plus the value of exports, minus the value of imports. For the estimation of an industry’s contribution to GDP, data on Gross Value Added (GVA) should be used. The link between GVA and GDP can be defined as: GVA + taxes on products - subsidies on products = GDP.
Gross Value Added
Gross Value Added (GVA) measures the contribution to the economy of each individual producer, industry or sector in the country, measured at basic prices. Data on GVA for each industrial sector should be available from the National Accounts prepared by the country’s national statistical authority.
ISIC/NACE
ISIC is the International Standard Industrial Classification of All Economic Activities. NACE is the equivalent Statistical Classification of Economic Activities in the European Community.
In ISIC Rev 3.1 (2004) and NACE Rev 1.1 (2002), the following categories cover forest industries:
02: Forestry, logging and related service activities.
20: Manufacture of wood and of products of wood and cork, except furniture; manufacture of articles of straw and plaiting materials.
21: Manufacture of paper and paper products.
In ISIC Rev 4 (2008) and NACE Rev 2 (2008), the corresponding categories are: 02, 16 and 17 (with some minor additions / subtractions). They only start to be used for statistics in 2009, so all data for this reporting round use the previous classification.
Indicator 6.3
Factor income
Factor income measures the remuneration of all factors of production (land, capital, labour) and represents all the value generated by a unit engaged in a production activity. It can be derived from Gross Value Added (GVA) by deducting fixed capital consumption (depreciation) to get net value added, and then adjusting from basic prices to factor cost by subtracting any taxes on production and adding any subsidies on production.
Net entrepreneurial income
Net entrepreneurial income measures the return to the forestry business owner, and consists of the compensation of unpaid labour, remuneration from land belonging to units and the yield arising from the use of capital. It can be derived from factor income by subtracting compensation of employees to get operating surplus, and then adding any interest received by forestry units organized as companies and deducting any rent and interest payments.
73
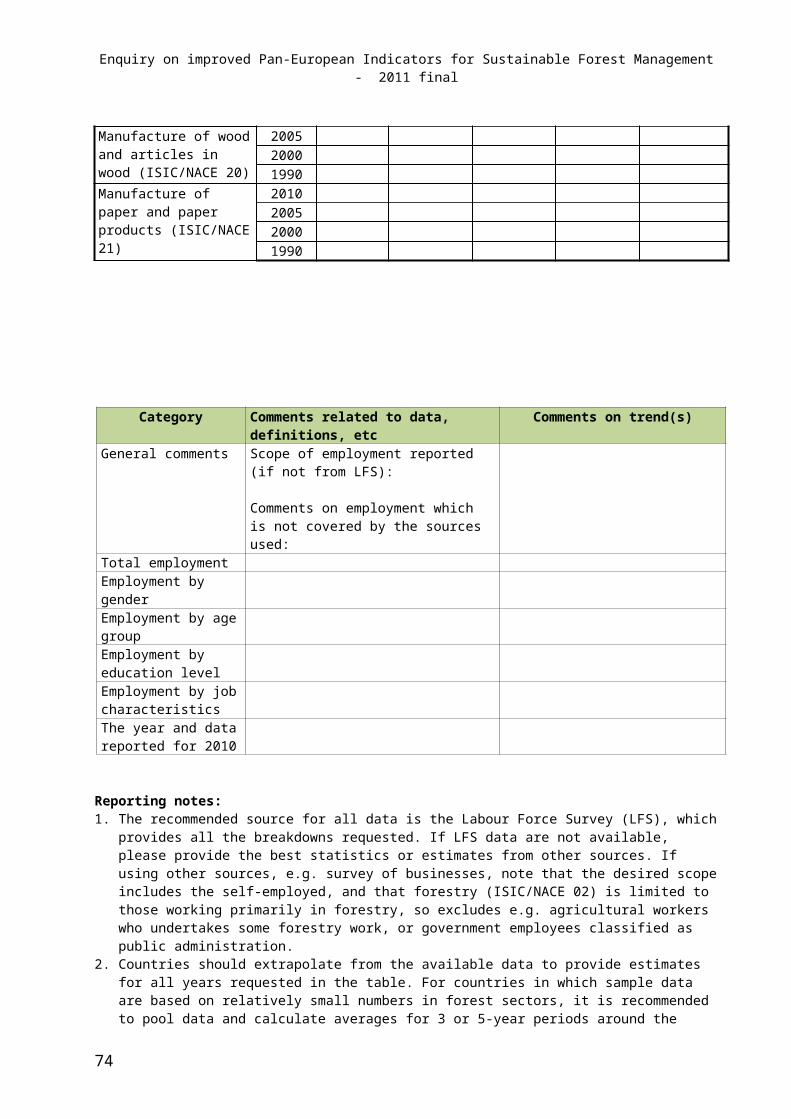
Enquiry on improved Pan-European Indicators for Sustainable Forest Management - 2011 final
Indicator 6.4
Government expenditures for long-term forest services
The reported expenditures should consist of government expenditures to provide or to stimulate others to provide long-term forest services. They should be limited to expenditures applied directly to forests, to enhance or to maintain the environmental capital. They should exclude any related expenditures on research or education, and should also exclude any current expenditures involved in delivering services (e.g. staff to look after visitors).
Indicator 6.5
Labour Force Survey
The Labour Force Survey (LFS) is a sample survey carried out in many European countries by interviewing individuals about their personal circumstances and work. Because the LFS is a sample survey, results are subject to sampling error, i.e. the actual proportion of the population in private households with a particular characteristic may differ from the proportion of the LFS sample with that characteristic.
The LFS provides information about people in unemployment and employment. The LFS defines employment as those people aged 16 and over who did at least one hour’s paid work in the reference week (either as an employee or self-employed); those who had a job which they were temporarily away from (on holiday for example); those participating in government training and employment programmes; and those doing unpaid family work.
Education
The main levels of the International Standard Classification of Education (Source: ISCED 1997), applied from 1998 data onwards, are:
ISCED 0 – pre-primary education
ISCED 1 – primary education or first stage of basic education
ISCED 2 – lower secondary education or second stage of basic education
ISCED 3 - (upper) secondary education
ISCED 4 – post-secondary non tertiary education
ISCED 5 – first stage of tertiary education (not leading directly to an advanced research qualification)
ISCED 6 – second stage of tertiary education (leading to and advanced research qualification)
For further information visit <http://www.unescobkk.org/fileadmin/user_upload/aims/ISCED_A.pdf>
Job characteristics
Those who own and operate their own business or professional practice, sometimes in conjunction with a partner, are considered as self-employed. The Labour Force Survey (LFS) asks a number of questions to establish a person's employment status; this is based on a respondent's own opinion of whether they are an employee or self-employed. If a different source is used, a relevant distinction is that employees work for wage or salary (in cash or kind) while the self-employed work for profit or family gain (in cash or kind). Family workers are persons doing unpaid work for a business they own or for a business that a relative owns.
Explanatory note:
1. For the purpose of this reporting unpaid family workers should be included in self-employed.
Indicator 6.6
Occupational accident An occurrence arising out of or in the course of work which results in:(a) fatal occupational injury;(b) non-fatal occupational injury (Source: ILO, 1998).
Occupational disease
74
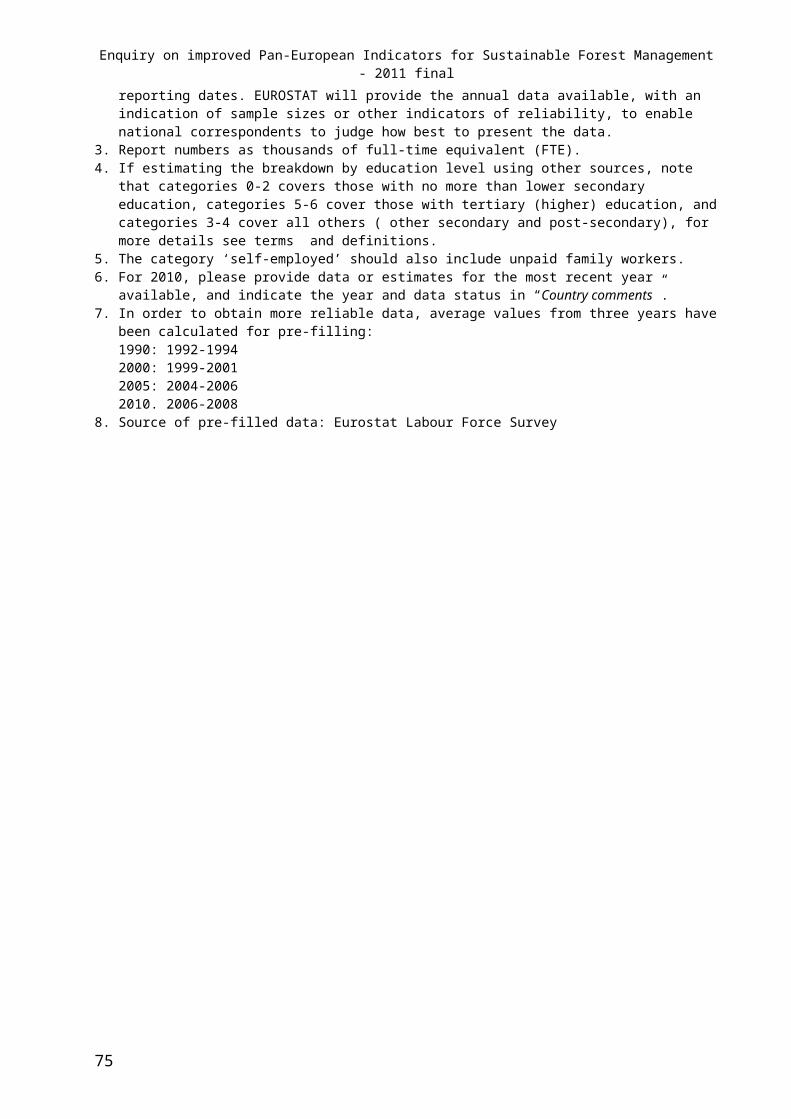
Enquiry on improved Pan-European Indicators for Sustainable Forest Management - 2011 final
A disease contracted as a result of an exposure to risk factors arising from work activity (Source: ILO, 1998).
Indicators 6.7 and 6.8 Definitions for these indicators are in the Technical Specifications for reporting by IDP, which is available in a separate document prepared for your information.
Indicator 6.9
Total Primary (energy) productionAny kind of extraction of energy products from natural sources to a usable form is called primary production. Primary production takes place when the natural sources are exploited, for example in coal mines, crude oil fields, hydro power plants or fabrication of biofuels. Transformation of energy from one form to another, such as electricity or heat generation in thermal power plants, or coke production in coke ovens, is not primary production. More specific definitions by product are given below. Source: EUROSTAT concepts and definitions database (http://circa.europa.eu/irc/dsis/coded/info/data/coded/en/gl013681.htm) referring to: Joint IEA/ESTAT/UN annual questionnaire on solid fossil fuels and manufactured gases
Gross inland (energy) consumptionGross inland consumption represents the quantity of energy necessary to satisfy inland consumption of the geographical entity under consideration. Gross inland consumption is calculated as follows: primary production + recovered products + total imports + variations of stocks - total exports (Code 100500) - bunkers. It corresponds to the addition of consumption, distribution losses, transformation losses and statistical differences.The difference between gross inland consumption and gross consumption is that in gross consumption the transformation output is included. Therefore, gross consumption is a product-specific consumption and does not express the demand for primary energy. Source: EUROSTAT concepts and definitions database (http://circa.europa.eu/irc/dsis/coded/info/data/coded/en/gl013722.htm )
Direct wood fibre sources(…) any wood fibre that enters the energy production without any further treatment or conversion. It comprises removals from forests and outside. This comprises also any wood (…) from “Other Wooded Land” (OWL) and “Trees Outside Forests” (…). It comprises any woody biomass from any land use and covers amongst others infrastructure maintenance (roads, railway, power transmission lines, pipelines, etc.), hedgerows, agricultural residues from fruit tree orchards, wood from gardens and parks, etc. It comprises any form of woody biomass, such as green chips, roundwood or split, stacked or loose from any part of the trees such as roots, stemwood and branches, fruits and shells. Source: UNECE/FAO Joint Wood Energy Enquiry 2007 report. (http://timber.unece.org/fileadmin/DAM/meetings/jwee2-data-report-24march.pdf)
Chips and particlesWood that has been reduced to small pieces and is suitable for pulping, for particle board and/or fibreboard production, for use as a fuel, or for other purposes. It excludes wood chips made directly in the forest from roundwood (i.e. already counted as pulpwood, round and split). It is reported in cubic metres solid volume excluding bark. Source: UNECE/FAO/EUROSTAT/ITTO Joint Forest Sector Questionnaire (http://timber.unece.org/fileadmin/DAM/other/definitions-e-2008a.doc)
Wood residuesThe volume of roundwood that is left over after the production of forest products in the forest processing industry (i.e. forest processing residues) and that has not been reduced to chips or particles. It includes sawmill rejects, slabs, edgings and trimmings, veneer log cores, veneer rejects, sawdust, residues from carpentry and joinery production, etc. It excludes wood chips made either directly in the forest from roundwood or made from residues (i.e. already counted as pulpwood, round and split or wood chips and particles). It is reported in cubic metres solid volume excluding bark. Source: UNECE/FAO/EUROSTAT/ITTO Joint Forest Sector Questionnaire (http://timber.unece.org/fileadmin/DAM/other/definitions-e-2008a.doc)
Black liquorAlkaline spent liquor obtained from digesters in the production of sulphate or soda pulp during the process of paper production, in which the energy content is mainly originating from the content of lignin removed from the wood in the pulping process. Source: UNECE/FAO Joint Wood Energy Enquiry 2007, Taken from FAO Unified Bioenergy Terminology (http://timber.unece.org/fileadmin/DAM/meetings/jwee2-questionnaire-2009-03.zip)
75
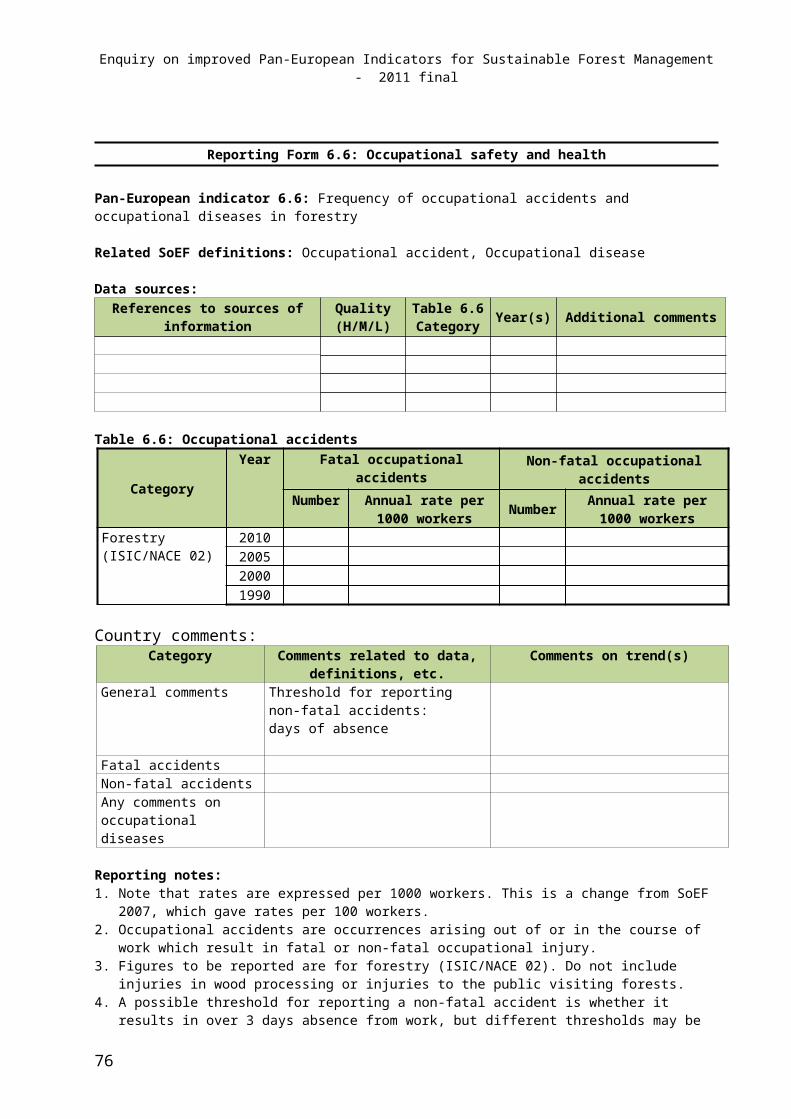
Enquiry on improved Pan-European Indicators for Sustainable Forest Management - 2011 final
Energy from processed wood-based fuelsSecondary (processed) biofuels in the form of solids (e. g. charcoal), liquids (e. g. alcohol, vegetable oil), or gases (e. g. biogas as a mixture of methane and carbon dioxide), can be used for a wider range of applications with higher efficiency rates on average, including transport and high-temperature industrial processes. Source: UNECE/FAO Joint Wood Energy Enquiry 2007, Taken from FAO Unified Bioenergy Terminology (http://timber.unece.org/fileadmin/DAM/meetings/jwee2-questionnaire-2009-03.zip)
Wood pelletsCylindrical products which have been agglomerated either directly by compression or by the addition of a small quantity of binder, having a diameter not exceeding 25 mm and a length not exceeding 45 mm. Source: Combined Nomenclature 2009, subheading 4401 20 30; Commission regulation (EC) No 1031/2008 of 19 September 2008 (http://eur-lex.europa.eu/LexUriServ/LexUriServ.do?uri=OJ:L:2008:291:0001:0894:EN:PDF)
BriquettesDensified biofuel made with or without pressing aids in the form of cubiform or cylindrical units, produced by compressing pulverized biomass. The raw material for briquettes can be woody biomass (...) are usually manufactured in a piston press. The total moisture of the biofuel briquette is usually less than 15 % of mass. (The JWEE 2008 assumes water content of 8 %). Source: UNECE/FAO Joint Wood Energy Enquiry 2007, Taken from FAO Unified Bioenergy Terminology (http://timber.unece.org/fileadmin/DAM/meetings/jwee2-questionnaire-2009-03.zip)
CharcoalWood carbonized by partial combustion or the application of heat from external sources. It includes charcoal used as a fuel or for other uses, e.g. as a reduction agent in metallurgy or as an absorption or filtration medium. It is reported in metric tonnes.” Source: UNECE/FAO/EUROSTAT/ITTO Joint Forest Sector Questionnaire (http://timber.unece.org/fileadmin/DAM/other/definitions-e-2008a.doc)
Wood-based ethanolBiogasoline (IEA) - Includes bioethanol (ethanol produced from (woody) biomass (...), biomethanol (methanol produced from (woody) biomass (...), bioETBE (ethyl-tertio-butyl-ether produced on the basis of bioethanol; the percentage by volume of bioETBE that is calculated as biofuel is 47%) and bioMTBE (methyl-tertio-butyl-ether produced on the basis of biomethanol: the percentage by volume of bioMTBE that is calculated as biofuel is 36%). Biogasoline includes the amounts that are blended into the gasoline - it does not include the total volume of gasoline into which the biogasoline is blended. Source: IEA Balance Builder; http://www.iea.org/textbase/stats/questionnaire/balance.xls
Wood-based biodieselIncludes biodiesel (a methyl-ester produced from woody biomass, of diesel quality), biodimethylether (dimethylether produced from biomass), Fischer Tropsch (Fischer Tropsch produced from biomass), (...) and all other liquid biofuels which are added to, blended with or used straight as transport diesel. Biodiesel includes the amounts that are blended into the diesel - it does not include the total volume of diesel into which the biodiesel is blended. Source: IEA Balance Builder; http://www.iea.org/textbase/stats/questionnaire/balance.xls.
Post consumer recovered wood Used wood arising from construction of buildings or from civil engineering works. Recovered wood from transport (pallets), private households, as well as used wood arising from construction or demolition of buildings or from civil engineering works. Source: UNECE/FAO Joint Wood Energy Enquiry 2007, Taken from FAO Unified Bioenergy Terminology (http://timber.unece.org/fileadmin/DAM/meetings/jwee2-questionnaire-2009-03.zip
Indicator 6.10:
Access for recreation The area in category “Area with access available to the public for recreational purposes” comprises area with a legal right of access, as well as areas with no formal legal right, but with customary rights or other de-facto forms of access available to the public. Areas to be excluded are those where access is legally forbidden, and areas with no formal legal right that are also not accessible in practice.
76
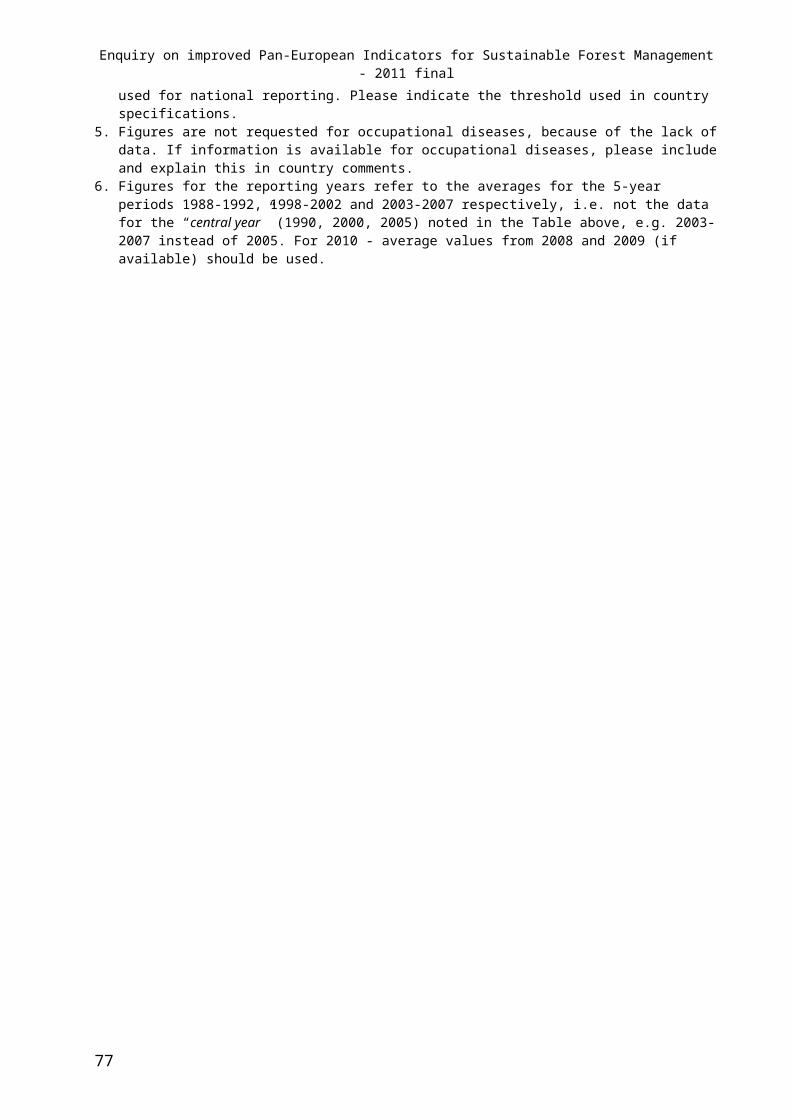
Enquiry on improved Pan-European Indicators for Sustainable Forest Management - 2011 final
Main management goal The “Area with recreational use as one main management goal” should include areas managed primarily for recreation, and also with multiple management objectives where there is evidence (e.g. from management plans) that recreational use is an important aspect of its management.
VisitA “Visit” is a visit for recreational purposes to any area of forest or other wooded land. There is no minimum duration and it is not necessary to undertake any specific activities. Visits for work purposes and travel through the forest for purposes other than recreation are excluded. Each individual participant, including children, counts as one visit. If several different forests are visited on one trip, then the trip only counts as one visit, but if an individual makes two or more separate trips to forests during one day, then each counts as a separate visit.
Indicator 6.11:
Cultural and spiritual valuesThis category includes “cultural heritage”, “forested landscapes”, “trees” and “other sites” with recognized cultural and spiritual values. Cultural heritage sites can be either “of the forest”, and hence historically associated with its management, or “in the forest”, with no significant historical connection to the surrounding forest. Forested landscapes with cultural & spiritual values may also be termed ‘cultural landscapes’ where forest or other wooded land is the primary component. Trees with cultural and spiritual values include veteran and heritage trees. Other sites include contemporary artistic features, woodland burial sites, and sites of ceremonies and performances.
Cultural heritageThis category includes all recognized archaeological and historical sites and features. Archaeological sites and features may include those associated with human artefacts, usually as discovered by excavation, surveys, or through disturbance during forest operations. Historical sites and features may include the remains of old buildings and monuments, and also locations of historical importance (e.g. battle sites) even if no remains are present. There is no commonly agreed distinction between ‘archaeological’ and ‘historical’ and for this reason the two types of site are combined in the reporting form.
Cultural heritage sites can be considered in two categories: sites “of the forest” and sites “in the forest”. Sites “of the forest” include monuments, buildings or other historic artefacts associated with the past management of the forest (or its constituents). In the reporting form they are referred to as sites “associated with historic forest management.” Examples may include: boundary banks and dykes, charcoal-burning platforms, saw pits, some bloomery and blast furnace sites, tar production sites, kilns, water mills and lades, features associated with game management and for transporting forest products. The forest was an essential component in their use, and they would not have been created if the forest had not existed. The kinds of historic forest management that these sites were associated with may include ancient wood pastures, historic planted forests, and stands of old industrial or pre-industrial coppice, coppice with standards, pollards, shredded or other ‘working trees’ for the production of acorns, fodder, tar, resins and other products. Evidence of such management may be found in “organically evolved landscapes” (see definition of “Forested landscapes with cultural & spiritual values”).
Sites “in the forest” include all other archaeological and historical sites, where the forest itself is not an important aspect of its heritage value. Often, such sites may predate the forest, which has subsequently grown up around it. Examples include: ancient settlements, fortifications, burial mounds, earthworks, field systems and other evidence of historic farming practices, standing stones, and military, funerary, industrial and domestic monuments, churchyards, crosses and memorials, battle sites, historic places of assembly or ceremony, castles, bridges, roads and transport structures.
Forested landscapes with cultural & spiritual valuesForested landscapes with cultural and spiritual values may also be termed ‘cultural landscapes’ where forest or other wooded land is the primary component. The term ‘cultural landscape’ embraces a diversity of manifestations of the interaction between humankind and its natural environment. Such landscapes fall into three main types:
a) Landscape designed and created intentionally by humans, often for aesthetic reasons, including historic and contemporary designed forested landscapes;
77
Enquiry on improved Pan-European Indicators for Sustainable Forest Management - 2011 final
b) Organically evolved landscape, either ‘relict’ (or fossil), in which an evolutionary process came to an end at some point in the past, or ‘continuing’, which retains an active social role in contemporary society closely associated with the traditional way of life, and in which the evolutionary process is still in progress;
c) Associative cultural landscape, which is recognized primarily for its religious, artistic or cultural associations with the natural element rather than any material cultural evidence (Source: UNESCO, 2008. Operational Guidelines for the Implementation of the World Heritage Convention, Annex 3).
All three types may be recognized for their contemporary aesthetic, amenity or recreational values. This category includes sites with geological and other non-biological natural elements such as mountains or waterfalls of recognized cultural and spiritual value. All the area reported under MCPFE Protected Forest Area Class 2 (Protection of Landscapes and Specific Natural Elements) should be recorded here as number of sites, as well as other sites recognized for similar values to those in Class 2 that are not protected.
Trees with cultural & spiritual valuesThis category includes individual veteran trees, heritage trees, champion trees and trees associated with religious and spiritual practices and beliefs. It also includes groups of trees that are too small to be classed as “forested landscapes” such as hedges, avenues and groves. Veteran (or ancient) trees can be defined as trees that are old relative to others of the same species, and are of interest biologically, aesthetically or culturally because of their age. For example, a birch tree may be considered to be a veteran at 200 years old, while a yew may have to survive for at least 1000 years before it can be considered ancient. Veteran ‘working trees’ include those that were coppiced, pollarded, shredded, etc, as part of historic management practices. Heritage trees can be defined as trees that are revered for their historical, cultural or botanical significance, for example because they are very old, have interesting historical associations such as ‘witness trees’ that were present at the scene of notable historic events, or are ‘champion trees’ of record dimensions (girth, height, amount of timber, etc).
Other sites with cultural & spiritual valuesThese include sites of contemporary cultural and spiritual importance, such as venues for cultural performances, ceremonies or gatherings, sites of sculptures and other installation art, and sites of recent woodland burial. Such sites may have historical associations, but they are recorded under this category rather than under “Cultural heritage” if their current use is recognized as more important than their historic use.
78
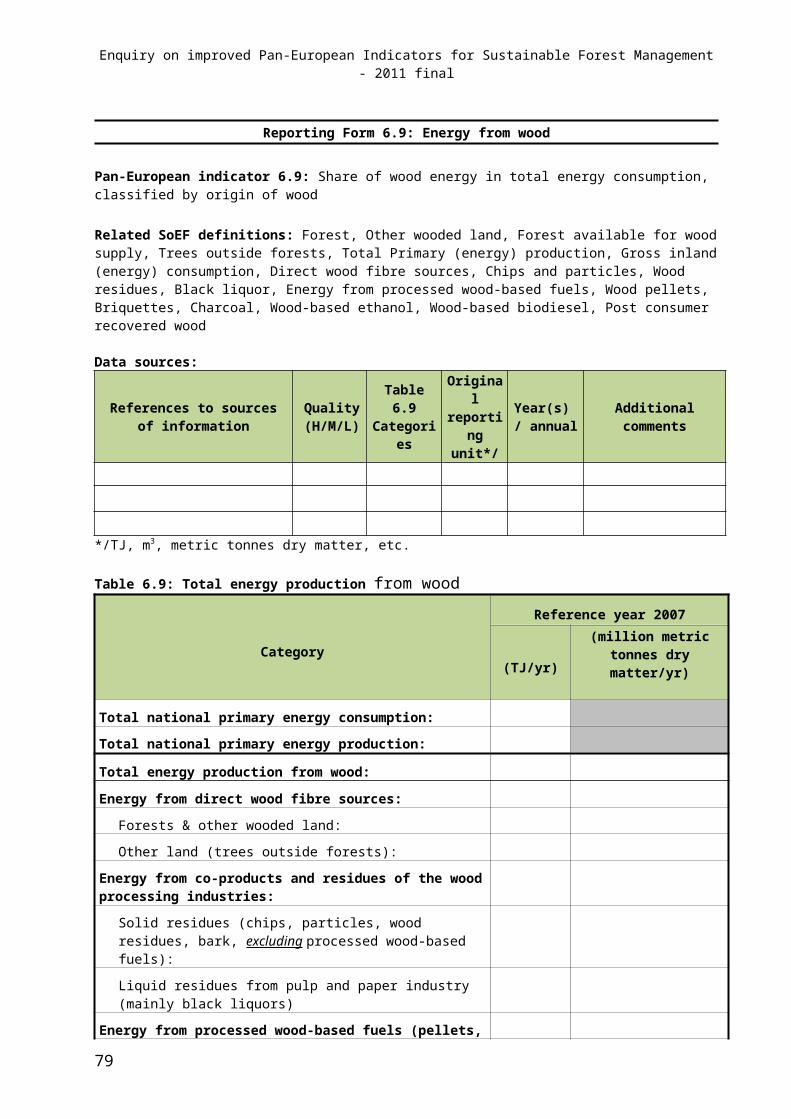
Enquiry on improved Pan-European Indicators for Sustainable Forest Management - 2011 final
Annex - Guidelines on new European Forest Types and set of tables for voluntary pilot reporting
IntroductionIn the Vienna Living Forest Summit Declaration, signed at the Fourth Ministerial Conference on the Protection of Forests in Europe (2003), the Signatory States and the European Community committed themselves to endorse the use of the “Improved Pan-European Indicators for Sustainable Forest Management as adopted by the MCPFE Expert Level Meeting, 7-8 October 2002, Vienna, Austria”. Following this set of improved criteria and indicators, the reporting for 7 of in total 35 quantitative indicators are required to be reported by forest type.
In this context it was raised the need to improve the forest classification beyond the 3 broad species groups, applied so far in pan-European reporting (predominantly conifers, predominantly broadleaved, mixed forest). To this end, the European Environment Agency (EEA) of the European Union, in cooperation with a consortium of forest experts from a number of European countries lead by the Italian Academy of Forest Sciences, has developed a proposal for the classification of forest types in Forest Europe countries, presented in the EEA Technical Report (No 9/2006): “European Forest Types – categories and types for sustainable management reporting and policy”5.
Since 2006 the MCPFE has organized consultation activities with representatives from member countries to discuss the potentials of applying the European Forest Types as a forest type framework for pan-European reporting, including a pilot test reporting for indicator 1.1 by EFTs. Based on gained experiences some improvements were introduced to update the EFTs classification in order to ensure its operationality. The new European Forest Types applied for pilot reporting under indicators 1.1, 1.2, 1.3, 4.1, 4.3, 4.5 are briefly described in Table A1.
The EFTs classification allows the breakdown of country forest area into a discrete number of smaller and more ecologically homogeneous units, thus facilitating the analysis, interpretation, and reporting of data on pan-European indicators, as well as of their trends.
The classification is conceived to categorize stocked forest land, the classification keys being grounded on the identification of forest dominant tree species. Thus, temporarily unstocked forest areas (e.g. forest burned areas, clearcut areas under regeneration, etc.) cannot be directly assigned to European Forest Types, without the support of additional information (cf. Introduction, p. 5).
The 14 categories of the EFT represent groups — of varying breadth — of ecologically distinct forests communities dominated by specific assemblages of trees. Notably, categories 1–10 and 13 correspond, to forests communities dominated by specific assemblages of trees native to Europe. The forest physiognomy of categories 1–10 is mainly determined by the latitudinal/altitudinal zonation of European vegetation and by inner climatic and edaphic variation therein. Categories 11–12 include azonal forest communities. Category 14 identifies forest stands predominantly consisting of introduced tree species; these are mainly represented by forest plantations, but also stands originated from natural regeneration are included.
5 The report can be downloaded at http://reports.eea.europa.eu/technical_report_2006_9/en. The presently available report was revised in 2007.
79

Enquiry on improved Pan-European Indicators for Sustainable Forest Management - 2011 final
Table A1: New European Forest Types, outlook.
EFTs – Category level Main characteristics1. 1. Boreal forest Extensive boreal, species-poor forests, dominated by Picea abies and Pinus sylvestris.
Deciduous trees including birches (Betula spp.), aspen(Populus tremula), rowan (Sorbus aucuparia) and willows (Salix spp.) tend to occur as early colonisers.
2. 2. Hemiboreal and nemoral coniferous and mixed broadleaved-coniferous forest
Latitudinal mixed forests located in between the boreal and nemoral (or temperate) forest zones with similar characteristics to cat. 1, but a slightly higher tree species diversity, including also temperate deciduous trees like Tilia cordata, Fraxinus excelsior, Ulmus glabra and Quercus robur. Includes also: pure and mixed forests in the nemoral forest zone dominated by coniferous species native within the borders of individual MCPFE member states like Pinus sylvestris, pines of the Pinus nigra group, Pinus pinaster, Picea abies, Abies alba.
3. 3. Alpine forest High-altitude forest belts of central and southern European mountain ranges, covered by Picea abies, Abies alba, Pinus sylvestris, Pinus nigra, Larix decidua, Pinus cembra and Pinus mugo. Includes also the mountain forest dominated by birch of the boreal region.
4. 4. Acidophilous oak and oak-birch forest
Scattered occurrence associated to less fertile soils of the nemoral forest zone; the tree species composition is poor and dominated by acidophilous oaks (Q. robur, Q. petraea) and birch (Betula pendula).
5. 5. Mesophytic deciduous forest
Related to medium rich soils of the nemoral forest zone; forest composition is mixed and made up of a relatively large number of broadleaved deciduous trees: Carpinus betulus, Quercus petraea, Quercus robur, Fraxinus, Acer and Tilia cordata.
6. 6. Beech forest Widely distributed lowland to submountainous beech forest. Beech, Fagus sylvatica and F. orientalis (Balkan) dominate, locally important is Betula pendula.
7. 7. Mountainous beech forest
Mixed broadleaved deciduous and coniferous vegetation belt in the main European mountain ranges. Species composition differs from cat. 6, including Picea abies, Abies alba, Betula pendula and mesophytic deciduous tree species. Includes also mountain fir dominated stands.
8. 8. Thermophilous deciduous forest
Deciduous and semi-deciduous forests mainly of the Mediterranean region dominated by thermophilous species, mainly of Quercus; Acer, Ostrya, Fraxinus, Carpinus species are frequent as associated secondary trees. Includes also Castanea sativa dominated forest.
9. 9. Broadleaved evergreen forest
Broadleaved evergreen forests of the Mediterranean and Macaronesian regions dominated by sclerophyllous or lauriphyllous trees, mainly Quercus species.
10. 10. Coniferous forests of the Mediterranean, Anatolian and Macaronesian regions
Varied group of coniferous forests in Mediterranean, Anatolian and Macaronesian regions, from the coast to high mountains. Dry and often poorly-developed soils limit tree growth. Several tree species, including a number of endemics, of Pinus, Abies and Juniperus species.
11. 11. Mire and swamp forest Wetland forests on peaty soils widely distributed in the boreal region. Water and nutrient regime determines the dominant tree species: Pinus sylvestris, Picea abies or Alnus glutinosa.
12. 12. Floodplain forest Riparian and riverine species-rich forests characterised by different assemblages of species of Alnus, Betula, Populus, Salix, Fraxinus, Ulmus.
13. 13. Non-riverine alder, birch or aspen forest
Pioneer forests dominated by Alnus, Betula or Populus.
14. 14. Introduced tree species forest
Forest dominated by introduced tree species (sensu pan-European indicator 4.4). Occur on a wide range of site conditions which otherwise would develop forests of above categories.Introduced tree species can be identified at regional (recommended) or national level and comprise:- tree species that are not native to Europe (e.g. Eucalyptus spp., Robinia pseudoacacia, Acacia dealbata, Ailanthus altissima, Prunus serotina, Quercus rubra, Fraxinus alba, Picea sitkensis, Pinus contorta, Pinus banksiana, Pseudotsuga menziesii, Tsuga heterophylla); - tree species native to Europe, but not naturally occurring within the borders of individual Forest Europe member state;- tree species native only in some regions of an individual Forest Europe country.
80
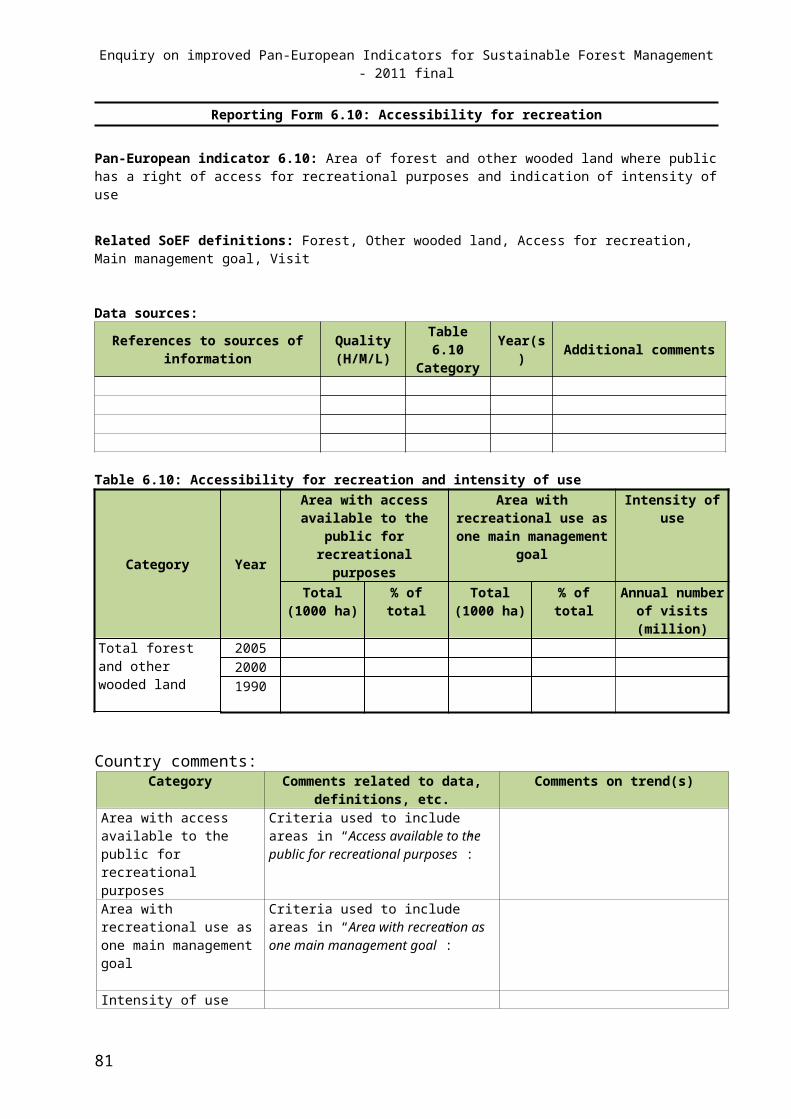
Enquiry on improved Pan-European Indicators for Sustainable Forest Management - 2011 final
Guidelines for reporting by EFTsOperational approaches to reclassify forest area to EFTs at national level should be flexible and allow for embedment into existing reporting routines.It is recommended to first assess the forest area to be assigned to Category 14, that must be also reported under pan-European indicator 4.4; A tree species can be regarded as introduced within an individual Forest Europe member state, if:
1) it does not naturally occur within its borders, i.e. its natural range falls fully outside the area of native occurrence of the species in Europe as mapped in the Atlas Florae Europaeae database (http://www.fmnh.helsinki.fi/english/botany/afe/publishing/database.htm). Otherwise available lists/maps of introduced tree species in the member state can be used as reference to classify forest area under this category, and shall be documented in the reporting forms under “Country comments”.
2) it naturally occurs only in specific regions of the country and can be regarded introduced outside;
In the latter case, a regional approach, if applicable, is recommended for reporting. Under Category 14 (and indicator 4.4) will be reported only the forest area dominated by the species falling outside its natural range within the country. The rest of the forest area will be assigned to 1-13 categories, based on tree species composition and biogeographical region. If the country is not able to apply such a regional approach it shall report all the forest area under the relevant 1-13 categories.
Example: Picea abies can be regarded as introduced in Ireland, UK, Spain, Portugal (natural range fully outside country borders); in western Norway Picea abies does not occur naturally, although it is the most common natural species in eastern Norway. Thus, Norway can adopt a regional approach to report forest area dominated by Picea abies: western Norway, Category 14 and eastern Norway Category 1.
Refer to EEA (2006) for the classification keys (Appendix II, Key A1.A4) and descriptions for the other categories; you can use the approach that is more feasible in your country to estimate national forest area by EFTs based on best available data sources (NFIs ground plots and forest maps, forest management plans). E.g.
81
Enquiry on improved Pan-European Indicators for Sustainable Forest Management - 2011 final
1. Countries having already developed national forest type classifications (forest maps included), provided that such classifications are grounded on same diagnostic criteria as the EFTs (e.g. actual forest vegetation, forest tree species composition, site ecological conditions, etc) can apply reclassification of national forest types to EFTs ('label to label' bridging functions).
2. In case EFTs are assessed with the use of original plot-based data, species dominance and assignment to an EFTs category should be based on basal area of dominant tree types and dominant forest species (cf. EEA, 2006 classification keys);
3. If information on basal area of dominant tree types and dominant forest species is not available, data on tree crown cover or on number of trees of the dominant tree layer can be used to identify dominant tree types and forest species, using the following thresholds:
- coniferous when > 75 % of the crown cover/number of trees consists of coniferous species; - broadleaved deciduous when > 75 % of the crown cover/number of trees consists of broadleaved deciduous species; - broadleaved evergreen when > 75 % of the crown cover/number of trees consists of broadleaved evergreen species; - mixed when neither coniferous, nor broadleaved species account for more than 75 % of the crown cover/number of trees.
For the needs of identification of the EFT category the coniferous/broadleaved deciduous/ broadleaved evergreen species (single or group of species), which accounts for more than 75% of the crown cover/number of trees, is considered as the dominant forest species.
82
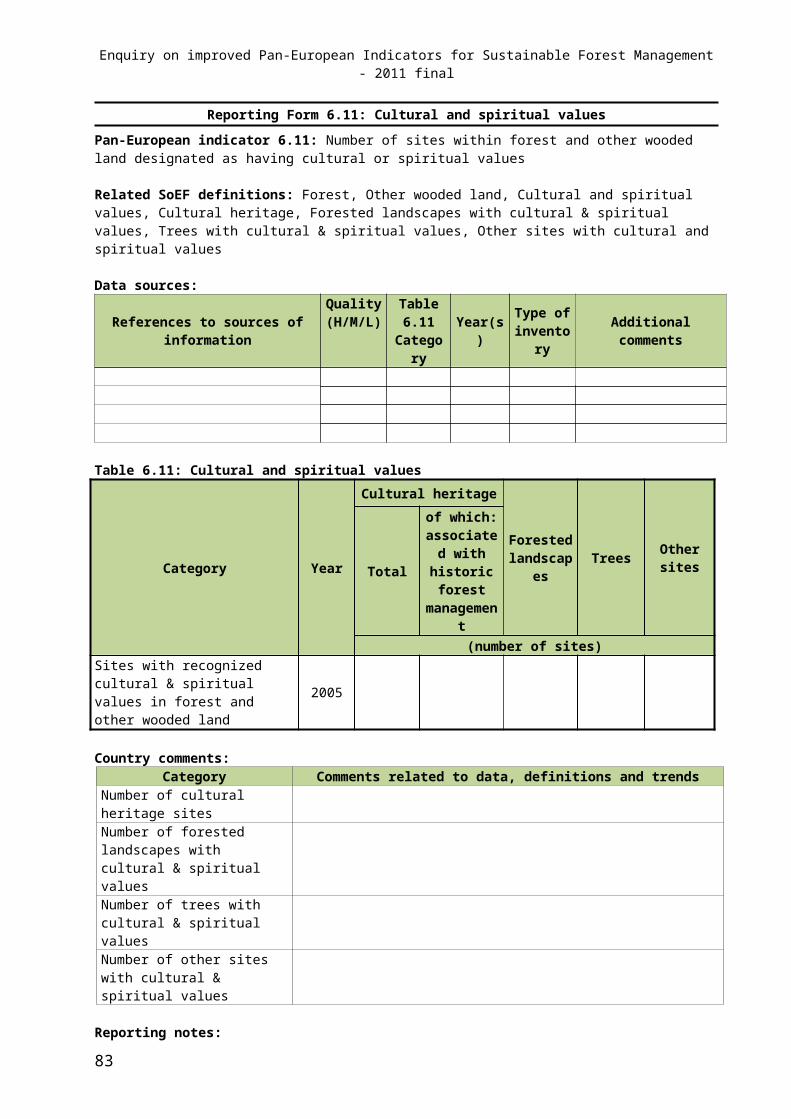
Enquiry on improved Pan-European Indicators for Sustainable Forest Management - 2011 final
Set of tables for pilot voluntary reporting by new European Forest Types
Pan-European indicator 1.3: Age structure and/or diameter distribution of forest and other wooded land, classified by forest type and by availability for wood supply.
Related SoEF definitions: Forest, Forest type, Stand, Even-aged stand
Pilot table 1.3c: Age class distribution (even aged stands) by European Forest Types
Category(Year: 2005) T
otal
Are
a(1
000
ha)
Area by age classes (1000 ha)
<10
year
s
11-2
0
21-4
0
41-6
0
61-8
0
81-1
00
101-
120
121-
140
>140
Uns
peci
fied
1. Boreal forest
2. Hemiboreal and nemoral coniferous and mixed broadleaved-coniferous forest 3. Alpine forest
4. Acidophilous oak and oak-birch forest5. Mesophytic deciduous forest
6. Beech forest
7. Mountainous beech forest
8. Thermophilous deciduous forest9. Broadleaved evergreen forest10. Coniferous forests of the Mediterranean, Anatolian and Macaronesian regions11. Mire and swamp forest
12. Floodplain forest
13. Non-riverine alder, birch or aspen forest14. Introduced tree species forestUnclassified stocked forest
Country comments:Category Comments related to data,
definitions, etc. Comments on the reported trends
Reporting notes: 1. Breakdown by the European Forest Types of age class distribution of even aged forest stands, as reported in Table
1.3a, is required.2. Reporting year: 2005.3. The country approach to the calculation of age class distribution by European Forest Types should be documented
in “Country comments”.
83
Enquiry on improved Pan-European Indicators for Sustainable Forest Management - 2011 final
Pan-European indicator 1.3: Age structure and/or diameter distribution of forest and other wooded land, classified by forest type and by availability for wood supply.
Related SoEF definitions: Forest, Stand, Forest type, Uneven-aged stands
Pilot Table 1.3d: Diameter distribution and total area (uneven-aged stands) by European Forest Types
Category(Year: 2005)
TotalArea
(1000 ha)
Total Volume (1 000
m³ o.b.)
Volume by diameter classes(1 000 m³ o.b.)
<20 cm 21-40 cm 41-60 cm >60 cm Unspecified1. Boreal forest
2. Hemiboreal and nemoral coniferous and mixed broadleaved-coniferous forest 3. Alpine forest
4. Acidophilous oak and oak-birch forest
5. Mesophytic deciduous forest
6. Beech forest
7. Mountainous beech forest
8. Thermophilous deciduous forest
9. Broadleaved evergreen forest
10. Coniferous forests of the Mediterranean, Anatolian and Macaronesian regions11. Mire and swamp forest
12. Floodplain forest
13. Non-riverine alder, birch or aspen forest
14. Introduced tree species forest
Unclassified stocked forest
Country comments:Category Comments related to data,
definitions, etc. Comments on the reported trends
Reporting notes: 1. Breakdown by the European Forest Types of uneven aged forest stands diameter distribution, as reported in Table
1.3b, is required.2. Reporting year: 2005.3. The country approach to the calculation of diameter distribution by European Forest Types should be documented
in “Country comments”.
84
Enquiry on improved Pan-European Indicators for Sustainable Forest Management - 2011 final
Pan-European indicator 4.1: Area of forest and other wooded land, classified by number of tree species occurring and by forest type
Related SoEF definitions: Forest, Stand, Tree, Forest type
Pilot table 4.1b: Tree species composition by European Forest Types
Category(Year: 2005)
Area with number of tree species occurring(1000 ha)
1 2-3 4-5 6-10 >101. Boreal forest
2. Hemiboreal and nemoral coniferous and mixed broadleaved-coniferous forest
3. Alpine forest
4. Acidophilous oak and oak-birch forest
5. Mesophytic deciduous forest
6. Beech forest
7. Mountainous beech forest
8. Thermophilous deciduous forest
9. Broadleaved evergreen forest
10. Coniferous forests of the Mediterranean, Anatolian and Macaronesian regions11. Mire and swamp forest
12. Floodplain forest
13. Non-riverine alder, birch or aspen forest
14. Introduced tree species forest
Unclassified stocked forest
Country comments:Category Comments related to data,
definitions, etc. Comments on the reported trends
Reporting notes: 1. Breakdown by the European Forest Types of the forest area classified by number of occurring tree species, as
reported in Table 4.1a, is required.2. Reporting year: 2005.3. The country approach to the calculation of tree species composition by European Forest Types should be
documented in “Country comments.
85
Enquiry on improved Pan-European Indicators for Sustainable Forest Management - 2011 final
Pan-European indicator 4.3: Area of forest and other wooded land, classified by “undisturbed by man”, by “semi-natural” or by “plantations”, each by forest type
Related SoEF definitions: Forest, Naturalness, Undisturbed by man, Semi-natural, Plantation, Forest type
Pilot table 4.3b: Naturalness of forest by European Forest Types
Category(Year: )
Area (1000 ha)
Undisturbed by man Semi-natural Plantations
1. Boreal forest
2. Hemiboreal and nemoral coniferous and mixed broadleaved-coniferous forest 3. Alpine forest
4. Acidophilous oak and oak-birch forest
5. Mesophytic deciduous forest
6. Beech forest
7. Mountainous beech forest
8. Thermophilous deciduous forest
9. Broadleaved evergreen forest
10. Coniferous forests of the Mediterranean, Anatolian and Macaronesian regions11. Mire and swamp forest
12. Floodplain forest
13. Non-riverine alder, birch or aspen forest
14. Introduced tree species forest
Unclassified stocked forest
Country comments:Category Comments related to data,
definitions, etc. Comments on the reported trends
Reporting notes: 1. Breakdown by the European Forest Types of the forest area classified by naturalness, as reported in Table 4.3a, is
required.2. Reporting year: 2005.3. The country approach to the calculation of forest naturalness by European Forest Types should be documented in
“Country comments”.
86
Enquiry on improved Pan-European Indicators for Sustainable Forest Management - 2011 final
Pan-European indicator 4.5: Volume of standing and of lying deadwood on forest and other wooded land, classified by forest type
Related SoEF definitions: Forest, Deadwood, Forest type
Pilot table 4.5b: Deadwood on forest by European Forest Types Category
(Year: 2005)Volume of deadwood
(m³/ha)
Total Standing Lying1. Boreal forest
2. Hemiboreal and nemoral coniferous and mixed broadleaved-coniferous forest 3. Alpine forest
4. Acidophilous oak and oak-birch forest
5. Mesophytic deciduous forest
6. Beech forest
7. Mountainous beech forest
8. Thermophilous deciduous forest
9. Broadleaved evergreen forest
10. Coniferous forests of the Mediterranean, Anatolian and Macaronesian regions11. Mire and swamp forest
13. Non-riverine alder, birch or aspen forest
14. Introduced tree species forest
Unclassified stocked forest
Country comments:Category Comments related to data,
definitions, etc. Comments on the reported trends
Reporting notes: 1. Breakdown by the European Forest Types of the deadwood volume on forest, as reported in Table 4.5a, is
required.2. Reporting year: 2005.3. The country approach to the calculation of forest deadwood volume by European Forest Types should be
documented in “Country comments”.
87


![KERANGAS [(Tropical) Heath Forests, (tropische) Heidewälder]](https://static.fdocument.pub/doc/165x107/55204d7d49795902118cd32e/kerangas-tropical-heath-forests-tropische-heidewaelder.jpg)