199 East 70th Place Merrillville, Indiana 46410 SIP2009.pdf · • LRE – Least Restrictive...
104
Public Law 221 2009-2010 Clifford Pierce Middle School 199 East 70 th Place Merrillville, Indiana 46410
Transcript of 199 East 70th Place Merrillville, Indiana 46410 SIP2009.pdf · • LRE – Least Restrictive...

Public Law 221
2009-2010
Clifford Pierce Middle School 199 East 70th Place Merrillville, Indiana 46410

Clifford Pierce Middle School Public Law 221 Report
Table of Contents
I. Introduction
a. Glossary………………………………………………………………………….….pg. 4 b. School Profile……………………………………………………………………….pg. 5 c. Demographics, Assessment Instruments……………………………………………pg. 8 d. Description and Location of Curriculum……………………………………………pg. 8 e. Student Success Process ……………………………………………………………pg. 10 f. Vision……………………………………………………………………………….pg. 11 g. Mission ……………………………………………………………………………..pg. 12
II. Data a. School Demographics ………………………………………………………………pg. 13 b. ISTEP Data Graphs………………………………………………………………….pg. 20 c. ISTEP Summary……………………………………………………………………..pg. 34 d. Discipline Graphs……………………………………………………………………pg. 35 e. Discipline Summary………………………………………………………………….pg. 41
III. Conclusions about Educational Programming a. Curriculum and Instruction………………………………………………………….pg. 43 b. Safe and Disciplined Learning Environment ……………………………………….pg. 44 c. Parent Involvement ………………………………………………………………....pg. 44 d. School Climate Survey……………………………………………………………...pg. 45
2
IV. Student Achievement Objectives and Goals a. Narratives of Goals …………………………………………………………………...pg. 62 b. Processes for each goal ……………………………………………………………….pg. 64
V. Professional Development Plan ………………………………………………………………pg. 75 VI. Form A ………………………………………………………………………………………..pg. 77
VII. Form B ………………………………………………………………………………………..pg. 78 VIII. Form C ……………………………………………………………………………………….. pg. 80
IX. Form D-1A ……………………………………………………………………………………pg. 82 X. Form D-2A ……………………………………………………………………………………pg. 84
3

Glossary of Terms
• AA — Allied Arts • AR — Academic Rotation • CIC — Continuous Improvement Council • Core subjects – Math, English, Science, Social Studies • E/LA – English/Language Arts • ES – Essential Skills • EH/ED – Emotionally Handicapped/ Emotionally Disabled • IAS – Indiana Academic Standards • ICARE – Indiana Content Area Reading • ISTEP – Indiana Statewide testing for Educational Progress • LRE – Least Restrictive Environment • LSS – Language Skills and Strategies • MSS – Math Skills and Strategies • NCLBA – No Child Left Behind Act • PBIS – Positive Behavior Intervention and Support • PDSA – Plan, Do, Study, Act • PEP – Preventing Expulsion Program • Pirate POWER – advisory period that stands for Principal’s Perspective, Operation Read, Working Together, Energizing, Rejoice-Reflect-Reward • PL221 – Public Law 221 • Power Writing – A sequential process that begins with a word – moves to a phrase- to a sentence – to paragraphs – to multi paragraph essays. Power
writing replaces writing terminology with a numbered structure. • PTO – Parent – Teacher Organization • REM – Remediation, Enrichment, Maintenance period • RSS – Reading Skills and Strategies • RTI – Response to Intervention • Ruby Payne – Ruby Payne’s Framework for Poverty techniques help the teacher and the entire school community by defining economic classes and
their affects on behaviors, attitudes and mindsets. • SIP – School Improvement Plan • SSP – Student Success Process • WSS – Writing Skills and Strategies
4
School Profile
Clifford Pierce Middle School is located in the town of Merrillville, Indiana. Merrillville is the 22nd largest community in
Indiana and the second largest land mass community in northwest Indiana with 32.5 square miles of land. Merrillville is continuing to grow rapidly as families from other states, especially from nearby Chicago, and other parts of Indiana are moving into the area. The Merrillville Community School Corporation comprises all of Ross Township, which includes Merrillville, as well as parts of Crown Point and Hobart.
Many residents commute for work purposes to either the industrial areas of northern Lake and Porter counties, or to the urban or suburban areas of Chicago. The community is a mix of socioeconomic middle class and lower middle class. Merrillville Community School Corporation has an enrollment of approximately 6200 students with 2000 students enrolled in five K-4 elementary schools, 1100 at Merrillville Intermediate School, 1100 at Pierce Middle School, and 2100 at Merrillville High School. Clifford Pierce Middle School reorganized in 2001-2002 as the only middle school comprised of exclusively 7th and 8th grade students within the school community. Prior to this transition, Merrillville had two 6-8 grade middle schools.
The school is a center of learning that reflects the profound changes occurring in the American landscape. It began in a small, rural community as a high school in 1928. Throughout the century, Merrillville became more suburban as heavy industry brought families to the area. Evolving from a high school to a junior high school, and now a middle school, Pierce has transformed into a state-of-the-art middle school within the shopping, entertainment, and growth center of northwest Indiana. In 1999 Pierce celebrated the beginning of a new era following a 2 ½ year, $28 million renovation.
Pierce Middle School is a one-of-a-kind building, which has been featured in architectural publications. One of the unique features of Pierce Middle School is the planetarium, which serves over 26,000 visitors each year with programs for all Merrillville schools, the surrounding school districts, and the community at-large. The school is well equipped technologically with traditional computer labs, portable wireless laptop labs, and modular multimedia labs for the Scholastic Read 180 classes. As a middle school, the building design incorporates the team concept into its floor plan and provides flexibility in instructional and meeting space.
5
Pierce Middle School faces challenges head-on with an eye on the future. In its lobby, suspended two stories above the entry, is a 15 foot model of the space shuttle, Endeavor. This symbol reflects a slogan that exemplifies the mood at Pierce Middle School. The school looks up the future with “A New Endeavor” as it seeks continuously to improve upon its great foundation.
Organizations Various ethnic, racial, and religious groups and traditions are represented within the student population. Student success is reflected in the number of awards and recognition that individuals and the school have received in academic, athletic, and community service areas. Some examples of these honors are:
• National Blue Ribbon School, 2000 • Indiana Blue Ribbon School, 1999 • Indiana Academic Super Bowl, multiple state awards • Indiana Spell Bowl, multiple state awards • Band, Orchestra, Choir awards for the state and region • Yearbook, state and national awards • Indiana learning and Service Grant award by the Indiana youth Commission • 1st Annual Birdsong Award from the Anti-Defamation league presented to STAND • We the People, multiple regional and state awards • Science Olympiad, multiple regional and state awards • Indiana School Improvement Program School award • Indiana Guidance Leadership Project, participant • Athletic conference and state championships
6

In addition to the recognitions listed above, Pierce students have the opportunity to participate in the following extracurricular activities. Several hundred students are active participants in these groups. Their involvement reflects the sense of community established at Pierce.
• Academic Super Bowl • Spell Bowl • Science Olympiad • Science Club • Drama Club • Art Club • Pierce Newspaper • Yearbook • Planetarium Club • Drama Club • Chess Club • Media Club • Builders Club • Young Men on a Mission • Peer Mediation • Athletic Teams • National Junior Honors Society • Socially Together and Naturally Diverse (STAND)
7
Special education services, guidance counseling, social work, speech, and remediation for essential skills are available for all students. Conflict resolution activities including peer mediation are options for students. Both co-curricular and extra curricular groups conduct community service projects. Celebrations include quarterly awards breakfasts, quarterly academic recognitions, bi-weekly PBIS redemption days, acknowledgements of success daily, evening family events, and sports invitational events.
Demographics The enrollment at Pierce Middle School is approximately 1200 7th and 8th grade students. The mobility rate at this time is 29% and fluctuates from year to year. The ethnic makeup of the student population is diverse with African American 59%, Caucasian 21%, Hispanic 10%, Multiracial 8%, Asian 1%, and Native Americans 0%. Included in the student population are approximately 100 special education students and Limited English proficiency students. Students who qualify for free or reduced lunch number at 44% of the total population. Three administrators, two guidance counselors, one social worker, one school nurse, 66 teachers including 6 special education teachers, and 56 support staff serve the school. Assessment Instruments In addition to ISTEP+ and ISTAR, the Merrillville Community School Corporation uses the Northwest Evaluation Association’s Measure of Academic Progress (NWEA-MAP), which is a computerized adaptive testing program in math, language arts, and reading. In addition to the NWEA-MAP, the school applies the 6+1 writing rubric district-wide. In math and language arts Pierce utilizes an 8-step instructional cycle called the Student Success Process (SSP). As part of this system, math and language assessments take place bi-weekly. Applied Skills questioning is used in the enrichment component of SSP, as well as in the regular classroom. Clifford Pierce Middle School has incorporated the Scholastic Read 180 program which periodically assesses students and their lexile reading scores to determine readability.
8
Description and Location of Curriculum Consistent throughout the Merrillville Community School Corporation is curriculum for all academic subject areas including mathematics, science, social studies, language arts, technology, art, music, physical education, family/consumer science, industrial technology, and Scholastic Read 180. The curriculum for each subject area is based on the Indiana Academic Standards. Malcolm Baldrige Criteria provides the basis for the design format of these plans. Copies of each department curriculum are available in the corporation administration office in addition to being posted on the corporation website. Each teacher is provided with a copy of the curriculum and map for their content area. Representation on curriculum design committees includes teachers and administrators from all levels.
9
Pierce Middle School Course Offerings: The following courses are offered to all students at Pierce Middle School:
• Language Arts • Math • Science • Social Studies • Alcohol, Tobacco, and Other Drugs (ATOD) • Band • Choir • Computer Applications • Computer Lab • Exploring Art/Music • Family and Consumer Science • Industrial Technology • Math Strategies • Multicultural/Multimedia Art • Music • Orchestra • Physical Education • Pirate Power • Remediation, Enrichment, Maintenance (REM) • Spanish/French Art/Humanities • Writing Skills and Strategies
Special Courses: The following courses are offered to students who qualify:
• Language Skills and Strategies • Honors English • Honors Math • Math Skills and Strategies • Preventing Expulsion Program • Scholastic Read 180 • Special Education • RTI tutoring
10

The Student Success Process Test Score Desegregation Use student test scores to identify instructional groups. Identify weak and strong objective areas.
Time Line Development
Develop a campus time line that encompasses all objective areas and time allocations based on the needs of the student groups.
Instructional Focus Using the time line, deliver the instructional focus lessons using the schedule.
Assessment Administer an assessment to identify mastery and non-mastery students. Tutorials Provide tutorial time to reteach non-mastered target areas Enrichment Provide enrichment opportunities for mastery students, concentrating on applied skills questions. Maintenance Provide materials for ongoing maintenance and reteaching Monitoring The principal assumes the role of instructional leader and is continuously involved in the teaching and learning process.

VISION
The Merrillville Community School Corporation has adopted a vision for its schools. This vision is a basis for the future and drives the mission of the middle school.
At the crossroads of Northwest Indiana, the Merrillville Community School Corporation creates a hometown feeling in a metropolitan area. The sprawling school community, nestled in comfortable neighborhood settings, offers attractive, well-maintained and safe schools with a comprehensive curriculum and state-of-the-art technology. A wide range of educational programs and activities are equally available to all, from preschoolers to senior citizens. Families are woven into a tapestry representing various ethnic, racial, and religious traditions united by the common bond seeking a quality education for the community.
People feel a close connection to the school system due to the emphasis on communication. Communication is the core that allows for a collaborative relationship among the school staff, parents and community. These relationships foster and support the learning experiences that challenge each student at a level appropriate to the individual’s needs and interests.
Merrillville has long enjoyed a reputation for the professional competence and character of its faculty, staff, and administration. The professional staff understands and accepts personal responsibility for achieving the mission of the school corporation. The school system is committed to designing and organization of learning that seeks continuous improvement and quality, resulting in highest student achievement.
Clearly written goals, aligned with rigorous academic standards, have been established and reach far beyond the minimum standards required by the Indiana Department of Education. These goals also focus on developing independent, lifelong learners, and responsible, productive citizens.
Learning environments throughout the school corporation are energized by sense of awe, curiosity, and enthusiasm generated by knowledgeable, caring adults who ignite and sustain the desire to learn. Students are inspired by teachers who use a wide range of teaching methods in order to ensure that students are active learners. Students find the content of their subjects
12

to be meaningful and applicable to the next stage of their development as learners. Each student is motivated to take ownership for learning resulting in the mastery of basic skills, literacy in wide range of subjects, and proficiency in the use of technology.
Students are able to make intelligent academic, personal and career choices as a result of individual counseling and community-based learning opportunities. Career exploration activities are provided though internships and mentoring with local business people civic leaders, and government officials.
Clifford Pierce Middle School’s Mission
Clifford Pierce Middle School provides a safe learning environment that prepares students for future success by
fostering respect, responsibility, creativity, and a desire to learn.
Adopted by the parents, students, and faculty of Clifford Pierce Middle School
13
School Demographic Data
14
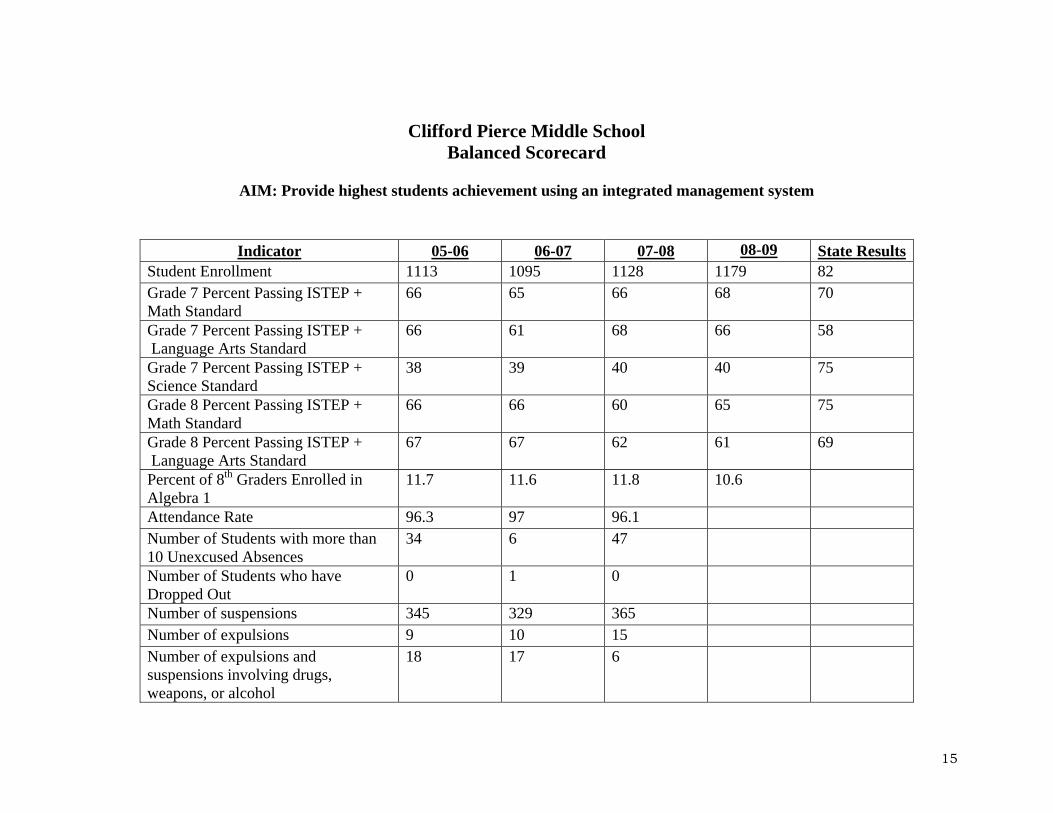
Clifford Pierce Middle School Balanced Scorecard
AIM: Provide highest students achievement using an integrated management system
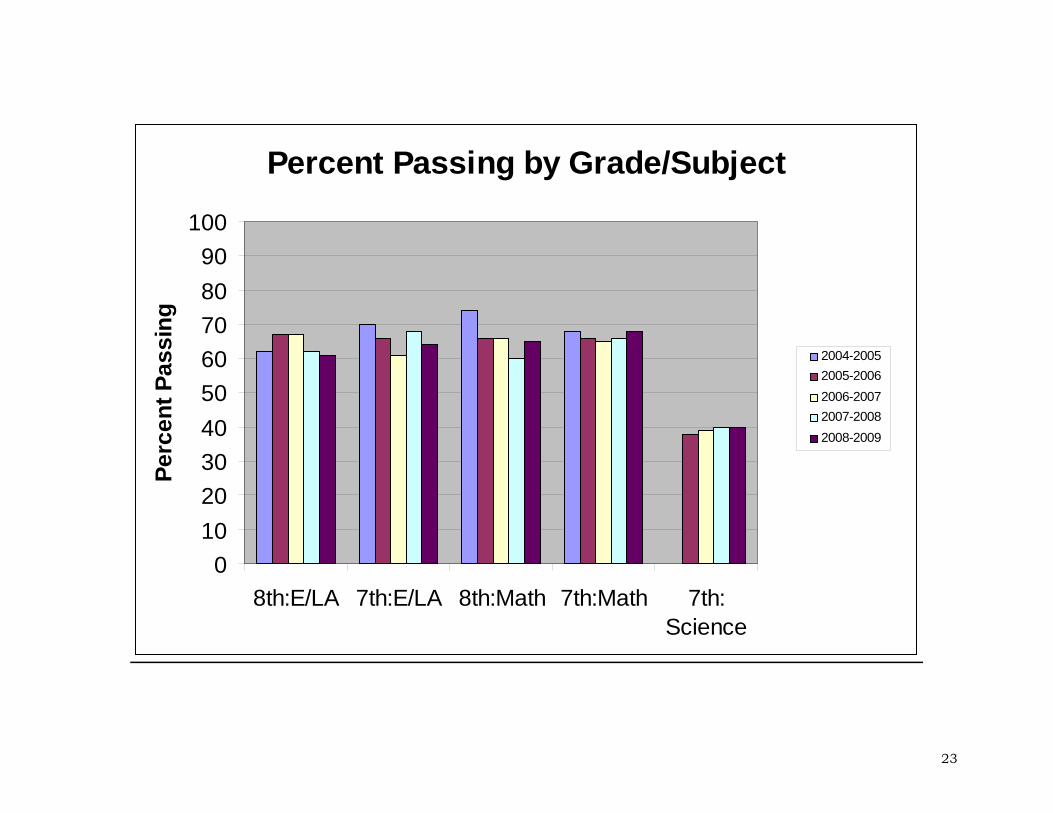
08-09Indicator 05-06 06-07 07-08 State Results Student Enrollment 1113 1095 1128 1179 82 Grade 7 Percent Passing ISTEP + 66 65 66 68 70 Math Standard
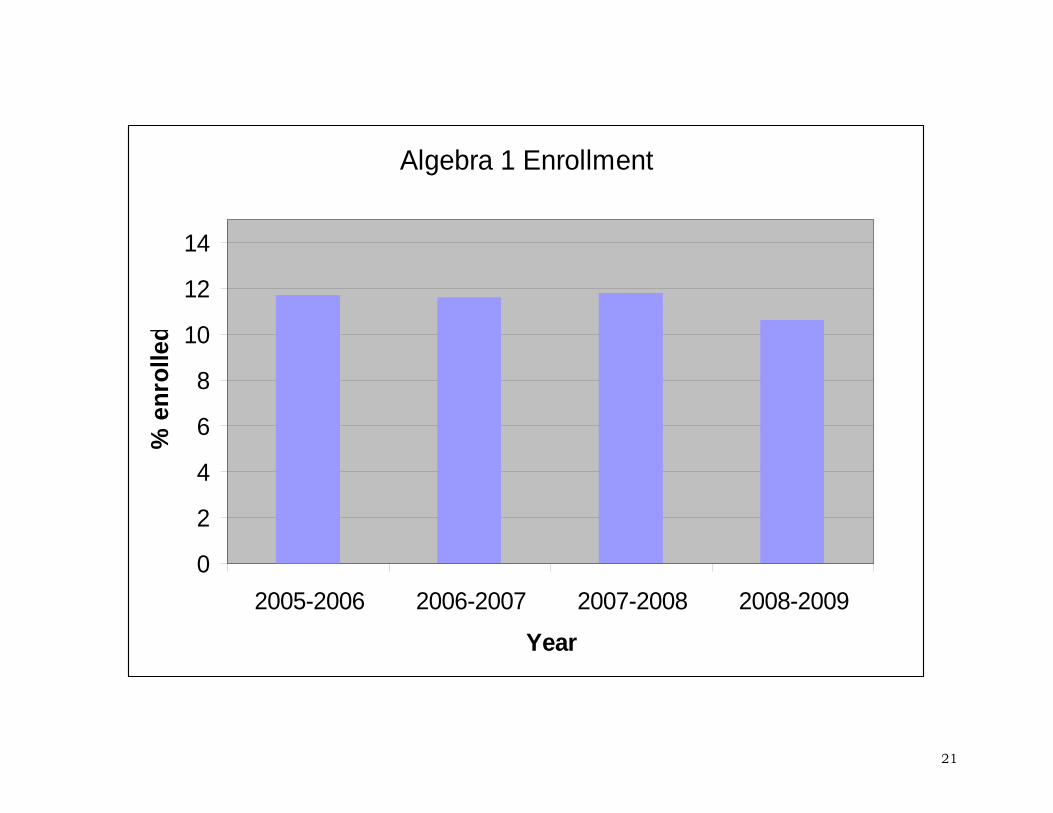
Grade 7 Percent Passing ISTEP + 66 61 68 66 58 Language Arts Standard Grade 7 Percent Passing ISTEP + 38 39 40 40 75 Science Standard Grade 8 Percent Passing ISTEP + 66 66 60 65 75 Math Standard Grade 8 Percent Passing ISTEP + 67 67 62 61 69 Language Arts Standard Percent of 8th Graders Enrolled in Algebra 1
11.7 11.6 11.8 10.6
Attendance Rate 96.3 97 96.1 Number of Students with more than 10 Unexcused Absences
34 6 47 Number of Students who have
Dropped Out 0 1 0
Number of suspensions 345 329 365 Number of expulsions 9 10 15 Number of expulsions and
suspensions involving drugs, weapons, or alcohol
18 17 6
15
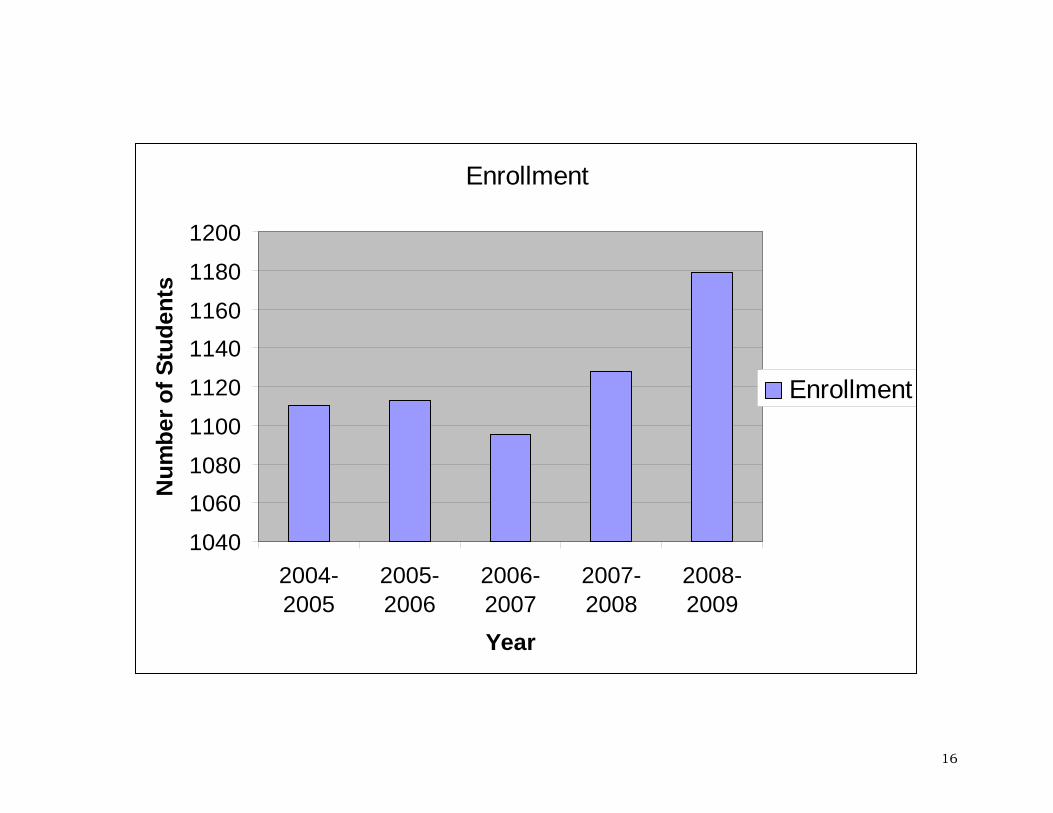
Enrollment
1040
10601080
1100
1120
11401160
1180
1200
2004-2005
2005-2006
2006-2007
2007-2008
2008-2009
Year
Num
ber o
f Stu
dent
s
Enrollment
16
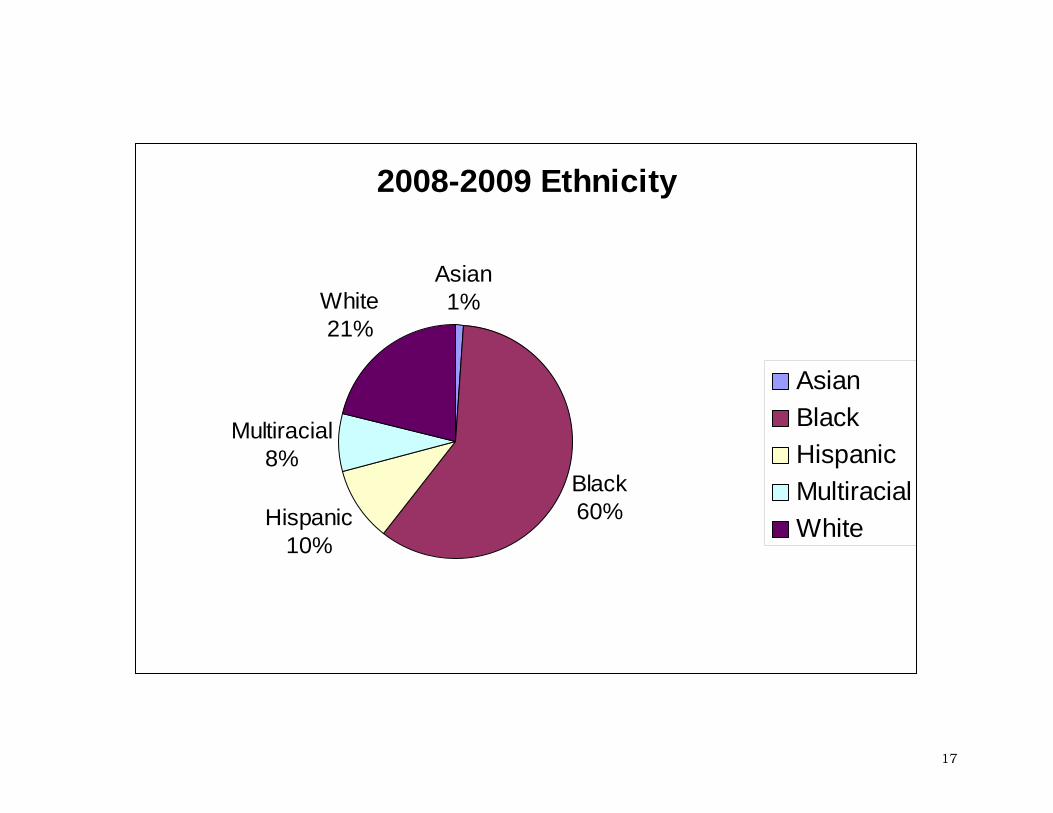
2008-2009 Ethnicity
Asian1%
Black60%Hispanic
10%
Multiracial8%
White21%
AsianBlackHispanicMultiracialWhite
17

2008-2009 Free Lunch Report
Free32%
Reduced12%
Paid56%
FreeReducedPaid
18
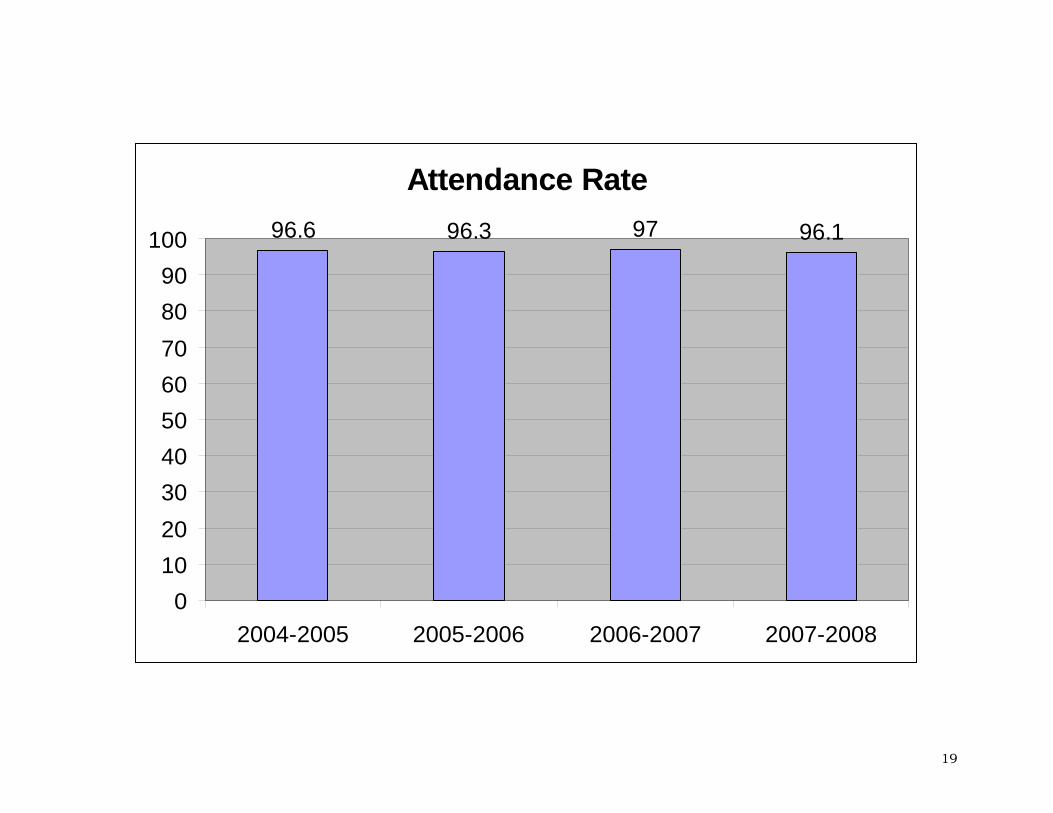
Attendance Rate96.6 96.3 97 96.1
0102030405060708090
100
2004-2005 2005-2006 2006-2007 2007-2008
19

20
Algebra 1 Enrollment
0
2
4
6
8
10
12
14
2005-2006 2006-2007 2007-2008 2008-2009
Year
% e
nrol
led
21

ISTEP DATA
22
Percent Passing by Grade/Subject
0102030405060708090
100
8th:E/LA 7th:E/LA 8th:Math 7th:Math 7th:Science
Perc
ent P
assi
ng
2004-20052005-20062006-20072007-20082008-2009
23
Percent Passing by Grade/Subject/Gender
0102030405060708090
100
7th: English 7th: Math 8th:English 8th: Math
Perc
ent P
assi
ng
MaleFemale
24

Special Education Comparision
0102030405060708090
100
English Math
Perc
ent P
assi
ng
7th8th
25

Ethnicity: English
0102030405060708090
100
Black Hispanic White MultiracialEthnicity
Perc
ent P
assi
ng
7th: English8th:Englih
26
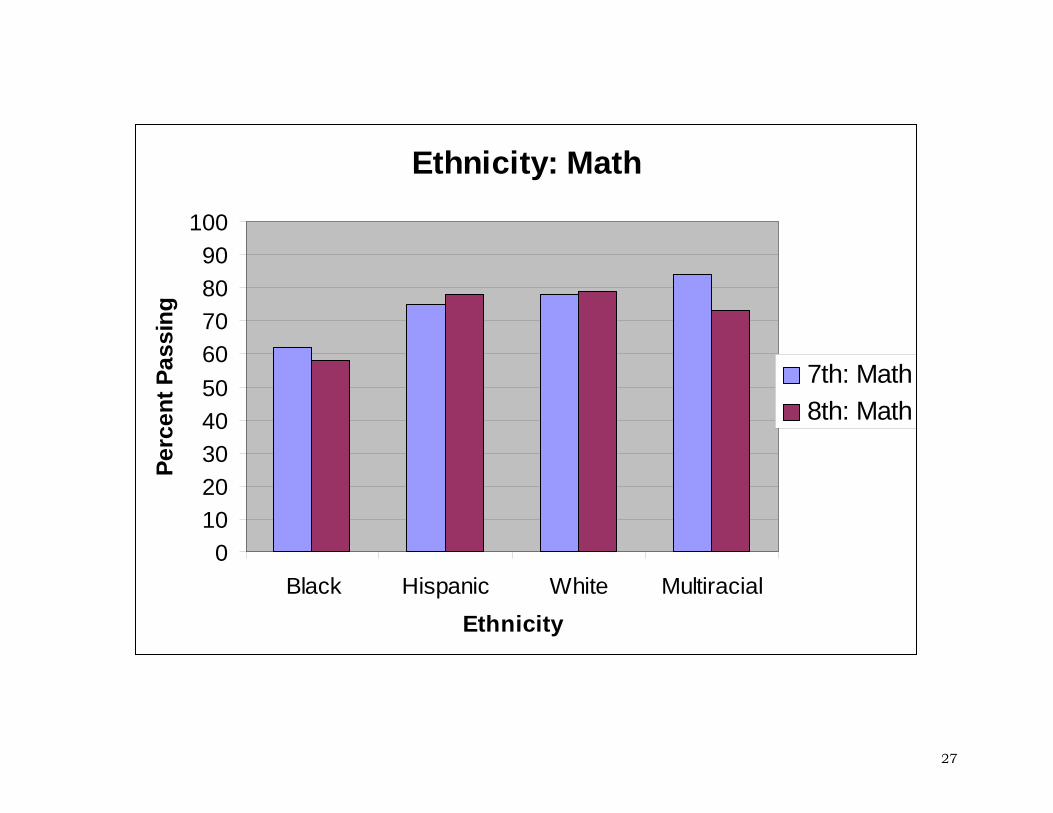
Ethnicity: Math
0102030405060708090
100
Black Hispanic White MultiracialEthnicity
Perc
ent P
assi
ng
7th: Math8th: Math
27

English Indicators: 7th Grade by Gender
0
10
2030
40
50
60
7080
90
100
ReadingVocabulary
ReadingComprehension
Writing Process
Perc
enta
ge P
assi
ng
MaleFemale
28
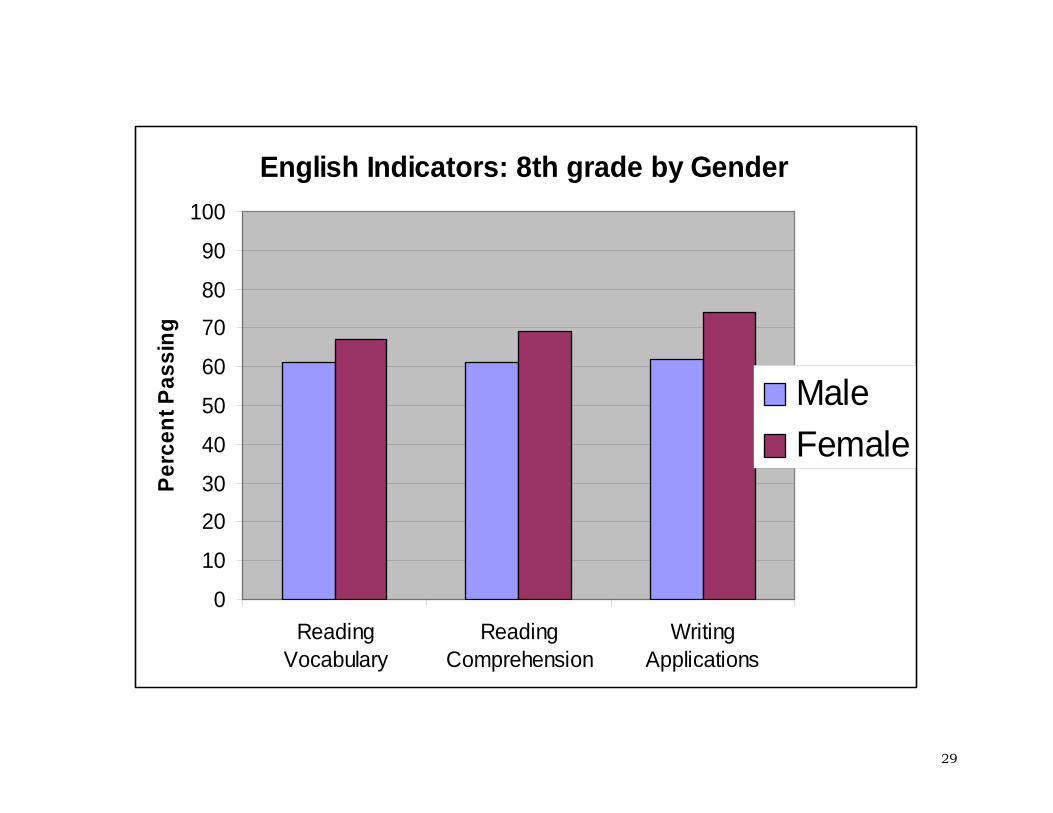
English Indicators: 8th grade by Gender
0
10
20
30
40
50
60
70
80
90
100
ReadingVocabulary
ReadingComprehension
WritingApplications
Perc
ent P
assi
ng
MaleFemale
29
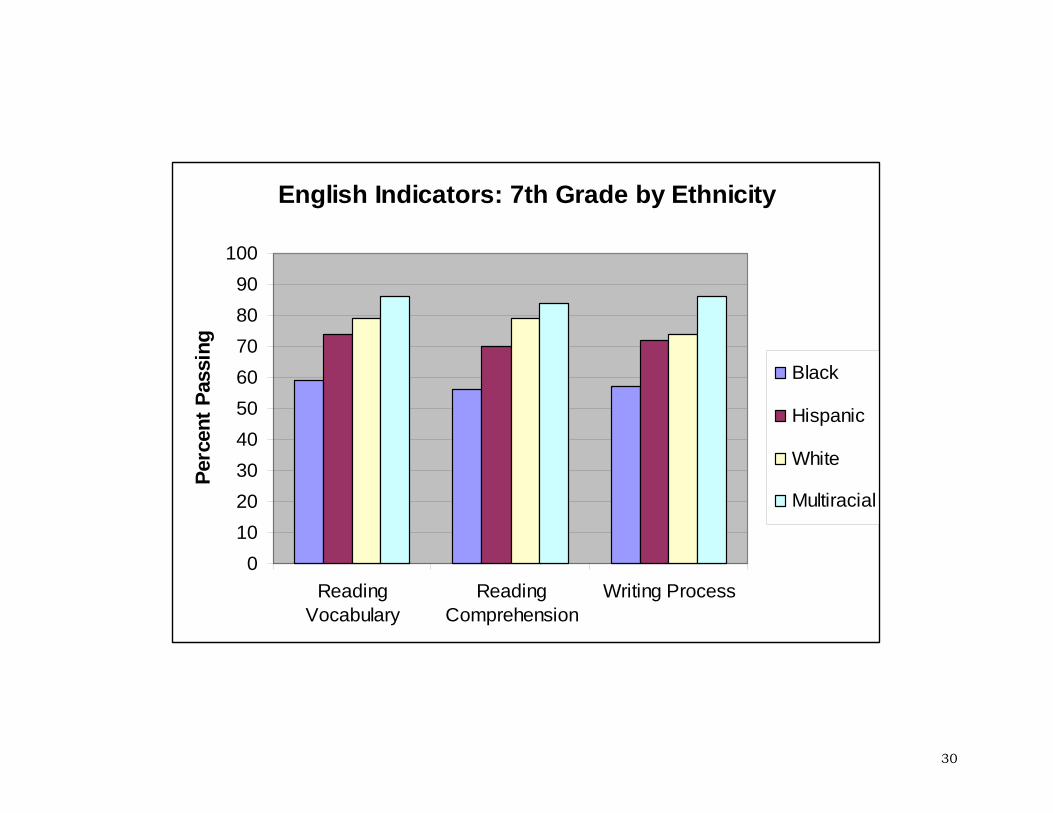
English Indicators: 7th Grade by Ethnicity
0102030405060708090
100
ReadingVocabulary
ReadingComprehension
Writing Process
Perc
ent P
assi
ng
Black
Hispanic
White
Multiracial
30
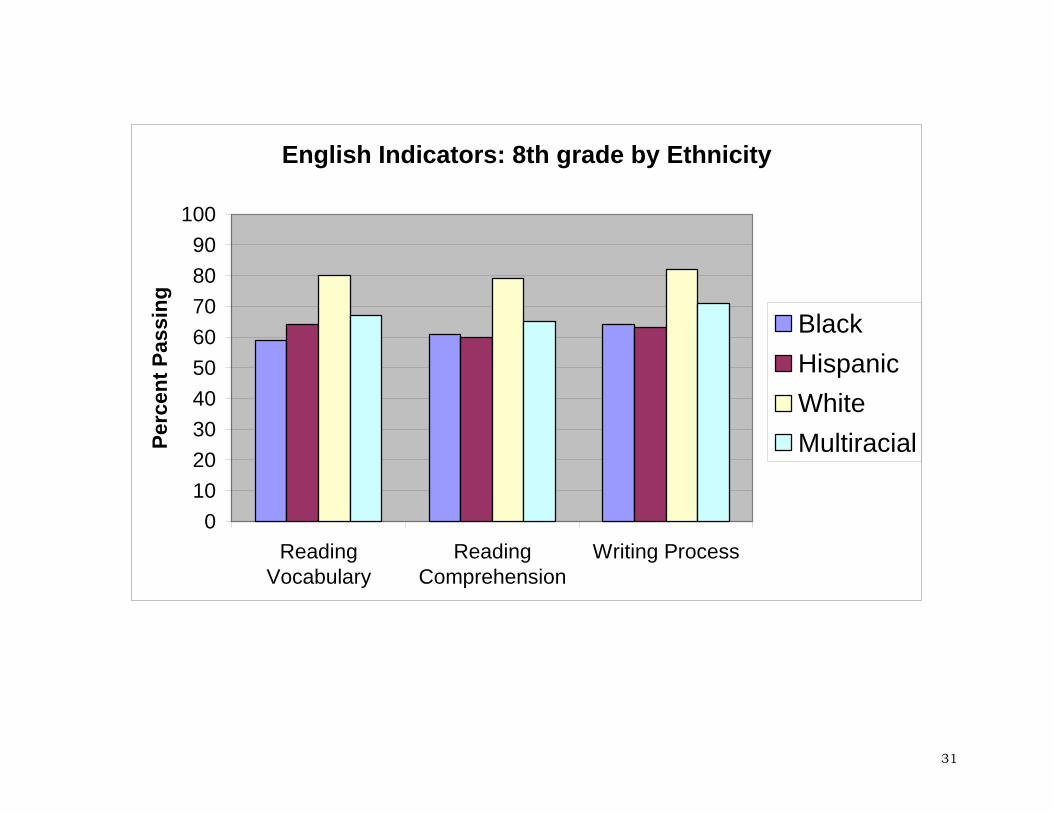
English Indicators: 8th grade by Ethnicity
0102030405060708090
100
ReadingVocabulary
ReadingComprehension
Writing Process
Perc
ent P
assi
ng
BlackHispanicWhiteMultiracial
31

Math Indicators: 7th grade by Gender
0102030405060708090
100
Numbe
r Sen
seCom
putat
ion
Algebra
& Fun
ction
sGeo
metry
Measu
remen
tData
Ana
lysis
Problem
Solv
ing
Perc
ent P
assi
ng
MaleFemale
32
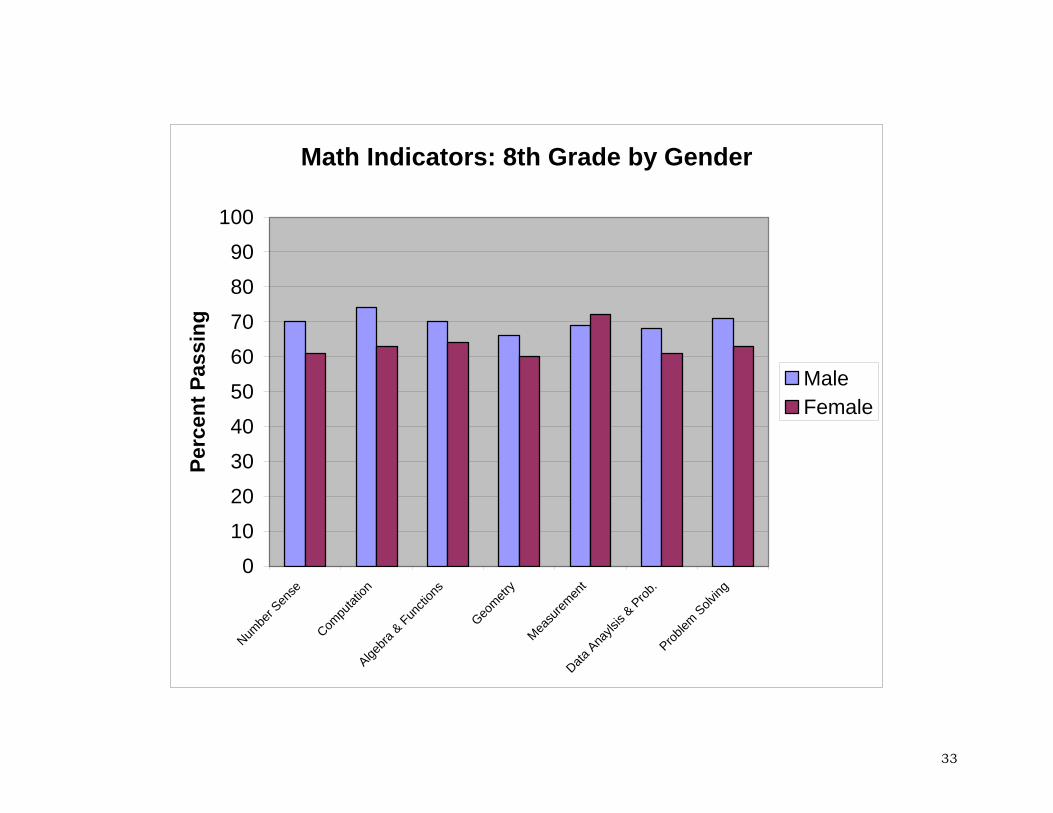
Math Indicators: 8th Grade by Gender
0
10
20
30
40
50
60
70
80
90
100
Numbe
r Sen
se
Compu
tation
Algebra
& Fun
ction
s
Geometr
y
Measu
remen
tData
Ana
ylsis
& Prob
.Prob
lem S
olving
Perc
ent P
assi
ng
MaleFemale
33
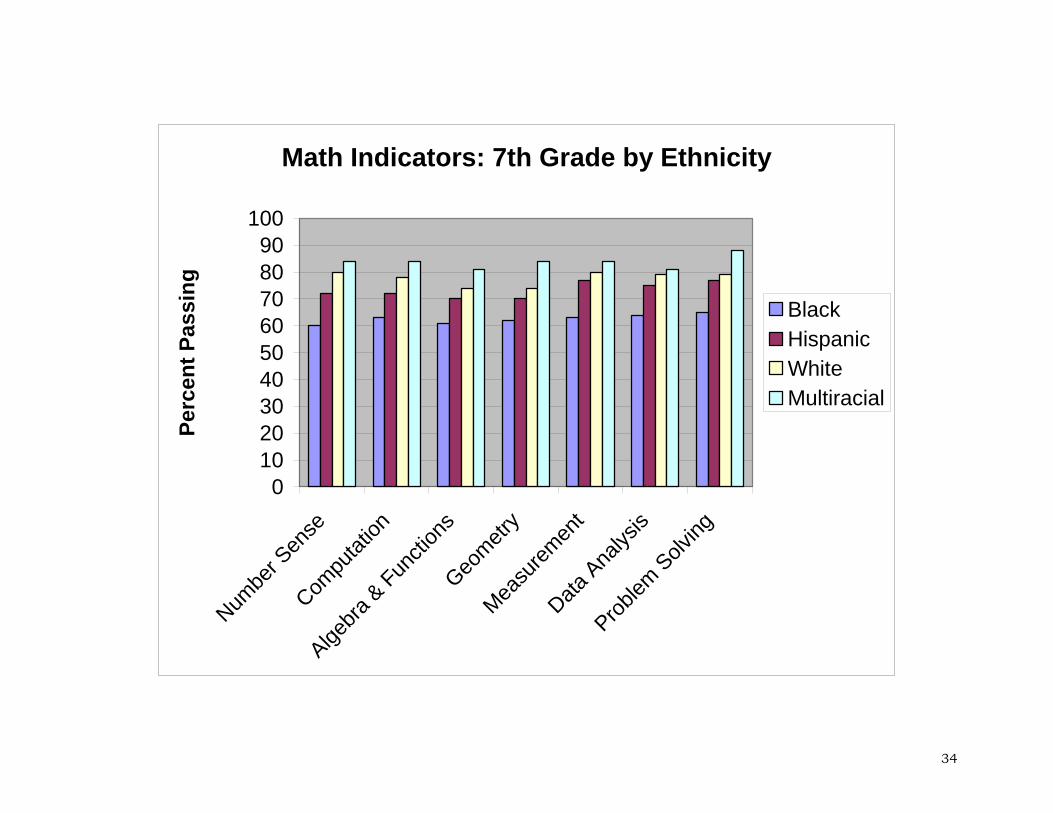
Math Indicators: 7th Grade by Ethnicity
0102030405060708090
100
Numbe
r Sen
seCom
putat
ion
Algebra
& Fun
ction
sGeo
metry
Measu
remen
tData
Ana
lysis
Problem
Solving
Perc
ent P
assi
ng
BlackHispanicWhiteMultiracial
34
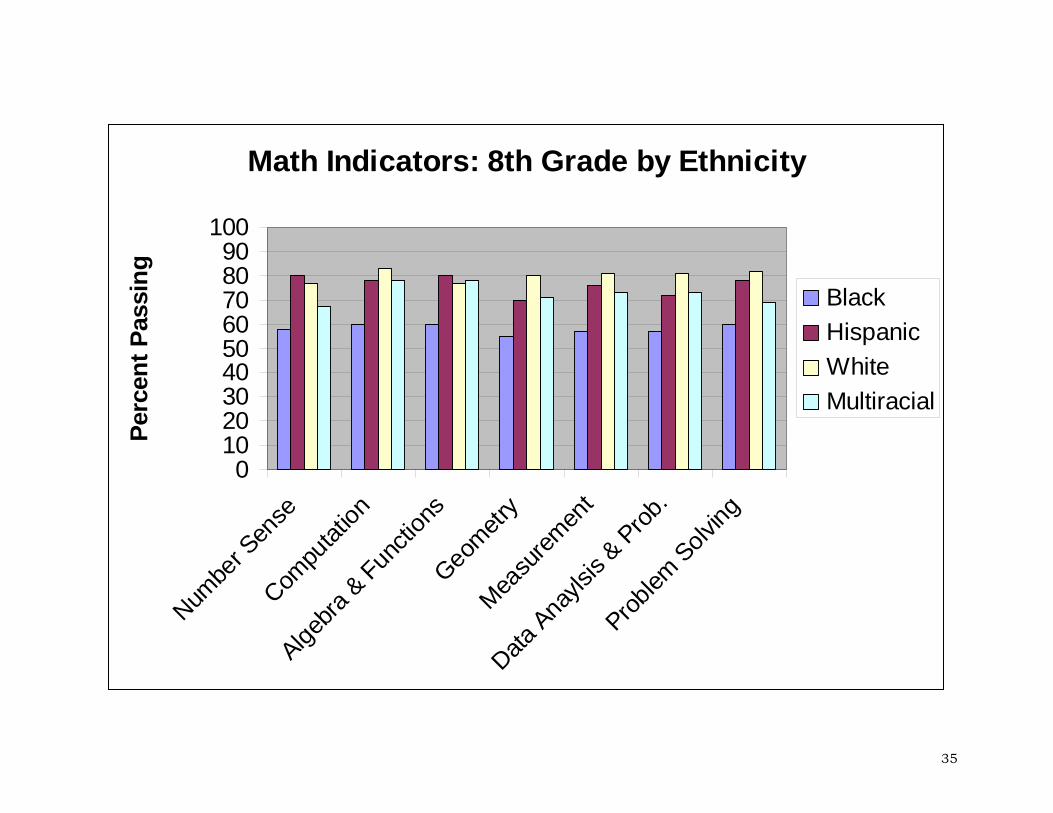
Math Indicators: 8th Grade by Ethnicity
0102030405060708090
100
Numbe
r Sen
seCom
putat
ion
Algebra
& Functi
ons
Geometr
yMea
surem
ent
Data Ana
ylsis
& Prob
.
Problem
Solving
Perc
ent P
assi
ng
BlackHispanicWhiteMultiracial
35

Summary of ISTEP data
• Summer school funding was reinstated which could have contributed to an increase in test performance on the fall ISTEP in Math
th• 8 grade mathematics experienced a 4% increase. We attribute this to high emphasis placed on applied skills at the classroom level. We have changed the SSP process to be implemented in math and English classrooms.
th grade English experienced a decrease in performance. • 7th grade science has steadily improved each year. • 7
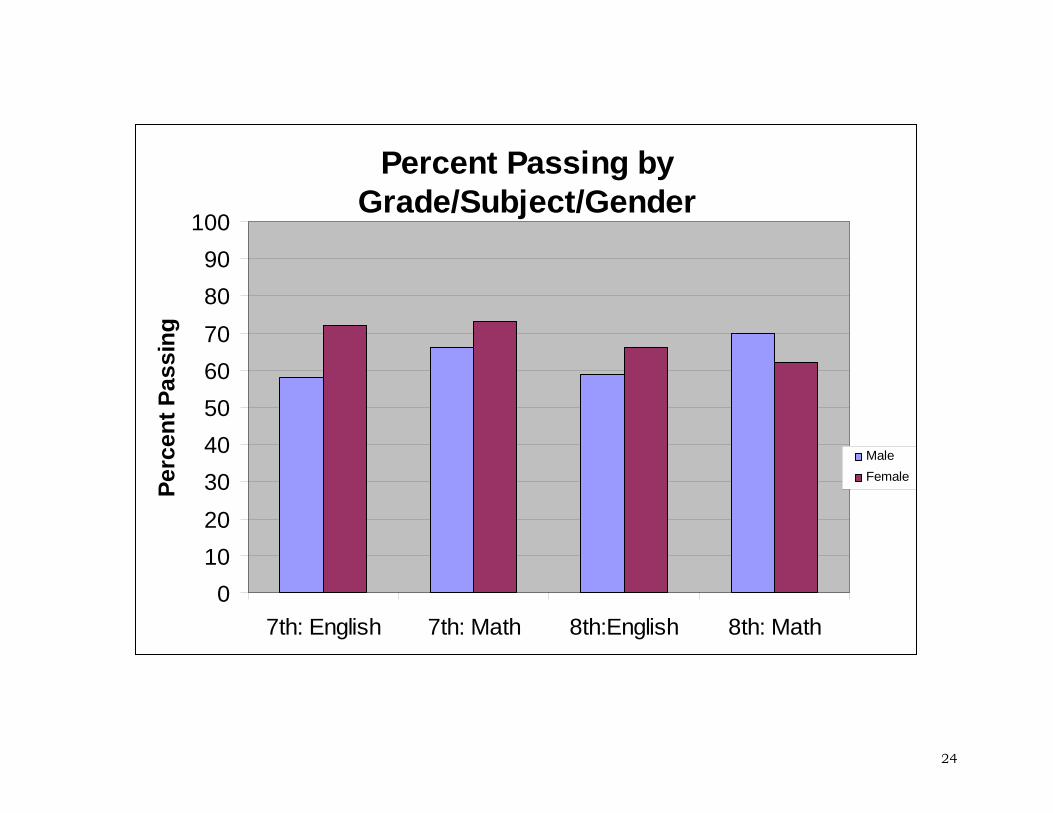
• There still remains a gender gap in performance. Females scored 7 percentage points higher than males in language, and males scored 8 percentage points higher than females in math.
th• At 7 grade, both Hispanics and Multiracial groups showed remarkable improvement in language with the multiracial students performing better than all groups. At 8th grade, all subgroups lag behind in performance when compared to Caucasian students. In math, at 7th grade both Hispanics and multiracial subgroups have closed the achievement gap with African American students showing remarkable improvement. Eighth grade performance in math was similar to that at 7th grade with African American students lagging behind all subgroups.
36

Discipline Data
37
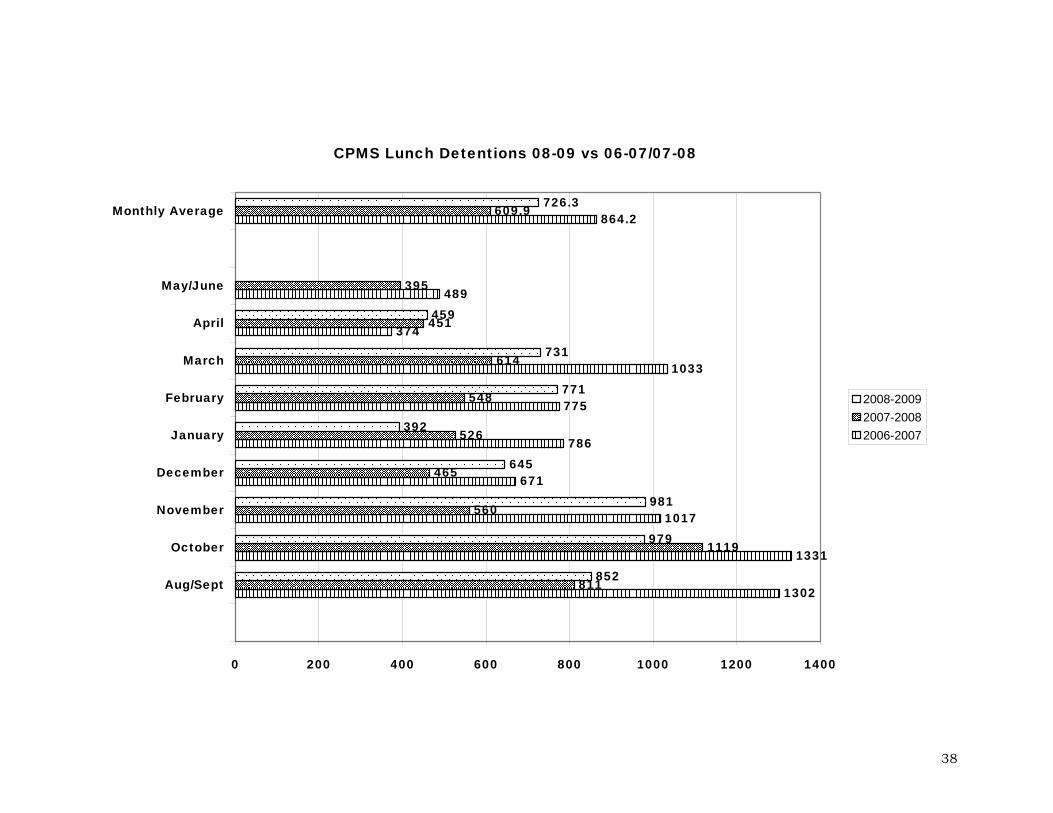
CPMS Lunch Detentions 08-09 vs 06-07/07-08
1302
1331
1017
671
786
775
1033
374
489
864.2
811
1119
560
465
526
548
614
451
395
609.9
852
979
981
645
392
771
731
459
726.3
0 200 400 600 800 1000 1200 1400
Aug/Sept
October
November
December
January
February
March
April
May/June
Monthly Average
2008-20092007-20082006-2007
38
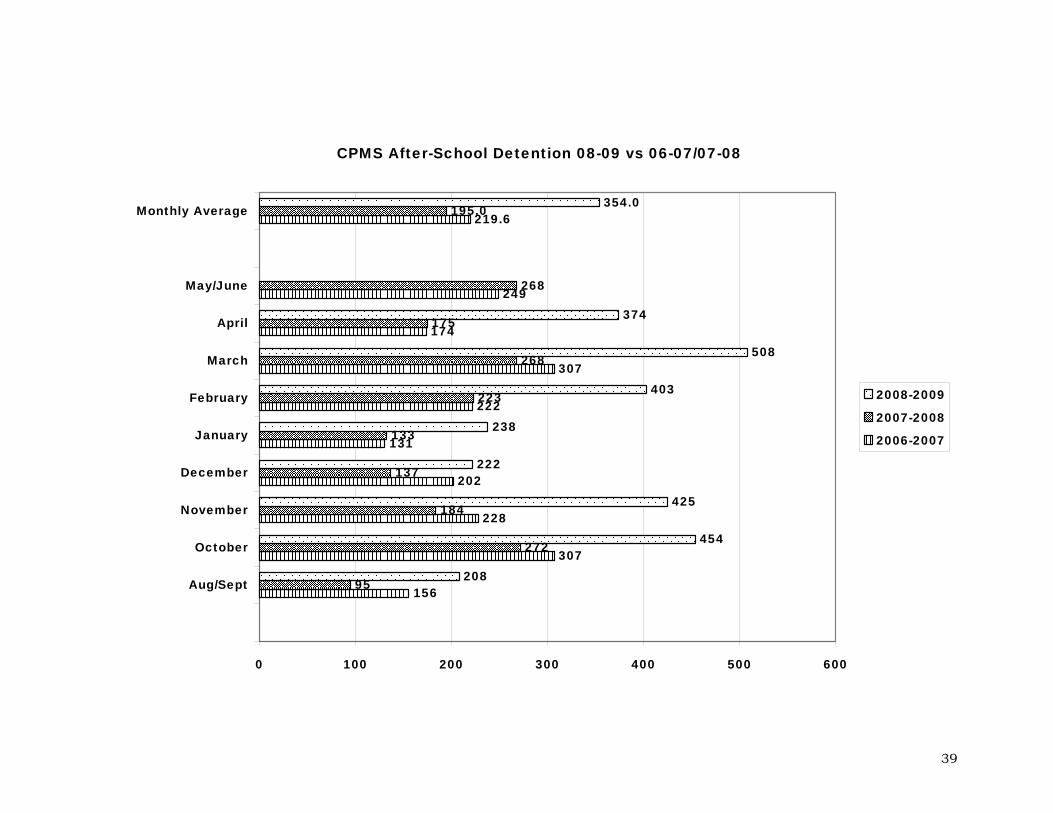
CPMS After-School Detention 08-09 vs 06-07/07-08
156
307
228
202
131
222
307
174
249
219.6
95
272
184
137
133
223
268
175
268
195.0
208
454
425
222
238
403
508
374
354.0
0 100 200 300 400 500 600
Aug/Sept
October
November
December
January
February
March
April
May/June
Monthly Average
2008-2009
2007-2008
2006-2007
39
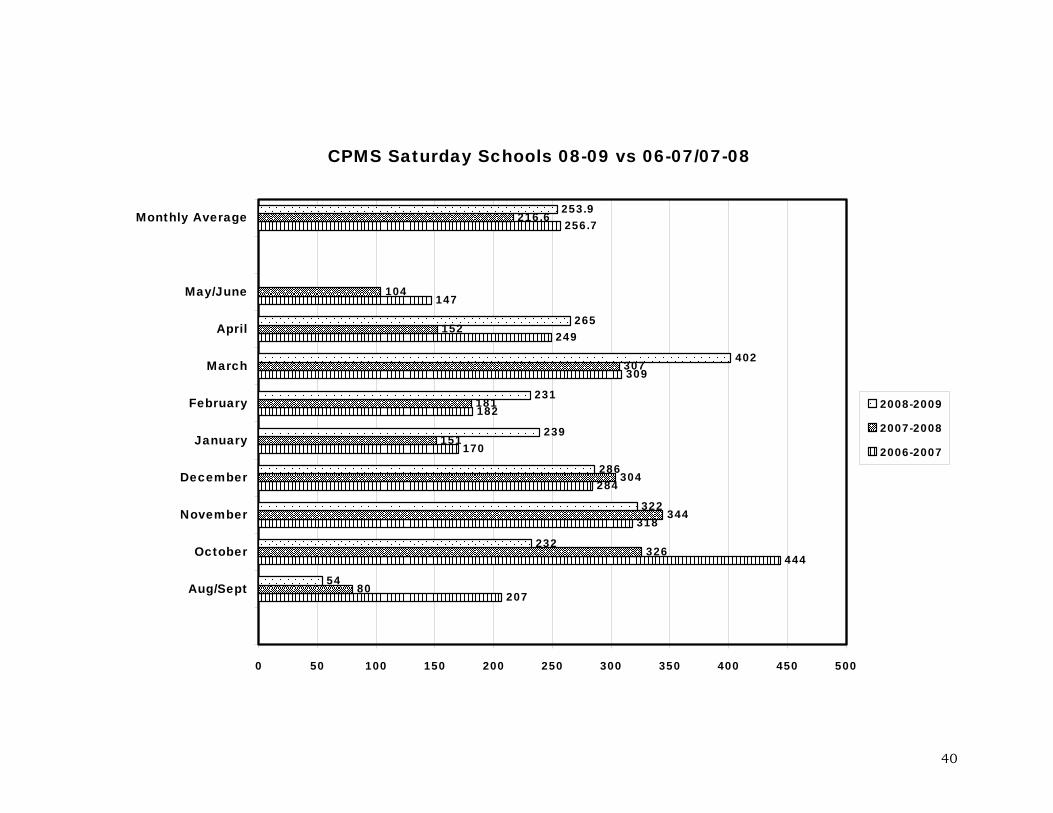
CPMS Saturday Schools 08-09 vs 06-07/07-08
207
444
318
284
170
182
309
249
147
256.7
80
326
344
304
151
181
307
152
104
216.6
54
232
322
286
239
231
402
265
253.9
0 50 100 150 200 250 300 350 400 450 500
Aug/Sept
October
November
December
January
February
March
April
May/June
Monthly Average
2008-2009
2007-2008
2006-2007
40

CPMS Out-of-School Suspensions 08-09 vs 06-07/07-08
43
52
78
87
76
76
120
60
154
82.9
28
29
77
87
79
62
155
109
248
97.1
25
49
44
49
38
79
146
67
62.1
0 50 100 150 200 250 300
Aug/Sept
October
November
December
January
February
March
April
May/June
Monthly Average
2008-2009
2007-2008
2006-2007
41
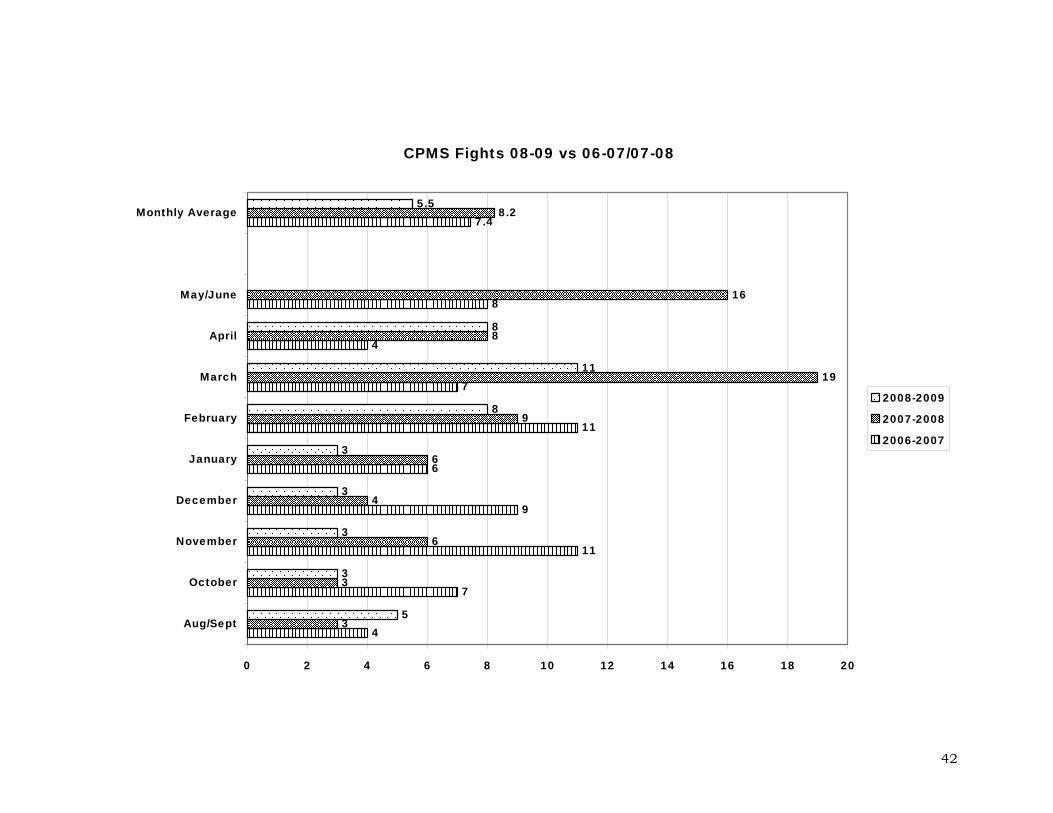
CPMS Fights 08-09 vs 06-07/07-08
4
7
11
9
6
11
7
4
8
7.4
3
3
6
4
6
9
19
8
16
8.2
5
3
3
3
3
8
11
8
5.5
0 2 4 6 8 10 12 14 16 18 20
Aug/Sept
October
November
December
January
February
March
April
May/June
Monthly Average
2008-2009
2007-2008
2006-2007
42

Summary of Discipline data
• Lunch, after school, and Saturday school detentions have all increased, we believe this is due to changes in the
handbook regarding consequences of certain discipline issues. • Though we have seen some increases, the number of out of school detentions has greatly decreased. • Truancy to detentions continues to be a major issue. To try to combat this problem we post lunch and after school
detention lists in hallways, make auto-generated reminder phone calls about after school detentions, and give written notice for Saturday school detentions every Friday.
• The number of fights has also decreased
43
Conclusions about Current Educational Programming
44
Curriculum and Instruction The ISTEP results show that Pierce’s educational program is effective. Performance on the ISTEP has been maintained despite an increase in enrollment of students with limited academic and language skills. Despite our challenges of size, ethnic diversity, and socioeconomic diversity, all subgroups are performing within close proximity to the state average with the Hispanic subgroup moving ahead of all groups in some areas of mathematics. The multiracial subgroup made improvements in closing the achievement gap when compared to Caucasian students. The achievement gap continues to be a challenge for our school; however, in some areas we are able to observe the gap beginning to close. At seventh grade the multi-racial subgroup surpassed all other groups in English/Language Arts and performed exceptionally well in mathematics. The Hispanic subgroup performed exceptionally well in English/Language Arts while African Americans made improvement. In mathematics, the Multi-racial and Hispanic subgroups performed well in mathematics. At eighth grade the Multi-racial subgroup performed well in English/Language Arts. All subgroups lagged far behind in mathematics at eighth grade. With the implementation of our Student Success Process, and with the increase in, and reorganization of supplemental instructional courses, we are able to target instruction and use best practices aimed toward subgroups that are achieving at a lower level. Examples of these interventions are Scholastic Read 180 which is now offered to students qualifying under Title I, Math Skills and Strategies (MSS) which has been expanded to address both seventh and eighth grade students, Writing Skills and Strategies (WSS) which is now offered to seventh grade students, Language Skills and Strategies, and the ISTEP workshop. Math teachers have and will continue to have meetings to determine the math curriculum for the 2009-2010 school year. Pierce believes that technology plays a significant role in closing the achievement gap; that is why all teachers are encouraged to integrate technology in their instruction. Many forms of technology are made available through our Audio/Visual or Information/Technology department.
45
Safe and Disciplined Learning Environment
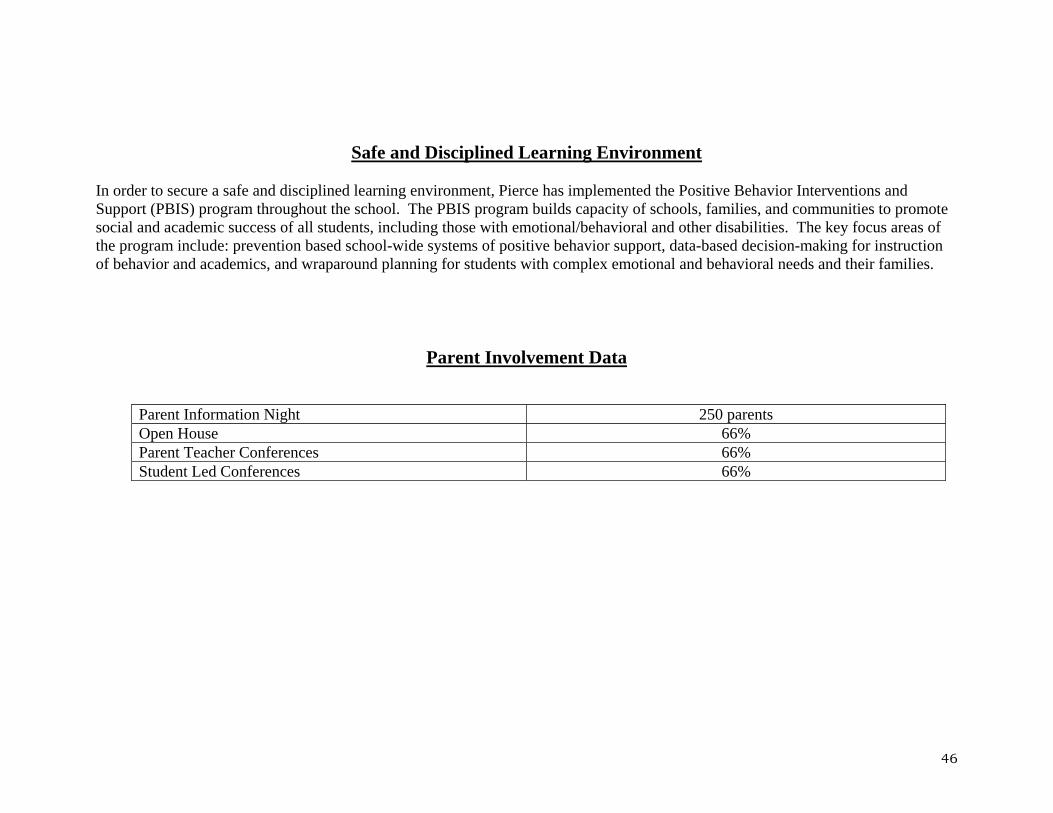
In order to secure a safe and disciplined learning environment, Pierce has implemented the Positive Behavior Interventions and Support (PBIS) program throughout the school. The PBIS program builds capacity of schools, families, and communities to promote social and academic success of all students, including those with emotional/behavioral and other disabilities. The key focus areas of the program include: prevention based school-wide systems of positive behavior support, data-based decision-making for instruction of behavior and academics, and wraparound planning for students with complex emotional and behavioral needs and their families.
Parent Involvement Data
Parent Information Night 250 parents Open House 66% Parent Teacher Conferences 66% Student Led Conferences 66%
46
School Climate Survey Results
47
Clifford Pierce Middle School 2009 Quality of Education
Parent Survey Results
Goal
The development of the parent survey was used to ascertain information of satisfaction as well as concern with the academic and social environment at Clifford Pierce Middle School. The results of this survey will be utilized to improve the areas of concern to parents, both academically and socially. These results are presented in Baldrige format.
Plan A survey was designed in 2003-2004 for the PL 221 report, which was reviewed by the Pierce CIC committee. The committee chose to continue with the survey but to modify questions deemed necessary. The survey was updated to reflect the current modifications and issues of concern.
48
Do
The survey was distributed to the parents/guardians with the Pierce newsletter on May 2, 2009. They were also able to access the survey via the Internet and paper/pencil copies.
Results of the surveys were totaled and calculated by the Safe Schools committee.
Study
The results of the survey will be presented and charted in graph format to the CIC and administration to address areas of concern. CIC will discuss and make suggestions/strategies to those deemed of concern by parents.
Act
The data will be presented to all faculty and central office staff for comment and/or addressing concerns.
49
50
Data Process
The Quality of Education Parent Survey was sent to all middle school parents/guardians via student report cards. Parents/guardians were also able to access the survey via the Internet and paper/pencil copies. Of approximately 1,200 students, an average of 84 parents completed some or all of the questions. 22 items were answered using a Likert scale (1-Strongly Agree; 2-Agree; 3-Disagee; 4-Strongly Disagree).
Participants of Survey
*75 Females *7 Males of whom (2 were no response):
• 29 were Caucasian • 43 were African-American • 1 were Hispanic • 4 were Multi-Racial • 0 were Asian • 1 were Native American or Alaskan Native • 6 gave no response

Clifford Pierce Middle School 2009 Annual Quality of Education Parent Survey
We appreciate your willingness to take a few minutes to complete this short survey. Your thoughtful responses to each of the items will help us to improve further the quality of education that is provided to our students and your children. Please return the completed survey to the school
Strongly Agree
Agree Disagree Strongly Disagre
1. I feel welcomed in my child’s school. 46% 46% 6% 1% 2. My child is safe at school. 27% 62% 6% 3% 3. The extra-curricular activities program meets
the social needs of my child. 24% 61% 11% 2%
4. The school meets the academic needs of my child.
26% 49% 19% 6%
5. The school expects quality work from my child. 30% 57% 8% 5% 6. The school succeeds in preparing my child for
the ISTEP+ test. 27% 43% 19% 2%
7. The school provides sufficient and appropriate communication regarding my child’s progress.
31% 33% 24% 11%
8. The school provides regular communication to me about school news, activities, and events.
25% 63% 13% 2%
9. School staff maintains consistent discipline, which is conducive to learning.
19% 56% 14% 8%
10. The school is succeeding in preparing my child for real life in regards to my child’s ability to use mathematics.
27% 52% 14% 6%
11. My child’s ability to write continues to improve. 26% 57% 13% 4% 12. My child’s ability to read continues to improve. 30% 61% 7% 2% 13. The school is succeeding in preparing my
child for real life in regards to my child’s ability to use scientific thinking.
24% 52% 21% 2%
14. The school is succeeding in furthering my child’s ability to use computers and technology.
31% 57% 10% 1%
15. The school is preparing my child to be successful in the future.
31% 48% 14% 5%
16. Physical facilities are clean and attractive. 30% 61% 4% 5%
51
52
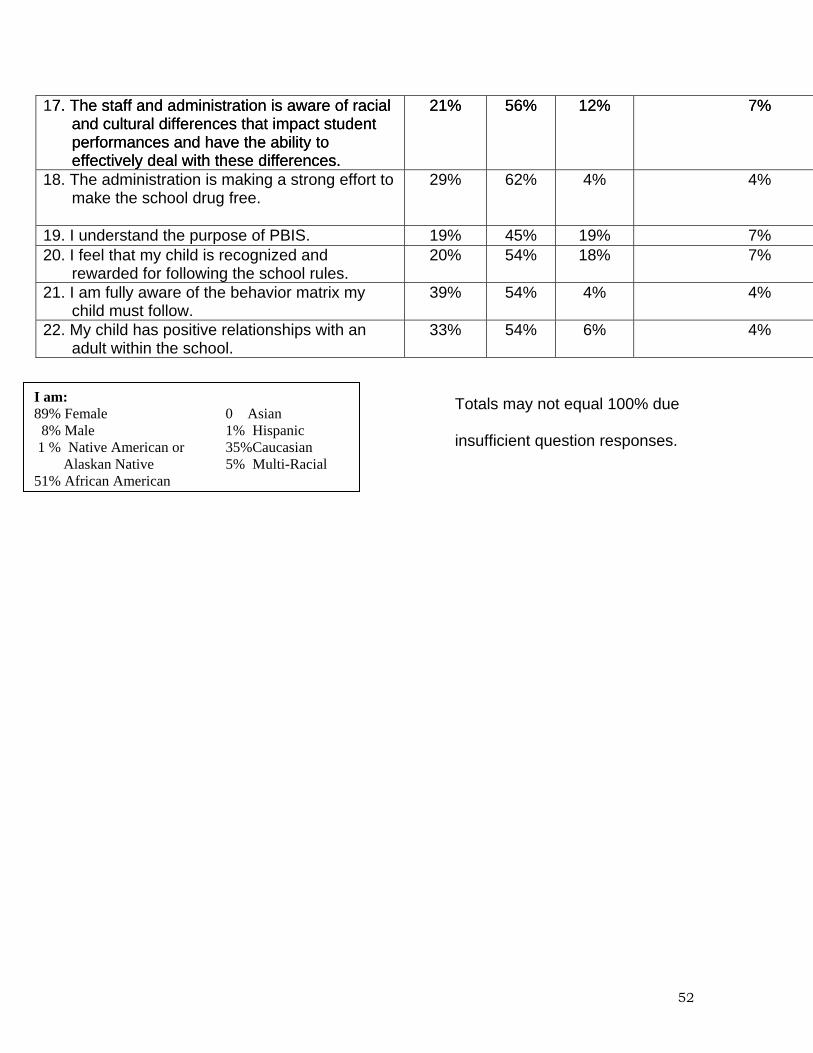
17. The staff and administration is aware of racial and cultural differences that impact student performances and have the ability to effectively deal with these differences.
7. The staff and administration is aware of racial and cultural differences that impact student performances and have the ability to effectively deal with these differences.
21% 56% 21% 56% 12% 12% 7% 7%
18. The administration is making a strong effort to make the school drug free.
29% 62% 4% 4%
19. I understand the purpose of PBIS. 19% 45% 19% 7% 20. I feel that my child is recognized and
rewarded for following the school rules. 20% 54% 18% 7%
21. I am fully aware of the behavior matrix my child must follow.
39% 54% 4% 4%
22. My child has positive relationships with an adult within the school.
33% 54% 6% 4%
Totals may not equal 100% due to insufficient question responses.
I am: 89% Female 0 Asian 8% Male 1% Hispanic 1 % Native American or 35%Caucasian Alaskan Native 5% Multi-Racial 51% African American

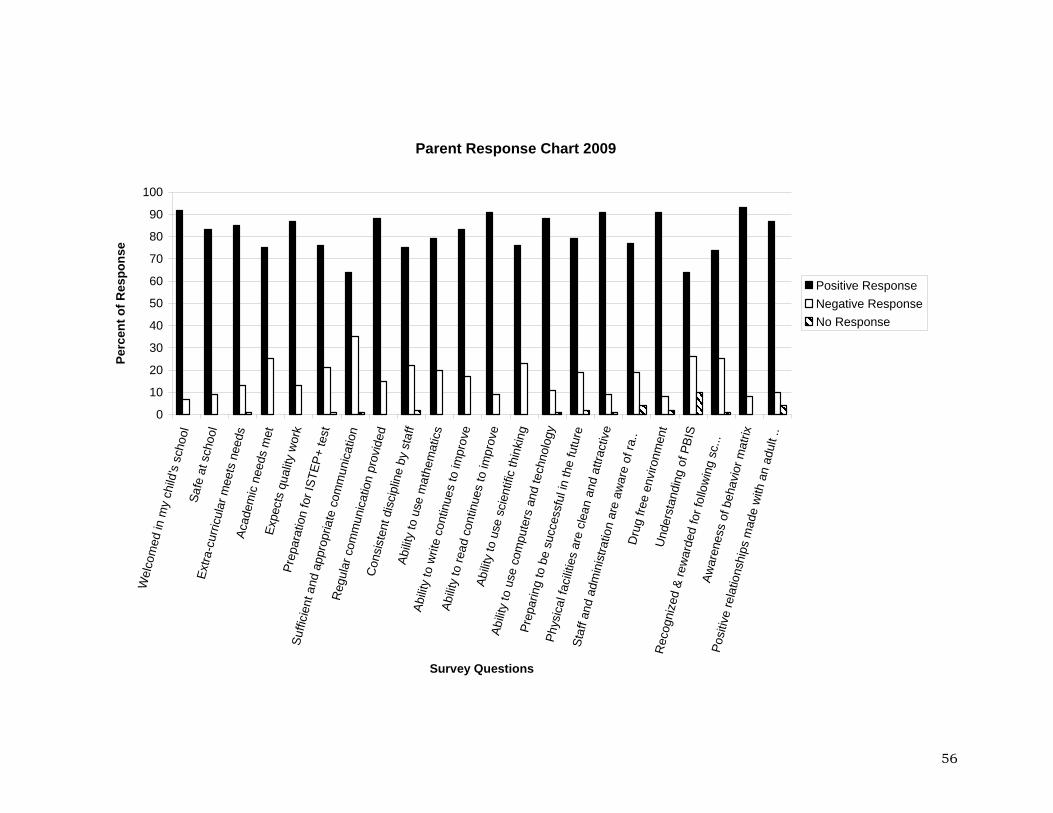
Data Results Welcomed in my child’s school – 92% positive response 39 strongly agree 39 agree 6 strongly/disagree Safe at school – 89% positive response 24 strongly agree 52 agree 8 strongly/disagree Extra-curricular meets needs – 85% positive response 20 strongly agree 51 agree 11 strongly/disagree Academic needs met – 75% positive response 22 strongly agree 41 agree 21 strongly/disagree Expects quality work – 87% positive response 25 strongly agree 48 agree 11 strongly/disagree
Preparation for ISTEP+ test – 76% positive response 24 strongly agree 41 agree 21 strongly/disagree Sufficient and appropriate communication – 64% positive response 26 strongly agree 28 agree 29 strongly/disagree Regular communication provided – 88% positive response 21 strongly agree 53 agree 10 strongly/disagree Consistent discipline by staff – 75% positive response 16 strongly agree 47 agree 19 strongly/disagree Ability to use mathematics – 79% positive response
53
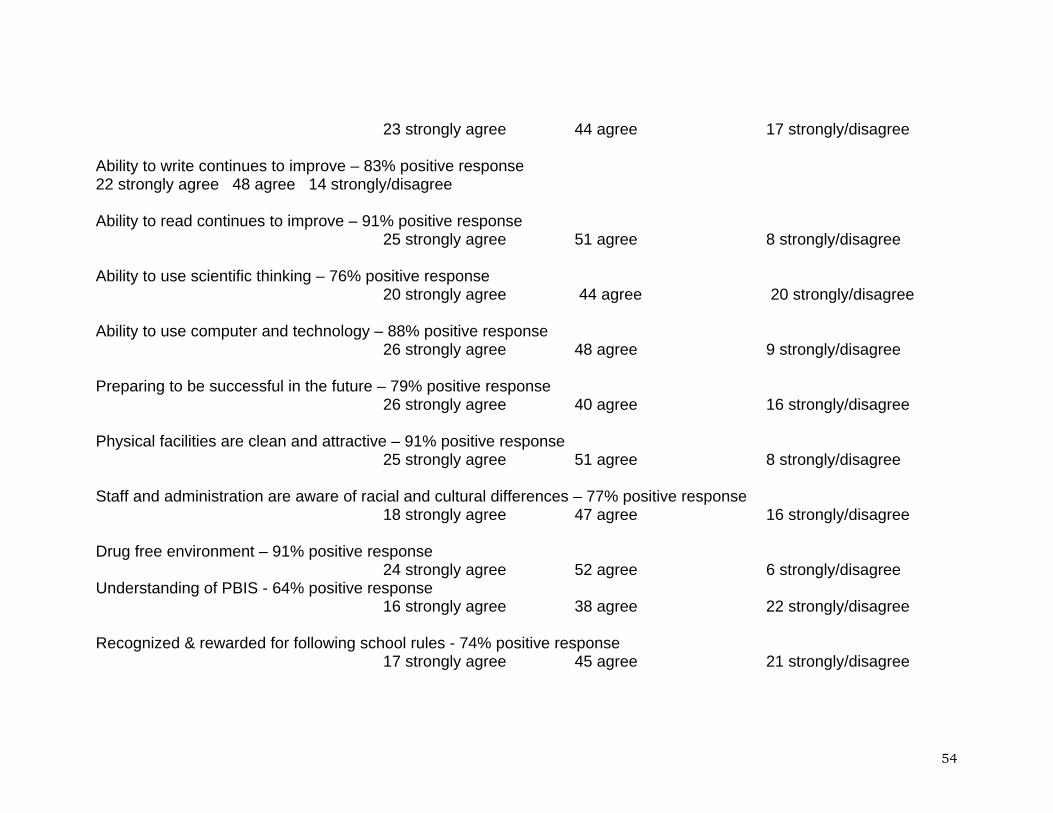
23 strongly agree 44 agree 17 strongly/disagree Ability to write continues to improve – 83% positive response 22 strongly agree 48 agree 14 strongly/disagree Ability to read continues to improve – 91% positive response 25 strongly agree 51 agree 8 strongly/disagree Ability to use scientific thinking – 76% positive response 20 strongly agree 44 agree 20 strongly/disagree Ability to use computer and technology – 88% positive response 26 strongly agree 48 agree 9 strongly/disagree Preparing to be successful in the future – 79% positive response 26 strongly agree 40 agree 16 strongly/disagree Physical facilities are clean and attractive – 91% positive response 25 strongly agree 51 agree 8 strongly/disagree Staff and administration are aware of racial and cultural differences – 77% positive response 18 strongly agree 47 agree 16 strongly/disagree Drug free environment – 91% positive response 24 strongly agree 52 agree 6 strongly/disagree Understanding of PBIS - 64% positive response 16 strongly agree 38 agree 22 strongly/disagree Recognized & rewarded for following school rules - 74% positive response 17 strongly agree 45 agree 21 strongly/disagree
54
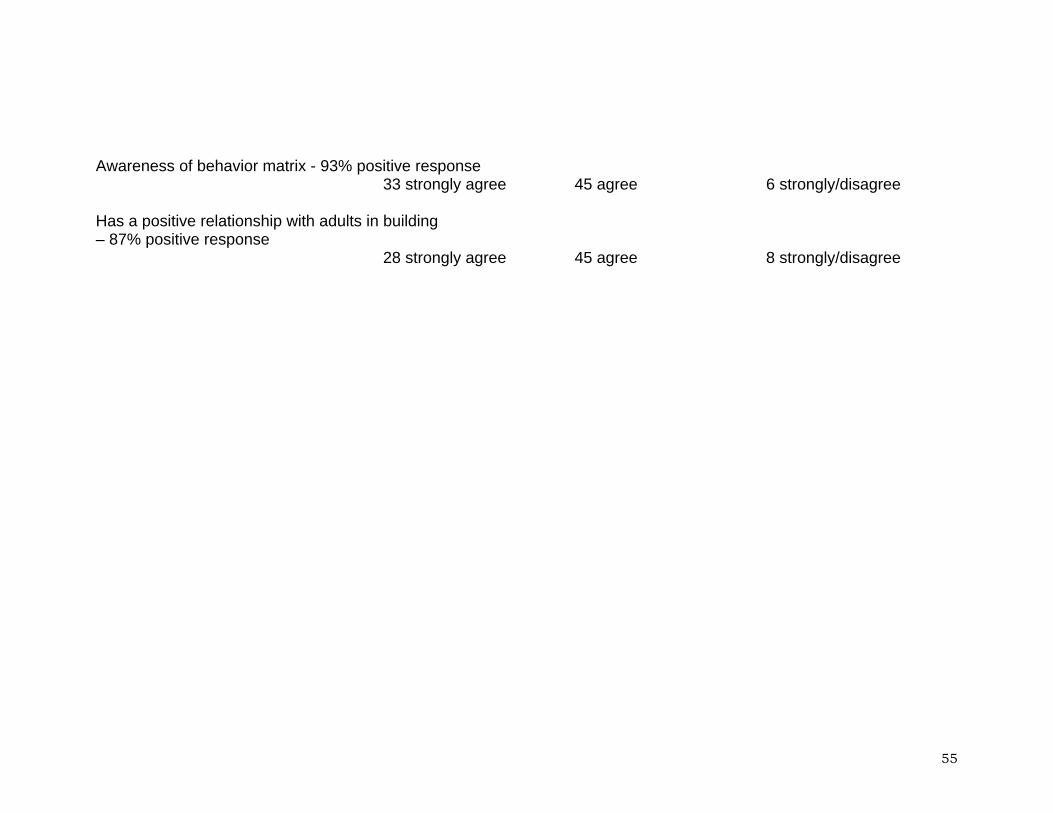
Awareness of behavior matrix - 93% positive response 33 strongly agree 45 agree 6 strongly/disagree Has a positive relationship with adults in building – 87% positive response 28 strongly agree 45 agree 8 strongly/disagree
55
Parent Response Chart 2009
0
10
20
30
40
50
60
70
80
90
100
Wel
com
ed in
my
child
's sc
hool
Safe
at s
choo
lEx
tra-c
urric
ular
mee
ts n
eeds
Acad
emic
nee
ds m
etEx
pect
s qu
ality
wor
kPr
epar
atio
n fo
r IST
EP+
test
Suffi
cien
t and
app
ropr
iate
com
mun
icat
ion
Reg
ular
com
mun
icat
ion
prov
ided
Con
sist
ent d
isci
plin
e by
sta
ffAb
ility
to u
se m
athe
mat
ics
Abilit
y to
writ
e co
ntin
ues
to im
prov
eAb
ility
to re
ad c
ontin
ues
to im
prov
eAb
ility
to u
se s
cien
tific
thin
king
Abilit
y to
use
com
pute
rs a
nd te
chno
logy
Prep
arin
g to
be
succ
essf
ul in
the
futu
re
Phys
ical
faci
litie
s ar
e cl
ean
and
attra
ctiv
e
Staf
f and
adm
inis
tratio
n ar
e aw
are
of ra
..D
rug
free
envi
ronm
ent
Und
erst
andi
ng o
f PBI
S
Rec
ogni
zed
& re
war
ded
for f
ollo
win
g sc
...Aw
aren
ess
of b
ehav
ior m
atrix
Posi
tive
rela
tions
hips
mad
e w
ith a
n ad
ult .
.
Survey Questions
Perc
ent o
f Res
pons
e
Positive ResponseNegative ResponseNo Response
56
Comments from Parents
After evaluating the 2008-2009 Quality of Education Parent Survey, we have analyzed that some parents feel that teachers should communicate more effectively and often with the parents. Some parents also feel that classroom disruption is adversely affecting the academic performance of the children.
Clifford Pierce Middle School 2009 Quality of Education
Staff Survey Results
Goal
The development of the staff survey was used to ascertain information of satisfaction as well as concern with the academic and social environment at Clifford Pierce Middle School. The results of this survey will be utilized to improve the areas of concern to staff, both academically and socially.
These results are presented in Baldrige format.
Plan
A survey was designed in 2003-2004 for the PL 221 report, which was reviewed by the Pierce CIC committee. The committee chose to continue with the survey but to modify questions deemed necessary. The survey was updated to reflect the current modifications and issues of concern.
58

Do
The survey was administered to the staff via the Internet. The survey was taken between May 11 – May 15, 2009. Results of the surveys were totaled and calculated by the Safe Schools committee.
Study
The results of the survey will be presented and charted in graph format to the CIC and administration to address areas of concern. CIC will discuss and make suggestions/strategies to those deemed of concern by the staff.
Act
The data will be presented to all faculty and central office staff for comment and/or addressing concerns.
Data Process
The Quality of Education Staff Survey was sent to all Clifford Pierce Middle School staff via the Internet. Of approximately 125 staff members, 55 completed some or all of the questions. 32 items were answered using a Likert scale (1-Strongly Agree; 2-Agree; 3-Disagee; 4-Strongly Disagree).
59

60
Participants of Survey
*37 Females *15 Males (3 gave no response) of whom:
• 40 were Caucasian • 8 were African-American • 0 were Hispanic • 3 were Multi-Racial • 0 were Asian • 0 were Native American or Alaskan Native • 4 gave no response
Grade level taught: 7th Grade – 22 8th Grade – 13 Both - 13
*7 gave no response Years teaching at CPMS:
1-3 yrs. – 24 4 yrs. or more – 26 *5 gave no response
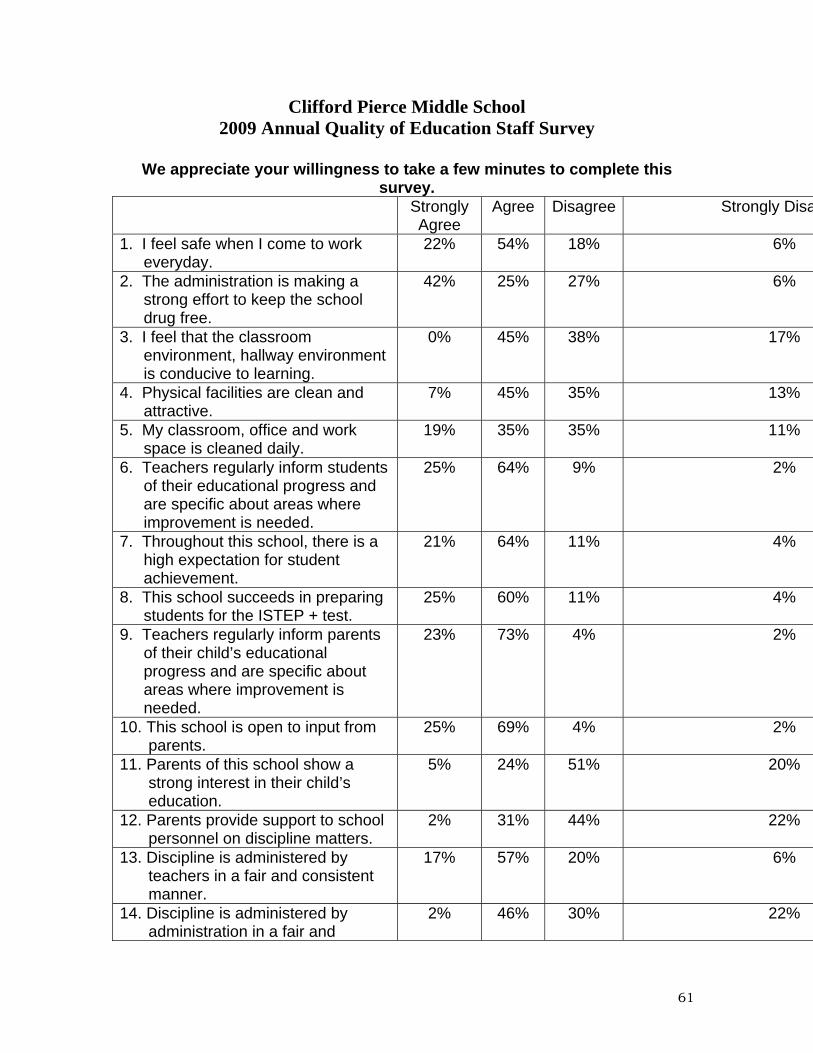
Clifford Pierce Middle School 2009 Annual Quality of Education Staff Survey
We appreciate your willingness to take a few minutes to complete this
survey. Strongly Agree
Agree Disagree Strongly Disa
1. I feel safe when I come to work everyday.
22% 54% 18% 6%
2. The administration is making a strong effort to keep the school drug free.
42% 25% 27% 6%
3. I feel that the classroom environment, hallway environment is conducive to learning.
0% 45% 38% 17%
4. Physical facilities are clean and attractive.
7% 45% 35% 13%
5. My classroom, office and work space is cleaned daily.
19% 35% 35% 11%
6. Teachers regularly inform students of their educational progress and are specific about areas where improvement is needed.
25% 64% 9% 2%
7. Throughout this school, there is a high expectation for student achievement.
21% 64% 11% 4%
8. This school succeeds in preparing students for the ISTEP + test.
25% 60% 11% 4%
9. Teachers regularly inform parents of their child’s educational progress and are specific about areas where improvement is needed.
23% 73% 4% 2%
10. This school is open to input from parents.
25% 69% 4% 2%
11. Parents of this school show a strong interest in their child’s education.
5% 24% 51% 20%
12. Parents provide support to school personnel on discipline matters.
2% 31% 44% 22%
13. Discipline is administered by teachers in a fair and consistent manner.
17% 57% 20% 6%
14. Discipline is administered by administration in a fair and
2% 46% 30% 22%
61
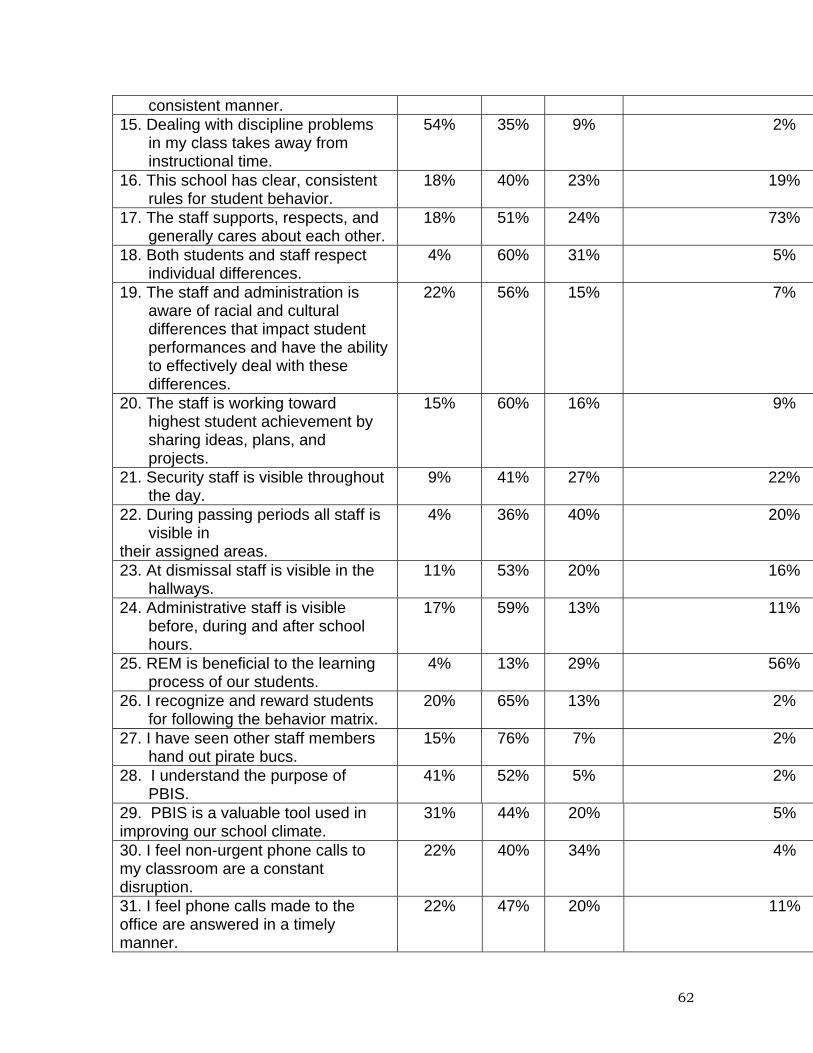
consistent manner. 15. Dealing with discipline problems
in my class takes away from instructional time.
54% 35% 9% 2%
16. This school has clear, consistent rules for student behavior.
18% 40% 23% 19%
17. The staff supports, respects, and generally cares about each other.
18% 51% 24% 73%
18. Both students and staff respect individual differences.
4% 60% 31% 5%
19. The staff and administration is aware of racial and cultural differences that impact student performances and have the ability to effectively deal with these differences.
22% 56% 15% 7%
20. The staff is working toward highest student achievement by sharing ideas, plans, and projects.
15% 60% 16% 9%
21. Security staff is visible throughout the day.
9% 41% 27% 22%
22. During passing periods all staff is visible in
4% 36% 40% 20%
their assigned areas. 23. At dismissal staff is visible in the
hallways. 11% 53% 20% 16%
24. Administrative staff is visible before, during and after school hours.
17% 59% 13% 11%
25. REM is beneficial to the learning process of our students.
4% 13% 29% 56%
26. I recognize and reward students for following the behavior matrix.
20% 65% 13% 2%
27. I have seen other staff members hand out pirate bucs.
15% 76% 7% 2%
28. I understand the purpose of PBIS.
41% 52% 5% 2%
29. PBIS is a valuable tool used in improving our school climate.
31% 44% 20% 5%
30. I feel non-urgent phone calls to my classroom are a constant disruption.
22% 40% 34% 4%
31. I feel phone calls made to the office are answered in a timely manner.
22% 47% 20% 11%
62

63
32. I build positive relationships with students on a daily basis.
40% 54% 4% 2%
Totals may not equal 100% due to insufficient question responses. For each item, please check the description that applies to you. Demographic data, which is used for summary analysis, will not be reported if individuals can be identified.
I am: 85% classroom teacher 9% instructional support staff (para’s, tech aides, PEP aides) 6% certificated staff (other than classroom teacher) I am: 71% female 29% male 16% African American 6% Multi-Racial 0% Asian 0% Native American or 78% Caucasian Alaskan Native 0% Latino/Hispanic Items for Classroom Teachers Only
I teach: I have been teaching at Pierce: 46% 7th Grade 48% 1-3 years 27% 8th Grade 52% 4 years or more 27% Both (7
th & 8th Grade)

Data Results
I feel safe at work – 76% positive response 12 strongly agree 29 agree 13 strongly/disagree Drug free school – 47% positive response 23 strongly agree 14 agree 18 strongly/disagree Classroom and halls conducive to learning – 45% positive response 0 strongly agree 24 agree 29 strongly/disagree Physical facilities are clean and attractive – 52% positive response 4 strongly agree 25 agree 26 strongly/disagree Classroom, office, work space cleaned daily – 54% positive response 10 strongly agree 19 agree 25 strongly/disagree Teachers inform students of progress – 89% positive response 14 strongly agree 35 agree 6 strongly/disagree High expectation for student achievement – 85% positive response 11 strongly agree 34 agree 8 strongly/disagree Preparation for ISTEP+ – 85% positive response 14 strongly agree 33 agree 8 strongly/disagree Inform parents of student progress – 96% positive response 12 strongly agree 40 agree 3 strongly/disagree

School is open to input from parents – 94% positive response 14 strongly agree 38 agree 3 strongly/disagree Parents show interest in child’s education – 29% positive response 3 strongly agree 13 agree 39 strongly/disagree Parents support discipline matters – 33% positive response 1 strongly agree 17 agree 36 strongly/disagree Teacher discipline is fair and consistent – 74% positive response 9 strongly agree 31 agree 14 strongly/disagree Administration discipline is fair and consistent – 48 % positive response 1 strongly agree 25 agree 28 strongly/disagree Discipline interferes with instruction – 89% positive response 29 strongly agree 19 agree 6 strongly/disagree Rules are clear and consistent – 58% positive response 10 strongly agree 21 agree 22 strongly/disagree The staff supports and respects each other – 69% positive response 10 strongly agree 28 agree 17 strongly/disagree Students and staff respect individual differences
65
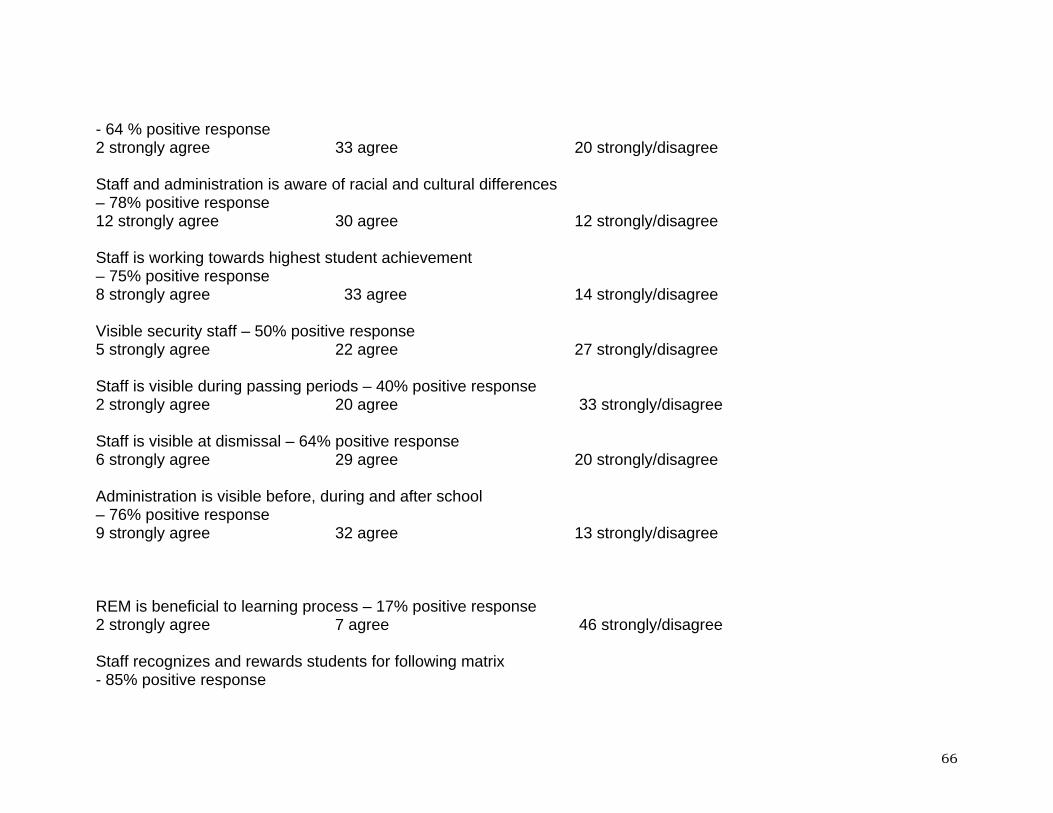
- 64 % positive response 2 strongly agree 33 agree 20 strongly/disagree Staff and administration is aware of racial and cultural differences – 78% positive response 12 strongly agree 30 agree 12 strongly/disagree Staff is working towards highest student achievement – 75% positive response 8 strongly agree 33 agree 14 strongly/disagree Visible security staff – 50% positive response 5 strongly agree 22 agree 27 strongly/disagree Staff is visible during passing periods – 40% positive response 2 strongly agree 20 agree 33 strongly/disagree Staff is visible at dismissal – 64% positive response 6 strongly agree 29 agree 20 strongly/disagree Administration is visible before, during and after school – 76% positive response 9 strongly agree 32 agree 13 strongly/disagree REM is beneficial to learning process – 17% positive response 2 strongly agree 7 agree 46 strongly/disagree Staff recognizes and rewards students for following matrix - 85% positive response
66

11 strongly agree 36 agree 8 strongly/disagree I have seen other staff members hand out pirate bucs -91% positive response 8 strongly agree 42 agree 5 strongly/disagree I understand the purpose of PBIS -93% positive response 22 strongly agree 28 agree 4 strongly/disagree PBIS is valuable in improving climate -75% positive response 17 strongly agree 24 agree 14 strongly/disagree Non-urgent phone calls are constant disruption -62% positive response 12 strongly agree 22 agree 21 strongly/disagree Calls made to office are answered in a timely manner – 69% positive response 12 strongly agree 26 agree 17 strongly/disagree I build positive relationships with students – 94% positive response 22 strongly agree 30 agree 3 strongly/disagree
67

Clifford Pierce Middle School
2009 Quality of Education Student Survey Results
Goal
The development of the student survey was used to ascertain information of satisfaction as well as concern with the academic and social environment at Clifford Pierce Middle School. The results of this survey will be utilized to improve the areas of concern to students, both academically and socially.
These results are presented in Baldrige format.
Plan
A survey was designed in 2003-2004 for the PL 221 report, which was reviewed by the Pierce CIC committee. The committee chose to continue with the survey but to modify questions deemed necessary. The survey was updated to reflect the current modifications and issues of concern.
Do
The survey was administered to the students via the Internet on May 15, 2009. Results of the surveys were totaled and calculated by the Safe Schools committee.
68
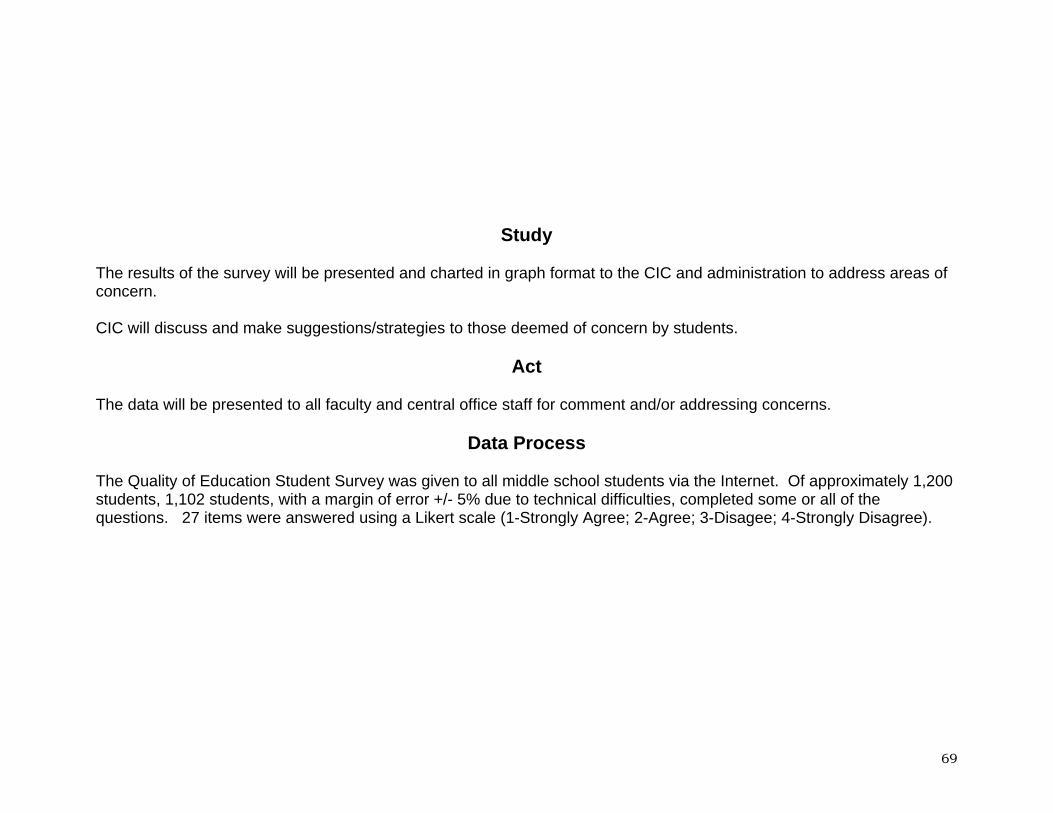
Study
The results of the survey will be presented and charted in graph format to the CIC and administration to address areas of concern. CIC will discuss and make suggestions/strategies to those deemed of concern by students.
Act
The data will be presented to all faculty and central office staff for comment and/or addressing concerns.
Data Process
The Quality of Education Student Survey was given to all middle school students via the Internet. Of approximately 1,200 students, 1,102 students, with a margin of error +/- 5% due to technical difficulties, completed some or all of the questions. 27 items were answered using a Likert scale (1-Strongly Agree; 2-Agree; 3-Disagee; 4-Strongly Disagree).
69

70
Participants of Survey
*510 7th Graders *561 8th Graders *543 Females *531 Males of whom:
• 193 were Caucasian • 561 were African-American • 114 were Hispanic • 173 were Multi-Racial • 19 were Asian • 16 were Native American or Alaskan Native
Clifford Pierce Middle School
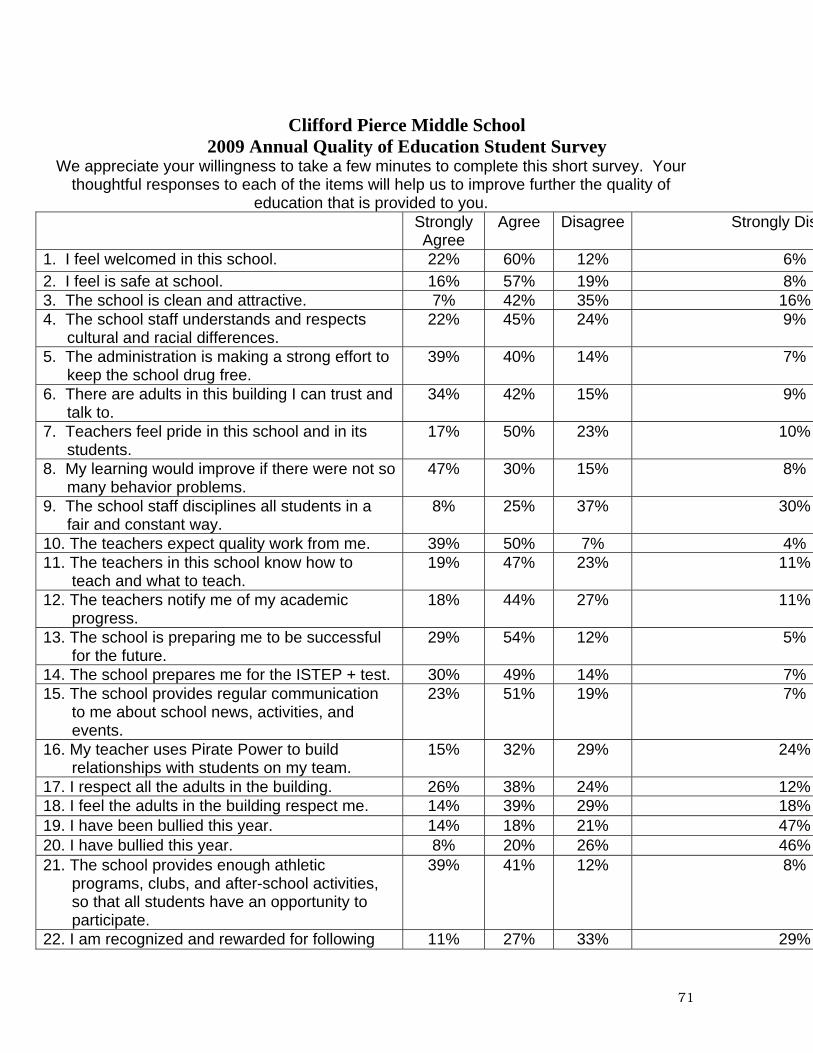
2009 Annual Quality of Education Student Survey We appreciate your willingness to take a few minutes to complete this short survey. Your
thoughtful responses to each of the items will help us to improve further the quality of education that is provided to you.
Strongly Agree
Agree Disagree Strongly Dis
1. I feel welcomed in this school. 22% 60% 12% 6%2. I feel is safe at school. 16% 57% 19% 8%3. The school is clean and attractive. 7% 42% 35% 16%4. The school staff understands and respects
cultural and racial differences. 22% 45% 24% 9%
5. The administration is making a strong effort to keep the school drug free.
39% 40% 14% 7%
6. There are adults in this building I can trust and talk to.
34% 42% 15% 9%
7. Teachers feel pride in this school and in its students.
17% 50% 23% 10%
8. My learning would improve if there were not so many behavior problems.
47% 30% 15% 8%
9. The school staff disciplines all students in a fair and constant way.
8% 25% 37% 30%
10. The teachers expect quality work from me. 39% 50% 7% 4%11. The teachers in this school know how to
teach and what to teach. 19% 47% 23% 11%
12. The teachers notify me of my academic progress.
18% 44% 27% 11%
13. The school is preparing me to be successful for the future.
29% 54% 12% 5%
14. The school prepares me for the ISTEP + test. 30% 49% 14% 7%15. The school provides regular communication
to me about school news, activities, and events.
23% 51% 19% 7%
16. My teacher uses Pirate Power to build relationships with students on my team.
15% 32% 29% 24%
17. I respect all the adults in the building. 26% 38% 24% 12%18. I feel the adults in the building respect me. 14% 39% 29% 18%19. I have been bullied this year. 14% 18% 21% 47%20. I have bullied this year. 8% 20% 26% 46%21. The school provides enough athletic
programs, clubs, and after-school activities, so that all students have an opportunity to participate.
39% 41% 12% 8%
22. I am recognized and rewarded for following 11% 27% 33% 29%
71

72
the rules. 23. I am recognized and rewarded for following
the behavior matrix. 3. I am recognized and rewarded for following
the behavior matrix. 11% 32% 11% 32% 33% 33% 24%24%
24. Pirate bucs have value to me. 18% 31% 21% 30%25. I try to earn Pirate bucs. 25% 32% 22% 21%26. The Pierce staff hands out Pirate bucs. 18% 41% 23% 18%27. I understand the purpose of PBIS. 29% 40% 17% 14%*Totals may not equal 100% due to insufficient question responses.
I am: 1% Native American or 11% Hispanic Alaskan Native 18% Caucasian 52% African American 16% Multi-Racial 2% Asian
I am: 51% Female 48% 749% Male 52% 8
th Grade th Grade
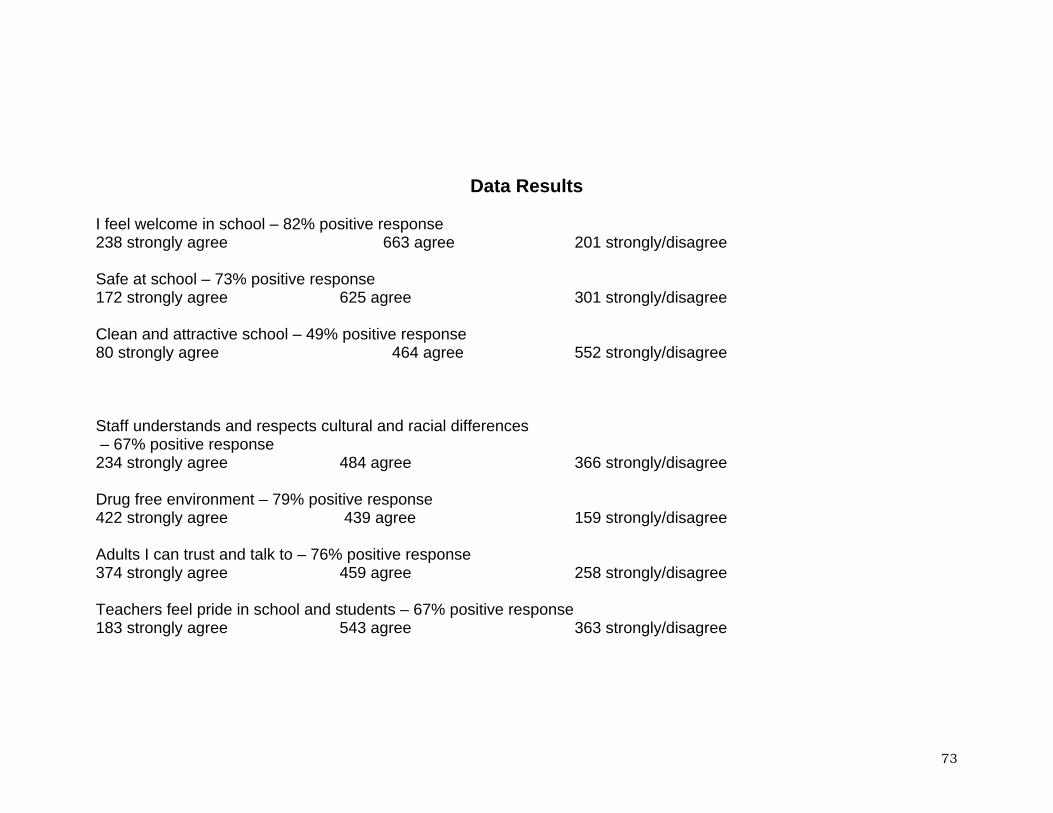
Data Results I feel welcome in school – 82% positive response 238 strongly agree 663 agree 201 strongly/disagree Safe at school – 73% positive response 172 strongly agree 625 agree 301 strongly/disagree Clean and attractive school – 49% positive response 80 strongly agree 464 agree 552 strongly/disagree Staff understands and respects cultural and racial differences – 67% positive response 234 strongly agree 484 agree 366 strongly/disagree Drug free environment – 79% positive response 422 strongly agree 439 agree 159 strongly/disagree Adults I can trust and talk to – 76% positive response 374 strongly agree 459 agree 258 strongly/disagree Teachers feel pride in school and students – 67% positive response 183 strongly agree 543 agree 363 strongly/disagree
73
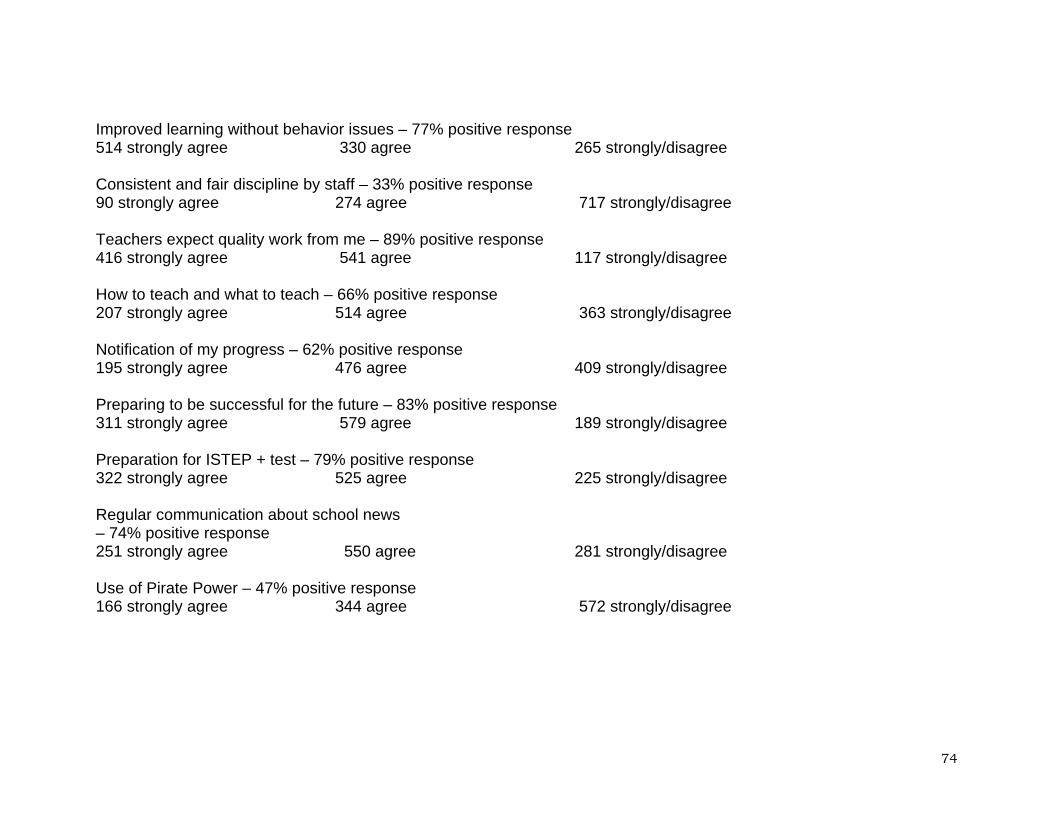
Improved learning without behavior issues – 77% positive response 514 strongly agree 330 agree 265 strongly/disagree Consistent and fair discipline by staff – 33% positive response 90 strongly agree 274 agree 717 strongly/disagree Teachers expect quality work from me – 89% positive response 416 strongly agree 541 agree 117 strongly/disagree How to teach and what to teach – 66% positive response 207 strongly agree 514 agree 363 strongly/disagree Notification of my progress – 62% positive response 195 strongly agree 476 agree 409 strongly/disagree Preparing to be successful for the future – 83% positive response 311 strongly agree 579 agree 189 strongly/disagree Preparation for ISTEP + test – 79% positive response 322 strongly agree 525 agree 225 strongly/disagree Regular communication about school news – 74% positive response 251 strongly agree 550 agree 281 strongly/disagree Use of Pirate Power – 47% positive response 166 strongly agree 344 agree 572 strongly/disagree
74
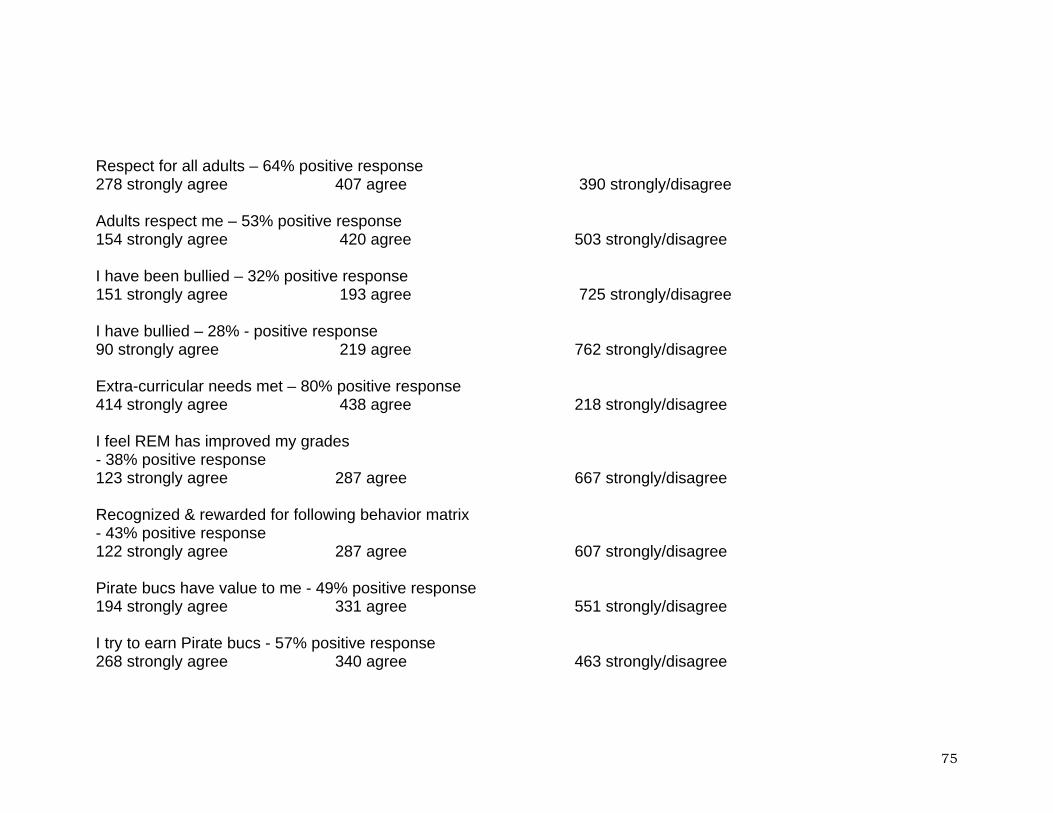
Respect for all adults – 64% positive response 278 strongly agree 407 agree 390 strongly/disagree Adults respect me – 53% positive response 154 strongly agree 420 agree 503 strongly/disagree I have been bullied – 32% positive response 151 strongly agree 193 agree 725 strongly/disagree I have bullied – 28% - positive response 90 strongly agree 219 agree 762 strongly/disagree Extra-curricular needs met – 80% positive response 414 strongly agree 438 agree 218 strongly/disagree I feel REM has improved my grades - 38% positive response 123 strongly agree 287 agree 667 strongly/disagree Recognized & rewarded for following behavior matrix - 43% positive response 122 strongly agree 287 agree 607 strongly/disagree Pirate bucs have value to me - 49% positive response 194 strongly agree 331 agree 551 strongly/disagree I try to earn Pirate bucs - 57% positive response 268 strongly agree 340 agree 463 strongly/disagree
75
Pierce staff hands out Pirate bucs - 59% positive response 193 strongly agree 443 agree 434 strongly/disagree I understand the purpose of PBIS - 69% positive response 312 strongly agree 435 agree 329 strongly/disagree
76

Student Response Chart 2009
0
10
20
30
40
50
60
70
80
90
100
Welcom
e in s
choo
l
Safe at
scho
ol
Clean a
nd at
tracti
ve sc
hool
Staff re
spec
ts cu
ltural
and r
acial
diffe
rence
s
Drug fre
e env
ironm
ent
Adults
I can
trust
and t
alk to
Teach
ers fe
el pri
de in
scho
ol an
d stud
ents
Impro
ved l
earni
ng w
ithou
t beh
avior
issu
es
Consis
tent a
nd fa
ir disc
ipline
by st
aff
Teach
ers ex
pect
quali
ty work
from m
e
How to
teac
h and
wha
t to te
ach
Notific
ation
of m
y prog
ress
Prepari
ng to
be su
cces
sful fo
r the f
uture
Prepara
tion f
or IS
TEP+ test
Regula
r com
munica
tion a
bout
scho
ol ne
ws
Use of
Pirate
Power
Respe
ct for
all a
dults
Adults
resp
ect m
e
I hav
e bee
n bull
ied
I hav
e bull
ied
Extra-c
urricu
lar ne
eds m
et
REM has i
mprove
d my g
rades
Recog
nized
& reward
ed fo
r follo
wing be
havio
r matr
ix
Pirate
bucs
have
value
to m
e
I try t
o earn
Pirate
bucs
The P
ierce
staff
hand
s out
Pirate
bucs
I und
erstan
d the
purpo
se of
PBIS
Survey Questions
Perc
ent o
f Res
pons
e
Positive ResponseNegative Response
77

78
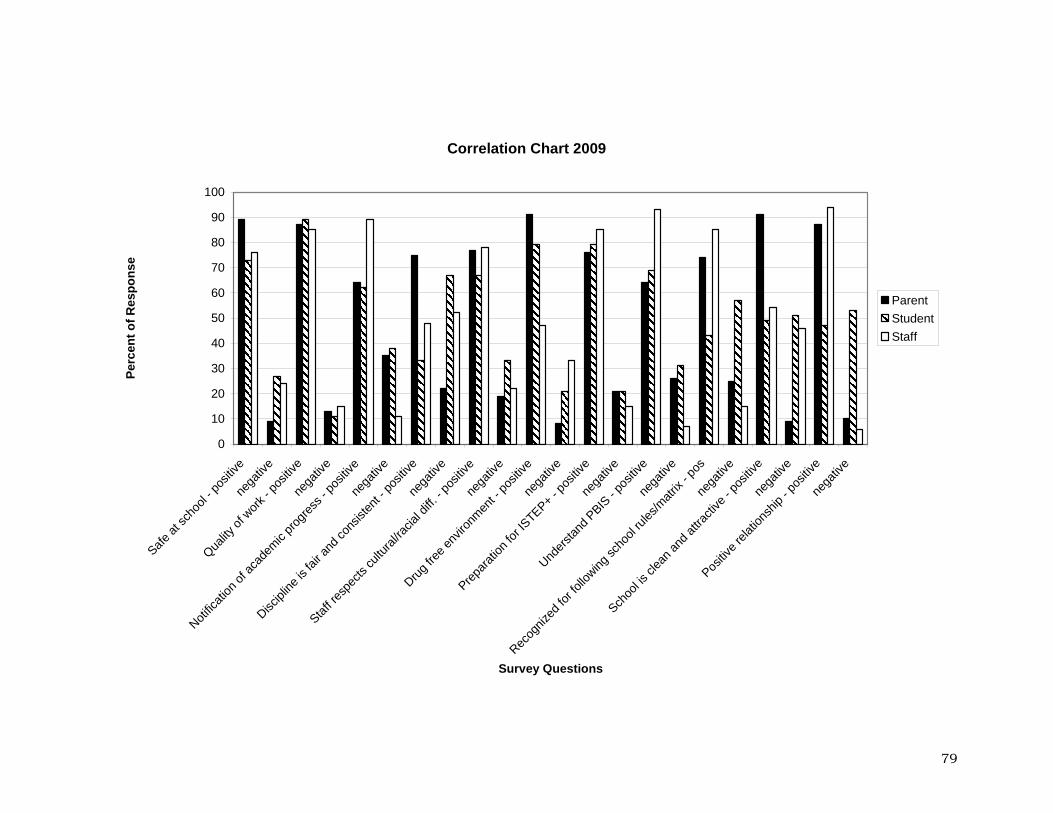
Correlation Chart 2009
0
10
20
30
40
50
60
70
80
90
100
Safe at
scho
ol - p
ositiv
ene
gativ
e
Quality
of w
ork - p
ositiv
ene
gativ
e
Notific
ation
of ac
adem
ic pro
gress
- pos
itive
nega
tive
Discipl
ine is
fair a
nd co
nsist
ent -
posit
ivene
gativ
e
Staff re
spec
ts cu
ltural
/racia
l diff.
- pos
itive
nega
tive
Drug fre
e env
ironm
ent -
posit
ivene
gativ
e
Prepara
tion f
or IS
TEP+ - po
sitive
nega
tive
Unders
tand P
BIS - p
ositiv
ene
gativ
e
Recog
nized
for fo
llowing
scho
ol rul
es/m
atrix
- pos
nega
tive
Schoo
l is cl
ean a
nd at
tracti
ve - p
ositiv
ene
gativ
e
Positiv
e rela
tions
hip - p
ositiv
ene
gativ
e
Survey Questions
Perc
ent o
f Res
pons
e
ParentStudentStaff
79
Student Achievement Objectives/Goals
80
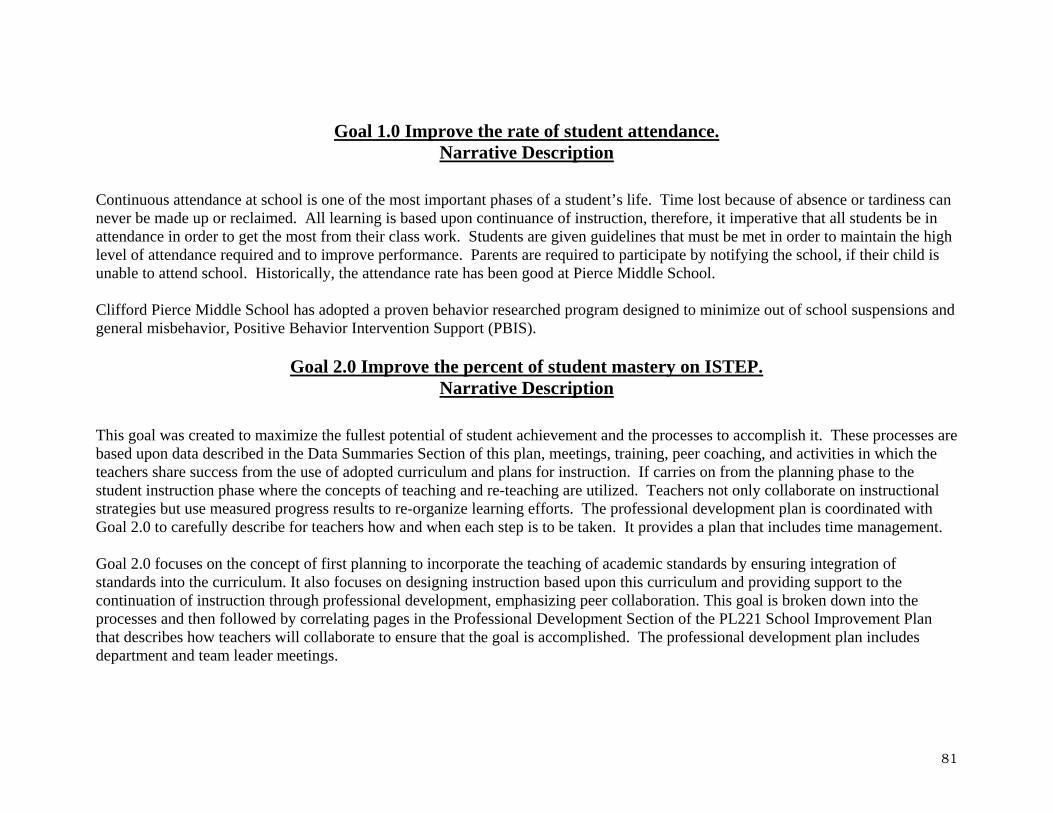
Goal 1.0 Improve the rate of student attendance. Narrative Description
Continuous attendance at school is one of the most important phases of a student’s life. Time lost because of absence or tardiness can never be made up or reclaimed. All learning is based upon continuance of instruction, therefore, it imperative that all students be in attendance in order to get the most from their class work. Students are given guidelines that must be met in order to maintain the high level of attendance required and to improve performance. Parents are required to participate by notifying the school, if their child is unable to attend school. Historically, the attendance rate has been good at Pierce Middle School. Clifford Pierce Middle School has adopted a proven behavior researched program designed to minimize out of school suspensions and general misbehavior, Positive Behavior Intervention Support (PBIS).
Goal 2.0 Improve the percent of student mastery on ISTEP. Narrative Description
This goal was created to maximize the fullest potential of student achievement and the processes to accomplish it. These processes are based upon data described in the Data Summaries Section of this plan, meetings, training, peer coaching, and activities in which the teachers share success from the use of adopted curriculum and plans for instruction. If carries on from the planning phase to the student instruction phase where the concepts of teaching and re-teaching are utilized. Teachers not only collaborate on instructional strategies but use measured progress results to re-organize learning efforts. The professional development plan is coordinated with Goal 2.0 to carefully describe for teachers how and when each step is to be taken. It provides a plan that includes time management. Goal 2.0 focuses on the concept of first planning to incorporate the teaching of academic standards by ensuring integration of standards into the curriculum. It also focuses on designing instruction based upon this curriculum and providing support to the continuation of instruction through professional development, emphasizing peer collaboration. This goal is broken down into the processes and then followed by correlating pages in the Professional Development Section of the PL221 School Improvement Plan that describes how teachers will collaborate to ensure that the goal is accomplished. The professional development plan includes department and team leader meetings.
81
Goal 3.0 Improve the overall school climate for staff, students, and parents.
Narrative Description
An analysis of data regarding student behaviors that create a school climate that meets our aim of having a respectful, responsible, and safe learning environment is included in the Data Summaries Section of the this plan. In addition to this data, staff and student surveys were completed to determine the status of climate issues in the building. The Pierce Continuous Improvement Council identified behaviors from this information that have been targeted based on this data and have created a plan that will provide a method by which the school can improve student behavior, and student/staff and parent satisfaction. Student and staff will work together to teach positive behaviors, but also reinforce their practice, celebrate their improvement and re-evaluate their progress. Goal 4.0 Increase parent and community involvement in the school and improve parent satisfaction with the
school. Narrative Description
Pierce Middle School has the expectation that while students are enrolled at Pierce Middle School, all parents will take an active role in the school. Pierce also believes that it should provide opportunities for meaningful involvement of community members. The Merrillville Community School Corporation has adopted a civility policy which encourages members of the learning community to always converse in a civil manner.
82
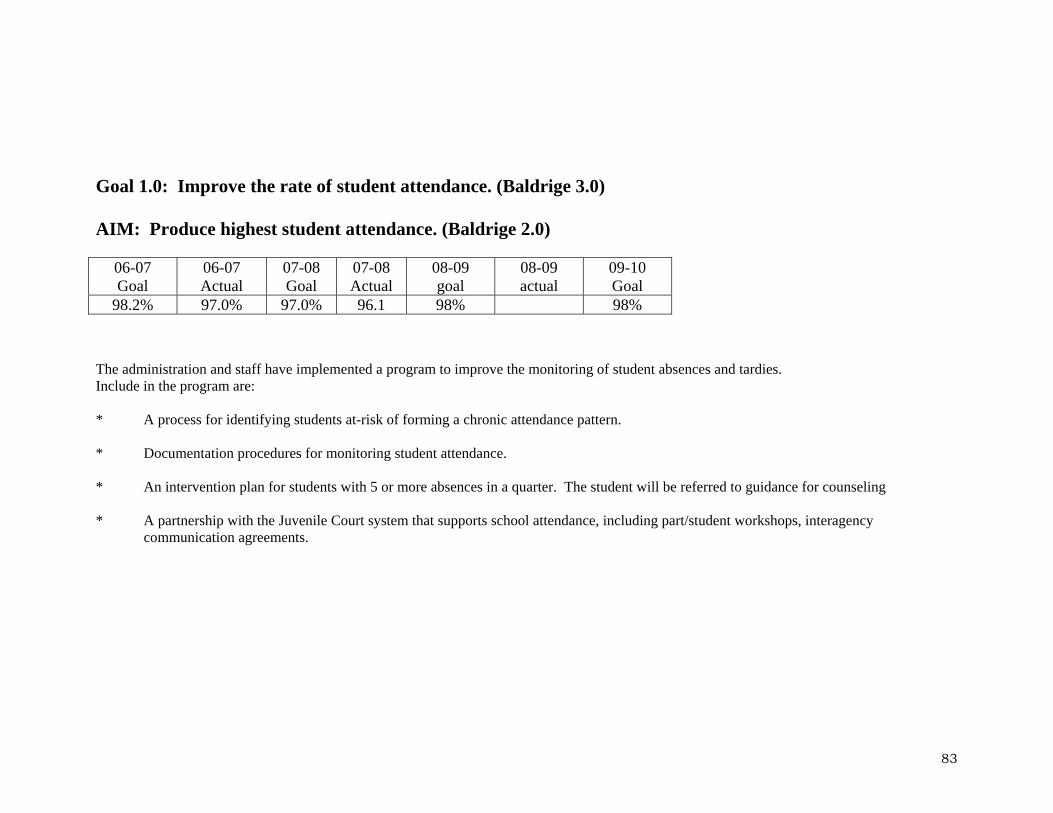
Goal 1.0: Improve the rate of student attendance. (Baldrige 3.0) AIM: Produce highest student attendance. (Baldrige 2.0)
06-07 06-07 Actual
07-08 07-08 08-09 08-09 09-10 Goal Goal Actual goal actual Goal
98.2% 97.0% 97.0% 96.1 98% 98%
The administration and staff have implemented a program to improve the monitoring of student absences and tardies. Include in the program are: * A process for identifying students at-risk of forming a chronic attendance pattern. * Documentation procedures for monitoring student attendance. * An intervention plan for students with 5 or more absences in a quarter. The student will be referred to guidance for counseling * A partnership with the Juvenile Court system that supports school attendance, including part/student workshops, interagency communication agreements.
83
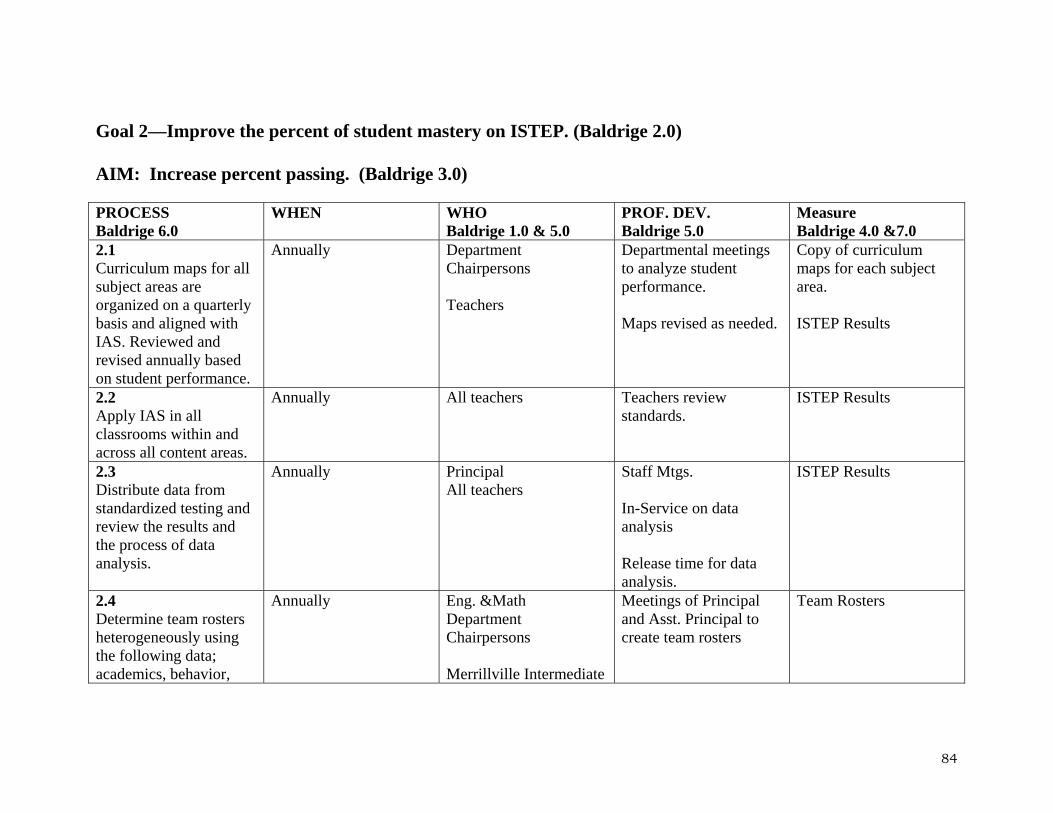
Goal 2—Improve the percent of student mastery on ISTEP. (Baldrige 2.0) AIM: Increase percent passing. (Baldrige 3.0) PROCESS WHEN WHO PROF. DEV. Measure Baldrige 6.0 Baldrige 1.0 & 5.0 Baldrige 5.0 Baldrige 4.0 &7.0 2.1 Annually Department
Chairpersons Departmental meetings to analyze student performance.
Copy of curriculum maps for each subject area.
Curriculum maps for all subject areas are organized on a quarterly basis and aligned with IAS. Reviewed and revised annually based on student performance.
Teachers
Maps revised as needed. ISTEP Results
2.2 Annually All teachers Teachers review standards.
ISTEP Results Apply IAS in all classrooms within and across all content areas.
2.3 Annually Principal Staff Mtgs. ISTEP Results Distribute data from standardized testing and review the results and the process of data analysis.
All teachers In-Service on data
analysis Release time for data analysis.
2.4 Annually Eng. &Math Meetings of Principal and Asst. Principal to create team rosters
Team Rosters Determine team rosters heterogeneously using the following data; academics, behavior,
Department Chairpersons Merrillville Intermediate
84
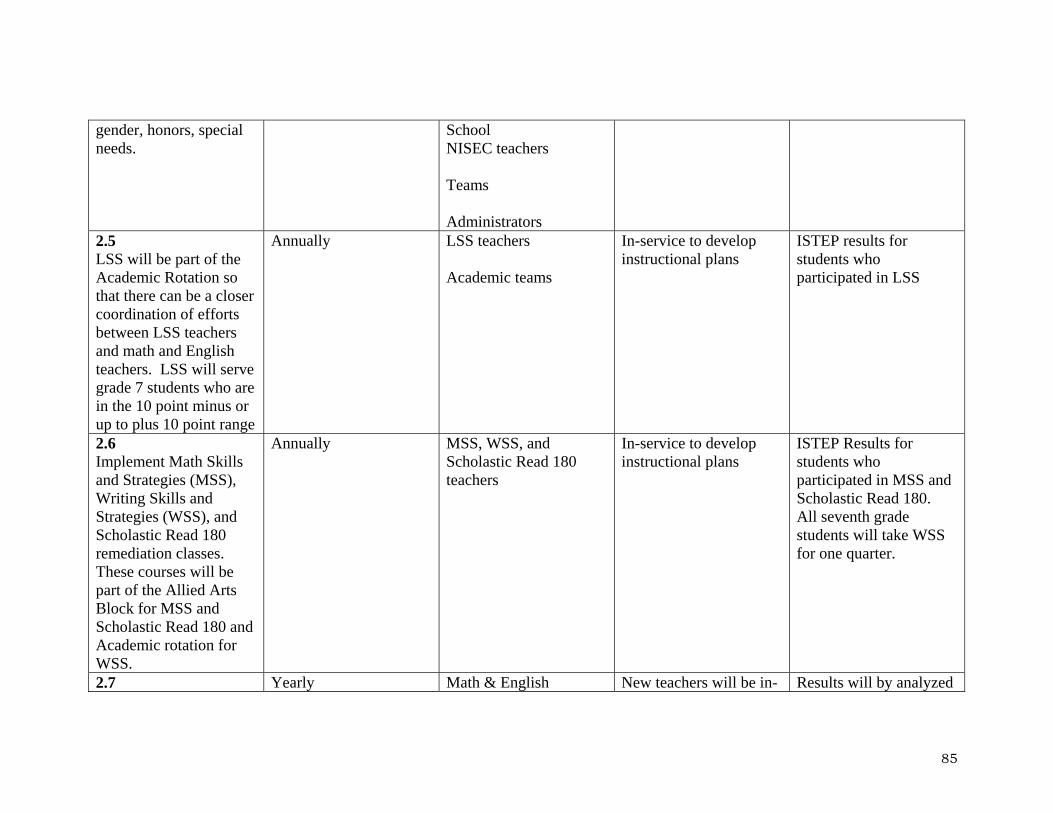
gender, honors, special needs.
School NISEC teachers Teams Administrators
2.5 Annually LSS teachers In-service to develop instructional plans
ISTEP results for students who participated in LSS
LSS will be part of the Academic Rotation so that there can be a closer coordination of efforts between LSS teachers and math and English teachers. LSS will serve grade 7 students who are in the 10 point minus or up to plus 10 point range
Academic teams
2.6 Annually MSS, WSS, and Scholastic Read 180 teachers
In-service to develop instructional plans
ISTEP Results for students who participated in MSS and Scholastic Read 180. All seventh grade students will take WSS for one quarter.
Implement Math Skills and Strategies (MSS), Writing Skills and Strategies (WSS), and Scholastic Read 180 remediation classes. These courses will be part of the Allied Arts Block for MSS and Scholastic Read 180 and Academic rotation for WSS. 2.7 Yearly Math & English New teachers will be in- Results will by analyzed
85
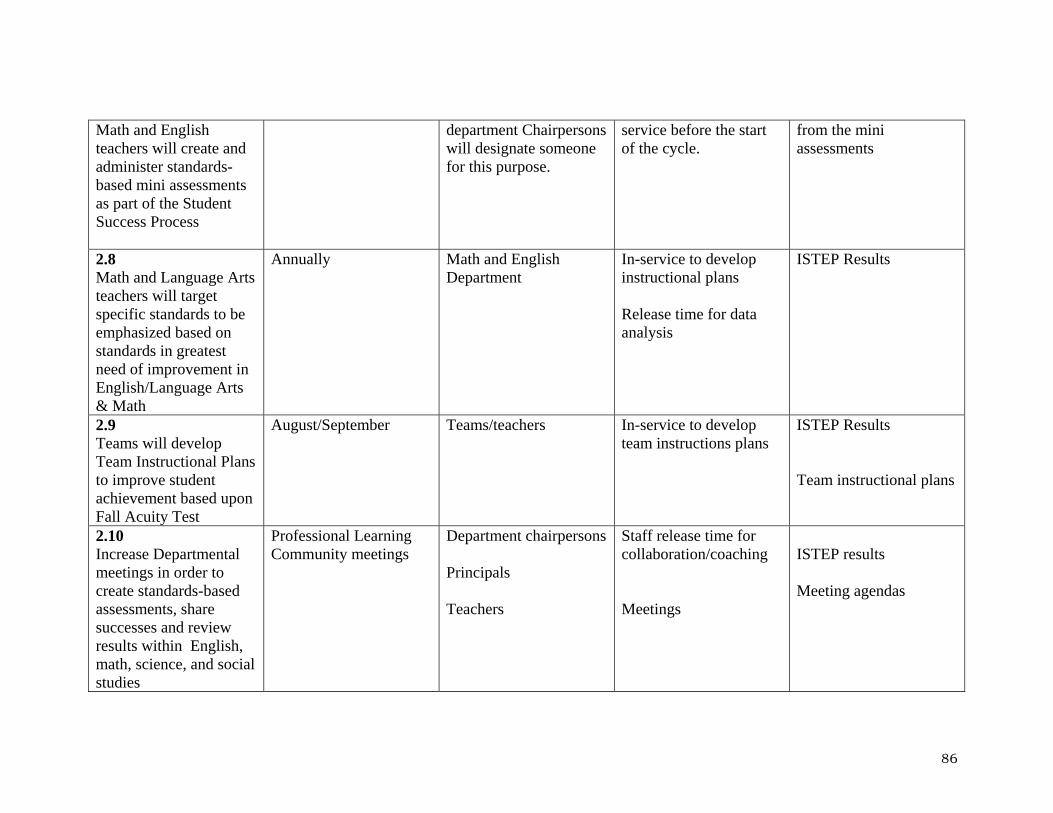
Math and English teachers will create and administer standards-based mini assessments as part of the Student Success Process
department Chairpersons will designate someone for this purpose.
service before the start of the cycle.
from the mini assessments
2.8 Annually Math and English
Department In-service to develop instructional plans
ISTEP Results Math and Language Arts teachers will target specific standards to be emphasized based on standards in greatest need of improvement in English/Language Arts & Math
Release time for data analysis
2.9 August/September Teams/teachers In-service to develop team instructions plans
ISTEP Results Teams will develop Team Instructional Plans to improve student achievement based upon Fall Acuity Test
Team instructional plans
2.10 Professional Learning Community meetings
Department chairpersons Staff release time for collaboration/coaching
Increase Departmental meetings in order to create standards-based assessments, share successes and review results within English, math, science, and social studies
ISTEP results Principals
Meeting agendas Teachers Meetings
86

2.11 Annually POWER Writing and 6+1 strategies coaches
Staff release time for collaborative/coaching
ISTEP Results Implement cross-curricular instructional activities that emphasize reading, writing, and math strategies
MSS, WSS, and Scholastic Read 180 teachers
Meeting Agendas
Department chairpersons
2.12 Annually Guidance counselors New student orientation process
Acuity results for new students attending Pierce Expand orientation of
incoming students to include the Acuity test given at enrollment and place new students in team’s instructional plans based upon test scores
Team Leaders/ teams
2.13 Institute a 4-year rotation of teams that teach Honors/Special Education, with an opt-out mechanism.
Begin Fall 2005 Principal N/A Master Schedule Revised ED plan May 06
Teams Team assignments LRE Facilitators
Place ED students on teams with LD services. ED students will be distributed equally between the LD teams and according to grade level. 2.14 Continue the implementation of
Annually Baldrige Trainers Classroom management for new staff
Student Portfolios
87
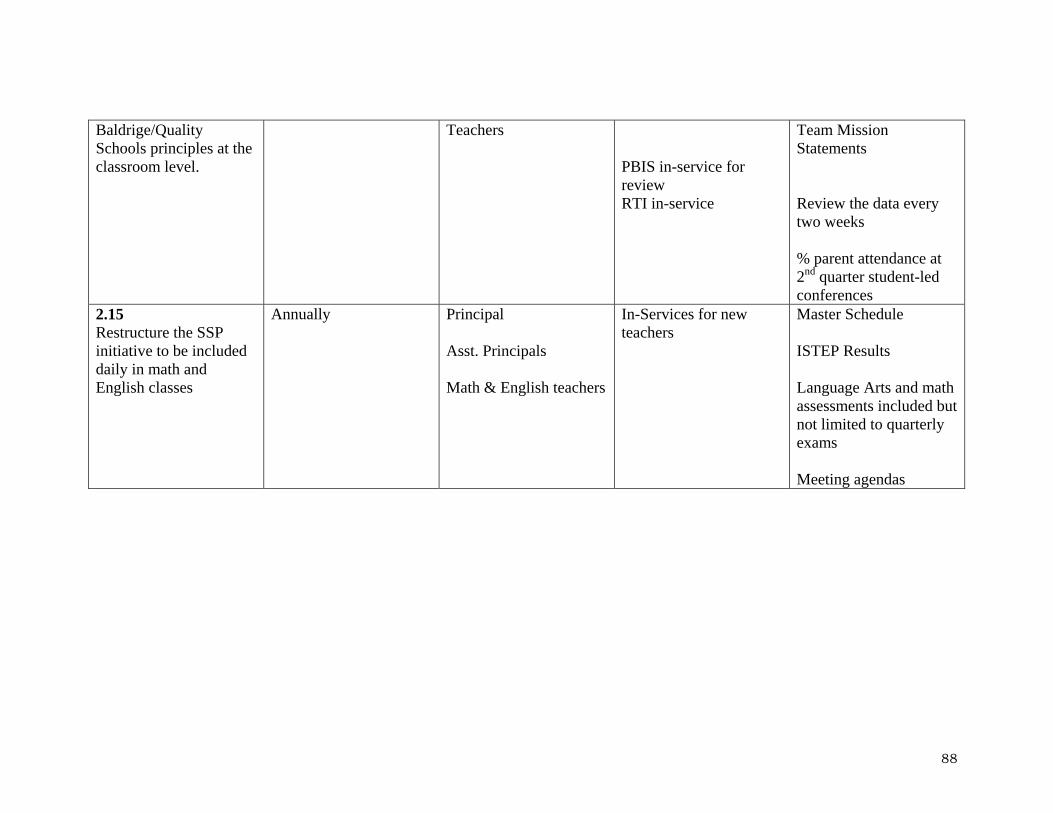
Baldrige/Quality Schools principles at the classroom level.
Teachers Team Mission Statements
PBIS in-service for review
RTI in-service Review the data every two weeks % parent attendance at 2nd quarter student-led conferences
2.15 Annually Principal In-Services for new teachers
Master Schedule Restructure the SSP initiative to be included daily in math and English classes
Asst. Principals ISTEP Results Math & English teachers Language Arts and math
assessments included but not limited to quarterly exams Meeting agendas
88
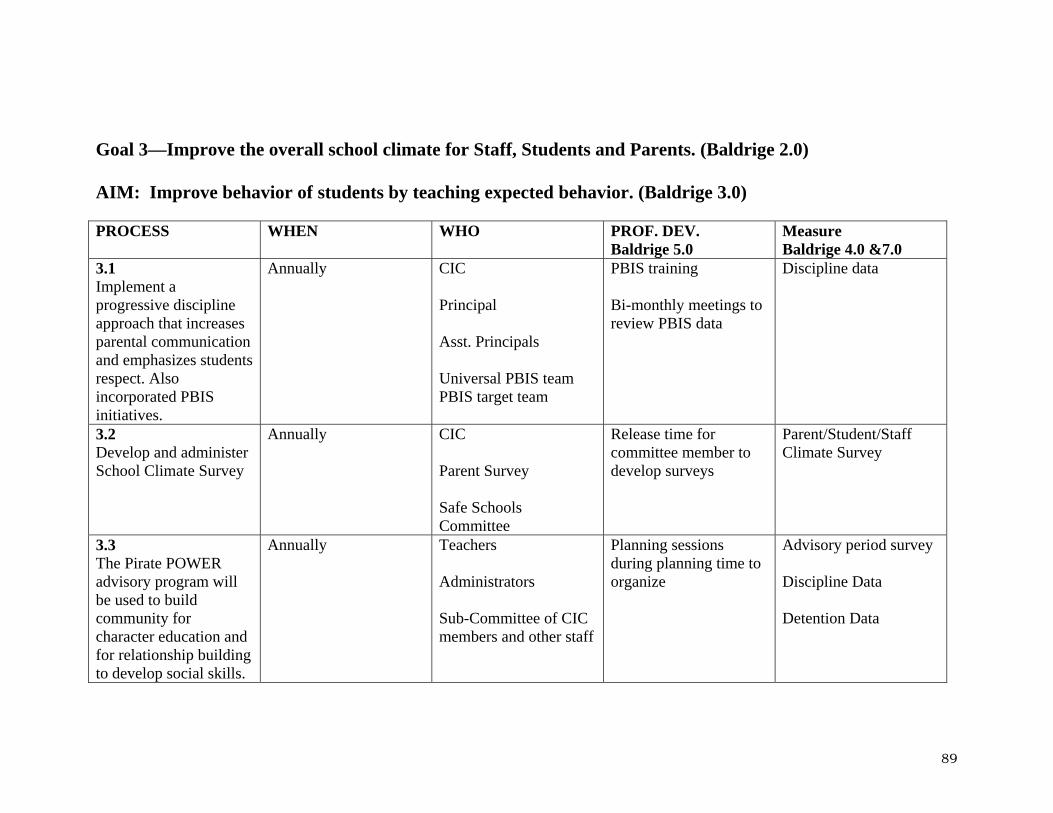
Goal 3—Improve the overall school climate for Staff, Students and Parents. (Baldrige 2.0) AIM: Improve behavior of students by teaching expected behavior. (Baldrige 3.0) PROCESS WHEN WHO PROF. DEV. Measure
Baldrige 5.0 Baldrige 4.0 &7.0 3.1 Annually CIC PBIS training Discipline data Implement a progressive discipline approach that increases parental communication and emphasizes students respect. Also incorporated PBIS initiatives.
Principal Bi-monthly meetings to
review PBIS data Asst. Principals Universal PBIS team PBIS target team
3.2 Annually CIC Release time for committee member to develop surveys
Parent/Student/Staff Climate Survey Develop and administer
School Climate Survey Parent Survey Safe Schools Committee
3.3 Annually Teachers Planning sessions during planning time to organize
Advisory period survey The Pirate POWER advisory program will be used to build community for character education and for relationship building to develop social skills.
Administrators Discipline Data
Detention Data Sub-Committee of CIC members and other staff
89

3.4 Annually All Staff PBIS in-service Discipline Data PBIS is designed to create effective learning communities based on research and validated practices.
In-service Agendas Teacher feedback
3.5 Quarterly Teachers List of Student Honorees Increase student
positive incentive reward program and recognize good behavior
Students Discipline Data Administrators Detention Data PBIS Coaches
90

Goal 4—Improve parent and community involvement in the school and improve parent satisfaction with the school. (Baldrige 2.0) AIM: Create a respectful, responsible, and safe Learning Environments (Baldrige 3.0)
Area of Focus 05-06 Goal 06-07 Goal 07-08 Goal 08-09 Goal 09-10 Goal Decrease the # of Discipline referrals to the office by 10%
158/month 158/month 100/month 100/month 100/month
Decrease the # of Out of School Suspensions by 5%/year
46.3/month 40/month 40/month 40/month 40/month
Decrease rate of disrespect to staff by 5%
17.2/month 17/month 10/month 10/month 10/month
Decrease rate of # of fights
11.7/month 8/month 5/month 5/month 5/month
Decrease the rate of the # of students assigned to lunch detentions assigned
41.6/LD per day 40/L.D. per day 15/L.D. per day 15/L.D. per day 15/L.D. per day
Improve the rate of attendance at lunch detentions by 3%/year
92.2% 94.9% 97.7% 97.7% 97.7%
79.2% 79.2% 90% 90% 90% Improve the rate of attendance at After School Detention by
91
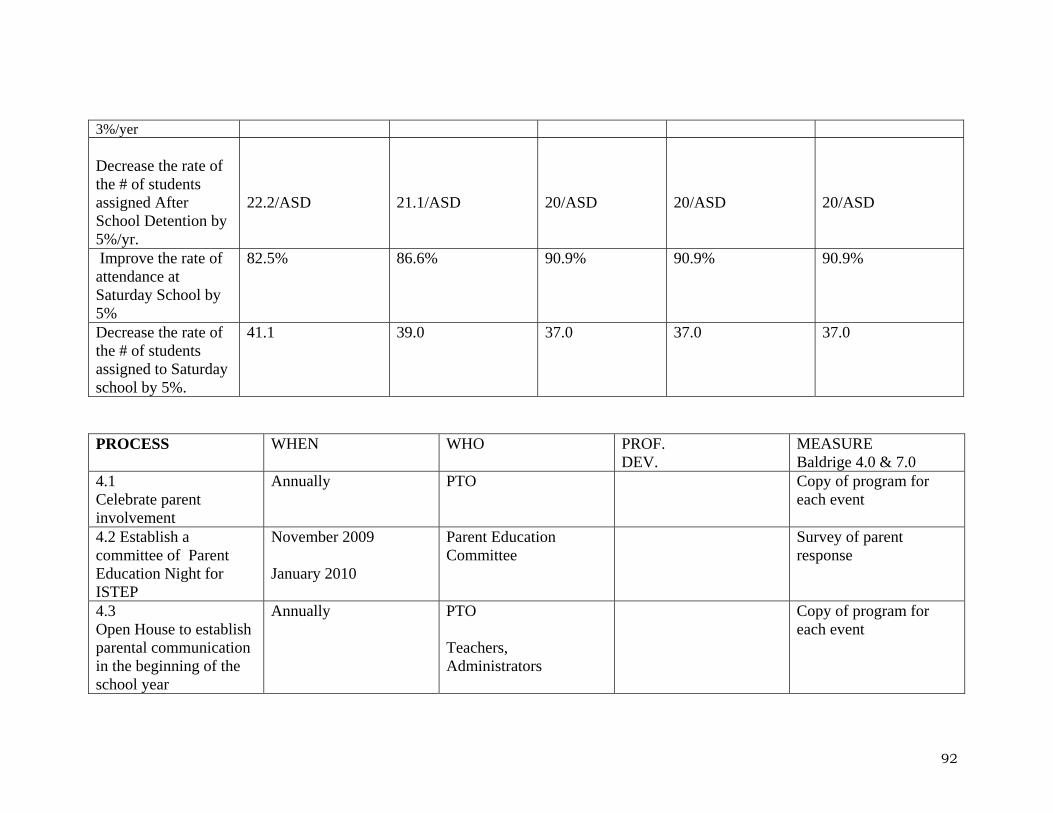
3%/yer Decrease the rate of the # of students assigned After School Detention by 5%/yr.
22.2/ASD 21.1/ASD 20/ASD 20/ASD 20/ASD
Improve the rate of attendance at Saturday School by 5%
82.5% 86.6% 90.9% 90.9% 90.9%
Decrease the rate of the # of students assigned to Saturday school by 5%.
41.1 39.0 37.0 37.0 37.0
PROCESS WHEN WHO PROF. MEASURE
DEV. Baldrige 4.0 & 7.0 4.1 Annually PTO Copy of program for
each event Celebrate parent involvement 4.2 Establish a committee of Parent Education Night for ISTEP
November 2009 Parent Education Committee
Survey of parent response
January 2010
4.3 Annually PTO Copy of program for each event Open House to establish
parental communication in the beginning of the school year
Teachers, Administrators
92

4.4. a 3rd quarter Merrillville Chamber of Commerce
Copy of program for each event Host a Reality Store
with participants from community businesses
Pierce Administration PTO Results of student
surveys on impact of event
8th grade teachers Director of Public Relations
4.4b Junior Achievement
1st nd and 2 semester Teachers Members of the community
4.5 Annually in the fall Merrillville Chamber of Commerce
Results of student surveys on impact of event
Host Core 40 scholars Presentation with participants from community businesses.
Pierce Administration 8th grade teachers
Professional Development Note: Because the Indiana Department of Education has eliminated the half-day in-service days for the coming school year, the CIC committee has not determined the format for staff development. In order to meet the new mandate our CIC is considering the idea of having all staff development take place during teachers’ planning times by adding an additional hour adding by utilizing substitute teachers. With staff input the following areas have been identified as staff development needs: Date Goal Process Required Resources How will the
effectiveness of the workshop be evaluated?
93

TBA To bring in an experienced consultant on the functionality of RTI (Response to Intervention)
A consultant from Northwest Indiana Education Service Center
Presenter: Workshop analysis sheet Dr. Carrie Cate-Clemons
TBA To bring in a consultant on “What’s new in educational technology?”
Reference from district Presenter: Dan Dallas Workshop analysis sheet Technology director
TBA To bring in a consultant to review PBIS
A consultant from Illinois Department of Education
Presenter: Wanda Jordan
Workshop analysis sheet
TBA Internal planning for team building
Teachers and administrators to present workshop
Activities to promote staff unity
Workshop analysis sheet
TBA Review new team configurations and develop contracts for parents/students
Team of teachers Rosters Completed contract for each team Sample Contracts
94
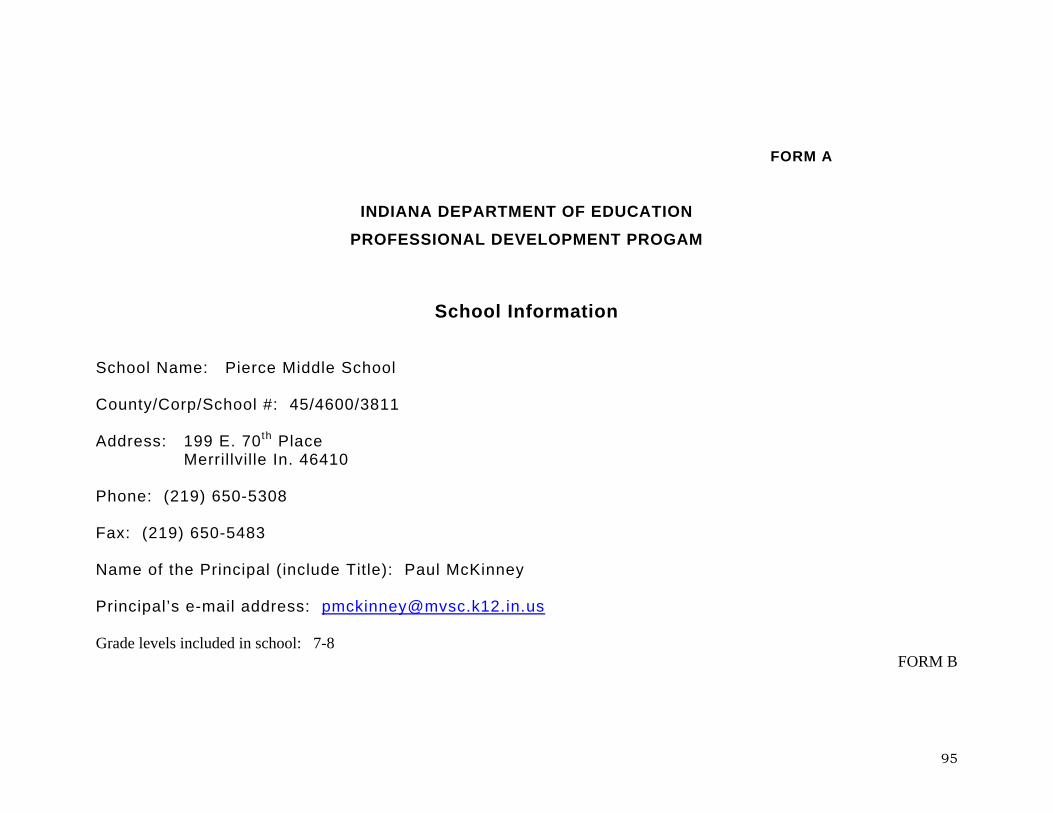
FORM A
INDIANA DEPARTMENT OF EDUCATION
PROFESSIONAL DEVELOPMENT PROGAM
School Information School Name: Pierce Middle School County/Corp/School #: 45/4600/3811 Address: 199 E. 70th Place Merrillville In. 46410 Phone: (219) 650-5308 Fax: (219) 650-5483 Name of the Principal (include Title): Paul McKinney Principal’s e-mail address: [email protected] Grade levels included in school: 7-8
FORM B
95

I, Debbie Argenta, as the exclusive representative, by signing this document, demonstrate my support for the Professional Development Program submitted by the above mentioned school. Signature Date Debbie Argenta Name (typed) Committee responsible for this plan: Name Group you are Signature Date
representing
96

97
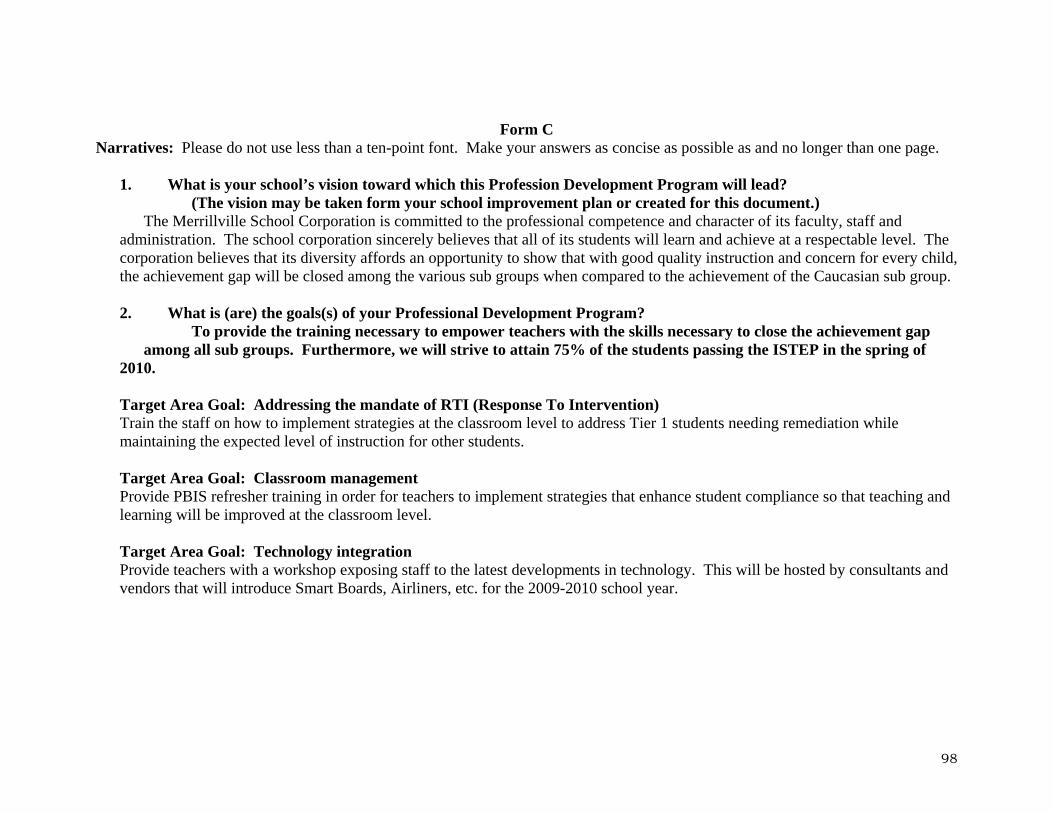
Form C Narratives: Please do not use less than a ten-point font. Make your answers as concise as possible as and no longer than one page.
1. What is your school’s vision toward which this Profession Development Program will lead? (The vision may be taken form your school improvement plan or created for this document.) The Merrillville School Corporation is committed to the professional competence and character of its faculty, staff and administration. The school corporation sincerely believes that all of its students will learn and achieve at a respectable level. The corporation believes that its diversity affords an opportunity to show that with good quality instruction and concern for every child, the achievement gap will be closed among the various sub groups when compared to the achievement of the Caucasian sub group. 2. What is (are) the goals(s) of your Professional Development Program? To provide the training necessary to empower teachers with the skills necessary to close the achievement gap among all sub groups. Furthermore, we will strive to attain 75% of the students passing the ISTEP in the spring of 2010. Target Area Goal: Addressing the mandate of RTI (Response To Intervention) Train the staff on how to implement strategies at the classroom level to address Tier 1 students needing remediation while maintaining the expected level of instruction for other students. Target Area Goal: Classroom management Provide PBIS refresher training in order for teachers to implement strategies that enhance student compliance so that teaching and learning will be improved at the classroom level. Target Area Goal: Technology integration Provide teachers with a workshop exposing staff to the latest developments in technology. This will be hosted by consultants and vendors that will introduce Smart Boards, Airliners, etc. for the 2009-2010 school year.
98
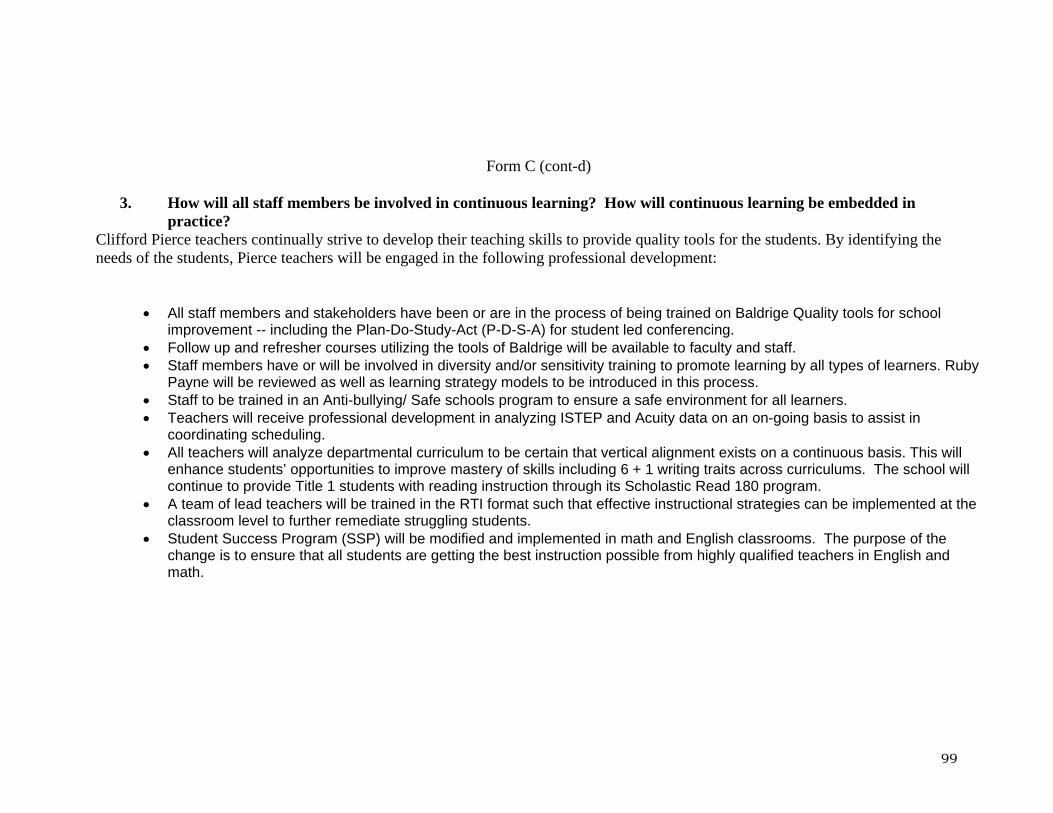
Form C (cont-d) 3. How will all staff members be involved in continuous learning? How will continuous learning be embedded in
practice? Clifford Pierce teachers continually strive to develop their teaching skills to provide quality tools for the students. By identifying the needs of the students, Pierce teachers will be engaged in the following professional development:
• All staff members and stakeholders have been or are in the process of being trained on Baldrige Quality tools for school improvement -- including the Plan-Do-Study-Act (P-D-S-A) for student led conferencing.
• Follow up and refresher courses utilizing the tools of Baldrige will be available to faculty and staff. • Staff members have or will be involved in diversity and/or sensitivity training to promote learning by all types of learners. Ruby
Payne will be reviewed as well as learning strategy models to be introduced in this process. • Staff to be trained in an Anti-bullying/ Safe schools program to ensure a safe environment for all learners. • Teachers will receive professional development in analyzing ISTEP and Acuity data on an on-going basis to assist in
coordinating scheduling. • All teachers will analyze departmental curriculum to be certain that vertical alignment exists on a continuous basis. This will
enhance students’ opportunities to improve mastery of skills including 6 + 1 writing traits across curriculums. The school will continue to provide Title 1 students with reading instruction through its Scholastic Read 180 program.
• A team of lead teachers will be trained in the RTI format such that effective instructional strategies can be implemented at the classroom level to further remediate struggling students.
• Student Success Program (SSP) will be modified and implemented in math and English classrooms. The purpose of the change is to ensure that all students are getting the best instruction possible from highly qualified teachers in English and math.
99
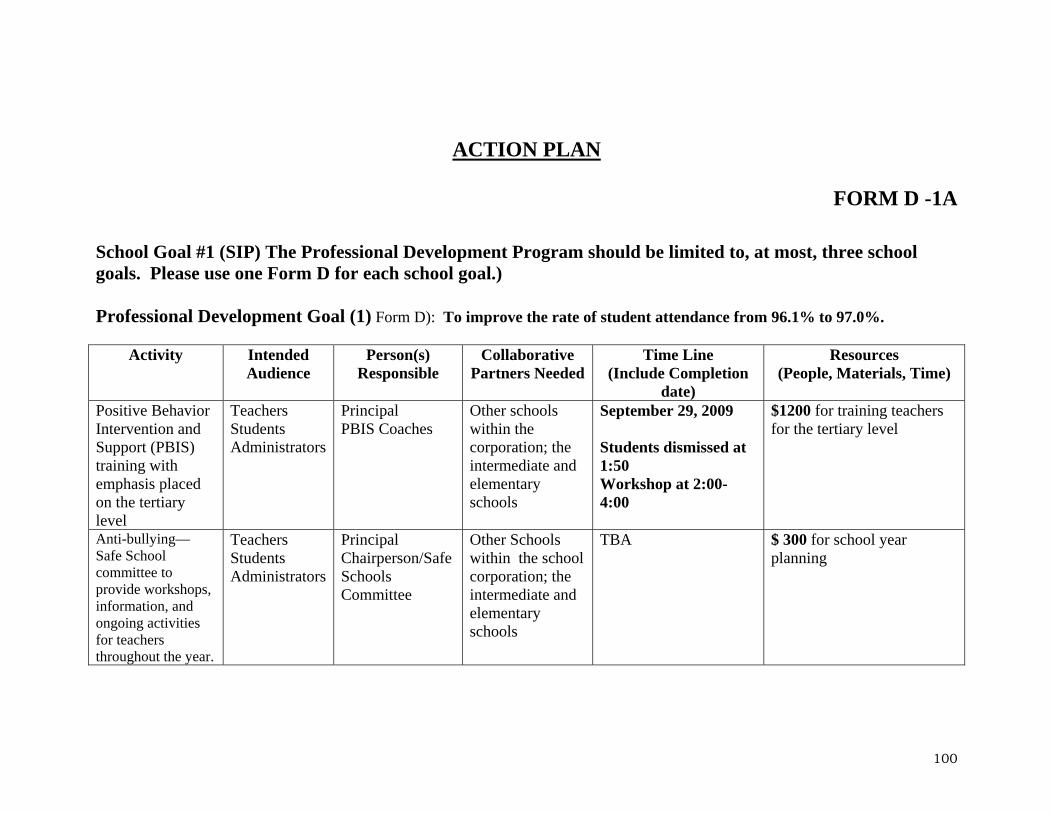
ACTION PLAN
FORM D -1A
School Goal #1 (SIP) The Professional Development Program should be limited to, at most, three school goals. Please use one Form D for each school goal.) Professional Development Goal (1) Form D): To improve the rate of student attendance from 96.1% to 97.0%.
Activity Intended Audience
Person(s) Responsible
Collaborative Partners Needed
Time Line Resources (Include Completion
date) (People, Materials, Time)
$1200 for training teachers for the tertiary level
September 29, 2009 Positive Behavior Intervention and Support (PBIS) training with emphasis placed on the tertiary level
Teachers Principal Other schools within the corporation; the intermediate and elementary schools
Students PBIS Coaches Students dismissed at 1:50
Administrators
Workshop at 2:00-4:00
$ 300 for school year planning
Teachers Principal Other Schools within the school corporation; the intermediate and elementary schools
TBA Anti-bullying— Safe School committee to provide workshops, information, and ongoing activities for teachers throughout the year.
Students Chairperson/Safe Schools Committee
Administrators
100
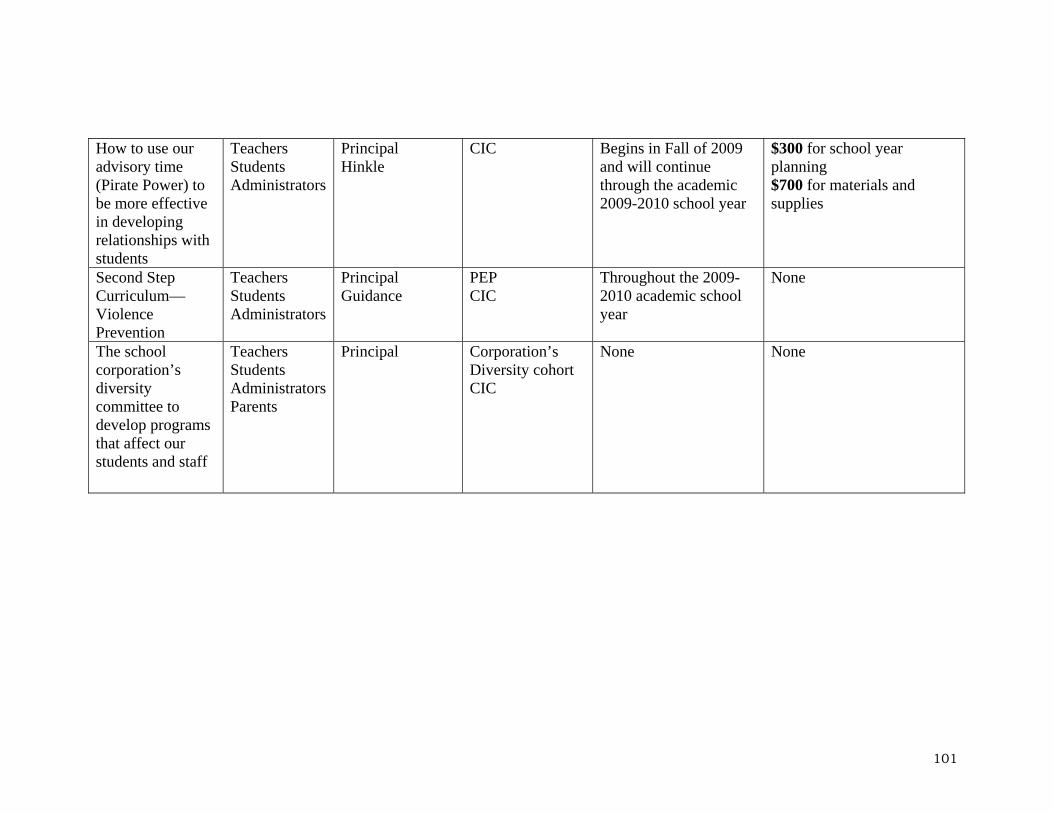
$300 for school year planning
How to use our advisory time (Pirate Power) to be more effective in developing relationships with students
Teachers Principal CIC Begins in Fall of 2009 and will continue through the academic 2009-2010 school year
Students Administrators
Hinkle $700 for materials and supplies
Second Step Curriculum—Violence Prevention
Teachers Principal PEP Throughout the 2009-2010 academic school year
None Students Guidance CIC Administrators
The school corporation’s diversity committee to develop programs that affect our students and staff
Teachers Principal Corporation’s Diversity cohort
None None Students Administrators CIC Parents
101
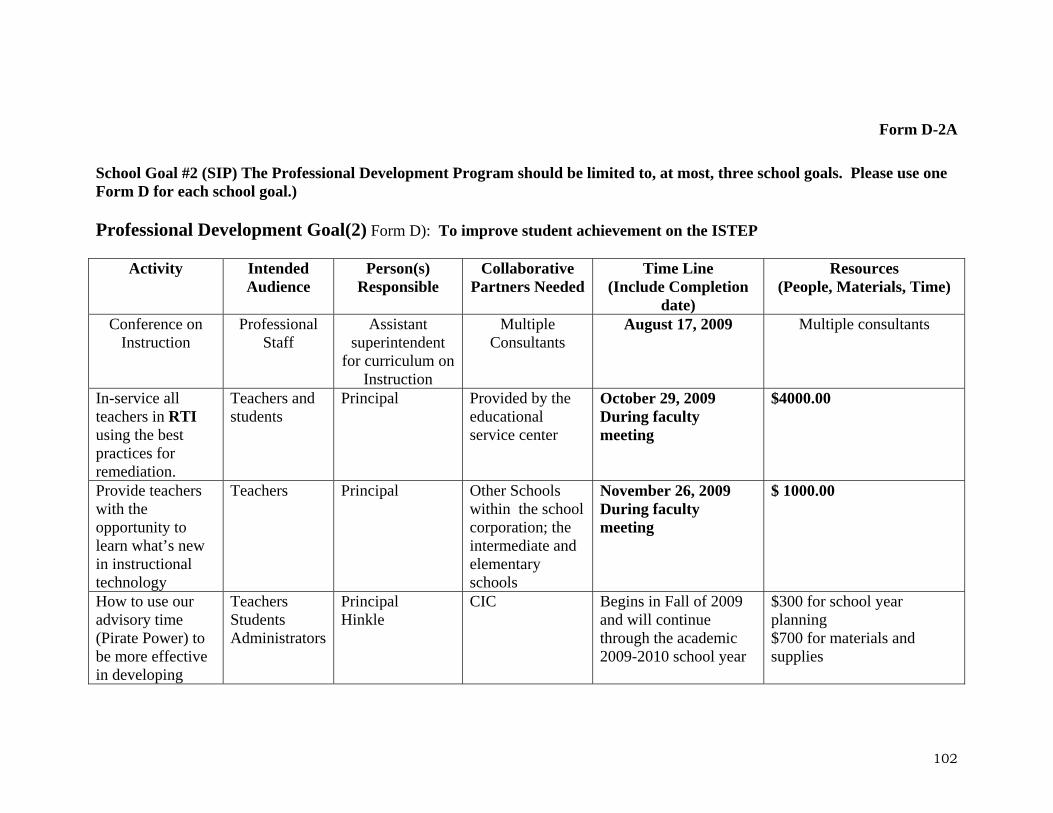
Form D-2A
School Goal #2 (SIP) The Professional Development Program should be limited to, at most, three school goals. Please use one Form D for each school goal.) Professional Development Goal(2) Form D): To improve student achievement on the ISTEP
Activity Intended Audience
Person(s) Responsible
Collaborative Partners Needed
Time Line Resources (Include Completion
date) (People, Materials, Time)
August 17, 2009 Conference on Instruction
Professional Staff
Assistant superintendent
for curriculum on Instruction
Multiple Consultants
Multiple consultants
In-service all teachers in RTI using the best practices for remediation.
Teachers and students
Principal Provided by the educational service center
October 29, 2009 $4000.00 During faculty meeting
November 26, 2009 $ 1000.00 Provide teachers with the opportunity to learn what’s new in instructional technology
Teachers Principal Other Schools within the school corporation; the intermediate and elementary schools
During faculty meeting
How to use our advisory time (Pirate Power) to be more effective in developing
Teachers Principal CIC Begins in Fall of 2009 and will continue through the academic 2009-2010 school year
$300 for school year planning Students
Administrators Hinkle
$700 for materials and supplies
102
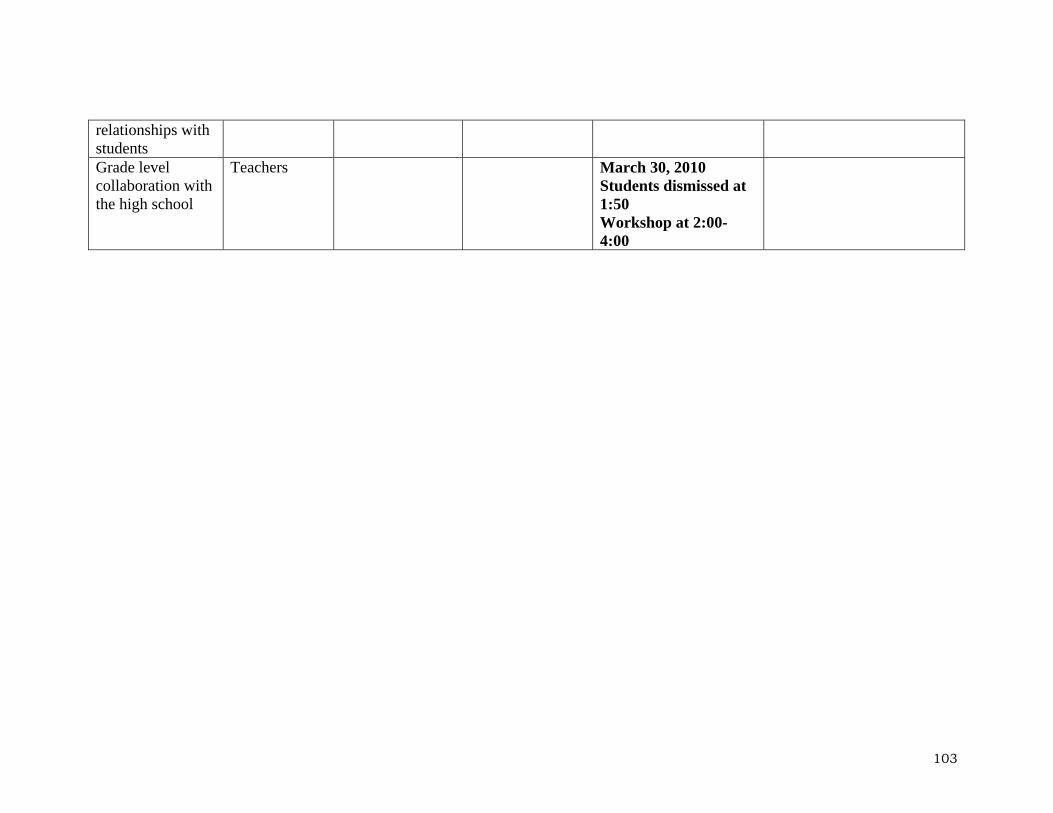
relationships with students
March 30, 2010 Grade level collaboration with the high school
Teachers Students dismissed at 1:50 Workshop at 2:00-4:00
103

School Goal #3 (SIP) The Professional Development Program should be limited to, at most, three school goals. Please use one Form D for each school goal.) Professional Development Goal(3) Form D): To improve school climate
Activity Intended Audience
Person(s) Responsible
Collaborative Partners Needed
Time Line Resources (Include Completion
date) (People, Materials, Time)
$1000.00 Provide parents with information on what can be done at home to improve student achievement
Parents Team leaders Guidance, social worker and teachers
February 11, 2010
104