Masao Sakisaka__Desarrollo de La Economia Japonesa Despues de La IIGM
1
Supplementary Information
Rapid decline in pH of coral calcification fluid due to incorporation of anthropogenic CO2
Kaoru Kubota, Yusuke Yokoyama, Tsuyoshi Ishikawa, Atsushi Suzuki, Masao Ishii
Supplementary Text
Supplementary Figures S1–S9
Supplementary Tables S1–S2
Supplementary References
2
Supplementary Text 1. Calculation of ΩCF. Though δ11B of coral skeleton can be used to estimate pHCF, in
order to fully describe CO2 system in the calcification fluid more calculation is required
(e.g., ref. 29,46). Thus from the following calculation we confirmed ΩCF is dependent
on pHCF. All calculation were made in temperature of 25°C and salinity of 35 for
simplicity. We used constants bellow:
[B]SW = 416 µmol/kg (ref. 47);
[Ca]SW = 10.2821 mmol/kg (ref. 48);
Solubility constant, Ksp for aragonite = 6.5 * 10-7 (ref. 49);
Dissociation constants of carbonic acid in the seawater: K1 and K2 from Lueker et
al.50;
Dissociation constants of boric acid in the seawater: KB from Dickson51.
We assume that calcium and boron concentration of the calcification fluid is same as
seawater as its difference is less than 10% (ref. 6). Although how boron is incorporated
into the aragonite skeleton from the seawater is still contested46,52, we employed the
relationship reported by Hemming & Hanson53 which is based on empirical calibration
of biogenically precipitated aragonite such as skeletons of corals and coralline algae
living in the ocean. To employ Hemming & Hanson53's model is reasonable, because
there is a statistically significant correlation between B/Ca and [B(OH)4-]/[HCO3
-] in a
boron concentration in the present seawater46. In this model, charged borate ion is
selectively incorporated into aragonite lattice. Distribution constant, KD is defined as:
KD =[HBO3
2− / CO32– ]solid
[B(OH)4– / HCO3
− ]liquid≅
[B / Ca]CaCO3[B(OH)4
– / HCO3− ]seawater
(S1)
where B/Ca is equivalent to [HBO3-]/[CO3
2-], because Ca and C are equimolar in
CaCO3. We made calculation using KD value of 12*10-3 reported by Hemming &
Hanson53, which lies within ones recently determined by Holcomb et al.46: 1.4–52 *10-3
and Mavromatis et al.52: 0.3–40 *10-3.
For the Chichijima coral samples (3-year resolution), we newly measured B/Ca ratio
by using a quadropole inductively coupled plasma mass spectrometry (Elan DRC,
Perkin Elmer, USA). Average B/Ca value of the Chichijima coral is 0.536 mmol/mol
during 1914–1997 (Table S2). For the Kikaijima coral, we used high-resolution B/Ca
3
records determined by using a laser ablation inductively coupled plasma mass
spectrometry (Element XR, Thermo Scientific, Germany)11. From smoothed
monthly-resolution data, we calculated 3-year averages for each data points that we
measured δ11B. Average B/Ca value of the Kikaijima coral is 0.457 mmol/mol during
1911–2006 (Table S2).
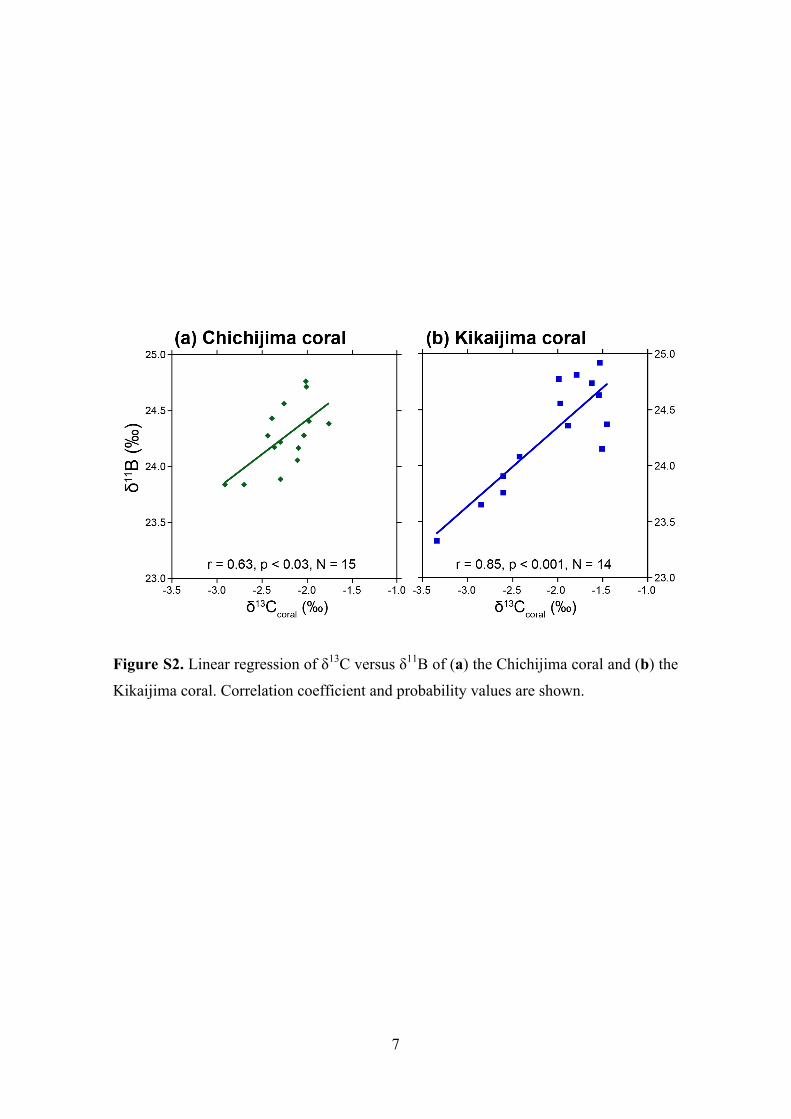
Saturation state of the calcification fluid with respect to aragonite, ΩCF =
[Ca]CF[CO32-]CF/Ksp, is calculated to be 20.1–31.7 (Table S2), which is consistent with
the previous estimation for Favia coral6. Through these calculations, we confirmed that
there is a clear positive relationship between pHCF and ΩCF (Fig. S2). Therefore we
concluded that pHCF decrease would lead to ΩCF decrease.
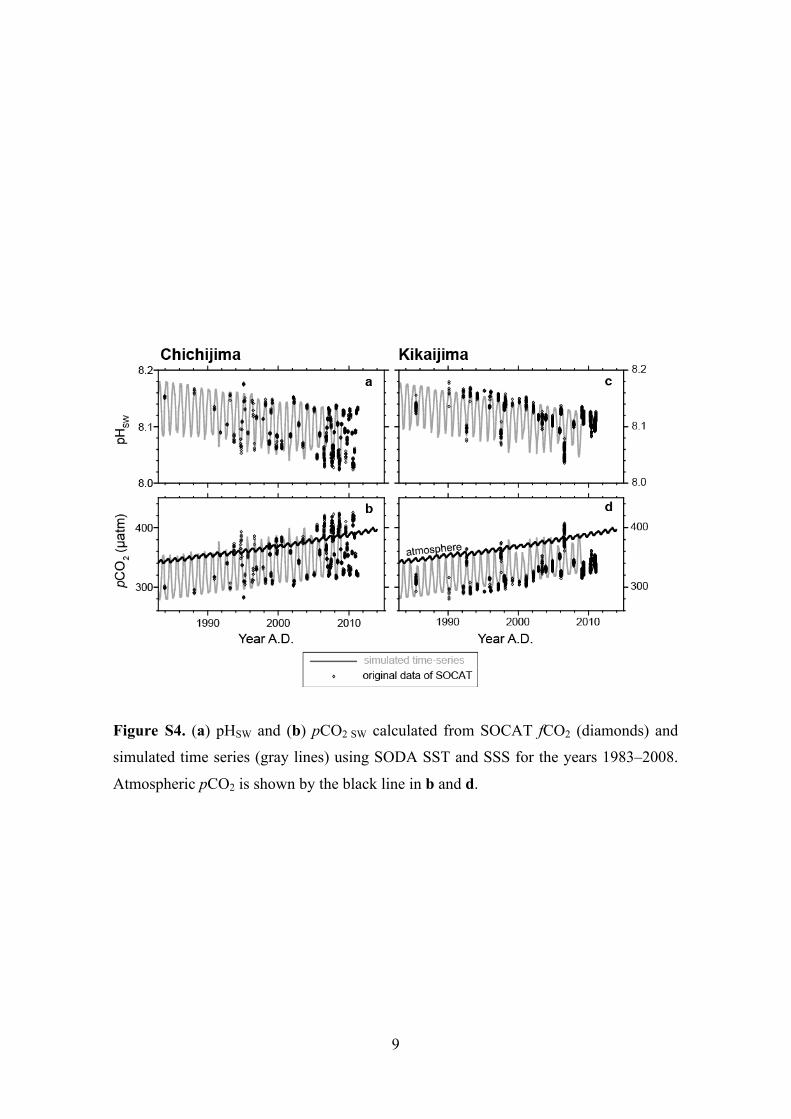
2. Further verification of pHSW estimation using SOCAT fCO2 data for the vicinity
of Chichijima. To see how much pHSW and pCO2 SW time series for the grid point at
27°N, 137°E (Method) represent those of the ocean in the vicinity of Chichijima
(27.1°N, 142.2°E) and Kikaijima (28.3°N, 130.0°E), as there are zonal distance of about
500–700 km between grid points, we estimated pHSW and pCO2 SW using SOCAT fCO2
version 2 data closer to the islands34. We extracted the data from 1.0° latitude by 5.0°
longitude grids centered on Chichijima and Kikaijima (Fig. S4). We calculated TA from
the equation: SSS/35×2295 µmol kg-1 (ref. 16). In the calculation, we used ancillary in
situ data of SST and SSS to each fCO2 data-point. For grid points where SSS data was
not available, we imported climatological salinity values from the World Ocean Atlas
2005. We calculated DIC using CO2Calc software, version 1.0 (ref. 54). We normalized
DIC at salinity of 35 (nDIC) and fitted it to an empirical function of the timing of
measurement (year), SST, and SSS by multi-parameter regression14:
nDIC = DIC *35 / SSS=C0 +C1 *(year - 2000)+C2 *(SST - 24.7)+C3 *(SST - 24.7)
2
+C4 *(SST - 24.7)3 +C5 *(SSS - 34.5)+ε
(S2)
The terms C0 ~ C5 are coefficients of multiple regressions, and ε represents the residual
of the fitting. The polynomial of (SST–24.7) in the equation exhibits strong correlation
with nDIC and SST. From this calculation we obtained an empirical regression equation
for Chichijima (R2 = 0.74, n = 1,034) and Kikaijima (R2 = 0.93, n = 4,401) using the
4
below parameters.
Parameter Chichijima Kikaijima
C0 1958.9 1953.1
C1 1.14 1.16
C2 -2.05 -3.65
C3 0.26 0.38
C4 -0.05 -0.02
C5 -12.0 -5.62
Root mean squares of ε are 6.7 and 2.5 µmol/Kg, respectively. We used SST and SSS of
the Simple Ocean Data Assimilation (SODA v2.2.4; ref. 55) to estimate monthly values
of nDIC for the years 1983–2008, and calculated pHSW and pCO2 SW from DIC and
assuming TA using CO2Calc (Fig. S4). We made calculations of seawater CO2
chemistry using the dissociation constants of carbonic acid given by Lueker et al.50, that
of hydrogen sulfate by Dickson51, and the pH scale of the total hydrogen ion
concentration. We compared obtained pHSW and pCO2 SW time series with those for the
grid point at 27°N, 137°E (Method). We observed no significant difference between
them (Fig. S5).
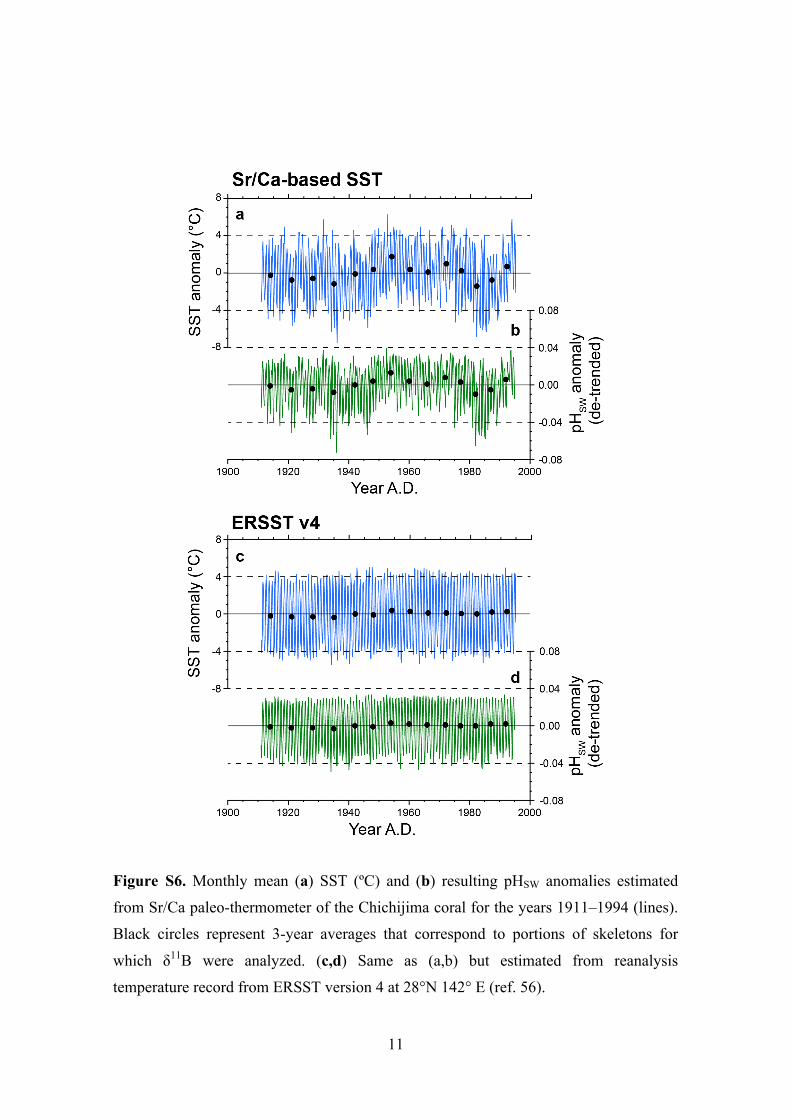
3. SST effects on pH calculation. As pH is temperature-dependent, we evaluated SST
effect on pHSW estimation. In all calculations, SSS was kept constant at the present
climatological value (34.8), as it had variation less than 0.05 during 1911–1997 (ref. 10),
which can be regarded negligibly small. We calculated SST in the past from monthly
Sr/Ca records of the Chichijima coral using equations reported by Felis et al.10 for the
same coral colony, and used them as a representative of past SST variation in the
western North Pacific11:
Sr / Ca = 10.33− 0.051*SST103
(S3)
We calculated nDIC from obtained SST and SSS (34.8) using Eq. (S2), where the term
5
for the linear trend was removed to examine seasonal to inter-annual variations. Then,
using CO2calc we calculated de-trended pHSW in combination with assumed TA. We
calculated averages for each 3-year period that corresponded to the same portions of the
coral skeleton used for δ11B analyses. The 3-year averaged SST anomaly had a standard
deviation of 0.9 °C, and that of the pHSW anomaly was only 0.006 (Fig. S6a,b).
Therefore, owing to 3-year averaging, we confirmed that effects of SST changes in the
past were negligible in pHSW calculation.
In addition, we confirmed the negligible effect of past SST changes on pHSW
estimation through the calculation using independently estimated reanalysis SST record,
the extended reconstructed global sea surface temperature (ERSST version 4; ref. 56).
The 3-year averaged SST anomaly had a standard deviation of 0.2 °C, and that of the
pHSW anomaly was only 0.002 (Fig. S6c,d).
Similarly, SST and SSS effects on pHCF calculation were negligibly small as a
standard deviation of pKB change is less than 0.01.
6
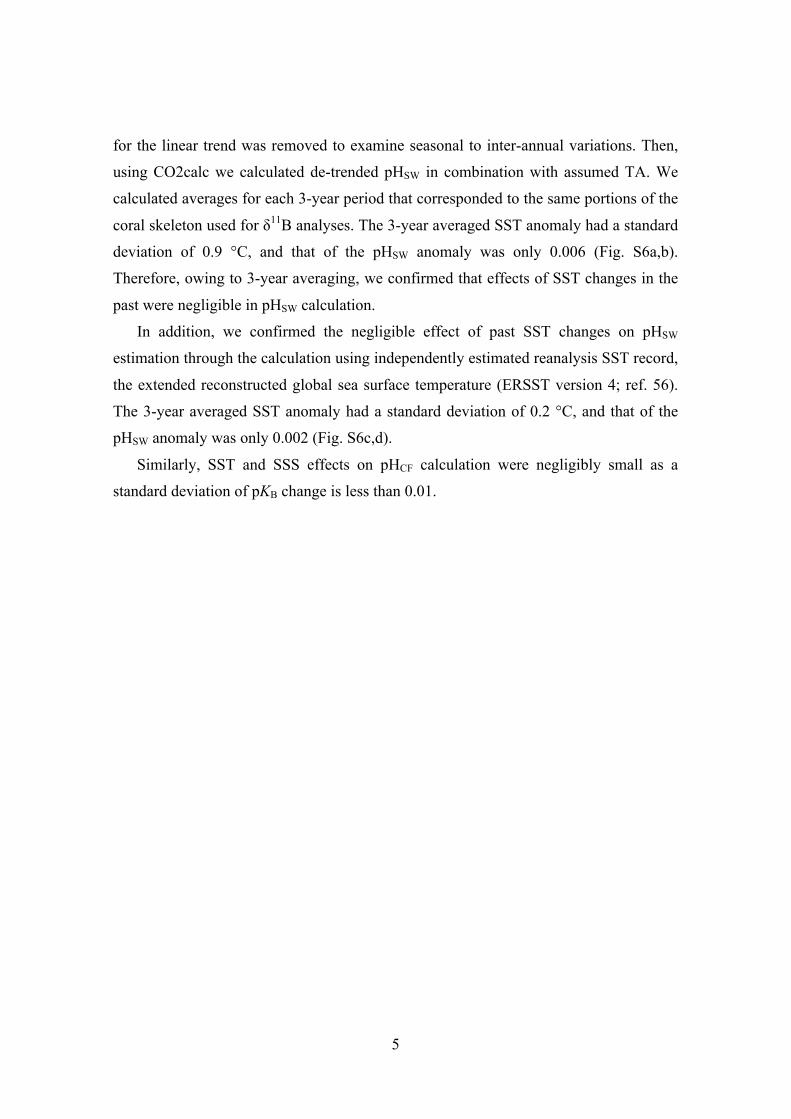
Figure S1. (a) A X-ray image of the Kikaijima coral. (b) Annual extension rates of the
Chichijima and the Kikaijima coral along the major growth direction. Data of the
Chichijima coral is previously published from Felis et al.10 and that of the Kikaijima
coral is calculated from distances of adjoining Sr/Ca peaks in winter measured by a
laser ablation ICPMS11.
7
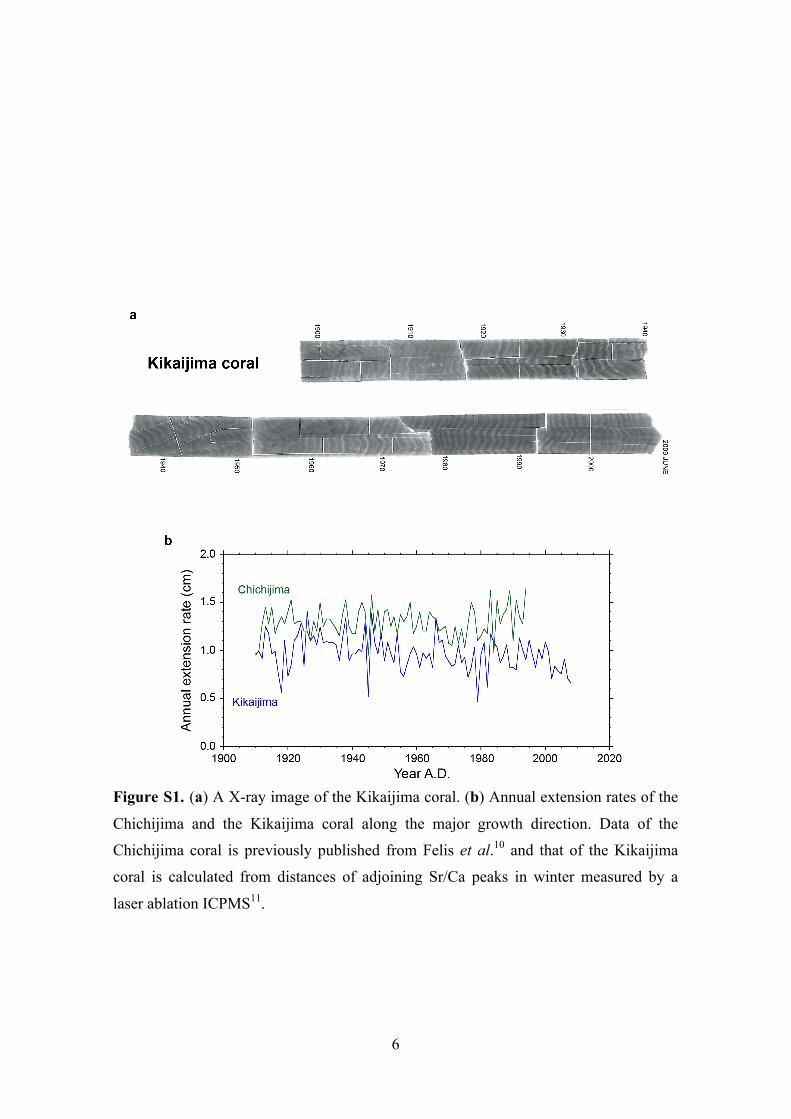
Figure S2. Linear regression of δ13C versus δ11B of (a) the Chichijima coral and (b) the
Kikaijima coral. Correlation coefficient and probability values are shown.
8
Figure S3. A cross-plot of pH and Ωaragonite of the calcification fluid (the Chichijima
coral, closed diamonds; the Kikaijima coral, open rectangles). CF, calcification fluid.
9
Figure S4. (a) pHSW and (b) pCO2 SW calculated from SOCAT fCO2 (diamonds) and
simulated time series (gray lines) using SODA SST and SSS for the years 1983–2008.
Atmospheric pCO2 is shown by the black line in b and d.
10
Figure S5. Comparison of (a) pHSW and (b) pCO2 SW time series simulated at 27°N,
137°E (for the years 1993–2010, red dashed lines) and those of the restricted areas
around Chichijima and Kikaijima (for the years 1983–2008, gray lines). Atmospheric
pCO2 is shown by the black line in b and d. MOVE, multivariate ocean variational
estimation system.
11
Figure S6. Monthly mean (a) SST (ºC) and (b) resulting pHSW anomalies estimated
from Sr/Ca paleo-thermometer of the Chichijima coral for the years 1911–1994 (lines).
Black circles represent 3-year averages that correspond to portions of skeletons for
which δ11B were analyzed. (c,d) Same as (a,b) but estimated from reanalysis
temperature record from ERSST version 4 at 28°N 142° E (ref. 56).
12
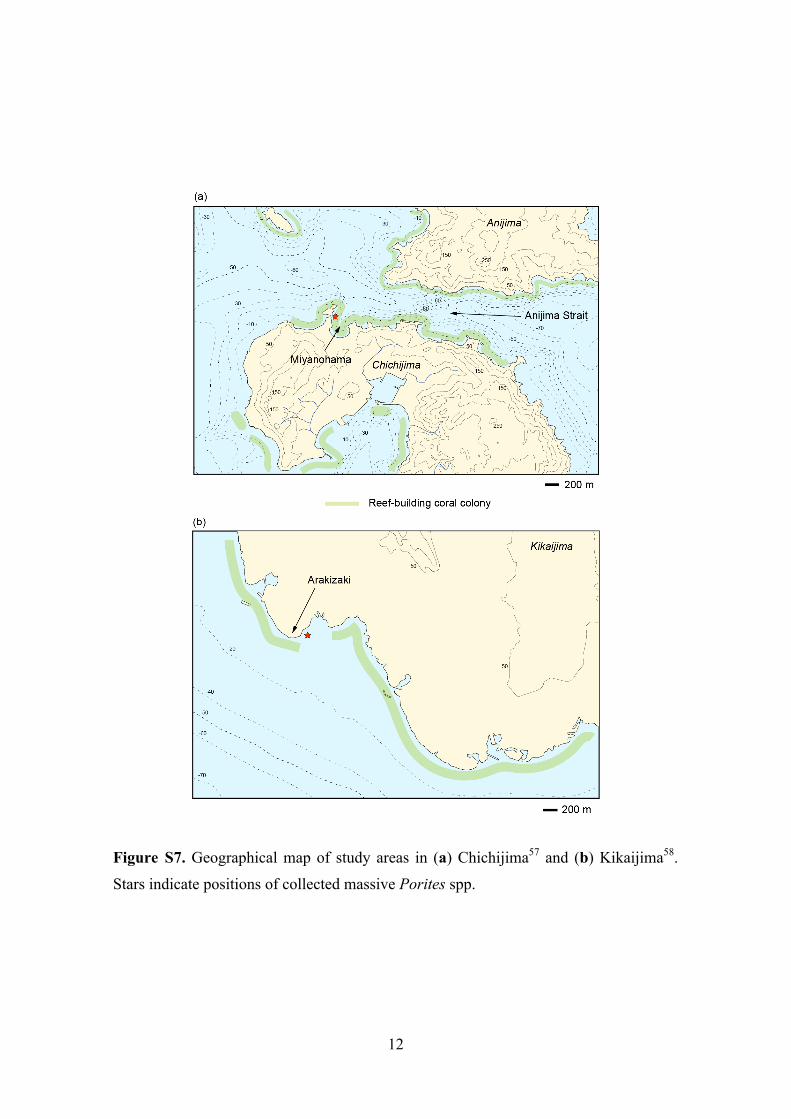
Figure S7. Geographical map of study areas in (a) Chichijima57 and (b) Kikaijima58.
Stars indicate positions of collected massive Porites spp.
13
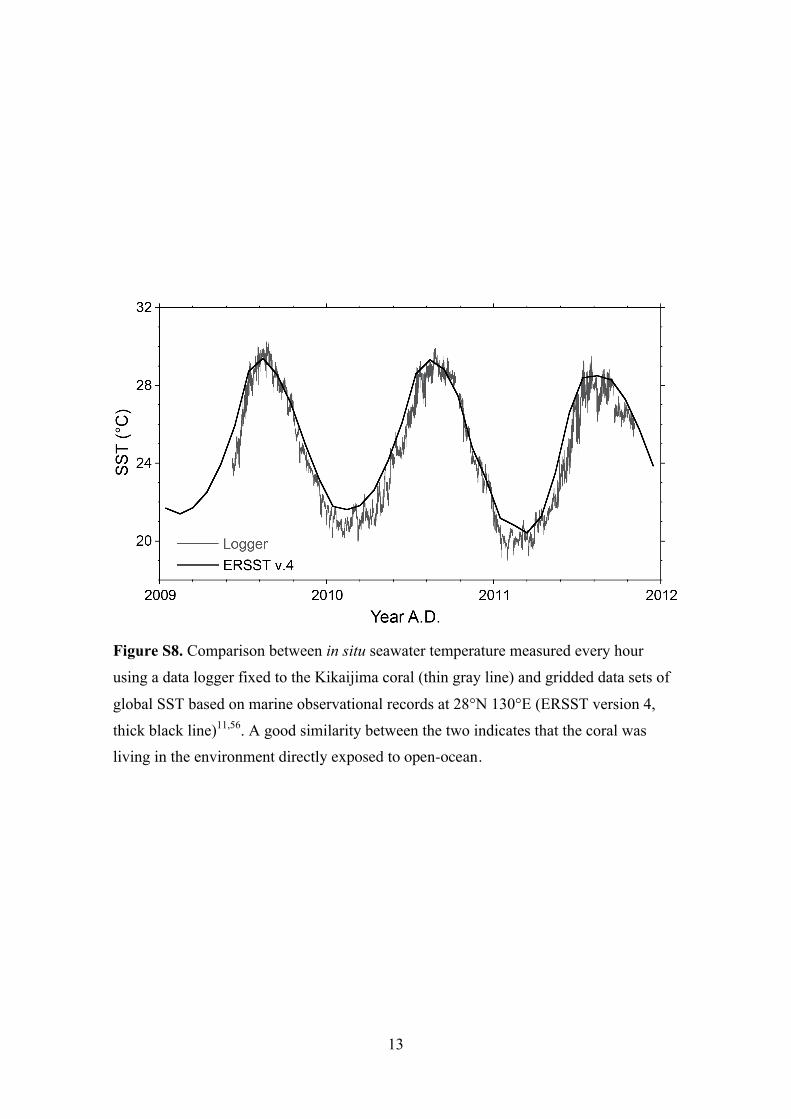
Figure S8. Comparison between in situ seawater temperature measured every hour
using a data logger fixed to the Kikaijima coral (thin gray line) and gridded data sets of
global SST based on marine observational records at 28°N 130°E (ERSST version 4,
thick black line)11,56. A good similarity between the two indicates that the coral was living in the environment directly exposed to open-ocean.
14
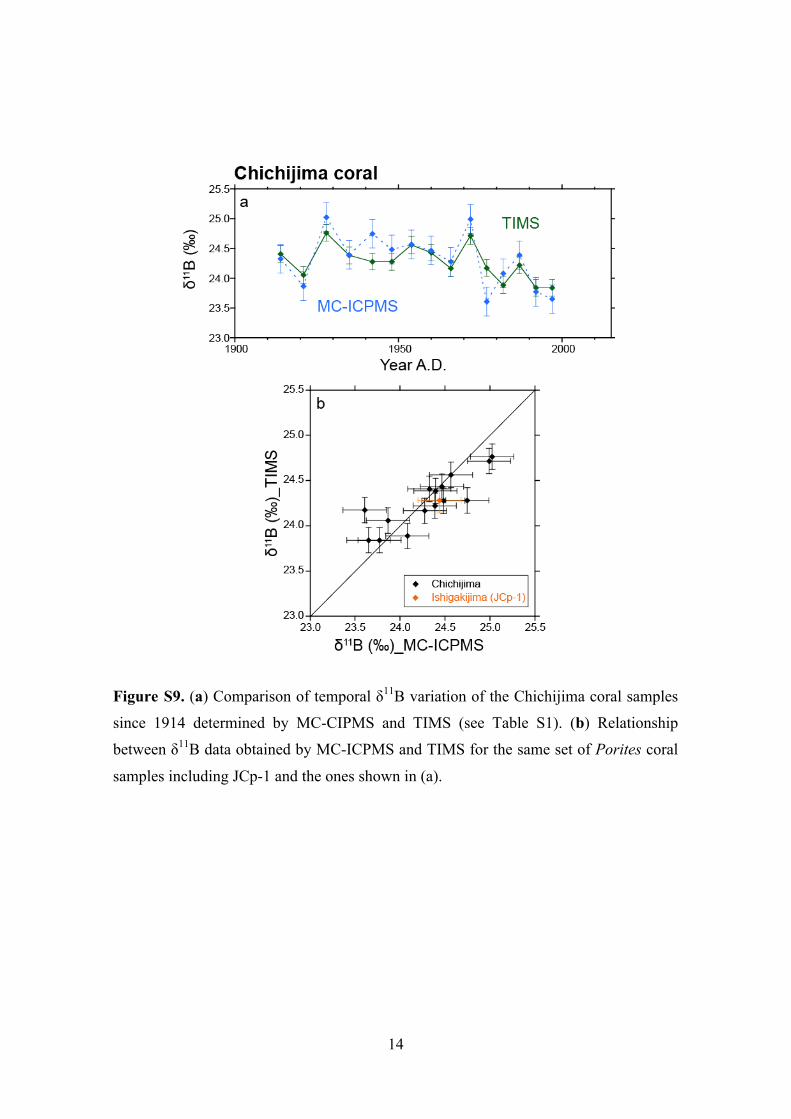
Figure S9. (a) Comparison of temporal δ11B variation of the Chichijima coral samples
since 1914 determined by MC-CIPMS and TIMS (see Table S1). (b) Relationship
between δ11B data obtained by MC-ICPMS and TIMS for the same set of Porites coral
samples including JCp-1 and the ones shown in (a).
15
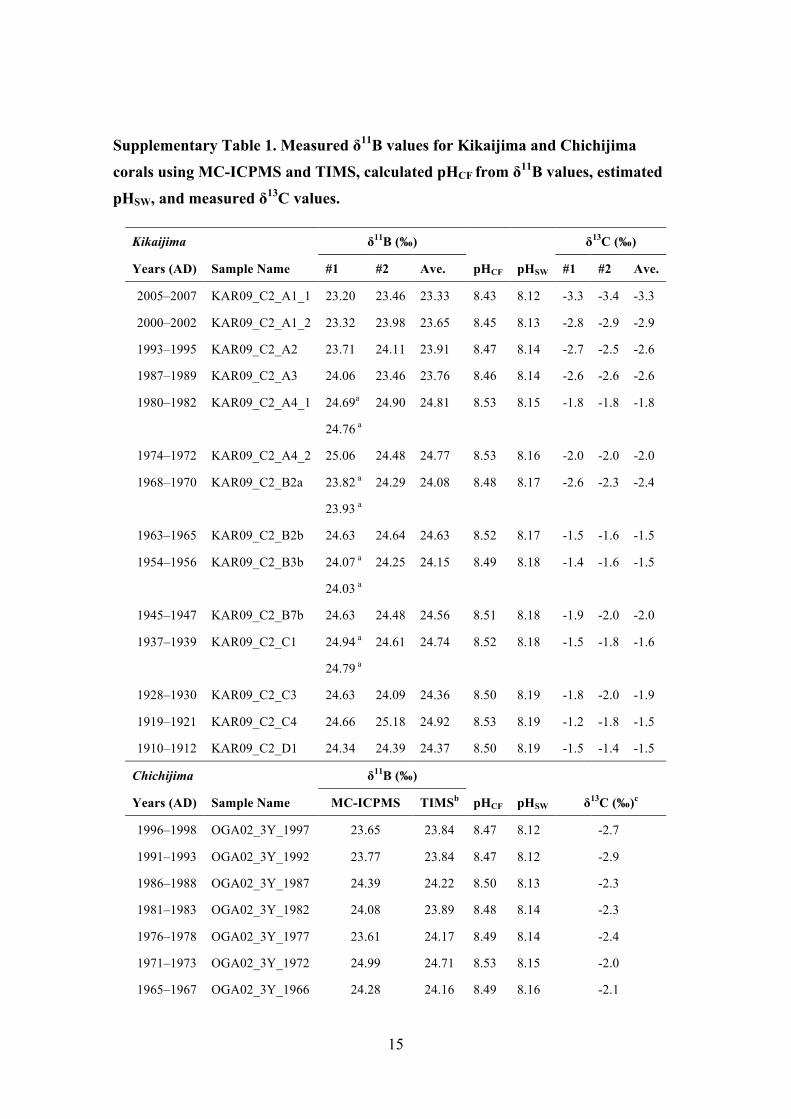
Supplementary Table 1. Measured δ11B values for Kikaijima and Chichijima
corals using MC-ICPMS and TIMS, calculated pHCF from δ11B values, estimated
pHSW, and measured δ13C values.
Kikaijima δ11B (‰) δ13C (‰)
Years (AD) Sample Name #1 #2 Ave. pHCF pHSW #1 #2 Ave.
2005–2007 KAR09_C2_A1_1 23.20 23.46 23.33 8.43 8.12 -3.3 -3.4 -3.3
2000–2002 KAR09_C2_A1_2 23.32 23.98 23.65 8.45 8.13 -2.8 -2.9 -2.9
1993–1995 KAR09_C2_A2 23.71 24.11 23.91 8.47 8.14 -2.7 -2.5 -2.6
1987–1989 KAR09_C2_A3 24.06 23.46 23.76 8.46 8.14 -2.6 -2.6 -2.6
1980–1982 KAR09_C2_A4_1 24.69a 24.90 24.81 8.53 8.15 -1.8 -1.8 -1.8
24.76 a
1974–1972 KAR09_C2_A4_2 25.06 24.48 24.77 8.53 8.16 -2.0 -2.0 -2.0
1968–1970 KAR09_C2_B2a 23.82 a 24.29 24.08 8.48 8.17 -2.6 -2.3 -2.4
23.93 a
1963–1965 KAR09_C2_B2b 24.63 24.64 24.63 8.52 8.17 -1.5 -1.6 -1.5
1954–1956 KAR09_C2_B3b 24.07 a 24.25 24.15 8.49 8.18 -1.4 -1.6 -1.5
24.03 a
1945–1947 KAR09_C2_B7b 24.63 24.48 24.56 8.51 8.18 -1.9 -2.0 -2.0
1937–1939 KAR09_C2_C1 24.94 a 24.61 24.74 8.52 8.18 -1.5 -1.8 -1.6
24.79 a
1928–1930 KAR09_C2_C3 24.63 24.09 24.36 8.50 8.19 -1.8 -2.0 -1.9
1919–1921 KAR09_C2_C4 24.66 25.18 24.92 8.53 8.19 -1.2 -1.8 -1.5
1910–1912 KAR09_C2_D1 24.34 24.39 24.37 8.50 8.19 -1.5 -1.4 -1.5
Chichijima δ11B (‰)
Years (AD) Sample Name MC-ICPMS TIMSb pHCF pHSW δ13C (‰)c
1996–1998 OGA02_3Y_1997 23.65 23.84 8.47 8.12 -2.7
1991–1993 OGA02_3Y_1992 23.77 23.84 8.47 8.12 -2.9
1986–1988 OGA02_3Y_1987 24.39 24.22 8.50 8.13 -2.3
1981–1983 OGA02_3Y_1982 24.08 23.89 8.48 8.14 -2.3
1976–1978 OGA02_3Y_1977 23.61 24.17 8.49 8.14 -2.4
1971–1973 OGA02_3Y_1972 24.99 24.71 8.53 8.15 -2.0
1965–1967 OGA02_3Y_1966 24.28 24.16 8.49 8.16 -2.1
16
1959–1961 OGA02_3Y_1960 24.47 24.43 8.51 8.16 -2.4
1953–1955 OGA02_3Y_1954 24.57 24.56 8.52 8.16 -2.3
1947–1949 OGA02_3Y_1948 24.48 24.28 8.50 8.16 -2.4
1941–1943 OGA02_3Y_1942 24.75 24.28 8.50 8.17 -2.0
1934–1936 OGA02_3Y_1935 24.40 24.38 8.51 8.17 -1.8
1927–1929 OGA02_3Y_1928 25.02 24.76 8.53 8.17 -2.0
1920–1922 OGA02_3Y_1921 23.87 24.06 8.49 8.17 -2.1
1913–1915 OGA02_3Y_1914 24.33 24.41 8.51 8.17 -2.0
(a) The same sample solution was measured by MC-ICPMS twice.
(b) TIMS data are from Kubota et al.19
(c) Calculated using sub-monthly δ13C records reported by Felis et al.10
17
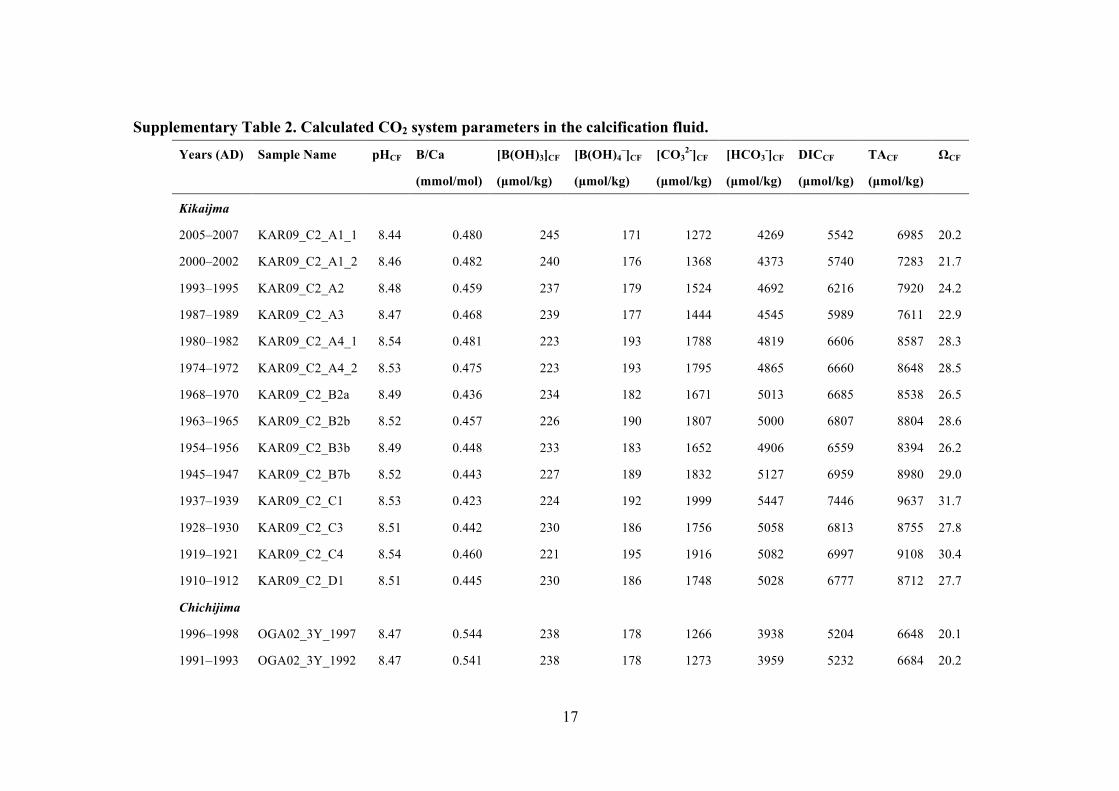
Supplementary Table 2. Calculated CO2 system parameters in the calcification fluid.
Years (AD) Sample Name pHCF B/Ca
(mmol/mol)
[B(OH)3]CF
(µmol/kg)
[B(OH)4–]CF
(µmol/kg)
[CO32-]CF
(µmol/kg)
[HCO3-]CF
(µmol/kg)
DICCF
(µmol/kg)
TACF
(µmol/kg)
ΩCF
Kikaijma
2005–2007 KAR09_C2_A1_1 8.44 0.480 245 171 1272 4269 5542 6985 20.2
2000–2002 KAR09_C2_A1_2 8.46 0.482 240 176 1368 4373 5740 7283 21.7
1993–1995 KAR09_C2_A2 8.48 0.459 237 179 1524 4692 6216 7920 24.2
1987–1989 KAR09_C2_A3 8.47 0.468 239 177 1444 4545 5989 7611 22.9
1980–1982 KAR09_C2_A4_1 8.54 0.481 223 193 1788 4819 6606 8587 28.3
1974–1972 KAR09_C2_A4_2 8.53 0.475 223 193 1795 4865 6660 8648 28.5
1968–1970 KAR09_C2_B2a 8.49 0.436 234 182 1671 5013 6685 8538 26.5
1963–1965 KAR09_C2_B2b 8.52 0.457 226 190 1807 5000 6807 8804 28.6
1954–1956 KAR09_C2_B3b 8.49 0.448 233 183 1652 4906 6559 8394 26.2
1945–1947 KAR09_C2_B7b 8.52 0.443 227 189 1832 5127 6959 8980 29.0
1937–1939 KAR09_C2_C1 8.53 0.423 224 192 1999 5447 7446 9637 31.7
1928–1930 KAR09_C2_C3 8.51 0.442 230 186 1756 5058 6813 8755 27.8
1919–1921 KAR09_C2_C4 8.54 0.460 221 195 1916 5082 6997 9108 30.4
1910–1912 KAR09_C2_D1 8.51 0.445 230 186 1748 5028 6777 8712 27.7
Chichijima
1996–1998 OGA02_3Y_1997 8.47 0.544 238 178 1266 3938 5204 6648 20.1
1991–1993 OGA02_3Y_1992 8.47 0.541 238 178 1273 3959 5232 6684 20.2
18
1986–1988 OGA02_3Y_1987 8.50 0.548 232 184 1372 4032 5403 6959 21.7
1981–1983 OGA02_3Y_1982 8.48 0.540 237 179 1289 3980 5269 6737 20.4
1976–1978 OGA02_3Y_1977 8.49 0.528 233 183 1408 4169 5578 7169 22.3
1971–1973 OGA02_3Y_1972 8.53 0.564 224 192 1490 4075 5565 7247 23.6
1965–1967 OGA02_3Y_1966 8.49 0.539 233 183 1378 4085 5464 7025 21.8
1959–1961 OGA02_3Y_1960 8.51 0.524 229 187 1504 4288 5793 7484 23.8
1953–1955 OGA02_3Y_1954 8.52 0.531 227 189 1529 4276 5805 7523 24.2
1947–1949 OGA02_3Y_1948 8.50 0.523 231 185 1455 4242 5697 7337 23.1
1941–1943 OGA02_3Y_1942 8.50 0.521 231 185 1463 4264 5726 7374 23.2
1934–1936 OGA02_3Y_1935 8.51 0.522 229 187 1494 4288 5782 7463 23.7
1927–1929 OGA02_3Y_1928 8.53 0.553 224 192 1537 4173 5710 7439 24.4
1920–1922 OGA02_3Y_1921 8.49 0.524 234 182 1381 4159 5540 7102 21.9
1913–1915 OGA02_3Y_1914 8.51 0.542 229 187 1447 4141 5588 7222 22.9
19
Supplementary References
46. Holcomb, M., DeCarlo, T. M., Gaetani, G. A., & McCulloch, M. Factors affecting
B/Ca ratios in synthetic aragonite. Chem. Geol. 437, 67–76 (2016).
47. Millero, F. J. The thermodynamics of the carbonate system in sea- water. Geochim.
Cosmochim. Acta 43, 1651–16 (1979).
48. Millero, F. J., Feistel, R., Wright, D. G. & McDougall, T. J. The composition of
standard seawater and the definition of the reference-composition salinity scale.
Deep-Sea Res. I 55, 50–72 (2008).
49. Mucci, A. & Morse, J. W. The incorporation of Mg2+ and Sr2+ into calcite
overgrowths: Influences of growth rate and solution composition. Geochim.
Cosmochim. Acta 47, 217–233 (1983).
50. Lueker, T. J., Dickson, A. G. & Keeling, C. D. Ocean pCO2 calculated from
dissolved inorganic carbon, alkalinity, and equations for K1 and K2: validation
based on laboratory measurements of CO2 in gas and seawater at equilibrium. Mar.
Chem. 70, 105–119 (2000).
51. Dickson, A. G. Thermodynamics of the dissociation of boric acid in synthetic
seawater from 273.15 to 318.15 K. Deep-Sea Res. 37, 755–766 (1990).
52. Mavromatis, V., Montouillout, V., Noireaux, J., Gaillardet, J. & Schott, J.
Characterization of boron incorporation and speciation in calcite and aragonite
from co-precipitation experiments under controlled pH, temperature and
precipitation rate. Geochim. Cosmochim. Acta 150, 299–313 (2015).
53. Hemming, N. G. & Hanson, G. N. Boron isotopic composition and concentration
in modern marine carbonates. Geochim. Cosmochim. Acta 56, 537–543 (1992).
54. Robbins, L. L., Hansen, M. E., Kleypas, J. A. & Meylan, S. C. CO2calc—A
user-friendly seawater carbon calculator for Windows, Max OS X, and iOS
(iPhone). U.S. Geological Survey Open-File Report 2010–1280 (2010).
55. Carton, J. A. & Giese, B. S. A Reanalysis of Ocean Climate Using Simple Ocean
Data Assimilation (SODA). Mon. Wea. Rev. 136, 2999–3017 (2008).
56. Huang, B. et al. Extended reconstructed sea surface temperature version 4
(ERSST.v4). Part I: upgrades and intercomparisons. J. Clim. 28, 911–930 (2015).
57. Maritime Safety Agency. Submarine structural chart, bathymetric chart, report of
survey (Chichijima), basic map of the sea in coastal waters, Scale 1:50,000.
<http://www.jha.or.jp/shop/>, (1998) Date of access: 27/04/2017
20
58. Maritime Safety Agency. Submarine structural chart, bathymetric chart, report of
survey (Eastern part of Amami Gunto), basic map of the sea in coastal waters,
Scale 1:200,000. <http://www.jha.or.jp/shop/>, (1982) Date of access: 27/04/2017