1 The Indian Automotive Industry A Perspective. 2 Global Auto Industry – An Analysis Indian Auto...
52
1 The Indian Automotive Industry A Perspective
-
Upload
lorenzo-streeter -
Category
Documents
-
view
217 -
download
3
Transcript of 1 The Indian Automotive Industry A Perspective. 2 Global Auto Industry – An Analysis Indian Auto...
1
The Indian Automotive Industry
A Perspective
2
• Global Auto Industry – An Analysis
• Indian Auto Industry
Two Wheelers
Three Wheelers
Passenger Cars
Commercial Vehicles
• Indian Auto Component Industry
• Emerging Opportunities
• Overview of Indian Economy
• TATA Motors – Organisation Structure
3
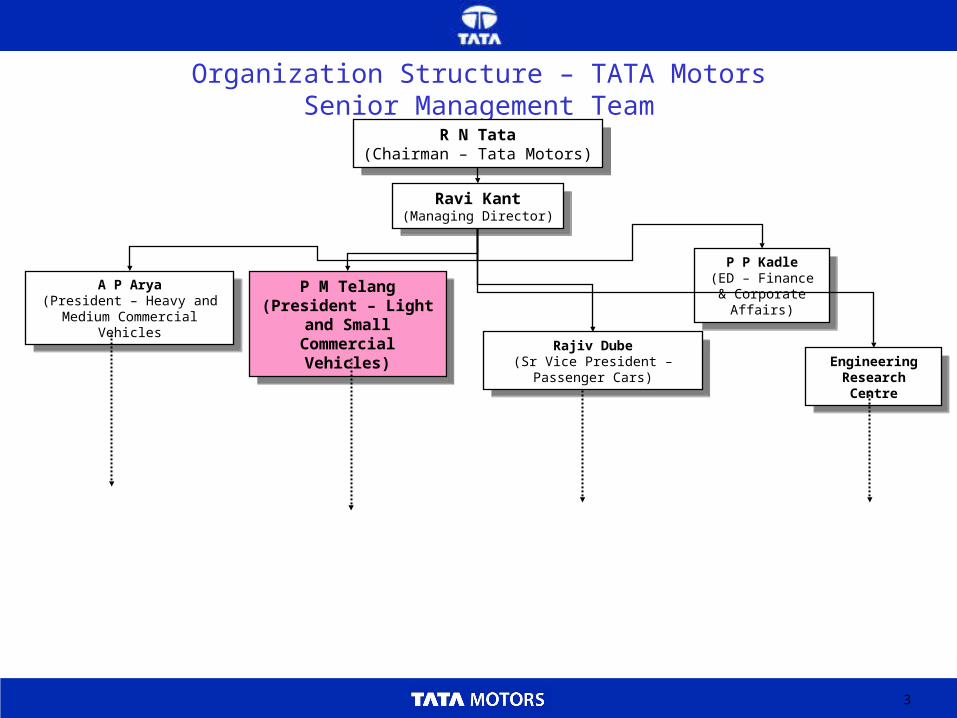
Organization Structure – TATA MotorsSenior Management Team
R N Tata(Chairman – Tata Motors)
R N Tata(Chairman – Tata Motors)
Ravi Kant(Managing Director)
Ravi Kant(Managing Director)
Rajiv Dube(Sr Vice President – Passenger
Cars)
Rajiv Dube(Sr Vice President – Passenger
Cars)
P P Kadle(ED – Finance &
Corporate Affairs)
P P Kadle(ED – Finance &
Corporate Affairs)P M Telang(President – Light and
Small Commercial Vehicles)
P M Telang(President – Light and
Small Commercial Vehicles)
A P Arya(President – Heavy and Medium
Commercial Vehicles
A P Arya(President – Heavy and Medium
Commercial Vehicles
Engineering Research Centre
Engineering Research Centre
4
• Global Auto Industry – An Analysis
• Indian Auto Industry
Two Wheelers
Three Wheelers
Passenger Cars
Commercial Vehicles
• Indian Auto Component Industry
• Emerging Opportunities
• Overview of Indian Economy
• TATA Motors – Organisation Structure
5
0
10000
20000
30000
40000
50000
60000
70000
1997 1998 1999 2000 2001 2002 2003 2004Year
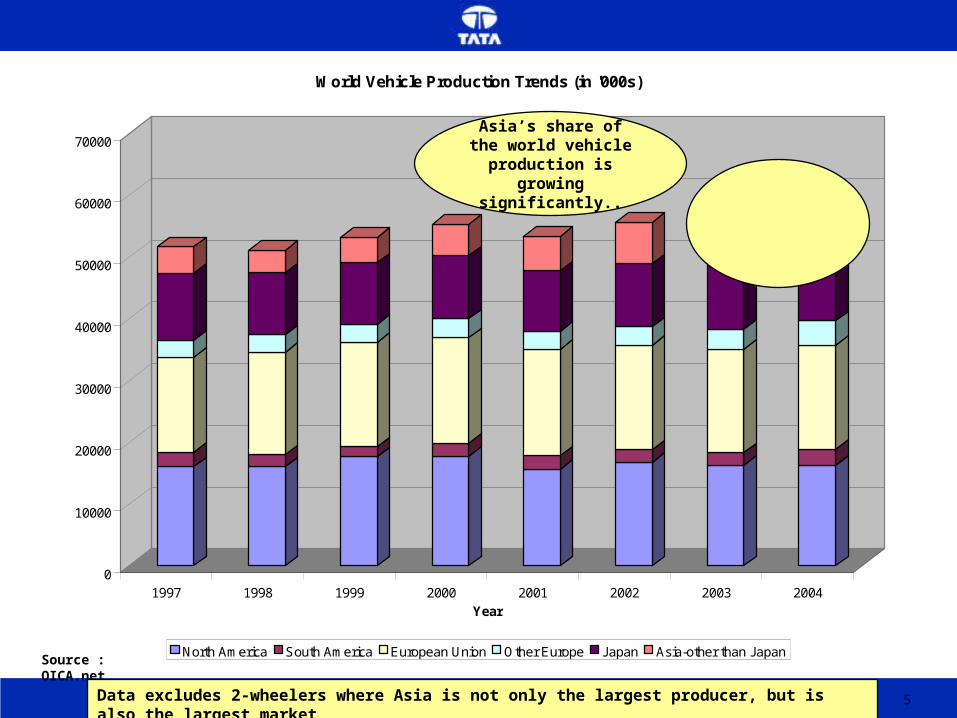
World Vehicle Production Trends (in '000s)
North America South America European Union Other Europe Japan Asia-other than JapanSource : OICA.net
Asia’s share of the world vehicle
production is growing significantly..
Data excludes 2-wheelers where Asia is not only the largest producer, but is also the largest market
6
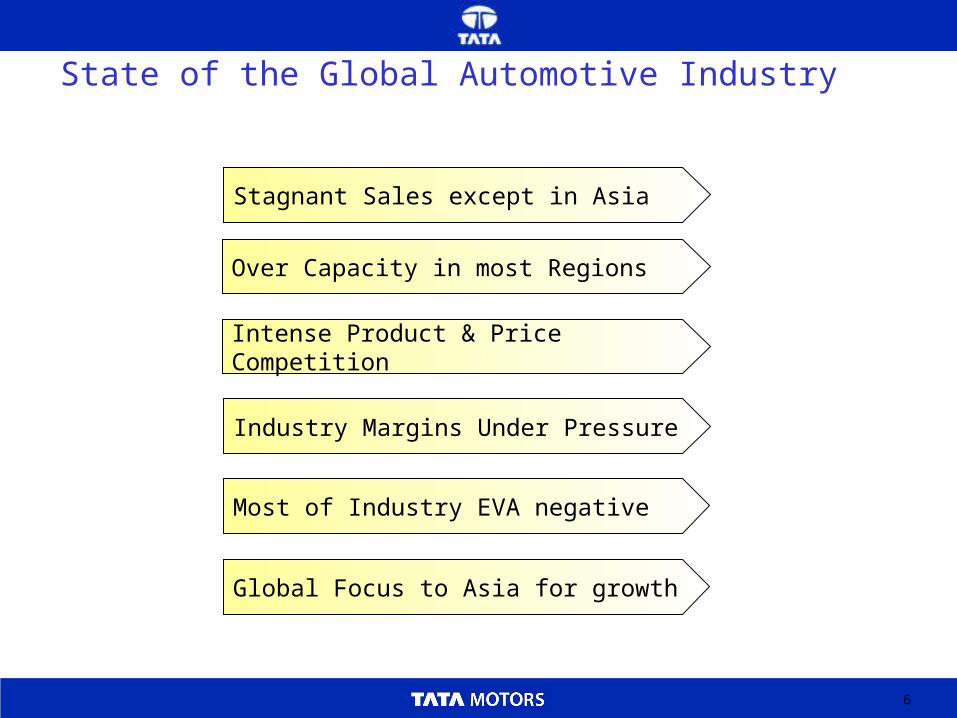
State of the Global Automotive Industry
Intense Product & Price Competition
Stagnant Sales except in Asia
Industry Margins Under Pressure
Over Capacity in most Regions
Most of Industry EVA negative
Global Focus to Asia for growth
7
• Global Auto Industry – An Analysis
• Indian Auto Industry
Two Wheelers
Three Wheelers
Passenger Cars
Commercial Vehicles
• Indian Auto Component Industry
• Emerging Opportunities
• Overview of Indian Economy
• TATA Motors – Organisation Structure
8
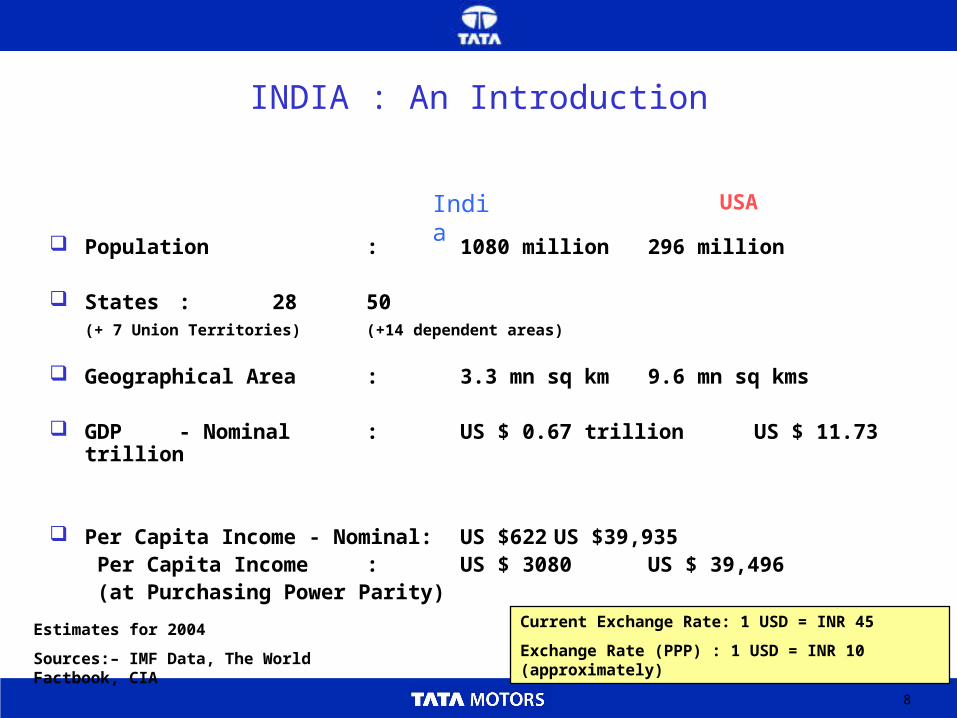
INDIA : An Introduction
Population : 1080 million 296 million
States : 28 50(+ 7 Union Territories) (+14 dependent areas)
Geographical Area : 3.3 mn sq km 9.6 mn sq kms
GDP - Nominal : US $ 0.67 trillion US $ 11.73 trillion
Per Capita Income - Nominal: US $622 US $39,935 Per Capita Income : US $ 3080 US $ 39,496 (at Purchasing Power Parity)
India USA
Estimates for 2004
Sources:– IMF Data, The World Factbook, CIA
Current Exchange Rate: 1 USD = INR 45
Exchange Rate (PPP) : 1 USD = INR 10 (approximately)
9
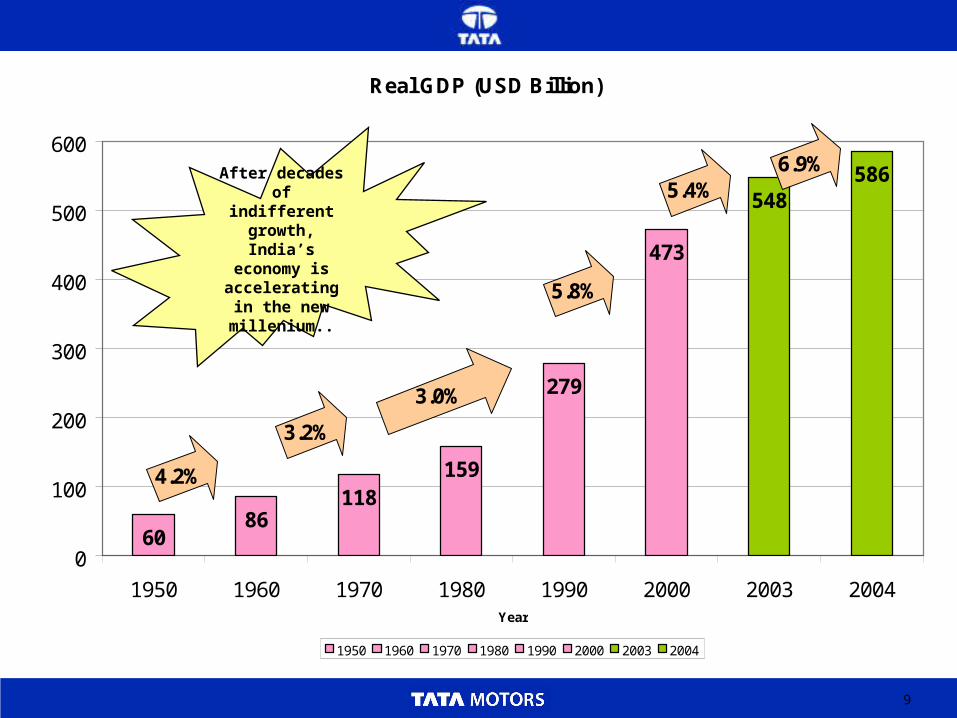
Real GDP (USD Billion)
6086
118159
279
473
548586
0
100
200
300
400
500
600
1950 1960 1970 1980 1990 2000 2003 2004Year
1950 1960 1970 1980 1990 2000 2003 2004
4.2%
3.2%
3.0%
5.8%
5.4%6.9%
After decades of indifferent
growth, India’s economy is
accelerating in the new
millenium..
10
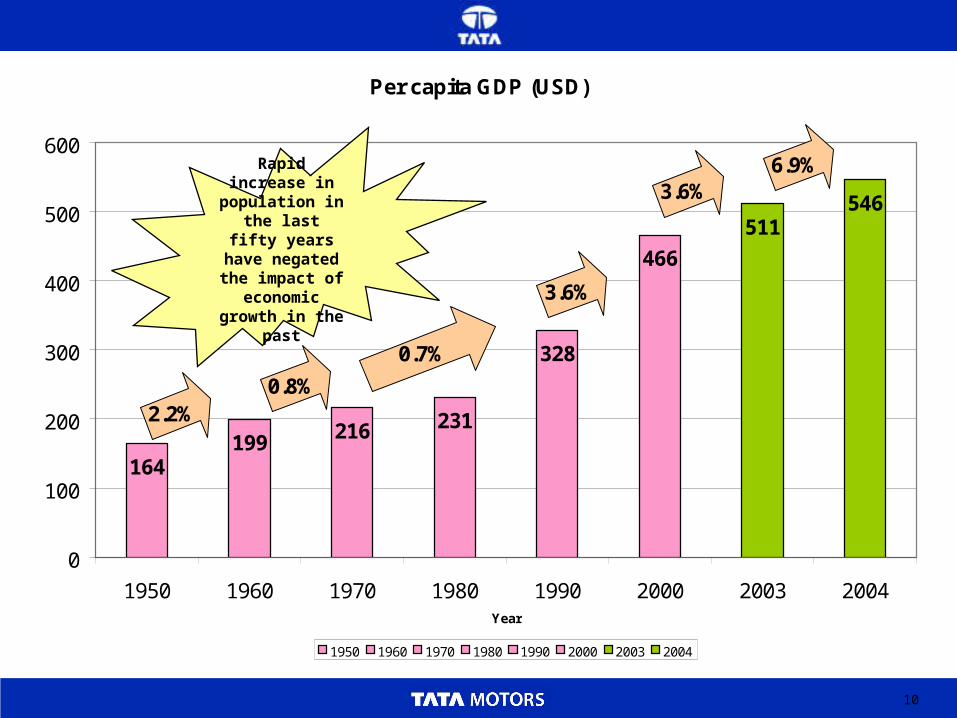
Per capita GDP (USD)
164199 216 231
328
466
511546
0
100
200
300
400
500
600
1950 1960 1970 1980 1990 2000 2003 2004Year
1950 1960 1970 1980 1990 2000 2003 2004
2.2%0.8%
0.7%
3.6%
3.6%6.9%
Rapid increase in population in the
last fifty years have negated the
impact of economic growth
in the past
11
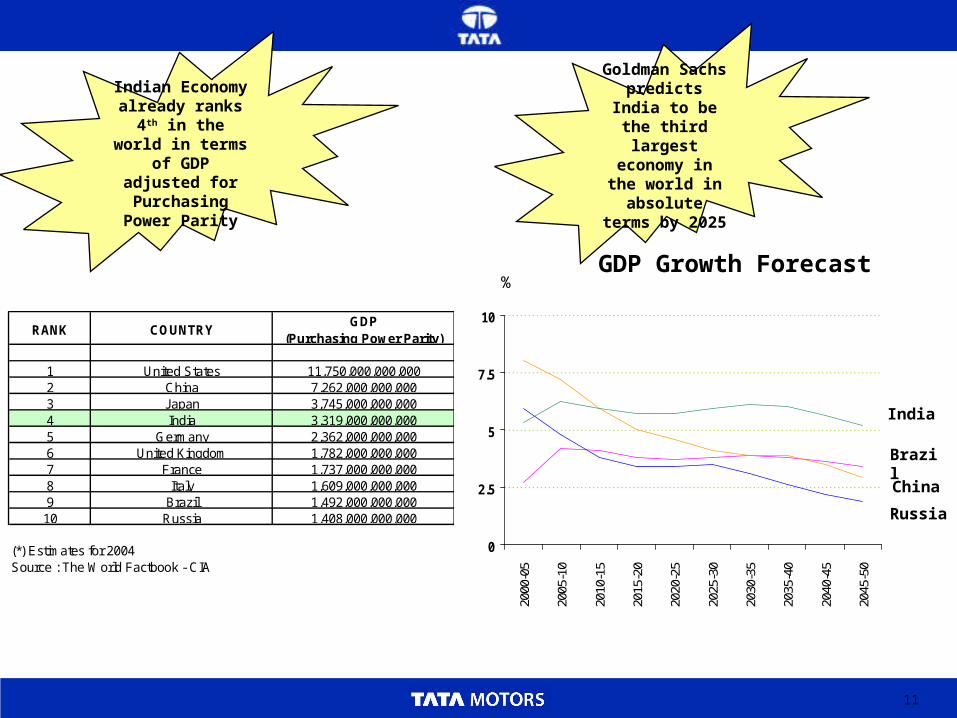
RANK COUNTRYGDP
(Purchasing Power Parity)
1 United States 11,750,000,000,0002 China 7,262,000,000,0003 Japan 3,745,000,000,0004 India 3,319,000,000,0005 Germany 2,362,000,000,0006 United Kingdom 1,782,000,000,0007 France 1,737,000,000,0008 Italy 1,609,000,000,0009 Brazil 1,492,000,000,000
10 Russia 1,408,000,000,000
(*) Estimates for 2004Source : The World Factbook - CIA
Indian Economy already ranks 4th in the world in terms of GDP adjusted for
Purchasing Power Parity
Goldman Sachs predicts India to
be the third largest economy
in the world in absolute terms
by 2025
GDP Growth Forecast%
0
2.5
5
7.5
10
2000
-05
2005
-10
2010
-15
2015
-20
2020
-25
2025
-30
2030
-35
2035
-40
2040
-45
2045
-50
India
Brazil
China
Russia
12
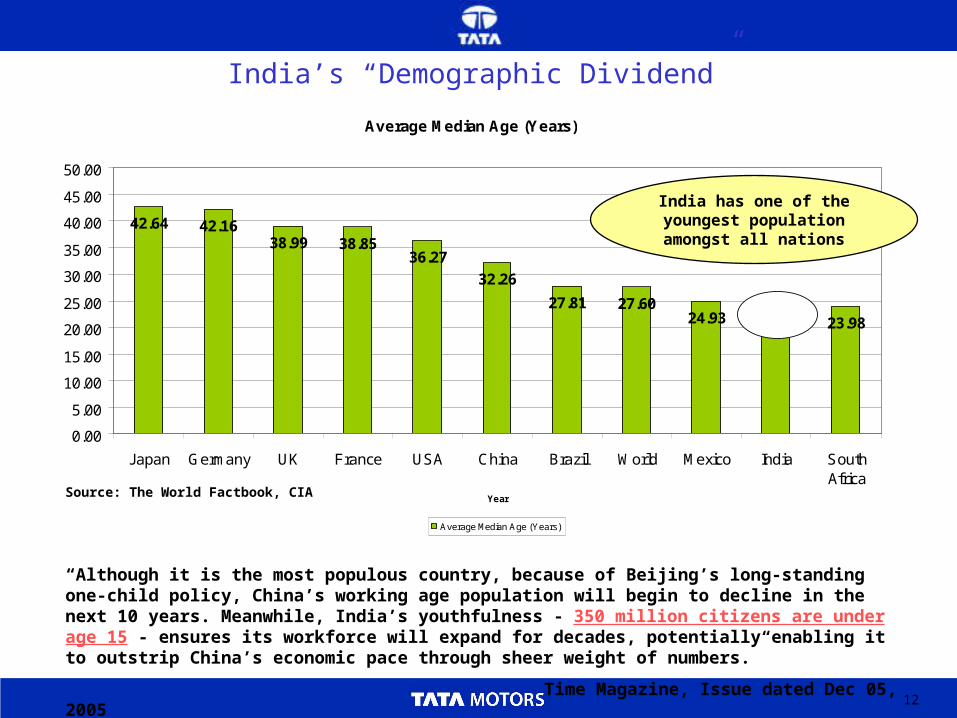
Average Median Age (Years)
42.64 42.1638.99 38.85
36.27
32.26
27.81 27.6024.93 24.66 23.98
0.00
5.00
10.00
15.00
20.00
25.00
30.00
35.00
40.00
45.00
50.00
Japan Germany UK France USA China Brazil World Mexico India SouthAfrica
Year
Average Median Age (Years)
Source: The World Factbook, CIA
“Although it is the most populous country, because of Beijing’s long-standing one-child policy, China’s working age population will begin to decline in the next 10 years. Meanwhile, India’s youthfulness - 350 million citizens are under age 15 - ensures its workforce will expand for decades, potentially enabling it to outstrip China’s economic pace through sheer weight of numbers.”
Time Magazine, Issue dated Dec 05, 2005
India’s “Demographic Dividend”
India has one of the youngest population amongst all nations
13
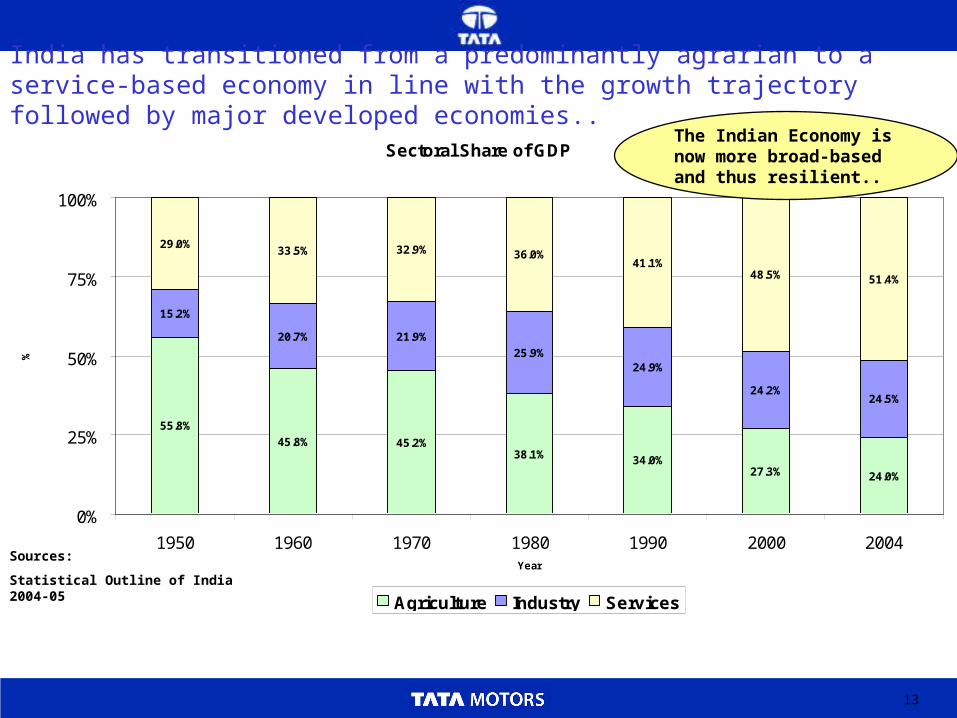
Sectoral Share of GDP
55.8%
45.8% 45.2%38.1% 34.0%
27.3% 24.0%
15.2%
20.7% 21.9%
25.9%24.9%
24.2%24.5%
29.0%33.5% 32.9% 36.0%
41.1%48.5% 51.4%
0%
25%
50%
75%
100%
1950 1960 1970 1980 1990 2000 2004Year
%
Agriculture Industry Services
Sources:
Statistical Outline of India 2004-05
India has transitioned from a predominantly agrarian to a service-based economy in line with the growth trajectory followed by major developed economies..
The Indian Economy is now more broad-based and thus resilient..
14
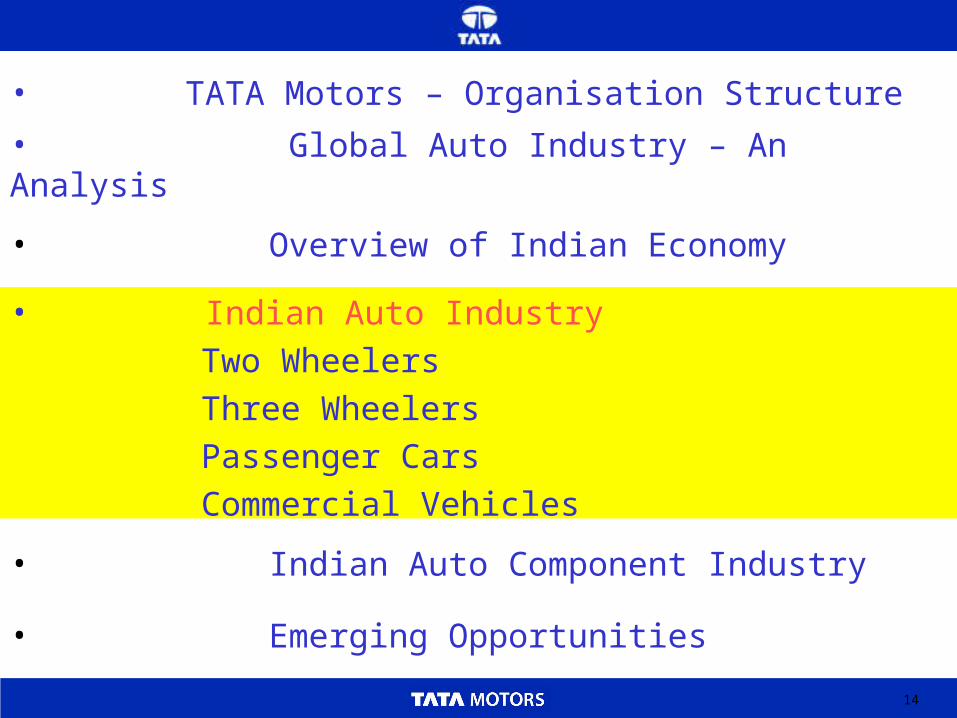
• Global Auto Industry – An Analysis
• Indian Auto Industry
Two Wheelers
Three Wheelers
Passenger Cars
Commercial Vehicles
• Indian Auto Component Industry
• Emerging Opportunities
• Overview of Indian Economy
• TATA Motors – Organisation Structure
15
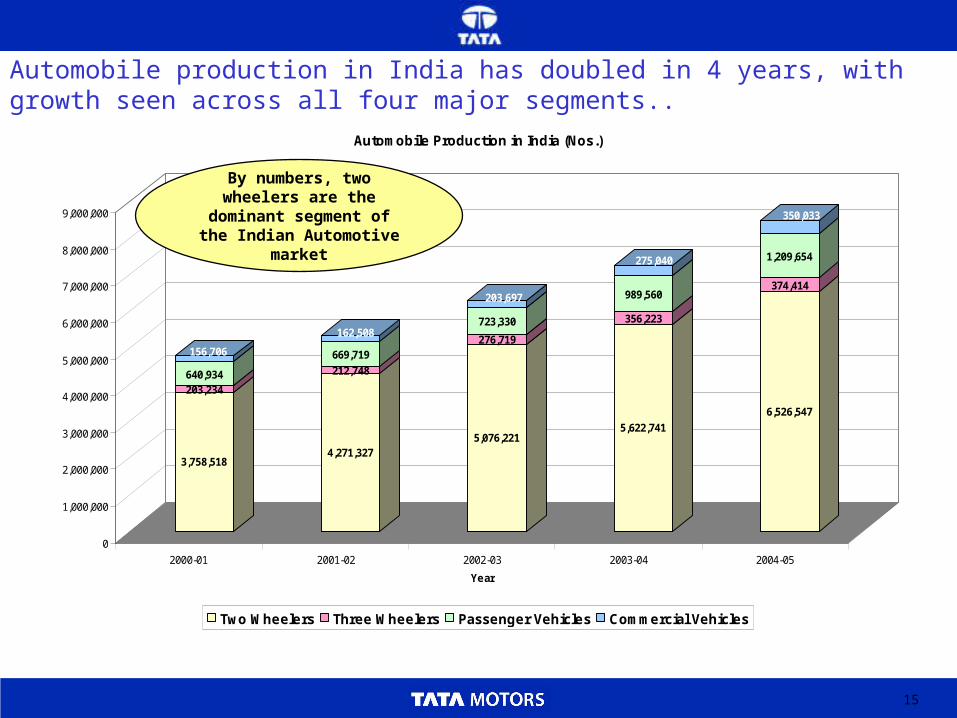
3,758,518
203,234640,934
156,706
4,271,327
212,748
669,719
162,508
5,076,221
276,719
723,330
203,697
5,622,741
356,223
989,560
275,040
6,526,547
374,414
1,209,654
350,033
0
1,000,000
2,000,000
3,000,000
4,000,000
5,000,000
6,000,000
7,000,000
8,000,000
9,000,000
2000-01 2001-02 2002-03 2003-04 2004-05
Year
Automobile Production in India (Nos.)
Two Wheelers Three Wheelers Passenger Vehicles Commercial Vehicles
Automobile production in India has doubled in 4 years, with growth seen across all four major segments..
By numbers, two wheelers are the dominant segment of the Indian Automotive
market
16
In many ways, the Indian Automotive Market is unique
Harsher operating conditions pose unique challenges for product conceptualization, design and development: Road inadequacy and quality High Traffic density Poor Fuel quality & variety (Gasoline, Diesel, CNG & LPG)
Manufacturing complexity higher despite lower volumes compared to global standards Large product portfolios
Product obsolescence policies not articulated and enforced, entailing longer product life.
Firms able to maintain profitability even at low volumes.
17
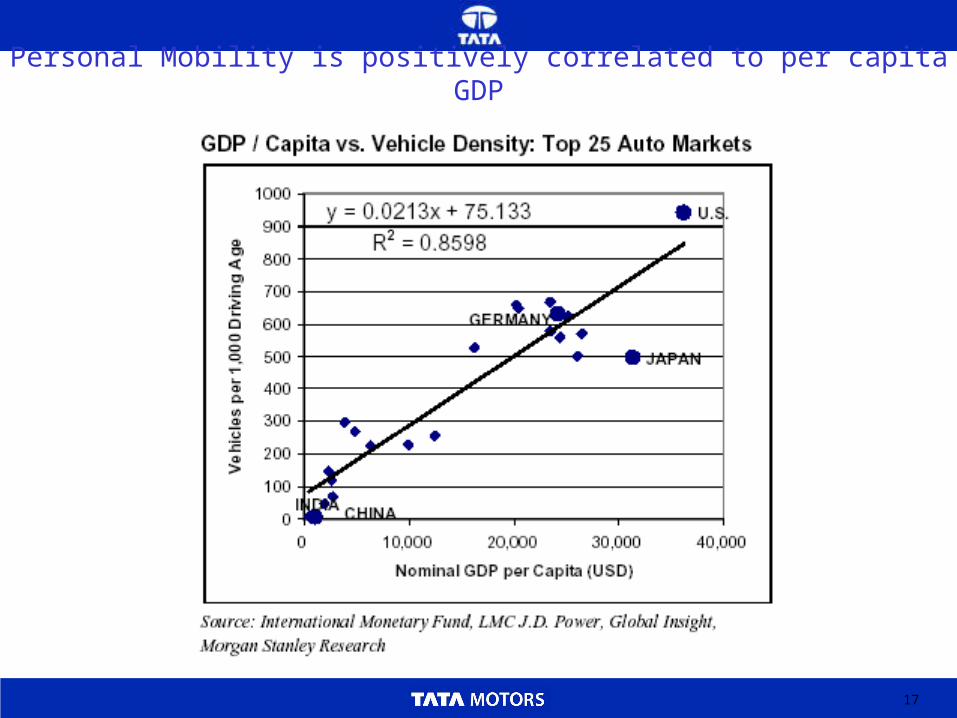
Personal Mobility is positively correlated to per capita GDP
18
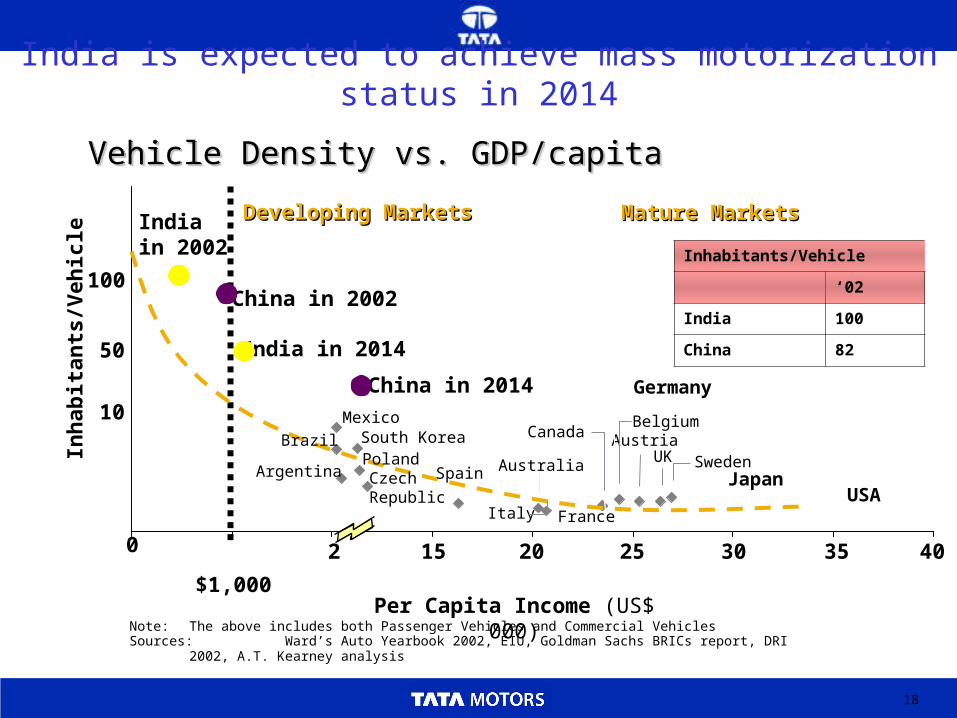
India is expected to achieve mass motorization status in 2014
Vehicle Density vs. GDP/capitaVehicle Density vs. GDP/capitaVehicle Density vs. GDP/capitaVehicle Density vs. GDP/capita
Note: The above includes both Passenger Vehicles and Commercial VehiclesSources: Ward’s Auto Yearbook 2002, EIU, Goldman Sachs BRICs report, DRI 2002, A.T. Kearney analysis
Inh
abit
ants
/Veh
icle
10
Per Capita Income (US$ 000)
50
100
Mature MarketsMature MarketsDeveloping MarketsDeveloping Markets
USAItaly
Brazil
MexicoSouth Korea
CzechRepublic
Spain
China in 2002
India in 2014
UKAustralia Sweden
Germany
Japan
Belgium
France
AustriaCanada
Poland
India in 2002
Argentina
2 20 25 30 3515
$1,000
0 40
China in 2014
Inhabitants/Vehicle
‘02
India 100
China 82
19
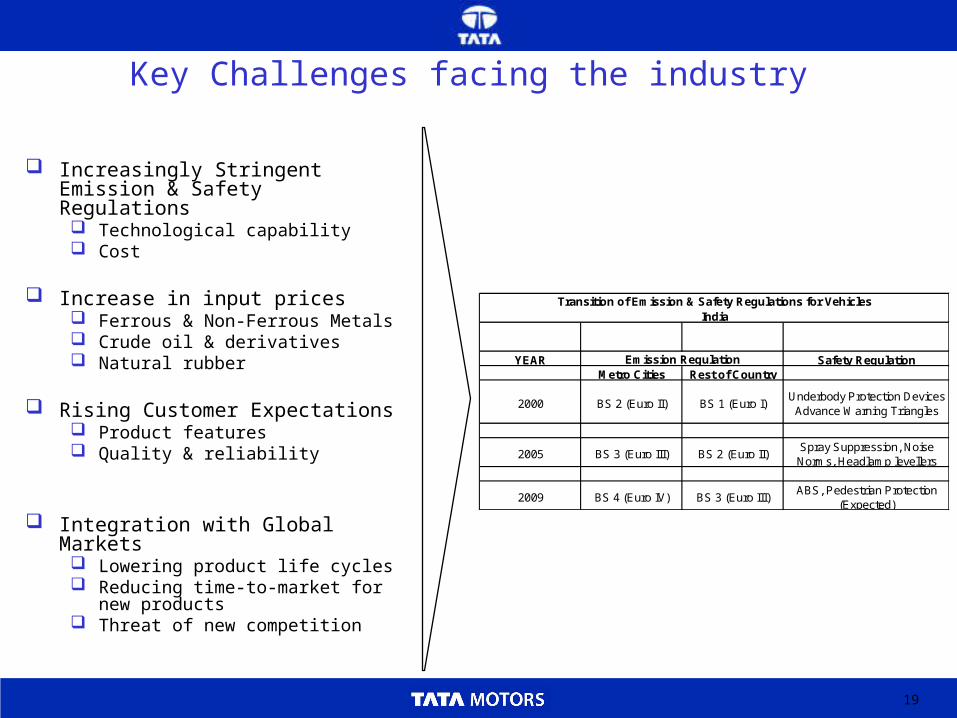
Key Challenges facing the industry
Increasingly Stringent Emission & Safety Regulations Technological capability Cost
Increase in input prices Ferrous & Non-Ferrous Metals Crude oil & derivatives Natural rubber
Rising Customer Expectations Product features Quality & reliability
Integration with Global Markets Lowering product life cycles Reducing time-to-market for new
products Threat of new competition
YEAR Safety RegulationMetro Cities Rest of Country
2000 BS 2 (Euro II) BS 1 (Euro I)Underbody Protection Devices
Advance Warning Triangles
2005 BS 3 (Euro III) BS 2 (Euro II)Spray Suppression, Noise Norms, Headlamp levellers
2009 BS 4 (Euro IV) BS 3 (Euro III)ABS, Pedestrian Protection
(Expected)
Transition of Emission & Safety Regulations for VehiclesIndia
Emission Regulation
20
• Global Auto Industry – An Analysis
• Indian Auto Industry
Two Wheelers
Three Wheelers
Passenger Cars
Commercial Vehicles
• Indian Auto Component Industry
• Emerging Opportunities
• Overview of Indian Economy
• TATA Motors – Organisation Structure
21
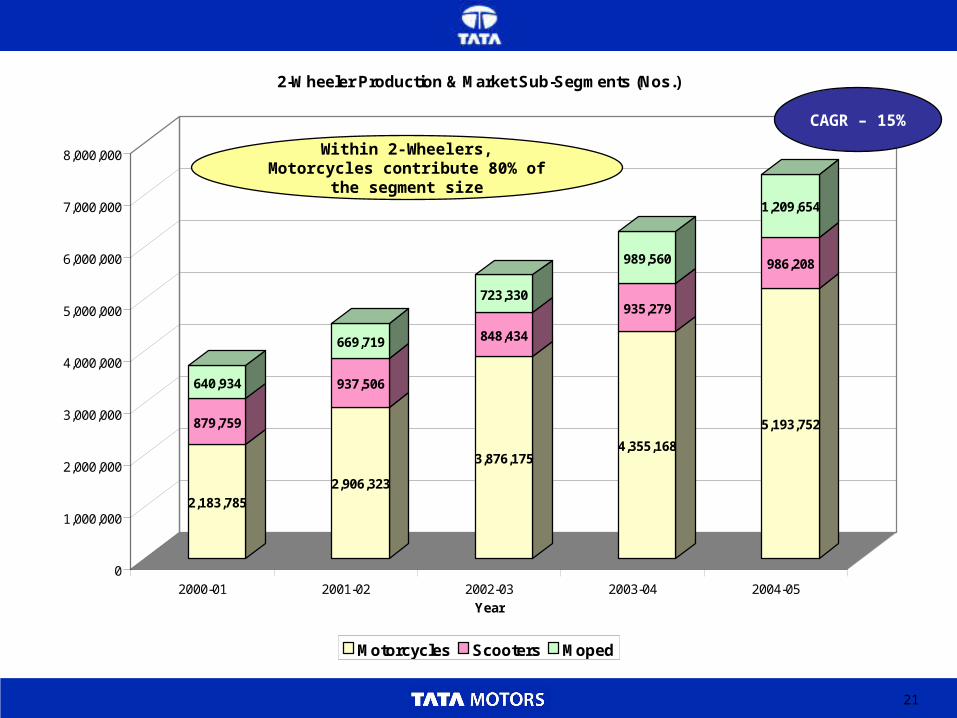
2,183,785
879,759
640,934
2,906,323
937,506
669,719
3,876,175
848,434
723,330
4,355,168
935,279
989,560
5,193,752
986,208
1,209,654
0
1,000,000
2,000,000
3,000,000
4,000,000
5,000,000
6,000,000
7,000,000
8,000,000
2000-01 2001-02 2002-03 2003-04 2004-05Year
2-Wheeler Production & Market Sub-Segments (Nos.)
Motorcycles Scooters Moped
Within 2-Wheelers, Motorcycles contribute 80% of the segment size
CAGR – 15%
22
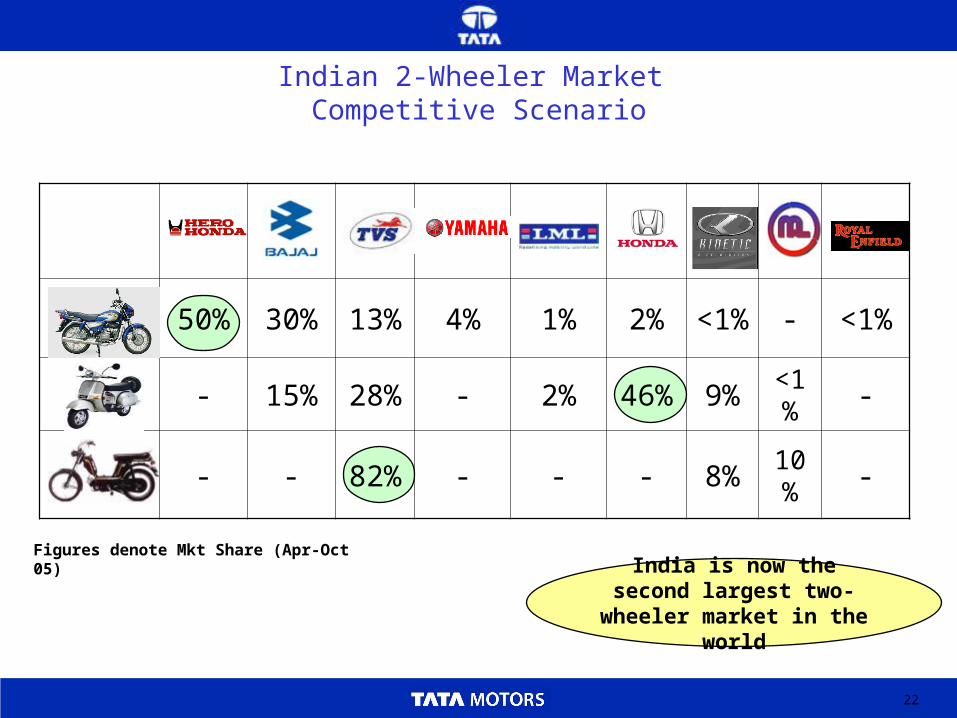
Indian 2-Wheeler Market Competitive Scenario
Motorcycle 50% 30% 13% 4% 1% 2% <1% - <1%
- 15% 28% - 2% 46% 9% <1% -
- - 82% - - - 8% 10% -
India is now the second largest two-wheeler market
in the world
Figures denote Mkt Share (Apr-Oct 05)
23
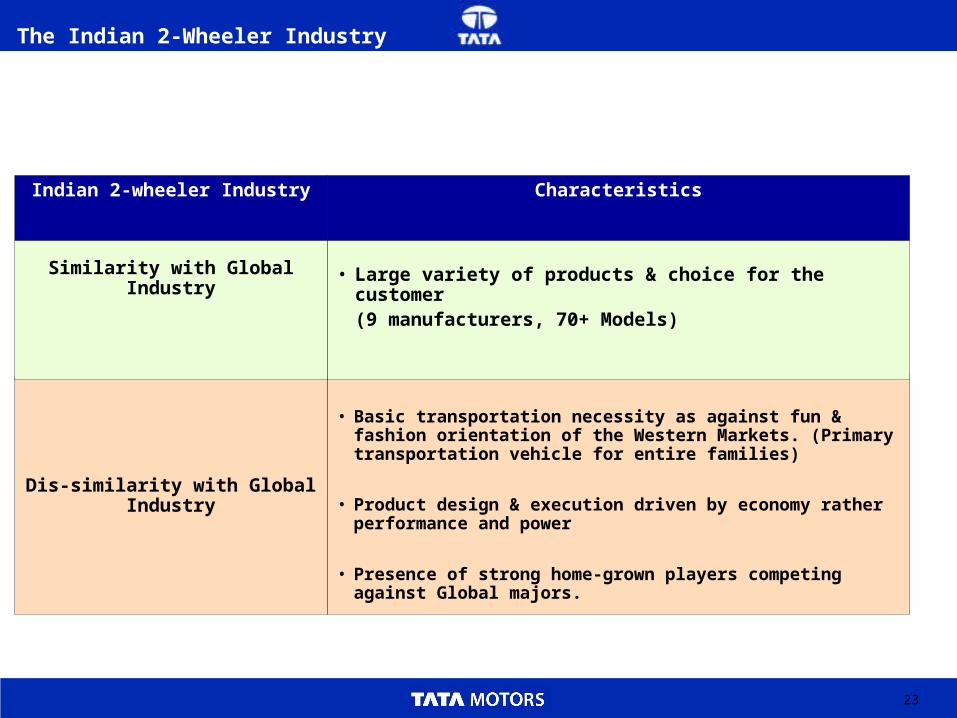
The Indian 2-Wheeler Industry
• Basic transportation necessity as against fun & fashion orientation of the Western Markets. (Primary transportation vehicle for entire families)
• Product design & execution driven by economy rather performance and power
• Presence of strong home-grown players competing against Global majors.
Dis-similarity with Global Industry
• Large variety of products & choice for the customer(9 manufacturers, 70+ Models)
Similarity with Global Industry
CharacteristicsIndian 2-wheeler Industry
24
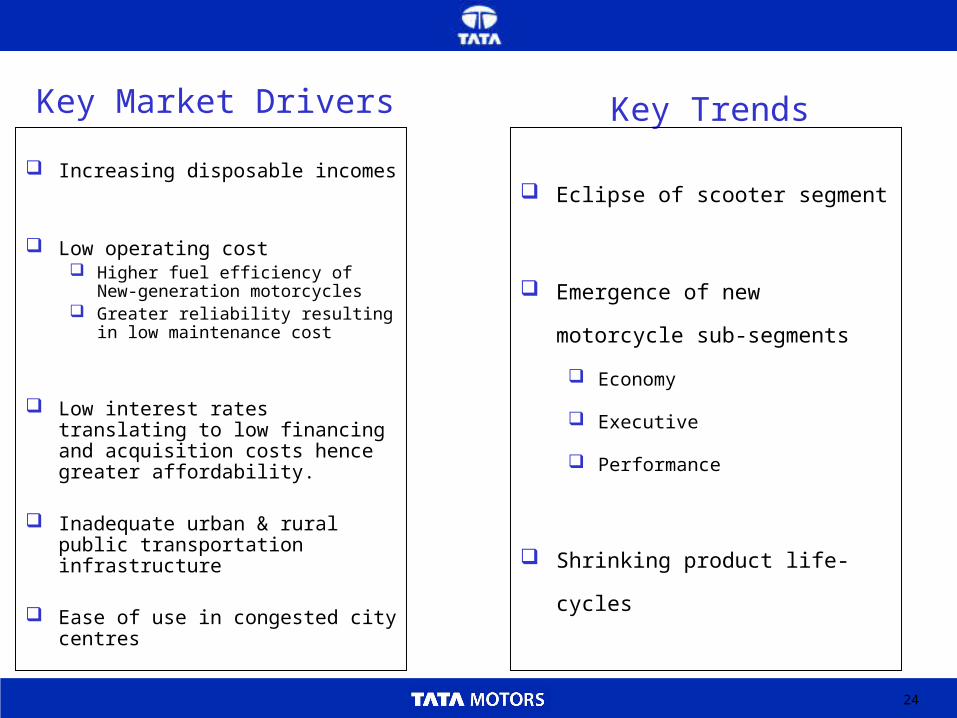
Key Market Drivers
Increasing disposable incomes
Low operating cost Higher fuel efficiency of New-
generation motorcycles Greater reliability resulting in low
maintenance cost
Low interest rates translating to low financing and acquisition costs hence greater affordability.
Inadequate urban & rural public transportation infrastructure
Ease of use in congested city centres
Key Trends
Eclipse of scooter segment
Emergence of new motorcycle sub-
segments
Economy
Executive
Performance
Shrinking product life-cycles
25
• Global Auto Industry – An Analysis
• Indian Auto Industry
Two Wheelers
Three Wheelers
Passenger Cars
Commercial Vehicles
• Indian Auto Component Industry
• Emerging Opportunities
• Overview of Indian Economy
• TATA Motors – Organisation Structure
26
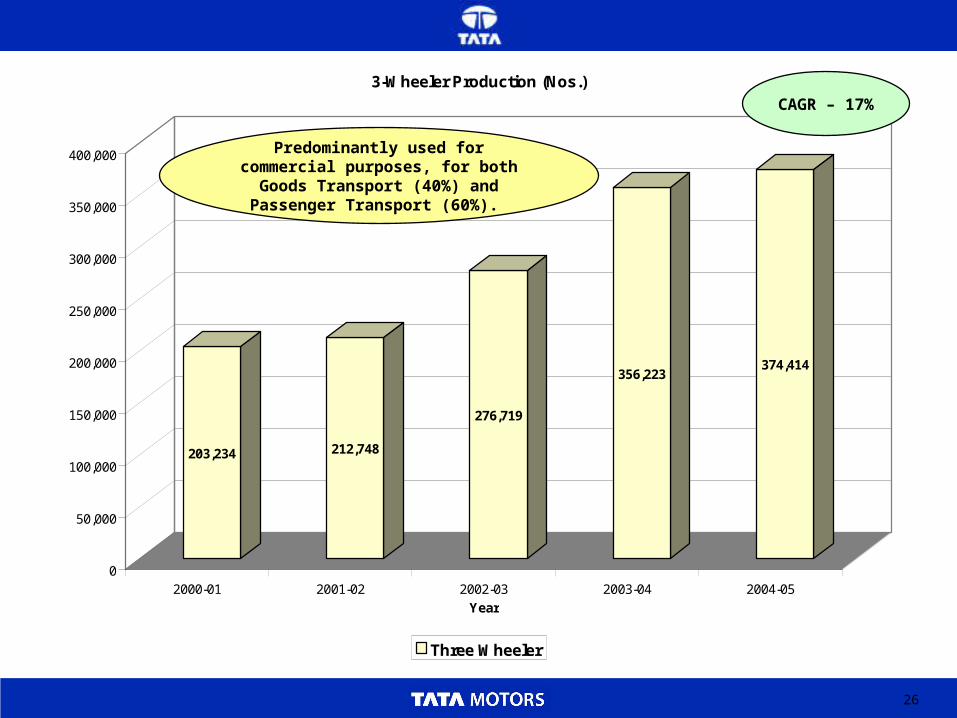
203,234 212,748
276,719
356,223374,414
0
50,000
100,000
150,000
200,000
250,000
300,000
350,000
400,000
2000-01 2001-02 2002-03 2003-04 2004-05Year
3-Wheeler Production (Nos.)
Three Wheeler
Predominantly used for commercial purposes, for both Goods Transport
(40%) and Passenger Transport (60%).
CAGR – 17%
27
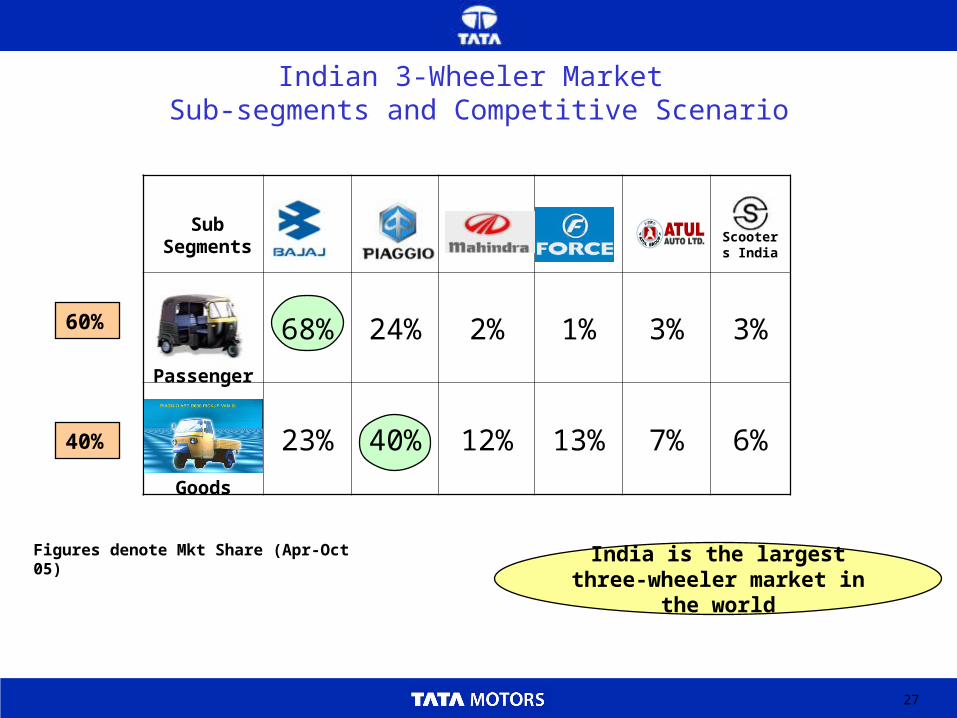
Indian 3-Wheeler Market Sub-segments and Competitive Scenario
68% 24% 2% 1% 3% 3%
23% 40% 12% 13% 7% 6%
India is the largest three-wheeler market in the world
Passenger
Goods
Scooters India
60%
40%
Sub Segments
Figures denote Mkt Share (Apr-Oct 05)
28
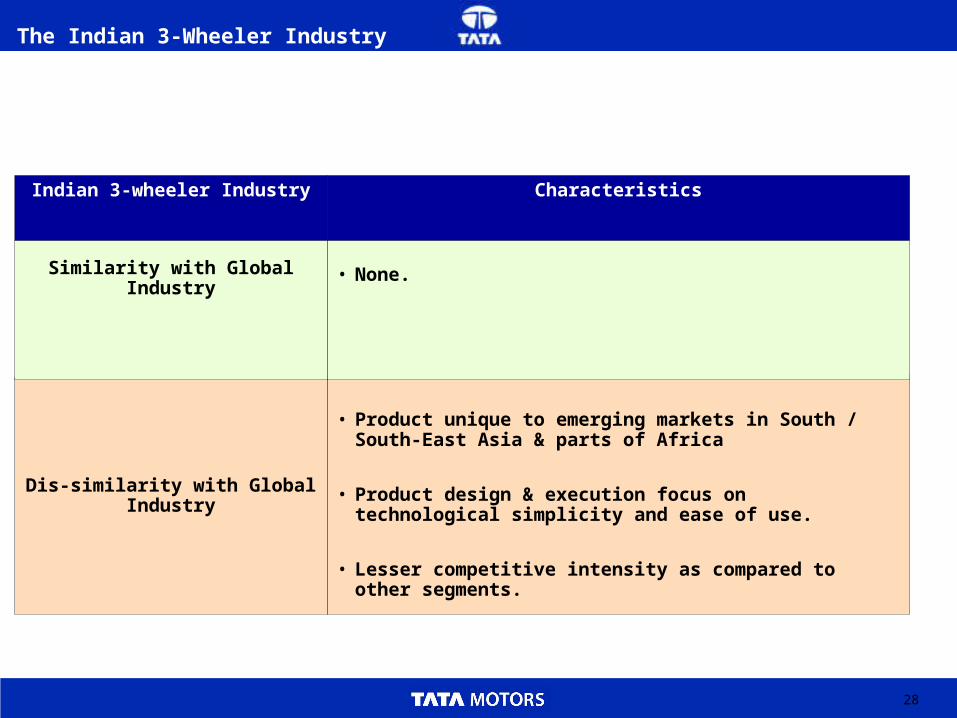
The Indian 3-Wheeler Industry
• Product unique to emerging markets in South / South-East Asia & parts of Africa
• Product design & execution focus on technological simplicity and ease of use.
• Lesser competitive intensity as compared to other segments.
Dis-similarity with Global Industry
• None. Similarity with Global Industry
CharacteristicsIndian 3-wheeler Industry
29
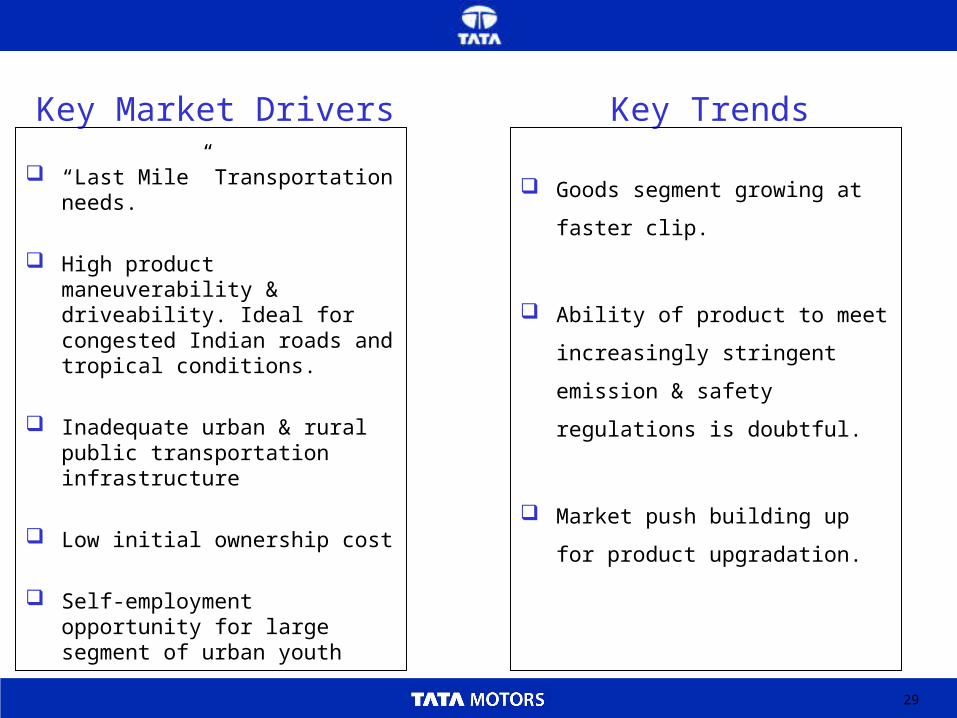
Key Market Drivers
“Last Mile” Transportation needs.
High product maneuverability & driveability. Ideal for congested Indian roads and tropical conditions.
Inadequate urban & rural public transportation infrastructure
Low initial ownership cost
Self-employment opportunity for large segment of urban youth
Key Trends
Goods segment growing at faster
clip.
Ability of product to meet
increasingly stringent emission &
safety regulations is doubtful.
Market push building up for product
upgradation.
30
• Global Auto Industry – An Analysis
• Indian Auto Industry
Two Wheelers
Three Wheelers
Passenger Cars
Commercial Vehicles
• Indian Auto Component Industry
• Emerging Opportunities
• Overview of Indian Economy
• TATA Motors – Organisation Structure
31
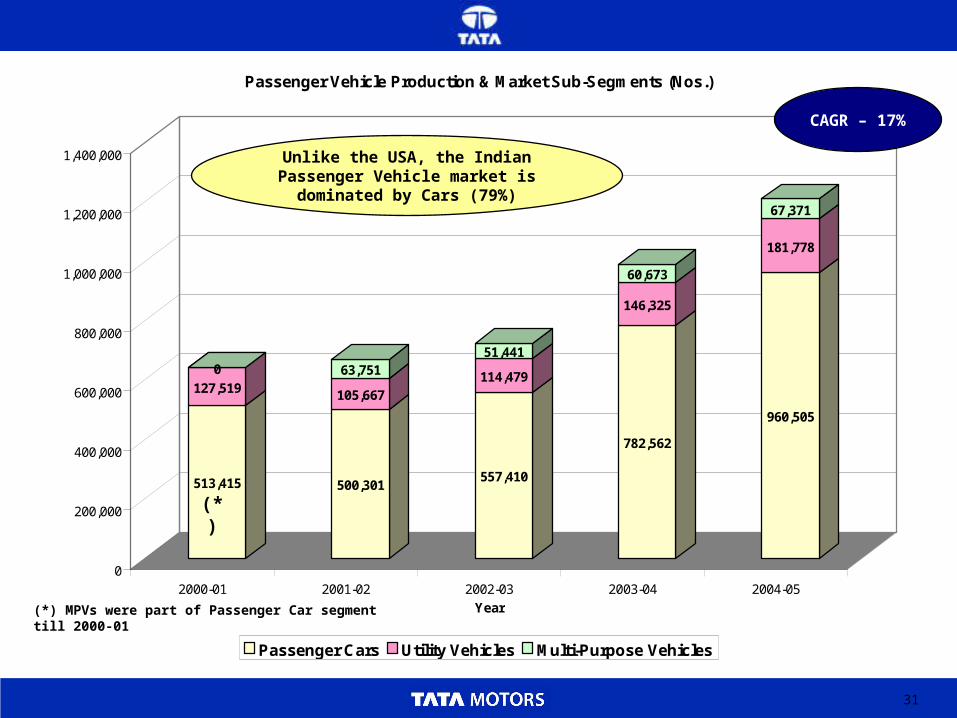
513,415
127,519
0
500,301
105,667
63,751
557,410
114,479
51,441
782,562
146,325
60,673
960,505
181,778
67,371
0
200,000
400,000
600,000
800,000
1,000,000
1,200,000
1,400,000
2000-01 2001-02 2002-03 2003-04 2004-05Year
Passenger Vehicle Production & Market Sub-Segments (Nos.)
Passenger Cars Utility Vehicles Multi-Purpose Vehicles
Unlike the USA, the Indian Passenger Vehicle market is dominated by Cars
(79%)
CAGR – 17%
(*)
(*) MPVs were part of Passenger Car segment till 2000-01
32
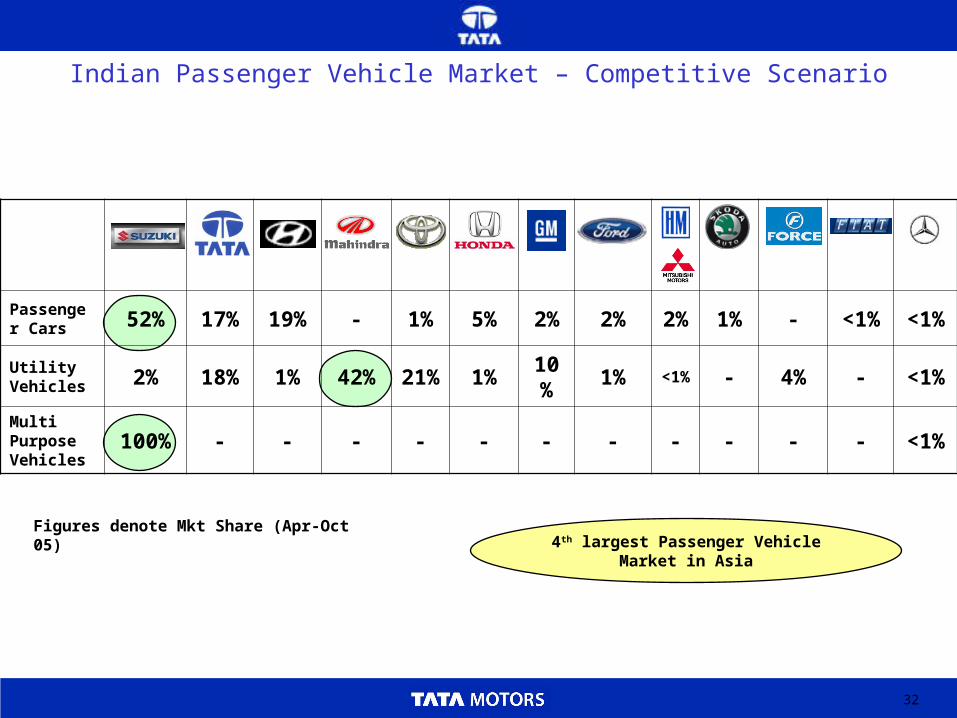
Indian Passenger Vehicle Market – Competitive Scenario
Passenger Cars 52% 17% 19% - 1% 5% 2% 2% 2% 1% - <1% <1%
Utility Vehicles 2% 18% 1% 42% 21% 1% 10% 1% <1% - 4% - <1%
Multi Purpose Vehicles
100% - - - - - - - - - - - <1%
4th largest Passenger Vehicle Market in Asia
Figures denote Mkt Share (Apr-Oct 05)
33
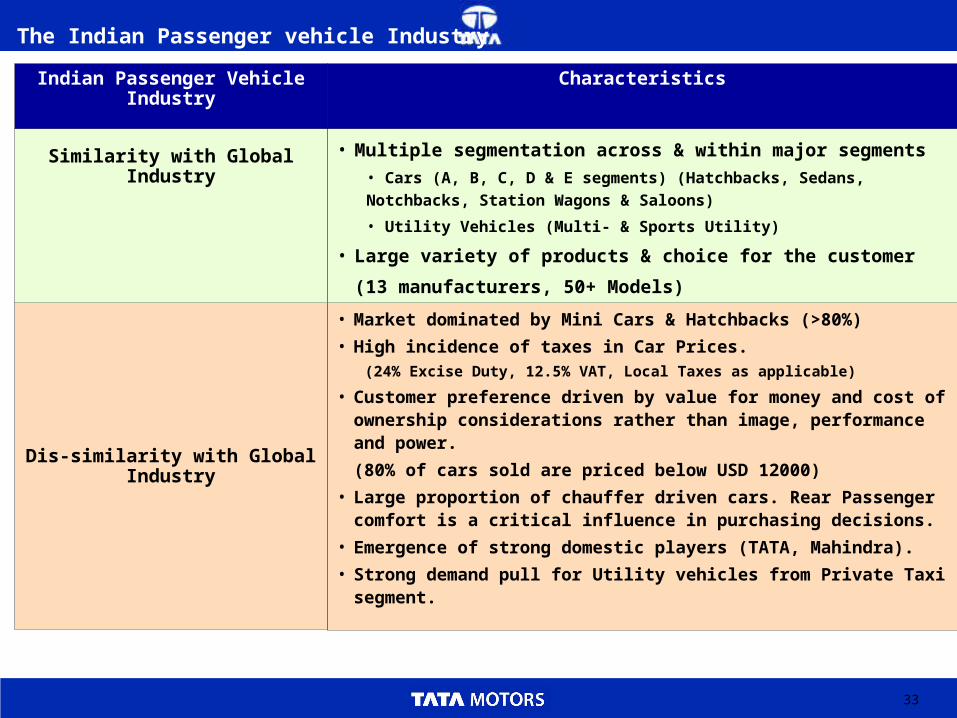
The Indian Passenger vehicle Industry
• Market dominated by Mini Cars & Hatchbacks (>80%)
• High incidence of taxes in Car Prices. (24% Excise Duty, 12.5% VAT, Local Taxes as applicable)
• Customer preference driven by value for money and cost of ownership considerations rather than image, performance and power.
(80% of cars sold are priced below USD 12000)
• Large proportion of chauffer driven cars. Rear Passenger comfort is a critical influence in purchasing decisions.
• Emergence of strong domestic players (TATA, Mahindra).
• Strong demand pull for Utility vehicles from Private Taxi segment.
Dis-similarity with Global Industry
• Multiple segmentation across & within major segments
• Cars (A, B, C, D & E segments) (Hatchbacks, Sedans, Notchbacks, Station
Wagons & Saloons)
• Utility Vehicles (Multi- & Sports Utility)
• Large variety of products & choice for the customer
(13 manufacturers, 50+ Models)
Similarity with Global Industry
CharacteristicsIndian Passenger Vehicle Industry
34
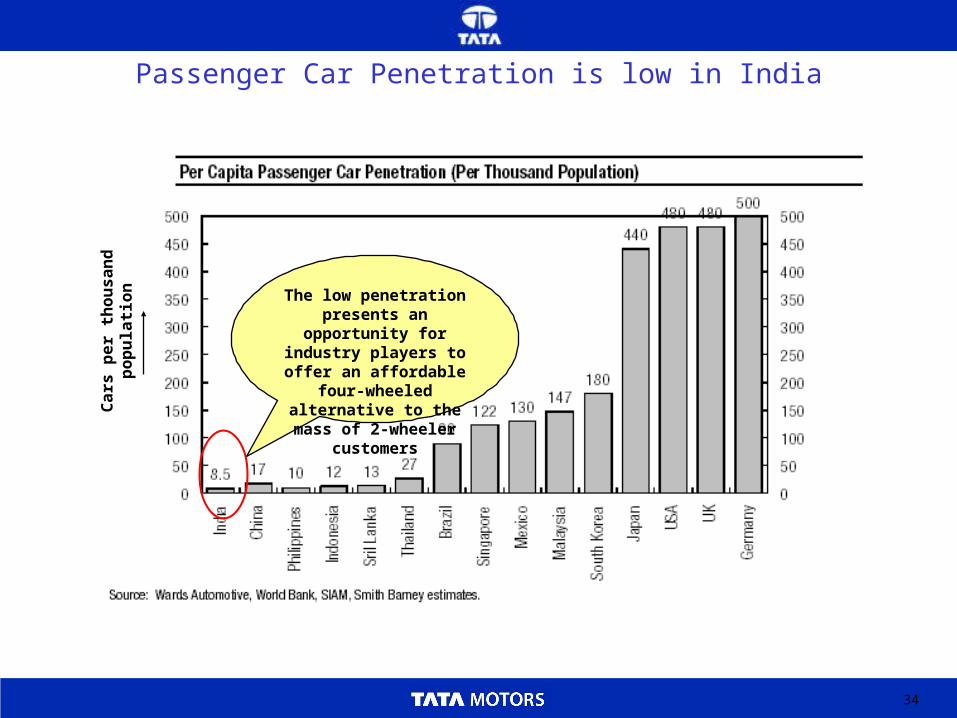
Passenger Car Penetration is low in India
The low penetration presents an opportunity for industry players to
offer an affordable four-wheeled alternative to the mass of 2-wheeler
customers
Ca
rs p
er
tho
us
an
d p
op
ula
tio
n
35
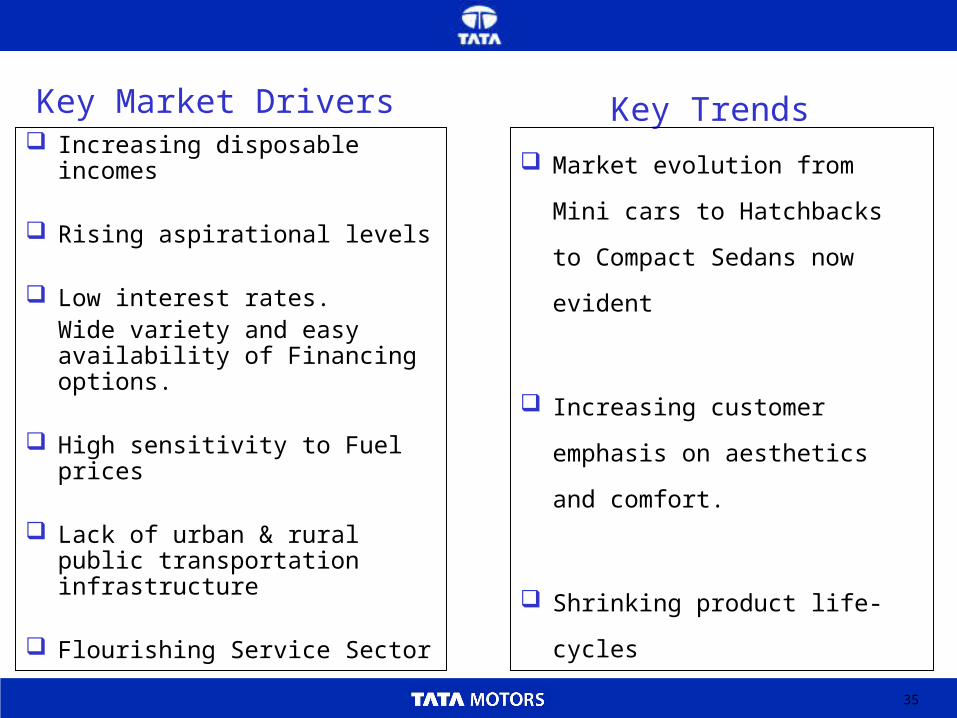
Key Market Drivers Increasing disposable incomes
Rising aspirational levels
Low interest rates.Wide variety and easy availability of Financing options.
High sensitivity to Fuel prices
Lack of urban & rural public transportation infrastructure
Flourishing Service Sector
Key Trends
Market evolution from Mini
cars to Hatchbacks to
Compact Sedans now evident
Increasing customer emphasis
on aesthetics and comfort.
Shrinking product life-cycles
36
• Global Auto Industry – An Analysis
• Indian Auto Industry
Two Wheelers
Three Wheelers
Passenger Cars
Commercial Vehicles
• Indian Auto Component Industry
• Emerging Opportunities
• Overview of Indian Economy
• TATA Motors – Organisation Structure
37
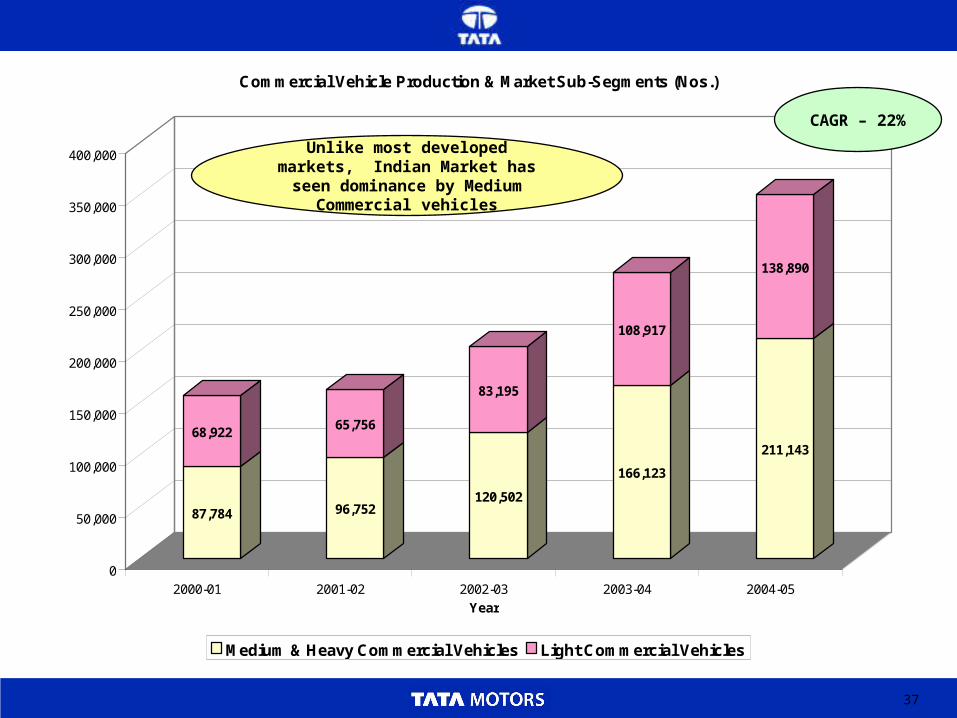
87,784
68,922
96,752
65,756
120,502
83,195
166,123
108,917
211,143
138,890
0
50,000
100,000
150,000
200,000
250,000
300,000
350,000
400,000
2000-01 2001-02 2002-03 2003-04 2004-05Year
Commercial Vehicle Production & Market Sub-Segments (Nos.)
Medium & Heavy Commercial Vehicles Light Commercial Vehicles
Unlike most developed markets, Indian Market has seen dominance
by Medium Commercial vehicles
CAGR – 22%
38
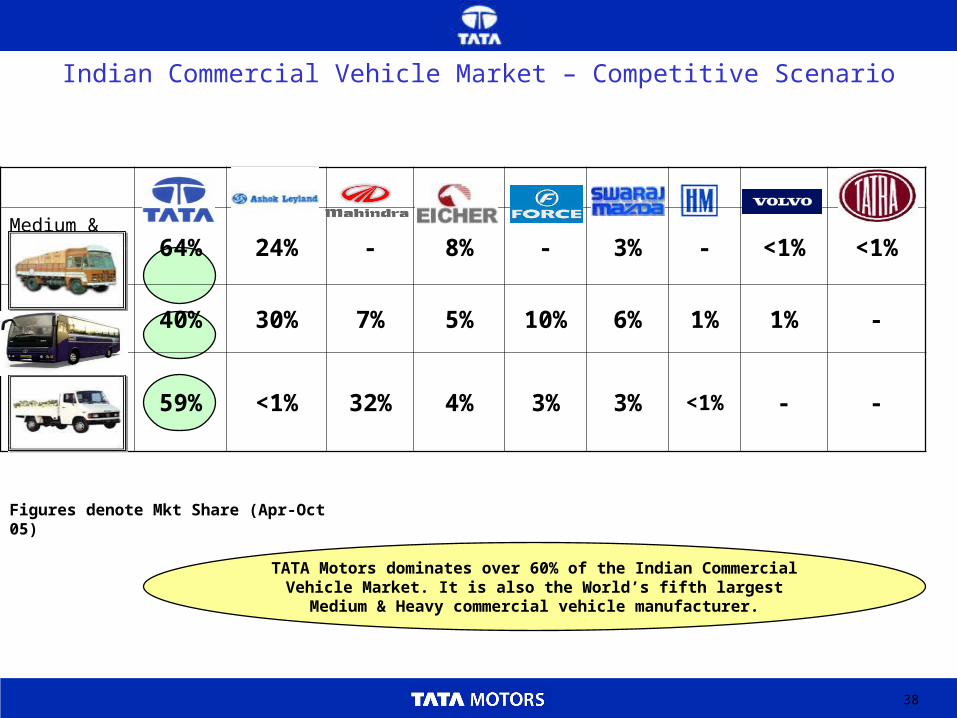
Indian Commercial Vehicle Market – Competitive Scenario
Medium & Heavy CV - Trucks
64% 24% - 8% - 3% - <1% <1%
Buses – L, M & HCV 40% 30% 7% 5% 10% 6% 1% 1% -
Light & Small Comm Veh – Trucks
59% <1% 32% 4% 3% 3% <1% - -
TATA Motors dominates over 60% of the Indian Commercial Vehicle Market. It is also the World’s fifth largest Medium & Heavy commercial
vehicle manufacturer.
Figures denote Mkt Share (Apr-Oct 05)
39
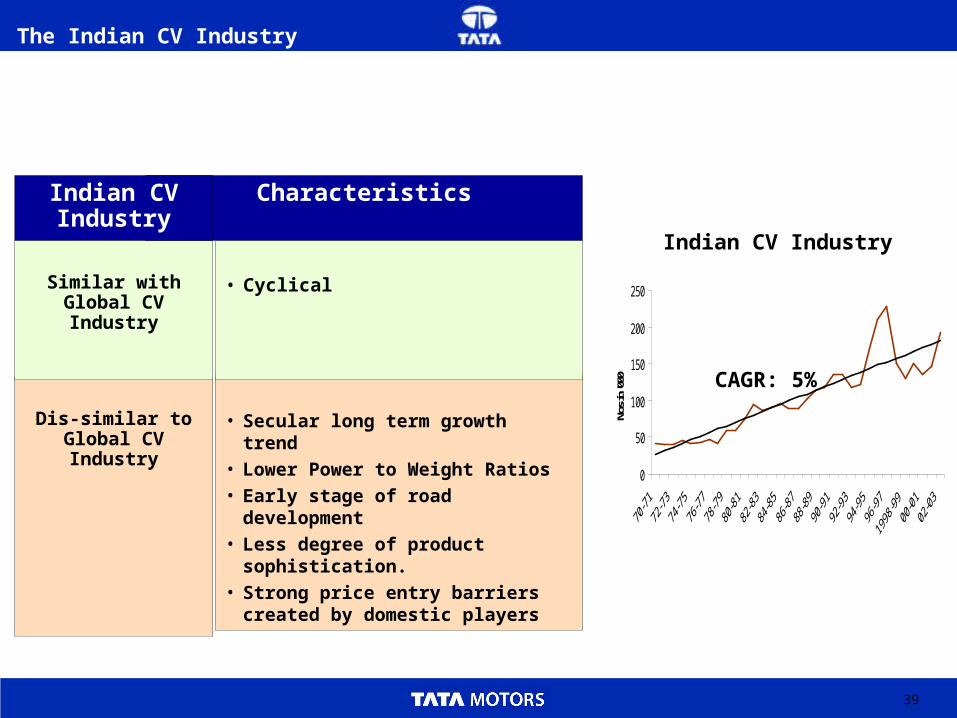
The Indian CV Industry
• Secular long term growth trend
• Lower Power to Weight Ratios
• Early stage of road development
• Less degree of product sophistication.
• Strong price entry barriers created by domestic players
Dis-similar to Global CV Industry
• CyclicalSimilar with Global CV Industry
CharacteristicsIndian CV Industry
0
50
100
150
200
250
Nos i
n '00
0
Indian CV Industry
CAGR: 5%
40
Key Market Drivers
Growth in Economic Activity
Road Network Development
Low interest rates.
Wide variety and easy availability of Financing options.
High sensitivity to Fuel prices
41
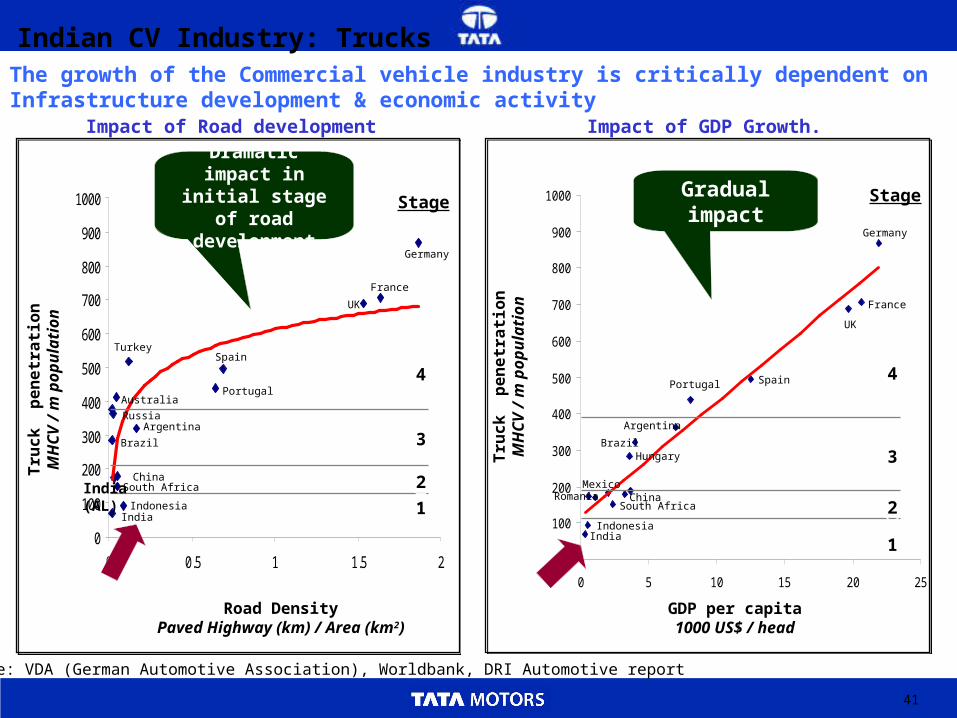
Impact of Road development
Source: VDA (German Automotive Association), Worldbank, DRI Automotive report
0
100
200
300
400
500
600
700
800
900
1000
0 5 10 15 20 25
Tru
ck
p
en
etr
ati
on
MH
CV
/ m
po
pu
lati
on
Germany
France
UK
SpainPortugal
IndiaIndonesia
South Africa
Argentina
Brazil
ChinaRomania
Hungary
Mexico
1
2
3
4
Stage
GDP per capita1000 US$ / head
0
100
200
300
400
500
600
700
800
900
1000
0 0.5 1 1.5 2
Tru
ck
p
en
etr
ati
on
MH
CV
/ m
po
pu
lati
on
Germany
France
UK
Spain
Portugal
Turkey
Australia
IndiaIndonesia
South AfricaChina
Brazil
ArgentinaRussia
1
2
3
4
Stage
Road DensityPaved Highway (km) / Area (km2)
Dramatic impact in initial stage of
road development
Gradual impact
Indian CV Industry: Trucks
Impact of GDP Growth.
The growth of the Commercial vehicle industry is critically dependent on Infrastructure development & economic activity
India (AL)
42
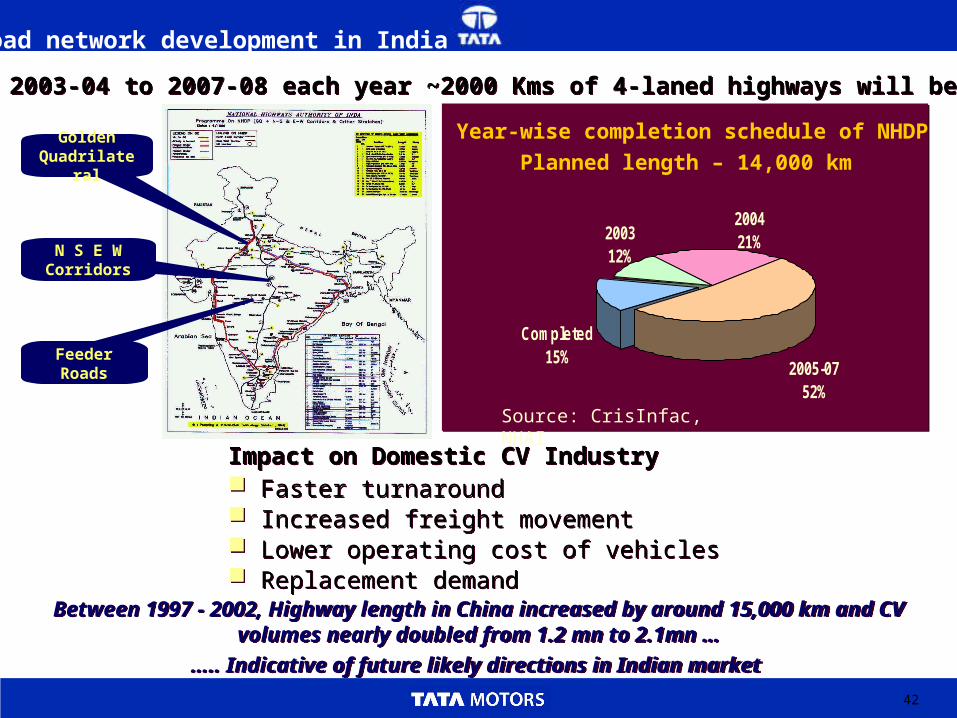
Road network development in India
Golden Quadrilateral
N S E W Corridors
Feeder Roads
Source: CrisInfac, NHAI
Year-wise completion schedule of NHDP
Planned length – 14,000 km
2005-0752%
Completed15%
200421%2003
12%
Between 2003-04 to 2007-08 each year ~2000 Kms of 4-laned highways will be added Between 2003-04 to 2007-08 each year ~2000 Kms of 4-laned highways will be added
Impact on Domestic CV Industry Faster turnaround Increased freight movement Lower operating cost of vehicles Replacement demand
Impact on Domestic CV Industry Faster turnaround Increased freight movement Lower operating cost of vehicles Replacement demand
Between 1997 - 2002, Highway length in China increased by around 15,000 km and CV volumes nearly doubled from 1.2 mn to 2.1mn …
….. Indicative of future likely directions in Indian market
Between 1997 - 2002, Highway length in China increased by around 15,000 km and CV volumes nearly doubled from 1.2 mn to 2.1mn …
….. Indicative of future likely directions in Indian market
43
2
4
6
8
10
12
14
16
18
15 25 35 45GVW (Tonnes)
Aver
age
Powe
r to
Wei
ght r
atio
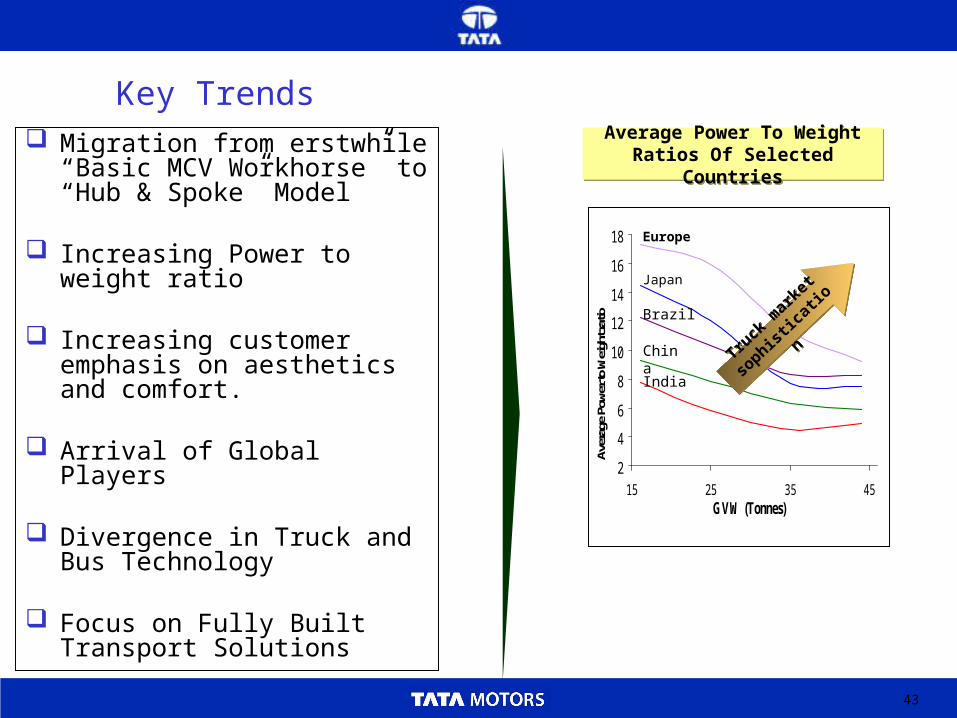
Key Trends Migration from erstwhile “Basic
MCV Workhorse” to “Hub & Spoke” Model
Increasing Power to weight ratio
Increasing customer emphasis on aesthetics and comfort.
Arrival of Global Players
Divergence in Truck and Bus Technology
Focus on Fully Built Transport Solutions
Europe
Japan
Brazil
India
Average Power To Weight Ratios Of Selected Countries
Average Power To Weight Ratios Of Selected Countries
China Truck
mar
ket
sophis
ticat
ion
Truck
mar
ket
sophis
ticat
ion
44
• Global Auto Industry – An Analysis
• Indian Auto Industry
Two Wheelers
Three Wheelers
Passenger Cars
Commercial Vehicles
• Indian Auto Component Industry
• Emerging Opportunities
• Overview of Indian Economy
• TATA Motors – Organisation Structure
45
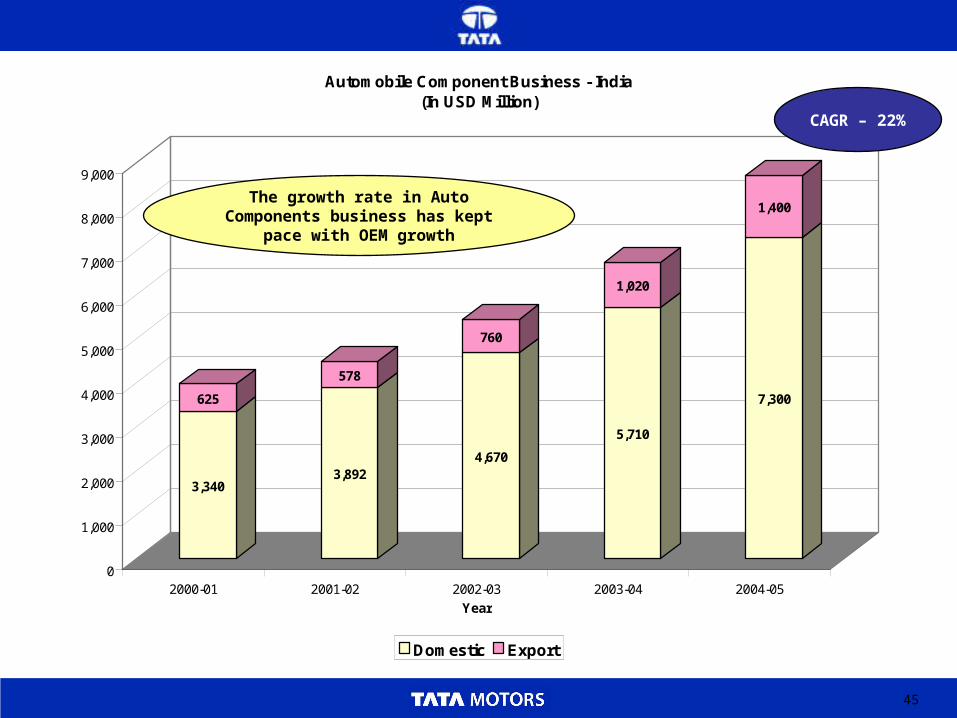
3,340
625
3,892
578
4,670
760
5,710
1,020
7,300
1,400
0
1,000
2,000
3,000
4,000
5,000
6,000
7,000
8,000
9,000
2000-01 2001-02 2002-03 2003-04 2004-05
Year
Automobile Component Business - India(In USD Million)
Domestic Export
The growth rate in Auto Components business has kept pace with OEM
growth
CAGR – 22%
46
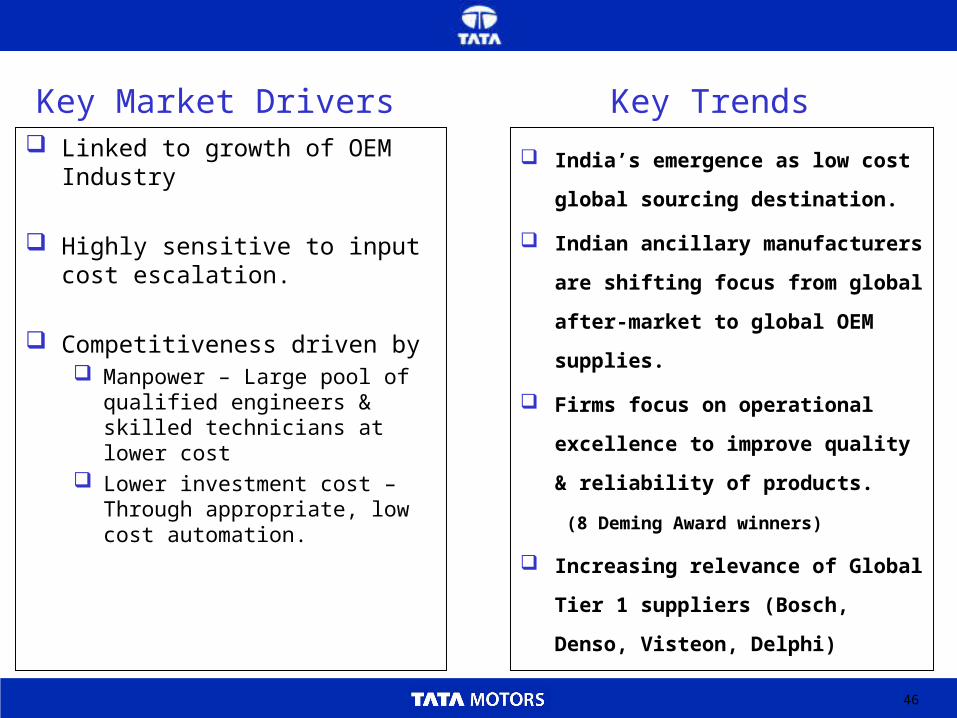
Key Market Drivers Linked to growth of OEM Industry
Highly sensitive to input cost escalation.
Competitiveness driven by Manpower – Large pool of
qualified engineers & skilled technicians at lower cost
Lower investment cost – Through appropriate, low cost automation.
Key Trends
India’s emergence as low cost
global sourcing destination.
Indian ancillary manufacturers are
shifting focus from global after-
market to global OEM supplies.
Firms focus on operational
excellence to improve quality &
reliability of products.
(8 Deming Award winners)
Increasing relevance of Global Tier
1 suppliers (Bosch, Denso, Visteon,
Delphi)
47
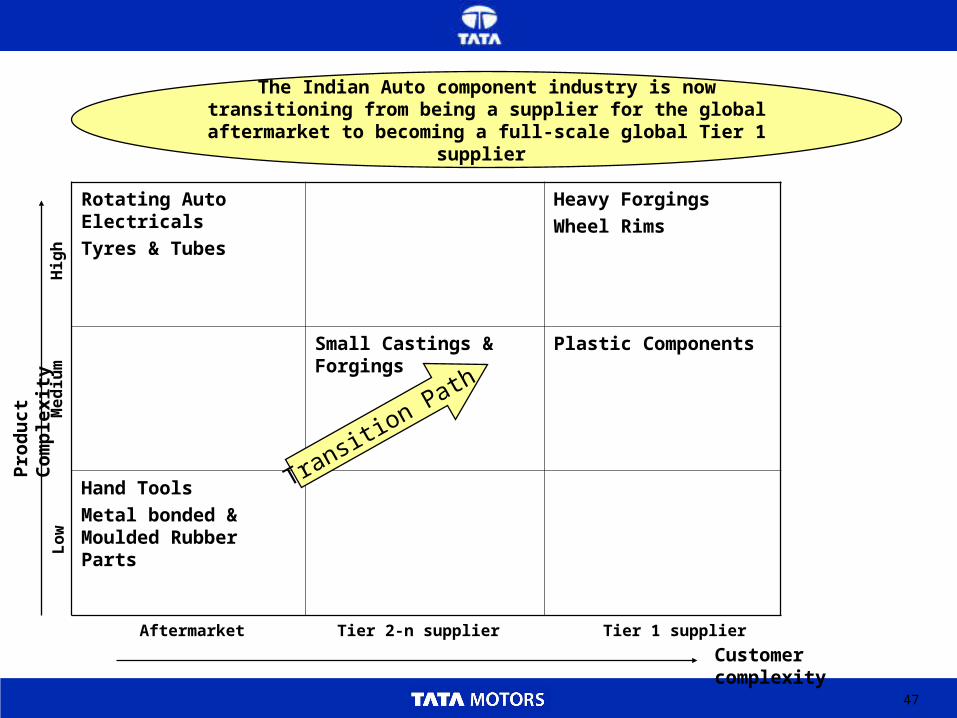
Rotating Auto Electricals
Tyres & Tubes
Heavy Forgings
Wheel Rims
Small Castings & Forgings
Plastic Components
Hand Tools
Metal bonded & Moulded Rubber Parts
Aftermarket
Customer complexityTier 2-n supplier Tier 1 supplier
Lo
wM
ed
ium
Hig
h
Pro
du
ct C
om
ple
xit
y
Transition Path
The Indian Auto component industry is now transitioning from being a supplier for the global aftermarket to becoming a full-
scale global Tier 1 supplier
48
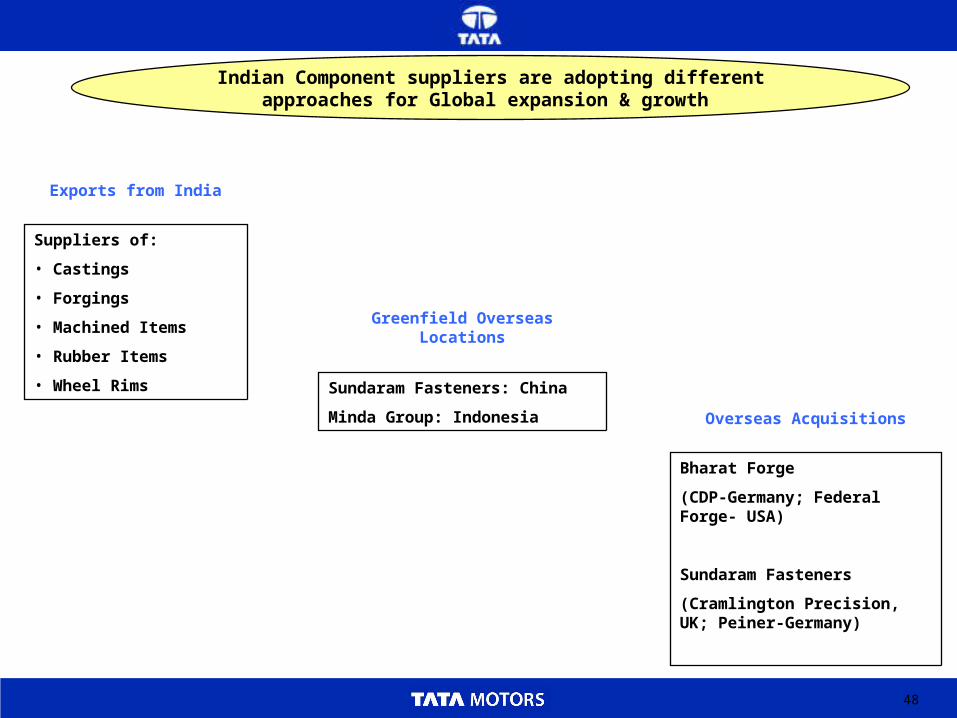
Indian Component suppliers are adopting different approaches for Global expansion & growth
Exports from India
Suppliers of:
• Castings
• Forgings
• Machined Items
• Rubber Items
• Wheel Rims
Greenfield Overseas Locations
Sundaram Fasteners: China
Minda Group: Indonesia Overseas Acquisitions
Bharat Forge
(CDP-Germany; Federal Forge- USA)
Sundaram Fasteners
(Cramlington Precision, UK; Peiner-Germany)
49
• Global Auto Industry – An Analysis
• Indian Auto Industry
Two Wheelers
Three Wheelers
Passenger Cars
Commercial Vehicles
• Indian Auto Component Industry
• Emerging Opportunities
• Overview of Indian Economy
• TATA Motors – Organisation Structure
50
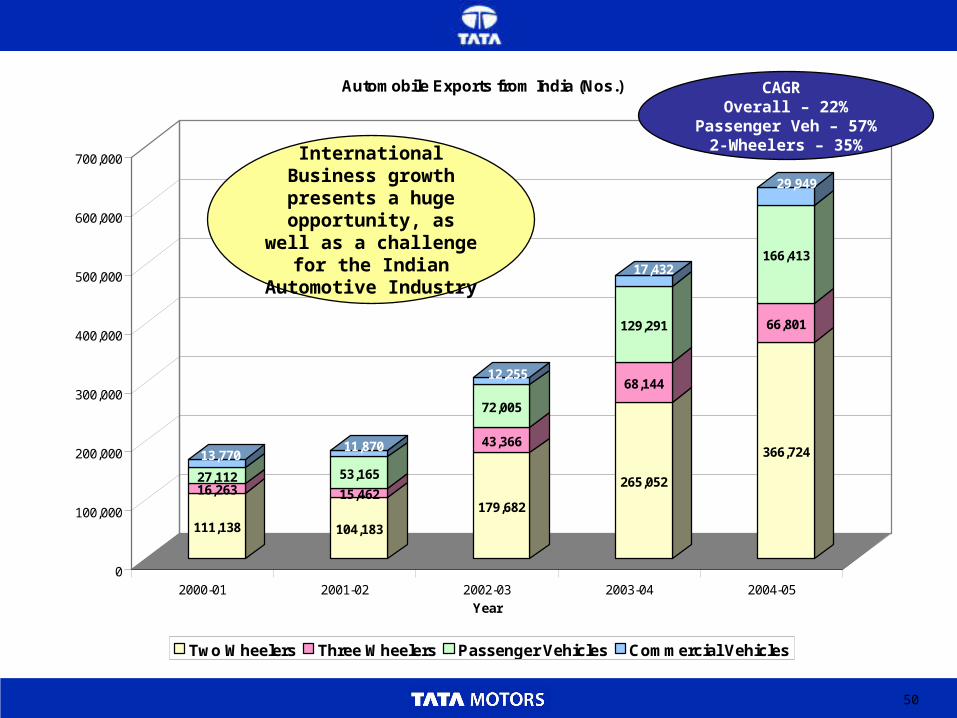
111,138
16,26327,112
13,770
104,183
15,462
53,165
11,870
179,682
43,366
72,005
12,255
265,052
68,144
129,291
17,432
366,724
66,801
166,413
29,949
0
100,000
200,000
300,000
400,000
500,000
600,000
700,000
2000-01 2001-02 2002-03 2003-04 2004-05
Year
Automobile Exports from India (Nos.)
Two Wheelers Three Wheelers Passenger Vehicles Commercial Vehicles
CAGR Overall – 22%
Passenger Veh – 57%2-Wheelers – 35%
International Business growth presents a huge opportunity, as well as
a challenge for the Indian Automotive
Industry
51
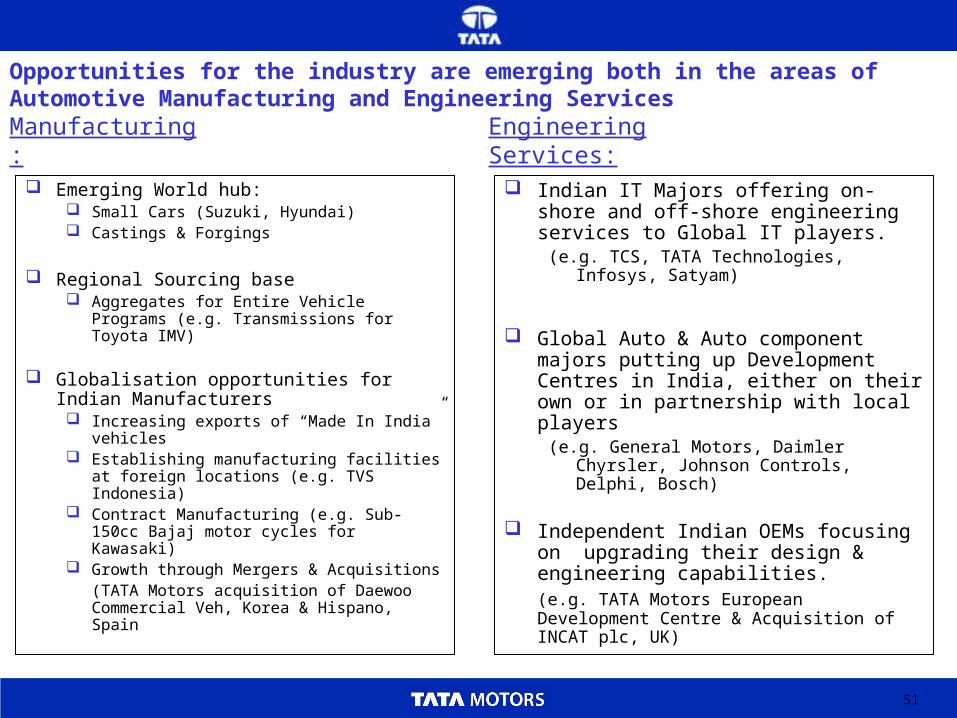
Opportunities for the industry are emerging both in the areas of Automotive Manufacturing and Engineering Services
Manufacturing:
Emerging World hub: Small Cars (Suzuki, Hyundai) Castings & Forgings
Regional Sourcing base Aggregates for Entire Vehicle Programs
(e.g. Transmissions for Toyota IMV)
Globalisation opportunities for Indian Manufacturers Increasing exports of “Made In India”
vehicles Establishing manufacturing facilities at
foreign locations (e.g. TVS Indonesia) Contract Manufacturing (e.g. Sub-150cc
Bajaj motor cycles for Kawasaki) Growth through Mergers & Acquisitions
(TATA Motors acquisition of Daewoo Commercial Veh, Korea & Hispano, Spain
Engineering Services:
Indian IT Majors offering on-shore and off-shore engineering services to Global IT players.
(e.g. TCS, TATA Technologies, Infosys, Satyam)
Global Auto & Auto component majors putting up Development Centres in India, either on their own or in partnership with local players
(e.g. General Motors, Daimler Chyrsler, Johnson Controls, Delphi, Bosch)
Independent Indian OEMs focusing on upgrading their design & engineering capabilities.(e.g. TATA Motors European Development Centre & Acquisition of INCAT plc, UK)
52
Thank You